journal of corporate finance - gvpesquisa.fgv.br · in the absence of legal reforms, firms that...
TRANSCRIPT

Journal of Corporate Finance 18 (2012) 883–903
Contents lists available at ScienceDirect
Journal of Corporate Finance
j ourna l homepage: www.e lsev ie r.com/ locate / j corpf in
Can a stock exchange improve corporate behavior? Evidence from firms'migration to premium listings in Brazil
Antonio Gledson de Carvalho a,1, George G. Pennacchi b,⁎a Fundacao Getulio Vargas School of Business at Sao Paulo, Brazilb Department of Finance, College of Business, University of Illinois, 4041 BIF Box 25, 515 East Gregory Drive, Champaign, IL 61820, United States
a r t i c l e i n f o
⁎ Corresponding author. Tel.: +1 217 244 0952; faxE-mail addresses: [email protected] (A.G. de
1 FGV-EAESP, R Itapeva, 474, 7o andar, São Paulo, SP
0929-1199/$ – see front matter © 2011 Elsevier B.V.doi:10.1016/j.jcorpfin.2011.01.003
a b s t r a c t
Article history:Received 12 June 2009Received in revised form 21 December 2010Accepted 1 January 2011Available online 11 January 2011
Because Brazil's legal system lacked protection for minority shareholders and trading ofBrazilian shares flowed to U.S. exchanges, in 2001 the São Paulo Stock Exchange, Bovespa,created three premium exchange listings that require more stringent shareholder protections.This paper examines the effects of a commitment to improved corporate disclosure andgovernance by firms' voluntary migration to these premium listings. Our analysis finds that afirm's migration brings positive abnormal returns to its shareholders, particularly when itsshares did not have a prior cross-listing on a U.S. exchange and also when the firm chooses apremium listing with the highest standards. Migration to a premium listing also leads to asignificant increase in the trading volume of non-voting shares. Firms that choose a premiumlisting tend to have growth opportunities that they finance with subsequent seasoned equityofferings. These results suggest that a premium listing is a mechanism for bonding to improvedcorporate behavior that can be less costly than cross-listing on a U.S. exchange.
© 2011 Elsevier B.V. All rights reserved.
JEL classifications:G32G39
Keywords:Premium listingsBondingCross-listings
1. Introduction
This paper examines an initiative by a private stock exchange in a large developing country that permitted its listedcorporations to commit to improved standards of transparency and corporate governance. We analyze the changes in share valuesand share trading volumes of the corporations that voluntarily chose the exchange's higher standards. Also, we study thecharacteristics of these corporations and how they differed from those of corporations that did not choose the improved standards.Our empirical results shed light on whether a domestic stock exchange can provide a credible mechanism that can bondcorporations to better protect their minority shareholders.
Empirical research has shown that protecting minority shareholders is critical to the development of a country's capitalmarkets (La Porta et al., 1997; Gleaser et al., 2001). In turn, capital market development has been linked to improved resourceallocation (Wurgler, 2000) and economic growth (Levine and Zervos, 1998). In contrast, when minority shareholders lackprotection and are subject to expropriation by controlling shareholders, markets for raising new shareholders' equity can breakdown (Shleifer and Wolfenzon, 2002). The possibility of expropriation together with poor disclosure of corporate activities alsocan deter investors from trading in a corporation's shares, thereby reducing liquidity. Illiquid shares further increases acorporation's cost of issuing new equity (Amihud and Mendelson, 1986; Bekaert et al., 2007).
In an environmentwhereminority shareholders are poorly protected, a potential remedy is to reform the country's securities laws(La Porta et al., 2006). However, legislative reforms often are difficult to implement: improvingminority rights can reduce the value ofcontrol that somepowerfulmajority shareholders exert over particularfirms. These controlling shareholders frequently are successfulin blocking legislative changes, even when the majority owners of other firms favor the reforms (Bebchuk and Roe, 1999).
: +1 217 244 6917.Carvalho), [email protected] (G.G. Pennacchi)., 01332-000, Brazil. Tel.: +55 11 3281 7767; fax: +55 11 3262 3662.
All rights reserved.
884 A.G. de Carvalho, G.G. Pennacchi / Journal of Corporate Finance 18 (2012) 883–903
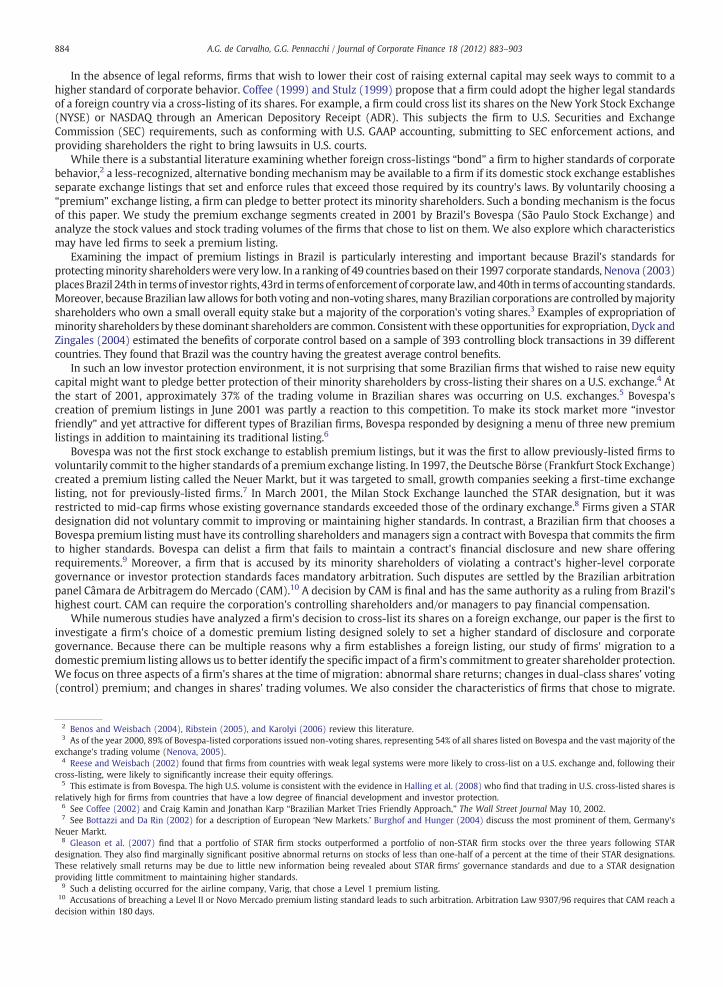
In the absence of legal reforms, firms that wish to lower their cost of raising external capital may seek ways to commit to ahigher standard of corporate behavior. Coffee (1999) and Stulz (1999) propose that a firm could adopt the higher legal standardsof a foreign country via a cross-listing of its shares. For example, a firm could cross list its shares on the New York Stock Exchange(NYSE) or NASDAQ through an American Depository Receipt (ADR). This subjects the firm to U.S. Securities and ExchangeCommission (SEC) requirements, such as conforming with U.S. GAAP accounting, submitting to SEC enforcement actions, andproviding shareholders the right to bring lawsuits in U.S. courts.
While there is a substantial literature examining whether foreign cross-listings “bond” a firm to higher standards of corporatebehavior,2 a less-recognized, alternative bonding mechanismmay be available to a firm if its domestic stock exchange establishesseparate exchange listings that set and enforce rules that exceed those required by its country's laws. By voluntarily choosing a“premium” exchange listing, a firm can pledge to better protect its minority shareholders. Such a bonding mechanism is the focusof this paper. We study the premium exchange segments created in 2001 by Brazil's Bovespa (São Paulo Stock Exchange) andanalyze the stock values and stock trading volumes of the firms that chose to list on them. We also explore which characteristicsmay have led firms to seek a premium listing.
Examining the impact of premium listings in Brazil is particularly interesting and important because Brazil's standards forprotectingminority shareholderswere very low. In a ranking of 49 countries based on their 1997 corporate standards, Nenova (2003)placesBrazil 24th in termsof investor rights, 43rd in termsof enforcementof corporate law, and40th in termsof accounting standards.Moreover, because Brazilian lawallows for both voting and non-voting shares, manyBrazilian corporations are controlled bymajorityshareholders who own a small overall equity stake but a majority of the corporation's voting shares.3 Examples of expropriation ofminority shareholders by these dominant shareholders are common. Consistentwith these opportunities for expropriation, Dyck andZingales (2004) estimated the benefits of corporate control based on a sample of 393 controlling block transactions in 39 differentcountries. They found that Brazil was the country having the greatest average control benefits.
In such an low investor protection environment, it is not surprising that some Brazilian firms that wished to raise new equitycapital might want to pledge better protection of their minority shareholders by cross-listing their shares on a U.S. exchange.4 Atthe start of 2001, approximately 37% of the trading volume in Brazilian shares was occurring on U.S. exchanges.5 Bovespa'screation of premium listings in June 2001 was partly a reaction to this competition. To make its stock market more “investorfriendly” and yet attractive for different types of Brazilian firms, Bovespa responded by designing a menu of three new premiumlistings in addition to maintaining its traditional listing.6
Bovespa was not the first stock exchange to establish premium listings, but it was the first to allow previously-listed firms tovoluntarily commit to the higher standards of a premium exchange listing. In 1997, the Deutsche Börse (Frankfurt Stock Exchange)created a premium listing called the Neuer Markt, but it was targeted to small, growth companies seeking a first-time exchangelisting, not for previously-listed firms.7 In March 2001, the Milan Stock Exchange launched the STAR designation, but it wasrestricted to mid-cap firms whose existing governance standards exceeded those of the ordinary exchange.8 Firms given a STARdesignation did not voluntary commit to improving or maintaining higher standards. In contrast, a Brazilian firm that chooses aBovespa premium listing must have its controlling shareholders andmanagers sign a contract with Bovespa that commits the firmto higher standards. Bovespa can delist a firm that fails to maintain a contract's financial disclosure and new share offeringrequirements.9 Moreover, a firm that is accused by its minority shareholders of violating a contract's higher-level corporategovernance or investor protection standards faces mandatory arbitration. Such disputes are settled by the Brazilian arbitrationpanel Câmara de Arbitragem do Mercado (CAM).10 A decision by CAM is final and has the same authority as a ruling from Brazil'shighest court. CAM can require the corporation's controlling shareholders and/or managers to pay financial compensation.
While numerous studies have analyzed a firm's decision to cross-list its shares on a foreign exchange, our paper is the first toinvestigate a firm's choice of a domestic premium listing designed solely to set a higher standard of disclosure and corporategovernance. Because there can be multiple reasons why a firm establishes a foreign listing, our study of firms' migration to adomestic premium listing allows us to better identify the specific impact of a firm's commitment to greater shareholder protection.We focus on three aspects of a firm's shares at the time of migration: abnormal share returns; changes in dual-class shares' voting(control) premium; and changes in shares' trading volumes. We also consider the characteristics of firms that chose to migrate.
2 Benos and Weisbach (2004), Ribstein (2005), and Karolyi (2006) review this literature.3 As of the year 2000, 89% of Bovespa-listed corporations issued non-voting shares, representing 54% of all shares listed on Bovespa and the vast majority of the
exchange's trading volume (Nenova, 2005).4 Reese and Weisbach (2002) found that firms from countries with weak legal systems were more likely to cross-list on a U.S. exchange and, following their
cross-listing, were likely to significantly increase their equity offerings.5 This estimate is from Bovespa. The high U.S. volume is consistent with the evidence in Halling et al. (2008) who find that trading in U.S. cross-listed shares is
relatively high for firms from countries that have a low degree of financial development and investor protection.6 See Coffee (2002) and Craig Kamin and Jonathan Karp “Brazilian Market Tries Friendly Approach,” The Wall Street Journal May 10, 2002.7 See Bottazzi and Da Rin (2002) for a description of European ‘New Markets.’ Burghof and Hunger (2004) discuss the most prominent of them, Germany's
Neuer Markt.8 Gleason et al. (2007) find that a portfolio of STAR firm stocks outperformed a portfolio of non-STAR firm stocks over the three years following STAR
designation. They also find marginally significant positive abnormal returns on stocks of less than one-half of a percent at the time of their STAR designations.These relatively small returns may be due to little new information being revealed about STAR firms' governance standards and due to a STAR designationproviding little commitment to maintaining higher standards.
9 Such a delisting occurred for the airline company, Varig, that chose a Level 1 premium listing.10 Accusations of breaching a Level II or Novo Mercado premium listing standard leads to such arbitration. Arbitration Law 9307/96 requires that CAM reach adecision within 180 days.

885A.G. de Carvalho, G.G. Pennacchi / Journal of Corporate Finance 18 (2012) 883–903
The remainder of the paper is as follows. Section 2 provides a description of Bovespa's premium listings, compares them to a U.S.cross-listing, and discusses hypotheses regarding their effects on a migrating firm's shares. Section 3 explains the empirical methodsthat are used to test these hypotheses and to analyze the characteristics of thefirms that chose tomigrate. Section 4 describes the data,and the results are presented in Section 5. Section 6 concludes.
2. Premium listings, cross listings, and hypotheses
2.1. Bovespa's premium listings
In 2001 Bovespa created three new premium listings in addition to maintaining its traditional listing. A premium listing couldbe chosen by a corporation that migrates from Bovespa's traditional listing or by a corporation seeking a first-time listing followingits initial public offering (IPO). The Appendix details the requirements for the three premium listings, which we now summarize.
NovoMercado is Bovespa's premium listing that has the highest standards. Corporations that list on it must sign a contract thatrequires: the issuance of only voting shares; a minimum of 25% of all shares must be listed and not controlled by majorityshareholders; a Board of Directors having terms of two years or less without staggered elections; financial statements that accordwith U.S. GAAP or IAS GAAP principles; the same conditions provided tomajority shareholders in a transfer of the controlling stake(takeover) must be given to all shareholders (tag-along rights); in the case of a privatization or delisting, tender offers must bemade for all outstanding shares at their economic values; and trades by controlling shareholders and senior managers are subjectto disclosure rules.
Recognizing that Novo Mercado's standards may be too stringent for many Brazilian firms, Bovespa also created two otherintermediate premium listings: Niveis Diferenciados de Governança Corporativa 1 and 2, referred to as Level (Nível) 1 and 2. Asmentioned earlier, almost 90% of Bovespa-listed firms had non-voting shares.11 Level 2 accommodates this situation bymaintaining all of NovoMercado's requirements except Level 2 allows non-voting shares. Level 1 is the least restrictive and focuseson improved disclosure standards, including provision of financial information on a quarterly frequency. Level 1 also requires afirm to make share offerings available to a wide spectrum of investors.
By creating these various premium listings whose requirements were enforced by Bovespa or mandatory arbitration, a menu ofcorporate behavior standards became available to firms that wished to separate themselves from others. With the opening ofpremium listings on June 26, 2001, 15 companies migrated from the traditional listing to the Level 1 listing. As of December 2006,Level 1 had 36 firms that had migrated from Bovespa's traditional listing. Level 2 had a total of 14 firms, with 7 of them havingmigrated from a traditional listing and 7 others having been first listed at the times of their IPOs. Novo Mercado had a total of 44firms, of which 10 were due to migrations and 34 were IPOs.12 By the end of 2006, approximately 25% of all Bovespa-listed firmshad chosen a premium listing, and premium-listed firms accounted for 58% of Bovespa's total market capitalization.
2.2. Comparison to U.S. cross-listings
Initial research on why firms chose to cross-list on a U.S. exchange focused on reducing cross-border market segmentation:cross-listing might raise the value of a firm's shares by lowering U.S. investors' transactions costs and by reducing informationasymmetries due to coverage from U.S. security analysts.13 More recently, the “bonding” hypothesis of Coffee (1999) and Stulz(1999) has garnered support: a firm's share value might be raised by cross-listing due to the higher legal standards of a U.S.exchange listing (legal bonding) and/or the enhanced market discipline due to closer scrutiny and monitoring of the firm'sbehavior by analysts and the media (reputational bonding).
The market segmentation versus bonding effects of cross listings can be distinguished by differentiating between firms thatestablish ADRs listed on the NYSE or NASDAQ versus those whose ADRs are listed on the over-the-counter OTC “Pink Sheets”market or are in the form of privately-placements traded on PORTAL. The former ADRs require SEC registration while the latterones do not. Thus, an OTC (or privately-placed) cross-listing provides a firmwith low cost access to U.S. investors but not the legalbonding obtained with an NYSE/NASDAQ listing. Consistent with a bonding effect, Miller (1999) found that firms announcingNYSE/NASDAQ ADRs experienced average abnormal stock returns of 2.63%, while those announcing OTC-listed ADRs experiencedaverage abnormal stock returns of 1.27%.14 Similarly, other research finds that cross-listed firms that choose NYSE/NASDAQ, ratherthan OTC, ADRs and are located in countries with poorer investor protections tend to have higher Tobin's q (Doidge et al., 2004)and are more likely to terminate poorly performing CEOs (Lel and Miller, 2008).
11 With the intention of simulating capital market development, Brazilian legislation during the late 1960s and early 1970s provided substantial subsidies tofirms that listed their shares on a stock exchange. However, ownership concentration was encouraged by permitting the issuance of non-voting shares. In 1976,changes in Corporate Law 6404 raised the limit for non-voting shares from the previous 50% to 66.7% of total shares, so that a controlling shareholder owning amajority of voting shares would require as little as 16.7% of the firm's total shares. In 2001, the maximum percentage of non-voting shares was returned to 50%.12 From 2001 through 2006, there were a total of 43 Brazilian IPOs. The two IPOs that chose traditional listings were off-shore companies listed as BrazilianDepository Receipts which were unable to choose a Bovespa premium listing due to legal restrictions. Moreover, various Brazilian regulations explain why eachof seven firms that chose a Level 2 IPO were prevented from choosing Novo Mercado.13 Karolyi (1998) reviews this research.14 In addition, firms from emerging markets that established ADR programs on average experienced higher abnormal returns than did firms from developedmarkets, 1.54% versus 0.87%.

886 A.G. de Carvalho, G.G. Pennacchi / Journal of Corporate Finance 18 (2012) 883–903
Given the evidence that cross-listing on a U.S. exchange serves as a bonding mechanism and that many Brazilian firms haveestablished such cross-listings, a natural question is why would a Brazilian firm choose a Bovespa premium listing? There are atleast four reasonswhy a premium listingmay be relevant. First, there have been challenges to the view that a cross-listing on a U.S.exchange is an effective bonding mechanism. Licht (2003) and Siegel (2005) dispute the notion that the SEC has effectivelyenforced protections for minority shareholders of cross-listed foreign firms. Leuz (2006) argues that foreign firms need onlyproduce financial statements that can be reconciled with U.S. GAAP, which is weaker than producing full U.S. GAAP reports.
Second, whether or not a U.S. cross-listing provides effective bonding, the standards of Bovespa premium listings are differentand varied and, therefore, the level of bondingmay be different. The disclosure requirements of a Level 1 listing differ from those ofa U.S. cross-listing, while Level 2 and Novo Mercado listings require corporate governance standards much higher than those of aU.S. cross-listing. Third, there are direct costs of establishing a cross-listing but no costs for choosing a premium listing. Miller(1999) notes that an initial cross-listing fee alone could exceed $1 million. In addition, there are continuing annual listing fees forthe major U.S. exchanges and also costs of establishing an ADR with a depository bank.15 In contrast, there is no incremental feewhen a firm migrates to a premium listing from Bovespa's traditional listing.
Fourth, while the standards of premium and cross listings differ, it may not necessarily be the case that a particular firm maywish to chose one or the other. The premium listing and cross listing standards may be complements, rather than substitutes. Leuz(2006 p. 290) notes that, unlike U.S. firms, foreign firms that cross-list on NYSE/NASDAQ are not required to report financialstatements quarterly unless they are required to do so at home. Thus, a Level 1 premium listing, which requires quarterly reporting,can complement cross-listing on a U.S. exchange in that U.S. GAAP conforming reports would be required on a quarterly, ratherthan annual, basis. Hence, there may be a rationale for firms to benefit from both premium and U.S. cross-listings.
Therefore, it may be unsurprising that some Brazilian firms have chosen a U.S. exchange listing, others have migrated to one ofBovespa's premium listings, and still others have done both. As shown in Table 1, of the 42 companies in our sample that migratedto one of Bovespa's premium segments during 2001 to 2006, ten had a prior NYSE cross-listing and another seven established anNYSE listing after migrating.16 Eleven additional migrating companies had prior ADRs that traded in the OTC market. Theremaining 14 migrating companies had no prior U.S. listing nor did they establish one (as of the beginning of 2007 when ourempirical analysis ends) following migration. As of 2007, there were 10 Brazilian firms cross-listed on the NYSE that had notmigrated to a premium listing.
2.3. Hypotheses
Doidge et al. (2004) and Östberg (2006) model environments where a firm's controlling shareholder can expropriate wealthfrom its existing minority investors. However, the firm also may have valuable growth opportunities that require additionalfunding fromminority investors. If these growth options are sufficiently plentiful, its controlling shareholder optimally chooses tolimit his ability to expropriate minority investors in order to reduce the (agency) costs of funding growth opportunities. Cross-listing on a U.S. exchange or voluntarily migrating to one of Bovespa's premium listings may be a bonding mechanism for limitingexpropriation. Assuming that investors do not fully anticipate the firm's decision tomigrate, it should impact the value of the firm'sexisting shares and its shares' trading volume.
Asmentioned earlier, most Brazilian firms issue dual-class shares: voting shares (denoted ON) and non-voting shares (denotedPN). A controlling family or institution typically holds a majority of a firm's voting shares with the remaining voting shares held ininfrequently-traded, small blocks by institutional investors, such as domestic banks and foreign and domestic investment funds.These institutional investors tend to have greater information and bargaining power compared to non-voting shareholders. It isnot uncommon for minority voting shareholders to sue controlling shareholders, with these lawsuits decided by Brazil's securitiesregulator, the Comissão de Valores Mobiliários (CVM). Hence, minority holders of voting shares may be less susceptible toexpropriation, particularly when control of the firm changes hands or is taken private by the controlling shareholder (Nenova2005). They may be able to force the majority owner to share some of the control rents.
Under current Brazilian law, a firm's non-voting shares cannot exceed one-half of its total equity capital.17 Ownership of non-voting shares tends to be more widely dispersed than voting shares and trading volumes are higher. Dispersed ownership, lessaccess to firm information, along with a lack of voting privileges, gives non-voting shareholders little bargaining power vis-à-visthe controlling owner. They are more likely to be subject to expropriation, especially during changes of control and going-privatetransactions.
To the extent that migration is a bonding mechanism that limits the majority shareholder's control and enhances the firm'sability to undertake growth options, we expect that two main factors will affect the value of minority shares. First, improvedgovernance and disclosure reduces the probability that the dominant shareholder extracts value from minority shareholders.Second, migration can signal the desire to invest in valuable growth opportunities that will increase the per share value of the firm.
Since non-voting shares are more susceptible to expropriation, their values should increase the most when a firm migrates.While the additional growth opportunities that are signaled bymigrationwould tend to raise the value of voting shares, their value
15 See Macey and O'Hara (2002) for an analysis of exchange listing fees and listing requirements, particularly those of the NYSE.16 None of the migrating firms had a prior NASDAQ cross-listing nor was one established following migration.17 Non-voting shares also must be given at least one of the following three rights: 1) payment of dividends equal to at least 110% of the dividends paid to votingshares; 2) payment of dividends of at least 25% of net income; 3) at least 80% of the rights obtained by the controlling shareholders on the transfer of the controlof the company (partial tag along rights).

Table 1Sample of migrating firms.
Firm/industry a Event date b ADR c Type of stock Stock code Market
BANCO BRADESCO/5 2001-06-26 M NYSE 11/21/2001 A ON BBDC3 Level 1PN BBDC4
BANCO ITAU/5 2001-06-26 M NYSE 02/21/2002 A PN ITAU4 Level 1BRADESCO PARTICIP/9 2001-06-26 M ON BRAP3 Level 1
PN BRAP4GERDAU/1 2001-06-26 M NYSE 03/10/1999 B ON GGBR3 Level 1
PN GGBR4GLOBOCABO/9 2001-06-26 M PN PLIM4 Level 1ITAU SA/9 2001-06-26 M ON ITSA3 Level 1
PN ITSA4PERDIGAO/6 2001-06-26 M NYSE 10/20/2000 B ON PRGA3 Level 1
PN PRGA4RANDON PART./14 2001-06-26 M PN RAPT4 Level 1SADIA/6 2001-06-26 M NYSE 12/30/2002 A ON SDIA3 Level 1
PN SDIA4UNIBANCO/5 2001-06-26 M NYSE 03/27/2001 B ON UBBR3 Level 1
PN UBBR4UNT UBBR1
VARIG/9 2001-06-26 M PN VAGV4 Level 1CEMIG/4 2001-10-17 M NYSE 09/19/2001 B ON CMIG3 Level 1
PN CMIG4RIPASA/10 2001-11-12 M PN RPSA4 Level 1VOTORANTIN CEL. PAPEL/10 2001-11-14 M NYSE 05/17/2002 A PN VCPA4 Level 1ARACRUZ/10 2002-04-16 M NYSE 03/03/1997 B ON ARCZ3 Level 1
PNB ARCZ6SABESP/9 2002-04-19 A NYSE 05/09/2002 A ON SBSP3 Novo MercadoBRASIL TELECOM/11 2002-05-09 M NYSE 11/16/2001 B ON BRTO3 Level 1
PN BRTO4BRASIL TELEC. PART./11 2002-05-09 M NYSE 08/01/2002 A ON BRTP3 Level 1
PN BRTP4CELESC/4 2002-06-21 A OTC 06/12/2002 B PN CLSC3 Level 2
PNB CLSC6MARCOPOLO/14 2002-08-23 A ON POMO3 Level 2
PN POMO4TRAN PAULISTA/4 2002-09-18 M OTC 09/24/1999 B ON TRPL3 Level 1
PN TRPL4KLABIN/10 2002-12-10 M OTC 12/01/1994 B PN KLBN4 Level 1BRASKEM/2 2003-02-13 M NYSE 17/09/2003 A ON BRKM3 Level 1
PN BRKM5P. ACUCAR-CBD/13 2003-04-24 A NYSE 05/28/1997 B ON PCAR3 Level 1
PN PCAR4SUZANO BAHIA SUL/10 2003-05-08 M OTC 10/01/1993 B PN SUZA4 Level 1GERDAU MET/1 2003-05-13 A ON GOAU3 Level 1
PN GOAU4ALPARGATAS/12 2003-07-10 A OTC 05/01/1994 B ON ALPA3 Level 1
PN ALPA4CIA VALE DO RIO DOCE/7 2003-12-12 M NYSE 03/27/2002 B ON VALE3 Level 1
PNA VALE5CONFAB INDUSTRIAL SA/1 2003-12-19 M PN CNFB4 Level 1UNIPAR-UNIAO DE INDUSTRIAS PET SA/2 2004-08-11 A ON UNIP3 Level 1
PNA UNIP5PNB UNIP6
ELETROPAULO MET/4 2004-09-10 A PN ELPL4 Level 2SUZANO PET SA/2 2004-10-22 A OTC 01/29/2003 B PN SUZB4 Level 2ETERNIT SA/8 2005-01-26 A ON ETER3 Level 2
PN ETER4DURATEX SA/9 2005-02-24 A ON DURA3 Level 1
PN DURA4ULTRAPAR PARTICIPACOES SA/2 2005-03-22 A NYSE 10/06/1999 B PN UGPA4 Level 1IOCHPE MAXION SA/14 2005-09-21 A OTC 04/01/1994 B ON MYPK3 Level 1
PN MYPK4ROSSI RESIDENCIAL SA/3 2006-01-27 M OTC 03/21/2000 B ON RSID3 Novo MercadoLIGHT/4 2006-02-22 M ON LIGT3 Novo MercadoSARAIVA SA LIVREIROS EDITORES/9 2006-04-07 M OTC 09/20/2000 B ON SLED3 Level 2
PN SLED4EMBRAER/14 2006-06-01 A NYSE 07/21/2000 B ON EMBR3 Novo Mercado
(continued on next page)
887A.G. de Carvalho, G.G. Pennacchi / Journal of Corporate Finance 18 (2012) 883–903

Table 1 (continued)
Firm/industry a Event date b ADR c Type of stock Stock code Market
ELETROBRAS/4 2006-06-28 A OTC 12/01/1994 B ON ELET3 Level 1PN ELET4
CESP/4 2006-07-11 A OTC 06/01/1994 B ON CESP3 Level 1PNA CESP5
a Reported is the industry sector number: 1— Basic Metal fabrication; 2— Chemical; 3— Construction; 4— Electric Power; 5— Finance and Insurance; 6— Foodand Beverage; 7—Mining; 8 — Nonmetallic Mining; 9— Other; 10— Pulp and Paper; 11— Telecommunication; 12— Textile; 13— Trade; 14— Vehicle and Parts
b Reported is the event date and whether it is an announcement date (A) or the migration date (M).c Reported is the type of ADRmarket (OTC or NYSE), the date the ADRwas first established, andwhether the ADRwas established before (B) or after (A) the firm
migrated to one of Bovespa's premium listings.
18 Similar effects should be expected with a foreign cross-listing. Indeed, Doidge (2004) finds that upon announcement of a U.S. cross-listing, both voting andnon-voting shares of dual share-class firms benefit, but non-voting shares benefit relatively more.19 In principle, one might expect greater liquidity to not only increase trading volumes but also lower bid-ask spreads. However, trading on Bovespa occursthrough an electronic order-matching system, so that bid-ask spreads not applicable to Bovespa stocks.20 Brazil's CVM released Instruction 358 in January of 2002 that amended disclosure rules regarding securities trading. An example of a change that should bedisclosed is “authorization to trade securities in any market, local or international.” Initially, it was unclear whether this provision would apply to a firm'smigration to a Bovespa premium segment. However, more recently firms are citing this Instruction when they announce their intention to migrate.
888 A.G. de Carvalho, G.G. Pennacchi / Journal of Corporate Finance 18 (2012) 883–903
.
may rise less if these minority voting shares previously enjoyed some of the benefits of control. Hence, one might expect that thevoting (control) premium, defined as the value of voting shares relative to non-voting shares, will decline at migration.18
A migrating firm's commitment to improved information disclosure should reduce information asymmetries between thefirm's insiders (including the controlling shareholder) and outside (minority) investors. With better information, outsideinvestors are less likely to suffer trading losses due to a corporate insider's superior information, and greater investor participationin shareholding should result. Thus, one would expect that migration could lead to an increase in the volume of trading and theliquidity of the firm's shares (Huddart et al., 1999), especially for non-voting shares since non-voting shareholders tended to beless informed.19
The effects of migration on both stock returns and share trading volumes may differ across firms based on a firm's corporatebehavior prior to migration. In particular, if a firm had previously cross-listed its shares on the NYSE, then a subsequent Bovespapremium listing may have a different impact relative to a firm not having a prior cross-listing. Because an NYSE cross-listing maysubstitute or complement a Bovespa premium listing as a bonding mechanism, we will control for prior cross-listings in ourempirical tests.
The choice between various premium listings also should impact a firm's share value differently since Level 2 and NovoMercado require more governance reforms in addition to the improved information disclosure as required by Level 1. Therefore,we will examine whether a Level 2 or Novo Mercado listing leads to marginally greater benefits to shareholders.
3. Empirical methodology
This section describes how we propose to examine the effects of migration on share values, the voting (control) premium ofshares, and share trading volumes. It also discusses our method for analyzing the characteristics of firms that chose a premiumlisting.
3.1. Migration's effect on share values
We first examine whether a firm's decision to migrate to a Bovespa premium listing is valuable from a shareholder's point ofview. This is done using event study methodology where the abnormal returns of a firm's equity shares are calculated around thetime of its migration. Ideally, the event window for calculating abnormal returns would be determined by a public announcementof the firm's decision to migrate. However, our search of the Brazilian financial press revealed few public announcements of firms'intentions to migrate, especially during the initial years of our sample. Until only recently did firms tend to explicitly announcetheir intentions to seek a premium segment listing on Bovespa.20 Column three of Table 1 indicates that an identifiable publicannouncement of an intention to migrate occurred for 16 of our sample's 42 migrating firms.
In cases where a firm's announcement date could be identified, we assume a four day event window that includes two tradingdays prior and two trading days after the announcement. When a firm's announcement date could not be identified, we assumethat a firm's intention to migrate was revealed to investors only around the time of its actual migration. For these cases, our testsconsider two different four-day event windows:
• Window-31: three trading days before and one after the migration• Window-22: two trading days before and two after the migration.
We choose these windows that included two or three days prior to migration to account for instances where information on afirm's intention to migrate may have been released shortly before its change in listing. Since it would be clear to investors that afirm actually migrated by one or two days following its new premium listing on Bovespa, we end the event windows shortly after

889A.G. de Carvalho, G.G. Pennacchi / Journal of Corporate Finance 18 (2012) 883–903
the actual migration date. Note that being unaware of the exact datewhen investors knewof a firm's intention tomigrate reduces thelikelihood of ourfinding a significant stockprice reaction. Hence, our estimated effects fromthedecision tomigrate are conservative.21
The econometric returns generating model for our event study is a market model based on two Brazilian stock indices:IBOVESPA and IBX. IBOVESPA is the most well-known Brazilian stock index, but it is concentrated in only a few company stocks.For this reason we opt to also include IBX, a more diversified index.
The first model that we estimate takes advantage of the panel structure of the data and assumes that the abnormal return is thesame for all migrating firms:
21 Morthe tim22 As dthese fi23 As s(1997),
Rit = αiþβiBt + γiXt + λ Wit + εit ; ð1Þ
: Rit is the return of stock i on date t; Bt is the return of the IBOVESPA index on date t; Xt is the return of the IBX index on date
wheret; and Wit is a dummy variable indicating the dates of the event window for stock i.A positive value for λ, the coefficient on Wit, indicates positive abnormal returns due to migration. Eq. (1) is estimated jointlyfor all stocks of migrating firms, constraining the abnormal return coefficient, λ, to be the same across stocks so as to test forgeneral statistical significance. We use two different methods regarding the treatment of the model's residuals, εit: GeneralizedLeast Squares (GLS) with correction for fixed-effects and heteroskedasticity and GLS with correction for random effects.22 Forrobustness purposes, we use four different estimation windows:
• 80 trading days before the migration• 80 trading days before and 80 after the migration• 40 trading days before and 40 after the migration• 80 trading days before and 40 after the migration.
Asmentioned in theprevious section, onemightexpect equity shares todisplaydifferent responses tomigrationbasedonwhether afirms' shareswere voting or non-voting shares, whether thefirm had its shares cross-listed on the NYSE prior tomigration. orwhetherthe firm chose a Level 2 or Novo Mercado premium listing. Hence, we extend the model in Eq. (1) to control for these effects:
Rit = αiþβiBt + γiXt + λ Wit + ω CiWit + εit ; ð2Þ
Ci is a control variable for the ith stock that is one of three different forms: VOTEi is a dummy indicating stock i is a voting
whereshare;NYSEi is a dummy indicating stock iwas cross-listed on the NYSE prior tomigrating; and L2NMi is a dummy indicating stock iis of a firm that migrated to a Level 2 or Novo Mercado premium listing.When Ci=VOTEi in Eq. (2), a negative value forω indicates that migrating to one of Bovespa's premiummarkets is less valuablefor voting shareholders relative to non-voting shareholders. If non-voting shares are more susceptible to expropriation, theirvaluesmight be expected to increase themost when a firmmigrates. Instead, when Ci=NYSEi, a negative value forω indicates thatmigrating to one of Bovespa's premiummarkets is less valuable for shareholders of firms having a prior NYSE listing. Alternatively,when Ci=L2NMi, a positive value for ω indicates that migrating to Level 2 or Novo Mercado, which impose higher governancestandards, is more valuable to shareholders relative to a Level 1 migration.
In addition to the panel regression method for analyzing abnormal stock returns due to migration, a conventional event studyfor each stock is performed. Market model regressions similar to Eq. (1) are run separately for each stock, which permittedabnormal returns due to migration to differ across stocks. An estimation window of 80 trading days prior to its migration and anevent window of Window-31 are assumed. While this method allows us to test for the significance of abnormal returns for eachindividual stock, a standard test of the mean abnormal return across all stocks may be unjustified. This is due to the likelihood thatthe abnormal returns for all stocks are not statistically independent, since several firms migrated on the same date.23
3.2. Migration's effect on the voting (control) premium
To test whether a firm's migration impacted the relative values of its voting and non-voting shares, we examine changes in thevotingpremiumof dual share-classfirms. FollowingNenova (2003, 2005), afirm's votingpremium is calculated as thefirm's total valueof voting benefits relative to the total value of its shareholders' equity. The date t value of this voting premium is calculated as:
VPt =Pv;t−Pnv;t
� �Nv;t
Pv;tNv;t + Pnv;tNnv;tð3Þ
Pv,t is the price of a voting share, Pnv,t is the price of a non-voting share, Nv,t is the number of voting shares, and Nnv,t is the
wherenumber of non-voting shares.e generally, if investors anticipated that some firms were more likely to migrate (cross-list) than others, the estimated abnormal stock price increase ate of migration (cross-listing) would not fully reflect the value of this bonding mechanism.iscussed in Section 5, we also adjust for possible correlation in stock return residuals for firms that migrated on the same day by forming a portfolio ofrms' stocks.hown in Table 1, 11 of the 42 firms in our sample migrated on June 26, 2001, the start of Bovespa's premium listings. As discussed in Campbell et al.the coincidence of these firms' event windows may make the independence assumption untenable.

890 A.G. de Carvalho, G.G. Pennacchi / Journal of Corporate Finance 18 (2012) 883–903
During the years 2000 and 2001, there were discussions in Brazil regarding potential reforms to its corporate law. The primaryproposalwas toprovide tag-along rights to all voting shares. InNovember 2001, compromise legislationwas enacted that required thebuyer of a firm's controlling stake to offer at least 80% of the controlling stake's offer price to all of the other voting shares. Thesecorporate law discussions were likely to have had an impact on the value of all firms' voting premiums. Therefore, in our tests of howmigration affects a firm's voting premium,we adjust each firm's voting premiumby the average voting premiumof all corporations inthe IBX index that had dual-class shares and did not migrate. Thus, a migrating firm's adjusted voting premium is
24 A feRennerfirm's v25 This
AVPt = VPt−VPIBX;t ð4Þ
VPIBX, tis the date t average voting premium of all non-migrating firms in IBX having both voting and non-voting shares.
whereWe then test whether a firm's average adjusted voting premium during the periods of four weeks, eight weeks, or 16 weeks aftermigration was different from its adjusted voting premium during the 52 weeks prior to migration. Our test assumes that
�AVPTeN μT ;σ
2T
� �ð5Þ
�AVPT is thefirm's average adjusted voting premiumduring period T, where T=B is the period beforemigration and T=A is the
whereperiod after migration.We test if μB=μA, that is, whether themean adjusted voting premiumswere equal before and after migration.
3.3. Migration's effect on trading volume
During the time whenmany of our sample firmsmigrated to premiummarkets, Bovespa experienced a serious decline in stocktrading volume. Insecurity from the 2001 crisis in Argentina had spread to Brazil, and a flight to quality led many foreign investorsto avoid emerging markets. Therefore, to isolate the effects of migration on a particular stock's trading volume, we adjust foroverall market factors that influenced trading. We assume a simple model in which the daily volume traded in a particular stock isa function of the volume traded in all stocks listed on Bovespa. The econometric estimation is based on the panel regression:
ln Vitð Þ = αiþλ DMitþ βi + γ DMitð Þln VBtð Þ + εit ; ð6Þ
: Vit is the average daily volume traded in R$ thousands of stock i duringweek t24; VBt is the average daily volume traded in R
where$millions of all stocks on Bovespa duringweek t; andDMit is a dummy variable equal to 1 if company i hasmigrated prior to week tand zero, otherwise.The model in Eq. (6) allows each stock to have a different unconditional trading volume relative to the total volume traded onBovespa, αi, and a different proportional sensitivity to the total volume traded on Bovespa, βi.25 The effect of migration is indicatedby λ and γ, the coefficients on the variables DMit and DMitln(VBt). Since it is probably more natural to consider migration as havingan effect that is proportional to a particular stock's prior volume of trading, Eq. (6) is estimated in logs of volume, rather thanlevels. However, because there are some days when a particular stock has no trading volume, we aggregate volume over a week toeliminate observations equaling zero. Note that Eq. (6) implies
1Vit
� �∂Vit
∂DMit= λ + γ ln VBtð Þ½ �: ð7Þ
If migration increases trading volume, as should be the case if greater disclosure improves a stock's liquidity, then λ+γln(VBt)should be positive. The coefficient λ indicates the stock's proportional change in unconditional volume while γ measures thechange in the stock volume's elasticity with respect to Bovespa's volume since
1Vit
� �∂Vit
1VBt
� �∂VBt
= βi + γDMit : ð8Þ
For example, a 1% change in Bovespa's volume ( 1VBt
∂VBt =1%) results in a [βi+γDMit]% change in stock i's volume.
3.4. Characteristics of migrating firms
Similar to Pagano et al. (2002) and Claessens and Schmukler (2007) who analyze the characteristics of firms that choose aforeign cross listing, we use duration analysis to examine the features of firms that choose a premium listing. Specifically, we
w firms converted their non-voting shares to voting shares shortly before migrating. This includes Arcelor Brazil, which migrated to Level 1, and Lojasand Tractebel Energia, both of which migrated to Novo Mercado. To create consistent time series for these firms, we sum the daily trading volumes of theoting and non-voting shares prior to conversion and append this to the daily trading volumes of the firm's (sole) voting shares after conversion.model nests the theoretical model in Tkac (1999) which predicts βi=1 for all i.

891A.G. de Carvalho, G.G. Pennacchi / Journal of Corporate Finance 18 (2012) 883–903
estimate a Cox proportional hazard model. The hazard rate, h(t), is the probability of migrating during year t conditional on nothaving yet migrated at the start of year t. This probability is assumed to depend on a set of firm characteristics observable at thestart of year t, Xt. The model assumes:
26 Finawith no27 WeCarvalh28 Webecause
h tð Þ = h0 tð Þexp β′Xt
� � ð9Þ
h0(t) is the date t baseline hazard function and β is a vector of coefficients to be estimated. This model is semi-parametric in
wherethat the form of h0(t) is unspecified.As discussed earlier, firms with substantial growth opportunities should be more likely to choose migration as a bondingmechanism that reduces their cost of funding. Thus, in the vector Xt we include sales growth and Tobin's q as proxies for growthopportunities. Also included are additional variables that could affect the decision to migrate, such as a firm's size (log of totalassets), leverage, return on equity, whether a firm had a U.S. cross-listing, and an index of the firm's corporate governance quality.We also control for industry differences.
4. The data
From Economatica we obtained daily closing stock prices and daily monetary trading volumes of the stocks of all firms thatmigrated to one of Bovespa's premium markets. These time series cover the five-year period between June 2001 and September2006. Some of our tests also use the daily returns on the BOVESPA and IBX indices, the total daily monetary trading volume of allstocks listed on Bovespa, as well as the stock prices of voting and non-voting shares of all firms in the IBX index (to adjust forvoting premium variations). To construct daily returns, Economatica adjusts daily percentage price changes for splits, dividends,and other cash and non-cash rights.
Some Brazilian stocks, often voting shares, are very thinly traded, and they were excluded from particular tests. The sampleselection criteria for specific tests are discussed in the next section. Table 1 lists the 70 stocks that were issued by 42 differentcorporations that migrated to one of Bovespa's premiummarkets and that met the sample selection criteria for one or more of ourempirical tests on share valuation and trading volume.
We also obtained from Economatica end-of-year financial statement data on all Bovespa-listed firms over the period 2000 to2006. These data were used to construct firm characteristics used in our duration analysis of a firm's decision to migrate: SalesGrowth; Tobin's q ([Total Assets−Book Value of Equity+Market Value of Equity]/Total Assets); Log of Total Assets; Leverage(Total Liabilities/Total Assets); and Return on Equity. A complete set of these firm characteristic data was available for 238different firms, 46 of which migrated and 192 of which did not migrate.26
In addition, our duration analysis uses an annual corporate governance index (CGI) constructed by Ricardo Leal and AndréCarvalhal-da-Silva and that was available for 146 of the 238 firms in our sample.27 The value of this index for a particular firm is thenumber of ‘yes’ answers to 24 questions, where an affirmative answer is associated with good governance. These questions can beanswered from publically available information and cover four main areas: disclosure; board composition and functioning; ethicsand conflicts of interest; and shareholder rights.
5. Results
5.1. Share values
The results of estimating the market model in Eqs. (1) and (2) are given in Tables 2 to 5. To be included in the panel regressionsample, we require that a stock be traded on at least 115 of the 160 trading days around its firm's migration and also to be tradedduring its event window. These selection criteria result in a sample of 47 voting and non-voting shares from 38 different firms.28
Each table reports results for two different models of the regression residuals: fixed effects with correction forheteroskedasticity; and random effects. In addition, the tables give results for four different estimation windows that comprisevarious combinations of 40 and 80 trading-day periods before and after a firm's migration. Also reported are results for twodifferent assumptions regarding an event window around migration. Recall that for the 16 firms where we can identify a publicannouncement of migration, we assume an event window of two trading days before and two trading days after the firm'sannouncement. For firms lacking a public announcement, the event window is assumed to be either three trading days before andone trading day after the firm's actual migration (Window-31) or two trading days before and two trading days after migration(Window-22).
Table 2 reports results without including controls for differences between voting and non-voting shares, whether the firm hada prior NYSE cross-listing, or whether the firm migrated to Level 1 versus Level 2 or Novo Mercado. Panel A of Table 2 shows thatthe estimated cumulative abnormal return due to migration is positive and statistically significant at the one percent level for both
ncial sector firms (banks and insurance companies) are excluded from this sample since some financial ratios (e.g., sales growth) are not comparablen-financial firms.are most grateful to Ricardo Leal and André Carvalhal-da-Silva for permitting us to use their data. A detailed description of the CGI is given in Leal andal-da-Silva (2007). Of these 146 firms, 38 migrated and 108 did not.also exclude stocks of firms that had confounding events at the time of (or announcement of) migration. For example, NET/Globocabo is excludedit announced a seasoned equity offering at the time of its migration to Level 1 on June 26, 2001. See Table 13.

Table 3Effect of migration on returns (controlling for voting shares). The values reported represent the cumulative percentage abnormal returns over the event windowsThey were obtained from the model Rit=αi+βiBt+γiXt+λWit+ωVoteiWit+εit, where Ritis the date t return on stock i; Bt is the date t return on the IBOVESPAindex; Xt is the date t return on IBX index; Witis a dummy variable indicating the event window for stock i; and Votei is a dummy variable that indicates votingshares. These results were obtained using GLS with correction for heteroskedasticity and for random effects. The event windows tested are: Window-22 (twotrading days before and two after migration/announcement); andWindow-31 (three trading days before and one after migration/two trading days before and twoafter announcement). Only stocks traded on at least 115 of the 160 trading days around the migration/announcement date and traded during the event windoware in the sample. The sample includes 47 stocks representing 38 different firms. There are 13 voting shares. In parentheses are z-statistics for the coefficients λ andω associated with the variables Wit and VoteiWit, respectively.
Estimation window
80 trading days beforemigration
80 trading days before and80 after the migration
40 trading days before and40 after the migration
80 trading days before and40 after the migration
Heteroskedastic panelWindow-22 W 1.64** 1.42* 1.78** 1.70**
(2.24) (1.93) (2.44) (2.37)VOTE×W 1.84* 1.96* 1.67 1.71*
(1.69) (1.70) (1.63) (1.65)Window-31 W 2.25*** 1.91*** 2.11*** 2.19***
(3.10) (2.58) (2.90) (3.04)VOTE×W −0.07 0.78 0.00 −0.05
(−0.07) (0.67) (0.00) (−0.05)
Random Effects PanelWindow-22 W 2.41*** 2.63*** 2.72*** 2.63***
(2.88) (3.12) (3.24) (3.21)VOTE×W 0.35 0.24 0.17 0.23
(0.23) (0.15) (0.11) (0.15)Window-31 W 2.39*** 2.60*** 2.72*** 2.62***
(2.86) (3.09) (3.25) (3.20)VOTE×W 0.69 0.51 0.36 0.44
(0.45) (0.33) (0.24) (0.29)
*, **, and *** indicate statistical significance at the 10% level, the 5% level, and the 1% level, respectively.
Table 2Effect of migration on returns. The values reported represent the cumulative percentage abnormal returns over the event windows. They were obtained from themodel Rit=αi+βiBt+γiXt+λWit+εit, where Ritis the date t return on stock i; Bt is the date t return on the IBOVESPA index; Xt is the date t return on IBX indexandWitis a dummy variable indicating the event window for stock i. These results were obtained using GLS with correction for heteroskedasticity and for randomeffects. The event windows tested are: Window-22 (two trading days before and two after migration/announcement); andWindow-31 (three trading days beforeand one day after migration/two trading days before and two after announcement). Only stocks traded on at least 115 of the 160 trading days around themigration/announcement date and traded during the event window are in the sample. The Panel A sample includes 47 stocks representing 38 different firms. ThePanel B sample includes 32 stocks representing 27 different firms and one portfolio with 15 stocks representing the 11 firms that migrated on June 26, 2001. Thevalues in parentheses are z-statistics for the coefficient λ associated with variable Wit.
Estimation Window
80 trading days beforemigration
80 trading days before and80 after the migration
40 trading days before and40 after the migration
80 trading days before and40 after the migration
Panel A: All individual sharesHeteroskedastic Panel
Window-22 2.44*** 2.20*** 2.59*** 2.51***(4.54) (3.89) (5.07) (4.87)
Window-31 2.17*** 2.18*** 2.06*** 2.12***(4.15) (3.83) (3.89) (4.03)
Random Effects PanelWindow-22 2.45*** 2.63*** 2.69*** 2.65***
(3.47) (3.71) (3.79) (3.83)Window-31 2.47*** 2.64*** 2.72*** 2.65***
(3.49) (3.73) (3.83) (3.83)
Panel B: A portfolio of shares used for firms migrating on same dateHeteroskedastic Panel
Window-22 1.97*** 1.90**v 2.25*** 2.04****(3.04) (2.91) (3.48) (3.20)
Window-31 2.39*** 2.22*** 2.49*** 2.37***(3.68) (3.39) (3.84) (3.71)
Random effects panelWindow-22 1.88** 2.26*** 2.24*** 2.16***
(2.32) (2.86) (2.78) (2.71)Window-31 1.84** 2.18*** 2.16*** 2.09***
(2.27) (2.75) (2.69) (2.63)
*, **, and *** indicate statistical significance at the 10% level, the 5% level, and the 1% level, respectively.
892 A.G. de Carvalho, G.G. Pennacchi / Journal of Corporate Finance 18 (2012) 883–903
.
;
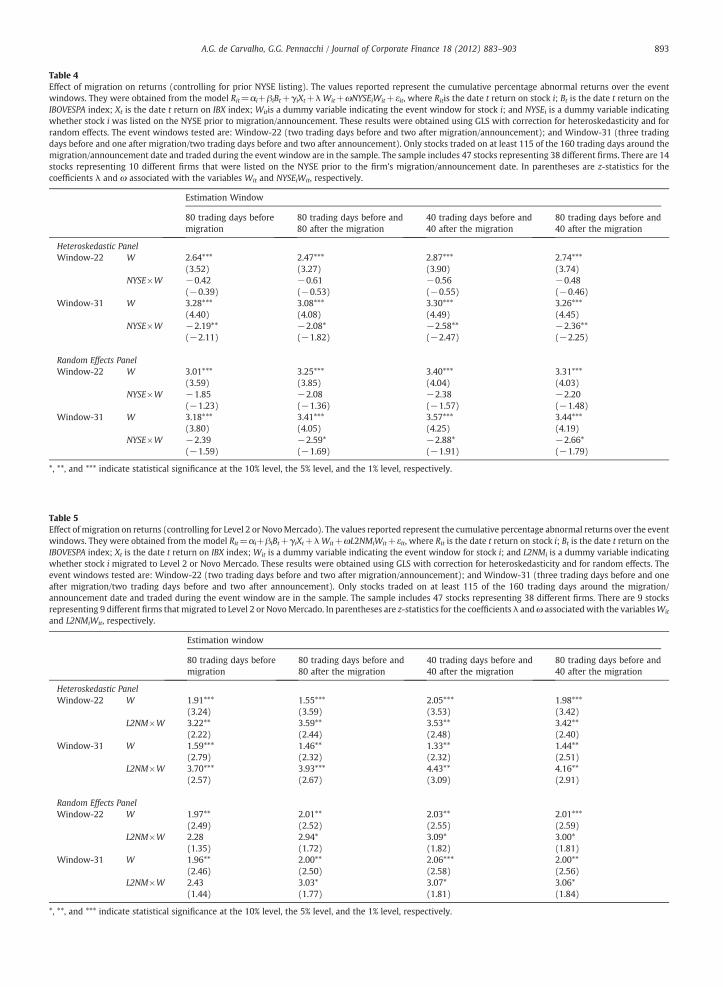
Table 5Effect of migration on returns (controlling for Level 2 or NovoMercado). The values reported represent the cumulative percentage abnormal returns over the evenwindows. They were obtained from the model Rit=αi+βiBt+γiXt+λWit+ωL2NMiWit+εit, where Rit is the date t return on stock i; Bt is the date t return on theIBOVESPA index; Xt is the date t return on IBX index; Wit is a dummy variable indicating the event window for stock i; and L2NMi is a dummy variable indicatingwhether stock i migrated to Level 2 or Novo Mercado. These results were obtained using GLS with correction for heteroskedasticity and for random effects. Theevent windows tested are: Window-22 (two trading days before and two after migration/announcement); and Window-31 (three trading days before and oneafter migration/two trading days before and two after announcement). Only stocks traded on at least 115 of the 160 trading days around the migrationannouncement date and traded during the event window are in the sample. The sample includes 47 stocks representing 38 different firms. There are 9 stockrepresenting 9 different firms that migrated to Level 2 or NovoMercado. In parentheses are z-statistics for the coefficients λ andω associatedwith the variablesWand L2NMiWit, respectively.
Estimation window
80 trading days beforemigration
80 trading days before and80 after the migration
40 trading days before and40 after the migration
80 trading days before and40 after the migration
Heteroskedastic PanelWindow-22 W 1.91*** 1.55*** 2.05*** 1.98***
(3.24) (3.59) (3.53) (3.42)L2NM×W 3.22** 3.59** 3.53** 3.42**
(2.22) (2.44) (2.48) (2.40)Window-31 W 1.59*** 1.46** 1.33** 1.44**
(2.79) (2.32) (2.32) (2.51)L2NM×W 3.70*** 3.93*** 4.43** 4.16**
(2.57) (2.67) (3.09) (2.91)
Random Effects PanelWindow-22 W 1.97** 2.01** 2.03** 2.01***
(2.49) (2.52) (2.55) (2.59)L2NM×W 2.28 2.94* 3.09* 3.00*
(1.35) (1.72) (1.82) (1.81)Window-31 W 1.96** 2.00** 2.06*** 2.00**
(2.46) (2.50) (2.58) (2.56)L2NM×W 2.43 3.03* 3.07* 3.06*
(1.44) (1.77) (1.81) (1.84)
*, **, and *** indicate statistical significance at the 10% level, the 5% level, and the 1% level, respectively.
Table 4Effect of migration on returns (controlling for prior NYSE listing). The values reported represent the cumulative percentage abnormal returns over the evenwindows. They were obtained from the model Rit=αi+βiBt+γiXt+λWit+ωNYSEiWit+εit, where Ritis the date t return on stock i; Bt is the date t return on theIBOVESPA index; Xt is the date t return on IBX index; Witis a dummy variable indicating the event window for stock i; and NYSEi is a dummy variable indicatingwhether stock i was listed on the NYSE prior to migration/announcement. These results were obtained using GLS with correction for heteroskedasticity and forandom effects. The event windows tested are: Window-22 (two trading days before and two after migration/announcement); and Window-31 (three tradingdays before and one after migration/two trading days before and two after announcement). Only stocks traded on at least 115 of the 160 trading days around themigration/announcement date and traded during the event window are in the sample. The sample includes 47 stocks representing 38 different firms. There are 14stocks representing 10 different firms that were listed on the NYSE prior to the firm's migration/announcement date. In parentheses are z-statistics for thecoefficients λ and ω associated with the variables Wit and NYSEiWit, respectively.
Estimation Window
80 trading days beforemigration
80 trading days before and80 after the migration
40 trading days before and40 after the migration
80 trading days before and40 after the migration
Heteroskedastic PanelWindow-22 W 2.64*** 2.47*** 2.87*** 2.74***
(3.52) (3.27) (3.90) (3.74)NYSE×W −0.42 −0.61 −0.56 −0.48
(−0.39) (−0.53) (−0.55) (−0.46)Window-31 W 3.28*** 3.08*** 3.30*** 3.26***
(4.40) (4.08) (4.49) (4.45)NYSE×W −2.19** −2.08* −2.58** −2.36**
(−2.11) (−1.82) (−2.47) (−2.25)
Random Effects PanelWindow-22 W 3.01*** 3.25*** 3.40*** 3.31***
(3.59) (3.85) (4.04) (4.03)NYSE×W −1.85 −2.08 −2.38 −2.20
(−1.23) (−1.36) (−1.57) (−1.48)Window-31 W 3.18*** 3.41*** 3.57*** 3.44***
(3.80) (4.05) (4.25) (4.19)NYSE×W −2.39 −2.59* −2.88* −2.66*
(−1.59) (−1.69) (−1.91) (−1.79)
*, **, and *** indicate statistical significance at the 10% level, the 5% level, and the 1% level, respectively.
893A.G. de Carvalho, G.G. Pennacchi / Journal of Corporate Finance 18 (2012) 883–903
t
/sit
t
r

894 A.G. de Carvalho, G.G. Pennacchi / Journal of Corporate Finance 18 (2012) 883–903
the three days before and one day after migration event window (Window-31) and the two days before and two days after eventwindow (Window-22). The point estimates for the abnormal returns range between 2.06% and 2.72% depending on the chosenevent and estimation windows and error correctionmethod. However, in each case the evidence is consistent with the notion thatinvestors view a firm's listing on one of Bovespa's premiummarkets as a commitment to greater minority shareholder protection.
This increase in shareholder value at the time of migration is comparable to the 2.63% increase that Miller (1999) found whenfirms announced a cross-listing on the NYSE or NASDAQ. As Stulz (1999) points out, the size of the abnormal returns found byMiller (1999) and others may be an underestimate of the true increase in value that shareholders attribute to a firm's cross-listingbecause the firm's action may have been partially anticipated. The same insight holds for our event study: some of the increase inshareholder value may have occurred weeks before a firm's actual migration date if investors viewed migration to have a positiveprobability. Hence our estimates of the impact of migration are likely to be conservative.
Panel B of Table 2 examines the robustness of the abnormal return estimates by using an alternative control for cross-correlation in the returns of shares of firms that migrated on the same day. Specifically, we formed an equally-weighted portfolioof the 15 stocks of the 11 firms that migrated on the initial day of June 26, 2001. We then re-ran the regressions treating thisportfolio as a single observation. The estimated abnormal returns range from 1.84% to 2.49% depending on the particularestimation and event windows and error correction method. However, as in Panel A, in each instance these estimates arestatistically significant at the 1% or 5% level. Thus, our results are not driven by the group of firms that migrated at the start ofBovespa's premium listings.
In Table 3, we estimate Eq. (2) where Ci=VOTEi controls for voting shares. In this set of regressions the coefficient on the eventwindow, W, represents the abnormal return for non-voting shares while the sum of this coefficient and that of the VOTE×Wrepresents the abnormal return for voting shares. Similar to the results in the previous table, for each estimation window andevent window choice, the event window coefficient representing the abnormal return on non-voting shares is positive andstatistically significant. In addition, the added effect for voting shares, VOTE×W, is statistically insignificant for most estimationand event window choices. Only when the event window is Window-22 and there is adjustment for heteroskedasticity does thedifference between the abnormal returns between voting and non-voting shares become significant at the 10% level. However, theoverall evidence appears to suggest that, as a group, there is as much of an increase in the value of voting shares as there is for thevalue of non-voting shares.
Table 4 is similar to Table 3 but instead estimates Eq. (2) where Ci=NYSEi controls for the shares of firms that had NYSE cross-listings prior to migration. Fourteen of the 47 stocks are of firms that had an NYSE cross-listing prior to their Bovespa premiumlisting. Depending on the event window and residual modeling, the abnormal returns reflecting shares of firms without a priorcross-listing appear somewhat higher than before, ranging from 2.47% to 3.57%. In all cases, the point estimates for the coefficienton the prior NYSE cross-listing dummy variable are negative, and they are statistically significant in 7 of the 16 cases. These resultsmight be interpreted as mild evidence that firms without a prior NYSE cross-listing benefit the most from migrating to a Bovespapremium listing.
Table 5 estimates Eq. (2) once again but nowwhere Ci=L2NMi controls for the shares of firms that migrated to Level 2 or NovoMercado, which are the premium listings that add higher governance standards to the primarily disclosure-related standards ofLevel 1. Nine out of our sample of 47 stocks were of firms that chose Level 2 (5 firms) or Novo Mercado (4 firms) listings. Whenregressions include this control, Table 5 shows that the coefficient on the migration event, W, remains positive and significant,though 0.48% to 0.73% less compared to the those of the regressions in Table 2 that exclude the control. The coefficient on theL2NM×W variable controlling for a Level 2 or Novo Mercadomigration is always positive and is statistically significant in 14 of the16 regression specifications. The coefficient estimates on this control indicate that the marginal benefit of choosing a Level 2 orNovo Mercado listing versus a Level 1 listing is an abnormal return ranging from 2.28% to 4.43%. These results are supportiveevidence that shareholders value the additional corporate governance improvements that come with a Level 2 and Novo Mercadolisting.
Our final analysis of abnormal returns involves estimating separate market models of the form of Eq. (1) for each stock issuedby a migrating firm. The results assuming an event Window-31 are reported in Table 6. There one sees that the average abnormalreturn is 2.63%, which coincidentally is the same average abnormal return found by Miller (1999) for firms announcing an NYSE/NASDAQ cross-listing. This cumulative abnormal return would be statistically significant under the assumption that returns areindependent across firms.29 Eight of the 47 stocks had significantly positive abnormal returns while only two stocks hadsignificantly negative ones. The average abnormal return for the 14 stocks issued by firms that had a prior NYSE cross-listing was1.03%. In contrast, the average abnormal return for the 33 stocks that did not have a prior NYSE listing was 3.30%. Table 6 alsoshows that average abnormal return for voting shares was 2.65% while it was 2.76% for non-voting shares. Average abnormalreturns for the 38 stocks of firms choosing a Level 1 listing was 2.33% while average abnormal returns for the nine stocks of firmschoosing a Level 2 or Novo Mercado listing was 3.90%. These results are consistent with the previous tables' panel regressionresults.
In summary, our samples of voting and non-voting shares appear to experience similar average abnormal returns due tomigration. Differences emerge when the sample is split between stocks of firms with a prior NYSE listing and of firms choosing aLevel 2 or Novo Mercado listing. We find some evidence that shareholders benefit more from a Bovespa premium listing if theirfirms had not previously cross-listed on the NYSE, suggesting that an NYSE cross-listing partially substitutes for a Bovespa
29 The potential lack of independence due to several firms migrating on the same date was the motivation for our panel regression tests in Tables 2 through 5
.
Table 6Effect of migration on returns (individual shares). Cumulative abnormal returns are reported as a percentage over a four trading day event window. Theseabnormal returns were estimated by OLS from amarket model using the IBOVESPA and IBX indices as explanatory variables. The estimation window is 80 tradingdays before the event window. The event window for the stocks whose event date is the migration date (M) is three trading days before and one after themigration. The event window for the stocks whose event date is the announcement date (A) is two trading days before and two after the announcement. Onlythose stocks that traded over the entire event window are included.
Stock Event Date and Type Prior NYSE Cummulative abnormal returns z-statistic Standard Deviation
BBDC3 BANCO BRADESCO ON 2001-06-26 M No 3.15 0.78 4.033BBDC4 BANCO BRADESCO PN 2001-06-26 M No 1.76 0.40 4.436ITAU4 BANCO ITAU PN 2001-06-26 M No 4.52 1.01 4.494BRAP3 BRADESCO PARTICIP. ON 2001-06-26 M No 3.60 0.58 6.177BRAP4 BRADESCO PARTICIP. PN 2001-06-26 M No 3.13 0.65 4.813GGBR4 GERDAU PN 2001-06-26 M Yes −3.75 −0.72 5.240PLIM4 GLOBOCABO PN 2001-06-26 M No 25.79*** 3.81 6.765ITSA4 ITAU SA PN 2001-06-26 M No 4.51 1.28 3.535PRGA4 PERDIGAO PN 2001-06-26 M Yes 10.33*** 3.01 3.432RAPT4 RANDON PART. PN 2001-06-26 M No 6.95 1.30 5.361SDIA4 SADIA PN 2001-06-26 M No 8.77** 2.20 3.989UBBR3 UNIBANCO ON 2001-06-26 M Yes 0.60 0.60 1.007UBBR4 UNIBANCO PN 2001-06-26 M Yes 4.82 1.08 4.474UBBR1 UNIBANCO UNT 2001-06-26 M Yes −2.19 −0.35 6.237VAGV4 VARIG PN 2001-06-26 M No −5.18 −0.72 7.169CMIG3 CEMIG ON 2001-10-17 M Yes −2.72 −0.45 6.099CMIG4 CEMIG PN 2001-10-17 M Yes −3.60 −0.69 5.250RPSA4 RIPASA PN 2001-11-12 M No −3.58 −0.70 5.082VCPA4 VOTORANTIN CEL. PAPEL PN 2001-11-14 M No 5.42 0.97 5.586ARCZ6 ARACRUZ PNB 2002-04-16 M Yes 4.65 0.84 5.544SBSP3 SABESP ON 2002-04-19 A No 9.04*** 2.59 3.491BRTO4 BRASIL TELECOM PN 2002-05-09 M Yes 3.54 1.40 2.526BRTP3 BRASIL TELEC. PART. ON 2002-05-09 M No 0.55 0.14 4.019BRTP4 BRASIL TELEC. PART. PN 2002-05-09 M No 0.66 0.21 3.106CLSC6 CELESC PNB 2002-06-21 A No 11.20** 2.39 4.681TRPL3 TRAN PAULISTA ON 2002-09-18 M No 6.10** 1.97 3.096TRPL4 TRAN PAULISTA PN 2002-09-18 M No −1.29 −0.23 5.714KLBN4 KLABIN PN 2002-12-10 M No −0.14 −0.03 5.273PCAR4 P. ACUCAR-CBD PN 2003-04-24 A Yes 4.06 0.85 4.759SUZA4 SUZANO BAHIA SUL PN 2003-05-08 M No 2.18 0.59 3.712GOAU4 GERDAU MET PN 2003-05-13 A No −6.72** −2.21 3.046VALE3 CIA VALE DO RIO DOCE ON 2003-12-12 M Yes 2.07 0.68 3.031VALE5 CIA VALE DO RIO DOCE PNA 2003-12-12 M Yes 0.10 0.03 2.897CNFB4 CONFAB INDUSTRIAL SA PN 2003-12-19 M No 2.60 0.67 3.910UNIP6 UNIPAR-UNIAO PET SA PNB 2004-08-11 A No 2.41 0.53 4.574ELPL4 ELETROPAULO MET PN 2004-09-10 A No 6.97 1.49 4.690SUZB4 SUZANO PET SA PN 2004-10-22 A No −0.26 −0.04 6.075ETER3 ETERNIT SA ON 2005-01-26 A No 4.90* 1.87 2.616DURA4 DURATEX SA PN 2005-02-24 A No 1.91 0.48 3.957UGPA4 ULTRAPAR PARTICIP. SA PN 2005-03-22 A Yes −7.49* −1.86 4.035MYPK4 IOCHPE MAXION SA PN 2005-09-21 A No 0.03 0.01 4.572RSID3 ROSSI RESIDENCIAL SA ON 2006-01-27 M No −15.45 −1.51 10.264LIGT3 LIGHT ON 2006-02-22 M No 13.49*** 2.59 5.203SLED4 SARAIVA PN 2006-04-07 M No 1.18 0.22 5.301EMBR3 EMBRAER ON 2006-06-01 A Yes 3.99 1.00 3.987ELET3 ELECTROBRA ON 2006-06-28 A No 5.11 1.01 5.044ELET4 ELECTROBRA PN 2006-06-28 A No 5.73 1.31 4.367
Average 2.63*** 5.40 0.49
*, **, and *** indicate statistical significance at the 10% level, the 5% level, and the 1% level, respectively.
895A.G. de Carvalho, G.G. Pennacchi / Journal of Corporate Finance 18 (2012) 883–903
premium listing. There also appears to be a marginal benefit from the higher corporate governance standards that derive from aLevel 2 and Novo Mercado listing.
5.2. Voting premium
The previous section's results may not be indicative to the relative returns earned on a particular dual share-class firm's votingand non-voting shares. One reason for this is that some of the voting shares that we analyzed are of firms that migrated to NovoMercado and, therefore, these firms could have only voting shares. In cases where Novo Mercado-listed firms had previouslyissued non-voting shares, they tended to convert them to voting shares well before migration and, hence, these shares are not inour sample. Another reason is that evenwhen dual share-class firmsmigrate to Levels 1 or 2, their voting shares often are excludedfrom our event study tests. As discussed earlier, voting shares tend to be less frequently traded, so that there are often insufficientprice observations for computing returns during the tests' estimation and event window periods.

896 A.G. de Carvalho, G.G. Pennacchi / Journal of Corporate Finance 18 (2012) 883–903
This section attempts to provide more insight regarding the relative returns to a particular dual share-class firm's voting andnon-voting shares at the time of migration. It uses a test methodology that is less sensitive to voting share illiquidity. As detailed inSection 3.2, we analyze the average change in a dual share-class firm's voting premium over relatively long intervals prior to, andfollowing, their migrations. If this change is statistically significant relative to firms that did not migrate over the same period, thenwe may conclude that the firm's voting and non-voting shareholders earn statistically different returns due to migration.
Table 7 analyzes themarket-adjusted voting (control) premium for 21migratingfirms that had dual share classes of voting andnon-voting shares. Column one gives the adjusted voting premium during the 52 weeks prior to migration while columns two, three, andfour give the change in the average voting premium during the periods of four weeks, eight weeks, and 16 weeks following migration.
For 11 of the firms, there is at least one post-migration period characterized by a statistically significant decline in the votingpremium. For only six of the firms does the voting premium rise significantly following migration. Taken as a whole, this evidencesuggests that migration is likely to benefit a firm's non-voting shareholders more than its voting shareholders.
These results contrast with the event study evidence of the previous section that included voting shares of single share-classfirms and excluded many illiquid voting shares of dual share-class firms. That sample of voting shares appeared to benefit frommigration just as much as, if not more than, non-voting shares. However, we now see that analyzing the relative returns to votingand non-voting shares at the level of a particular dual share-class firm can matter. Doing so produces evidence consistent with thetheoretical prediction that better disclosure and governance benefits non-voting shareholders the most.
Table 7Effect of migration on the voting (control) premium. The voting premium was calculated as VPt=(Pv, t−Pnv, t)Nv, t/(Pv, tNv, t+Pnv, tNnv, t), where Pv,t is the price of avoting share; Pnv,t is the price of a non-voting share; Nv,t is the number of voting shares; and Nnv,t is the number of non-voting shares. For each firm the votingpremium was adjusted by subtracting the average of the voting premiums of all corporations in the IBX index that had dual-class shares. For each firm we reportthe average voting premium during the 52 weeks before its migration and the difference in the average adjusted voting premiums during the 4, 8, and 16 weekperiods after its migration. The second reported value is the z-statistic and in parentheses is the number of observations in the period.
52 weeksbefore
Differences
4 weeks after 8 weeks after 16 weeks after
Alpargatas 0.026 0.213*** 0.167*** 0.098***(31) 0.000(4) 0.000 (8) 0.000 (14)
Aracruz −0.189 0.009 0.016 0.026***(42) 0.562 (4) 0.165 (8) 0.003 (15)
Banco Bradesco −0.055 −0.049*** −0.056*** −0.068***(52) 0.002 (4) 0.000(8) 0.000 (16)
Banco Itaú 0.038 −0.052** −0.054*** −0.061***(51) 0.016 (4) 0.001 (8) 0.000 (16)
Bradespar −0.004 −0.031 −0.044*** −0.052***(46) 0.166 (4) 0.007 (8) 0.000 (16)
Brasil Telec. −0.117 −0.027* −0.023** −0.029***(51) 0.082 (4) 0.039 (8) 0.000 (16)
Brasil Telec. Part. −0.030 −0.043*** −0.051*** −0.075***(52) 0.000 (4) 0.000 (8) 0.000 (16)
Brasken −0.052 0.025(14) 0.154 (4)
Cemig −0.023 −0.024** −0.027*** −0.029***(52) 0.029 (4) 0.001 (8) 0.000 (16)
Cesp −0.098 0.007 −0.015 −0.03(52) 0.763 (4) 0.343 (8) 0.865 (10)
Gerdau −0.040 −0.019* −0.010 −0.018**(32) 0.075 (3) 0.220 (5) 0.035 (6)
Gerdau Met. −0.017 0.013 0.007 0.004(22) 0.294 (2) 0.373 (5) 0.413 (13)
Iochpe −0.099 −0.036 −0.033 −0.022(25) 0.292 (3) 0.217 (5) 0.278 (9)
Itausa 0.162 −0.028* −0.038*** −0.030***(50) 0.097 (4) 0.002 (8) 0.001 (15)
Marcopolo 0.021 −0.013 −0.026* −0.044***(25) 0.511 (2) 0.066 (4) 0.000 (9)
Perdigão S/A 0.079 −0.109***(18) 0.000 (2)
Sadia 0.126 0.042*** 0.26** 0.009(13) 0.001 (3) 0.016 (6) 0.354 (10)
Tran Paulista −0.137 0.032 0.046*** 0.065***(52) 0.123 (4) 0.003 (8) 0.000 (16)
Unibanco 0.419 −0.015 −0.014 0.015*(52) 0.292 (4) 0.156 (8) 0.098 (16)
Unipar 0.011 −0.026** −0.021** −0.011*(52) 0.034 (4) 0.016 (8) 0.086 (16)
Vale Rio Doce 0.036 0.060*** 0.065*** 0.074***(52) 0.000 (4) 0.000 (8) 0.000 (16)
*, **, and *** indicate statistical significance at the 10% level, the 5% level, and the 1% level, respectively.

897A.G. de Carvalho, G.G. Pennacchi / Journal of Corporate Finance 18 (2012) 883–903
5.3. Trading volume
This section examines whether trading volumes increase following migration, as would be predicted if greater disclosure leadsto less information asymmetries and greater share liquidity. Regressions of Eq. (6) are estimated at a weekly frequency usingweekly averages of daily trading volumes during the 100 trading days prior to a firm's migration and the 100 trading days after itsmigration. To be included in this analysis, a stock must have traded at least once during each week of the estimation period. Thisselection criterion leaves a sample of 49 stocks of 38 different firms.
Table 8 reports results of panel regressionsbasedondifferent subsamples andempirical specifications.Models 1, 2, and3of the tablecorrect the regression residuals for heteroskedasticity whileModels 4, 5, and 6 correct the regression residuals for random effects. TheformsofModels 1 and4allow for only afixedproportional shift indaily trading volumewhileModels 2 and5allow for only a shift in thestock volume's sensitivity to changes in Bovespa's total volume. Models 3 and 6 are the most general by allowing both types of shifts.
When only a fixed shift is modeled, columns one and four of Table 8 indicate that if all shares are considered together,migration leads to a statistically significant increase in volume of 7.0% and 17.0% for Models 1 and 4, respectively. Examining sub-samples, there is evidence that this increase comes mainly from non-voting shares: for Models 1 and 4, volumes for non-votingshares increase 7.4% and 17.8%, respectively, while volume increases are smaller and statistically insignificant for voting shares.Interestingly, when only stocks of firms that had NYSE cross-listings prior to migration are considered, migration leads to theirvolumes on Bovespa increasing by the substantial amounts of 15.4% and 23.7% for Models 1 and 4, respectively. A potentialexplanation for these increases in volume is that trading shifted from the NYSE to Bovespa following migration.
The results are qualitatively similar if one models the effect of migration as being only a change in the stock volume's elasticitywith respect to Bovespa's total volume of trading. In Models 2 and 5, the proportional increase in volume due to migration equalsγln(VBt). If we evaluate this change at the daily average log volume (in R$ millions) traded on Bovespa during our sample period,20.29, one obtains a proportional increase of 0.003×20.29=6.1% and 0.009×20.29=18.3% inModels 2 and 5 for the sample of allshares. As before, this increase from migration occurs mainly for non-voting shares (8.1% and 18.3% for Models 2 and 5) and forNYSE cross-listed shares (16.2% and 24.3% for Models 2 and 5).
The most general specifications, Models 3 and 6, imply that the proportional effect of migration equals λ+γln(VBt). FromTable 8, we see that when both effects are permitted, the sign of λ becomes negative but γ stays positive. However, if as before,
Table 8Effect of migration on trading volumes. This table presents estimates for the model ln(Vit)=αi+λ DMit+(βi+γ DMit)ln(VBt)+εit where Vit is the average dailyvolume traded in R$ thousands of stock i during week t, VBt is the average daily volume traded in R$millions of all stocks listed on Bovespa during week t, and DMis a dummy variable equal to 1 if firm i migrated/announced migration prior to week t and zero, otherwise. Two different estimation methods are used: GLS withcorrection for heteroskedasticity and GLS with random effects. The sample comprises the 100 trading days before and 100 days after each firm's migrationannouncement. “All Shares” estimates are for 49 stocks of 38 different firms. “Only Non−Voting Shares” (Only Voting Shares”) estimates are for 34 (14) stocks o34 (14) different firms. “Only Shares of Firms with a Prior NYSE Cross-Listing” estimates are for 15 stocks of 10 different firms. In parentheses are the regressioncoefficients’ z-values.
Heteroskedastic Random effects
Model 1 Model 2 Model 3 Model 4 Model 5 Model 6
All SharesAFTER (λ) 0.070*** −2.047** 0.170*** −5.111***
(3.25) (−2.21) (5.53) (−4.28)AFTER×ln(VOLUME BOVESPA) (γ) 0.003*** 0.104** 0.009*** 0.260***
(3.29) (2.28) (5.64) (4.42)Effect at average ln(VOLUME BOVESPA) 0.061 0.063 0.183 0.164
Only Non-Voting SharesAFTER (λ) 0.074*** −1.170 0.178*** −5.328***
(3.08) (−1.02) (5.19) (−3.66)AFTER×ln(VOLUME BOVESPA) (γ) 0.004*** 0.062 0.009*** 0.272***
(3.10) (1.08) (5.28) (3.78)Effect at average ln(VOLUME BOVESPA) 0.081 0.088 0.183 0.191
Only Voting SharesAFTER (λ) 0.033 −5.644*** 0.108 −6.048***
(0.67) (−3.26) (1.64) (−2.73)AFTER×ln(VOLUME BOVESPA) (γ) 0.002 0.277*** 0.006* 0.301***
(0.76) (3.27) (1.72) (2.78)Effect at average ln(VOLUME BOVESPA) 0.041 −0.024 0.122 0.059
Only Shares of Firms with a Prior NYSE Cross ListingAFTER (λ) 0.154 *** −2.072 0.237*** −2.738
(4.09) (−1.08) (4.56) (−1.21)AFTER×ln(VOLUME BOVESPA) (γ) 0.008*** 0.110 0.012*** 0.147
(4.10) (1.16) (4.59) (1.32)Effect at average ln(VOLUME BOVESPA) 0.162 0.160 0.243 0.245
*, **, and *** indicate statistical significance at the 10% level, the 5% level, and the 1% level, respectively.
it
/f
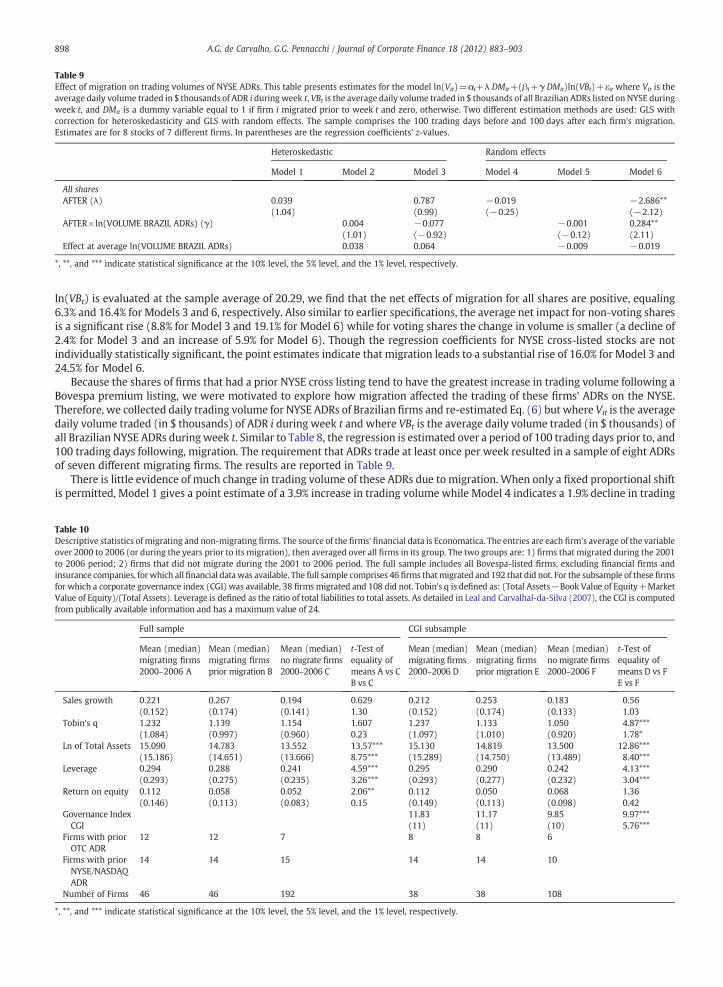
Table 9Effect of migration on trading volumes of NYSE ADRs. This table presents estimates for the model ln(Vit)=αi+λ DMit+(βi+γ DMit)ln(VBt)+εit where Vit is theaverage daily volume traded in $ thousands of ADR i during week t, VBt is the average daily volume traded in $ thousands of all Brazilian ADRs listed on NYSE duringweek t, and DMit is a dummy variable equal to 1 if firm i migrated prior to week t and zero, otherwise. Two different estimation methods are used: GLS withcorrection for heteroskedasticity and GLS with random effects. The sample comprises the 100 trading days before and 100 days after each firm's migrationEstimates are for 8 stocks of 7 different firms. In parentheses are the regression coefficients' z-values.
Heteroskedastic Random effects
Model 1 Model 2 Model 3 Model 4 Model 5 Model 6
All sharesAFTER (λ) 0.039 0.787 −0.019 −2.686**
(1.04) (0.99) (−0.25) (−2.12)AFTER×ln(VOLUME BRAZIL ADRs) (γ) 0.004 −0.077 −0.001 0.284**
(1.01) (−0.92) (−0.12) (2.11)Effect at average ln(VOLUME BRAZIL ADRs) 0.038 0.064 −0.009 −0.019
*, **, and *** indicate statistical significance at the 10% level, the 5% level, and the 1% level, respectively.
Table 10Descriptive statistics of migrating and non-migrating firms. The source of the firms' financial data is Economatica. The entries are each firm's average of the variableover 2000 to 2006 (or during the years prior to its migration), then averaged over all firms in its group. The two groups are: 1) firms that migrated during the 2001to 2006 period; 2) firms that did not migrate during the 2001 to 2006 period. The full sample includes all Bovespa-listed firms, excluding financial firms andinsurance companies, forwhich allfinancial datawas available. The full sample comprises 46 firms thatmigrated and 192 that did not. For the subsample of these firmsfor which a corporate governance index (CGI) was available, 38 firms migrated and 108 did not. Tobin's q is defined as: (Total Assets−Book Value of Equity+MarkeValue of Equity)/(Total Assets). Leverage is defined as the ratio of total liabilities to total assets. As detailed in Leal and Carvalhal-da-Silva (2007), the CGI is computedfrom publically available information and has a maximum value of 24.
Full sample CGI subsample
Mean (median)migrating firms2000–2006 A
Mean (median)migrating firmsprior migration B
Mean (median)no migrate firms2000–2006 C
t-Test ofequality ofmeans A vs CB vs C
Mean (median)migrating firms2000–2006 D
Mean (median)migrating firmsprior migration E
Mean (median)no migrate firms2000–2006 F
t-Test ofequality ofmeans D vs FE vs F
Sales growth 0.221 0.267 0.194 0.629 0.212 0.253 0.183 0.56(0.152) (0.174) (0.141) 1.30 (0.152) (0.174) (0.133) 1.03
Tobin's q 1.232 1.139 1.154 1.607 1.237 1.133 1.050 4.87***(1.084) (0.997) (0.960) 0.23 (1.097) (1.010) (0.920) 1.78*
Ln of Total Assets 15.090 14.783 13.552 13.57*** 15.130 14.819 13.500 12.86***(15.186) (14.651) (13.666) 8.75*** (15.289) (14.750) (13.489) 8.40***
Leverage 0.294 0.288 0.241 4.59*** 0.295 0.290 0.242 4.13***(0.293) (0.275) (0.235) 3.26*** (0.293) (0.277) (0.232) 3.04***
Return on equity 0.112 0.058 0.052 2.06** 0.112 0.050 0.068 1.36(0.146) (0.113) (0.083) 0.15 (0.149) (0.113) (0.098) 0.42
Governance IndexCGI
11.83 11.17 9.85 9.97***(11) (11) (10) 5.76***
Firms with priorOTC ADR
12 12 7 8 8 6
Firms with priorNYSE/NASDAQADR
14 14 15 14 14 10
Number of Firms 46 46 192 38 38 108
*, **, and *** indicate statistical significance at the 10% level, the 5% level, and the 1% level, respectively.
898 A.G. de Carvalho, G.G. Pennacchi / Journal of Corporate Finance 18 (2012) 883–903
.
ln(VBt) is evaluated at the sample average of 20.29, we find that the net effects of migration for all shares are positive, equaling6.3% and 16.4% for Models 3 and 6, respectively. Also similar to earlier specifications, the average net impact for non-voting sharesis a significant rise (8.8% for Model 3 and 19.1% for Model 6) while for voting shares the change in volume is smaller (a decline of2.4% for Model 3 and an increase of 5.9% for Model 6). Though the regression coefficients for NYSE cross-listed stocks are notindividually statistically significant, the point estimates indicate that migration leads to a substantial rise of 16.0% for Model 3 and24.5% for Model 6.
Because the shares of firms that had a prior NYSE cross listing tend to have the greatest increase in trading volume following aBovespa premium listing, we were motivated to explore how migration affected the trading of these firms' ADRs on the NYSE.Therefore, we collected daily trading volume for NYSE ADRs of Brazilian firms and re-estimated Eq. (6) but where Vit is the averagedaily volume traded (in $ thousands) of ADR i during week t and where VBt is the average daily volume traded (in $ thousands) ofall Brazilian NYSE ADRs during week t. Similar to Table 8, the regression is estimated over a period of 100 trading days prior to, and100 trading days following, migration. The requirement that ADRs trade at least once per week resulted in a sample of eight ADRsof seven different migrating firms. The results are reported in Table 9.
There is little evidence of much change in trading volume of these ADRs due to migration. When only a fixed proportional shiftis permitted, Model 1 gives a point estimate of a 3.9% increase in trading volume while Model 4 indicates a 1.9% decline in trading
t

30 On a related issue, there is mixed evidence as to whether a firm's domestic market trading increases or declines following a foreign cross-listing. For a reviewand empirical tests, see Halling et al. (2008).31 Morck et al. (2000) and Jin and Myers (2006) show that improved liquidity due to better information disclosure and corporate governance should make thefirm's share price better reflects its firm-specific risk. Thus, there should be a rise in the share return's idiosyncratic (firm-specific) risk relative to its systematirisk or “beta” (covariance with market returns). In unreported tests similar to those of Ferreira and Laux (2007), we examined migrating firms' share variancebeta, and relative idiosyncratic risk (equal to the market model regression R2 ratio [1−R2]/R2) for the 100 trading days prior to each firm's migration. We thencompared these statistics to those computed for the 100 trading days following migration. The average of the migrating firms' share variances and share betafell, while their average relative idiosyncratic risks rose. While the changes in these statistics following migration are consistent with theory, none of the changein these averages were statistically significant.
Table 11Characteristics predicting firms' decisions to migrate. The table reports estimates of a Cox proportional hazard model h(t)=h0(t)exp(β′Xt) where the hazard rateh(t), is the probability of migrating during year t conditional on a vector of firm characteristics observable at the start of year t, Xt. h0(t) is the date t baseline hazardfunction and β is a vector of coefficients. The table reports the estimated hazard ratios exp(β1), exp(β2),…for the firm characteristics, and robust z-statistics basedon errors that cluster on each firm are given in parentheses. The full sample includes observations from 2000 to 2006 on 238 firms, 46 of whichmigrated and 192 owhich did not. The CGI Subsample is a subset of 146 firms, 38 of which migrated and 108 of which did not. Firms' financial data is from Economatica. Tobin's q idefined as: (Total Assets−Book Value of Equity+Market Value of Equity)/(Total Assets) and Leverage is defined as the ratio of Total Liabilities to Total Assets. Thecorporate governance index (CGI), from Leal and Carvalhal-da-Silva (2007), is computed from publically available information and has a maximum value of 24The regressions include dummy variables that control for the following industries: Agriculture and Fisheries, Chemical, Construction, Electric and ElectronicElectric Power, Food and Beverage, Industrial Machinery, Mining, Nonmetallic Mining, Oil and Gas, Pulp and Paper, Software and Data, Telecommunication, TextileTrade, Transportation Service, Vehicle and Parts, and Other. Estimates in columns two and four use observations on firm financial characteristics that arewinsorized at the first and 99th percentiles.
Hazard ratios
Full sample Full sample winsorized CGI subsample CGI subsample winsorized
Sales Growth 1.145** 1.762** 1.101 2.241***(2.08) (2.52) (1.47) (2.82)
Tobin's q 1.284* 1.451* 1.455 1.625*(1.68) (1.91) (1.27) (1.65)
Log of Total Assets 1.565*** 1.559*** 1.414*** 1.506***(4.24) (4.40) (3.03) (3.51)
Leverage 1.002 1.154 0.940 0.459(0.23) (0.14) (−0.06) (−0.66)
Return on Equity 0.754** 0.705 0.768** 0.539*(−2.28) (−1.09) (−2.43) (−1.79)
OTC ADR 2.924*** 2.770*** 1.901 1.741(2.78) (2.67) (1.41) (1.10)
NYSE/NASDAQ ADR 1.884 1.922* 1.528 2.060(1.58) (1.67) (0.95) (1.61)
Governance Index 1.082 0.983(1.41) (−0.20)
Industry Dummies Yes Yes Yes YesFinancial Variables Winsorized at 1% Tails No Yes No YesNumber of Observations/Firms 1048 1048 760 760
238 238 146 146Log-Likelihood −196.36 −195.51 −152.12 −138.88
*, **, and *** indicate statistical significance at the 10% level, the 5% level, and the 1% level, respectively.
899A.G. de Carvalho, G.G. Pennacchi / Journal of Corporate Finance 18 (2012) 883–903
,
fs
.,,
volume. However, neither of these coefficients is significantly different from zero. Models 2, 3, and 5 also produce small andstatistically insignificant changes in trading volume. OnlyModel 6's coefficients are statistically significant.When its proportional shiftof λ+γln(VBt) is evaluated at ln(VBt)=9.39, which is the average log daily volume traded (in $ thousands) of all Brazilian NYSEADRsduring our sample period, it implies a decline in trading volume of 1.9%. Hence, there appears to be little or no decline in trading of afirm's ADRs following migration. Apparently, a commitment to improve corporate behavior can raise the total trading volume for afirm's shares, with the greatest increase in its domestic market and without a material decline in its foreign market.30
In conclusion, our estimates indicate that shares' trading volumes on Bovespa increased following their premium listings,especially for non-voting shares. This supports the view that a commitment to improved disclosure benefits lesser-informed, non-voting shareholders the most. These minority investors became less likely to suffer trading losses from insiders. In addition, wefind that increases in trading volumes are particularly large for shares of firms that were previously cross-listed on the NYSE,providing evidence that exchanges' listing standards may be complementary in terms of their disclosure. Together, these resultsare evidence that Bovespa was successful in establishing premium listings to recoup losses in trading volume, though its successwas not at the expense of the NYSE. The higher disclosure and governance standards of a premium listing appears to be a netbenefit to investors by raising overall liquidity.31
5.4. Characteristics of migrating firms
We now investigate whether particular characteristics can identify firms that tend to choose premium listings. As discussedearlier, theory predicts that if firms have substantial growth opportunities that require external funding, their controlling
c,
ss

900 A.G. de Carvalho, G.G. Pennacchi / Journal of Corporate Finance 18 (2012) 883–903
shareholders are more likely to forego expropriation of minority investors in order to lower their firms' funding costs. A way tocommit to this behavior is to migrate to a premium listing.
Table 10 compares descriptive statistics of migrating and non-migrating firms. Columns A, B, and C cover the full sample of 238Bovespa-listed firms while Columns D, E, and F cover the 146-firm subset for which the CGI (corporate governance index) was alsoavailable. For both samples, themeans andmedians of each of the financial variables are calculated formigrating firms (Columns Aand D) and non-migrating firms (Columns C and F) during the 2000–2006 period. In addition, the means and medians of thevariables are calculated for migrating firms during only the years prior to their migration (Columns B and E).
Tests of the equality ofmeans show thatmigrating firms had significantly greater total assets and leverage relative to non-migratingfirms. For the full sample of firms, those that migrated had a significantly higher return on equity over the entire 2000–2006 periodcompared to non-migrating firms, but there were no significant return on equity differences during the years prior to their migrations.For the CGI subset of firms, migrating firms had significantly higher Tobin's q and a higher CGI than did non-migrating firms.
Table 11 presents the results of multivariate analysis using Cox proportional hazard model regressions. These regressions arerun for the full sample of firms (columns one and two) as well as for the subsample for which the CGI index is available (columnsthree and four). The table reports each explanatory variable's hazard ratio estimate, exp(β1), exp(β2), …, so that a point estimate
Table 12Bovespa seasoned equity offerings. Market indicates the firm's listing at the time of the offering. Initial returns are computed with respect to the distribution priceand first closing price after the distribution.
Date Firm/Stock Market Total Issued (R$ mil.) ADR Issued (R$ mil.) Foreign Investors (%)
6/01 Petrobahia Traditional 7 – n.a.9/01 Mehir Holding Traditional 2 – n.a.7/01 Petrobras Traditional 2014 1629 n.a.12/01 Nova Marlin Traditional 129 – n.a.11/01 CBLC Traditional 243 – n.a.3/02 CVRD Traditional 4522 2552 n.a.5/02 Sabesp NM 527 157 n.a.8/02 NET/Globocabo Level l 597 – n.a.9/02 Marcopolo Level 2 95 – n.a.2/03 Rossi Residencial Level 1 80 – n.a.4/03 CSN Traditional 414 – n.a.7/03 Coteminas Traditional 111 – n.a.9/03 Unibanco Level 1 637 446 n.a.12/03 Votorantin Celulose Level 1 745 447 n.a.12/03 Suzano Traditional 443 – n.a.5/04 CCR NM 375 – n.a.9/04 Weg Level 1 319 – n.a.9/04 Braskem Level 1 1211 807 n.a.9/04 Sabesp NM 688 501 n.a.12/04 Gerdau Level 1 413 – n.a.12/04 Gerdau Met. Level 1 88 – n.a.12/04 Bradespar Level 1 1045 – n.a.12/04 Suzano Pet. Level 2 179 – n.a.1/05 Unibanco Level 1 718 – 56.73/05 ALL Level 2 645 – 80.04/05 Ultrapar Traditional 362 137 74.84/05 Gol Level 2 594 451 79.26/05 AES Tietê Traditional 1060 – 80.27/05 Lojas Renner NM 886 – 86.39/05 Unibanco Level 1 1765 1310 80.59/05 Bradespar Level 1 505 – 67.19/05 Cyrela NM 902 566 72.212/05 Tractebel NM 1052 – 55.12/06 Iochpe-Maxion Level 1 340 – 47.33/06 Rossi Residencial NM 1013 – 80.33/06 TAM Level 2 1559 510 79.93/06 Dasa NM 662 – 84.94/06 Duratex Level 609 – 46.44/06 Submarino NM 929 – 89.94/06 Localiza NM 394 – 73.64/06 Saraiva Level 2 183 – 85.84/06 Randon Level 1 235 – 57.56/06 Porto Seguro NM 201 – 53.86/06 Banco do Brasil NM 2273 – 50.97/06 Cesp Level 1 3200 – 30.47/06 Cyrela NM 838 – 75.59/06 Eletropaulo Level 2 1345 4 59.810/06 Perdigão NM 800 64 43.2
Source: Bovespa.

901A.G. de Carvalho, G.G. Pennacchi / Journal of Corporate Finance 18 (2012) 883–903
greater (less) than unity indicates a greater (lesser) likelihood of migration due to an increase in the variable relative to thebaseline hazard, h0(t). In parentheses are z-statistics based on errors that cluster on each firm. The regressions control for industrydifferences, and to examine the effect of extreme outliers that might arise from reporting errors, the regressions are run with andwithout winsorizing the financial variables at the 1% upper and lower tails of the observations.
For the full sample of firms (columns one and two of Table 11), consistent with theorywe find that the prior year's sales growthand Tobin's q predict the decision to migrate at the 5% and 10% confidence levels, respectively. Firm size (log of total assets) is alsohighly significant. A possible explanation for this size effect is that smaller firms may tend to rely on bank loan financing due tohigh fixed costs of issuing public securities. Consistent with Harvey et al. (2004), a smaller firm might reduce its cost of externalfinance by submitting to loan covenants enforced by bank monitoring, obviating the need to protect minority shareholders via apremium listing.
There is some evidence (only when variables are not winsorized) that firms with a lower return on equity are more likely tomigrate. Perhaps a low return on equity proxies for a lack of internal funds, thereby necessitating greater external funding ofgrowth opportunities. Firms that previously had OTC ADRs, and to a lesser extent those having NYSE/NASDAQ ADRs, are also morelikely to seek a premium listing. Having an OTC ADRmight indicate that a firm desires external financing but is unwilling to pay thehigher costs of an exchange listing. A premium listing could be a more cost-effective way of bonding the firm to better protectminority shareholders.
The qualitative results are similar for the subsample of firms for which the CGI is available. Sales growth and Tobin's q continueto predict a greater tendency tomigrate, though onlywhen variables arewinsorized. Greater firm size and a lower return on equityalso increase the likelihood of a premium listing. Interestingly, the CGI is not a significant predictor of migration, and its inclusiondecreases the significance of a firm having an ADR. This may be due to colinearity since one of the CGI questions asks if the firmuses U.S. or IAS GAAP accounting. Overall, these regression results are consistent with the hypothesis that reducing the externalcost of funding growth opportunities can motivate a firm's premium listing.
If, indeed, the motive for a premium listing was to reduce financing costs in order to take advantage of growth opportunities,we should expect that premium-listed firms would be more likely to have seasoned equity offerings (SEOs). Table 12 providesinformal, but striking evidence that firms choose premium listings in order to reduce the costs of subsequent SEOs. Of the 48 SEOssince the opening of Bovespa's premium segments in June of 2001, 37 of them (77%) were by firms having a prior premium listing.Twenty-nine of the 37 were issues of firms that migrated to a premium segment while the other eight were of firms thatestablished premium listings at their IPOs. As of year-end 2006, there were approximately 350 total companies with a Bovespaexchange listing and only 86 of them (25%) had a premium listing. If we consider the 87 relatively large firms who were inBovespa's IBX index at the end of 2006, 55 of them (63%) had a premium listing, which is still less than the 77% of SEOs bypremium-listed firms over the entire sample period. Hence, relative to a firm with a traditional Bovespa listing, a premium-listedfirm was more likely to issue seasoned equity.
6. Conclusions
Prior research has highlighted the roles that good corporate governance and disclosure play in the development of capitalmarkets. However, in many countries reforms of corporate law aimed at protecting minority investors often face serious politicalopposition. In this environment, private contractual arrangements in the form of premium stock exchange listings show promiseas mechanisms for pledging better corporate behavior. Our evidence suggests that a Bovespa premium listing is a credible bondingmechanism that Brazilian firms can use to reduce their cost of funding growth opportunities.
By allowing previously-listed corporations to choose a premium listing, the creation of Bovespa's premium segments providesa setting to analyze the pure effects of adopting improved corporate governance and disclosure. In this study, we found that afirm's shares tend to earn a positive abnormal return when it chooses a premium listing, especially if the listing requires improvedgovernance standards in addition to greater transparency. In addition, a firm's increase in share value from a premium listing istypically greater if its shares had not previously been cross-listed on a U.S. exchange. Migration also tends to reduce the premiumbetween a firm's voting and non-voting shares. Moreover, choosing a premium enhances trading volume for non-voting shares,consistent with the notion that improved disclosure creates liquidity. These results are important because they provide evidencethat the private creation of premium listings can be successful in improving investor welfare and encouraging greater capitalmarket development.
By making an alternative bonding mechanism available to Brazilian firms, Bovespa's premium listings might be a partialexplanation for why foreign cross-listings on U.S. exchanges are in decline (Doidge et al., 2009). Listing on a Bovespa premiumsegment leads to an increase in shareholder value that is similar to cross listing on a U.S. exchange. Bovespa's innovation supportsthe view that competition among the world's stock exchanges can lead to higher overall standards of corporate behavior.
Acknowledgments
The authors thank Nelson F. Souza Sobrinho, Priscilla M. Flori, Solange Kileber, Chang Joo Lee, and Rodrigo Tolentino for theirexcellent research assistance. We are grateful for valuable comments by Murillo Campello, Karl Lins, JohnMcConnell, Jeffry Netter,Andrei Simonov, Michael Weisbach, an anonymous referee, seminar participants at the Federal Reserve Bank of Atlanta,Georgetown University, the International Monetary Fund, KAIST, the Pontifical Catholic University of Rio de Janeiro, the Universityof Illinois, and the University of Utah, and session participants at the 2009 Financial Intermediation Research Society Conference.

902 A.G. de Carvalho, G.G. Pennacchi / Journal of Corporate Finance 18 (2012) 883–903
Appendix. Rules for admission to BOVESPA's premium listings
BOVESPA lays down a series of standards for the conduct of companies, managers and controlling shareholders considered asimportant for valuation of shares and other assets issued by the company. The adherence to these practices distinguishes acompany as either a Level 1 (Nível 1) Company, a Level 2 (Nível 2) Company, or a Novo Mercado company, depending on thedegree of commitment assumed by the company.
All these rules are consolidated in the Listing Regulations, the adherence to which is voluntary. The commitment entered intoby the company, its controlling shareholders and its management are signed via a contract to which these entities and BOVESPAare parties.
Level 1
Level 1 companies largely undertake to improve methods of disclosure to the market and to disperse their shares among thelargest number of shareholders possible. Thus, the principal practices required of a Level 1 company are:
• maintenance of a free-float of at least 25% of capital;• holding of public offerings for placing shares through mechanisms that favor capital dispersion to a broader spectrum ofshareholders;
• improved disclosure of quarterly information including the obligation of reporting consolidated figures and special auditrevision;
• adherence to the disclosure rules for transactions involving assets issued by the company on the part of the controllingshareholders or company management;
• disclosure of shareholder agreements and stock option programs;• provision of an annual calendar of corporate events.
Level 2
To be classified as a Level 2 company, in addition to the obligations of Level 1, the company and its controlling shareholdersmust adopt and observe amuch broader range of corporate governance practices andminority shareholder rights. In summary, thecriteria for listing as a Level 2 company are:
• a term of two years or less for the entire Board of Directors without staggered elections;• the annual balance sheet to be made available in accordance with US GAAP or IAS;• granting to all holders of common shares the same conditions obtained by the controlling shareholders on the transfer of thecontrol of the company and 80% of these conditions for preferred shareholders (partial tag along);
• voting rights granted to preferred shares in certain circumstances such as transformation, incorporation, spin-off and merger ofthe company and approval of contracts between the company and other companies of the same group;
• obligation to hold a tender offer by the economic value criteria should the capital be closed or registration as a Level 2 companybe canceled;
• adherence to the Market Arbitration Panel as the vehicle to resolve corporate disputes.
Novo Mercado
To be listed in the NovoMercado, besides all the obligations established to enter Level 2 the firmmust issue and list only votingshares (common stock).
References
Amihud, Y., Mendelson, H., 1986. Asset pricing and the bid-ask spread. J. Financ. Econ. 17, 223–249.Bebchuk, L., Roe, M., 1999. A theory of path dependence in corporate ownership and governance. Stanford Law Rev. 52, 127–170.Bekaert, G., Harvey, C., Lundblad, C., 2007. Liquidity and expected returns: lessons from emerging markets. Rev. Financ. Stud. 20, 1783–1832.Benos, E., Weisbach, M., 2004. Private benefits and cross-listings in the united states. Emerg. Mark. Rev. 5, 217–240.Bottazzi, L., Da Rin, M., 2002. Europe's ‘new’ stock markets. Innocenzo Gasparini Institute for Economic Research Working Paper.Burghof, H.-P., Hunger, A., 2004. The neuer markt: an (overly) risky asset of Germany's financial system. Adv. Financ. Econ. 10, 295–324.Campbell, J., Lo, A., MacKinlay, A.C., 1997. The Econometrics of Financial Markets. Princeton University Press, Princeton.Claessens, S., Schmukler, S., 2007. International financial integration through equity markets: which firms fromwhich countries go global? J. Int. Money Financ. 26,
788–813.Coffee, J., 1999. The future as history: the prospects for global convergence in corporate governance and its implications. Northwestern University Law Rev. 93,
641–708.Coffee, J., 2002. Racing towards the top? The impact of cross-listings and stock market competition on international corporate governance. Columbia Law Rev. 102,
1757–1831.Doidge, C., 2004. U.S. cross-listings and the private benefits of control: evidence from dual-class firms. J. Financ. Econ 72, 519–553.Doidge, C., Karolyi, A., Stulz, R., 2004. Why are foreign firms that are listed in the U.S. worth more? J. Financ. Econ 71, 205–238.Doidge, C., Karolyi, A., Stulz, R., 2009. Has New York become less competitive than London in global markets? Evaluating foreign listing choices over time. J. Financ.
Econ. 91, 253–287.Dyck, A., Zingales, L., 2004. Private benefits of control: an international comparison. J. Financ. 59, 537–600.

903A.G. de Carvalho, G.G. Pennacchi / Journal of Corporate Finance 18 (2012) 883–903
Ferreira, M., Laux, P., 2007. Corporate governance, idiosyncratic risk, and information flow. J. Financ. 62, 951–989.Gleaser, E., Johnson, S., Shleifer, A., 2001. Coase versus the Coasians. Q. J. Econ. 108, 853–899.Gleason, K., Madura, J., Subrahmanyam, V., 2007. Stock exchange governance initiatives: evidence from the Italian STARs. J. Bank. Financ. 31, 141–159.Halling, M., Pagano, M., Randl, O., Zechner, J., 2008. Where is the market? Evidence from cross-listings in the U.S. Rev. Financ. Stud. 21, 725–761.Harvey, C., Lins, K., Roper, A., 2004. The effect of capital structure when expected agency costs are extreme. J. Financ. Econ. 74, 3–30.Huddart, S., Hughes, J., Brunnermeier, M., 1999. Disclosure requirements and stock exchange listing choice in an international context. J. Acc. Econ. 26, 237–269.Jin, L., Myers, S., 2006. R2 around the world: new theory and new tests. J. Financ. Econ. 79, 257–292.Karolyi, A., 1998. Why do companies list shares abroad? A survey of the evidence and its managerial implications. Financ. Mark. Inst. Instrum. 7, 1–60.Karolyi, A., 2006. The world of cross-listings and cross-listings of the world: challenging conventional wisdom. Rev. Financ. 10, 73–115.La Porta, R., Lopez-de-Silanes, F., Shleifer, A., Vishny, R., 1997. Legal determinants of external finance. J. Financ. 52, 1131–1150.La Porta, R., Lopez-de-Silanes, F., Shleifer, A., 2006. What works in securities laws? J. Financ. 61, 1–32.Leal, R., Carvalhal-da-Silva, A., 2007. Corporate governance and value in Brazil (and Chile). In: Chong, A., López-de-Silanes, F. (Eds.), Investor Protection and
Corporate Governance: Firm Level Evidence across Latin America. Stanford University Press, pp. 213–287.Lel, U., Miller, D., 2008. International cross-listing, firm performance, and top management turnover: a test of the bonding hypothesis. J. Financ. 63, 1897–1937.Leuz, C., 2006. Cross listing, bonding and firms' reporting incentives: a discussion of Lang, Raedy and Wilson. J. Acc. Econ. 42, 285–299.Levine, R., Zervos, S., 1998. Stock markets, banks, and economic growth. Am. Econ. Rev. 88, 537–558.Licht, A., 2003. Cross-listing and corporate governance: bonding or avoiding. Chicago J. Int. Law 4, 122–141.Macey, J.R., O'Hara, M., 2002. The economics of stock exchange listing fees and listing requirements. J. Financ. Intermed. 11, 297–319.Miller, D.P., 1999. The market reaction to international cross-listings: evidence from depository receipts. J. Financ. Econ. 51, 103–123.Morck, R., Yeung, B., Yu, W., 2000. The information content of stock markets: why do emerging markets have synchronous stock price movements? J. Financ. Econ.
58, 215–260.Nenova, T., 2003. The value of corporate voting rights and control: a cross-country analysis. J. Financ. Econ. 68, 325–351.Nenova, T., 2005. Control values and changes in corporate law in Brazil. Latin Am. Bus. Rev. 6 (3), 1–37.Östberg, P., 2006. Disclosure, investment and regulation. J. Financ. Intermed. 15, 285–306.Pagano, M., Röell, A., Zechner, J., 2002. The geography of equity listing: why do companies list abroad? J. Financ. 52, 2651–2694.Reese, W.A., Weisbach, M., 2002. Protection of minority shareholder interests, cross-listings in the united states, and subsequent equity offerings. J. Financ. Econ. 6,
65–104.Ribstein, L., 2005. Cross-listing and regulatory competition. Rev. Law Econ. 1, 97–148.Shleifer, A., Wolfenzon, D., 2002. Investor protection and equity markets. J. Financ. Econ. 66, 3–27.Siegel, J., 2005. Can foreign firms bond themselves effectively by submitting to U.S. law? J. Financ. Econ. 75 (2), 319–360.Stulz, R., 1999. Globalization of equity markets and the cost of capital. J. Appl. Corp. Financ. 12, 8–25.Tkac, P., 1999. A trading volume benchmark: theory and evidence. J. Financ. Quant. Anal. 34, 89–114.Wurgler, J., 2000. Financial markets and the allocation of capital. J. Financ. Econ. 58, 187–214.