journal of economics and finance education · on foreign exchange (forex or fx) markets. it can be...
TRANSCRIPT

JOURNAL OF
ECONOMICS
and FINANCE
EDUCATION
editor
E. F. StephensonMANAGING EDITOR

Editorial Staff Editor:
E. Frank Stephenson, Berry College
Co-Editor (Finance):
Bill Z. Yang, Georgia Southern University
Senior Editors:
Richard J. Cebula, Jacksonville University
Joshua Hall, West Virginia University
Luther Lawson, University of North Carolina-
Wilmington
Board of Editors (Economics):
Steven Caudill, Rhodes College
Joy Clark, Auburn University at Montgomery
David Colander, Middlebury College
Stephen Conroy, University of San Diego
Mike Daniels, Columbia State University
Paul Grimes, Pittsburg State University
John Marcis, Coastal Carolina University
Kim Marie McGoldrick, University of Richmond
Franklin Mixon, Jr., Columbus State University
J. Wilson Mixon, Jr., Berry College
Usha Nair-Reichert, Georgia Tech
Inder Nijhawan, Fayetteville State University
Carol Dole, Jacksonville University
James Payne, University of Texas at El Paso
Christopher Coombs, LSU - Shreveport
Jason Beck, Armstrong Atlantic State University
Board of Editors (Finance):
Robert Boylan, Jacksonville University
Kam (Johnny) Chan, Western Kentucky University
S. J. Chang, Illinois State University
Edward Graham, University of North Carolina at
Wilmington
John Griffin, Old Dominion University
Srinivas Nippani, Texas A&M University - Commerce
Mario Reyes, University of Idaho
William H. Sackley, University of North Carolina at
Wilmington
Barry Wilbratte, University of St. Thomas
Bob Houmes, Jacksonville University
Shankar Gargh, Holkar Science College, India
Christi Wann, Tennessee-Chattanooga
Shelton Weeks, Florida Gulf Coast University
Production Editor:
Doug Berg, Sam Houston State University
Volume 18 SUMMER 2019 Number 1
<1> Teaching Double-Dip Recession in Macroeconomics Ben L. Kyer and Gary E. Maggs
<6> Considerations for the Organization of the Introductory Financial
Derivatives Course
Robert B. Burney
<18> The View from 30,000 Feet: Using Paper Airplanes to
Understand Economic Modeling
Wayne Geerling, G. Dirk Mateer, and Brian O’Roark
<25> The Second-Generation Theory of Fiscal Federalism: A
Research Lesson from the Classroom
Giampaolo Garzarelli
<34> Adam Ruins Everything, Except Economics
Jadrian Wooten and James Tierney
<54> Financial Analysis of the Beer Logistics and Transportation
Industry: A Unique Interdisciplinary Finance Travel Course
Jocelyn Evans, Kent Gourdin, and Alan Shao
<67> Does Order Matter? Micro- and Macroeconomics Principles
Courses at an Access Institution
Jason J. Delaney, William B. Holmes, P. Wesley Routon, J.
Taylor Smith, Andrew V. Stephenson, and Amanda L. Wilsker
<81> The Power of Interest: Connecting the Real World to the
Finance Classroom
Alma D. Hales, Laura Cruz, and Jacob Kelley
Academy of Economics and Finance

JOURNAL OF ECONOMICS AND FINANCE EDUCATION ∙ Volume 18 ∙ Number 1 ∙ Summer 2019
1
Teaching Double-Dip Recession in
Macroeconomics
Ben L. Kyer and Gary E. Maggs1
ABSTRACT
This paper modifies the customary pedagogical approach to the business
cycle found in many macroeconomics textbooks. A logical definition of
double-dip recession, a relatively neglected yet potentially important
concept, is offered. The proposed definition is then applied to real gross
domestic product data for the United States from the Bureau of
Economic Analysis. It is confirmed that the United States has
experienced ten recessions from 1947 to the present and that three of
those may be classified via our approach as double-dip recessions. We
also suggest here the useful corollaries of multi-dip recessions and
deepened trough recessions.
Introduction
A neglected concept in macroeconomics pedagogy is double-dip recession. Indeed, this idea is mentioned
but not defined in just two of more than a dozen macroeconomic textbooks surveyed at both the principles
and intermediate levels (Dornbusch et al. 2011, p. 275; Krugman and Wells 2017, p. 463). Moreover, the
documentation of or empirical evidence on double-dip recession is, to our knowledge, absent with respect to
the teaching of macroeconomics.2 There are, however, numerous, vague, and inconsistent definitions of double-dip recession within the
non-academic, financial, and popular presses. For example, the Financial Times defines a double-dip
recession as occurring “when an economy goes into recession twice without having undergone a full recovery
in between.” The Oxford English Dictionary states that a double-dip recession is “a recession during which
a period of economic decline is followed by a brief period (usually one or two quarters) of growth, followed
by a further period of decline.” According to BusinessDictionary.com, a double-dip recession is “a second
recession following a brief period of growth. A double-dip recession must come after an initial period of
general economic decline. Essentially, the country’s GDP slides from negative to positive and eventually
back to negative.” Investopedia declares that “a double-dip recession is when gross domestic product (GDP)
growth slides back to negative after a quarter or two of positive growth. A double-dip recession refers to a
recession followed by a short-lived recovery, followed by another recession.” Finally, Wikipedia states, “In
a W-shaped recession, (also known as a double-dip recession), the economy falls into recession, recovers
with a short period of growth, then falls back into recession before finally recovering, giving a ‘down up
down up’ pattern resembling the letter W.”3 From these citations, it appears that at least the non-academic
world is interested in the phenomenon of double-dip recession.
The purpose of this paper is twofold. First, we extend the standard classroom approach to the business
cycle and propose a rather more specific and empirically useful definition of double-dip recession. Second,
we apply this definition to quarterly data on real GDP provided by the Bureau of Economic Analysis (BEA)
1 The authors are, respectively, the Benjamin Wall Ingram, III Professor of Economics, Francis Marion University, Florence, SC, and Professor of Economics, St. John Fisher College, Rochester, NY. We thank two anonymous referees for helpful suggestions
and guidance. Any remaining errors are our own. Corresponding author email: [email protected].
2 This is probably because academic investigations to document the occurrence of double-dip recessions in the United States are
rare. Indeed, the only paper we found along those lines is that by Elwell (2011).
3 These definitions of double-dip recession come from www.ft.com, www.oed.com, www.businessdictionary.com,
www.investopedia.com, and www.wikipedia.com (“recession shapes”), respectively.

JOURNAL OF ECONOMICS AND FINANCE EDUCATION ∙ Volume 18 ∙ Number 1 ∙ Summer 2019
2
from 1947 to the present in order to chronicle the existence of double-dip recession in the United States.4
The Analysis
The usual pedagogical treatment of the business cycle5 identifies and distinguishes between the four
stages of expansion, peak, recession, and trough, with the peak and trough sometimes referred to as turning
points in the cycle and the term ‘recession’ frequently referred to as a ‘contraction.’ We modify this common
approach in order to arrive at a logical and uniform definition of double-dip recession which is both suitable
for use in macroeconomics classrooms and applicable to real world data.
To begin, we adopt the historical academic definition of a recession as a circumstance when real GDP
decreases for at least two consecutive quarters.6 Second, we make the distinction for our students between
“recovery” and “expansion,” with the former being an increase of real GDP from the trough to the previous
peak level of real output and the latter being an increase of real GDP beyond the previous peak level. Third,
we refer to this previous peak level of real GDP as the “reversion point,” or that point at which the economy
has fully recovered from the recession and beyond which it reverts to net growth in aggregate real output.
Fourth, we define a double-dip recession as a situation in which another decrease in real GDP takes place
after the trough of an economic cycle but prior to its reversion point. In other words, and as the name itself
suggests, a double-dip recession occurs when real GDP decreases for a second time and the economy returns
to a recessionary condition prior to completely recovering from an initial two quarter or more decline of real
GDP.
To demonstrate the aforementioned discussion and definitions, we draw Figure 1, in which a double-dip
recession takes place from point A to point A’, with point A’ being the reversion point. The first dip or decline
of real GDP is illustrated by the movement from point A to point B and the second dip is shown by the
movement from point C to point D. At this juncture in the classroom discussion, we inform our students that
a direct application of this suggested methodology to real GDP data for the United States reveals that ten
recessions have occurred since 1947, with the three occurring shortly after World War II, in the early 1980s,
and in the Great Recession of 2008 qualifying as double-dip recessions.
Figure 1: Double-Dip Recession
4 Quarterly data on real GDP is available from the BEA beginning only in 1947. See www.bea.gov. 5 We note for our classes here that we prefer the broader and more inclusive term “economic cycle,” which we use through the
remainder of our macroeconomics courses. 6 We contrast for our students this “academic” definition of a recession with that employed by the NBER, that a recession is “…a
significant decline in economic activity spread across the economy, lasting more than a few months, normally visible in real GDP, real income, employment, industrial production, and wholesale-retail sales.” See “Business Cycle Dates,” under “Data” on the
NBER website www.nber.org/cycles/cyclesmain.
Time

JOURNAL OF ECONOMICS AND FINANCE EDUCATION ∙ Volume 18 ∙ Number 1 ∙ Summer 2019
3
The first double-dip recession in the United States dates to the late 1940s as real GDP reached a peak of
about $2.04 trillion in the fourth quarter of 1948.7 As shown in Figure 2, real output then decreased for two
quarters and attained its trough during the second quarter of 1949. Therefore, this decline of real GDP is the
first dip of this particular recession. Although real GDP then increased during the third quarter of 1949, it
fell short of the previous peak or reversion point by approximately twelve billion dollars after which it
experienced a second decline during the final quarter of 1949--the second dip of this double-dip recession.
We note that the reversion point was exceeded during the first quarter of 1950, and then real GDP increased
continuously until the next recession in the 1953-1954 timespan.
Figure 2: Double-Dip Recession, United States, 1948-1950
Many economists, both academic and business, characterize the behavior of the US economy during the
early 1980s as evidence of a double-dip recession. In their text, Krugman and Wells (2017, p. 463) allude to
“the double-dip recession of 1979-1982.” Similarly, Investopedia also characterizes the early 1980s as an
episode of double-dip recession, noting that the economy shrank in the first half of 1980, experienced a period
of growth in late 1980 and early 1981, and then slipping back into a recession from July 1981 to November
1982.8
We believe that defining or considering the entire time period of the early 1980s as a double-dip recession
is misguided and confusing. Following our suggested approach, it is clear the United States endured two
separate recessions after the first quarter of 1980 through the second quarter of 1983, with only the latter part
of this period constituting a double-dip recession.
Figure 3 illustrates the movement of real GDP in the United States during this time. Following its peak
in the first quarter of 1980, real GDP declined for two consecutive quarters to its trough in the third quarter
of 1980. Because real output increased during the next two quarters and surpassed the reversion point by
more than $100 billion in 1981.1, this episode is a traditional or single-dip recession and not a double-dip
recession as often mischaracterized.
After declining slightly during only the second quarter of 1981, real GDP then peaked again at roughly
$6.7 trillion in the following quarter. Real output then decreased during 1981.4 and 1982.1 by nearly $200
billion. Notably, the increase of real GDP during the second quarter of 1982 fell short of the reversion point
by about $150 billion and decreased again during the third quarter of 1982. Therefore, using our definition,
we characterize this recession as a double-dip recession. Beginning in the fourth quarter of 1982, real GDP
then increased continuously until the onset of the next recession in during 1990.4 and 1991.1.
7 The real GDP numbers were calculated by the BEA with chained 2009 prices. 8 See www.investopedia.com/terms/d/doublediprecession.asp.
1900
1950
2000
2050
2100
2150
2200
1948.3 1948.4 1949.1 1949.2 1949.3 1949.4 1950.1 1950.2
Real GDP (billions)

JOURNAL OF ECONOMICS AND FINANCE EDUCATION ∙ Volume 18 ∙ Number 1 ∙ Summer 2019
4
Figure 3: Single-Dip and Double-Dip Recessions, United States, 1980 - 1983
The Great Recession of 2008 is now discussed in nearly all contemporary macroeconomics textbooks.
While most of the elements and nuances of this event have been well-documented, such as its length, depth,
amplitude, and causes, an overlooked characterization is that it may be viewed as another double-dip
recession. As illustrated in Figure 4, real GDP peaked in the United States during the fourth quarter of 2007
at nearly fifteen trillion dollars. Following a one quarter decrease, real output increased again during the
second quarter of 2008 but to a value below the 2007.4 level. Real GDP then decreased during the next four
quarters and troughed during the second quarter of 2009. This particular decline constitutes the first dip of
the Great Recession. Real GDP then increased during each of the next six quarters, rising to about $14.94
trillion in the fourth quarter of 2010 or about $53 billion less than the previous peak of 2007.4. The second
dip of the Great Recession is seen during the first quarter of 2011 when real GDP declined again, by about
$58 billion. Beginning in the second quarter of 2011, real output increased and surpassed the reversion point
during the third quarter of 2011.
Figure 4: Double-Dip Recession, United States, 2008 - 2011
6200
6300
6400
6500
6600
6700
6800
Real GDP (billions)
13800
14000
14200
14400
14600
14800
15000
15200
15400
Real GDP (billions)
JOURNAL OF ECONOMICS AND FINANCE EDUCATION ∙ Volume 18 ∙ Number 1 ∙ Summer 2019
5
To logically extend this analysis and conclude the classroom discussion, we introduce our students to two
additional ideas. First, having defined double-dip recession, it is also possible for triple-dip and quadruple-
dip recessions to occur. Generalizing, the term “multi-dip recessions” may be used to accurately reference
all other types of recessions. Second, one might also conceive of events such as “deepened trough recessions”
where, for example, the trough of a second or subsequent dip of real GDP is lower or deeper than the initial
trough or first decline in real GDP. Although neither of these has occurred in the United States since 1947,
evidence of both these phenomena exists in other countries (Kyer and Maggs 2019).
Conclusion
We believe that macroeconomics courses could be enriched by extending the standard discussion of
business cycles to include the phenomenon of double-dip (or multi-dip) recession. While a bare bones
discussion of the business cycle is useful and reveals a considerable amount of information in characterizing
an economy, in recent years, the readily available vectors of macroeconomic empirics is well suited to
measure double-dip and more complex aspects nested within the business cycle. The present paper is an
attempt to not only add precision to the dialogue relating to traditional and multi-dip recessions, but also to
encourage follow-up research to investigate international differences with regard to these types of episodes.
Specifically, previous empirical research on this topic by the present authors reveal that the frequency, depth,
and general likelihood of secondary recessionary influences differ considerably between nations. This quite
naturally leads to the question as to why this occurs and what determinants are most relevant in providing an
adequate explanation of these features of recessions for the United States and other countries.
References
Dornbusch, Rudiger, Stanley Fischer, and Richard Startz. 2011. Macroeconomics, 11th ed., McGraw-Hill.
New York.
Elwell, Craig K. 2011. “Double-Dip Recession: Previous Experience and Current Prospect.” Congressional
Research Service Report.
Krugman, Paul, and Robin Wells. 2017. Essentials of Economics, 4th ed. New York: Worth.
Kyer, Ben L., and Gary E. Maggs. 2019. “Some International Evidence on Double-Dip Recession.”
International Advances in Economic Research 25: 347-362.

JOURNAL OF ECONOMICS AND FINANCE EDUCATION ∙ Volume 18 ∙ Number 1 ∙ Summer 2019
6
Considerations for the Organization of the
Introductory Financial Derivatives Course
Robert B. Burney1
ABSTRACT
In this paper, we discuss the two dominant approaches to ordering the
presentation of the material in the introductory financial derivatives
course. We begin by reviewing the basic payoff similarities and practical
differences among the various types of derivative securities. Then a
review of several popular derivative securities textbooks is presented,
demonstrating the two dominant pedagogical approaches. We then
contrast the two dominant approaches and discuss the merits of each.
The paper concludes with recommendations for faculty selecting
between the two approaches.
Overview of the Pedagogical Issue
Derivative securities involve transactions for which the establishment of terms and the actual execution
are displaced in time. This means that the value of the associated contract can change through time dependent
on market conditions. From a fundamental economic perspective, the value of the derivative security depends
simply upon the relationship between the contract price (fixed at the outset) and the spot market price (which
changes through time). However, when one takes into account differences in the operational details for
different types of derivative securities, the basic similarities are shrouded somewhat.
If one considers the “plain vanilla” derivative securities (forward contracts, futures contracts, and options
contracts), the essential differences between the types can be seen as depending on specific additional
features. Relative to forward contracts, for which both parties are obligated to transact, exchange traded
futures contracts are merely a standardized version. Relative to forward contracts and futures contracts,
options contracts have an additional feature which allows the holder to choose not to transact when doing so
would be disadvantageous.
Alternatively, one might consider options contracts to be the most basic of the three because combinations
of options can be used to construct payoffs identical to forward contracts and futures contracts, while the
reverse is not true. From this perspective as well, futures contracts could be seen to be just standardized
forward contracts.
These two perspectives seem to evidence themselves in two distinct organizational approaches used in
various textbooks on the topic offered in the U.S. market. The first starts with forward contracts, then
progresses to futures contracts as simply standardized forward contracts, then progresses to options by
introducing the “right, but not the obligation to transact” dimension of options. This order of presentation
lends itself well to a pedagogical approach stressing the similarities of the payoffs to the three basic
derivatives.
The second approach starts out with options without much more than a mention of futures and forward
contracts. Then, later in the course, futures contracts are introduced. Pedagogically, then, this presentation
has futures as similar to options but with both “the right and the obligation to transact.” Thus futures are
essentially presented as options with fewer features.
It is possible that one of the motivations for the second of these two approaches is that basis risk, the
chance that the relationship between the spot price and futures price may change, causes the futures contracts
payoffs to be non-linear when portrayed graphically as a function of the spot price of the underlying asset.
This situation arises whenever a futures trader closes out the position by taking an equal but opposite position
1 Professor of Finance, Coastal Carolina University, Conway, SC. Email: [email protected].

JOURNAL OF ECONOMICS AND FINANCE EDUCATION ∙ Volume 18 ∙ Number 1 ∙ Summer 2019
7
in the contract – which is much more common than actual delivery.2 Thus, the payoff to the futures contract
is a linear function of the futures price – not the spot price. This detail considerably diminishes the ease with
which one first encountering options contracts and futures contracts can grasp the underlying similarities in
payoffs.
If the literature on student learning styles is incorporated, the relative merits of the two approaches
become yet more difficult to weigh. For, these two approaches can also be seen as suggesting “from the
specific to the general” versus “from the general to the specific” ways of thinking. Past studies of prevalent
personality types of business students and business faculty suggest that the majority of students may naturally
prefer the first of these, while faculty members may naturally prefer the latter.
The issues which arise with respect to the pricing (valuing) of these three different types of derivative
securities will not be addressed in detail in this paper, since the various pedagogical sequencings do not imply
any differences in the pricing process. That is, all of the major textbooks use the same technical approach to
the pricing of the three types of derivative securities, so it is the order of presentation which is at issue.
Review of Basic Derivative Securities
We begin by reviewing the basic payoff similarities and practical differences between forward contracts,
futures contracts, and options contracts. To streamline the terminology, we will alternately refer to these as
forwards, futures, and options in the following discussion.
All of the three basic types of derivative securities contracts which we will discuss have values which are
driven by the price of the asset upon which the contract is written. The contract value relationships are the
same regardless of which “underlying” asset the contract covers. And, in each case, it is the relationship
between the contract price and the spot market price (spot price) which determines the contract holder’s gain
or loss. The various derivative securities pricing models in addition account for the impact of variability in
the price of the underlying asset and the time value of money. However, since our focus in this paper is not
derivative security pricing per se, our consideration of derivative security pricing will be limited.
In considering the “payoffs” to the various derivative securities, it is important to keep in mind that the
contract price is established and fixed at the outset of the contract. The spot price, in contrast, can potentially
vary throughout the life of the contract as market conditions change. Depending on whether the trader has a
long (buying) or short (selling) position relative to the underlying asset, the potential payoff to the contract
will rise and fall as the spot price changes.
The value of a derivatives contract, held by itself, is driven by the relationship between the contract price
and spot price. These generic payoffs are presented in Table 1. It should be noted that the presentation order
in this table follows one of the two alternative presentation orders discussed in the paper.
Table 1: Payoffs and Characteristics of Financial Derivatives Contracts to Buy (S-K) Contracts to Sell (K-S)
Forward Contract to Buy Forward Contract to Sell
Long Futures - Adds Standardization Short Futures - Adds Standardization
Call Option - Adds right to walk away Put Option - Adds right to walk away S = spot price at future transaction date (uncertain)
K = contract price (certain)
In Figure 1, the payoffs for the forward contract positions are presented in graphical format. It should be
noted that the payoffs change in a one-to-one fashion with respect to the spot price of the underlying assets,
so the slopes are +1.0 and -1.0, respectively. At spot prices equal to the contract price, both contract positions
have a payoff of zero. At any spot price different from the contract price, each contract will have a positive
or negative payoff depending on whether the spot price is above or below the contract price.
If a futures contract position were to be held to the contract’s maturity, then the graphs in Figure 1 also
describe the payoffs to long and short futures contract positions. This is because if futures are held to maturity,
the futures contract price will converge to the spot price. However, if the futures contract position is closed
out prior to the contract’s maturity, the issue of “basis” risk arises. We will return to this issue later.
2 The futures price must converge to the spot price as the contract’s maturity approaches. But, for futures contracts the first potential delivery is up to one month prior to contract maturity. Therefore traders not wishing to take or make deliver will typically not remain
in the contract until the maturity date when the futures price converges to the spot price, rendering a basis of zero.

JOURNAL OF ECONOMICS AND FINANCE EDUCATION ∙ Volume 18 ∙ Number 1 ∙ Summer 2019
8
Figure 1: Payoffs to Forward Contract Positions
S = spot price at future transaction date (uncertain)
K = contract price (certain)
Since options contracts also give the holder the right to transact at the contract price, their payoffs are
similar to forward contracts. However, the option holder has the right, but not the obligation, to transact. This
means that an option holder may elect to “walk away” from a potentially losing contract position by choosing
not to exercise the option. Therefore, the option contract payoff will not include the negative payoffs which
the forward contract or futures contract holder must accept as long as he or she remains in the contract.
Figure 2 presents these payoffs in graphical format. In these graphs, the dotted lines indicate the potential
negative payoffs which the option holder will choose not to accept. The resulting payoffs are the so called
“hockey stick” patterns. These are presented in the graph in blue functions.
However, because the option holder has the opportunity to walk away from negative outcomes, the
grantor (writer) of the option receives a payment from the holder. This payment is referred to as the
“premium” and is essentially the cost of the option. The resulting net payoffs are presented in Figure 2 as the
green functions. Strictly speaking, the graphs in Figure 2 suggest a European style option which may only be
exercised at maturity since the horizontal axis is labeled to indicate the spot price at maturity (T=1).3
Considering these payoffs, it is clear how an instructor might choose to begin with forward contracts and
then progress to options contracts. One would begin with the simplest linear function, then explain how the
right for the option holder to choose whether to exercise the option leads to the well-known option payoffs.
Then by explaining the unequal exposure faced by the grantor and the holder of the option, the concept of
the premium could be introduced.
Mathematically, the payoffs to the long and short forward contracts would be (ST-K) and (K-ST). The
payoff to the call and put would be Max[(ST-K),0] and Max[(K-ST),0]. If the premium is considered, the
option payoffs become Max[(ST-K),0]-P and Max[(K-ST),0]-P. So, the exposition using mathematical
functions allows for the same progressive levels of complexity as using the graphical presentation.
This would seem a workable approach. However, if the instructor presents futures contracts between
forward contracts and options, one is still left with how the complication of the normal market practice in the
futures market impacts these basic payoffs.
The conditions concerning delivery set forth in a futures contract’s specification vary considerably from
one underlying asset to the next. Very few contracts specify that delivery must be made or taken on the actual
single maturity date. And, some contracts have a wide delivery window which can be up to the entire month
prior to the contract maturity. In addition, the typical futures contract has a limited number of potentially
inconvenient geographical delivery points.
3 In the derivatives literature it is common to use the notation ST for the spot price at maturity and the notation St for the spot price at any particular time. In a payoff graph for an American style option, the horizontal axis could be labeled with the latter indicating
exercise of the option could occur at any point during its life.
Forward Contract to Buy Forward Contract to Sell
Pay
off
Pay
off
K K ST=1 S
T=1

JOURNAL OF ECONOMICS AND FINANCE EDUCATION ∙ Volume 18 ∙ Number 1 ∙ Summer 2019
9
Figure 2: Payoffs to Options Contract Positions
S = spot price at future transaction date (uncertain) K = contract price (certain)
P = premium
The precise conditions for delivery of the underlying asset in futures contracts means that taking or
making delivery of the underlying asset may be expensive or burdensome. Consequently, the typical hedger
in the futures market would close out the futures position, accept the gain or loss on the futures position, and
then transact in a more geographically workable (physical) spot market. In addition, speculators4 in the
futures market would generally not be expected to wish to take or make delivery if it could be avoided.
When the futures trader closes out his or her position prior to the contract’s maturity, the payoff is no
longer determined by the relationship between the underlying asset’s spot price and the original contract
price, but rather between the futures price at the time the position is opened and the futures price at the time
the position is closed out. If we let F1 be the futures price at the time the futures position is entered into, and
F2 be the futures price at the time the futures position is closed out, the payoff to a long position would be
(F2 - F1) instead of the generic (ST-K) described above. Likewise, the payoff to a short futures position would
be (F1 - F2) instead of the generic (K-ST) described earlier. Figure 3 shows how the graphical presentation of
the payoffs would be modified. (This issue is discussed in more detail in the appendix.)
With respect to using payoff similarities to aid in student understanding, this means that the instructor
must either initially impose strong simplifying assumptions to force clear similarities in both mathematical
function and graphical presentations across all three types of derivatives, or risk student confusion.
Specifically, in order to have the forward and options payoffs shown in Figures 1 and 2 have precisely the
same horizontal axis, the instructor must assume European options are being discussed (so that exercise
would only occur at ST). And, in order for the horizontal axis in the payoff graphs for futures contracts to
conform, the instructor must further assume that the futures contract would be held until maturity (when F1
converges to ST).
For a strictly mathematical function based presentation, this essentially requires assumptions that set
ST=St=F2. Further, full comparability requires the additional assumption that F1=K.5
As mentioned earlier, an alternative pedagogical perspective holds that options should be presented first
since they are the most fundamental building blocks in terms of constructing other positions by holding
multiple contracts. In order to demonstrate this, we must consider the grantor’s (writer’s) position in the
4 Speculators are those market participants who do not need to buy or sell the underlying asset as a business input or output. Rather,
speculators are motivated by a desire for gains from price movements and are not interested in acquiring or disposing of the asset.
5 Without such assumptions we could have a temporal order of K, F1, F2, and ST even if we were not to introduce American style
options.
Call Option Put Option
Pay
off
Pay
off
K K -P -P S
T=1 S
T=1

JOURNAL OF ECONOMICS AND FINANCE EDUCATION ∙ Volume 18 ∙ Number 1 ∙ Summer 2019
10
options described above. Because the grantor must accept the holder’s exercise decision, the grantor’s payoff
is the negative of the holder’s payoff.
Figure 3: Payoffs to Futures Contract Positions
Figure 4 shows the results from holding the combined position of being the grantor of an option while
simultaneously being the holder of another identical option. In both panels the holder’s position is depicted
in blue while the writer’s position is depicted in green. As can be seen from the graphs, the two contracts’
payoffs together create a payoff identical to the related forward contract. That is, one who plays the role of
the grantor in one options contract, and is the holder in another identical options contract, ends up with a net
combined position which has exactly the same payoffs as the associated forward contract. Simultaneously
writing and holding two of the same call options creates a combined position equivalent to a forward buy
contract. Simultaneously writing and holding two of the same put options creates a combined position
equivalent to a forward sell contract. In Figure 4, the dotted black line shows the resulting combination.
Figure 4: Payoffs to Options Contract Positions
S = spot price at future transaction date (uncertain)
K = contract price (certain)
Forward Contract to Buy Forward Contract to Sell P
ayo
ff
Pay
off
F1
FK
F2 F
2 F
1
Call Option Put Option
Pay
off
K K ST=1
S
T=1

JOURNAL OF ECONOMICS AND FINANCE EDUCATION ∙ Volume 18 ∙ Number 1 ∙ Summer 2019
11
In Figure 4, we do not show the premium on the options for clarity of presentation. However, because the
premium paid by the holder is the premium received by the writer, the effect on the combined position is
zero. The alternative presentation would include the premiums for both with the holders payoff displaced
below the horizontal axis by the amount of the premium as is demonstrated in Figure 2 above. Likewise the
writer’s payoff would be displaced above the horizontal axis by the amount of the premium.
As mentioned above, some advocates of the earlier presentation of options have pointed out that options
are theoretically more basic contracts. An interesting side question would be whether it was the more
theoretically basic options or the more operationally simple forwards which emerged earlier in human
society. While numerous sources describe the organized use of futures and forward type contracts from the
Middle Ages onward in parts of both Asia and Europe, the oldest historical records may be of derivative-like
contracts in Ancient Mesopotamia. The Code of Hammurabi, which dates to 1750 BC, contains a law which
gives farmers the right to forego payments to creditors in the event of climate related crop failures (Kummer
and Pauletto 2012).
Such an arrangement is sometimes referred to as a state contingent claim, which is a contract which would
provide a specified payment only if a certain state of nature should occur. From a modern perspective, this
arrangement would likely be seen as a put option – albeit one whose exercise condition is not specified in
terms of price.
As ancient as that example is, there are cuneiform clay contract tablets from approximately the same era
(ex. 1809 BC) giving examples of forward contracts and also contracts with embedded repayment options
(Weber 2008). Thus it would seem that both state contingent claims and temporally displaced commercial
transactions (as antecedents for modern options and forward/futures) likely both date back to the ancient era
in which record keeping became possible.6 So, the historical date of emergence cannot be seen as a potential
justification of any particular pedagogical order of presentation of forwards, futures, and options.
Approaches Used in Various Textbooks and Justification of Specific Approaches
As noted earlier, the derivatives securities textbooks available in the U.S. are divided in terms of the order
of presentation discussed above. Even those textbooks which are dominant do not all use the same order of
presentation. Table 2 lists a collection of available textbooks and the order of presentation which they use.
Table 2: U.S. Market Textbooks for the Financial Derivatives Course
Authors Title Order of Presentation Publisher
Chance and Brooks An Introduction to
Derivatives and Risk
Management
Options, then
Forwards and Futures
Cengage
Hull Fundaments of Futures and
Options Markets
Forwards and Futures,
then Options
Pearson
Hull* Options, Futures, and Other
Derivative Securities
Forwards and Futures,
then Options
Pearson
Kolb and Overdahl Futures, Options and Swaps Forwards and Futures,
then Options
Wiley
Sundaram and Das Derivatives: Principles and
Practice
Forwards and Futures,
then Options
McGraw-Hill/Irwin
Strong Derivatives: An
Introduction
Options, then
Forwards and Futures
Thompson
Goldenberg Derivatives Markets Forwards, then
Futures, then Options
Routledge
*Hull offers a full textbook and a “fundamentals” version.
As can be seen from the table, the majority of the sample of textbooks uses an order of presentation which
begins with forward contracts and/or futures contracts, and then presents options later. It should be noted that
the table contains two entries for Hull which represent his main textbook and the “fundamentals” version.
However, the order of presentation is the same in both textbooks.
6 Weber (2008) notes that reliable record keeping made possible by the invention of writing is a likely precursor to the development
of derivatives type contract which are essentially human promises.

JOURNAL OF ECONOMICS AND FINANCE EDUCATION ∙ Volume 18 ∙ Number 1 ∙ Summer 2019
12
In an attempt to gain additional insight, we contacted the authors of all these textbooks via e-mail. After
explaining our interest in the textbook layout, each author was asked why the particular order of presentation
had been selected for their particular books. Nearly all of those contacted were kind enough to respond, for
which we are deeply appreciative. The authors’ responses confirmed some of the issues we had considered
ourselves, but introduced multiple new factors. The textbook authors’ key comments are summarized in
Table 3.
Table 3: Textbook Authors’ Key Comments on Presentation Order
Author Textbook Order Comments
Chance Options First Options are theoretically more fundamental
securities, alternative order provides
complication for futures options
Brooks Options First More complex options material is better
presented earlier in the semester
Hull Forwards/Futures First Linear payoff derivatives are simpler and thus
should be presented first, alternative order puts
coverage of futures and forwards at risk of being
left out
Kolb Futures First Conceptually simpler material first as
pedagogical preference.
Sundaram Forwards/Futures First Linear payoff derivatives are better for
presenting arbitrage-based pricing arguments
since they don’t require an assumption
concerning price evolution,
Das Forwards/Futures First The presentation order used provides an
incremental exposure to complexity
Strong Options First Numerous real world examples of option type
arrangements aids student understanding
Goldenberg Forward First Begin with less nuanced securities
Professor Chance responded that options are technically more fundamental since they can be held in
combinations which provide the same payoffs as futures and forwards, while the reverse is not the case. He
also noted that the most basic securities are the Arrow-Debreu securities from economic theory – which are
essentially option-like. Professor Chance did point out that one could likely present futures and forwards
before options, but this would require the instructor to defer any coverage of futures options (options on
futures contracts) until later in the course.
Professor Brooks (Chance’s co-author) points out that, as a practical matter, many students in this
particular course are last semester seniors. The course organization which covers options first has the
advantage that the most challenging material (mathematically) is covered earlier in the semester when the
(graduating) seniors are still fully engaged.7
Professor Hull stressed that linear products (forwards and futures) are simpler than non-linear products
(options) and thus are best presented first. He also pointed out that the former are in some respects more
important – pointing out that swaps are essentially comprised of a series of forward contracts, and that swaps
are the most important over-the-counter derivatives contracts. Professor Hull also suggested that if options
are presented first, then the linear products “tend to get tucked at the end of the course or are not covered at
all.”8 He also noted that if futures and forwards are covered earlier, then contrasts can be made concerning
hedging with these versus options.
Professor Kolb framed his choice to present futures before options in the context of his overall preference
for “moving from simple to more complex in pedagogical matters.”9 Further, he referenced a parallel
pedagogical progression in the context of market structure in which initial presentations are typically made
7 The author has noticed this same issue with late semester presentation of complex option pricing material.
8 Email from John Hull, January 27, 2018. 9 Email from Robert Kolb, November 4, 2018.

JOURNAL OF ECONOMICS AND FINANCE EDUCATION ∙ Volume 18 ∙ Number 1 ∙ Summer 2019
13
with no market imperfections, and then the later presentations are extended to include market imperfections
(e.g., transaction costs).
Professor Sundaram stated that “Linear derivatives are a simpler place to introduce the pricing by
replication/no-arbitrage principle since there is no model-dependence.”10 He further pointed out that option
pricing – even if arbitrage based – requires the additional complexity of some assumption of price evolution.
So, from this perspective, presenting forwards and futures first prepares a better foundation for student
comprehension of more complex option pricing relationships.
Professor Das (Sundaram’s co-author) provided a perspective in full agreement with that of Professor
Sundaram. The futures and forwards first order of organization is to be preferred because it provides for the
introduction of “incremental concepts and techniques.”11
Professor Strong stressed that real world analogies with options are “easy to find and easy for students to
understand” and thus provide an effective entry point into the discussion of derivatives.12 He states that
discussions of these types of examples (ex. a ticket to a sporting event as a call option) lead easily to the
presentation of option pricing concepts using the binomial option pricing model. In Professor Strong’s view,
futures, forwards, and swaps are more difficult for a student to grasp and understanding is enhanced with
earlier exposure to options.
Professor Goldenberg stated that he chooses to start with forwards because they “are nice linear
instruments.”13 After the introductory chapter, his textbook dedicates three chapters to forward contracts
before moving into futures with their “added institutional complexity” and options. He suggests that a firm
footing with the forward contracts prepares students well for later exposure to futures and options. He also
noted that payoff profit profiles can be very effectively introduced with forward contracts.
As discussed earlier, there is a potential problem in attempting to use payoff diagrams as a basis for
explaining the similarities between different types of derivatives. Specifically, the tendency for futures
contracts to be closed out prior to maturity means that the payoff diagram for futures contracts should have
the horizontal axis labeled as the futures price at close out – not the spot price of the underlying asset. (As
noted earlier, this issue is further explored in the appendix.)
The sample textbooks were scanned for the use of payoff diagrams specifically for futures contracts. The
results of this scan are presented in Table 4. While all of the textbooks presented payoff diagrams for options,
and most presented payoff diagrams for forwards, only a single example of a payoff diagram for futures
contracts was found in all of the texts. And, this single example, which suggested equivalence for futures and
forward contracts, had an axis which was not precisely defined.
The authors of the textbooks were not asked specifically why they did not choose to use payoff diagrams
for future contracts. However, given the common usage of payoff diagrams for both forwards and options, it
seems likely that the virtual absence of payoff diagrams for futures must be associated with the complication
discussed above – that is, the futures contract payoff depends on ending futures price instead of spot price.
The textbooks were also reviewed for their overview of the range of basic derivatives types in the
introductory chapter. These findings are also presented in Table 4. With the exception of Goldenberg, whose
text has no overview introductory chapter, each of the textbooks uses the same order of presentation in the
initial overview as in the textbook overall.
Summary of Issues Considered
The issues raised in this paper should be considered when selecting a course layout or textbook for the
introductory financial derivatives course. While an instructor can choose to cover chapters in an order
different from the sequence presented in the textbook, care should be given to ensure that the any resulting
gaps in the logic of presentation are accounted for in the in-class presentation.
The key issues raised involve the preferred order of presentation and the use of payoff diagrams and
payoff functions to enforce the basic similarities between the various types of derivatives. Arguments can be
10 Email from Raguh Sundaram, January 27, 2018.
11 Email from Sanjiv Das, January 27, 2018.
12 Email from Robert Strong, November 6, 2018. 13 Email from David Goldenberg, November 4, 2018.

JOURNAL OF ECONOMICS AND FINANCE EDUCATION ∙ Volume 18 ∙ Number 1 ∙ Summer 2019
14
made that, theoretically, options may be more fundamental securities. But, it seems clear that in terms of
student learning, the presentation of arbitrage pricing arguments is less difficult if done using forwards and/or
futures. From this perspective, the earlier presentation of forwards and futures can actually support the later
presentation of options. In addition, from a mathematical perspective, forwards and futures have more
straightforward payoffs.
However, both graphical presentations and payoff functions are potentially problematic for futures due
to their common early close-out. Because the basis (difference between spot and futures) is subject to change,
the payoffs to futures contracts cannot be a strictly linear function of the spot price. This complicates any
attempt to present futures as merely standardized, exchange traded forwards. And, this in turn complicates a
presentation progressing from forwards, to futures, and then to options using the payoff for the three in either
graphical or mathematical function terms.
If the instructor uses a graphical approach for comparisons, care must be given to either emphasize the
assumption that the futures are held to maturity (when spot and futures converge) or to use the ending futures
price in graphical presentations. The same care must be taken in strictly formulaic presentations as well.
Attention must also be given to the fact that options payoffs and pricing are considerably more complex
than that for forwards and futures. Thus, they may require additional class time and higher level of student
engagement. If options are presented later in the course after forwards and futures, then care must be taken
that the main options pricing material is presented early enough in the course so as to avoid the end-of-
semester bustle and resulting student distractions.
Finally, it should be noted that this discussion has focused on the introductory financial derivatives course.
These recommendations do not necessarily hold for a more advanced course in which students already have
significant exposure, and where the strictly theoretical considerations might be given more weight. In that
particular setting, an options first presentation order could be justified – particularly if the discussion were to
be taken to a detail level which would involve basic market theory (e.g., Arrow-Debreu securities).
Table 4: Textbook Introductory Chapter Coverage of Derivatives and Use of Payoff Graphs
Author Overview
Chapter
Derivatives
Presented in Order
Payoff
Graphs
Presented in
Order
Horizontal Axis
Labels in Order
Use of Futures
Payoff Graph
in Futures
Chapters
Chance &
Brooks
1 Options, Forwards,
Futures, Swaps
None NA
No
Hull
(Fundamentals)
1 Futures, Forwards,
Options
Options “Stock Price”
Yes*
Hull (Main) 1 Forwards, Futures,
Options
Forwards,
Options
ST, “Stock
Price”
No
Kolb &
Overdahl
1 Forwards, Futures,
Options, Futures
Options, Swaps
None NA No
Sundaram &
Das
1 Forwards &
Futures, Options,
Swaps
Forwards ST, No
Strong 1 Options, Futures,
Swaps
None NA No
Goldenberg None NA NA NA No * A single payoff graph equating forwards and futures payoffs with horizontal axis labeled “exchange rate” on p. 43

JOURNAL OF ECONOMICS AND FINANCE EDUCATION ∙ Volume 18 ∙ Number 1 ∙ Summer 2019
15
Concluding Recommendations for Instructors
This paper has discussed the order of presentation of material in the introductory derivative securities
course. While at first glance, a particular presentation order might seem logically obvious, attention to certain
real-world market details leads to pedagogical caveats. Further considerations arise from prevalent patterns
of student engagement levels at different points in the typical one-semester course. And, significant
differences in the overall complexity of different types of derivatives should be considered.
Given the factors discussed, it seems that a stronger case can be made for the presentation of forwards
and futures prior to covering options than for the reverse order. Adhering to the pedagogical convention of
moving from the simple to the more complex seems a stronger argument than either strictly theoretical
development basis for ordering material or practical flow-of-semester considerations.
The finer detail of whether to comingle forwards and futures or to present them sequentially requires
additional consideration. All but one of the textbooks in our sample comingles their discussions of forwards
and futures.14 This is particularly prevalent in terms of the pricing of forward and futures contracts due to the
technical similarities in the pricing of the two.
Finally, we see great potential value in using payoff diagrams to visually emphasize the underlying
similarities of the three major types of derivative contracts – at least in the initial, overview presentation.
However, to avoid inadvertently establishing the grounds for later student confusion, the instructor must
carefully consider the details of the payoff graphs used. In particular, certain assumptions15 must be
introduced in order for a direct comparison or overlay type presentation to be used. Then, in later more
detailed presentations the assumptions made to support initial comparisons can be revisited and relaxed.
References
Chance, Don M., and Robert Brooks. 2016. An Introduction to Derivatives and Risk Management. Boston:
Cengage.
Goldenberg, David H. 2016. Derivatives Markets. New York: Routledge.
Hull, John C. 2017. Fundamentals of Futures and Options Markets. Boston: Pearson.
Hull, John C. 2018. Options, Futures, and Other Derivatives. Boston: Pearson.
Kolb, Robert W., and James A. Overdahl. 2007. Futures, Options, and Swaps. Hoboken: Blackwell.
Kummer, Steve, and Chirstian Pauletto. 2012. “The History of Derivatives: A Few Milestones.” EFTA
Seminar of Regulation of Derivatives Markets 431-466.
Strong, Robert A. 2005. Derivatives: An Introduction. Boston: Thompson.
Sundaram, Rangarajan K., and Sanjiv R. Das. 2016. Derivatives: Principles and Practice. New York:
McGraw-Hill/Irwin.
Weber, Ernst Juerg. 2008. “A Short History of Derivative Security Markets.” University of Western
Australia.
14 Goldenberg alone dedicates multiple chapters to forward contracts before moving on to futures contracts.
15 From earlier discussions, these assumptions are that the options in question are European style options and that the futures
contracts are held until their maturity.

JOURNAL OF ECONOMICS AND FINANCE EDUCATION ∙ Volume 18 ∙ Number 1 ∙ Summer 2019
16
Appendix: Futures Basis Risk and Graphical Presentations
Because the typical futures market participant would close out his or her position prior to the earliest
delivery window means that “basis risk” is an issue. The basis is the difference between the spot price and
the futures price at any point in time. Because the futures price must converge to the spot price at the moment
of maturity, the basis changes through time. It is this variability in basis which causes the payoffs to futures
contracts to deviate from a linear function of the spot price of the underlying asset whenever a futures position
is closed out prior to maturity. In effect, from a pedagogical perspective, the payoff is no longer a predictably
straight linear function of the spot price. And, thus, the pedagogical progression of explanation is broken.
Because the basis (St – Ft) is subject to change, there is no constant proportion between the two prices
(the spot price and futures price). Thus, it is not possible to describe the payoff to a futures position as a linear
function of the spot price except at the very end of the contract. A simple two axis graph cannot properly
describe the relationship, so the presentation must be more complex. If this issue is included in the initial
introductory presentation, the student is likely to become confused rather than enlightened by a reference to
the similarity of the fundamental payoffs.
Figure 5 depicts some potential relationships as a function of spot price assuming a changeable basis.
The payoff (F2 - F1) would be a linear function of F2. But since the basis is subject to both widening and
narrowing, the payoff as a function of St could be quite variable and almost certainly would not be linear.
This complicates the presentation and could largely destroy the value of stressing that futures and forwards
are essentially the same.
Figure 5: Payoffs to Futures Contracts with Changing Basis
F2 = ending futures price at position closeout date (uncertain)
F1 = starting futures price (certain)
S = spot price at position closeout date (uncertain) P = premium
Although there are recognized historical and seasonal patterns in the basis for a particular commodity, it
is difficult to reliably describe the basis as a function of the spot price at any particular point in time – except
at contract maturity (when the basis will be zero). Keeping in mind that graphs such as those presented in
Figure 1 for forward contracts typically use the spot price at contract maturity, the complication for futures
contracts closed out prior to contract maturity is readily apparent. In those situations the “ending” spot price
would not be the end-of-contract spot price, but rather the spot price on the day on which the futures contract
was closed out. Even if one could reliably model basis, a full presentation would require a three-axis graph.
At any point prior to maturity the basis is subject to a high degree of variability driven by seasonal changes
in supply and demand along with various shocks and overall market conditions. These are in addition to the
Long Futures Contract Short Futures Contract
Pay
off
Pay
off
F1 F1 St St

JOURNAL OF ECONOMICS AND FINANCE EDUCATION ∙ Volume 18 ∙ Number 1 ∙ Summer 2019
17
relatively straightforward changes associated with the time value aspects as maturity approaches. The basis
can either widen or narrow before maturity. Consequently, the basis could have a wide range of “functional”
relationships to the then current level of the spot price. So, the payoff functions to the futures position could
have a wide range of departure from the strictly linear presentation in a two-axis graph. These are the
hypothetically representative non-linear functions presented in Figure 5.
Because no-arbitrage pricing relationships for futures prices imply constraints on the size of the basis,
some general observations can be made. If we assume the no-arbitrage pricing relationship used for a no-
income “investment asset” (F0 = S0erT), then the actual relationship would be curvilinear as is depicted in the
long futures contract panel of Figure 5. If we consider the no-arbitrage relationship for a “consumption asset”
with storage costs [F0 ≤ (S+U)0erT], then the curvilinear relationship would be displaced by an amount equal
to the present value of the storage costs “U” as is depicted in the short futures contract panel of Figure 5.16
Including a “convenience yield,” y, further elucidates the variability of the relationship [F0eyT = (S+U)0erT].
Of course, if the no-arbitrage conditions do not hold, then an even wider range of relationships is possible.
16 Investment assets are those which are held primarily for investment purchases by at least some market participants, whereas consumption assets are those held primarily for consumptions purposes. See Hull (2017, pp. 125-128) for a discussion of pricing
differences.
JOURNAL OF ECONOMICS AND FINANCE EDUCATION ∙ Volume 18 ∙ Number 1 ∙ Summer 2019
18
The View from 30,000 Feet: Using Paper Airplanes
to Understand Economic Modeling
Wayne Geerling, G. Dirk Mateer, and Brian O’Roark1
These airplanes we have today are no more than a perfection of a
child’s toy made of paper.
Henri Coanda
ABSTRACT
This paper describes an active-learning technique for teaching how
models evolve over time. Models lie at the heart of economic analysis,
yet many students struggle because they lack the spatial skills to interpret
the models. We expand on the work of Geerling and Mateer (2014), who
showed that using a paper airplane experiment in class was a great way
of showing principles-level students how we build simple, yet effective
models. What is less intuitive is that a paper plane experiment is also an
ideal starting point to discuss how economic models evolve over time in
an intermediate macroeconomics class.
Introduction
In this paper, we utilize paper airplanes to help learners understand how we create simple, yet effective
models in principles-level classes, before extending this analysis to show how models evolve over time in
intermediate macroeconomics. The activity can be completed in less than ten minutes and leaves a powerful
impression in both small and large classes. Understanding how economic models are designed, the limitations
of each model, and how well models work in the real world are some of the most important objectives in any
economics course. This activity provides instructors with a simple and fun technique to ensure that learners
understand the fundamentals of model building, and then extends the analysis by introducing more complex
ideas and robustness suitable for an intermediate level macroeconomics class. We begin by surveying the
literature before providing a brief summary of how this activity first evolved at the principles level. We then
extend the analysis to the intermediate macroeconomics classroom. Finally, we provide some closing
thoughts.
Literature Review
Becker et al.’s (2006) seminal work encourages instructors to drop “chalk and talk.” Acchiardo and
Mateer (2015) note that class activities create positive impressions about economic concepts that last far
beyond the life of a course. Recent papers by Roach (2014), Balaban et al. (2016), and Wozny et al. (2018)
suggest that in-class activities in a flipped classroom setting raise student performance on exams. These
results provide evidence that learning by doing increases the efficacy of teaching.
More germane to the current paper, deploying paper airplanes as a learning tool is an example of active
learning. According to Prince (2004, p. 223): “Active learning is generally defined as any instructional
method that engages students in the learning process. In short, active learning requires students to do
meaningful learning activities and think about what they are doing.” Freeman et al. (2014) reported results
1 Geerling (corresponding author): Senior Lecturer, Department of Economics, Room E970, Monash University, Clayton, VIC
3800, Australia. Tel: +61399055482. Email: [email protected]. Mateer: Senior Lecturer, Department of Economics,
401J McClelland Hall, The University of Arizona, USA. Tel: +15206216224. Email: [email protected]. O’Roark: Professor of Economics (Social Sciences), Massey Hall 310, Robert Morris University, USA. Tel: +14123976386. Email:

JOURNAL OF ECONOMICS AND FINANCE EDUCATION ∙ Volume 18 ∙ Number 1 ∙ Summer 2019
19
from 225 studies across STEM disciplines, comparing results in classes that rely upon traditional lectures to
those employing active learning. In general, students’ average exam scores were shown to improve by around
6% in active learning classes. Additionally, students involved in a traditional lecture setting were 1.5 times
more likely to fail as compared to those in classes with significant active learning.
The use of paper airplanes to teach basic physics is relatively commonplace. Educators have used
different paper airplane designs to illustrate drag, gravity, thrust, and lift to teach aerodynamics.2 Hello
Learning (n.d.) prepared an especially useful guide that describes the scientific method by means of paper
airplanes. Wild Child Designs (n.d.) created an extended mathematics lesson that uses paper airplanes to help
students learn measurement and graphing. Each of these resources help learners understand the importance
of model building in a science, technology, engineering, and mathematics (STEM) setting.
Economics is conducive to a STEM approach, but paper airplanes are rarely used to teach economics.
Steiner and Fackler (n.d.) created an assembly line game to manufacture paper airplanes that is appropriate
in K-12. While this activity focuses on specialization, division of labor, and marginal productivity, the
airplane itself is not instrumental to learning the concepts. Geerling and Mateer (2014) directly apply the use
of paper airplanes in their work, The Ultimate Guide to Teaching Microeconomics, a resource with over 500
teaching tips for creating an engaged classroom. The authors show how a paper plane activity can help
illustrate the difference between endogenous and exogenous factors and why the concept of ceteris paribus
is important in determining causation. Similar to work by Rutkowski et al. (2004), whose curriculum is
designed for K-12 educators interested in teaching engineering, Geerling and Mateer’s work highlights how
iterative design helps model builders learn from the mistakes of early designs. Unfortunately, Geerling and
Mateer’s work is tied to a publisher’s ancillary package, limiting its availability to most faculty. Our work
takes this novel idea, expands upon it, and extends it to intermediate macroeconomics.
Principles of Economics
Geerling and Mateer’s (2014) paper airplane experiment was first developed for a principles-level class
to help provide students with an intuitive way of understanding how models work. When designing airplanes,
engineers often build small-scale models to test how they fly without building full-size aircraft. Similarly,
paper airplanes were used to illustrate the basics of model building in economics. Students design their own
plane and try to hit a target, such as a trash can at the front of the room. This activity helps students who
struggle to distinguish between: (i) endogenous and exogenous variables; (ii) causation and correlation. The
design of a paper plane is endogenous – or built into the model. Example of endogenous factors include:
wingspan, the type of paper used and the method of folding the paper. Exogenous factors affect how a plane
flies, but lie outside the model itself. If the experiment is run inside the classroom, an example of an
exogenous factor would be air traffic. A well-constructed plane will not hit the target if there are too many
planes in the same air space. If flown outside, wind or precipitation would also affect the flight of a plane.
The instructor can ask students to write an endogenous variable on the inside of their plane and an exogenous
variable on the outside upon completion.
A classroom provides an ideal setting for a controlled environment, which will be used to determine the
best model. In its simplest form, the experiment works as follows. Start by breaking the class into three
groups: group one (the right-hand side of the classroom), group two (the center), and group three (the left-
hand side of the classroom). Students in group one will stand up simultaneously and attempt to hit the target
(trash can) with their plane. The instructor will then ask students in group two to make one change to their
plane: folding back part of the left wing. The instructor might need to model this in front of the class with a
plane flown by group one to ensure that the same change is made. This is introducing the concept of ceteris
paribus: by altering one characteristic of each airplane, while holding everything else constant, an economist
has the ability to determine how changes to basic model design impact performance. Ask for predictions on
how the planes will fly before getting the center group to simultaneously fly their planes at the target. We
now have a basis for testing whether the change to the model improved performance. Finally, with group
three, the concept of ceteris paribus should be intentionally violated. Ask students to make three changes to
the original design: fold back part of the left wing (like group two), bend down the front tip and tear off part
of the right wing. When predictions on how the plane will fly are requested, there will be a range of weird
answers, all negative. Students know their planes won’t fly, which is inevitably true. What they can’t explain
2 http://www.greatpaperairplane.org/wp-content/uploads/Lesson-Plan.pdf

JOURNAL OF ECONOMICS AND FINANCE EDUCATION ∙ Volume 18 ∙ Number 1 ∙ Summer 2019
20
is what effect each of the individual changes had on how these model airplanes performed. There is no way
of separating causation from correlation. This reinforces the idea that in economics, the objective is to build
simple, yet effective models, and then change one variable at a time in order to understand what the model
predicts will happen as a result.
Intermediate Macroeconomics
Paper airplanes do not only appeal to principles students. At the intermediate level, students will typically
need to be reminded of the basics of modelling and the types of variables that will be utilized in a theory-
based class; however, once the review is complete, the airplane analogy can be extended to more complex
ideas, thereby increasing the robustness of the activity.
One of the most noticeable distinctions between macroeconomics and microeconomics is the diversity of
opinion that has prevailed over time as schools of thought have arisen to explain macroeconomic phenomena.
As a result, macroeconomic models have been particularly prone to falling out of favor as economic events
overwhelm an acclaimed model’s predictive power. While instructors of intermediate level material realize
that models are updated as more data become available, as new insights arise, and as modelling techniques
improve, students are likely to begin a class with the expectation that they will learn how the various
macroeconomic pieces fit together for now and always. The extension that follows will help to allay that
belief.
To begin, split the class into three groups, as described in the principles version of this exercise. As before,
each student should be provided with a piece of paper from which to build a plane. This time however, two
things should be different. First, begin with a less sturdy type of paper (paper towels work particularly well).
Second, set the target very close to group one. Of course, this gives a decided advantage to that group. Most
of the planes constructed by that group should have no problem hitting the target despite their flimsy
construction. This means the target must be very, very close. Have the group choose its best plane which
becomes the representative plane for the group. Unfortunately for the other groups, they are likely to have
absolutely no luck in reaching the target.
At this point the grumbling from groups two and three is likely to be palpable, so take a minute to explain
what this represents. In the development of macroeconomic theory, issues were initially answered by what
has since been labelled the classical school of thought. The belief that government intervention was
unnecessary, even detrimental, to the health of the economy, and that any economic malady would reverse
itself sans policy, was the way of the world prior to the Great Depression (Smith 1776; Say 1803). In the
exercise as constructed, group one is the classical school. They have hit the target with the policy airplane
and while there are voices on the periphery, what they have to say about the health of the economy, in terms
of their theories, are essentially irrelevant. However, the Great Depression is coming, and things are about to
change.
To reflect this disruption to the status quo, move the target closer to one of the other groups. This simulates
the inability of the dominant models to explain and address the macroeconomic upheaval. First, have group
one throw its plane and see how close it comes. The target should be far enough away so that group one can’t
make it, but close enough to group two that it is relatively easy for them to hit. Before group two throws,
however, allow them to redesign their planes based on what they have seen work from group one. This
illustrates that economists build their models based on those that have gone before. The new theories, in this
analogy the Keynesian theory, builds upon the classical school and attempts to correct the failures of that
model. Permit everyone in group two to throw a plane and choose the best of the lot to be group two’s proxy.
Now groups one and two should have a plane, while group three is still trying to determine which is best.
Now, it’s group three’s turn. Move the target once more. Place it far enough from groups one and two so
that they will have an incredibly difficult time hitting the target, but not so close to group three that its
members can easily hit it. Group three may see this as unfair at first but insist that they try anyway. Like the
other groups, have them throw their planes and determine which is the best. Once that is done, provide them
with a sheet of printer paper. They should replicate their design and try again. It should be much easier for
them to hit the target even though it is a little further away. This change in paper illustrates how models not
only improve and advance over time as we build upon what has come before, but it also shows that models
become better as modelling ability progresses. Analogize the original model as a pre-macroeconomic data
world, and the new plane as the post-macroeconomic data world. A model that predicts the health of an
economy will be much more accurate with data as there is something to compare states of the world to, and
JOURNAL OF ECONOMICS AND FINANCE EDUCATION ∙ Volume 18 ∙ Number 1 ∙ Summer 2019
21
tangible targets to hit. Classical and early Keynesian models had no significant macroeconomic data against
which to gauge their models; GDP in its modern form wasn’t really invented until the mid-1930s, and the
first U.S. GDP statistics weren’t published until 1942 (Coyle 2014, p. 15). Even then, the data being collected
was skewed by the dire economic conditions of the Great Depression and World War II. Allegorically, group
three’s model should be better because, as time has progressed, they have more tools to test and refine their
models.
Now, provide all teams with the same paper, and allow them to add new “technology” to their models.
Make paperclips, markers, and other weights of paper (for instance, construction paper, oak tag, or tissue
paper) available to all teams. Allow them to choose only one item, but make sure there is enough of each
item for every team to choose whatever they want.
After they have modified their planes, move the target equidistant from all teams and see who gets closest.
Once a clear winner is determined, allow the other two teams to make a change to their planes. They can
redesign the plane and trade in their “technology” for something else. Now, ask the losing teams to throw
again. See how long it takes for the various teams to converge on a model idea. This is demonstrated when
everyone chooses the same “technology” and basic plane design. This reflects how macroeconomic models
take what works from other models to improve their own; yet, it also echoes the missive of Milton Friedman
(1968, p. 15), who claimed “in one sense, we are all Keynesians now.” However, even when a model becomes
the dominant way of thinking, there will eventually be an economic event the model does not or cannot
predict. Friedman (1968, p. 15) goes on to suggest that “in another [sense], no one is a Keynesian any longer.
We all use the Keynesians language and apparatus; none of us any longer accepts the initial Keynesian
conclusions.” While one generation of macroeconomists might believe that a model has the answers to all
the world’s ills, the next may find it lacking.
The point of this advanced version of the paper airplane experiment is to show intermediate
macroeconomics level students how models evolve over time. Whether it is the Solow model, which adds
components to the list of explanatory variables to improve its predictive power, models of inflation that are
impacted by the application of expectations, or the generalized equilibrium models of the classical, Keynesian
and monetarist schools of thought, models change based on the successes of others, and the failures of one’s
own. Additionally, it is worth noting that correcting models during a shock is particularly difficult. Models
evolve over time, and when a model fails to offer solutions to a problem, the transition to a better model does
not occur overnight.
The groups in this exercise represent the schools of thoughts that the instructor will likely be addressing
during the course. Sometimes those schools of thought seem to have it all figured out, but then the economy
changes, a shock occurs – the target moves – and the models that had successfully explained economic
changes are no longer able to do so.
Practical Application
After running through the exercise, randomly provide the following scenarios and policy reactions to see
if students can determine the order of events. Do not tell them the name of the recession until they have them
in the correct order. These historical economic episodes were all dealt with in very different ways even though
they were all recessions. Based on the brief synopsis, ask students to talk about the different approaches to
policy during these recessions, and what their reactions are. Do the policies make sense to them? As the
observations are made, ask students if they have any insights as to which schools of thought fit with each
situation. If this is done at the beginning of the term, students probably will not know much about different
approaches to policy or the names of schools of thought. If necessary, offer some historical context and
explain why these scenarios are answered by different schools (see Table 1). At the end of the exercise, be
sure that students capture the relationship between the schools of thought and policy. These recessions can
be described as follows:
Policy during the Panic of 1893 was hands-off, as there were no real policy tools available. The classical
school of economic thought advocated for minimalist intervention at the time, not to mention there was
no sense of what a national policy could achieve.
By the Great Depression, economic theory was beginning to evolve as governments adopted more
activist policies. The slow pace of recovery and the severity of the downturn opened the door for new

JOURNAL OF ECONOMICS AND FINANCE EDUCATION ∙ Volume 18 ∙ Number 1 ∙ Summer 2019
22
ideas. The Keynesian school stepped into the void with its suggestions of counter-cyclical budgets and
deficit spending.
The economic malaise of the 1970s was not corrected by Keynesian policy in large part because the
source of the downturn was not based on aggregate demand, which the Keynesian models were built to
address. Monetarist policy-making initiated a more significant role for the Federal Reserve.
The Great Recession was described by many economists as the worst economic catastrophe since the
Great Depression. Keynesian models of deficit spending were once again on display as fiscal stimulus
was adopted. However, the Fed also added to the stimulus following the monetarist playbook of flooding
the economy with liquidity. This crisis is a little trickier to identify as being addressed by one of the
prominent schools of thought, which is yet another illustration of how models, and the policy that results
from those models, change over time.
Table 1: Historical Episodes
Name /Date Scenario Policy Reaction School of Thought
Panic of 1893 After years of slowing growth
accompanied by the bankruptcy
of the Reading Rail Road, a run
on the banks occurred.
Unemployment rose to over
10%.
No monetary policy could
be conducted because
there was no central bank,
and the federal
government lacked the
power to tax income, so
no policy was adopted.
Classical
The Great
Depression
A massive run up in stock
prices combined with terrible
trade policy, weak monetary
policy, and other economic
maladies resulted in a
cataclysmic failure felt around
the world.
After a number of years,
the federal government
began spending like it
never had before.
Keynesian
Early 1980s
recession
Stubbornly high inflation and
high unemployment (known as
stagflation) left policy makers
scratching their heads. The
Iranian Revolution led to a
decrease in oil supplies; the
Fed, now an accepted
institution, attempted to rein in
inflation, but was not taken
seriously. Standard policy had
no effect.
Strident contractionary
monetary policy was
adopted to slow the rate
of inflation.
Monetarist
The Great
Recession
Exuberant lending, sketchy
financial instruments, and
regulatory mismanagement
caused the housing bubble to
burst. This resulted in the near
collapse of the financial sector.
Unemployment skyrocketed and
GDP plummeted.
Massive fiscal and
monetary stimulus was
adopted in an attempt to
prevent what was
predicted to be an
economic catastrophe.
Keynesian/
Monetarist
These episodes, and their admittedly brief explanations, provide an introduction to schools of thought and
tie the paper airplane exercise to some actual events which illustrate why new models rose to prominence,
while others faded into the background, waiting for a reboot.

JOURNAL OF ECONOMICS AND FINANCE EDUCATION ∙ Volume 18 ∙ Number 1 ∙ Summer 2019
23
Post-Script
Students have found that this exercise provides them with a reference to modelling when, later in the
term, models become more complex. While the exercise is never replayed for lack of time, it does provide a
helpful reference point. Students certainly appreciate the illustration and recall it fondly on end-of-term
evaluations. Depending on the weather and size of the classroom, this exercise has been conducted outside
(the weather variable being a clear illustration of an exogenous variable) and in the halls. Students on their
way to other classes have stopped to watch. Intermediate macroeconomics isn’t the most sought-after class
on campus, but when paper airplanes are being thrown, passersby become curious. They have even been
heard to say “I wish we did this in class.” Anecdotally, students have commented on it many semesters later.
They certainly do not recall every point about the exercise, but they do seem to remember that building paper
airplanes and macroeconomics go together.
Conclusion
Students often miss the big picture. Modeling with airplanes helps students understand how models are
designed (the on-the-ground view) and how they are deployed during times of recession (the view from
30,000 feet). Models are the basic tool of economic analysis, yet students can find themselves lost in the
jargon we take for granted. One way around this is to use teaching aids that are familiar to students (O’Roark
2017; O’Roark and Grant 2018). This puts students in a setting where they are tethered to something
recognizable. From the earliest days in school, students have had at least a passing familiarity with paper
airplanes, making them a perfect starting point to discuss models. Paper airplanes are certainly not the real
thing, but they approximate something real, just like our economic models. As we have shown, paper
airplanes and variations of paper airplane construction allow us to demonstrate basic model building along
with more esoteric notions about the progression of models over time. We hope that by adopting an
interactive exercise such as this, teachers may yet see the value in allowing paper airplanes to fly around their
rooms.
References
Acchiardo, Charity-Joy, and G. Dirk Mateer. 2015. “First Impressions: Why the First Day Matters.”
Perspectives on Economic Education Research 9: 1-9.
Balaban, Rita A., Donna B. Gilleskie, and Uyen Tran. 2016. “A Quantitative Evaluation of the Flipped
Classroom in a Large Lecture Principles of Economics Course.” Journal of Economic Education 47: 269-
287.
Becker, William E., Suzanne R. Becker, and Michael W. Watts eds. 2006. Teaching Economics: More
Alternatives to Chalk and Talk. Northampton, MA: Edward Elgar Publishing.
Coyle, Diane. 2014. GDP: A Brief but Affectionate History. Princeton, NJ: Princeton University Press.
Freeman, Scott, Sarah L. Eddy, Miles McDonough, Michelle K. Smith, Nnadozie Okoroafor, Hannah Jordt,
and Mary Pat Wenderoth. 2014. “Active Learning Increases Student Performance in Science, Engineering,
and Mathematics.” Proceedings of the National Academy of Sciences 111: 8410-8415.
Friedman, Milton. 1968. Dollars and Deficits. Prentice Hall: New York: Prentice-Hall.
Geerling, Wayne, and G. Dirk Mateer. 2014. The Ultimate Guide to Teaching Microeconomics. New York:
W.W. Norton Publishers.
Hello Learning. n.d. Scientific Method and Paper Airplanes.
https://www.teacherspayteachers.com/Product/Scientific-Method-and-Paper-Airplanes-An-Investigation-
in-Flight-852451

JOURNAL OF ECONOMICS AND FINANCE EDUCATION ∙ Volume 18 ∙ Number 1 ∙ Summer 2019
24
O’Roark, Brian. 2017. “Super-Economics Man! Using Superheroes to Teach Economics.” Journal of
Economics Teaching 2: 51-67.
O’Roark, Brian, and William Grant. 2018. “Games Superheroes Play: Teaching Game Theory with Comic
Book Favorites.” Journal of Economic Education 49: 180-193.
Prince, Michael. 2004. “Does Active Learning Work? A Review of the Research.” Journal of Engineering
Education 93: 223-231.
Roach, Travis. 2014. “Student Perceptions toward Flipped Learning: New Methods to Increase Interaction
and Active Learning in Economics.” International Review of Economic Education 17: 74-84.
Rutkowski, Tom, Alex Conner, Geoffrey Hill, Malinda Zarske and Janet Yowell. 2004. “Take Off with Paper
Airplanes.” TeachEngineering.org.https://www.teachengineering.org/lessons/view/cub_airplanes_lesson06.
Say, Jean-Baptiste. 1803. A Treatise on Political Economy: or the Production, Distribution and Consumption
of Wealth. Paris: Crapelet [for] Deterville.
Smith, Adam. 1776. The Wealth of Nations. London: Oxford University Press.
Steiner, Deanna, and Jenelle Fackler. n.d. Paper Airplane Factory: An Assembly Line Game.
https://www.teacherspayteachers.com/Product/Paper-Airplane-Factory-An-Assembly-Line-Game-499558
Wild Child Designs. n.d. Measurement & Graphing Math Project-Based Learning: Paper Airplane Fun.
https://www.teacherspayteachers.com/Product/Measurement-Graphing-Math-Project-Based-Learning-
Paper-Airplane-Fun-2621095
Wozny, Nathan, Cary Balser, and Drew Ives. 2018. “Evaluating the Flipped Classroom: A Randomized
Controlled Trial.” Journal of Economic Education 49: 115-129.
JOURNAL OF ECONOMICS AND FINANCE EDUCATION ∙ Volume 18 ∙ Number 1 ∙ Summer 2019
25
The Second-Generation Theory of Fiscal
Federalism: A Research Lesson from the Classroom
Giampaolo Garzarelli1
ABSTRACT
The second-generation theory of fiscal federalism (SGT) ought to more
explicitly consider intergovernmental grants in order to continue to be a
progressive research program. This proposition, which emanates from
scope economies between teaching and research, implies that at present:
(1) first-generation theory of fiscal federalism (FGT) and SGT concern
two different organizational phases of a federation; (2) we analytically
need both phases; and (3) FGT and SGT are also both still needed, at
least as much as they still need each other. Taken together, (1), (2) and
(3) outline a promising research path – a positive heuristic – for the SGT.
Introduction
A classic question in the economics of education concerns the existence of scope economies between
teaching and research (e.g., De Witte et al. 2013). Is there a teaching-research learning nexus?
In terms of novel knowledge from research making its way to the classroom, matters are fairly trite. The
opposite – having new research ideas or intuitions from teaching – less so. This article reports one instance
of scope economies between teaching and research directly from the classroom. The instance regards new
research insights gained from teaching two approaches for the study of fiscal federalism – namely, first- and
second-generation theories of fiscal federalism (henceforth FGT and SGT).
The lesson learned from the instance can be summarized as follows. Motivated by preference revelation
issues, the FGT considers that a federation is already in place and focuses on the internalization of
externalities among federated states through intergovernmental grants. The SGT instead concerns why one
should opt for fiscal federalism in the first place by trying to establish, mostly on organizational grounds, an
incentive motivation for decentralization. The SGT does consider externalities, but does not explicitly
consider the related role of grants. This means that there is hitherto no (or very little) normative overlap
between the FGT and the SGT. I therefore ultimately suggest that in order for the SGT to be a progressive
research program there should be normative overlap: the SGT ought to consider the role of grants.
My suggestion resonates with Oates (2005). However, given that my main source of inspiration is the
classroom rather than the library, my reasoning differs from that of Oates on two main accounts. My
reasoning is pedagogical in origin. This implies that it is more stylized, involving some degree of
simplification and judgment, but not for this reason losing the essence of the original theories. More
substantively, my reasoning is on the net more organizational too. It is closer in spirit to the SGT than to the
FGT. These two reasoning differences allow me to assert that at present: (1) FGT and SGT concern two
different organizational phases (or moments) of a federation; (2) we analytically need both phases; and (3)
FGT and SGT are also both still needed, at least as much as they still need each other. Taken together, (1),
(2) and (3) outline a promising research path – a positive heuristic – for the SGT.
1 DiSSE, Sapienza – Università di Roma, Rome, Italy & IPEG, SEF, University of the Witwatersrand, Johannesburg, South Africa,
[email protected]. I am grateful to all the undergraduate and graduate students in two continents who over the years
had to go through my lectures and from whom I learned a lot, to the two anonymous referees who posed very challenging comments that led to significant improvements, and to Lyndal Keeton for her constructive feedback. My greatest debt is to Aldo A. Sitoe: this
work would not exist were it not for the many stimulating conversations with Aldo over the years. All the shortcomings are mine.

JOURNAL OF ECONOMICS AND FINANCE EDUCATION ∙ Volume 18 ∙ Number 1 ∙ Summer 2019
26
The Lesson
Experience from teaching both undergraduate and graduate public economics for more than a decade (and
in different continents) suggests that it is fruitful to be actively dialectical. I mean this in two senses. The first
is the sense that should be familiar to most: the Socratic method or maieutics, where we engage in debates
with students in the hope to stimulate interest, critical thinking, material retention, and additional insights.
The second sense concerns how we lecture the topics. I began by teaching the FGT and then considering the
SGT – i.e., I proceeded chronologically rather than dialectically. After some trial and error, in subsequent
generations of classes I switched to teaching FGT and SGT together, but in juxtaposition to one another in
terms of different assumptions, motivations, origins, problems explored, and the like. Relatedly, the teaching
benefited from using elemental organizational reasoning as the common expository denominator for both.
More precisely, given its more mature status, I found it convenient to illustrate the arguments from the
perspective of the FGT while at the same time employing, as proposed by the SGT, an organizational lens.
The dialectical nature of lecturing through an organizational lens ultimately allowed for more informative
analytical comparisons. In particular, it is what added value in terms of informing my research lesson from
the classroom – and, consequently, also permeates what follows.
FGT and SGT: A Quick Overview
The FGT mostly originates from the public finance framework presented in the classic works of Arrow,
Musgrave, and Samuelson. It is essentially a (Pigouvian) framework that deals with benevolent social
planning, market failure, Musgrave's three functions of government, Samuelson's equilibrium condition with
private and public goods, welfare theorems, etc.
The motivational pillar of the FGT is the conviction that fiscal decentralization solves the knowledge
problem tied to the nature of public goods. That is, the partitioning of fiscal responsibilities among levels of
government offers an efficient solution about how to supply a good that because of its nonexclusivity and
nonrivalness does not encourage the spontaneous revelation of individual preferences (Oates 2011).
The SGT, as hinted at the outset, proposes the inclusion of insights from the theory of the firm or, more
broadly, the modern economics of organization (Gibbons and Roberts 2013) to study decentralized
intergovernmental fiscal relations (Qian and Weingast 1997). Though the SGT is still-emerging – and embeds
different interests and approaches, e.g., the trade-off between policy design and rent-seeking as an incomplete
contract problem (Seabright 1996), policy experimentation by viewing a federation as a laboratory (Garzarelli
2006), and incentive alignment between consumer-voters and elected officials as in a common agency model
(Tommasi and Weinschelbaum 2007) – it has one uniting assumption that explicitly sets it apart from the
FGT. That is to say that the organization of multilevel government should not be a matter of indifference in
public economics. The baseline view is that different organizations have different welfare consequences.
Note that proposing this view is not tantamount to asserting that the FGT (as we will see more clearly as
we proceed) denies that decentralized public sector organization, especially of the vertical type (e.g., Oates
1999), matters. Rather, the SGT is trying to define a theoretical research program that the FGT lacks. The
point is not just to recognize that organization matters, but to see what an explicit application of economics
of organization theory can add to the field of fiscal federalism. Recognition of organizational importance is
insufficient if one still considers the public sector as a black box in scientific practice.
The SGT presents some overlap with political economy approaches, most notably Public Choice and
Political Economics (Oates 2008). The overlap concerns the interest in aligning political incentives. For
example, how decentralization of fiscal functions can improve political accountability (such as limit capture,
clientelism, and shirking), and, more generally, reduce the political taste for excessive budget relaxation (e.g.,
Rodden et al. 2003) that can lead to Leviathan (Brennan and Buchanan 1980).
However, there is a basic difference between the SGT and political economy approaches. When
performing comparative institutional analysis, political economists mostly allow for rent seeking
considerations. Without negating self-interest, the SGT is instead also interested in studying positive
incentives: those incentives that create value by means of trial and error learning, such as those that channel
individual curiosity, initiative, and energy towards the exploration of novel policy solutions (Callander and
Harstad 2015). This “muddling through” (Lindblom 1959) view to policymaking (and to other productive
human action), means that the SGT is closer in spirit to the work of new institutional economists rather than
to that of political economists (Garzarelli and Keeton 2018). The reason is that the new institutionalists allow

JOURNAL OF ECONOMICS AND FINANCE EDUCATION ∙ Volume 18 ∙ Number 1 ∙ Summer 2019
27
for the consideration of both value creation (positive incentives) and rent seeking (negative incentives) when
assessing feasible institutional alternatives (Bates 2014). Most notably, think about the work of Douglass
North and collaborators, which, while owing to (positive) political economy, especially Public Choice,
considers both incentives (North et al. 2009).
The FGT and the SGT therefore originate from different traditions – public finance versus economics of
organization – and have different motivations – knowledge versus (positive and negative) incentives – for
fiscal federalism. So much for differences between the two; what about points of tangency?
Positive Overlap
This question can be answered both positively and normatively. More or less explicitly, a part of the
literature acknowledges the positive tangency point. It is the belief that public sector governance is not just
about mutually exclusive positions. Public governance does not merely regard centralization or
decentralization. Rather, it equally regards all the positions in between, from less to more (de)centralization.
Public governance is a spectrum.
For the FGT, one can trace back the governance spectrum to Oates (1972), and as a result virtually finds
it within the entire theoretical edifice of the FGT. For the SGT, the work of, e.g., Garzarelli (2006) and
Weingast (2009) embeds the spectrum. Other related contributions endogenizing the spectrum are, among
others, Breton (1996), Inman and Rubinfeld (1997), Cooter (2000), and Buchanan (2001, pp. 67-89). Political
economics recognizes the existence of the spectrum as well (e.g., Lockwood 2002; Besley and Coate 2003;
Luelfesmann, et al. 2015). Yet, the majority of the SGT and related work leaves the spectrum exogenous in
practice; more precisely, it considers externalities, but does not sufficiently study grants. This is the major
theme behind the lesson of this article that we will return to when dealing with the normative overlap.
From the perspective of the positive tangency point, then, centralization and decentralization are just two
ideal-typical extremes of a public governance spectrum about the division of labor of fiscal responsibilities
among a state's levels of government. Place full centralization at the right extreme. This is zero fiscal
devolution – just one government at the central level, no local ones. At the left extreme place full
decentralization. This is fully autonomous fiscal devolution; think, as the most extreme case, of governments
belonging to different nation-states. See Figure 1. The two ideal-typical extremes can at times be inclusive.
Think about the dissolution of many European states (Yugoslavia, USSR, etc.) that after the fall of
communism led to new, autonomous states with new forms of governance (even if many of these states were
purportedly politically federal, their governments all practiced economic central planning); or about the
idiosyncratic EU that, from its ongoing process in the opposite direction (from autonomy to increased
centralization), now could be interpreted as lying somewhere within the extremes.
Factually, however, the majority of governance is internal to the extremes. Most economies defining
themselves as unitary in reality fiscally lie inside the extremes, not genuinely coinciding with the right-hand
one (e.g., Breton 2000). For example, France and Japan would be very close to the latter extreme, but Italy
and South Africa less so; while over the years Belgium growingly moved from being close to this extreme to
ever-increasing decentralization. The same holds for federations. Canada and the United States, for instance,
can be considered closer to the left-hand extreme than, say, Switzerland. In short, no matter the de jure public
governance, from a positive viewpoint, de facto, one mainly faces degrees of (de)centralization.
To sum up, the positive tangency point between FGT and SGT considers available governance, namely
the spectrum of Figure 1 as the set of governance ‘equilibria.’ What is not yet clear is if there is also a
normative tangency point between FGT and SGT.
Normative Overlap
The normative tangency point regards the relatively better governance given the available governance
repertoire. That is to say that the basic interest is with the economic policy choice about ‘optimal’ fiscal
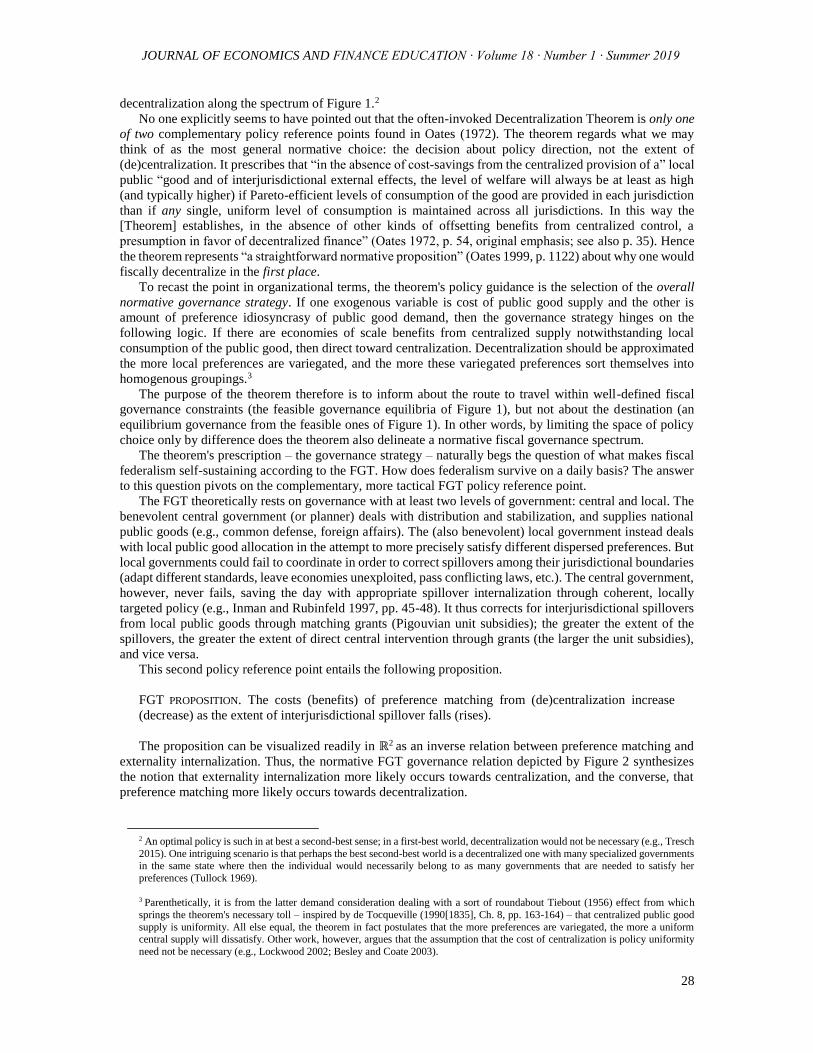
JOURNAL OF ECONOMICS AND FINANCE EDUCATION ∙ Volume 18 ∙ Number 1 ∙ Summer 2019
28
decentralization along the spectrum of Figure 1.2
No one explicitly seems to have pointed out that the often-invoked Decentralization Theorem is only one
of two complementary policy reference points found in Oates (1972). The theorem regards what we may
think of as the most general normative choice: the decision about policy direction, not the extent of
(de)centralization. It prescribes that “in the absence of cost-savings from the centralized provision of a” local
public “good and of interjurisdictional external effects, the level of welfare will always be at least as high
(and typically higher) if Pareto-efficient levels of consumption of the good are provided in each jurisdiction
than if any single, uniform level of consumption is maintained across all jurisdictions. In this way the
[Theorem] establishes, in the absence of other kinds of offsetting benefits from centralized control, a
presumption in favor of decentralized finance” (Oates 1972, p. 54, original emphasis; see also p. 35). Hence
the theorem represents “a straightforward normative proposition” (Oates 1999, p. 1122) about why one would
fiscally decentralize in the first place.
To recast the point in organizational terms, the theorem's policy guidance is the selection of the overall
normative governance strategy. If one exogenous variable is cost of public good supply and the other is
amount of preference idiosyncrasy of public good demand, then the governance strategy hinges on the
following logic. If there are economies of scale benefits from centralized supply notwithstanding local
consumption of the public good, then direct toward centralization. Decentralization should be approximated
the more local preferences are variegated, and the more these variegated preferences sort themselves into
homogenous groupings.3
The purpose of the theorem therefore is to inform about the route to travel within well-defined fiscal
governance constraints (the feasible governance equilibria of Figure 1), but not about the destination (an
equilibrium governance from the feasible ones of Figure 1). In other words, by limiting the space of policy
choice only by difference does the theorem also delineate a normative fiscal governance spectrum.
The theorem's prescription – the governance strategy – naturally begs the question of what makes fiscal
federalism self-sustaining according to the FGT. How does federalism survive on a daily basis? The answer
to this question pivots on the complementary, more tactical FGT policy reference point.
The FGT theoretically rests on governance with at least two levels of government: central and local. The
benevolent central government (or planner) deals with distribution and stabilization, and supplies national
public goods (e.g., common defense, foreign affairs). The (also benevolent) local government instead deals
with local public good allocation in the attempt to more precisely satisfy different dispersed preferences. But
local governments could fail to coordinate in order to correct spillovers among their jurisdictional boundaries
(adapt different standards, leave economies unexploited, pass conflicting laws, etc.). The central government,
however, never fails, saving the day with appropriate spillover internalization through coherent, locally
targeted policy (e.g., Inman and Rubinfeld 1997, pp. 45-48). It thus corrects for interjurisdictional spillovers
from local public goods through matching grants (Pigouvian unit subsidies); the greater the extent of the
spillovers, the greater the extent of direct central intervention through grants (the larger the unit subsidies),
and vice versa.
This second policy reference point entails the following proposition.
FGT PROPOSITION. The costs (benefits) of preference matching from (de)centralization increase
(decrease) as the extent of interjurisdictional spillover falls (rises).
The proposition can be visualized readily in ℝ2 as an inverse relation between preference matching and
externality internalization. Thus, the normative FGT governance relation depicted by Figure 2 synthesizes
the notion that externality internalization more likely occurs towards centralization, and the converse, that
preference matching more likely occurs towards decentralization.
2 An optimal policy is such in at best a second-best sense; in a first-best world, decentralization would not be necessary (e.g., Tresch
2015). One intriguing scenario is that perhaps the best second-best world is a decentralized one with many specialized governments in the same state where then the individual would necessarily belong to as many governments that are needed to satisfy her
preferences (Tullock 1969).
3 Parenthetically, it is from the latter demand consideration dealing with a sort of roundabout Tiebout (1956) effect from which
springs the theorem's necessary toll – inspired by de Tocqueville (1990[1835], Ch. 8, pp. 163-164) – that centralized public good
supply is uniformity. All else equal, the theorem in fact postulates that the more preferences are variegated, the more a uniform central supply will dissatisfy. Other work, however, argues that the assumption that the cost of centralization is policy uniformity
need not be necessary (e.g., Lockwood 2002; Besley and Coate 2003).
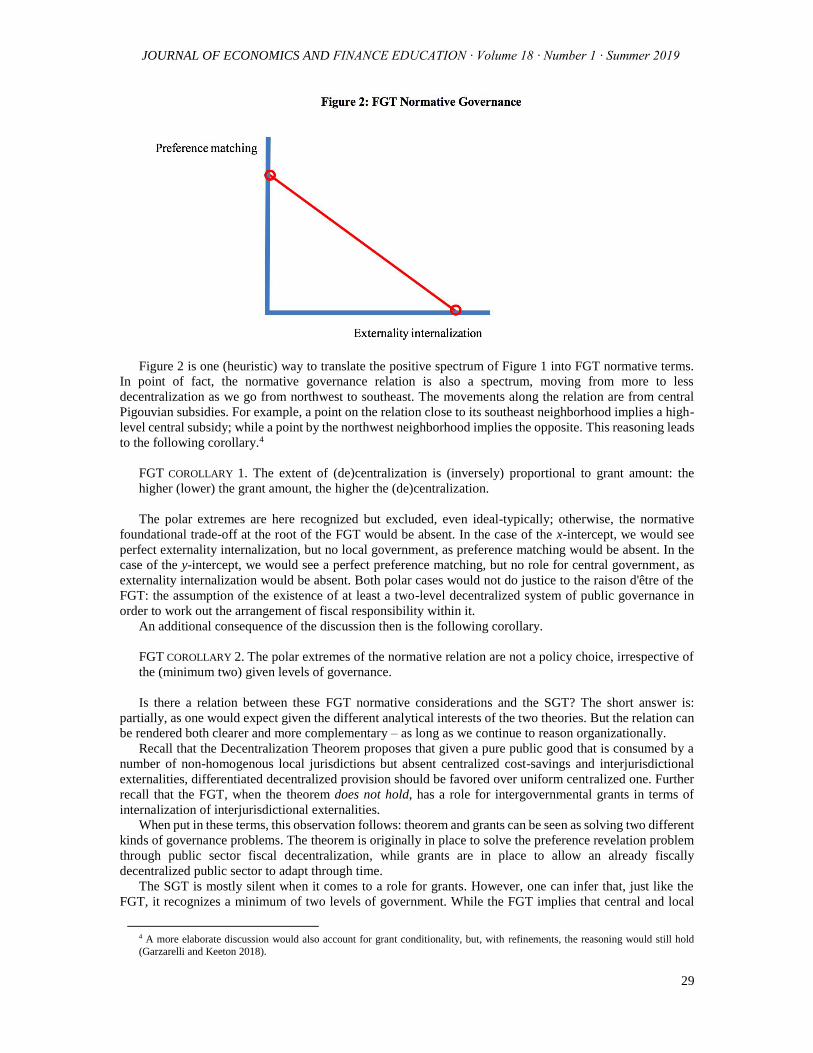
JOURNAL OF ECONOMICS AND FINANCE EDUCATION ∙ Volume 18 ∙ Number 1 ∙ Summer 2019
29
Figure 2 is one (heuristic) way to translate the positive spectrum of Figure 1 into FGT normative terms.
In point of fact, the normative governance relation is also a spectrum, moving from more to less
decentralization as we go from northwest to southeast. The movements along the relation are from central
Pigouvian subsidies. For example, a point on the relation close to its southeast neighborhood implies a high-
level central subsidy; while a point by the northwest neighborhood implies the opposite. This reasoning leads
to the following corollary.4
FGT COROLLARY 1. The extent of (de)centralization is (inversely) proportional to grant amount: the
higher (lower) the grant amount, the higher the (de)centralization.
The polar extremes are here recognized but excluded, even ideal-typically; otherwise, the normative
foundational trade-off at the root of the FGT would be absent. In the case of the x-intercept, we would see
perfect externality internalization, but no local government, as preference matching would be absent. In the
case of the y-intercept, we would see a perfect preference matching, but no role for central government, as
externality internalization would be absent. Both polar cases would not do justice to the raison d'être of the
FGT: the assumption of the existence of at least a two-level decentralized system of public governance in
order to work out the arrangement of fiscal responsibility within it.
An additional consequence of the discussion then is the following corollary.
FGT COROLLARY 2. The polar extremes of the normative relation are not a policy choice, irrespective of
the (minimum two) given levels of governance.
Is there a relation between these FGT normative considerations and the SGT? The short answer is:
partially, as one would expect given the different analytical interests of the two theories. But the relation can
be rendered both clearer and more complementary – as long as we continue to reason organizationally.
Recall that the Decentralization Theorem proposes that given a pure public good that is consumed by a
number of non-homogenous local jurisdictions but absent centralized cost-savings and interjurisdictional
externalities, differentiated decentralized provision should be favored over uniform centralized one. Further
recall that the FGT, when the theorem does not hold, has a role for intergovernmental grants in terms of
internalization of interjurisdictional externalities.
When put in these terms, this observation follows: theorem and grants can be seen as solving two different
kinds of governance problems. The theorem is originally in place to solve the preference revelation problem
through public sector fiscal decentralization, while grants are in place to allow an already fiscally
decentralized public sector to adapt through time.
The SGT is mostly silent when it comes to a role for grants. However, one can infer that, just like the
FGT, it recognizes a minimum of two levels of government. While the FGT implies that central and local
4 A more elaborate discussion would also account for grant conditionality, but, with refinements, the reasoning would still hold
(Garzarelli and Keeton 2018).

JOURNAL OF ECONOMICS AND FINANCE EDUCATION ∙ Volume 18 ∙ Number 1 ∙ Summer 2019
30
government are both benevolent social planners with no organization of relevance, the SGT suggests that
government, no matter the level, is an imperfect organization given human fallibility (political motivations
are often expedient rather than for the public good, policies are muddled through rather than optimized, etc.);
and that is why one should decentralize irrespective of preference revelation (for political accountability, for
policy experiments, etc.). Yet little is said in terms of economics of organization theory once decentralization
is in place.
There are currently just two SGT normative public sector governance equilibria, which are mutually
exclusive; a normative governance spectrum is absent. Figure 3 represents a possible rendering of this
assertion in the same (heuristic) spirit of Figure 2. The dotted line means that, even though externalities are
acknowledged, the corresponding normative governance relation that leads to organizational adaptation
through grants is weakly defined or inexistent. In practice, at present there is only the binary organizational
choice about centralization and decentralization of the public sector, which is indicated by the two filled dots
placed on the axes. The dot on the abscissa stands for complete centralization (in the presence of
interjurisdictional spillovers), while the one on the ordinate stands for complete decentralization (in the
absence of interjurisdictional spillovers).
Figure 3: SGT Normative Governance
We come now to our final proposition, which can be stated from the perspective of both SGT
normative choices.
SGT PROPOSITION. The governance benefits of positive and negative incentive alignment are present
(absent) with complete decentralization (centralization), or, equivalently, the governance benefits of
interjurisdictional spillover internalization are present (absent) with complete centralization
(decentralization).
Therefore, the SGT normative governance trade-off – differently from the FGT one – is at present one of
kind, rather than of degree. This difference originates mostly because the two theories focus on two different
governance phases of fiscal federalism. The two phases are not organizationally incompatible. Quite the
opposite is the case. As will be clear before long, they have yet to be considered in tandem. It is up to the
SGT to pick up the challenge.
Heuristic (Added) Value: A Research Path
The research lesson learned from teaching – that the SGT needs a more explicit treatment of grants –
should not be accompanied by negative undertones. Recall in fact that the SGT is still an emerging research
program. This means that it can easily accommodate a variety of research issues. By way of a conclusion, we
shall delineate the organizational contours of a research issue more directly related to our lesson; refer to
Garzarelli (2018) for an elaboration.
Externality internalization
Incentive alignment
(positive & negative)

JOURNAL OF ECONOMICS AND FINANCE EDUCATION ∙ Volume 18 ∙ Number 1 ∙ Summer 2019
31
At its most elemental, as pointed out earlier, one can think of the problem of economic organization as
being composed of two phases: first, the fixed cost of designing an organization, and, second, the variable
costs of keeping an organization afloat. In our more specific context, the first phase can be likened to the so-
called assignment problem of fiscal federalism. In this phase, one tries to determine which level of
government should do what in terms of Musgrave's three functions of allocation, distribution, and
stabilization. The typical outcome is that local governments should deal with allocation and central
government with distribution and stabilization. Though the outcome is most often justified, even implicitly,
in terms of the FGT motivation, the SGT motivation is not incompatible with it, and in fact can be seen as
being complementary: the organizational nuance that the SGT introduces is that this first phase can be
interpreted as dealing with the assignment of property rights over different types of policies to different levels
of government. That is to say that, to borrow an expression from political science, we can think of this first
phase as being about constitutional engineering.
By determining what level of government is responsible for what in terms of most general property rights
to policy, the first phase effectively also gives legitimacy to the second. For example, the property rights to
locally or centrally provided health care, education standards, environmental management, and the like
commonly also fall within the first phase. But the details about how to design the relevant policy agencies
(to stick to our example, the health, education, and environmental ministries) are left for the second, post-
constitutional phase. The same holds for the more specific rights tied to day-to-day organizational adaptation,
namely rights to policy design are also left over or, if you like, emerge by difference as needed. For instance,
in the presence of a poorer municipality (a negative externality), we know from the first phase that the central
government would usually hold the property rights to disburse an equalization grant to try to level the supply
of public goods among all municipalities. But the design of the grant formula, a specific right that is often
effectively in the domain of intergovernmental fiscal relations, is a second phase matter. The point to
underscore is that the variable costs attached to these and similar survival practices should be the bread and
butter of an organizational approach to fiscal federalism as well.
How can one go about considering both fixed and variable costs from a SGT perspective? One way to
bridge the analysis of these fixed and variable costs through the economics of organization is to reason
according to transactions (Breton and Scott 1978). Transaction costs and property rights are, after all, two
faces of the same coin – they cannot be meaningfully separated. Just like in “the world of Robinson Crusoe
property rights play no role” (Demsetz 1967, p. 347), so transaction costs “must be defined to be all the costs
which do not exist in a Robinson Crusoe economy” (Cheung 1998, p. 515). Moreover, it can be convincingly
argued that the original governance approach of Coase (1937), from which virtually all modern theories of
economic organization spring, embeds both fixed and variable transaction-cost analysis (e.g., Allen 2000).
The upshot is that the SGT scholar would not need to reinvent the wheel to begin exploring the two
organizational phases of a decentralized public sector. One nontrivial research issue would be to explore in
SGT terms the received FGT notion that when there is a local interjurisdictional externality, the central
government must perform internalization – i.e., the question of whether it is necessarily the case that central
government is the only organization with property rights to externality internalization. If one performs
comparative (variable) transaction-cost analysis in the second phase, then it may be that in some cases top-
down vertical internalization may be more costly than horizontal, autonomous intervention; a result favoring
the attribution of property rights to externality internalization to one of the local governments that are directly
involved. In terms of Figure 3, this would mean that the spectrum would become populated not just, as mainly
implied currently, for reasons of top-down vertical internalization, but for reasons of horizontal and bottom-
up vertical internalization as well. Clearly, the outcome of the comparative calculus determining the nature
of internalization would also be influenced by how the federal structure is designed in the first phase, which
is also an issue involving transaction cost considerations, albeit of the fixed type.
Take note that this is not synonymous with the naïve position advocating outright a sort of Coase Theorem
equivalence principle for the public sector, such as the so-called Federal Coase Theorem (correctly) critiqued
by Cooter and Siegel (2010). The position being advocated here is more sophisticated. It is informing us that
the first phase of design is as fundamental as the second phase of adaptation, namely that, to be a progressive
research program, the SGT needs Coase (1937) as much as Oates (1972) and Coase (1960).

JOURNAL OF ECONOMICS AND FINANCE EDUCATION ∙ Volume 18 ∙ Number 1 ∙ Summer 2019
32
References
Allen, Douglas W. 2000. “Transaction Costs.” In The Encyclopedia of Law and Economics, Volume 1, edited
by Boudewijn Bouckaert and Gerrit De Geest. Cheltenham: Edward Elgar.
Bates, Robert. 2014. “The New Institutionalism.” In Institutions, Property Rights, and Economic Growth:
The Legacy of Douglass North, edited by Sebastian Galiani and Itai Sened. New York: Cambridge University
Press.
Besley, Timothy, and Stephen Coate. 2003. “Central versus Local Provision of Public Goods: A Political
Economy Analysis.” Journal of Public Economics 87: 2611-2637.
Brennan, Geoffrey, and James M. Buchanan. 1980. The Power to Tax: Analytical Foundations of a Fiscal
Constitution. New York: Cambridge University Press.
Breton, Albert. 1996. Competitive Governments: An Economic Theory of Politics and Public Finance. New
York: Cambridge University Press.
Breton, Albert. 2000. “Federalism and Decentralization: Ownership Rights and the Superiority of
Federalism.” Publius 30: 1-16.
Breton, Albert, and Anthony Scott 1978. The Economic Constitution of Federal States. Toronto: University
of Toronto Press.
Buchanan, James M. 2001. Federalism, Liberty, and the Law. Volume 18 of The Collected Works of James
M. Buchanan. Indianapolis: Liberty Fund.
Callander, Steven, and Bård Harstad. 2015. “Experimentation in Federal Systems.” Quarterly Journal of
Economics 130: 951-1002.
Cheung, Steven N. S. 1998. “The Transaction Cost Paradigm.” Economic Inquiry 36: 514-521.
Coase, Ronald H. 1937. “The Nature of the Firm.” Economica 4: 386-405.
Coase, Ronald H. 1960. “The Problem of Social Cost.” Journal of Law and Economics 3: 1-44.
Cooter, Robert D. 2000. The Strategic Constitution. Princeton: Princeton University Press.
Cooter, Robert D., and Neil S. Siegel. 2010. “Collective Action Federalism: A General Theory of Article I,
Section 8.” Stanford Law Review 63: 115-185.
Demsetz, Harold. 1967. “Toward a Theory of Property Rights.” American Economic Review 57: 347-359.
De Witte, Kristof, Nicky Rogge, Laurens Cherchye, and Tom Van Puyenbroeck. 2013. “Economies of Scope
in Research and Teaching: A Non-parametric Investigation.” Omega 41: 305-314.
Garzarelli, Giampaolo. 2006. “Cognition, Incentives, and Public Governance: Laboratory Federalism from
the Organizational Viewpoint.” Public Finance Review 34: 235-257.
Garzarelli, Giampaolo. 2018. “Internal Organization in a Public Theory of the Firm: Toward a Coase-Oates
Federalism Nexus.” International Tax Law Review 1: 79-106.
Garzarelli, Giampaolo, and Lyndal Keeton. 2018. “Laboratory Federalism and Intergovernmental Grants.”
Journal of Institutional Economics 14: 949-974.

JOURNAL OF ECONOMICS AND FINANCE EDUCATION ∙ Volume 18 ∙ Number 1 ∙ Summer 2019
33
Gibbons, Robert, and Roberts, John (eds). 2013. The Handbook of Organizational Economics. Princeton, NJ:
Princeton University Press.
Inman, Robert P., and Daniel L. Rubinfeld. 1997. “Rethinking Federalism.” Journal of Economic
Perspectives 11: 43-64.
Lindblom, Charles E. 1959. “The Science of ‘Muddling Through’.” Public Administration Review 19: 79-
88.
Lockwood, Ben. 2002. “Distributive Politics and the Costs of Centralization.” Review of Economic Studies
69: 313-337.
Luelfesmann, Christoph, Anke Kessler, and Gordon M. Myers. 2015. “The Architecture of Federations:
Constitutions, Bargaining, and Moral Hazard.” Journal of Public Economics 124: 18-29.
North, Douglass C., John Joseph Wallis, and Barry R. Weingast. 2009. Violence and Social Orders: A
Conceptual Framework for Interpreting Recorded Human History. New York: Cambridge University Press.
Oates, Wallace E. 1972. Fiscal Federalism. New York: Harcourt Brace Jovanovich, Inc.
Oates, Wallace E. 1999. “An Essay on Fiscal Federalism.” Journal of Economic Literature 37: 1120-1149.
Oates, Wallace E. 2005. “Toward a Second-generation Theory of Fiscal Federalism.” International Tax and
Public Finance 12: 349-373.
Oates, Wallace E. 2008. “On the Evolution of Fiscal Federalism: Theory and Institutions.” National Tax
Journal 16: 313-334.
Oates, Wallace E. 2011. “On the Development of the Theory of Fiscal Federalism: An Essay in the History
of (Recent) Economic Thought.” Journal of Public Finance and Public Choice 29: 3-24.
Qian, Yingyi, and Barry R. Weingast. 1997. “Federalism as a Commitment to Preserving Market Incentives.”
Journal of Economic Perspectives 11: 83-92.
Rodden, Jonathan A., Gunnar S. Eskeland, and Jennie Litvack (eds). 2003. Fiscal Decentralization and the
Challenge of Hard Budget Constraints. Cambridge, Massachusetts: MIT Press.
Seabright, Paul. 1996. “Accountability and Decentralisation in Government: An Incomplete Contracts
Model.” European Economic Review 40: 61-89.
Tiebout, Charles M. 1956. “A Pure Theory of Local Expenditures.” Journal of Political Economy 64: 416-
24.
Tocqueville, Alexis de. 1990. Democracy in America, Volume I (with a “New Introduction” by Daniel J.
Boorstin). New York: Vintage Classics. First published 1835.
Tommasi, Mariano, and Federico Weinschelbaum. 2007. “Centralization vs. Decentralization: A Principal-
Agent Analysis.” Journal of Public Economic Theory 9: 369-389.
Tresch, Richard W. 2015. Public Finance: A Normative Theory (Third Ed). London: Academic Press.
Tullock, Gordon. 1969. “Federalism: Problems of Scale.” Public Choice 6: 19-29.
Weingast, Barry R. 2009. “Second Generation Fiscal Federalism: The Implications of Fiscal Incentives.”
Journal of Urban Economics 65: 279-293.

JOURNAL OF ECONOMICS AND FINANCE EDUCATION ∙ Volume 18 ∙ Number 1 ∙ Summer 2019
34
Adam Ruins Everything, Except Economics
Jadrian Wooten and James Tierney1
ABSTRACT
Adam Ruins Everything is a self-proclaimed “half-hour informational
comedy show” that appears on truTV. The main goal of the show is to
take topics and discuss how they are not as great as one might expect;
for example, gift giving. In doing this, Adam Ruins Everything touches
on many economics topics that are relevant to introductory-level
courses. This paper provides a comprehensive analysis of the television
show Adam Ruins Everything to aid instructors interested in adopting
television clips into the classroom.
Introduction
Over the past decade, resources have been developed to make the economics classroom more engaging
with research and tools developed around music, movies, television shows, and sports. The end goal of
most projects is to increase students’ understanding and interest in the material. While these resources are
available for implementation, faculty are not necessarily willing to abandon traditional lectures in favor of
these new approaches (Goffe and Kauper 2014). Using data from an ASSA conference, researchers found
that around two-thirds of faculty continue to deliver a standard lecture either because they felt it was the
best method or because it was cost-effective. One fear of adapting new teaching methods was that the time
spent preparing new delivery techniques could be best utilized elsewhere. By providing an episode-by-
episode breakdown of the major economics topics covered, the resources outlined in this paper may
alleviate some of the hesitation of devoting time to implementing additional media into the classroom.
This article provides a comprehensive analysis of the television show Adam Ruins Everything to aid
instructors interested in adopting television clips in the classroom. Adam Ruins Everything debuted in
September 2015 on truTV as a self-proclaimed “half-hour informational comedy show” (Conover et al.
2016). The original concept for the show was based on a web series by host Adam Conover and
CollegeHumor. While Adam is the main host of the show, each episode includes guest appearances by
actual researchers, scientists, professors, and even economists.2 Character actors on the show portray
Adam’s friends, friends of friends, partners, and siblings.
The show has two overarching features that make it an interesting application for the economics
classroom. Whether the goal is to introduce new topics or connect material across topics, Adam Ruins
Everything serves as a bridge that brings “real life” economics into the classroom in short segments. First,
each 22-minute episode is typically broken into three major segments that cover a commonly-held
misconception that the host, Adam Conover, tries to debunk. Many of these segments are available on
YouTube via the show’s original producer, CollegeHumor, or its current television host, truTV. Starting in
2018, Adam Ruins Everything has been picked up selectively by Netflix,3 while all episodes are available
for purchase on Amazon, iTunes, and Google Play Store. An instructor would most likely use a segment,
not the entire episode, to teach a lesson. The second benefit of using Adam Ruins Everything is the level of
research that goes into an episode. While presented as an informational comedy show, the writers provide
1 Jadrian Wooten: Department of Economics, The Pennsylvania University, 319 Kern Graduate Building, University Park, PA
16802, [email protected]. James Tierney: Department of Economics, The Pennsylvania University, 315 Kern Graduate Building, University Park, PA 16802, [email protected].
2 Donald Shoup appears in episode 3: “Adam Ruins Cars” to discuss the economics of parking, Joel Waldfogel appears in episode 25: “Adam Ruins Christmas” to discuss the inefficiency of gift giving, Allison Schrager appears in episode 31: “Adam Ruins Art”
to discuss art markets and auction houses, Penelope Prime appears in episode 37: “Adam Ruins the Economy” to discuss
American manufacturing, and Teresa Ghilarducci appears in episode 42: “Adam Ruins the Future” to discuss retirement accounts. 3 https://www.adamconover.net/adam-ruins-everything-on-netflix/.

JOURNAL OF ECONOMICS AND FINANCE EDUCATION ∙ Volume 18 ∙ Number 1 ∙ Summer 2019
35
on-screen citations for various claims made in each episode, which are available on the show’s website.4
Sources for each episode include a wide range of media including podcasts, government reports, peer-
reviewed publications, magazine pieces, and news articles. Each episode also has citations for additional
reading on topics that viewers may be interested in exploring. This allows instructors to show clips, but also
follow-up by assigning additional reading.
We begin with a brief summary of the use of television shows in engaging students in the classroom,
then provide background information on the show and discuss some of our favorite ways to implement
media in the classroom. We then present four episodes from the show that detail a significant economic
concept often taught in principles of economics courses along with a teaching tip.
Literature Review
At the turn of the millennium, Becker (2001) argued in The Chronicle of Higher Education that the
economics curriculum needed to be overhauled because it was not appealing to the modal undergraduate
student. He cited drops in the number of undergraduate economics degrees awarded as proof of a lack of
student interest in the subject. Following a round of criticism by a set of highly-respected economics
educators (Hamilton 2003; McMillin 2003; Hoyt 2003; Siegfried and Sanderson 2003; Watts 2003), Becker
(2004) provided additional feedback about tailoring the economics curriculum to what he feels should be
taught. The bulk of criticism against Becker’s initial commentary focused on how instructors could work to
improve their teaching and questioned whether instructors should be concerned about whether their field
was “sexy” or not. A resonating point came in Hoyt’s (2003) analysis that the “chalk-and-talk” method
prevails because economists infer the benefits of changing their styles do not outweigh the costs associated
with investing in new teaching tools, which is a sentiment echoed by Goffe and Kauper (2014) a decade
later. However, other disciplines in the STEM field have embraced active learning techniques to enhance
their lectures (Sax et al. 1999) even as economics has continued to resist.
Since the debate during the early 2000s, publications in economics education have focused on utilizing
technology in lesson planning to improve content retention and interest. Whether it’s a one-minute paper
(Stead 2005), personal response systems (Elliot 2003), or a variety of alternative teaching methods (Becker
et al. 2006), economics educators have spent a considerable amount of time developing resources to
enhance the profession. It is not possible to determine whether the increased focus on developing resources
has been the cause or the result of faculty using more alternative teaching methods since the mid-1990s.
The median time devoted by faculty to teaching with traditional lectures has not changed from 1995 to
2010, but the average time spent lecturing has decreased by 8 percentage points. The median time spent
teaching with media (films, movie clips, or DVDs) increased from no time at all in 1995 to 6% of the time
in 2010. While the use of alternative teaching methods has moved in favor of alternative methods, the
production of resources by researchers has also greatly expanded over the same time period (Watts and
Schaur 2011).
The practice of using television clips in the classroom has boomed over the past few years, with clips
directed at specific television shows like Modern Family (Wooten et al. 2020), The Simpsons (Luccasen
and Thomas 2010; Hall 2014), Seinfeld (Ghent et al. 2011), The Big Bang Theory (Tierney et al. 2016;
Geerling et al. 2018), The Colbert Report (Randolph 2016), The Office (Kuester et al. 2014; Kuester and
Mateer 2018), Parks and Recreation (Conaway and Clark 2015; Wooten and Staub 2019), Shark Tank
(Patel et al. 2015), and South Park (Hoffer and Crowley 2015). While there is value in using segmented
clips to introduce or reinforce a particular concept, some of the value of the analysis may be lost when
students miss backstories. Also, with traditional TV shows or movies, the actual concept may not be
discussed, making it more difficult for instructors to connect the clip with the concept. On the other hand,
many of the Adam Ruins Everything clips we discuss in this paper use the exact terminology used in
common economics textbook while still presenting the material in an entertaining fashion. For example, in
the episode “Adam Ruins Malls” (Conover et al. 2016), which is outlined in more detail below, Adam and
Emily explicitly discuss the market power that Luxottica holds in the market for glasses and sunglasses:
EMILY: “80% of glasses and sunglasses brands are controlled by a single company,
Luxottica.”
4 http://www.trutv.com/shows/adam-ruins-everything/blog/adams-sources/index.html

JOURNAL OF ECONOMICS AND FINANCE EDUCATION ∙ Volume 18 ∙ Number 1 ∙ Summer 2019
36
ADAM: “But that would give them a virtual monopoly over the entire industry.”
EMILY: “Bingo. And because they control the luxury brands and the cheap brands,
they can charge whatever they want for either.”
EMILY: “Luxottica uses that power to drive up the prices for everybody, sometimes
charging as much as twenty times what they cost to produce.”
While Emily’s statement is not entirely accurate since monopolists cannot charge whatever they want, this
quote gives instructors an opportunity to pose the issue to their students and have them respond with the
correct process for monopolists selecting the price. Later in the same segment, the character representing
Luxottica’s CEO provides a more appropriate interpretation of monopoly pricing, quoting the actual CEO
in that, “Everything is worth what people are ready to pay” (CBS News, 2014). This allows instructors to
reference the process of monopolists selecting output based on marginal revenue and marginal cost, but
using the demand curve to select the price since demand represents what people are willing and able to pay.
In addition, relatively few projects have taken full episodes and applied “big picture” topics or used
entire shows to teach lessons. The most recent exception is Al-Bahrani and Patel’s (2015) examination of
economics themes in ESPN’s popular 30-for-30 series of sports-centric documentaries. In The Episodes,
Concepts, and Clips section of the paper we dive deeper into four particular episodes. Tables 1, 2, and 3 in
the appendix outline each episode on a segment level and list the key relevant economic concepts. Table 4
sorts the list of episodes based on concepts that an instructor may be interested in covering.
While the literature on active learning and the use of videos in the classroom is sparse in economics, it
has been shown that active learning increases student performance in science, engineering, and
mathematics (Freeman et al. 2014). This comes as no surprise, as cognitive psychologists have formalized
the concept of scaffolding, where you must build a structure of existing knowledge to hold more complex
concepts (Van de Pol et al. 2010). We believe that the use of videos in the classroom that are already
familiar to the students help in the scaffolding process and make the learning process more active than
basic chalk and talk.
Pedagogical Approach
For shorter clips, like those found on show-specific websites or clip agglomerators (Mateer 2012;
Wooten 2018), playing the clip in the middle of the class could serve to break monotony of a traditional
lecture. Short clips could be used to segue between topics, move from theory to application, or preview an
upcoming lesson. The authors routinely use shorter clips in a variety of ways to keep the use of clips from
becoming repetitive. With Adam Ruins Everything, truTV has aided in the utilization of its shows by
providing particular segments of each episode based on the topic covered in the clip. For example, in the
episode “Adam Ruins Malls,” the segments cover the history of malls and outlet malls, the regulation of
nutritional supplements, and the market for glasses. On YouTube, truTV provides these three segments as
separate videos that instructors can assign instead of assigning the entire episode.
Using media in the classroom is truly dependent on the instructor’s comfort level, but does require some
lead time regardless of familiarity with mode of instruction. Depending on the type of assessment, various
lead times may be required of the instructor. Because the episodes contained here are comedy-based, it is
important to establish the legitimacy of their analysis in an early section. This may be especially true for
certain students (international students particularly) who are not familiar with satirical work. Before
showing any clip, instructors must understand how the piece fits in their overall lesson and whether humor
is an appropriate medium for discussing the topic at hand. Alderman and Popke (2002) used Michael
Moore's TV Nation to introduce humor and film into a geography classroom in an attempt to have students
answer broader questions. This springboard approach allows instructors to open with a series of clips from
a common source over a topic interesting to students and then segue into a more thoughtful analysis in the
classroom.
A creative end-of-semester assessment could involve having students research and “ruin” a commonly
held notion around a particular topic. Students could work alone or in teams to form a central theme to their
segments and then present their results using similar sources from the videos. Integrating active learning
components into the classroom can take many forms (Al-Bahrani et al. 2016), and having students research

JOURNAL OF ECONOMICS AND FINANCE EDUCATION ∙ Volume 18 ∙ Number 1 ∙ Summer 2019
37
topics they find interesting and match the style delivered in these clips could help build a type of
summative assessment.
The Episodes, Concepts, and Clips
The following episodes contain a few of the authors’ favorite segments for teaching principles-level
courses. We include a description of the overall story in the episode to give the reader a background, the
topics and concepts covered, and one tip on how this concept could be used to engage students. In total, we
have identified concepts for each of the show’s episodes through the third season. Each show’s topics are
covered in Tables 1, 2, and 3 in the appendix.
Episode: “Adam Ruins Restaurants” (2015)
Veronica, Haylie, and Emily are eating at a nice restaurant, but before the bill is settled, Adam discusses
the custom of tipping in the United States. He covers the history of tipping and wonders why the custom
has persisted. The tipping portion of the episodes ends with the owner of California-based Brand 158
restaurant talking about its no-tipping policy. The second segment of the episode revolves around the
decision of choosing an appropriate alcoholic beverage for dinner, specifically wine, and includes a
discussion on the inability of ‘wine experts’ to tell the difference between certain wines. The last segment
of the episode explores fish offerings at restaurants. Adam describes to the group the appropriate color of
salmon, the mislabeling of fish, and the practice of renaming fish. The episode ends with Adam talking
about the history of restaurants and how people can make their experience more enjoyable.
Concept: Wage Discrimination (4:25 - 4:55)
In the first segment of this episode, Adam covers the equity issue inherent in the United States’ custom
of tipping. One of the arguments in favor of tipping is that it serves as an incentive mechanism for
improved performance, but Adam debunks that myth with the work of Lynn (2000), which showed that
tipping was often random and great service was often rewarded with at most a 1% increase in the total tip
amount. A follow-up issue presented is that tipping can lead to wage discrimination. Adam cites Brewster
and Lynn (2014), which showed black servers were tipped less than their white co-workers regardless of
the customer’s race.
Teaching Tip: Pre- & Post-Clip Discussion
It is likely every student has encountered the experience of tipping. Most students have been in the role
of deciding on how much to tip, but some students have worked as servers receiving tips. This personal
experience should create an engaging discussion. When teaching about wage discrimination in the labor
portion of a class, or when discussing unintended consequences, asking the question “Should tipping be
illegal?” will certainly create discussion in the classroom. Once that discussion has finished, show this clip
and reengage the students. After learning of the evidence presented in Brewster and Lynn (2014), and
knowing wage discrimination is illegal, students should now be able to articulate why some believe tipping
itself should also be considered illegal. The study, and concept, was also covered in a Freakonomics
podcast (Lechtenberg 2013), which can be assigned as a post-class review of the material.
Concept: Overfishing and the Tragedy of the Commons (15:53 - 17:35)
Many students learn about the tragedy of the commons and overfishing in introductory microeconomics
classes. This segment gives a real-life example of the negative consequences associated with overfishing.
Adam explains how companies can legally decide to rename “trash fish” varieties in order to make them
sound more appetizing. The reason this practice is so common is due to the tragedy of the commons and
overfishing, concepts which are explicitly stated in the segment. Popular species of fish become depleted
over time which forces restaurants to serve some fish that may not have previously been considered
appetizing. As a final point, Adam’s actual father, David Conover, a marine biologist at Stony Brook
University, discusses the extent of overfishing by providing various statistics and ways viewers can help
curb the overfishing problem.
Teaching Tip: Think-Pair-Share
Whether the clip is required as a pre-lecture assignment or is shown in class, a simple Think-Pair-Share
JOURNAL OF ECONOMICS AND FINANCE EDUCATION ∙ Volume 18 ∙ Number 1 ∙ Summer 2019
38
activity (Lyman 1987) can help make the concept stick with students. Students can be asked to name other
examples of common resources they have seen victimized by the tragedy of the commons in their day-to-
day lives. Responses will typically include examples like shared living spaces in their apartments or air
pollution from cars on campus. Rao and DiCarlo (2010) note that peer instruction of this type that allows
students to discuss what they’re learning in relation to their past experiences helps students apply the
material to their daily lives.
Episode: “Adam Ruins Malls” (2016)
Adam and Emily take a trip to their local mall to purchase some items for Emily’s upcoming
honeymoon, while Adam seeks a new pair of glasses. The first segment covers the history of malls and the
marketing strategy of outlet malls; it focuses on how stores differentiate their own products by offering
higher-priced items in their primary locations while selling a lower-quality version at their outlet stores.
There is a short segment on the regulatory history of the supplements industry and how it differs from
pharmaceutical regulation. The third segment of the episode has Emily explaining to Adam the breakdown
of the eyeglasses and vision insurance industry.
Concept: Monopoly Power (13:45 - 18:30)
In the last segment of the episode, Adam learns about the monopoly power of Luxottica. Through
vertical integration, Luxottica controls the majority of designs, manufacturing centers, distribution
channels, and retail operations in the market. Luxottica also manages the second largest vision insurance
company in the United States (Goodman 2014). Whether students are in the market for Oakleys or Ray-
Bans, they are buying Luxottica glasses. If students expect to find competitive prices by shopping at
LensCrafters instead of Sunglass Hut, they are still buying their glasses from a Luxottica-owned store. This
market may be especially poignant for students who are in the market for prescription eyeglasses or
designer sunglasses and would be more noticeable than traditional markets like De Beers’ power in the
diamond industry or OPEC’s control over the oil industry, which are examples used in many principles
texts.
Teaching Tip: Pre-Lecture Viewing
One way to prepare students for lecture is to require work before attending. We suggest using this
segment as a pre-lecture assignment. In this segment, Adam explicitly states that Luxottica has a “virtual
monopoly” in the industry and talks about how limited competition affects prices of products. By assigning
this as a pre-lecture viewing, students will have been exposed to critical vocabulary before entering the
classroom. Using a student response system (clicker) or through a learning management system, instructors
can administer a short quiz to ensure students have watched the video before class.
Episode: “Adam Ruins the Economy” (2017)
Adam visits his friend Hank, a recently laid-off factory worker who is in the middle of filing taxes. In
the first segment of the show, Adam explains the concept of the return-free filing system, where the
government would complete a worker’s tax return and then send the results to the worker. This system
would allow workers to save time that is normally spent with tax forms or tax filing software. In the second
segment, Adam and Hank discuss popular measures of the strength of an economy including the Dow Jones
Industrial Average, the unemployment rate, and gross domestic product. The last segment of the episode
discusses the history of manufacturing employment in the United States.
Concept: Rent Seeking (2:02 - 5:20)
In the opening segment, Adam presents the incentives of tax-filing software companies like TurboTax
and H&R Block who lobby to ensure the tax return system is complicated enough that consumers will need
to purchase software to complete their returns. While offering a free version for two-thirds of Americans,
many more opt-in to the system because it makes filing a bit easier. Tax software companies lobby
Congress to ensure a return-free filing system never becomes implemented for fear of losing market power.
Teaching Tip: Combine with a classroom game
Goeree and Holt (1999) argue that using classroom exercises alongside lecture and textbook reading has

JOURNAL OF ECONOMICS AND FINANCE EDUCATION ∙ Volume 18 ∙ Number 1 ∙ Summer 2019
39
the potential to increase interest about economic theory while simultaneously decreasing some of the
skepticism around its application. The authors propose a simple classroom exercise which shows how rent
seeking leads to inefficiencies. This clip can be used in conjunction with the Goeree and Holt (1999) in-
class experiment to connect economic theory to real-life applications that students will encounter at some
point if they had not already.
Concept: Unemployment (8:20 - 10:00)
In the second segment, Adam and Hank discuss what it takes to be officially classified as unemployed.
While the show presents the unemployment rate (U-3) as a flawed number, it is careful to mention that the
unemployment rate does not include many individuals that others might consider unemployed. For
example, Hank drives for Uber a few nights per week, which disqualifies him from being classified as
unemployed, but results in his actually being considered underemployed. Two other individuals in the
episode are disqualified because they would be considered discouraged workers or because they earned just
enough to be classified as employed.
Teaching Tip: Pre- & Post-Clip Clicker Question
Studies have shown the use of student response systems (clickers) enhance student engagement and
learning outcomes (Mula and Kavanagh 2009; Premuroso et al. 2011). These systems provide immediate
feedback for both the students and the instructor. For this concept, we suggest conducting a pre- and post-
clip clicker question to gauge student understanding of the requirements to be classified as unemployed by
the Bureau of Labor Statistics. Before showing the clip or beginning a discussion on the topic, survey the
students on whether they believe they are unemployed:
“According to the economic definition, are you considered officially unemployed?”
A. Yes
B. No
C. Unsure
Record these percentages and show the clip from “Adam Ruins the Economy.” After the clip finishes, but
before beginning the discussion, re-poll the class with the exact same question. Responses will likely shift
toward a more accurate response and hopefully lead to a healthy discussion on who is officially considered
unemployed. This clip is a useful starting point because many students consider themselves unemployed
despite the fact that they are not actively searching for a job as full-time students.
Episode: “Adam Ruins the Future” (2017)
The episode starts with Adam struggling to evaluate his relationship with his girlfriend, Melinda. His
struggle focusses on where their relationship is going and segues into a theme of “the future” for the entire
episode. The first segment of the show covers food expiration dates from a public policy standpoint and
how firms benefit from this state-driven regulation. The second segment of the show covers retirement
accounts and a lack of American savings. The episode ends with Melinda trying to convince Adam that he
cannot predict the future despite how many research papers he reads or how hard he tries to control his life.
This episode can also be used as an introduction for a personal finance course or used to discuss the role of
government in retirement savings plans.
Concept: Retirement Accounts and Savings (7:15 - 11:35)
In the second segment of the episode, Adam explains to Melinda about the riskiness associated with
401k retirement accounts. He explains how companies’ changing from pensions to 401k accounts,
especially in the 1990s, were an attempt to provide workers an incentive to save their own money. This
segment of the episode can be used in a principles of finance course as a primer on different types of
retirement accounts. In the second segment, Adam covers the volatility of selecting stocks by focusing on
the dot-com bubble of the late 1990s and then on the 2008 financial crisis. This segment ends with a
discussion by labor economist Teresa Ghilarducci on how 401k accounts should not be the only method of
retirement savings. This portion of the clip can be used to discuss diversification strategies and the
importance of portfolio management.
JOURNAL OF ECONOMICS AND FINANCE EDUCATION ∙ Volume 18 ∙ Number 1 ∙ Summer 2019
40
Teaching Tip: End-of-Class Minute Paper
A “minute paper” is typically defined as a short in-class writing assignment in response to an instructor-
prompted question. The goal of these papers is to have students reflect on the class’s material or provide
instructors with some meaningful feedback. Given that the concepts of retirement accounts and investment
strategies are foreign to many principles students, this section provides a unique opportunity to elicit
student’s perception of the relevance to the topic. Questions could include:
What idea(s) struck you as most relevant that you could or should put into practice today?
For you, what questions still remain unanswered about today’s discussion?
What was the most surprising and/or unexpected idea covered in today’s lecture?
These types of questions not only have students reflect on the material covered, but also provide
valuable insight to the instructor regarding which concepts could be covered better in future lessons. This
assessment can provide a meaningful sense of closure to the topics covered that day.
Conclusion
Instructors have slowly begun adopting various teaching methods in their classrooms in order to
improve content retention and understanding. While it is important for instructors to feel comfortable with
the material they have selected to present to their classes, connections to “real world” economics can have a
lasting impact on students. The topics presented throughout Adam Ruins Everything provide a basis for
analysis for students because of the familiarity of the examples, the commonality of the misconception, and
the humor utilized in the show.
References
Al-Bahrani, Abdullah, Kim Holder, Darshak Patel, and Jadrian Wooten. 2016. “Art of Econ: Incorporating
the Arts Through Active Learning Assignments in Principles Courses.” Journal of Economics and Finance
Education 15: 1-16.
Al‐Bahrani, Abdullah, and Darshak Patel. 2015. “Using ESPN 30 for 30 to Teach Economics.” Southern
Economic Journal 81: 829-842.
Alderman, Derek H., and E. Jeffry Popke. 2002. “Humor and Film in the Geography Classroom: Learning
from Michael Moore's TV Nation.” Journal of Geography 101: 228-239.
Becker, William E. 2001. “How to Make Economics the Sexy Social Science.” The Chronicle of Higher
Education, December 7. https://www.chronicle.com/article/How-to-Make-Economics-the-Sexy/25119.
Becker, William E. 2004. “Economics for a Higher Education.” International Review of Economics
Education 3: 52-62.
Becker, William E., Michael Watts, and Suzanne R. Becker (Eds.). 2006. Teaching Economics: More
Alternatives to Chalk and Talk. Northampton, MA: Edward Elgar Publishing.
Brewster, Zachary W., and Michael Lynn. 2014. “Black–White Earnings Gap Among Restaurant Servers:
A Replication, Extension, and Exploration of Consumer Racial Discrimination in Tipping.” Sociological
Inquiry 84: 545-569.
CBS News. 2014. “Sticker Shock: Why Are Glasses So Expensive?” June 15.
https://www.cbsnews.com/news/luxottica-eyewear-why-are-glasses-expensive/.
Conaway, L. Brooke, and Christopher Clark. 2015. "Swansonomics: Using ‘Parks And Recreation’ to
Teach Economics." Journal of Economics and Finance Education 14: 41-68.
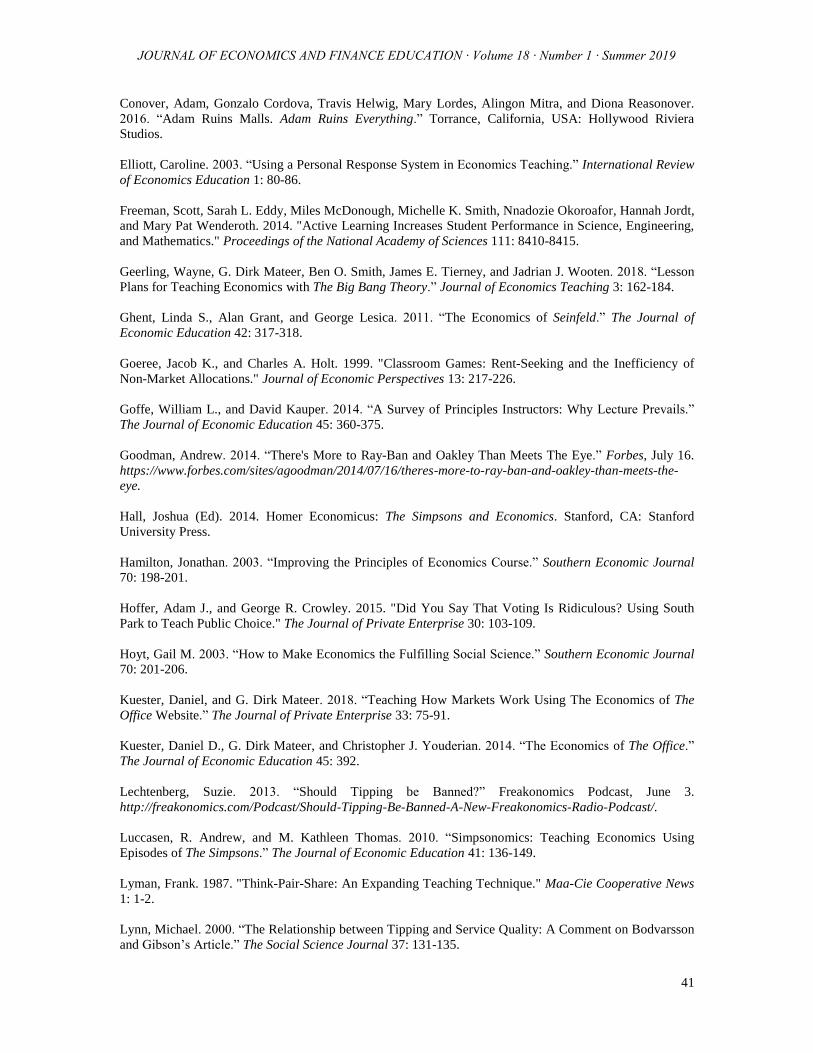
JOURNAL OF ECONOMICS AND FINANCE EDUCATION ∙ Volume 18 ∙ Number 1 ∙ Summer 2019
41
Conover, Adam, Gonzalo Cordova, Travis Helwig, Mary Lordes, Alingon Mitra, and Diona Reasonover.
2016. “Adam Ruins Malls. Adam Ruins Everything.” Torrance, California, USA: Hollywood Riviera
Studios.
Elliott, Caroline. 2003. “Using a Personal Response System in Economics Teaching.” International Review
of Economics Education 1: 80-86.
Freeman, Scott, Sarah L. Eddy, Miles McDonough, Michelle K. Smith, Nnadozie Okoroafor, Hannah Jordt,
and Mary Pat Wenderoth. 2014. "Active Learning Increases Student Performance in Science, Engineering,
and Mathematics." Proceedings of the National Academy of Sciences 111: 8410-8415.
Geerling, Wayne, G. Dirk Mateer, Ben O. Smith, James E. Tierney, and Jadrian J. Wooten. 2018. “Lesson
Plans for Teaching Economics with The Big Bang Theory.” Journal of Economics Teaching 3: 162-184.
Ghent, Linda S., Alan Grant, and George Lesica. 2011. “The Economics of Seinfeld.” The Journal of
Economic Education 42: 317-318.
Goeree, Jacob K., and Charles A. Holt. 1999. "Classroom Games: Rent-Seeking and the Inefficiency of
Non-Market Allocations." Journal of Economic Perspectives 13: 217-226.
Goffe, William L., and David Kauper. 2014. “A Survey of Principles Instructors: Why Lecture Prevails.”
The Journal of Economic Education 45: 360-375.
Goodman, Andrew. 2014. “There's More to Ray-Ban and Oakley Than Meets The Eye.” Forbes, July 16.
https://www.forbes.com/sites/agoodman/2014/07/16/theres-more-to-ray-ban-and-oakley-than-meets-the-
eye.
Hall, Joshua (Ed). 2014. Homer Economicus: The Simpsons and Economics. Stanford, CA: Stanford
University Press.
Hamilton, Jonathan. 2003. “Improving the Principles of Economics Course.” Southern Economic Journal
70: 198-201.
Hoffer, Adam J., and George R. Crowley. 2015. "Did You Say That Voting Is Ridiculous? Using South
Park to Teach Public Choice." The Journal of Private Enterprise 30: 103-109.
Hoyt, Gail M. 2003. “How to Make Economics the Fulfilling Social Science.” Southern Economic Journal
70: 201-206.
Kuester, Daniel, and G. Dirk Mateer. 2018. “Teaching How Markets Work Using The Economics of The
Office Website.” The Journal of Private Enterprise 33: 75-91.
Kuester, Daniel D., G. Dirk Mateer, and Christopher J. Youderian. 2014. “The Economics of The Office.”
The Journal of Economic Education 45: 392.
Lechtenberg, Suzie. 2013. “Should Tipping be Banned?” Freakonomics Podcast, June 3.
http://freakonomics.com/Podcast/Should-Tipping-Be-Banned-A-New-Freakonomics-Radio-Podcast/.
Luccasen, R. Andrew, and M. Kathleen Thomas. 2010. “Simpsonomics: Teaching Economics Using
Episodes of The Simpsons.” The Journal of Economic Education 41: 136-149.
Lyman, Frank. 1987. "Think-Pair-Share: An Expanding Teaching Technique." Maa-Cie Cooperative News
1: 1-2.
Lynn, Michael. 2000. “The Relationship between Tipping and Service Quality: A Comment on Bodvarsson
and Gibson’s Article.” The Social Science Journal 37: 131-135.

JOURNAL OF ECONOMICS AND FINANCE EDUCATION ∙ Volume 18 ∙ Number 1 ∙ Summer 2019
42
Mateer, G. Dirk. 2012. “Econ 1-0-What?” The Journal of Economic Education 43: 440.
McMillin, W. Douglas. 2003. “Is the Economics Major Dying and, If So, Will Changes in Teaching
Technology and Course Content Save It?” Southern Economic Journal 70: 206-209.
Mula, Joseph M., and Marie Kavanagh. 2009. "Click Go the Students, Click-Click-Click: The Efficacy of a
Student Response System for Engaging Students to Improve Feedback and Performance." E-Journal of
Business Education and Scholarship of Teaching 3: 1-17.
Patel, Darshak, Abdullah Al-Bahrani, Charity-Joy Acchiardo, and Brandon J. Sheridan. 2015. “Dive In!
Tips for Teaching Economics through Shark Tank.” Working Paper available at SSRN:
https://ssrn.com/abstract=2655655.
Premuroso, Ronald F., Lei Tong, and Teresa K. Beed. 2011. "Does Using Clickers in the Classroom Matter
to Student Performance and Satisfaction When Taking the Introductory Financial Accounting Course?"
Issues in Accounting Education 26: 701-723.
Randolph, Gregory M. 2016. “Laissez-Colbert: Teaching Introductory Macroeconomics with The Colbert
Report.” The American Economist 61: 217-228.
Rao, Sumangala P., and Stephen E. Dicarlo. 2000. "Peer Instruction Improves Performance on Quizzes."
Advances in Physiology Education 24: 51-55.
Sax, Linda J., Alexander W. Astin, William S. Korn, and Shannon K. Gilmartin. 1999. The American
College Teacher: National Norms For The 1989-1999 HERI Faculty Survey. Los Angeles: Higher
Education Research Institute.
Siegfried, John J., and Allen R. Sanderson. 2003. “Keeping Economics from Becoming a Sexy Social
Science.” Southern Economic Journal 70: 209-214.
Stead, David R. 2005. “A Review of the One-Minute Paper.” Active Learning in Higher Education 6: 118-
131.
Tierney, James E., G. Dirk Mateer, Ben O. Smith, Jadrian J. Wooten, and Wayne A. Geerling. 2016.
“Bazinganomics: Economics of The Big Bang Theory.” The Journal of Economic Education 47: 192.
Van de Pol, Janneke, Monique Volman, and Jos Beishuizen. 2010. "Scaffolding in Teacher–Student
Interaction: A Decade of Research." Educational Psychology Review 22: 271-296.
Watts, Michael. 2003. “Is Sexy Economics and Economics Teaching Necessary or Sufficient?” Southern
Economic Journal 70: 214-219.
Watts, Michael, and Georg Schaur. 2011. “Teaching and Assessment Methods in Undergraduate
Economics: A Fourth National Quinquennial Survey.” The Journal of Economic Education 42: 294-309.
Wooten, Jadrian J. 2018. “Economics Media Library.” The Journal of Economic Education 49: 364-365.
Wooten, Jadrian J., and Kalina Staub. 2019. “Teaching Economics Using NBC's Parks and Recreation.”
The Journal of Economic Education 50: 87-88.
Wooten, Jadrian, Kalina Staub, and Susan Reilly. 2020. “Economics within ABC’s Modern Family.” The
Journal of Economic Education 51: 210.

JOURNAL OF ECONOMICS AND FINANCE EDUCATION ∙ Volume 18 ∙ Number 1 ∙ Summer 2019
43
APPENDIX
Table 1: Title, Concepts, and a Description of the Economic Topics Covered for Season 1
Ep. Title Show Topics Economic Topics
1 Adam Ruins
Giving
Diamond rings Marketing, advertising, intrinsic value, cartels,
competition, supply and demand, charity,
production costs, profit, efficiency, cost-benefit
analysis, warm-glow effect, rationality
Tom's shoes
Canned-food drives
2 Adam Ruins
Security
Airport security Cost-benefit analysis, opportunity costs,
marketing, advertising, unintended consequences,
rationality
Tylenol
Credit card fraud
3 Adam Ruins
Cars
Car dealerships Regulation, monopolies, anti-competition laws, tax
revenue, rent seeking, marketing, advertising,
negative externalities, induced (derived) demand,
overconfidence, unintended consequences,
personal finance, budgeting, price discrimination
Automobile industry
Car ownership
4
Adam Ruins
Forensic
Science
Polygraph Behavioral economics (false memory, attribution
bias) Eye witnesses
Fingerprinting
5 Adam Ruins
Restaurants
Tipping Labor economics, minimum wage, input costs,
incentives, wage discrimination, advertising,
acquisitions, overchoice, utility, overfishing,
tragedy of the commons
Wine
Fish
6 Adam Ruins
Hygiene
Mouthwash and Soap Marketing, advertising, profit, public utilities,
unintended consequences, negative externalities,
growth, poverty
Flushable wipes
Running water
7 Adam Ruins
Voting
The Electoral College Cost-benefit analysis, corruption, political
economy Voting
Gerrymandering
8 Adam Ruins
Work
The standard work week Labor economics, labor unions, profit,
productivity, incentives, labor laws,
unemployment insurance, wages, asymmetric
information, wage discrimination
Internships
Salaries
9 Adam Ruins
Summer Fun
Summer vacation Growth, human capital, technological
improvements, subsidies, barriers to entry,
marketing, advertising
Cartoons
Video Games
10 Adam Ruins
Sex
Circumcision Unintended consequences, opportunity costs, cost-
benefit analysis Herpes
The hymen
11 Adam Ruins
Nutrition
Vitamins Decreasing marginal returns, advertising, research
design, decision making Breakfast
Health Shows
12 Adam Ruins
Death
Death Shutdown decision, mark up, profit, mergers,
negative externalities, cost-benefit analysis,
acquisitions
Funerals
End-of-life care

JOURNAL OF ECONOMICS AND FINANCE EDUCATION ∙ Volume 18 ∙ Number 1 ∙ Summer 2019
44
Table 2: Title, Concepts, and a Description of the Economic Topics Covered for Season 2
Ep. Title Show Topics Economic Topics
13 Adam Ruins
Hollywood Movie awards Signaling, advertising, prestige, winner's curse
Movie ratings
Reality shows
14 Adam Ruins
Football NFL playoffs Sample size, advertising, preferences, research
ethics, unintended consequences, sports economics Hydration myths
Concussions
15 Adam Ruins
Weddings Weddings Capitalism, commercialization, complements,
preferences, demand, price discrimination,
correlation vs causation, principal-agent problem,
specialization, trickle-down economics
Newlyweds
Divorce
16 Adam Ruins
Malls Evolution of malls Commercialization, regulation, price
discrimination, unintended consequences,
advertising, monopolies, vertical integration,
product differentiation, predatory pricing,
willingness to pay, substitutes
Outlet malls
Eyeglasses
17 Adam Ruins
Animals Cats and dogs Club goods, standardization, incentives,
unintended consequences, property rights,
common resources, tragedy of the commons Poaching
Trophy hunting
18 Adam Ruins
Immigration Illegal immigration Labor economics, immigration, allocative
efficiency, migration Immigration courts
Deportation
19 Adam Ruins
Housing Buying vs. renting Mobility costs, personal finance, principal-agent
problem, diversification, portfolio strategy, Great
Recession, opportunity costs, regulation,
discrimination, price discrimination
Airbnb
Houses for the homeless
20 Adam Ruins
Drugs Marijuana Correlation vs. causation, health, economics of
crime, incentives, principal-agent problem,
unintended consequences, product differentiation,
preferences, supply and demand
DARE
Opioid epidemic
21 Adam Ruins
Prison Private prisons Economics of crime, rationality, profit, cost
minimization, privatization, public services,
principal-agent problem, incentives, unintended
consequences
Solitary confinement
Recidivism
22 Adam Ruins
the Wild West Cowboys Mobility costs, black markets, compensating
differentials, labor economics, entrepreneurship Women in the Wild West
Air Conditioning
23 Adam Ruins
the Internet Power of the internet Growth, technological improvements,
productivity, monopolies, natural monopolies,
barriers to entry, imperfect competition, collusion,
government intervention, antitrust policy,
opportunity costs, tradeoffs
Cable companies
"Free" websites
24 Adam Ruins
Justice Coffee lawsuit Discrimination, statistical discrimination, self-
interest Jury bias
Public defenders
25 Adam Ruins
Christmas
Christmas Inefficiency, gift-giving, rationality, behavioral
economics, willingness to pay, demand, consumer
surplus, subjective value, surplus, inequality Gift giving
Santa Claus
26 Adam Ruins
Going Green
Littering Preferences, unintended consequences, cost
minimization, inputs, outputs, production,
opportunity costs, input costs Electric cars
Climate change
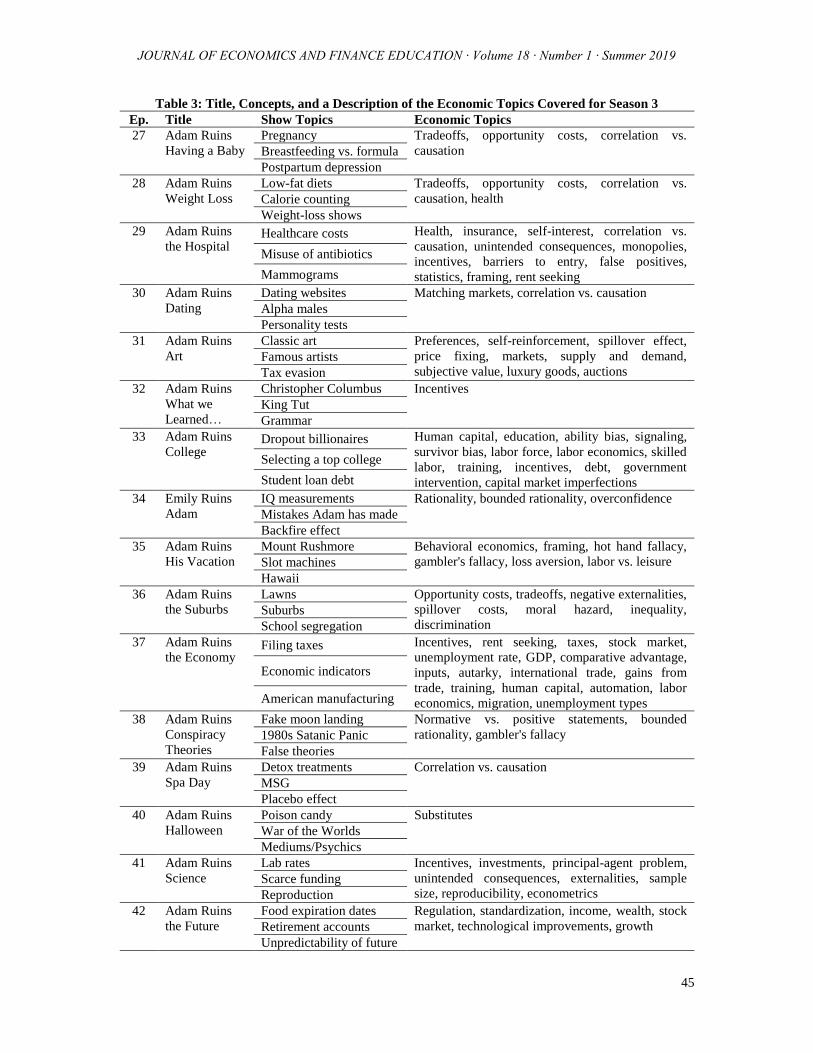
JOURNAL OF ECONOMICS AND FINANCE EDUCATION ∙ Volume 18 ∙ Number 1 ∙ Summer 2019
45
Table 3: Title, Concepts, and a Description of the Economic Topics Covered for Season 3
Ep. Title Show Topics Economic Topics
27 Adam Ruins
Having a Baby
Pregnancy Tradeoffs, opportunity costs, correlation vs.
causation Breastfeeding vs. formula
Postpartum depression
28 Adam Ruins
Weight Loss
Low-fat diets Tradeoffs, opportunity costs, correlation vs.
causation, health Calorie counting
Weight-loss shows
29 Adam Ruins
the Hospital Healthcare costs Health, insurance, self-interest, correlation vs.
causation, unintended consequences, monopolies,
incentives, barriers to entry, false positives,
statistics, framing, rent seeking
Misuse of antibiotics
Mammograms
30 Adam Ruins
Dating
Dating websites Matching markets, correlation vs. causation
Alpha males
Personality tests
31 Adam Ruins
Art
Classic art Preferences, self-reinforcement, spillover effect,
price fixing, markets, supply and demand,
subjective value, luxury goods, auctions Famous artists
Tax evasion
32 Adam Ruins
What we
Learned…
Christopher Columbus Incentives
King Tut
Grammar
33 Adam Ruins
College Dropout billionaires Human capital, education, ability bias, signaling,
survivor bias, labor force, labor economics, skilled
labor, training, incentives, debt, government
intervention, capital market imperfections
Selecting a top college
Student loan debt
34 Emily Ruins
Adam
IQ measurements Rationality, bounded rationality, overconfidence
Mistakes Adam has made
Backfire effect
35 Adam Ruins
His Vacation
Mount Rushmore Behavioral economics, framing, hot hand fallacy,
gambler's fallacy, loss aversion, labor vs. leisure Slot machines
Hawaii
36 Adam Ruins
the Suburbs
Lawns Opportunity costs, tradeoffs, negative externalities,
spillover costs, moral hazard, inequality,
discrimination Suburbs
School segregation
37 Adam Ruins
the Economy Filing taxes Incentives, rent seeking, taxes, stock market,
unemployment rate, GDP, comparative advantage,
inputs, autarky, international trade, gains from
trade, training, human capital, automation, labor
economics, migration, unemployment types
Economic indicators
American manufacturing
38 Adam Ruins
Conspiracy
Theories
Fake moon landing Normative vs. positive statements, bounded
rationality, gambler's fallacy 1980s Satanic Panic
False theories
39 Adam Ruins
Spa Day
Detox treatments Correlation vs. causation
MSG
Placebo effect
40 Adam Ruins
Halloween
Poison candy Substitutes
War of the Worlds
Mediums/Psychics
41 Adam Ruins
Science
Lab rates Incentives, investments, principal-agent problem,
unintended consequences, externalities, sample
size, reproducibility, econometrics Scarce funding
Reproduction
42 Adam Ruins
the Future
Food expiration dates Regulation, standardization, income, wealth, stock
market, technological improvements, growth Retirement accounts
Unpredictability of future

JOURNAL OF ECONOMICS AND FINANCE EDUCATION ∙ Volume 18 ∙ Number 1 ∙ Summer 2019
46
Table 4: Concept Covered in Adam Ruins Everything and Corresponding Episodes
Concept Title Ep. #
Ability Bias Adam Ruins College 33
Acquisitions Adam Ruins Death 12
Adam Ruins Restaurants 5
Advertising
Adam Ruins Cars 3
Adam Ruins Football 14
Adam Ruins Giving 1
Adam Ruins Hollywood 13
Adam Ruins Hygiene 6
Adam Ruins Malls 16
Adam Ruins Nutrition 11
Adam Ruins Restaurants 5
Adam Ruins Security 2
Adam Ruins Summer Fun 9
Allocative Efficiency Adam Ruins Immigration 18
Anti-Competition Laws Adam Ruins Cars 3
Antitrust Policy Adam Ruins the Internet 23
Asymmetric Information Adam Ruins Work 8
Attribution Bias Adam Ruins Forensic Science 4
Auctions Adam Ruins Art 31
Autarky Adam Ruins the Economy 37
Automation Adam Ruins the Economy 37
Barriers to Entry
Adam Ruins Summer Fun 9
Adam Ruins the Hospital 29
Adam Ruins the Internet 23
Behavioral Economics
Adam Ruins Christmas 25
Adam Ruins Forensic Science 4
Adam Ruins His Vacation 35
Black Markets Adam Ruins the Wild West 22
Bounded Rationality Adam Ruins Conspiracy Theories 38
Emily Ruins Adam 34
Budgeting Adam Ruins Cars 3
Capital Market Imperfections Adam Ruins College 33
Capitalism Adam Ruins Weddings 15
Cartels Adam Ruins Giving 1
Charity Adam Ruins Giving 1
Club Goods Adam Ruins Animals 17
Collusion Adam Ruins the Internet 23
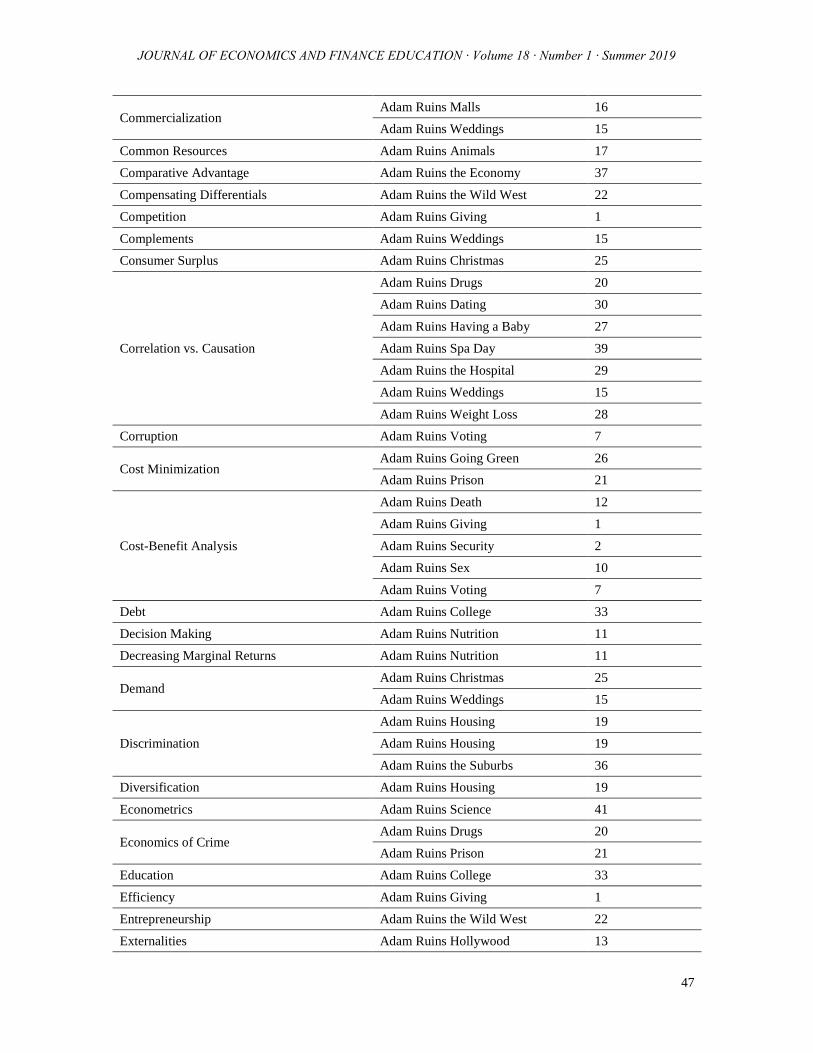
JOURNAL OF ECONOMICS AND FINANCE EDUCATION ∙ Volume 18 ∙ Number 1 ∙ Summer 2019
47
Commercialization Adam Ruins Malls 16
Adam Ruins Weddings 15
Common Resources Adam Ruins Animals 17
Comparative Advantage Adam Ruins the Economy 37
Compensating Differentials Adam Ruins the Wild West 22
Competition Adam Ruins Giving 1
Complements Adam Ruins Weddings 15
Consumer Surplus Adam Ruins Christmas 25
Correlation vs. Causation
Adam Ruins Drugs 20
Adam Ruins Dating 30
Adam Ruins Having a Baby 27
Adam Ruins Spa Day 39
Adam Ruins the Hospital 29
Adam Ruins Weddings 15
Adam Ruins Weight Loss 28
Corruption Adam Ruins Voting 7
Cost Minimization Adam Ruins Going Green 26
Adam Ruins Prison 21
Cost-Benefit Analysis
Adam Ruins Death 12
Adam Ruins Giving 1
Adam Ruins Security 2
Adam Ruins Sex 10
Adam Ruins Voting 7
Debt Adam Ruins College 33
Decision Making Adam Ruins Nutrition 11
Decreasing Marginal Returns Adam Ruins Nutrition 11
Demand Adam Ruins Christmas 25
Adam Ruins Weddings 15
Discrimination
Adam Ruins Housing 19
Adam Ruins Housing 19
Adam Ruins the Suburbs 36
Diversification Adam Ruins Housing 19
Econometrics Adam Ruins Science 41
Economics of Crime Adam Ruins Drugs 20
Adam Ruins Prison 21
Education Adam Ruins College 33
Efficiency Adam Ruins Giving 1
Entrepreneurship Adam Ruins the Wild West 22
Externalities Adam Ruins Hollywood 13

JOURNAL OF ECONOMICS AND FINANCE EDUCATION ∙ Volume 18 ∙ Number 1 ∙ Summer 2019
48
Adam Ruins Science 41
False Positives Adam Ruins the Hospital 29
Framing Adam Ruins His Vacation 35
Adam Ruins the Hospital 29
Gains from Trade Adam Ruins the Economy 37
Gambler's Fallacy Adam Ruins Conspiracy Theories 38
Adam Ruins His Vacation 35
Gift-Giving Adam Ruins Christmas 25
Government Intervention Adam Ruins College 33
Adam Ruins the Internet 23
Great Recession Adam Ruins Housing 19
Gross Domestic Product (GDP) Adam Ruins the Economy 37
Growth
Adam Ruins Hygiene 6
Adam Ruins Summer Fun 9
Adam Ruins the Future 42
Adam Ruins the Internet 23
Adam Ruins the Internet 23
Health
Adam Ruins Drugs 20
Adam Ruins the Hospital 29
Adam Ruins Weight Loss 28
Hot Hand Fallacy Adam Ruins His Vacation 35
Human Capital
Adam Ruins Summer Fun 9
Adam Ruins College 33
Adam Ruins the Economy 37
Immigration Adam Ruins Immigration 18
Imperfect Competition Adam Ruins the Internet 23
Incentives
Adam Ruins Animals 17
Adam Ruins College 33
Adam Ruins Drugs 20
Adam Ruins Prison 21
Adam Ruins Restaurants 5
Adam Ruins Science 41
Adam Ruins the Economy 37
Adam Ruins the Hospital 29
Adam Ruins What We Learned in
School 32
Adam Ruins Work 8
Income Adam Ruins the Future 42
Induced (Derived) Demand Adam Ruins Cars 3

JOURNAL OF ECONOMICS AND FINANCE EDUCATION ∙ Volume 18 ∙ Number 1 ∙ Summer 2019
49
Inefficiency Adam Ruins Christmas 25
Inequality Adam Ruins Christmas 25
Adam Ruins the Suburbs 36
Input Costs Adam Ruins Going Green 26
Adam Ruins Restaurants 5
Inputs Adam Ruins Going Green 26
Adam Ruins the Economy 37
Insurance Adam Ruins the Hospital 29
International Trade Adam Ruins the Economy 37
Intrinsic Value Adam Ruins Giving 1
Investments Adam Ruins Science 41
Labor Economics
Adam Ruins the Wild West 22
Adam Ruins College 33
Adam Ruins Immigration 18
Adam Ruins Restaurants 5
Adam Ruins the Economy 37
Adam Ruins Work 8
Labor Force Adam Ruins College 33
Labor Laws Adam Ruins Work 8
Labor Unions Adam Ruins Work 8
Labor vs. Leisure Adam Ruins His Vacation 35
Loss Aversion Adam Ruins His Vacation 35
Luxury Goods Adam Ruins Art 31
Mark Up Adam Ruins Death 12
Marketing
Adam Ruins Cars 3
Adam Ruins Giving 1
Adam Ruins Hygiene 6
Adam Ruins Security 2
Adam Ruins Summer Fun 9
Markets Adam Ruins Art 31
Matching Markets Adam Ruins Dating 30
Mergers Adam Ruins Death 12
Migration Adam Ruins Immigration 18
Adam Ruins the Economy 37
Minimum Wage Adam Ruins Restaurants 5
Mobility Costs Adam Ruins Housing 19
Adam Ruins the Wild West 22
Monopolies Adam Ruins Cars 3
Adam Ruins Malls 16

JOURNAL OF ECONOMICS AND FINANCE EDUCATION ∙ Volume 18 ∙ Number 1 ∙ Summer 2019
50
Adam Ruins the Hospital 29
Adam Ruins the Internet 23
Moral Hazard Adam Ruins the Suburbs 36
Natural Monopolies Adam Ruins the Internet 23
Negative Externalities
Adam Ruins Cars 3
Adam Ruins Death 12
Adam Ruins Hygiene 6
Adam Ruins the Suburbs 36
Normative vs. Positive Statements Adam Ruins Conspiracy Theories 38
Opportunity Costs
Adam Ruins Going Green 26
Adam Ruins Having a Baby 27
Adam Ruins Housing 19
Adam Ruins Security 2
Adam Ruins Sex 10
Adam Ruins the Internet 23
Adam Ruins the Suburbs 36
Adam Ruins Weight Loss 28
Outputs Adam Ruins Going Green 26
Overchoice Adam Ruins Restaurants 5
Overconfidence Adam Ruins Cars 3
Emily Ruins Adam 34
Overfishing Adam Ruins Restaurants 5
Personal Finance Adam Ruins Cars 3
Adam Ruins Housing 19
Political Economy Adam Ruins Voting 7
Portfolio Strategy Adam Ruins Housing 19
Poverty Adam Ruins Hygiene 6
Predatory Pricing Adam Ruins Malls 16
Preferences
Adam Ruins Art 31
Adam Ruins Drugs 20
Adam Ruins Football 14
Adam Ruins Going Green 26
Adam Ruins Weddings 15
Prestige Adam Ruins Hollywood 13
Price Discrimination
Adam Ruins Cars 3
Adam Ruins Weddings 15
Adam Ruins Malls 16
Adam Ruins Housing 19
Price Fixing Adam Ruins Art 31
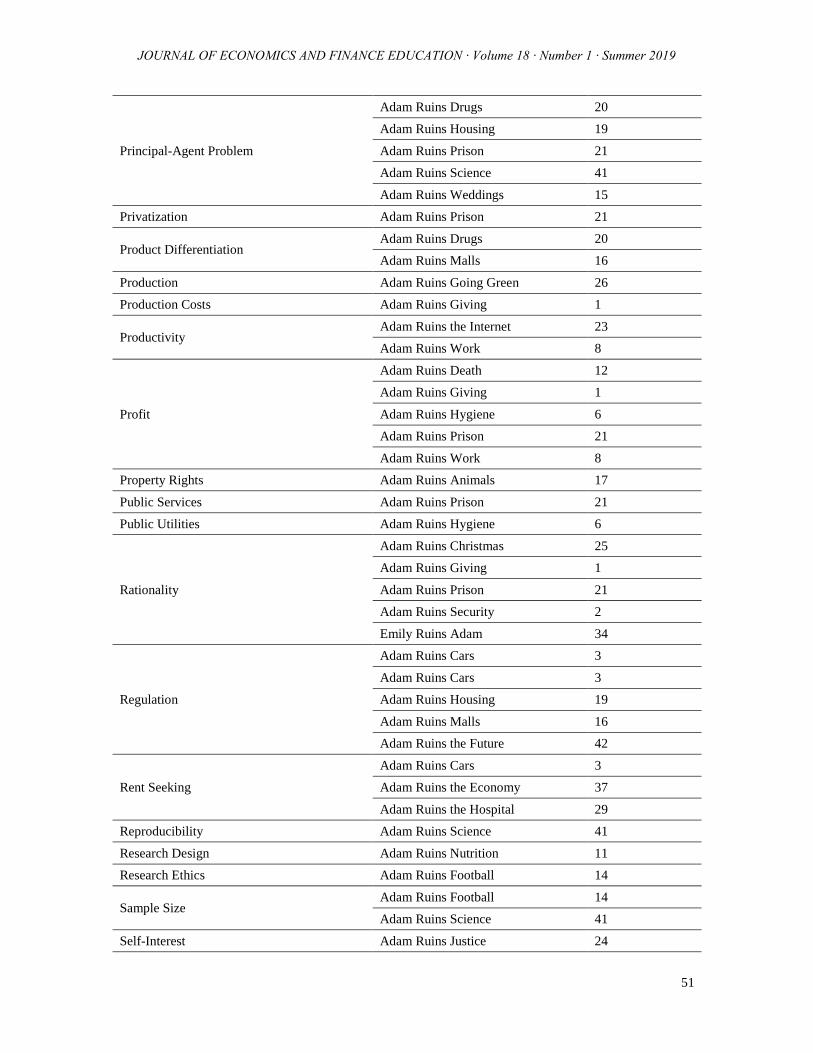
JOURNAL OF ECONOMICS AND FINANCE EDUCATION ∙ Volume 18 ∙ Number 1 ∙ Summer 2019
51
Principal-Agent Problem
Adam Ruins Drugs 20
Adam Ruins Housing 19
Adam Ruins Prison 21
Adam Ruins Science 41
Adam Ruins Weddings 15
Privatization Adam Ruins Prison 21
Product Differentiation Adam Ruins Drugs 20
Adam Ruins Malls 16
Production Adam Ruins Going Green 26
Production Costs Adam Ruins Giving 1
Productivity Adam Ruins the Internet 23
Adam Ruins Work 8
Profit
Adam Ruins Death 12
Adam Ruins Giving 1
Adam Ruins Hygiene 6
Adam Ruins Prison 21
Adam Ruins Work 8
Property Rights Adam Ruins Animals 17
Public Services Adam Ruins Prison 21
Public Utilities Adam Ruins Hygiene 6
Rationality
Adam Ruins Christmas 25
Adam Ruins Giving 1
Adam Ruins Prison 21
Adam Ruins Security 2
Emily Ruins Adam 34
Regulation
Adam Ruins Cars 3
Adam Ruins Cars 3
Adam Ruins Housing 19
Adam Ruins Malls 16
Adam Ruins the Future 42
Rent Seeking
Adam Ruins Cars 3
Adam Ruins the Economy 37
Adam Ruins the Hospital 29
Reproducibility Adam Ruins Science 41
Research Design Adam Ruins Nutrition 11
Research Ethics Adam Ruins Football 14
Sample Size Adam Ruins Football 14
Adam Ruins Science 41
Self-Interest Adam Ruins Justice 24

JOURNAL OF ECONOMICS AND FINANCE EDUCATION ∙ Volume 18 ∙ Number 1 ∙ Summer 2019
52
Adam Ruins the Hospital 29
Self-Reinforcement Adam Ruins Art 31
Shutdown Decision Adam Ruins Death 12
Signaling Adam Ruins College 33
Adam Ruins Hollywood 13
Skilled Labor Adam Ruins College 33
Specialization Adam Ruins Weddings 15
Spillover Costs Adam Ruins the Suburbs 36
Spillover Effect Adam Ruins Art 31
Sports Economics Adam Ruins Football 14
Standardization Adam Ruins Animals 17
Adam Ruins the Future 42
Statistical Discrimination Adam Ruins Justice 24
Statistics Adam Ruins the Hospital 29
Stock Market Adam Ruins the Economy 37
Adam Ruins the Future 42
Subjective Value Adam Ruins Art 31
Adam Ruins Christmas 25
Subsidies Adam Ruins Summer Fun 9
Substitutes Adam Ruins Halloween 40
Adam Ruins Malls 16
Supply and Demand
Adam Ruins Art 31
Adam Ruins Drugs 20
Adam Ruins Giving 1
Surplus Adam Ruins Christmas 25
Survivor Bias Adam Ruins College 33
Tax Revenue Adam Ruins Cars 3
Taxes Adam Ruins the Economy 37
Technological Improvements
Adam Ruins Summer Fun 9
Adam Ruins the Future 42
Adam Ruins the Internet 23
Tradeoffs
Adam Ruins Having a Baby 27
Adam Ruins the Internet 23
Adam Ruins the Suburbs 36
Adam Ruins Weight Loss 28
Tragedy of the Commons Adam Ruins Animals 17
Adam Ruins Restaurants 5
Training Adam Ruins College 33
Adam Ruins the Economy 37
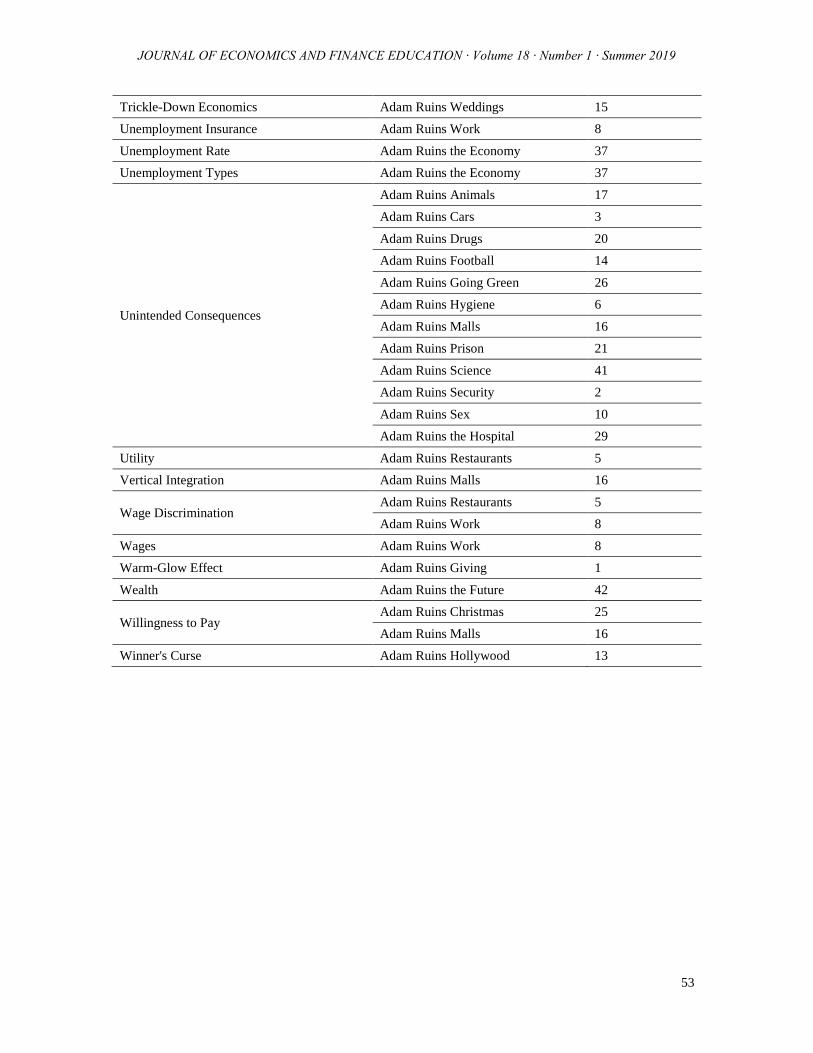
JOURNAL OF ECONOMICS AND FINANCE EDUCATION ∙ Volume 18 ∙ Number 1 ∙ Summer 2019
53
Trickle-Down Economics Adam Ruins Weddings 15
Unemployment Insurance Adam Ruins Work 8
Unemployment Rate Adam Ruins the Economy 37
Unemployment Types Adam Ruins the Economy 37
Unintended Consequences
Adam Ruins Animals 17
Adam Ruins Cars 3
Adam Ruins Drugs 20
Adam Ruins Football 14
Adam Ruins Going Green 26
Adam Ruins Hygiene 6
Adam Ruins Malls 16
Adam Ruins Prison 21
Adam Ruins Science 41
Adam Ruins Security 2
Adam Ruins Sex 10
Adam Ruins the Hospital 29
Utility Adam Ruins Restaurants 5
Vertical Integration Adam Ruins Malls 16
Wage Discrimination Adam Ruins Restaurants 5
Adam Ruins Work 8
Wages Adam Ruins Work 8
Warm-Glow Effect Adam Ruins Giving 1
Wealth Adam Ruins the Future 42
Willingness to Pay Adam Ruins Christmas 25
Adam Ruins Malls 16
Winner's Curse Adam Ruins Hollywood 13

JOURNAL OF ECONOMICS AND FINANCE EDUCATION ∙ Volume 18 ∙ Number 1 ∙ Summer 2019
54
Financial Analysis of the Beer Logistics and
Transportation Industry: A Unique
Interdisciplinary Finance Travel Course
Jocelyn Evans, Kent Gourdin, and Alan Shao1
ABSTRACT
This course takes an innovative approach to learning utilizing a travel
study abroad course that integrates supply chain, logistics and credit
analysis finance topics. The highlight of the course is a trip to Europe
that introduces students to managers in both logistics companies and
financial institutions that provide resources to multinational companies
such as Heineken that rely heavily on an efficient supply chain processes.
The article provides a blueprint to educators on how to incorporate
assignments, organize the trip, and integrate lectures from local
professionals.
Introduction
With U.S. undergraduate applications dropping over the past six years and for the foreseeable future, it is
important that business school administrators and faculty design academic programs that differentiate their
curriculum and prepare students for the most needed jobs (Nadworny 2018). In response to declining
enrollments, many universities have launched unique, flexible programs in sought-after areas such as finance
and supply-chain logistics management (College Choice 2019). Few, however, offer interdisciplinary, study
abroad courses that incorporate both academic areas, even though supply chain finance teaches students how
to use financial analytical problem-solving skills to analyze the cost structure of logistics and supply chains.
Each step in the logistics and supply chain process requires revenue and cost forecasting as well as capital
budgeting analysis. For example, in the brewing industry, financial analysis is important from three different
perspectives: 1) buying firms can optimize working capital in a way that improves cash flow by minimizing
accounts receivables; 2) suppliers can better assist their large buyers with inventory planning and revenue
forecasts to improve profitability; and 3) bankers can lower their underwriting risk if analysts understand the
costs at each level of the logistics and supply chain.
We outline a study abroad course that provides students with finance-related logistics and supply chain
knowledge from a global perspective. Many academics advocate this type of experiential learning because it
goes beyond classroom lecturing to ensure that students retain and understand the information (Buchanan
and Gjerstad 2017). Study abroad courses provide students with authentic learning journeys that enable them
to engage with professionals in the logistics/supply chain and finance industries in another country - an
immersive, alternative experiential learning opportunity. The intent is to have students apply the theoretical
concepts they learn in class to existing corporate strategic issues in a memorable and engaging way within a
specific industry context. Applying this approach to the Commercial Lending in the Brewing Industry course
gives students intrinsic motivation to better understand firms’ logistics and supply chain issues.
1 Dr. Evans is a Professor of Finance. Dr. Gourdin is a Professor of Supply Chain and Information Management. Dr. Shao is Dean
of the School of Business and a Professor of Marketing. The authors are from the School of Business at the College of Charleston,
5 Liberty Street, Charleston, S.C. 20424. The contact author, Dr. Jocelyn Evans, can be reached at [email protected]. We are grateful to the editors, Frank Stephenson and Bill Yang, and an anonymous referee for their constructive suggestion for substantially revising
the original submission. We also thank Wes Burnett, Phyllis Keys, James Malm, Timothy Jones, and participants at the 2018
Academy of Economics and Finance Association meeting for helpful discussions and insightful comments on an earlier draft of this manuscript. Jocelyn Evans and Kent Gourdin received research funding from the School of Business at the College of Charleston.
The usual caveat applies.
JOURNAL OF ECONOMICS AND FINANCE EDUCATION ∙ Volume 18 ∙ Number 1 ∙ Summer 2019
55
Adaptability of Course Curriculum and Study Abroad Trip
Our ‘Commercial Lending in the Global Beer Industry’ course is an example of innovative, experiential
teaching, which Buchanan and Gjerstad (2017) argue is essential for increasing student learning and
employment skills. It is a semester-long, interdisciplinary, study abroad course. In addition to traditional
lecturing from the instructor, the course has several unique components: 1) lectures from professionals and
on-site visits to nearby breweries; 2) a financial analysis of Heineken’s supply chain and logistics costs; 3) a
trip to meet finance, logistics, and supply chain professionals in the Netherlands and Belgium;2 4) a visit with
the Rotterdam Port Authority logistics managers and executives at other corporations; 5) lectures with
industry professionals that pay for a professional development course, providing students with training in
supply chain fundamentals and leadership skills; 6) professional guest lecturers in the finance class; and 7) a
Beer Game business-to-business eCommerce case (Reimer 2008). An appendix available upon request from
the authors provides a program overview, itinerary, and syllabus for the travel-study course.3
Finance students’ ability to participate in the Global Logistics and Transportation Professional
Development class that is designed for supply chain and logistics professionals in South Carolina is an
important experiential component of this study abroad course. Recognized leaders in the logistics and supply
chain profession lecture on innovative technologies, recent industry concerns, and the logistics industry. We
decided to have finance majors only attend the seminars that focus on practical knowledge and training of
supply chain and logistics cost strategies. The instructor and guest lecturers integrate financial analysis
applications and global logistics and transportation strategies to ensure that students meet certain discipline-
based, interdisciplinary, and study abroad learning goals.
To our knowledge, few finance or supply chain undergraduate degrees offer interdisciplinary, travel-
focused courses (Gourdin and Shao 2013), even though this type of interdisciplinary course provides students
with different analytical and valuation skills. The course is most appropriate for students with either a finance
major, finance minor, supply chain or logistics major, supply chain and logistics minor, or any student that
has the necessary prerequisites. Recommended prerequisites include an introduction to finance, managerial
accounting, financial accounting, and possibly a production course. The instructor, however, can choose to
waive any of the prerequisites for select students such as those non-traditional enrollees with substantial
related work experience that are interested in auditing the course.
We chose the brewing industry due to its extensive reliance on logistics and supply chain management in
addition to the large number of breweries in Belgium and the Netherlands. According to the Brewers
Association, the protection of the supply chain with respect to the cost of accessing hop raw material is an
important ongoing strategic issue (Skypeck 2016). Disease and fluctuating raw ingredient costs can greatly
affect firms’ profitability and ability to deliver product at a specified price to buyers. One of the biggest
concerns is unprecedented pressure on the global hop supply due to the escalating popularity of craft beers.
This and other supply chain challenges that affect beer production globally are analyzed in the course.
Although the type of industry and specific firm is flexible, the course focuses on Heineken because it is
a publicly-traded corporation with headquarters in the Netherlands that faces stiff competition from craft
breweries in Belgium and other countries.4 Due to the global nature of its product markets, the logistics and
supply chain management process is an important aspect of cost control. Hence, to analyze how these costs
affect financial performance, students benefit from receiving formal training about the complications derived
from complicated supply chain relationships.
The academic course can be duplicated or adapted at any university by choosing a corporation in a
different industry that has a dominant market share in a country outside of the United States. For example,
professors at business schools located in other cities with ports and transportation hubs can adapt the
curriculum blueprint to their stakeholder needs. The largest and busiest ports within the United States are in
coastal regions with liberal arts universities. For example, the Port of Los Angeles and Port of Long Beach
2 The insight regarding the travel abroad component is based on over twenty-five years of student (more than 300) participation in
the Global Logistics and Transportation minor trip at the College of Charleston. http://sb.cofc.edu/academics/professional-
programs/glat/. 3 The study abroad course can be substituted with a local interdisciplinary experience that provides interaction with the businesses
within the corporate community that use supply chain and logistics strategies. 4 Other firms in different industries that rely on supply chain and logistics techniques can be used to exemplify the same concepts.

JOURNAL OF ECONOMICS AND FINANCE EDUCATION ∙ Volume 18 ∙ Number 1 ∙ Summer 2019
56
are close to UCLA, one of the most acclaimed MBA finance programs in the world. Given that this port
facilitates much of the transpacific trade, an interdisciplinary travel abroad course within the business-
economics program under the College of Letters and Sciences could add value to their students since an
undergraduate business program does not exist. Other universities near ports can contextualize financial
analysis for supply chain/logistics operational decisions: Morgan State University (Baltimore, Maryland),
New York University (Port of New York and New Jersey), Georgia Southern University (Port of Savannah),
University of Richmond (Port of Virginia), University of Houston (Port of Houston), University of
California-UC Berkeley (Port of Oakland), and Florida International University (Port of Miami). Examples
of internationally important ports are those in China, Hong Kong, and Panama.
If the university or college is not located near a port, the study abroad trip and experiential learning
opportunities can focus on different types of transportation hubs. For example, Federal Express is a
multinational transportation company headquartered in Memphis, Tennessee. Federal Express owns a
shipping provider (Roberts Express), a truckload freight carrier (Viking Freight), airfreight, and a logistics
and technology solutions subsidiary. The University of Memphis has a Global Supply Chain Management
curriculum that emphasizes the importance of real-world work experiences that could be complemented with
an experiential interdisciplinary study abroad course that is jointly developed with the department of finance.
Thus, instead of analyzing Heineken’s financial performance, a professor at the University of Memphis could
choose one of Federal Express’s corporate partners in another location.
Related Literature
Supply chain/logistics supply and demand factors are strongly linked to financial budgeting, forecasting,
and valuation in a way that creates repeat patronage, deepens account penetration, and, ultimately,
strengthens long-term customer and supplier relationships. Surprisingly, there has been minimal academic
pedagogy research on this interdisciplinary topic (Larson and Halldorsson 2004), even though it is well
known that effective and efficient supply chain/logistics management is viewed as a valuable way of securing
a competitive advantage and improving organization performance (Li et al. 2006).
Sanders and Wagner (2011, p. 317) comment that, “While researchers have extensively studied supply
chain performance measurement (Griffis et al. 2004) and the various components of working capital (and in
particular inventory) (e.g., Eroglu and Hofer 2011), there are numerous topics at the supply chain–finance
interface that warrant further study.” Stronger supply chain–finance links provide tangible value (Miller and
De Matta 2008). Research on how to deal with volatile market supply and demand (as we have seen with
transport capacities or inventory levels prior to and during the 2007-2009 financial crisis5) requires close
collaboration between finance and supply chain management (Dooley et al. 2010). These topics are highly
relevant for practitioners but are minimally addressed in finance or supply chain/logistics courses. For
example, the supply chain’s impact on a firm’s share price is very interesting to practitioners (Presutti and
Mawhinney 2007) and, therefore, deserves more attention in the pedagogy literature.
Consistent with existing literature (Bajada and Trayler 2013), we believe that our study abroad course
piques students’ interest in finance supply chain topics. In other contexts, experiential education has been
shown to be beneficial because it immerses learners in an experience that encourages reflection about hard
to understand topics (see, for example, Al-Bahrani et al. 2017 and Steiner and Laws 2006). These authors
comment that some universities now emphasize interdisciplinary learning by requiring curriculum and
assignments to integrate two or more academic functional areas within the business school.
Sanders and Wagner (2011) suggest that supply chain and logistics instructors must address the
challenges of globalization, process integration, cost efficiency, and sustainability within a multidisciplinary
framework to remain relevant as a discipline. They argue that a siloed, single perspective inadequately
addresses complex, interdependent issues that tie firms’ financial performance to each other. While
instructors in supply chain and logistics performance measurement teach about alternative sourcing strategies
(e.g., single sourcing, multiple sourcing, supplier switching, supplier development, supplier integration) and
finance instructors teach the various components of working capital (in particular inventory), few professors
discuss topics related to the supply chain/logistics finance interface.
5 The 2007-2009 financial crisis is often referred to as the Great Recession. It began in 2007 with a crisis in the subprime mortgage
market in the United States that spilled over into other countries as a banking crisis on September 15, 2008. The crisis was followed by global business failures that required effective supply chain and logistics management skills to streamline costs.

JOURNAL OF ECONOMICS AND FINANCE EDUCATION ∙ Volume 18 ∙ Number 1 ∙ Summer 2019
57
Demand for Financial Analysts in the Supply Chain and Logistics Industry
The multidisciplinary finance study abroad course is a partial response to the need for financial analysts
in the supply chain and logistics industry as well as the hiring needs of the Port of Charleston. Because South
Carolina’s port system is a major part of the state’s economy, our business school established the state’s first
intermodal transportation program in 1985 through the Global Logistics and Transportation program6 due to
the strong partnership with the maritime community. In fact, financial contributions from the state, several
corporations, transportation professional groups, and several European manufacturers located in South
Carolina support the Amsterdam study abroad trip for Global Logistics minors.
The demand for supply chain/logistics analysts at the Port of Charleston is consistent with the National
Survey by the Society for Human Resource Management’s report in 2016 that public and private sector
employers need more statisticians and data analysts to analyze the cost efficiency of supply chain and
logistics systems (American Statistical Association 2016). In a national survey, eighty percent of the
responding organizations identified a need for employees with financial analysis and supply chain
management skill sets. These positions require employees to analyze large data sources to identify abnormal
trends in inventory turnover, cost per unit, and shipping time. An employee usually identifies strengths and
weaknesses in the processes and must be able to effectively communicate them to customers, suppliers,
production managers, and senior management.
Business schools have an opportunity because some firms reported having difficulty finding qualified
candidates. For example, companies like ACE Logistics Solutions in Las Vegas, Nevada hire financial
analysts for transportation and logistics areas (Indeed 2019). The analyst positions requires a B.S. degree in
Finance, Accounting, Supply Chain Management and Logistics, or any another business major with an
analytical emphasis. Moreover, employment projections from the Bureau of Labor Statistics report that job
growth in this area is projected to increase substantially from 2016 to 2026 (Bureau of Labor Statistics 2019).
A Multidisciplinary Study Abroad Course
To this point, we have discussed the relevance for creating a multidisciplinary, integrative study abroad
course. The supply chain management, logistics, and credit analysis academic interface create learning
complementarities that provide students with a unique perspective, bringing together theory and practical
skills from two different professions. Chief financial officers (CFOs) of many corporations understand the
value of the supply chain and logistics as critical drivers of shareholder value (Davis 2005). For
manufacturing firms, these costs are substantial and directly impact a firm’s profit through its ability to
effectively implement lean inventory practices and generate revenue from on-time delivery. As such, CFOs
should not just view the supply chain and logistics departments as cost centers. When properly managed,
these areas give firms a competitive advantage that enables them to develop close, symbiotic relationships
with their customers and suppliers. Consequently, students (future employees) need to learn to evaluate the
value impact of lowering costs through inventory management and improving product availability as it is
reflected on the financial statements and by the stock price.
The interface shows how value is created or destroyed across the supply chain for both shareholders and
other stakeholders affected by the company's operations. Dooley et al. (2010) discuss how changes in the
economy impact the supply chain by affecting the flow of materials and products through unexpected shifts
in consumer demand, resulting in what is known as the “bullwhip” effect. An unexpected decline in the
economy creates an unexpected decrease in customers’ demand for its products, which should ideally lead to
lower inventory purchases from retail firms in the supply chain to wholesalers. In turn, wholesalers should
order less from distributors or manufacturers. Typically, however, the lag in delivery of orders forces firms
further downstream to estimate the demand for their product with uncertainty (e.g., default risk, lead times
variations, and capacity restrictions), which makes inventory management less effective. Dooley et al. (2010)
show that when demand for products and services is volatile because of a shock to end-customer demand
such as during the 2007-2009 financial crisis or as a response to Brexit, close collaboration and
communication is needed between financial analysts that provide earnings estimates and supply chain or
6 http://sb.cofc.edu/academics/professional-programs/glat/

JOURNAL OF ECONOMICS AND FINANCE EDUCATION ∙ Volume 18 ∙ Number 1 ∙ Summer 2019
58
logistics professionals. Essentially, supply chain and logistics professionals can provide earnings guidance
to financial analysts to increase forecast accuracy through big data analysis of customer sales trends.
Important questions students should consider include the following: 1) how do exchange rates and
taxation affect the flows of material, information, and funds through global supply networks?; 2) what supply
chain management and logistics strategic priorities should be emphasized with respect to cost, quality,
delivery, flexibility, and innovation of products and services?; 3) how is risk management applied to supply
chain problems?; and 4) how can measures of diversification (e.g., sourcing in different regions of the world)
reduce default risk?
The course curriculum that complements the study abroad component explains how these questions are
addressed. The course consists of a combination of lectures, class discussion, quizzes on select presentations
in the professional development program, a historical paper on the Dutch East India Company, a Brexit
research paper, several academic research papers, a brewing industry strategy paper, a strategic and financial
analysis on Heineken, a Beer Game in business-to-business eCommerce case simulation, tours of local
breweries, and the requirement for students to attend the Spring Break study abroad component in the
Netherlands and Belgium.
The grade the students receive for the course is intended to certify their demonstrated proficiency of eight
learning goals and objectives. Proficiency is evaluated by measuring performance as follows:
1. Participation at Local Visits to Breweries: Individual 10%
2. Beer Game Case Study write-up (1): Individual 10%
3. Participation in Europe Study Abroad Trip: Individual 10%
4. Academic research paper summaries and quizzes on Intermodal Transportation and Other Lectures:
Individual 10%
5. Paper on the Dutch Shipping Company: Group plus Peer Review 10%
6. Paper on the Brewery industry: Group plus Peer Review 10%
7. Strategic and Financial Analysis of Heineken over past 5 years and 4 competitors (Include Brexit,
Taxes, Tariffs, Sustainability, Intercultural Awareness, etc.): Group plus Peer Review 40%
A detailed blueprint on the experiential learning assignments addresses the following eight learning goals.
Understanding of Intercultural Awareness (Study Abroad Trip)
Intercultural awareness is understanding the similarities and differences in U.S., Belgium, and
Netherlands corporate cultures. Employers value employees with intercultural awareness because it is a key
foundation of global business communication and decision making. For example, it is important to
understand corporations’ cultures and strategic goals as they pertain to national values. For example, firms
in the Netherlands and Belgium place a much stronger emphasis on environmental issues than most U.S.
corporations, which most likely impacts the cost and form of their logistics and supply chain models. Since
we are visiting corporations, the Rotterdam Port Authority, and academics overseas, it is necessary that the
beginning lectures discuss intercultural awareness.
Goal: Provide students with an international, experiential learning experience that discusses the
cultural differences and geographic complexity within the corporate community.
Assessment: Group oral presentations to executives at firms in the Netherlands and Belgium.
Target: Every group will be measured on a scale of exemplary, high performance, meets
expectations, and fails to meet expectations.
Students visited the largest port in Europe, Port of Rotterdam, to learn about the importance of supply
chain management and logistics in the European Union within a Brexit uncertainty and environmentally
friendly environment. They visited Heineken, craft beer makers, Servicenow, Shell Oil, universities,
Cushman and Wakefield, and BlackRock. This approach is like Buchanan and Gjerstad’s (2017) use of
historical sites, local markets, and business visits to explain how supply and demand operate differently in
European countries (see also McCannon 2011, Wright and Hind 2011, and Smith 2007).
Surveys revealed several differences that were noticed by the students: 1) the team performance is more
important than the individual performance (Servicenow); 2) more efficient and open office structure in which
management do not have closed offices (Servicenow); 3) stated high quality of work life with less stress due

JOURNAL OF ECONOMICS AND FINANCE EDUCATION ∙ Volume 18 ∙ Number 1 ∙ Summer 2019
59
to team efforts; 4) business casual instead of business professional dress with the exception of Blackrock; 5)
very ecofriendly as evidenced by the use of wind energy from windmills (Port of Rotterdam); and 6)
acceptance of nationally legislated bonus caps (20% of salaries).
Current issues: Global Logistics and Professional Training (GLAT) Program (Intermodal
Transportation, Other Lectures and Local Visits to Breweries)
Students attend selected lectures presented in the Global Logistics and Transportation Professional
Training Program at the College of Charleston. Instructors for the seminars are experts on transportation and
logistics topics. Their career experiences in both public and private sectors not only provide practical
application to theoretical academic topics, but it also enables them to convey the most up-to-date and practical
information to the students. The GLAT program is designed to provide practical knowledge and training in
diverse areas of global logistics and transportation. The instructors for the seminars are experts in specific
areas and have substantial experience in the private and public sectors of the industry. In addition,
professionals outside of the above program are asked to speak to the students during their class time as well
as visits to local breweries.
Goal: Understand current issues in the brewery industry relative to logistics and supply chain
strategy.
Assessment: Quizzes on lectures by GLAT and other professionals.
Target: Each student should earn at least a score of 80.
Independent of the GLAT program, industry professionals are scheduled to lecture on other finance topics
such as how the new set of U.S. tax and tariff law changes will affect supply chains in the beer and other
industries. Prior to the law, if a company imports beer costing $1,000 and sells it for $1,100, the company’s
taxable income was $100 after deducting the cost of goods sold. After the new law, the $1,000 is no longer
deductible making the taxable income increase from $100 to $1,100. In contrast, the tax is zero on export
revenue. This could be a major concern because alternative domestic suppliers are not always suitable
replacements, which could cause severe disruptions in supply chains globally. Tax-law-induced disruption
will be costly because many corporations have invested a lot of resources into establishing relationships with
key suppliers around the world. The potential negative impact on cash flow due to tax law changes is
compounded by managers’ concern about how currency hedge and forward contracts can be reported on the
financial statements.
Understanding of Interdependence within Logistics and Supply Chain Globalization (Dutch
Shipping Company Paper)
Kouvelis and Niederhoff (2007) discuss why global market companies do not compete solely as
individuals but as part of an entire supply chain. They conclude that strategic managers must consider the
whole supply chain and fully understand global forces and relevant trends when making operational
decisions.
Goal: Understand interdependencies along the supply chain strategy that can be disrupted by
shocks.
Assessment: Individual historical analysis of the Dutch East India Company and participation at local
brewery visits.
Target: Each student will earn at least a score of 80 on both.
The students learn about the impact of globalization on the supply chain industry from researching the
history and life cycle of the Dutch East India Company. Founded in 1602, the Dutch East India Company
traded East Indies spices around the world throughout the 17th and 18th centuries until 1800. Many companies
today use the Dutch East India Company’s shipping business model for their supply chain and logistics
strategy. The company, which was headquartered in Amsterdam was the first publicly traded corporation in
the world. The firm was able to issue shares publicly because it was the first corporation to have formal
licenses in several different regions including Africa, the Middle East, South Asia, and the Far East. At one

JOURNAL OF ECONOMICS AND FINANCE EDUCATION ∙ Volume 18 ∙ Number 1 ∙ Summer 2019
60
time, the Dutch East India Company was the largest, most valuable company in the world. In today’s
currency, its market capitalization would be worth $7.9 trillion.
A research paper highlights how supply chain and logistics strategies and warehouses in port cities can
create substantial wealth for investors. The questions that formulate the research are as follows:
1. How did the Dutch East India Company come to exist and how did it become the most powerful
shipping company in the world?
2. How did it become a globalized corporation and what supply chain management and logistics strategies
did it use?
3. What were its major contributions to transportation and navigation?
4. When did it become publicly traded?
5. Why did it disappear?
6. How did the growth in the Dutch East India Company parallel the current rise in Chinese shipping
companies and port dominance?
Today, China is dominant in the shipping industry and has the largest ports by size in a way that was once
enjoyed by the Dutch East India Company. The Chinese government continues to build infrastructure and
dredge waterways that are making its coastal cities as prosperous as Amsterdam was in the 1600s. It is
apparent that establishing supply chain and logistics dominance by building large facilities near major ocean
ports is a winning strategy because it gives firms easy access to global trade. Both research on the Dutch East
India Company and Chinese enterprises illustrates timeless lessons about how supply chain and logistics
expertise enable corporations to better forecast projected growth and expansion of international trade.
Understanding of Strategic Supply Chain Alignment - Matching Supply with Demand
(Beer-Game Case Study Simulation)
A supply chain is comprised of all the parties involved in fulfilling a customer order. The integrated
management of this network is a critical determinant of success in today’s competitive environment.
Companies like Amazon, Toyota, Walmart, and Heineken have excellent supply chain management that is a
cornerstone of their financial strength and industry leadership. There have been recent examples such as
Kmart and Sears, however, showing that reduced funding from supplier partners caused bankruptcy. The
instruction emphasizes how increasing competition and political uncertainty creates challenges and
opportunities for global supply chain and logistics relationships.
Goal: Provide a strong understanding of how abrupt changes in demand and supply for products
or services affects profitability due to the degree of supply chain and logistics alignment
across and within corporations.
Assessment: Individual written analyses of the Beer-Game case study simulation and an article titled
“Inventory Management and the Bullwhip Effect during the 2007-2008 Recession.”
Target: Every individual should earn at least a score of 80.
The 2007-2009 housing crisis led to a recession that ultimately affected the global economy at all
production levels. Dooley et al. (2010) analyze how product demand variation at each level of the supply
chain before, during, and after the recession affected inventory levels between 2005 and 2009. The first
hypothesis tests whether demand variation from the most recent recession causes excessive inventory due to
miscommunication between wholesalers to manufacturers, then retailers to wholesalers, and then consumers
to retailers. By analyzing the negative impacts from the 2007-2009 recession, the authors argue that supply
chain alignment between firms through information sharing leads to more efficient inventory management
strategies.
Prior to the recession hitting, retailers were building up inventories because the economy was doing well.
The assumption is that consumer pessimism about the economy is not accurately forecast, probably because
the suppliers’ products are only a small part of retailers’ total revenue. Consequently, retailers did not signal
a decrease in consumer demand by lowering their orders to wholesalers because few managers anticipated
the 2008 recession. Retailers increased their orders from wholesalers until just the month prior to the official
start of the economic downturn, which did not give wholesalers, distributors, and manufacturers much time
to adjust. Manufacturers and wholesalers did not lower their production and purchases, respectively, until
almost nine and eleven months after the onset of the 2008 crisis.

JOURNAL OF ECONOMICS AND FINANCE EDUCATION ∙ Volume 18 ∙ Number 1 ∙ Summer 2019
61
The bull whip effect was exemplified in a Beer Game simulation explained by Reimer (2008). During
the in-class Beer Game simulation, students learned how an unexpected shock to consumer demand creates
havoc with respect to inventory management across the supply chain. Each student played the role of either
manufacturer, distributor, wholesaler, or retail store. The objective of the game is for each supply chain group
of four to obtain the lowest amount of inventory-related costs. Costs in the game arose due to excessive
inventory levels or backorders resulting from insufficient stock. The cost of backorders is double the cost of
holding excess inventory. The restriction is that none of the four players can communicate with each other at
any time during the simulation game.
The retailer received the customer order first. If the order is smaller than the initial stock, the request is
fulfilled immediately, and the student must pay for warehousing costs of $0.50 per unit. In contrast, if the
stock is less than the initial order, the unfulfilled part is a backorder costing $1.00 per unit. The friction,
orders delivered two weeks after the request, created inventory uncertainty. Once the retailer received an
order from the end-customer, it then ordered inventory from the wholesaler. The wholesaler then ordered
from the distributor after fulfilling the retailer’s order, and lastly the distributor ordered from the
manufacturer.
It became difficult for students to keep inventory costs at a minimum while also meeting customer orders.
The ability to minimize costs by keeping inventory low became increasingly difficult as the end-customer
amounts changed drastically. An increase from 5 to 100 units of beer caused large backorders because the
unexpected rise in demand was not anticipated by the students. Later in the game when the recession caused
consumers to drop their orders back to 5 units, the students had high inventory levels. Like Dooley et al.
(2010), the retailer had the lowest inventory costs because it had the closest contact with the end consumer.
Understanding of Alternative Logistics and Supply Chain Strategies for Managing Resources
and Technology (Brewery Industry Paper)
The students make decisions as a group by completing the Beer Game, a business-to-business eCommerce
case. Each group acts as a financial analyst team assigned to effectively manage resources and maintain
financial transparency regarding transportation costs, inventory management, logistics costs, average
component supplier cost per product sold, etc. The consulting teams evaluate the integration of logistics and
production decisions on brewery firms’ financial performance.
Goal: Understand strategic supply chain and logistics decisions that affect financial outcomes.
Assessment: Group written brewery industry analysis.
Target: Every consulting group should earn at least a score of 80 on the brewery industry analysis.
Universities which have an Enterprise Resource Planning (ERP) system such as SAP can use simulations
to evaluate how production and logistics strategic decisions impact firm profitability while controlling for
other determinants. Our university is an SAP-sponsored School of Business, so we can incorporate the ERP
system either within an individual class or across the core curriculum. The ERP simulation enables students
to see precisely how customer orders and inventory levels can be seen by the sales, production planning, and
finance business units as well as vendors in an integrated centralized database system. The ERP simulation
enables students to separate logistics and supply chain costs from selling expenses and costs of goods sold,
respectively. In this way, the supply chain and logistics strategy choices are immediately translated into cost
efficiency level and customer service as defined by inventory availability. The trade-off between waste
reduction from lean management and backorders becomes stark, e.g., a capital budgeting decision between
large (small) warehouse space and more (less) transportation costs. Another option is the Cesim Global
Challenge simulation that improves students’ understanding of supply chain and logistics business operations
in a dynamic, simulated competitive environment.
Forecasting revenue and expenses in a Brexit environment (Heineken strategic and financial
analysis)
Politicians and business executives continue Brexit discussions (Fox 2017a). The pending final agreement
creates uncertainty for supply chain and logistics managers because it will have profound implications for
import and export firms that operate within the UK. The 2016 British vote to leave the European Union

JOURNAL OF ECONOMICS AND FINANCE EDUCATION ∙ Volume 18 ∙ Number 1 ∙ Summer 2019
62
biggest effect on firms’ costs and revenue will occur if a Brexit deal is not obtained with the other EU
countries. If Brexit negotiations end in Britain not being a part of the single market pass port system, tariffs
could decrease the profitability of Heineken and all firms that sell an appreciable amount of their products in
the UK. The higher costs will most likely have a trickle-down effect within the logistics industry and
throughout a firm’s supply chain, forcing suppliers to pass on increased costs to the consumer (Fox 2017b).
The study abroad trip allows students to discuss this issue with experts in the country.
Goal: Make strategic decisions that affect financial outcomes.
Assessment: Group written Heineken strategic and financial analysis.
Target: Every group should earn at least a score of 80 on the brewery industry analysis.
Supply chain management today is about much more than finding and lowering the cost of inventory.
While cost controls, optimization, efficiencies, and operational excellence are important to a successful
supply chain, maintaining strong relationships with customers and effective risk management strategies
differentiate winners from strugglers in the Brexit uncertainty environment. In this environment, the ability
to forecast revenue and costs is vital. Brewery corporations are fast-paced organizations that must constantly
respond to changes in international trade rules (Brexit), changes in consumer preferences, and ever-increasing
competition. Forward planning with respect to trucking, shipping, and other types of transport is especially
needed.
Ability to Analyze Other Types of Risk (Academic Research Paper Summaries)
Another important skill is the ability to differentiate between deterministic and uncertainty risks. As
mentioned above, political uncertainty (Brexit) is important due to its ability to destabilize international trade
within the European Union. Given that corporations’ supply chains and logistics systems often extend across
countries in the EU, it is important to prepare for immeasurable political instability, possibly by moving
production and warehouse facilities to other countries that have lower tariffs and more efficient ports. A more
measurable, deterministic type is exchange rate risk that can be partially hedged away. Given that currency
risk directly affects the cost of production and logistics, students need to be aware of how these factors impact
financial performance along the supply chain. For example, students in the class learn that firms can hedge
rising raw materials costs with futures, forward, and option contracts. This is one way to take some control
of risk and mitigate a sudden increase in supplier costs.
Recent changes to U.S. tax law also raise some foreign corporations’ supply chain and logistics costs
(Patrick 2017). It is purported that U.S.-based manufacturing firms and freight industries are pleased, but
port management has some reservations because the law increases costs for supply chain managers working
with foreign suppliers, shipping companies, etc. Consequently, everything else held equal, many of the largest
American companies that import inventory will be at a competitive disadvantage to those that buy
domestically.
Goal: Exhibit skills to assess supply chain and logistics performance through a risk/return
perspective.
Assessment: Make recommendations to increase Heineken’s supply chain competitiveness in a written
paper.
Target: Each group will earn at least a score of 80 on the written analysis.
Each student works on a consulting team assigned to evaluate critical technology, information, and supply
chain issues from a financial perspective that should enable them to recommend innovative solutions to
Heineken’s operational and competitive challenges. As noted by Cartwright and Stepanova (2012), focusing
the written analysis on a specific company within a single industry makes it easier for students to gain
intercultural competence regarding understanding the financial implication of supply chain structures and the
challenges within the industry. We chose Heineken because it is a large international brewery that competes
against other large companies and smaller craft brewers that continuously expand their distribution footprint
globally. To remain a market leader, Heineken and other firms in the brewing industry must have an effective
logistics and supply chain strategy to protect their market shares. This is particularly problematic in the UK
where the brewing industry is now saturated: “supermarkets like Tesco have responded to the growth by
replacing half of Heineken’s mainstream beer brands with up to 30 craft beers” (Thorburn 2017). The

JOURNAL OF ECONOMICS AND FINANCE EDUCATION ∙ Volume 18 ∙ Number 1 ∙ Summer 2019
63
increased competition makes selecting the most cost efficient and/or quickest route for delivering goods to
distributors or the final consumer, whether by ship, plane, train, or truck, an important strategic issue.
Since Heineken is the largest Netherlands-based brewery, its supply chain and logistics routing and
scheduling system is global and complicated. Therefore, this firm is an appropriate case study for our study
abroad course. For Heineken, improving logistics efficiency is a critical part of its strategy for achieving
profitability and market share goals because it ships its product to almost every country in the world. Unless
a student understands the logistics costs incurred between the brewer, its transportation suppliers, the network
of wholesalers, and the destination for each customer, the risks inherent in forecasting revenue and resource
needs will not be reduced. Few finance students understand the importance of maximizing shipping volumes
on a given day or measuring trucking capacities, the benefits of relying on alternative energy sources, the
selection between multiple ports, and the tradeoff between labor costs at the shipping docks and technology.
Sustainability (Study Abroad Trip)
Key topics in Corporate Social Responsibility (CSR) reports are responsible sourcing, sustainable
packaging, reverse logistics, minimizing water and wastewater use, as well as clean energy and gas emission.
The reduction of water consumption and recycling are important aspects of companies’ supply chains and
logistics operations and missions. The trip to the Netherlands enables the students to talk with logistics
financial professionals who explain why these CSR initiatives are economically profitable. The aim of the
trip is to also show the way in which the CSR conception is put into practice by brewing enterprises in the
Netherlands, especially Heineken.
Goal: Understand the costs/benefits of a sustainable supply chain.
Assessment: Individual participation at the presentation by the Rotterdam port.
Target: Each student should earn at least a score of 80.
Recommendations and Conclusions
Many universities have global awareness as part of their business school mission statement because it is
a priority of most corporations and, therefore, an academic responsibility (Open Doors 2017). Consequently,
experiential international education is a key component of the curriculum. Hence, innovative travel courses
that enable students to meet academics and professionals outside of the U.S. are valuable (McClure 2009)
because they prepare individuals to be global citizens. Study abroad programs that exemplify the interaction
between financial analysis and supply chain management or logistics, however, are rare even though a large
percentage of students studying abroad are in the field of business and management.
To successfully incorporate logistics, transportation, and/or supply chain management into a study-abroad
finance course several things must occur. First, a champion for the effort must be found both within the
School of Business and in the local business community. Having multiple professors teach the study abroad
course is optimal because the lead instructor that organizes the trip can alternate each year. At our school, the
business community partner role is fulfilled by the South Carolina State Ports Authority and local craft
brewery owners who are alumni of the College of Charleston. The collaboration between academia and the
business community is beneficial.
Second, a lack of available scholarships and grants as well as students’ need to work during the academic
year is an impediment. Therefore, to make study abroad accessible to all students, several courses with spring
break trips were added to the curriculum. For many of our students, their only opportunity to study abroad is
with a faculty-led short-term study abroad class. Dessoff (2006), Lewis and Niesenbaum (2005), and
Ingraham and Peterson (2004) also find that the largest growth in study abroad programs has been in shorter
duration trips over the past decade. Funding from corporate sponsors and self-supporting activities such as
professional education programs are necessary to ensure the quality and viability of the program. In addition,
our dean solicited philanthropic funds from some of our donors and convinced the university to approve
student business school credit hour fees ($75 per credit hour) for study abroad scholarships and grants.
Shorter study abroad experiences reduce the cost to the point that students with financial concerns, family
commitments, and limited vacation from work, etc. can participate. Lowering the cost of travel mitigates the
ongoing challenge of meeting enrollment minimums. This approach has been a resounding success at our
institution. A total of forty students have enrolled in the course for spring 2019, which necessitated another

JOURNAL OF ECONOMICS AND FINANCE EDUCATION ∙ Volume 18 ∙ Number 1 ∙ Summer 2019
64
instructor to co-teach the class. After the enrollment exceeded 20 students, however, another professor was
recruited to make the travel study component manageable from an activity point of view.
Third, the pre-requisites for the course must be tailored to the assignments and the requirement that the
students attend the spring break trip to the Netherlands and Belgium. Since many of the assignments are
group oriented, we limited the prerequisites to junior standing and the introduction to finance course because
most of the individuals were finance students who encouraged their friends to register. The prerequisites
should be waived for nontraditional students with substantial work experience in a relevant field. The only
other suggestion is that if the instructor adds an ERP component, an information management instructor
should be the second faculty leader on the trip and the prerequisites should include the core accounting,
economics, finance, marketing, management, and production courses.
The fourth concern is that the professional development course for local executives only had space for
forty students. If the enrollment at a university can only accommodate ten extra attendees, some of the same
speakers can be invited to lecture during the finance course class time on a volunteer basis. If existing faculty
do not have the time or an interest in teaching this type of course, the department can look to practitioner
adjuncts to supplement the supply chain and logistics instruction.
References
Al-Bahrani, Abdullah, Bradley Libis, Sara Drabik, and John Gibson. 2017. “Econ Beats: A Semester Long,
Interdisciplinary, Project-Based Learning Assignment.” Journal of Economic and Finance Education 16: 1-
10.
American Statistical Association. 2016. “New National Survey by SHRM Shows Employers Struggling to
Meet Growing Demand for Data Analysts.” https://www.amstat.org/ASA/News/2016-Jobs-of-the-Future-
Data-Analysis-Skills.aspx
Bajada, Christopher, and Rowan Trayler. 2013. “Interdisciplinary Business Education: Curriculum through
Collaboration.” Education + Training 55: 385-402.
Buchanan, Joy A., and Steven Gjerstad. 2017. “Economics of the World beyond the Textbook: Two Methods
for Teaching.” Journal of Economics and Finance Education 16: 1-6.
Bureau of Labor Statistics. 2019. “Employment Projections.”
https://data.bls.gov/projections/occupationProj.
Cartwright, Edward, and Anna Stepanova. 2012. “What Do Students Learn from a Classroom Experiment:
Not Much, Unless They Write a Report on It.” Journal of Economic Education 43: 48–57.
College Choice. 2019. “Best Logistics and Supply Chain Management Degrees.”
https://www.collegechoice.net/rankings/best-logistics-and-supply-chain-management-degrees/.
Davis, Scott. 2005. “The CFO and the Supply Chain.” Logistics Quarterly 11: 18-20
Dessoff, Alan. 2006. “Who’s Not Going Abroad?” International Educator 15: 20-27.
Dooley, Kevin J., Tingting Yan, Srimathy Mohan, and Mohan Gopalakrishnan. 2010. “Inventory
Management and the Bullwhip Effect during the 2007-2009 Recession: Evidence from the Manufacturing
Sector.” Journal of Supply Chain Management 46: 12-18.
Eroglu, Cuneyt, and Christian Hofer. 2011. “Lean, Leaner, Too Lean? The Inventory–Performance Link
Revisited.” Journal of Operations Management 29: 356-369.
Fox, Justin. 2017. “How Will Brexit Impact the European Logistics Industry?”
https://www.supplychaindigital.com/logistics/how-will-brexit-impact-european-logistics-industry.
JOURNAL OF ECONOMICS AND FINANCE EDUCATION ∙ Volume 18 ∙ Number 1 ∙ Summer 2019
65
Fox, Justin. 2017. “The Impact of Brexit: Three Key Logistics Concerns.”
https://www.supplychainquarterly.com/articles/1433-the-impact-of-brexit-three-key-logistics-concerns.
Gourdin, Kent N., and Alan T. Shao. 2013. “Building a Niche Business Program at a Liberal Arts
Institution: The Integration of Supply Chain Management.” Journal of International Business and Economics
13: 103-108.
Griffis, Stanley E., Martha Cooper, Thomas J. Goldsby, and David J. Closs. 2004. “Performance
Measurement: Measure Selection Based Upon Firm Goals and Information Reporting Needs.” Journal of
Business Logistics 25: 95–118.
Indeed. 2019. “Logistics Financial Analyst Jobs.”
https://www.indeed.com/jobs?q=Logistics%20Financial%20Analyst&vjk=e490f4076d1fa8ab.
Ingraham, Edward C., and Debra L. Peterson. 2004. “Assessing the Impact of Study Abroad on Student
Learning at Michigan State University.” Frontiers: The Interdisciplinary Journal of Study Abroad 10: 83-
100.
Kouvelis, Panos, and Julie Niederhoff. 2007. “On the Globalization of Operations and Supply Chain
Strategies.” In Building Supply Chain Excellence in Emerging Economies, edited by Hau L. Lee and
Chung-Yee Lee. Boston, MA: Springer.
Larson, Paul D., and Arni Halldorsson. 2004. “Logistics versus Supply Chain Management: An International
Survey.” International Journal of Logistics: Research and Applications 7: 17-31.
Lewis, Tammy L., and Richard A. Niesenbaum. 2005. “The Benefits of Short-term Study Abroad.” Chronicle
of Higher Education 51: B20.
Li, Suhong, Bhanu Ragu-Nathan, T. S. Ragu-Nathan, and S. Subba Rao. 2006. “The Impact of Supply Chain
Management Practices on Competitive Advantage and Organizational Performance.” Omega 34: 107-124.
McCannon, Bryan C. 2011. “Teaching Austrian Economics in Austria as a Non-Austrian: A Note.” Journal
of Economics and Finance Education 10: 1-6.
McClure, Ann. 2009. “Study Abroad has Global Benefit.” University Business 12: 11-12.
Miller, Tan and Renato De Matta. 2008. “A Global Supply Chain Profit Maximization and Transfer Model.”
Journal of Business Logistics 29: 175-199.
Nadworny, Elissa. 2018. “Why is Undergraduate College Enrollment Declining?”
https://www.npr.org/2018/05/25/614315950/why-is-undergraduate-college-enrollment-declining.
Open Doors. 2017. “Report on International Educational Exchange.” http://opendoors.iienetwork.org/.
Patrick Macri, Kate. 2017. “The GOP Tax Bill is Law. Here's How It Could Affect Supply Chains.”
https://www.supplychaindive.com/news/GOP-tax-bill-supply-chain-effects/513315/.
Presutti, William J. Jr., and John R. Mawhinney. 2007. “The Supply Chain-Finance Link.” Supply Chain
Management Review 11: 32-38.
Reimer, Kai. 2008. “The Beergame in Business-to-Business eCommerce Courses-A Teaching Report.”
BLED 2008 Proceedings 588-606.
Sanders, Nada R., and Stephan M. Wagner. 2011. “Multidisciplinary and Multimethod Research for
Addressing Contemporary Supply Chain Challenges.” Journal of Business Logistics 32: 317-323.
JOURNAL OF ECONOMICS AND FINANCE EDUCATION ∙ Volume 18 ∙ Number 1 ∙ Summer 2019
66
Skypeck, Chuck. 2016. “Protecting the Supply Chain.” https://www.brewersassociation.org/industry-
updates/protecting-supply-chain/.
Smith, Mark Griffin. 2007. “Case Studies on Location: Taking to the Field in Economics.” Journal of
Economic Education 38: 308-317.
Steiner, G., and D. Laws. 2006. “How Appropriate are Two Established Concepts from Higher Education for
Solving Complex Real-World Problems? A Comparison of the Harvard and the ETH Case Study Approach.”
International Journal of Sustainability in Higher Education 7: 322-340.
Thorburn, Andy. 2017. “State of the UK Craft Beer Market in 2017.”
https://hallway.agency/blog/article/state-of-the-uk-craft-beer-market-in-2017/.
Wright, Richard Keith, and David Hind. 2011. “International Field Trips-the Tourism and Entertainment
Management Field Trip to The Gambia, West Africa.” Assessment, Teaching and Learning Journal (Leeds
Met) 11:83-92.

JOURNAL OF ECONOMICS AND FINANCE EDUCATION ∙ Volume 18 ∙ Number 1 ∙ Summer 2019
67
Does Order Matter? Micro- and Macroeconomics
Principles Courses at an Access Institution
Jason J. Delaney, William B. Holmes, P. Wesley Routon, J. Taylor Smith, Andrew V.
Stephenson, and Amanda L. Wilsker1
ABSTRACT
For Principles of Microeconomics and Macroeconomics, there is no
consensus as to the “correct” course order either in the literature or
practice. If ordering affects learning, outcomes could be improved by
choosing the optimal sequence. Here, we examine student data from an
access institution, finding strong evidence students generally perform
better in their second economics principles course, and weaker but not
insignificant evidence that taking macroeconomics first improves grades
more than the opposite order. Taking the courses concurrently also
appears to significantly improve microeconomics grades but has no
apparent macroeconomics performance effect. Findings are largely
robust to different econometric specifications.
Introduction
Economic education is important, not least for its contribution to civic engagement in a functioning
democracy. That is why the authors of this study, like many economics educators, are consistently looking
for ways to improve students’ educational outcomes in the area of economics. Here, we examine the extent
to which course order affects students’ grades in principles of microeconomics and macroeconomics using a
thorough set of econometric tools to try to account for the direction, magnitude, significance, and robustness
of the effects, if any. Several prior studies have addressed this question, but results have been inconsistent.
While the results from one institution cannot hope to be dispositive, we present information on an important
and growing population: students at open-access institutions.
Much of the literature and popular press coverage of undergraduate education concerns itself with highly
selective schools, despite the fact that the majority of undergraduate students attend less selective institutions.
For example, in 2014, over forty percent of all college students were enrolled in community college (Ma and
Baum 2016). In 2009, only 16 percent of all college students attended private, nonprofit institutions, and less
than 10 percent attended state flagship universities or other public schools conducting high profile research
(O’Shaughnessy 2011). To assume that research on students at selective institutions can be generalized to
students at less selective schools ignores significant differences between these student bodies. Less selective
schools are likely to be more diverse in terms of race/ethnicity, representation of non-traditional students,
and academic preparedness. Students are more likely to be from lower-income households or to be first-
generation college students, thus affecting their expectations, experiences, and test-taking abilities. Given the
differences in student populations, it may be necessary to determine whether previous findings are robust.
There are many reasons why there could be different course order effects between access and selective
institution students in economics classes. One possibility is that a student experiences an increase in
confidence from completing their first economics course which drives them toward better performance in
their second course. This effect could be larger for access students who may have fewer mechanisms for
1 Delaney: Associate Professor of Economics, School of Business, Georgia Gwinnett College, 1000 University Center Lane,
Lawrenceville, GA 30043, USA. Holmes: Associate Professor of Economics, School of Business, Georgia Gwinnett College, 1000 University Center Lane, Lawrenceville, GA 30043, USA. Routon: Assistant Professor of Economics, School of Business, Georgia
Gwinnett College, 1000 University Center Lane, Lawrenceville, GA 30043, USA. Smith: Senior Product Manager at Walmart, Inc.,
702 SW 8th St., Bentonville, AR 72716, USA. Stephenson: (corresponding author) Assistant Professor of Economics, School of Business, Georgia Gwinnett College, 1000 University Center Lane, Lawrenceville, GA 30043, USA. Wilsker: Associate Professor
of Economics, School of Business, Georgia Gwinnett College, 1000 University Center Lane, Lawrenceville, GA 30043, USA.

JOURNAL OF ECONOMICS AND FINANCE EDUCATION ∙ Volume 18 ∙ Number 1 ∙ Summer 2019
68
coping with setbacks and less academic confidence overall if they are the first in their family to attend college.
Another possibility is that the high level of ethnic diversity and percentage of older students at an access
institution could lead to the stimulation of a greater (or lesser) amount of student interest in economics as a
result of taking either macro or micro first. This greater (or lesser) amount of interest generated in their first
course could then be carried forward to improve (or worsen) engagement and outcomes in their second
course. For example, much of the content in macroeconomics is international in nature or related to the labor
market which could be of especially strong interest to older or more ethnically diverse students. Alternatively,
it might be the case that the topics covered in microeconomics (markets, competition, the impact of price
controls, etc.) results in a higher level of interest among those students. Because of potential differences such
as these, it is important to add studies of access institutions to the literature.
Students in this study attend an open-access, four-year public college serving over twelve thousand
students. The college is the most ethnically diverse college (either public or private) in the Southern Region
(U.S. News & World Report 2017; Georgia Gwinnett College 2016). A third of the institution’s students are
non-traditional (older), and the college is recognized as a Military Friendly School (Georgia Gwinnett
College 2017). The school was modeled after a liberal arts college, and class sizes, even for popular courses
such as principles of microeconomics and macroeconomics, are capped at 40 students per section (with a
college-wide average class size of 21). Our primary focus as faculty is on teaching, student engagement, and
mentoring, and our goal in this study is to generate research with a direct bearing on practices in economics
education at institutions similar to ours.
At present, there is no recommended economics principles course ordering at our institution, although the
courses are numbered such that macroeconomics precedes microeconomics numerically. Microeconomics,
on the other hand, is a prerequisite for Financial Management, and so many advisors advise students to take
microeconomics first. The discussion about making one principles course a pre-requisite for the other has
been ongoing at our institution, with those teaching macroeconomics the most adamant about using micro as
a prerequisite for that course. Administration requested evidence that establishing a prerequisite order would
benefit students, so we decided to review other schools’ catalogs for a consensus. Of the 58 regional colleges
we investigated, 50 offered separate principles of microeconomics and macroeconomics courses. Of these,
33 (or 66 percent) specified no required order, 9 (or 18 percent) required microeconomics first, and 8 (or 16
percent) required macroeconomics as the pre-requisite for micro. Our findings somewhat deviate from those
using the Princeton Review’s Best 380 Colleges in that those schools were relatively more likely to designate
microeconomics as a pre-requisite for macroeconomics than in our subsample. A significant majority of
schools in that group (67 percent), however, still specify no order for the principles courses (Prante 2016)
Given the variation across institutions, we explored the literature on economic education for insight.
Much of the empirical research suggested macroeconomics first was preferable, but this research was
conducted at more selective institutions and was counter to some faculty members’ expectations. Opinions
in our department were as diverse as the paradigms around us, and here we find ourselves, asking on behalf
of the discipline: does order matter?
There are reasons to expect that order matters for students’ grades, but such reasoning supports
hypotheses on both sides of the issue. Macroeconomists, for example, assert that much of their theory is
rooted in microeconomic foundations. For example, theories of money supply and demand or chapters on
labor markets and unemployment are built around microeconomic principles. Students entering
macroeconomics with a better understanding of microeconomics may grasp content more quickly or more
thoroughly in a subsequent macroeconomic class, enabling professors in these courses to cover more topics
or existing content at a greater depth.
On the other hand, some research suggests that macroeconomics before microeconomics may be the
preferable order. Macroeconomics includes topics such as GDP and unemployment with which students
might be more familiar from stories in the media, perhaps making initial connections easier and faster. While
there is an abundance of microeconomic stories in the news, too, students’ unfamiliarity with
microeconomics may hamper their connection between course content and current events. Given greater
familiarity with macroeconomics, taking this course first may improve students’ economic thinking and
outcomes more than the opposite sequence.
We test the extent to which order matters in principles courses, differentiating our study from others in
two ways. First, we employ econometric approaches not used in previous studies. Many of the cited studies
on the proper micro/macro sequence are more than 20 years old, and methods to control for unobservable
characteristics or correlated error terms were less developed at the time. It is possible that we reach different
conclusions when correcting for statistical issues. Second, we analyze student data from an open-access, four-

JOURNAL OF ECONOMICS AND FINANCE EDUCATION ∙ Volume 18 ∙ Number 1 ∙ Summer 2019
69
year college, one of many institutional types underrepresented in education research. Differences in student
body compositions and academic preparedness could affect findings. Using our selected econometric models
and open-access student body data, we find that taking principles of macroeconomics either before or
simultaneously with principles of microeconomics has a specification-robust positive effect on student
outcomes, while evidence for taking microeconomics first is mixed at best.
The article that follows represents our contribution to the collective discussion among economists
regarding economic education. We begin with a review of the relevant literature. In Section 3, we describe
the data obtained from student records at our institution and our modeling approaches. In Section 4, we
present results using both restrictive and non-restrictive parametric assumptions. We conclude with a
discussion of our findings.
Previous Research
The lack of consensus among undergraduate economics programs regarding the ordering of
microeconomic versus macroeconomic principles is consistent with the mixed and contradictory results in
the economics education literature regarding the optimal ordering of those classes. Most popular economics
teaching handbooks and teaching survey articles in the literature do not address the ordering of principles-
level economics courses (Hoyt and McGoldrick 2012; Hansen et al. 2002; Watts and Schaur 2011; Becker
1997, 2000; Siegfried and Walstad 1998; Saunders and Walstad 1990, 1998). Some researchers have,
however, specifically explored the ordering issue and found that taking microeconomics first will produce a
better understanding of economics (Fizel and Johnson 1986), while others have concluded taking
macroeconomics first may improve grades in microeconomics but not the other way around (Lopus and
Maxwell 1995; Perumal 2012; McCoy et. al. 1991). Another study determined that concurrent enrollment in
the two courses is optimal (Terry and Galchus 2003). Given the disparate findings, it is important to consider
these ordering studies in more detail.
Lopus and Maxwell (1995) examine sequencing effects using a sample of Test of Understanding of
College Economics III data from research universities, liberal arts colleges, and two-year colleges. As
mentioned above, they find completing macro first improves micro scores, but not the other way around. The
authors attribute their findings to the following two possibilities. First, instructors may emphasize economic
forces when teaching macroeconomics that better prepare students for micro whereas microeconomic
instructors do not relate material to macroeconomics. Second, some instructors may include microeconomic
material when teaching macro such that when students take microeconomics after macroeconomics, content
is more familiar to students who previously completed macroeconomics.
Perumal (2012) measures sequencing effects using students’ grades on a sample of 405 students from the
University of Canberra in Australia. Taking macroeconomics before micro improves students’ grades in
microeconomics by an average of seven percent, while taking micro first does not have a significant effect
on macroeconomics grades. McCoy et al. (1991) similarly use grades as a dependent variable in an education
production function and conclude that microeconomics before macroeconomics has no statistically
significant effect on grades in macroeconomics, but the opposite order appears to improve outcomes in
microeconomics. All three studies (Lopus and Maxwell 1995; Perumal 2012; McCoy et al. 1991) use
independent OLS models to estimate the ordering effect, meaning one for micro grades and another for
macro. Therefore, results may be impacted by the presence of correlation across residuals.
Fizel and Johnson (1986) administered the Revised Test of Understanding of College Economics to
students at The University of Wisconsin to assess how ordering principles classes affect students’
understanding of economics. Using two-stage least squares and OLS regressions in many different
specifications, the authors find that taking micro first improves students' understanding of economics,
contradictory to the two studies previously cited. The authors also emphasize that there is a need for similar
studies at different schools because of the variation across educational settings and institutions. Our analysis
here constitutes the first study to be performed at an access institution where a large part of the student body
consists of non-traditional and first-generation college students and is noted for its ethnic, racial, and cultural
diversity.
Terry and Galchus (2003) use both OLS and ordered probit regressions on a sample of 870 business
students at the University of Arkansas at Little Rock to determine sequencing effects. These researchers find
that the optimal approach is for students to take micro and macro concurrently, with micro prior to macro
being the second-best sequence. The authors conclude that the benefits from taking both courses concurrently

JOURNAL OF ECONOMICS AND FINANCE EDUCATION ∙ Volume 18 ∙ Number 1 ∙ Summer 2019
70
may be a result of synergies, as both courses contain common terminology and similar frameworks of
analysis, as well as increased focus on the part of students taking two closely related courses at the same
time.
Lastly, other authors have considered the ordering issue and recommended a single principles course in
which students are taught economic literacy, eliminating some of the traditional material from the dual
principles-course approach. Hansen et al. (2002) argue that students would be better served by a single course
without some components such as cost curves, elasticity computations, graphing, national income
accounting, comparisons of imperfectly competitive industries, multiplier formulae, and aggregate demand
and supply, while adding components such as a focus on problems, policies and issues, and creating more
opportunities to practice economics. For those students who would continue on to focus their studies on
economics, the authors envision a second, more advanced principles course that would incorporate more
graphs, equations, rules for optimization, the derivation of supply and demand curves, and other tools.
As described above, existing studies on course ordering contain conflicting results and therefore
conflicting suggestions for prerequisite requirements. We attempt to add to this ongoing discussion by using
a number of econometric approaches to examine the ordering effects of principles economics courses on
students’ grades. By implementing a variety of approaches, both parametric and non-parametric, we can more
easily compare our results to the previous literature.
Data and Methods
We have data on 5,762 students who completed one or both economics principles courses between the
spring semester of 2007 and the fall semester of 2013. By the end of this time period, 1,596 students had
taken both courses, and 1,203 students had taken them both at our institution. We restricted our sample to
this last group of students to better control for instructor fixed effects.
Business majors are the only students that are required to take both principles courses at the sampled
institution. Using the typical GPA scale (A=4, B=3, etc.), the mean micro (macro) grade was 2.719 (2.868),
implying the average student within the sample fared a little better in macro than micro. Students completing
one course may fall into a variety of categories including dual enrollment (high school) students, transient
students on our campus for one semester, students that transferred to other schools after taking one economics
course, students that chose not to continue with their education, students pursuing a minor in business,
students that changed their major from business, or students completing a requirement for outside programs
such as pre-pharmacy. Our institution offers a one-semester introductory economics course for non-business
majors that satisfies core education requirements, helping to create principles courses that almost exclusively
serve business students. Over half of the 1,203 students in this study were declared business majors when the
data were collected. Another 18 percent are listed as undeclared, but it is likely that such students are leaning
towards a major in business given that business is the only major required to take both courses. For other
students, it is possible that they change their major from business after (or while) completing the sophomore
level courses or they intend to change their majors to business but failed to file the appropriate paperwork
with the registrar’s office. Anecdotally, we know that the percentage of students verbally declaring business
at the time of the principles course exceeds that which is suggested in our data.
Our measure of student performance, grades, was provided by the institution’s registrar along with other
key variables such as the semester courses were taken, course instructors, and students’ GPAs. Economic
literacy, or “ability,” is a potential variable of interest. Unfortunately, such data is not readily available.
Grades, as a dependent variable, are subject to inflation through assignments that assess effort over economic
understanding. It is also possible that students with poor grades have a greater understanding than what their
grades reflect if the student fails to turn in required assignments. Although grades and underlying ability are
not perfectly correlated, we contend that the two are likely positively correlated, and as such, grades are a
reasonable choice for a dependent variable. Grades are also more relevant when examining students’
progression, a metric now used to determine funding for higher education in our state. We can thus treat
grades directly as a variable of interest (for the purposes of retention, progression, and graduation) or as an
outcome variable contingent on the underlying latent variable, ability.
Because the distribution of grades is our outcome of interest, we will spend some time discussing these
before we move to the analysis. Table 1, panel (a) presents mean grade (measured in grade points, A = 4, B
= 3, C = 2, D = 1, F = 0) from the first time taking a course based on the course ordering. Figure 1 shows the

JOURNAL OF ECONOMICS AND FINANCE EDUCATION ∙ Volume 18 ∙ Number 1 ∙ Summer 2019
71
full distribution of first-attempt grades in microeconomics, while Figure 2 shows the full distribution for
macroeconomics. Figures 3 and 4 illustrate the correlation between the two courses.2
Table 1: Grades and Nonparametric Tests of Equality
(a) Summary statistics of course grades by course ordering
Course Micro Macro N
Ordering grade grade
Grade
Micro first
2.591 2.878 428
Macro first 2.787 2.845 567
Simultaneous 2.798 2.909 208
(b) P-values from Wilcoxon tests of equality of distributions
Hypothesis test p-values
Micro first vs. Macro first 0.008 0.474
Micro first vs. Simultaneous 0.017 0.000
Macro first vs. Simultaneous 0.541 0.220
Notes: Mean grade (A = 4, B = 3, C = 2, D = 1, F = 0) is displayed for each subsample, along with p-
values for Wilcoxon tests of equality.
Figure 1: Micro Grade distribution
Notes: n = 1,203.
2 A brief interpretation aid: the large dark rectangle in the lower left of Figure 3 indicates students who received an ‘A’ in both courses. The width of the rectangle indicates the proportion of all students who earned an ‘A’ in microeconomics, while the height
of the rectangle indicates the proportion who earned an ‘A’ in macroeconomics, conditional on having earned an ‘A’ in
microeconomics. From this we see that almost no one who earned an ‘A’ in micro earned a ‘D’ or ‘F’ in macro (the very thin slivers in the top left), while some of those who earned an ‘F’ in micro nonetheless earned an ‘A’ in macro (the dark rectangle in the bottom
right corner of Figure 3). A similar pattern is visible in Figure 4.
0
5
10
15
20
25
30
35
A B C D F
Per
cen
t Fr
equ
ency
Micro Grade

JOURNAL OF ECONOMICS AND FINANCE EDUCATION ∙ Volume 18 ∙ Number 1 ∙ Summer 2019
72
Figure 2: Macro Grade Distribution
Notes: n = 1,203.
Figure 3: Micro-Macro Heat Map with Micro Bins
Notes: n = 1,203. Bar widths sized to Micro Grade relative frequencies.
0
5
10
15
20
25
30
35
40
A B C D F
Per
cen
t Fr
equ
ency
Macro Grade
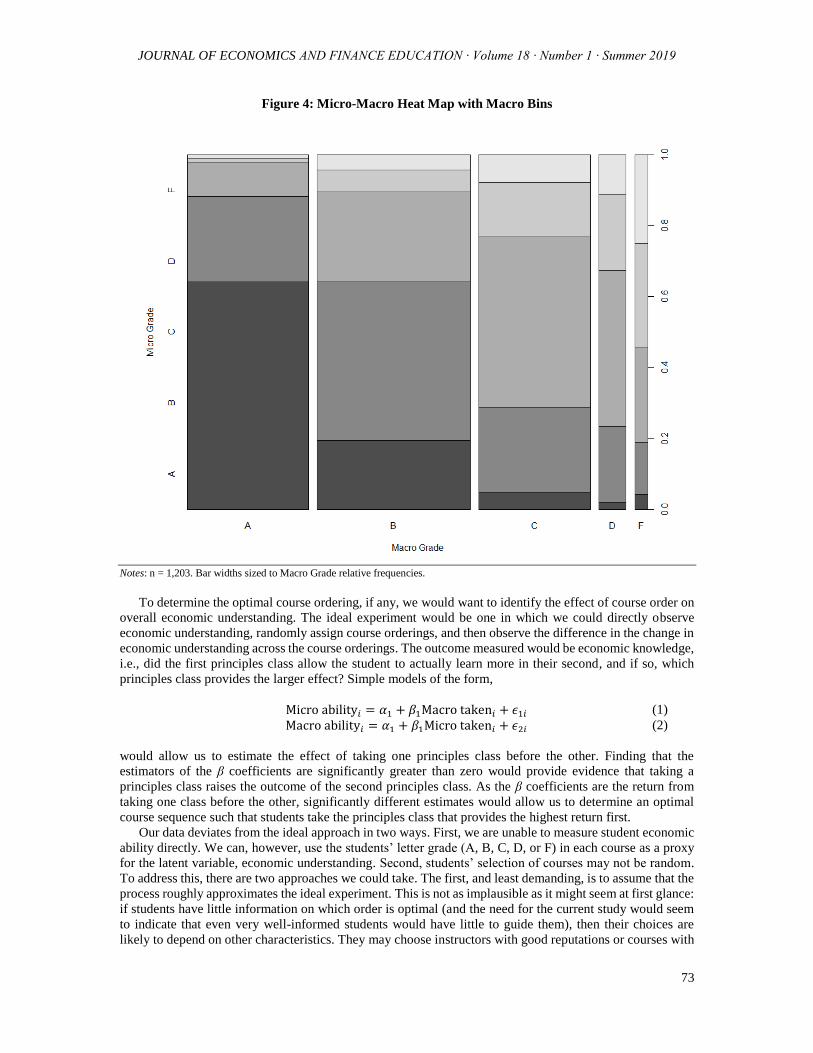
JOURNAL OF ECONOMICS AND FINANCE EDUCATION ∙ Volume 18 ∙ Number 1 ∙ Summer 2019
73
Figure 4: Micro-Macro Heat Map with Macro Bins
Notes: n = 1,203. Bar widths sized to Macro Grade relative frequencies.
To determine the optimal course ordering, if any, we would want to identify the effect of course order on
overall economic understanding. The ideal experiment would be one in which we could directly observe
economic understanding, randomly assign course orderings, and then observe the difference in the change in
economic understanding across the course orderings. The outcome measured would be economic knowledge,
i.e., did the first principles class allow the student to actually learn more in their second, and if so, which
principles class provides the larger effect? Simple models of the form,
Micro ability𝑖 = 𝛼1 + 𝛽1Macro taken𝑖 + 𝜖1𝑖 (1)
Macro ability𝑖 = 𝛼1 + 𝛽1Micro taken𝑖 + 𝜖2𝑖 (2)
would allow us to estimate the effect of taking one principles class before the other. Finding that the
estimators of the β coefficients are significantly greater than zero would provide evidence that taking a
principles class raises the outcome of the second principles class. As the β coefficients are the return from
taking one class before the other, significantly different estimates would allow us to determine an optimal
course sequence such that students take the principles class that provides the highest return first.
Our data deviates from the ideal approach in two ways. First, we are unable to measure student economic
ability directly. We can, however, use the students’ letter grade (A, B, C, D, or F) in each course as a proxy
for the latent variable, economic understanding. Second, students’ selection of courses may not be random.
To address this, there are two approaches we could take. The first, and least demanding, is to assume that the
process roughly approximates the ideal experiment. This is not as implausible as it might seem at first glance:
if students have little information on which order is optimal (and the need for the current study would seem
to indicate that even very well-informed students would have little to guide them), then their choices are
likely to depend on other characteristics. They may choose instructors with good reputations or courses with

JOURNAL OF ECONOMICS AND FINANCE EDUCATION ∙ Volume 18 ∙ Number 1 ∙ Summer 2019
74
convenient times or locations. While these are non-random, they may be uncorrelated with course order,
which is to say, “random enough” to approximate random assignment. This approach would allow for simple
comparisons with very few assumptions required, and would also have the benefit of easy interpretation.
The other approach asserts that sortation into courses is not “random enough.” For example, it may be
the case that some instructors provide better introductory material, and that students are aware of this and
provide such insight to their fellow students. These information flows would imply that students with more
aptitude for or interest in learning about course selection would also be more likely to choose optimally,
which would imply biased estimates of the effect of course ordering on overall understanding. This is just
one of many arguments for taking measures to try to more precisely approximate an experiment using
econometric methods to construct appropriate counterfactuals. These methods have the disadvantage of
requiring more extensive modeling assumptions, being more data-intensive, and providing less in the way of
straightforward interpretations. They do, however, provide the advantage of avoiding biased estimates of the
treatment effect.
In this study, we consider both approaches. The least restrictive assumptions allow for a broader view,
while the more restrictive assumptions provide more clarity as to the accuracy of our identified effect, if any.
A total of three econometric approaches appear in this study. The first and least restrictive approach is the
Wilcoxon rank-sum test of equality of two distributions. This provides simplicity, but does not allow for
conditional mean estimation of the treatment effect.
The Wilcoxon rank-sum tests make very few distributional assumptions. A causal interpretation,
however, treats the data as though any variation in the students’ choice of course order is strictly exogenous
or random. Because this may not be the case, we can consider other methods with more restrictive
assumptions to try to control for nonrandom selection issues. Multiple estimation techniques are used to
better understand the ordering effects of principles courses on grades. First, if we are willing to assume that
the error term follows a standard normal distribution, then we can use an ordered probit model to estimate
the effect of having taken a previous or concurrent economics course. Including other controls for student,
faculty, and course characteristics, we have the following two full models:
Micro grade𝑖 = 𝛼1 + 𝛽1Macro taken𝑖 + 𝛾1Simultaneous𝑖 + 𝛿1𝑋𝑖 + 𝜃1𝐹𝑖 + 𝜆1𝑓𝑖 + 𝜙1𝑇𝐼 + 𝜖1𝑖 (3)
Macro grade𝑖 = 𝛼2 + 𝛽2Micro taken𝑖 + 𝛾2Simultaneous𝑖 + 𝛿2𝑋𝑖 + 𝜃2𝐹𝑖 + 𝜆2𝑓𝑖 + 𝜙2𝑇𝐼 + 𝜖2𝑖 (4)
where Micro gradei and Macro gradei are the student’s ordinal grades in the respective principles class; α an
intercept; Macro takeni and Micro takeni are dummy variables for those students that took microeconomics
or macroeconomics, respectively, in a previous semester; Simultaneousi is an indicator for those students who
took both classes during the same term; Fi and fi are faculty fixed effects for each principles class; Ti are
semester fixed effects; Xi is a vector of individual characteristics (prior academic achievement, other-course
outcomes, age, gender, number of credit hours, and major); and εi is a well-behaved error term. We also
cluster the errors around the faculty fixed effects to better account for different grading distributions among
professors.
Because these models describe processes at the same institution occurring with the same student body,
the assumption that the error terms would be uncorrelated across the models would likely be violated. Thus,
we implement a third econometric approach, seemingly unrelated regression (SUR) to allow for correlation
between the models and to estimate the coefficients of both models simultaneously. This approach allows the
use of a Wald test to directly test whether β1 = β2, something which cannot be done when estimating (3) and
(4) independently of one another.
Results
We begin with the results from our nonparametric hypothesis tests to see if there are differences in the
underlying distributions without regard to other conditions. These results are in panel (b) of Table 1. The
response variable is either the grade achieved in the first attempt at taking Principles of Microeconomics or
the grade achieved in the first attempt at taking Principles of Macroeconomics, depending on the column. In
the first row, we see that there is a difference in micro grades between the group that took micro first and the
group that took macro first (p = 0.008—in this test we are testing the difference between the 2.591 mean
grade in micro from the macro-first group and the 2.787 mean grade in micro from the macro-first group),
but that there is no difference in macro grades between these groups (p = 0.474—here we are testing the

JOURNAL OF ECONOMICS AND FINANCE EDUCATION ∙ Volume 18 ∙ Number 1 ∙ Summer 2019
75
2.878 vs. 2.845). We also find those who take the course simultaneously outperform those who take micro
first in both courses (p = 0.017 for micro grade differences, p < 0.001 for macro grade differences). These
results provide some preliminary evidence: Students who take macroeconomics first or the two subjects
concurrently perform significantly better in microeconomics. However, it is important to note that the higher
GPA in all orderings of macro may make it more difficult for a student to improve their macro score after
taking micro versus the reverse case. Also, causal inference should be cautioned against in this case, as other
differences between these groups may be nonrandom.
We can have more confidence in our inferences by controlling for observable differences among students
in the different conditions. Table 2 presents summary statistics for our student-specific control variables. We
have data on prior academic achievement, other-course outcomes, age, gender, number of credit hours, and
major. In addition, we can identify the instructor of the course, as well as the term, and we use these controls
in a number of specifications to check for the robustness of our results. Ideally, we would want to control for
race, first-generation status, and parent’s education levels, but these and other socio-economic variables were
not available from our data source.
Table 2: Student-specific control variable summary statistics.
Continuous variable Mean SD Min Max
Freshman year GPA 2.937 0.987 1 4
Current term GPA (exclusive of the econ course) 2.308 1.097 1 4
Enrolled credit hours for current term 7.346 5.527 3 19
Age at matriculation 24.450 7.183 16 54
Binary variable Percent frequency
Male 52.4
Major: biology 6.3
Major: business 56.3
Major: chemistry 0.1
Major: criminal justice 1.6
Major: English 0.6
Major: exercise science 2.6
Major: history 1.3
Major: information technology 5.4
Major: math 1.2
Major: pre-nursing 0.7
Major: political science 1.3
Major: psychology 4.0
Major: special education 0.4
Major: undeclared 18.1 Notes: n = 1,203. Minimums and maximums rounded to the integer.
The results from several ordered probit models are visible in Table 3. Here, the dependent variable is a
student’s ordinal letter grade (A through F) in either micro or macro. The simplest model includes none of
the controls mentioned, while in the most comprehensive model, we include professor and term fixed effects,
professor-term interactions, and student characteristics. In every model we see that taking either
macroeconomics first or concurrently improves a student’s expected microeconomics grade. These results
are relatively robust with respect to magnitude as well. Students are shown to perform better in their second
economics course. That is, the estimated effect of having taken micro first on a student’s macro grade, as
well as the estimated effect of having taken macro first on micro, is positive. Additionally, taking the courses
simultaneously is estimated to improve one’s micro grade but to have no effect (positive or negative) on their
macro grade. Specifically, in the 2 models with the highest level of control (column 5), a student who has
already taken micro is estimated to be 34% more likely to earn a higher letter grade in macro than other
students, on average. The estimated impacts on micro grades are noticeably higher, with students who have
already taken macro being 69.7% more likely to earn a higher letter grade in micro, on average. Even larger
in magnitude is the estimated impact of simultaneous enrollment on one’s micro grade, 91.9%, though the
magnitude of this estimate is less robust to included controls, ranging 35.7-59.0% in the other models.

JOURNAL OF ECONOMICS AND FINANCE EDUCATION ∙ Volume 18 ∙ Number 1 ∙ Summer 2019
76
Table 3: Ordered Probit Results
Independent variable Model
(1) (2) (3) (4) (5)
Dependent variable = Micro grade
Has taken macro 1.706*** 1.452*** 1.390*** 1.372*** 1.697***
(0.150) (0.132) (0.127) (0.126) (0.162)
Took simultaneously 1.357*** 1.590*** 1.472*** 1.497*** 1.919***
(0.107) (0.143) (0.134) (0.136) (0.174)
Pseudo R2 0.004 0.017 0.022 0.023 0.177
Dependent variable = Macro grade
Has taken micro 1.150 1.285*** 1.365*** 1.358*** 1.340***
(0.100) (0.115) (0.123) (0.122) (0.122)
Took simultaneously 0.915 1.158 1.132 1.119 1.073
(0.064) (0.106) (0.104) (0.104) (0.101)
Pseudo R2 0.001 0.009 0.014 0.015 0.075
Controls
Professor fixed effects
X X X X
Student characteristics X X X
Term fixed effects X X
Professor-term interactions X
Clustered standard errors X X X X
Notes: Values are odds ratios with standard errors in parentheses. Clustered standard errors, when used, are clustered at the professor level (of the course in question). Student characteristics comprise prior academic achievement, other-course outcomes, age, gender,
number of credit hours, and major. Professor fixed effects refers to both courses. *p < 0.10; **p < 0.05; ***p < 0.01. n = 1,203.
Given that observations are drawn from overlapping students and instructors, it seems unlikely that the
errors across models of micro and macro grades are independent, which is why we next use a SUR approach.
In Table 4, we present results from five different SUR ordered probit models. Like before, results show
previously completing a college-level economics principles course improves expected grades in the second
course: taking macro first is associated with a 16.2% - 20.2% increase in the likelihood of a higher micro
grade (models 5 and 3), while taking micro first is associated with a 10.5% - 16.8% increase in the likelihood
of a higher macro grade (models 1 and 5—only marginally significant in some specifications). Also, like
before, concurrent courses improve microeconomics grades but not macroeconomics, on average, and even
then, the magnitude of the point estimate of the effect of macro-first on a student’s microeconomics grade is
larger than the estimated effect of micro-first on their macroeconomics grade. Importantly, Wald tests
indicate that there is no statistically significant difference between the estimated micro first and macro first
coefficients under any of our specifications. Although the effects of order are not statistically different in this
specification based on the Wald test, we do observe a larger magnitude of the odds ratio showing that macro’s
estimated effect on micro is larger than in the reverse. Future research using more data might improve the
ability of this test to distinguish a statistically significant difference between order effects which would be
consistent with the findings from the other specifications used in this study. However, the emerging
significance of those results is not guaranteed.
As a test of whether “outlier students” may be significantly influencing these estimates, we subsample to
business majors between the ages of 18 and 30 and re-estimate the ordered probit and SUR ordered probit
models. Key results from these models are presented in Table 5. The estimated magnitudes of the course
ordering effects do change, but not in large ways, and the overall story remains. As mentioned previously,
we consider one of our primary contributions to be an analysis of a diverse open-access student body.
Therefore, we consider estimates from our full sample (those in Tables 1-4) to be primary, but still find these
subsample tests valuable.

JOURNAL OF ECONOMICS AND FINANCE EDUCATION ∙ Volume 18 ∙ Number 1 ∙ Summer 2019
77
Table 4: SUR Ordered Probit Results
Independent variable Model
(1) (2) (3) (4) (5)
Dependent variable = Micro grade
Has taken macro 1.190*** 1.186*** 1.202*** 1.198*** 1.162***
(0.060) (0.060) (0.061) (0.061) (0.061)
Took simultaneously 1.199** 1.227*** 1.226*** 1.227*** 1.159*
Dependent variable = Macro grade
(0.080) (0.080) (0.081) (0.081) (0.082)
Has taken micro 1.105* 1.118* 1.126** 1.123** 1.168***
(0.061) (0.061) (0.062) (0.062) (0.062)
Took simultaneously 1.095 1.089 1.074 1.071 1.048
(0.077) (0.077) (0.078) (0.078) (0.078)
Wald test: Has taken macro = Has taken micro
χ2 value 0.640 0.400 0.520 0.500 0.001
Prob > χ2 0.424 0.525 0.472 0.478 0.949
Controls
Professor fixed effects X X X X
Student characteristics X X X
Term fixed effects X X
Professor-term interactions X
Clustered standard errors X X X X
Notes: Values are odds ratios with standard errors in parentheses. Clustered standard errors, when used, are clustered at the professor
level (of the course in question). Student characteristics comprise prior academic achievement, other-course outcomes, age, gender,
number of credit hours, and major. Professor fixed effects refers to both courses. *p < 0.10; **p < 0.05; ***p < 0.01. n = 1,203.
Combining the Wilcoxon, ordered probit, SUR ordered probit, and subsample model results, we have
taken a systematic approach to establishing the direction, magnitude, significance, and robustness of the
ordering effects of principles courses in economics. We find that, across varying levels of modeling
assumptions, taking macroeconomics first consistently leads to statistically significant improvements in
microeconomics grades. While students appear to generally perform better in their second economics course,
evidence of micro helping macro is slightly less consistent and often of smaller magnitude than the reverse.
Taking the courses concurrently consistently appears to aid in micro but not macro performance, giving
further evidence that macro education somehow helps micro students but perhaps not (or less so) the opposite.
However, within our only methodology which allows for a direct statistical test of equality for the two effects
(the Wald tests following the SUR ordered probits), we found evidence that the two primary course ordering
effects cannot be called statistically distinguishable, even though the magnitude of the odds ratios indicated
that macro’s estimated effect on micro is larger than in the reverse.
Conclusion
The purpose of this project was to employ a number of methods to determine whether the sequencing of
principles of macroeconomics and microeconomics affects students’ grades in these courses. Looking to
improve students’ educational outcomes and strengthen our curriculum, we assessed how other, similar
schools arranged these courses and reviewed the existing literature on the subject. Previous studies, however,
provided mixed evidence and, in practice, some schools require micro first, others macro, and even more let
students decide. To some extent, differences in the literature may be attributed to statistical issues, such as
failing to account for correlated error terms as well as non-random assignment of students into treatment
groups, or because of a lack of external validity, since studies are based on different types of institutions. To
this end, we find that our main contributions to the literature are: 1. The use of data for an open-access

JOURNAL OF ECONOMICS AND FINANCE EDUCATION ∙ Volume 18 ∙ Number 1 ∙ Summer 2019
78
institution, and 2. The application of multiple econometric techniques to provide a sense of both the
magnitude and the robustness of any course-ordering effects.
Table 5: Sub-sample models, business majors 18-30 years of age
Independent variable Ordered probit SUR ordered probit
Dependent variable = Micro grade
Has taken macro 1.704*** 1.175***
(0.168) (0.063)
Took simultaneously 1.900*** 1.161*
(0.169) (0.084)
Dependent variable = Macro grade
Has taken micro 1.301*** 1.170***
(0.132) (0.060)
Took simultaneously 1.081 1.056
(0.120) (0.081)
Wald test: Has taken macro = Has taken micro
χ2 value 0.002
Prob > χ2 0.930
Controls
Professor fixed effects X X
Student characteristics X X
Term fixed effects X X
Professor-term interactions X X
Clustered standard errors X X Notes: Values are odds ratios with standard errors in parentheses. Clustered standard errors, when used, are clustered at the professor level (of the course in question). Student characteristics comprise prior academic achievement, other-course outcomes, age, gender,
number of credit hours, and major. Professor fixed effects refers to both courses. *p < 0.10; **p < 0.05; ***p < 0.01. n = 502.
With the majority of U.S. students attending less selective institutions (O’Shaughnessy 2011), scholarship
of teaching and learning should include more research on these schools. Our institution, recognized for its
diversity along a number of dimensions, provides an excellent setting for this type of analysis. While our
results fall in line with many of the previous studies, this finding is not one that could easily be extrapolated
given the selectivity inherent in previous studies. Our econometric techniques also differ from earlier studies.
The non-parametric (Wilcoxon tests) results show that students perform better in microeconomics when
they have either already taken macroeconomics or are taking it concurrently. Results from the ordered probit
models differ from the findings of the non-parametric approach but generally suggest the same course
ordering. In these models, taking microeconomics first increases the expected grade in macroeconomics, but
taking macroeconomics first has a larger positive effect on the expected grade in microeconomics. The
magnitudes of these two effects are often comparable and probably not statistically differentiable, although
these models are incapable of distinguishing the estimated impacts statistically. As with the nonparametric
approach, simultaneous courses in microeconomics and macroeconomics appears to improve outcomes in
microeconomics but not macroeconomics. These patterns appear robust to various institutional and student
control variables under this ordered probit approach.
The SUR ordered probit models are broadly consistent with the previous ordered probits. Students score
better in their second economics course, and when taken simultaneously, perform better in micro but not
macro. However, when allowing the models to run simultaneously, the estimated impact of taking macro first
on micro grades is no longer noticeably different (larger) in magnitude than the reverse. Also, based on post-
regression hypothesis tests for these models, there is no evidence that the two effects are statistically different.
To summarize, we have three results that are consistent across all empirical approaches: taking macro
first will improve a student’s micro grade, taking the courses simultaneously will improve a student’s micro
grade, and taking the courses simultaneously will have no impact on a student’s macro grade. Ordered probit
JOURNAL OF ECONOMICS AND FINANCE EDUCATION ∙ Volume 18 ∙ Number 1 ∙ Summer 2019
79
models show an additional impact of micro first on macro grades, but one that is smaller in magnitude than
the consistent impact of macro on micro. Finally, when the ordered probit models are estimated
simultaneously in a SUR framework, we no longer see a difference across those two positive effects.
However, even in this approach, concurrent enrollment has a statistically significant impact on micro but not
macro grades, implying macro may help micro but not the reverse. We see value in all of these empirical
methodologies. The nonparametric approach, for example, has both advantages and disadvantages when
compared to the parametric techniques. Therefore and overall, we feel our results imply that if one course
must serve as a prerequisite to the other, Principles of Macroeconomics should be placed first, as it has the
most consistently estimated impact on student grades.
There are many reasons why taking macroeconomics first might be advantageous. First, macroeconomics
is built on microeconomic foundations, meaning students encounter essential elements of microeconomics
during the macroeconomics course. It is typical for Principles of Macroeconomics to discuss market demand
and supply, which is at the core of many concepts in Principles of Microeconomics. Students begin to build
the skills necessary to think like an economist before more foreign concepts such as elasticity or profit
maximization are introduced. Second, macroeconomics introduces students to current affairs and the
aggregate economy, both of which may pique student interest more than firm-level and perhaps individual-
level theories of microeconomics. This interest could carry forward into subsequent economics courses.
Another reason is that students may be more familiar with macroeconomics from the media. While stories
on microeconomics are abundant, they may be harder for students to identify prior to a microeconomics
course. Articles on GDP, interest rates, and inflation are much more recognizable as economic news. Again,
familiarity with the subject levels the playing field more in macroeconomics courses, whereby having a
previous course in microeconomics does less to improve students’ grades in macroeconomics than the
reverse. Two more explanations for a beneficial macro first-order effect are specific to access institutions.
First is the possibility that these students, often being the first in their family to attend college, receive a larger
confidence boost from performing well in macroeconomics (average grades in macro were higher regardless
of ordering) which leads to better performance in their later micro classes. A second possibility is that the
content in macroeconomics courses which includes many topics that are international in nature or related to
the labor market may generate higher levels of interest among the diverse and non-traditional students at
access institutions, which could lead to higher levels of interest and engagement in microeconomics classes
later on. Finally, as our results show, concurrent enrollment in the two courses can improve student
achievement in microeconomics. Thus, listing macro as prerequisite/co-requisite may be a viable option.
Our unique sample and variety of econometric approaches yield at least a tentative answer to the question,
“Does Order Matter?” The answer, it appears, is “yes,” followed by more questions: “why?” and “now what?”
among them. The results we present should inform both the curriculum design process at schools like ours,
as well as future research on economic literacy and undergraduate economics education. In particular,
additional research on the effects of ordering when the curriculum is intentionally designed to be ordered
would be informative. In addition, our results run counter to some of the theoretical arguments on the
importance of microeconomic foundations as prerequisites for macroeconomics work.
Future research may be of use to determine whether our result differs based on the level of material: at
more selective institutions or in graduate work, there may be more direct links between, for example, choice
theory and agent-based macroeconomic models. In these contexts, the course ordering question may need
revisiting. The significance of program assessment and assurance of learning in economics and business
programs will continue to have economists considering the best way to approach economic foundations in
both microeconomics and macroeconomics. Our institution’s course ordering requirements and/or
recommendations may or may not change as a result of this study, but our desire, along with economics
faculty everywhere, is to provide our students with the greatest gains in economic understanding along with
the highest chance of academic success in our courses.
References
Becker, William E. 1997. "Teaching Economics to Undergraduates." Journal of Economic Literature 35:
1347-373.
Becker, William, E. 2000. "Teaching Economics in the 21st Century." Journal of Economic Perspectives 14:
109-119.

JOURNAL OF ECONOMICS AND FINANCE EDUCATION ∙ Volume 18 ∙ Number 1 ∙ Summer 2019
80
Fizel, John, and Jerry Johnson. 1986. “The Effect of Macro/Micro Course Sequencing on Learning and
Attitudes in Principles of Economics.” Journal of Economic Education 12: 87-98.
Georgia Gwinnett College. 2016. “GGC Highly Ranked For Its Ethnic Diversity, Affordability.”
https://www.ggc.edu/about-ggc/news/News/ggc-highly-ranked-for-its-ethnic-diversity-affordability.
Georgia Gwinnett College. 2017 “Office of Veterans Success.” http://www.ggc.edu/admissions/tuition-and-
fees-and-financial-aid/financial-aid/office-of-veterans-success.
Hansen, W. Lee, Michael K. Salemi, and John J. Siegfried. 2002. “Use It or Lose It: Teaching Literacy in the
Economics Principles Course.” American Economic Review 92: 463-472.
Hoyt, Gail Mitchell, and KimMarie McGoldrick. 2012. International Handbook on Teaching and Learning
Economics. Northampton, MA: Edward Elgar Publishing.
Lopus, Jane, and Nan Maxwell. 1995. “Teaching Tools: Should We Teach Microeconomic Principles Before
Macroeconomic Principles?” Economic Inquiry 33: 336-350.
Ma, Jennifer, and Sandy Baum. 2016. “Trends in Community Colleges: Enrollment, Prices, Student Debt
and Completion.” College Board Research: Research Brief, April.
https://trends.collegeboard.org/sites/default/files/trends-in-community-colleges-research-brief.pdf.
McCoy, James P., David W. Brasfield, and Martin I. Milkman. 1991. “The Impact of Macro/micro
Sequencing.” Journal of Education for Business 66: 223
O’Shaughnessy, Lynn. 2011. “20 Surprising Higher Education Facts.” U.S. News and World Report.
https://www.usnews.com/education/blogs/the-college-solution/2011/09/06/20-surprising-higher-education-
facts.
Perumal, Muni. 2012. “Should we Teach Microeconomics before Macroeconomics? Evidence from an
Australian University.” Australasian Journal of Economics Education 9: 1-14.
Prante, Gerald. 2016. “A comparison of Principles of Economics Curriculum across U.S. Colleges and
University.” The E-Journal of Business Education & Scholarship of Teaching 10: 73-84.
Saunders, Phillip, and William B. Walstad. 1990. The Principles of Economics Course: A Handbook for
Instructors. New York: McGraw-Hill.
Saunders, Phillip, and William B. Walstad. 1998. Teaching Undergraduate Economics: A Handbook for
Instructors. New York: Irwin/McGraw-Hill.
Siegfried, John J., and William B. Walstad. 1998. “Research on Teaching College Economics.” In Teaching
Undergraduate Economics: A Handbook for Instructors, edited by William B. Walstad and Phillip Saunders.
New York: McGraw-Hill.
Terry, Andy, and Ken Galchus. 2003. “Does Macro/Micro Course Sequencing Affect Student Performance
in Principles of Economics Courses?” Journal of Economics and Finance Education 2: 30-37.
U.S. News & World Report. 2017. “Campus Ethnic Diversity.” https://www.usnews.com/best-
colleges/rankings/regional-colleges-south/campusethnic-diversity.
Watts, Michael, and Georg Schaur. 2011. “Teaching and Assessment Methods in Undergraduate Economics:
A Fourth National Quinquennial Survey.” The Journal of Economic Education 42: 294-309.

JOURNAL OF ECONOMICS AND FINANCE EDUCATION ∙ Volume 18 ∙ Number 1 ∙ Summer 2019
81
The Power of Interest: Connecting the Real World
to the Finance Classroom
Alma D. Hales, Laura Cruz, and Jacob Kelley1
ABSTRACT
This study examines how the incorporation of a project utilizing real-
world financial data from the Bloomberg Professional Service affects
student engagement in an introductory finance course. This mixed
methods study demonstrates that the project provides insight into the role
played by receptivity, relevance, discipline, and integration in bridging
the gap between teaching and learning and between theory and practice.
Introduction
A basic tenet in finance is that a dollar today is worth more than in the future due to the power of interest.
But the importance of interest in the finance classroom extends beyond the principles of time value of money.
The type of interest that makes our students curious about the world of finance can make positive and
significant contributions to their learning. While there are multiple pathways towards increasing student
interest, research in learning sciences strongly suggests that the perceived relevance of course material may
play a significant role (Brown et al. 1989; Sperber and Wilson 2004). This is especially the case for applied
sciences, such as those fields commonly represented in business, for which the clear and direct connection
between the subject matter and career success is what many students cite as their primary reason for selecting
the major (Malgwi et al. 2005). Bringing the real-world to the classroom is compelling in theory; in practice,
however, it has proven challenging to implement and no single pedagogical standard has emerged to define
how this could or should be accomplished whether in business or other fields (Carlile et al. 2016; Donovan
et al. 2006).
In this study, we assess efforts to harness the power of student interest in an introductory finance course
through the integration of real-world tools and project-based learning. Our study aligns with recent literature
on using technology and analytics to teach economics and finance (Evans and Jones 2016; Gehy and Hoffman
Smith 2016; Keys 2016; Kazemi 2015). However, our study contributes to the literature in a distinct way.
Rather than discussing details that illustrate how to implement a singular intervention, such as the use of
Bloomberg terminals or project-based learning (both used in the study), we focus on larger questions of how
the implementation of such an intervention, especially at an early stage in the curriculum, affects the student
learning experience. The findings of our mixed methods study indicate that principles of finance courses can
reach beyond knowledge acquisition and skill development. With proper guidance, students in introductory
courses can be motivated to use the tools of inquiry and, through them, extend those principles into the
complex, real-world.
Related Literature
Research on active learning strategies, such as project-based learning, spans several decades, with the
majority of studies indicating positive results when implemented effectively (Freeman et al. 2014; Lee et al.
2014; Prince and Felder 2006). With this consensus, the questions to be answered have shifted from whether
or not these approaches work to how to make them work well within specific disciplinary contexts, across
1 Alma D. Hales, Tennessee Tech University, Department of Economics, Finance & Marketing, 1 William L. Jones Drive, Cookeville, TN 38505, Phone: (931) 372-3717, E-mail: [email protected]; Laura Cruz, The Pennsylvania State University,
Schreyer Institute for Teaching Excellence, State College, PA 16802, Phone: (814).865-0428, E-mail: [email protected]; Jacob
Kelley, Tennessee Tech University, Center for Innovation in Teaching and Learning,1 William L. Jones Drive, Cookeville, TN 38505, Phone: (931) 372-6950, E-mail: [email protected]; The authors wish to thank two anonymous referees for
comments that helped improve the paper. The usual disclaimer applies.
JOURNAL OF ECONOMICS AND FINANCE EDUCATION ∙ Volume 18 ∙ Number 1 ∙ Summer 2019
82
different mediums, and/or with distinctive audiences. That being said, challenges to implementation persist
throughout higher education and recent research has focused on identifying those factors that impede teaching
transformation; including (among others) attention to the role of diverging disciplinary standards, low faculty
motivation to change, and unclear connections between teaching and research (Dallas et al. 2014; Porter and
Graham 2016).
In the case of business education, these factors appear less applicable. The primary accrediting body for
colleges and schools of business in the United States, the Association to Advance Collegiate Schools of
Business includes in its mission the goal to “amplify impact in business education.” AACSB standards
include significant time and attention paid to fostering and assessing student learning outcomes, adopting
best practices in teaching, and actively engaging students in real-world business challenges through
curricular, co-curricular, and extra-curricular activities. Faculty in colleges and schools of business are often
engaged directly in that real-world as consultants, business owners, board members, and related roles. Thus,
one of the fundamental assumptions of the business mindset is the need for constant adaptation to a changing
environment.
This adaptive orientation is evident in the burgeoning literature on best practices in business education;
business faculty have served as pioneers in several key areas of contemporary pedagogical practice including
technology-mediated instruction (classroom-based technologies, on-line and hybrid modes of instruction,
and virtual simulations) (Alavi and Leidner 2001; Arbaugh 2014; Arbaugh et al. 2009; Davis et al. 2005;
Duxbury et al. 2016; Farley et al. 2011; Hornik et al. 2008; Whitaker et al. 2016; Yu et al. 2014);
interdisciplinary integration (ethics, communication, social justice/law) (Toubiana 2014); and problem-based
learning (case studies, simulations, and role-play) (Anderson and Lawton 2014; Bigelow 2004; Farrell 2005;
Stahl and Dunning 2015; Stinson and Milter 1996). Many of the innovations within business education fall
under the umbrella of engaged or authentic learning, in which student activities are closely connected to the
world outside of the classroom. This is a link that is often emphasized in marketing materials for the college
or school (Fink 2013; Herrington et al. 2014; Rule 2006). Despite this initial success, business schools, like
other areas in academia, have struggled to move from the early adopter to the late majority phase on the
diffusion of innovation curve (Eschenfelder et al. 2014; Watty et al. 2016).
It is possible that the solution may emerge through disciplinary-based educational research. Business
education is an aggregate term that aligns with the AACSB’s college-level accreditation process and the
widespread implementation of an integrated core business curriculum. That aggregation has facilitated large-
scale studies of key educational indicators, such as student success, but it glosses over differences between
disciplines housed in the college, such as accounting (which has an especially lively teaching research base),
management, information systems and finance. Each of these disciplines face distinct challenges in student
learning and faculty adoption.
In the case of finance, students grapple with a set of inter-related challenges. The study of finance requires
advanced proficiency in quantitative analysis, a set of skills which have been identified as daunting in many
academic disciplines (Conners et al. 1998; Jain and Dowson 2009; Pan 2003) but especially when compared
to other, relatively less-quantitative majors within business. It could be said that finance instructors must
contend with a student perception of relative deprivation (Sanford et al. 2014; Theodosopoulos et al. 2014).
This emphasis on quantitative proficiency contributes to the perception that finance classes are more
challenging than others in the core, so students enter the class with a sense of trepidation or foreboding, which
can affect their receptivity to the material (Worthington 2002). Finally, the need for advanced skill
proficiency often drives instruction, meaning that students spend considerable amounts of time on skill
development versus application, analysis, or synthesis (Grove and Wasserman 2006; Janor et al. 2013;
Mauffette et al. 2004; McCullough and Munro 2016; Wentworth and Funck 2015). The latter are not only
valued as higher order thinking skills, but they are also closely correlated with student satisfaction (Smith
and Cook 2012).
Methodology
This study examines how integration of the Bloomberg Professional Service and project-based learning
affects the student experience in Principles of Managerial Finance, an introductory finance course required
of all business majors. The study took place over the course of one semester at a medium-sized, doctoral-
granting institution located in a suburban region of the southern United States. During the study, only one
instructor taught all (four) sections of the course; three sections met Monday-Wednesday while one met

JOURNAL OF ECONOMICS AND FINANCE EDUCATION ∙ Volume 18 ∙ Number 1 ∙ Summer 2019
83
Tuesday-Thursday. Table 1 below shows the composition, by major, of the 166 participants in the study.
Although this is a finance course, only 11.45% of the participants are pursuing finance as a major. These
demographics highlight the challenge of and the need for increasing engagement in this introductory course.
Table 1: Composition of Sample by Program of Study
Major # of Students % of Sample
Accounting 26 15.66
Business & Information Technology 17 10.24
Economics 6 4.82
Finance 19 11.45
Management 29 17.47
International Business & Cultures 8 4.82
Marketing 26 15.66
Other 35 21.08
Total 166 100.00 Notes: Other includes students with majors outside the College of Business but pursuing
business minors and students in the College of Business with undeclared majors.
To meet this goal, the professor introduced a multi-part project. The project’s objectives are: “enable [the
student] to see how course content is applied in the real business world” and “introduce [the student] to the
Bloomberg Professional Service to enhance [their] marketable skill set.” As a first step, the project requires
students to self-select into groups of three or four and choose a company to analyze. For simplicity, eligible
companies include only those in the S&P 500. After group formation, the project consists of five data
collection stages and three analyses in alignment with course units. Students may report their findings using
their preferred method including essay, presentation, podcast, or infographic.2 The final analysis requires
students to compare and contrast their company to a suitable peer, as determined by the course instructor.
Table 2 displays a subset of data items/guiding questions offered to participants at each stage of the project.
To support participants in the completion of the project, the course instructor offered written feedback for
both the data collection and analysis phases. Students with errors in data collection had multiple opportunities
to make corrections. Furthermore, feedback on Analyses 1 and 2 helps guide the creation of the final analysis.
Table 2: Stages of the Project
Phase 1-Introduction/Company Overview: Collect basic company information including a description of
the company’s main operations and general information on the company’s management.
Phase 2-Time Value of Money: Collect information on the historical rates of return for the company’s
stock and a market index, specifically the S&P 500.
Phase 3-Company’s Bonds & Interest Rates: Collect bond characteristic information for one of the
company’s outstanding bonds including but not limited to coupon rate, issuance date, maturity
date, par amounts, and bond ratings
Analysis 1: What is your company? What does your company do? Why did you select this company?
Did the company fare better than the overall stock market? What does this suggest about stock
picking? Consider the coupon rate of this bond. Do you think the rate is attractive? Irrespective
of the coupon rate, what are some attractive qualities of investing in bonds?
Phase 4-Company’s Stock: Collect information on the risk and return of the company’s equity including:
annual mean returns, the standard deviation of returns, and required returns based on the Capital
Asset Pricing Model.
Phase 5-Company Financials: Compile historical financial statements for the company and information
on the company’s financial ratios for over time and relative to an industry average.
Analysis 2: Consider the stock’s required return. Is it increasing or decreasing over time? What is driving
these changes? Is it changes in expected inflation? Changes in risk aversion? Changes in beta?
Analyze the company’s liquidity, asset management, debt and profitability using time series
analysis.
Final Analysis: Which of these two companies do you feel is better managed? Why? Notes: Detailed descriptions for each phase available from the authors upon request.
2 Most students select written report. Exceptions include some PowerPoint presentations and one poster.

JOURNAL OF ECONOMICS AND FINANCE EDUCATION ∙ Volume 18 ∙ Number 1 ∙ Summer 2019
84
To examine the impact of the pedagogical intervention, this study incorporates a variety of assessment
tools. First, we used information gathered from a series of focus group interviews. We invited students to
participate in focus group interviews conducted by the authors not involved in course instruction. This
maximized our ability to obtain unbiased feedback on the implementation of the project. We offered students
extra-credit points in the course and snacks (pizza and drinks) to encourage focus group participation. To
ensure that participation remained strictly voluntary, the instructor offered all students an alternative extra
credit opportunity, with 76 opting into the alternative. For the focus group interviews, a total of sixty-three
students participated in seven distinct groups centering on a list of IRB-approved questions including, but
not limited to:
If a friend had the choice of taking FIN 3210 either with or without the Bloomberg tool, what would you
tell them?
If you had to describe the benefits of the Bloomberg tool to an upcoming student, what would you tell
them?
Please describe any challenges or obstacles you experienced in using the Bloomberg tool.
Following data collection, the researchers applied thematic analysis to the transcripts of the focus group audio
recordings. We first identified potential themes through independent review, which consists of the
researchers locating ideas or experiences that were shared among the participants across focus group
interviews (Patton 2015). Then we used NVivo, a qualitative analysis software package, to search the
transcripts and analyze word frequency to assess support of our themes. This allowed us to explore the data
in a different way in an attempt to infuse trustworthiness into our study (Marshall and Rossman 2016).
The researchers also searched for evidence of student engagement by analyzing student learning
outcomes. First, we review aggregate student performance on a set of course examinations before and after
the intervention. In addition, we review quantitative data from the course’s assurance of learning (AoL)
mechanism. The process includes asking all students enrolled in Principles of Managerial Finance a set of
six standardized multiple choice questions developed and approved by all members of the college’s finance
faculty. The use of the AoL mechanism is an AACSB-accreditation requirement and precedes the
implementation of the Bloomberg project. To examine whether the incorporation of project-based learning
impacts student outcomes, we compare the exam and AoL results across the sections taught by the same
instructor in different semesters—with and without the Bloomberg intervention. Secondly, we evaluated the
final analysis section of students’ Bloomberg projects.3 After removing all identifying information, each
member of the research group and one external member analyzed and rated the student products
independently based on the rubric provided in Table 3. Finally, we averaged the scores across all three
internal raters to develop a composite score.
Table 3: Student Product Scoring Rubric
Factor Description Possible Ratings
Appropriate
Terminology:
The student employs terminology in a clear and
accurate manner as to demonstrate understanding.
When appropriate, the student also defines
terminology.
Absent (1)
Emerging (2)
Proficient (3)
Advanced (4)
Multiple
Dimensions:
The student considers a variety of financial
concepts when deciding on a position in order to
enhance their argument.
Absent (1)
Emerging (2)
Proficient (3)
Advanced (4)
Effective
Argument:
The student articulates a definitive position that was
supported by evidence. Proper writing conventions
are observed.
Absent (1)
Emerging (2)
Proficient (3)
Advanced (4)
External
Connections:
The student makes connections beyond the scope of
the project, including the overall financial
environment and content of other courses.
Absent (1)
Emerging (2)
Proficient (3)
Advanced (4)
3 We used only those projects for which all participating students provided IRB-approved consent, N=19.

JOURNAL OF ECONOMICS AND FINANCE EDUCATION ∙ Volume 18 ∙ Number 1 ∙ Summer 2019
85
Findings and Discussion
The multiple methods of assessing the outcomes of this project revealed several key components of
building student interest in the finance classroom. We have grouped these components into four categories:
receptivity, relevance, discipline, and integration.
Receptivity
Research suggests that student resistance can be a critical factor in the adoption of new teaching strategies,
and it is not uncommon for students to be initially uncomfortable with changes that fall outside of the
expected culture within the department or college (Hayward et al. 2016; Walder 2015). We expected student
resistance since this was the first semester in which students had been asked to complete not just this project
but any project in relation to this Principles of Managerial Finance course. Not surprisingly, student
receptivity was linked to the incorporation of not just a new pedagogical approach but also new technology.
Participants in the focus group interviews expressed having limited knowledge regarding Bloomberg prior
to this course. The majority reported knowing nothing or only having heard of Bloomberg through media,
particularly movies, a perception that confirms previous findings (Gehy and Hoffman Smith 2016). Students
expressed concern over the difficulty navigating the terminal particularly as first-time users, as demonstrated
by the focus group excerpt below:
I am scared of technology so it’s hard for me…
Based on analysis of the focus group interview transcripts with NVivo, we discern 20 references to ambiguity,
which led to some push back from the students. Student resistance to the introduction of new technologies in
the classroom is a well-documented phenomenon (Carty and Baker 2015; Mintu-Wimsatt 2001), though there
is some evidence that the effect is not as significant for business students (Spinelli 2001). Our experience is
in line with these findings since the students point out technical issues. Yet, they do not recommend doing
away with the project or the Bloomberg tool. Instead, they conveyed a desire for additional formal instruction
regarding use of the service. They suggest training videos, class demonstrations, and full days in the lab to
provide step-by-step demonstrations of Bloomberg functions required for the project. Similarly, logistical
issues, particularly a limited number of Bloomberg terminals and limited lab hours, decreased student interest
at first. Rather than solving the problem through direct resistance to the technology, their comments focused
on finding ways to alleviate logistical constraints.
Beyond student receptivity, systemic faculty resistance is often posited as a more critical barrier to
classroom innovation. Business instructors and evaluators are no exception (Redpath 2012). Practitioners
may be tempted to attribute these differences in receptivity to broad demographic factors, but this case, in
which a Generation X professor introduces a new tool directly from the business world to a group consisting
largely of resistant Millennials suggests that such simple lines of causation may not be sufficient. For this
course, the instructor initiated a form of proprietary technology that students would be likely to encounter in
their careers and allowed them to engage directly with the same information used by business professionals.
This strategy resulted in little direct student resistance to the tool or the intervention itself. Rather, student
feedback focused on the logistics and integration of the tool as part of the course, while simultaneously
recognizing the value of working with business-ready applications. Implicit in these results are several
potential lessons for improving both student and faculty resistance to technology-mediated instruction.
Relevance
Another lesson to be drawn from this study is the impact of relevance in the classroom. As mentioned
previously, it is not a new idea to suggest a strong positive correlation between student interest and the
relevance of course material (Rule 2006). That being said, relevance presents a distinctive challenge to
finance, in which the pedagogy is conventionally grounded in the development of advanced quantitative
skills. In this sense, teaching finance is more akin to other fields outside of business, such as statistics or
applied math, in which such skills feature prominently (Conners et al. 1998; Jain and Dowson 2009; Pan
2003). Skill-based learning presents two challenges to fostering relevance. First, skill development is a
graduated process in which students need to develop foundational proficiency before moving on to the next
level and secondly, they need to practice the same skills repeatedly in order to gain proficiency.
Conventionally, these outcomes are accomplished through the use of problem sets that take into account the
level of student ability and allow for repetition. This project did not replace skill building activities but instead

JOURNAL OF ECONOMICS AND FINANCE EDUCATION ∙ Volume 18 ∙ Number 1 ∙ Summer 2019
86
aimed to complement them by bridging the gap between curated problem sets and the complexities of the
finance world. For this project, the instructor spent significant time developing the stages of the project to
align with student abilities, creating a body of resources for technical support and instructions, and identifying
ways in which the parameters of student inquiry using the terminals could be confined to the appropriate
introductory level. To put it another way, students in this course are not prepared (yet) to deal with the full
ambiguity and complexity of financial decision-making. The project, however, was designed to spark their
interest by offering a controlled peek at real-world of finance.
As evidenced by the excerpts below, many students recognize and appreciate the relevance of the course
content to a real-world company, particularly the interpretation of financial ratios. In fact, the NVivo analysis
resulted in 62 references to relevance from the focus group interviews.
As a whole, I feel more prepared to do financial work in a company. It’s nice to real life experience with
real life numbers about a real-life company.
It made it more realistic and relevant. You sit in a class and they talk about things that you may never see
and do. This project went beyond that.
[Our] classes are pretty much providing concepts with math problems. Once you got the math problems
or financial ratio … then you could use Bloomberg say this is what in the real world.
In two instances, students cited direct examples of the relevance of the skills they gained through the project:
… I got an internship this summer and they kind of ask me some information about like some ratios about
their companies like they ask me if I knew any information about their company about how they calculate
ratios and so I went into Bloomberg kind of on my own time and I was able to look that up.
There’s this girl… she is interning in Walmart. They asked her about the company about what she knew,
because of the Bloomberg and everything she did, she could tell them you know, what she knew about it
how it went. So it’s really beneficial….
Table 4: Results from Course Examinations
Panel A: Results from Course Evaluations, All Students
No Intervention Intervention Difference
Exam 1 Mean 64 65.524 1.5244
Std. Dev. (23.001) (19.213)
Exam 2 Mean 68.210 73.055 4.8454*
Std. Dev. (24.115) (17.609)
Exam 3 Mean 64.810 63.4939 -1.316
Std. Dev. (22.6648) (20.057)
N 105 164
Panel B: Results from Course Examinations, Standardized Questions
No Intervention Intervention Difference (% points)
Net Income 94% 93% -1
Time Value of Money 62% 77% +15
Bond Pricing 45% 50% +5
Risk and Return 57% 75% +18
Financial Ratios 78% 70% -8
Capital Budgeting 52% 71% +19 Notes: * represents statistical significance at the 10% level. Statistical difference of means is tested via a t-test
with unequal variances across groups. The “Intervention” sample includes all students completing the course
during the implementation of the Bloomberg Project, Spring 2017. The “No Intervention” sample captures the previous spring semester (2016) when the course was taught by the same instructor with no project.
In addition to the focus group comments, aggregate student performance on a set of course examinations,
shown in Panel A of Table 4 above, suggests gains in student learning after the incorporation of the
intervention. It is important to note that all scores reported are for the same instructor and the content assessed
across the two time periods is similar. No major changes were made to course materials or to the instructor’s
teaching style from one semester to the next. Exam 1 assesses time value of money, bonds, and interest rates
and Exam 2 assesses stocks and financial statements. Finally, Exam 3 is a comprehensive final exam that

JOURNAL OF ECONOMICS AND FINANCE EDUCATION ∙ Volume 18 ∙ Number 1 ∙ Summer 2019
87
encompasses all topics and also measures mastery of capital budgeting issues. Across two of the three course
examinations, differences in performance are not statistically different. However, in Exam 2, student
performance during the intervention time period is higher than in the time period prior to the intervention,
and this difference is statistically significant at the 10% level.
Furthermore, Panel B of Table 4, shows results across a set of common questions across the two time
periods examined. Student performance improved across four of the six questions but decreased substantially
across one area, financial ratios; this is a surprising result given the focus group comments. Overall, we
cannot attribute changes in performance directly to the implementation of the project, as we do not control
for possible confounding effects. However, we view the results as evidence that the project does not hinder
student progress in the course but could have potentially positive learning effects that extend beyond the
subject matter covered directly by the project.
Discipline
Student response to the Bloomberg project varied along disciplinary lines. As shown in the excerpts
below, students report the value of the project to be highest for majors closest to finance and accounting:
I can see if I was a finance major or accounting major like this could be really efficient. [Be]cause
it’s…hands on finance but for me like I don’t really need to know all this stuff.
It really depends on your major. If you are in the finance it could be super useful but you are in human
resources it’s hard.
Furthermore, student receptivity did seem to be linked to the perceived rigor of the course, a perception
that was often tied to major, as follows:
Finance is a very hard subject.
Her class is a very challenging class.
I think as much as how demanding our class is already…
Analysis of the focus group transcripts using NVivo indicates 36 references to difficult/rigorous content.
Nonetheless, based on the focus group interviews, it appears that the project did allow for higher student
engagement with the course material, even outside the finance major. A number of students gained a broader
appreciation of both finance and the Bloomberg service, as suggested by the excerpts below:
Even if you are not a business major…it’s kind of cool that you can go and look at the stocks you know.
And everybody has to retire someday
I can see how it would be useful for you to understand even if you didn’t work on the financial portion of
the company you just understand what they are doing so you could better assist in doing your part.
I am not a finance major but I can see how it can eventually help me with companies one day…I would
probably want to look at it to better the company. So it’s good practice to start now.
To investigate whether these perceptions are consistent with student performance, we revisit the exam
scores reported in Table 4 but we decompose the results based on students’ academic major. We create one
group consisting of finance and accounting majors and another group with all other majors including, but not
limited to, marketing, management, information technology and non-business. The decomposed scores are
shown in Table 5.
The results reveal support for the aforementioned perceptions. On average, finance and accounting majors
outperform other majors and that outperformance is statistically significant in 50% of the cases considered.
This is consistent with the notion that finance is a difficult course particularly for those outside of finance
and accounting. Furthermore, we explore whether differences in performance after the intervention vary by
academic major. The difference in average performance before and after the intervention is not statistically
different from zero for finance and accounting majors on any examination. Interestingly, the previously
reported improvement in performance on Exam 2 appears driven by majors outside of finance and
accounting. Specifically, for students outside of finance and accounting, the average score on Exam 2
increases by 5.596 points after the intervention and that change is statistically significant at the 10% level.
JOURNAL OF ECONOMICS AND FINANCE EDUCATION ∙ Volume 18 ∙ Number 1 ∙ Summer 2019
88
Table 5: Results from Course Examinations by Academic Major Categories
No Intervention Intervention Difference
Exam FIN/ACC Other Diff. FIN/ACC Other Diff. FIN/ACC Other
#1 71.90 60.84 -11.06* 71.09 63.55 -7.55* -0.09 2.71
(20.64) (23.26) (17.68) (19.42)
# 2 73.90 65.93 -7.97 77.35 71.53 -5.82* 3.45 5.60*
(26.02) (23.10) (18.35) (17.16)
# 3 69.20 63.05 -6.15 67.77 61.98 -5.79 -1.43 -1.08
(25.31) (21.45) (19.98) (19.95)
N 30 75 43 121 Notes: * represents statistical significance at the 5 or 10% levels. Statistical difference of means is tested via a t-test with unequal variances across groups. The “Intervention” sample includes all students completing the course during the implementation of the
Bloomberg Project, Spring 2017. The “No Intervention” sample captures the previous spring semester (2016) when the course was
taught by the same instructor with no project. Finance & Accounting Majors include all students listing one of these two disciplines as their primary major. Other Majors include business majors, outside of finance and accounting, and non-business majors.
As these results suggest, students perceive finance differently than they do other business fields and those
perceptions present contextual challenges that studies of business education more broadly are unlikely to
discern (Arbaugh 2005). The tension between concentrations raises the question of what it means to require
such a course for non-majors. Finance is an integral part of the business core and even those who do not plan
to work directly in finance are expected to be familiar with the analytical insights that it provides to the firm
as a whole. That begs the question: are the needs of those in non-finance fields sufficiently similar to those
for whom this course serves as the foundation for advanced finance courses or are their needs sufficiently
differentiated to justify separate approaches (and courses) for majors and non-majors? The answer to this
question lies in finding solutions within the finance classroom. The data collected on this project is not
sufficient to answer the question, but they do suggest that the question is worth asking.
Integration
The recent learner-centered revolution has focused attention on the importance of students meeting an
identified set of cognitive learning outcomes. Particularly at the level of the university, instructors aspire to
have their students reach the upper-most stages of cognitive development, often referred to as higher-order
thinking, which includes skills such as problem solving, critical and creative thinking, and synthesis (Johnson
et al. 2015). These skills are often depicted hierarchically, with lower-order skills, such as understanding and
remembering, serving as the base of a pyramid or ladder, but this does not mean that such skills have to be
treated strictly sequentially. For example, there are faculty and administrators who do not believe that first-
year students are capable of engaging in higher-order thinking and suggest that introductory courses should
focus on building a foundation of lower-level skills.
Table 6: Student Product Ratings
Terminology Dimensions Argument Connections
Internal External Internal External Internal External Internal External
Minimum 2 2 1.67 2 1 1 1 1
Maximum 4 4 4 4 4 4 2.7 3
Mean 3.18 2.842 3.02 2.95 2.68 2.74 1.33 1.37
Median 3.33 3 3 3 2.67 3 1.33 1 Notes: Internal shows the average scores of 3 independent raters of 19 student products using the rubric displayed in Table 3. External
reflects the ratings for a rater outside the research team. Includes only the 19 projects for which all student participants signed IRB-
approved consent forms.
Our experience with the Bloomberg project suggests otherwise. Interestingly, despite all the challenges
students describe, the evidence from their student products suggests that important gains were made in
learning, particularly in the use of critical thinking. Table 6 displays the average scores across three internal
raters and one external rater for the Final Analysis portion of the project. The external rater is a business
professor outside the research team. In our composite ratings, the students score highest, on factors related
to lower-order thinking, such as terminology and application (called dimensions). Both factors had an average
rating of 3. The patterns are similar although ratings are somewhat lower for the external rater. Although the

JOURNAL OF ECONOMICS AND FINANCE EDUCATION ∙ Volume 18 ∙ Number 1 ∙ Summer 2019
89
scores on the higher-order skills, such as developing an argument (on average 2.61) or connecting to external
information (on average 1) are lower, as might be expected, they are not absent, with at least three student
project reports reflecting the skills of evaluation and synthesis, even though the latter were not explicitly
required. Interestingly, the external rater results on the higher order skills were marginally greater than those
of the internal raters. The similarity in scores across the raters is not indicative of rating inflation. Therefore,
these findings strongly suggest that, even in an introductory course, there are at least some students who have
the capacity to process what they are learning at the highest levels.
This result may not be too surprising. After all, the project was designed to utilize a number of pedagogical
strategies with proven track records in higher order thinking, ranging from problem-based to inquiry-guided
learning. By providing that glimpse into the real-world, however, it also brought in another, more unexpected,
factor. Both educational psychologists and employers seem to agree that college graduates need to be well-
equipped to deal effectively with the ambiguity of the real world, but the skills for navigating indefinite
problems are difficult to teach. Their results are also difficult to capture, especially when most objective
assessments of student learning, including those recognized by AACSB, are not usually geared towards
measuring cognitive abilities such as flexibility (Selingo 2016). In our NVivo analysis of the focus group
transcripts, we found 20 references to a growing recognition of the ambiguity, complexity and
interdependence of real-world data analysis; including the sometimes startling realization of the power of
self-directed learning:
You are learning problem solving with the different issues…It gives you the opportunity to learn how to
handle …different situations, to adjust.
It’s not like it [the project] applies to one chapter, it applies to it all and then you carry each problem to
the next unit-it just ties everything [together].
I was able to use it, I have got…money saved, I’ve got to put in different funds I can kind of keep track of
them without having to report through a broker. I think I kind of can do it on my own. Don’t need that
middle man in there.
And you are able to actually calculate yourself without actually really needing someone to tell you with
and you can apply it too. [I want to be a]CEO of a company, so these things would help me get to that
knowing how to not just look at the numbers but to apply it to a company and this helps you think and
prove it to get to that cause it doesn’t just affect finance it also affects finance, management, affects
research and development, marketing, it affects everything.
This last lesson, that the learning gains from the project affect everything, also applies to the results of this
study.
Conclusions
Our results suggest that the introduction of the Bloomberg project was effective in increasing the power
of student interest; and it did so in ways that were direct and indirect. Unlike conventional scholarship of
teaching and learning projects, we did not produce a set of interventions that others could readily adopt.
Although other instructors would be welcome to use the design of the project in their own instruction
(available upon request), our results suggest larger questions about this emerging field; with implications for
both future teaching practice as well as pedagogical research in finance and other business courses. Rather
than merely exposing students to the functions of the Bloomberg terminals, our experience suggests that other
factors may play a significant role in the successful integration of educational technology. Rather than
inserting the project into an existing course structure, the takeaway may be the critical role course design
plays in enhancing student engagement. Rather than limiting lower-level courses to lower-level thinking; our
study shows that students in introductory course may be more ready to engage with higher-order problem-
solving, albeit in a carefully structured way, than previously believed. Rather than keeping students out of
the real-world until they have fully developed the skills necessary to manage all of its challenges and
complexities; our project suggests that business students in particular may benefit from making those
connections not only earlier, but more often, than conventional approaches may allow.
Our conclusions should not be overstated. The current study encompasses four sections of a single face-
to-face course, taught in one semester and at one institution. Our method reflects the limited ability
researchers have to control all variables inherent in teaching and learning (Mayhew et al. 2016). As such, our

JOURNAL OF ECONOMICS AND FINANCE EDUCATION ∙ Volume 18 ∙ Number 1 ∙ Summer 2019
90
results may or may not be representative of the experiences of students and instructors in other contexts. That
being said, our results do present some potentially productive avenues for future research in finance, business,
and other applied fields in which instructors are looking to foster a stronger connection between what students
do in the classroom and the real world. By listening directly to our students through their words and work,
we discovered that we do not need to throw them into the deep end of the pool. Instead, by allowing them to
dip their toes into the water, they begin to get an enticing picture of just what it means to swim in those
waters. To put it less figuratively, the results of the Bloomberg project suggest that students appreciated the
growing realization of the complex and contested nature of the real world and that awareness contributed
meaningfully to their interest in being prepared to engage with it.
References
Alavi, Maryam, and Dorothy E. Leidner. 2001. "Research Commentary: Technology-Mediated Learning—
A Call for Greater Depth and Breadth of Research." Information Systems Research 12: 1-10.
Anderson, Philip H., and Leigh Lawton. 2014. "The Effectiveness of a Simulation Exercise for Integrating
Problem-Based Learning in Management Education." Developments in Business Simulation and Experiential
Learning 32: 10-18.
Arbaugh, J. Ben. 2005. "How Much Does “Subject Matter” Matter? A Study of Disciplinary Effects in On-
line MBA Courses." Academy of Management Learning & Education 4: 57-73.
Arbaugh, J. Ben. 2014. "System, Scholar or Students? Which Most Influences Online MBA Course
Effectiveness?" Journal of Computer Assisted Learning 30: 349-362.
Arbaugh, J. Ben, Michael R. Godfrey, Marianne Johnson, Birgit Leisen Pollack, Bruce Niendorf, and
William Wresch. 2009. "Research in Online and Blended Learning in the Business Disciplines: Key Findings
and Possible Future Directions." The Internet and Higher Education 12: 71-87.
Bigelow, John D. 2004. "Using Problem-Based Learning to Develop Skills in Solving Unstructured
Problems." Journal of Management Education 28: 591-609.
Brown, John Seely, Allan Collins, and Paul Duguid. 1989. "Situated Cognition and the Culture of Learning."
Educational Researcher 18: 32-42.
Carlile, Paul R., Steven H. Davidson, Kenneth W. Freeman, Howard Thomas, and N. Venkatraman. 2016.
Reimagining Business Education: Insights and Actions from the Business Education Jam. Bingley, UK:
Emerald Group Publishing Limited.
Carty, Lynn, and Ron Baker. 2015. "Student Perceptions of Learning Technologies in Introductory
Accounting Courses." The Accounting Educators' Journal 24: 21-33.
Conners, Frances A., Steven M. McCown, and Beverly Roskos-Ewoldson. 1998. "Unique Challenges in
Teaching Undergraduates Statistics." Teaching of Psychology 25: 40-42.
Dallas, Bryan K., Thomas D. Upton, and Matthew E. Sprong. 2014. "Post-Secondary Faculty Attitudes
toward Inclusive Teaching Strategies." Journal of Rehabilitation 80: 12-20.
Davis, Larry R., Dean L. Johnson, and Chelley Vician. 2005. "Technology-Mediated Learning and Prior
Academic Performance." International Journal of Innovation and Learning 2: 386-401.
Donovan, M. Suzanne, John D. Bransford, and James W. Pellegrino. 2006. How People Learn: Bridging
Research and Practice. Washington, DC: National Academy of Sciences.
Duxbury, Tammy, Maryella Gainor, and Jack Trifts. 2016. "Increasing Active Learning in Accounting and
Finance by Flipping the Classroom." Journal of the Academy of Business Education 17: 35-51.

JOURNAL OF ECONOMICS AND FINANCE EDUCATION ∙ Volume 18 ∙ Number 1 ∙ Summer 2019
91
Eschenfelder, Mark J., Lois D. Bryan, and Tanya M. Lee. 2014. "Motivations, Costs and Results of AOL:
Perceptions of Accounting and Economics Faculty." Journal of Case Studies in Accreditation and Assessment
3: 1-14.
Evans, Jocelyn, and Timothy A. Jones. 2016. “The Effectiveness of Stock Simulations and Technology: The
Importance of Kolb Student Learning Styles in Introduction to Finance Courses.” Journal of Economics and
Finance Education 15: 56-67.
Farley, Alan, Ameeta Jain, and Dianne Thomson. 2011. "Blended Learning in Finance: Comparing Student
Perceptions of Lectures, Tutorials and Online Learning Environments across Different Year Levels."
Economic Papers: A Journal of Applied Economics and Policy 30: 99-108.
Farrell, Carlyle. 2005. "Perceived Effectiveness of Simulations in International Business Pedagogy: An
Exploratory Analysis." Journal of Teaching in International Business 16: 71-88.
Fink, L. Dee. 2013. Creating Significant Learning Experiences: An Integrated Approach to Designing
College Courses. Hoboken, NJ: John Wiley & Sons.
Freeman, Scott, Sarah L. Eddy, Miles McDonough, Michelle K. Smith, Nnadozie Okoroafor, Hannah Jordt,
and Mary Pat Wenderoth. 2014. "Active Learning Increases Student Performance in Science, Engineering,
and Mathematics." Proceedings of the National Academy of Sciences 111: 8410-8415.
Gehy, Dominique, and Aimee Hoffman Smith. 2016. “Ready to Work Graduates: Enhancing the Value of
Bloomberg in a University Finance Curriculum.” Journal of Economics and Finance Education 15: 68-82.
Grove, Wayne A., and Tim Wasserman. 2006. "Incentives and Student Learning: A Natural Experiment with
Economics Problem Sets." American Economic Review 96: 447-452.
Hayward, Charles N., Marina Kogan, and Sandra L. Laursen. 2016. “Facilitating Instructor Adoption of
Inquiry-Based Learning in College Mathematics. International Journal of Research in Undergraduate
Mathematics Education 2: 59–82.
Herrington, Jan, Thomas C. Reeves, and Ron Oliver. 2014. "Authentic Learning Environments." In
Handbook of Research on Educational Communications and Technology, edited by Michael Spector, M.
David Merrill, Jan Elen and M.J. Bishop. New York, NY: Springer.
Hornik, Steven, Carol Stoak Saunders, Yuzhu Li, Patsy D. Moskal, and Charles D. Dzuiban. 2008. "The
Impact of Paradigm Development and Course Level on Performance in Technology-Mediated Learning
Environments." Informing Science 11: 35-58.
Jain, Sachin, and Martin Dowson. 2009. "Mathematics Anxiety as a Function of Multidimensional Self-
Regulation and Self-Efficacy." Contemporary Educational Psychology 34: 240-249.
Janor, Hawati, Ruzita Abdul Rahim, Aisyah Abdul Rahman, Noor Azryani Auzairy, Noor Azuan Hashim,
and Muhamad Zain Yusof. 2013. "Integrating Student-Centered Learning in Finance Courses: The Case of a
Malaysian Research University." International Education Studies 6: 108-123.
Johnson, Larry, Samantha Adams Becker, Victoria Estrada, and Alex Freeman. 2015. The NMC Horizon
Report: 2015 Higher Education Edition. Austin, TX: New Media Consortium.
Kazemi, Hossein S. 2015. “Using Bloomberg Real-time Data and Analytics to Teach Economics and
Finance.” Journal of Economics and Finance Education 14: 79-93.
Keys, Phyllis. 2016. “A Corporate Finance Approach to Integrating Bloomberg and Stock-Track into the
Finance Curriculum.” Journal of Economics and Finance Education 15: 38-55.
JOURNAL OF ECONOMICS AND FINANCE EDUCATION ∙ Volume 18 ∙ Number 1 ∙ Summer 2019
92
Lee, Jean S., Sue Blackwell, Jennifer Drake, and Kathryn A. Moran. 2014. "Taking a Leap of Faith:
Redefining Teaching and Learning in Higher Education through Project-Based Learning." Interdisciplinary
Journal of Problem-Based Learning 8: 19-34.
Malgwi, Charles A., Martha A. Howe, and Priscilla A. Burnaby. 2005. "Influences on Students' Choice of
College Major." Journal of Education for Business 80: 275-282.
Marshall, Catherine, and Gretchen B. Rossman. 2016. Designing Qualitative Research. Thousand Oaks, CA:
SAGE Publications.
Mauffette, Yves, Peter Kandlbinder, and Alexandre Soucisse. 2004. "The Problem in Problem-Based
Learning is the Problems: But Do They Motivate Students." In Challenging Research in Problem-Based
Learning, edited by Maggi Savin Baden and Kay Wilkie. Maidenhead, England: Open University Press.
Mayhew, Matthew J., Alyssa N. Rockenbach, Nicholas A. Bowman, Tricia A. Seifert, and Gregory C.
Wolniak. 2016. How College Affects Students: 21st Century Evidence that Higher Education Works. San
Francisco, CA: John Wiley & Sons.
McCullough, Kerry, and Nicholas Munro. 2016. "Finance Students’ Experiences of Lecture-Based Active
Learning Tasks." Innovations in Education and Teaching International 55: 1-9.
Mintu-Wimsatt, Alma. 2001. "Traditional vs. Technology-Mediated Learning: A Comparison of Students’
Course Evaluations." Marketing Education Review 11: 63-73.
Pan, William S. 2003. "The Challenges of Teaching Statistics in the Current Technology Environment."
Journal of American Academy of Business 3: 351-351.
Patton, Michael Q. 2015. Qualitative Research & Evaluation Methods, Thousand Oaks, CA: SAGE
Publications.
Porter, Wendy W., and Charles R. Graham. 2016. “Institutional Drivers and Barriers to Faculty Adoption of
Blended Learning in Higher Education. British Journal of Educational Technology 47: 748-762.
Prince, Michael J., and Richard M. Felder. 2006. "Inductive Teaching and Learning Methods: Definitions,
Comparisons, and Research Bases." Journal of Engineering Education 95: 123-138.
Redpath, Lindsay. 2012. "Confronting the Bias Against On-line Learning in Management Education."
Academy of Management Learning & Education 11: 125-140.
Rule, Audrey C. 2006. "The Components of Authentic Learning." Journal of Authentic Learning 3: 1-10.
Sanford, Douglas M., Douglas N. Ross, Al Rosenbloom, Dan Singer, and Vince Luchsinger. 2014. "The Role
of the Business Major in Student Perceptions of Learning and Satisfaction with Course Format." Journal of
Online Learning and Teaching 10: 535-550.
Selingo, Jeffrey J. 2016. There is Life after College: What Parents and Students Should Know about
Navigating School to Prepare for the Jobs of Tomorrow. New York, NY: Harper Collins.
Smith, Mike, and Kathryn Cook. 2012. "Attendance and Achievement in Problem-Based Learning: The
Value of Scaffolding." Interdisciplinary Journal of Problem-based Learning 6: 129-152.
Sperber, Dan, and Deirdre Wilson. 2004. "Relevance Theory." In Handbook of Pragmatics, edited by
Laurence R. Horn and Gregory Ward. Oxford: Blackwell.
Spinelli, Michael A. 2001. "The Use of Technology in Teaching Business Statistics." Journal of Education
for Business 77: 41-44.

JOURNAL OF ECONOMICS AND FINANCE EDUCATION ∙ Volume 18 ∙ Number 1 ∙ Summer 2019
93
Stahl III, Charles E., and Greg R. Dunning. 2015. "Instructional Case-Hypo Corporation Problem-Based-
Learning/Case Studies Method, A Review and Application." Journal of Accounting and Finance 15: 91-106.
Stinson, John E., and Richard G. Milter. 1996. "Problem‐Based Learning in Business Education: Curriculum
Design and Implementation Issues." New Directions for Teaching and Learning 68: 33-42.
Theodosopoulos, G., C. Haslam, and C. Riley. 2014. "Teaching Accounting and Finance to Non-Specialists:
Revealing the Students' Perspective on the Learning Experience." British Accounting and Finance
Association Annual Conference. http://bura.brunel.ac.uk/handle/2438/10370.
Toubiana, Madeline. 2014. "Business Pedagogy for Social Justice? An Exploratory Investigation of Business
Faculty Perspectives of Social Justice in Business Education." Management Learning 45: 81-102.
Walder, Anne M. 2015. “Obstacles to Innovation: The Fear of Jeopardising a Professorial Career.” British
Journal of Education 3: 1-16.
Watty, Kim, Jade McKay, and Leanne Ngo. 2016. "Innovators or Inhibitors? Accounting Faculty Resistance
to New Educational Technologies in Higher Education." Journal of Accounting Education 36: 1-15.
Wentworth, Rebecca A., and Mary C. Funck. 2015. "Using Varying Pedagogical Approaches in College
Classrooms: Increasing Motivation for Undergraduate Finance Students." International Journal for
Infonomics 1: 11-18.
Whitaker, Jonathan, J. Randolph New, and R. Duane Ireland. 2016. "MOOCs and the Online Delivery of
Business Education What's new? What's not? What now?" Academy of Management Learning & Education
15: 345-365.
Worthington, Andrew C. 2002. "The Impact of Student Perceptions and Characteristics on Teaching
Evaluations: A Case Study in Finance Education." Assessment & Evaluation in Higher Education 27: 49-64.
Yu, Bosco, Priscilla Chan, S. F. Chan, and Jimmy Chang. 2014. "Exploring the Preference in Learning
Approach among the Hong Kong University Students: Case Study, Problem-Based or Traditional Textbook
Question." Developments in Business Simulation and Experiential Learning 32: 331-6.