journal of educational sciences - jes.ejournal.unri.ac.id
TRANSCRIPT

Journal of Educational Sciences Vol. 5 No. 3 (July, 2021) 448-463
Journal of Educational Sciences Journal homepage: https://jes.ejournal.unri.ac.id/index.php/JES
The Effect of Quality of Education Services on Perceptions of
Educational Costs and Student Trust and Their Impact on
Student Satisfaction at SMA Negeri Ujungbatu
Septia Syafriani1,2
*, Suarman2, Henny Indrawati
2
1SMA Negeri 1 Ujungbatu, Ujungbatu, Rokan Hulu, 28553, Indonesia 2Faculty of Teacher Training and Education, Pekanbaru, 28293, Indonesia
ARTICLE INFO A B S T R A C T
Article history:
Received: 06 Dec 2020
Revised: 21 June 2021
Accepted: 27 June 2021
Published online: 24 July 2021
This study aims to analyze the effect of the quality of
education services on perceptions of education costs and
student confidence and their impact on student satisfaction
at SMA Negeri Ujungbatu. The population of this research
is the students of Class XI SMA Negeri Ujungbatu as many
as 475 students. The study was conducted with a sample of
217 students taken by simple random sampling technique.
Data was collected using a questionnaire. The data analysis
used in this research is descriptive quantitative and path
analysis. The results showed that there was an influence
between the quality of education services on perceptions of
education costs and student confidence and the impact on
student satisfaction at SMA Negeri Ujungbatu. The
meaning is that the better the quality of educational
services provided by the school and the more positive
students perceive the cost of education, the more students
will believe in the education in the school, it will increase
the satisfaction felt by students
Keywords:
Quality of Education Services
Perception of Education Costs
Student Trust
Student Satisfaction
1. Introduction
Education is one of the most effective tools for changing human beings, education
has the task of improving the quality of individuals to be more productive. The
impact of education in the formation of human quality is two or three times
stronger than others, education functions as a social controller, cultural
preservation, training center and workforce development and attitude formation.
In Indonesia, efforts in education development are also carried out at various
levels, from basic education, secondary education to higher education (Indrawati,
2013).
Corresponding author.
E-mail: [email protected] Doi: https://doi.org/10.31258/jes.5.3.p.448-463
P-ISSN 2581-1657
E-ISSN 2581-2203

Septia Syafriani et al. / Journal of Educational Sciences Vol. 5 No. 3 (July, 2021) 448-463
449
Education in general still faces problems in relation to the relevance of
curriculum, learning and school management which creates a low quality student
learning process (rote learning). The learning process does not grow the potential
and creativity of students, but presents the theory and knowledge that is
memorized with solid theoretical content, coupled with the cost of education
which does not seem cheap. This kind of learning process has become a learning
culture for students in Indonesia, especially in primary and secondary education,
including in high school. Schools have not been able to create a comfortable,
interesting and fun learning process for students to learn optimally, so that student
learning achievement is low and seems to be getting worse lately (Suryadi, 2010;
Indrawati, 2019).
In the business world, customer satisfaction is one of the keys to the success of a
business. This is because by satisfying customers, the organization can increase its
profit level and get a wider market share. Customer satisfaction is a customer's
perception of one type of service experience they experience. Basically there is a
close relationship between the determination of service quality and customer
satisfaction. If the service received or perceived is as expected, then the service
quality is perceived as good and satisfactory and vice versa. Thus, whether or not
service quality is good depends on the ability of service providers to consistently
meet customer expectations (Murty, 2014).
Likewise in the business world, in the world of education measuring the level of
student satisfaction with educational services is important to find out how well the
services have been provided by the school. Schools as educational service
providers need to learn and have the initiative to improve customer satisfaction
because education is a circular process that influences each other and is
continuous. Therefore, a marketing strategy for educational services is needed to
win the competition between schools and to increase the acceleration of
improving the quality and professionalism of school management. The
community as school customers (students, parents, and other related parties) needs
to be convinced that the school to be chosen is a school that provides services that
are relevant to the needs and demands of the times (Murty, 2014).
In Ujungbatu, there are two SMANs, namely SMAN 1 and 2 Ujungbatu. From the
initial survey that has been carried out, it is known that the services at SMAN
have met educational standards. This is evidenced by, among others, the
accreditation of schools that have received an A grade and seen from the number
of students who enroll in this high school, the number always increases every
year. The predicate of A accreditation achieved by SMAN 1 and 2 Ujungbatu
should be able to show that the educational services provided to students have
reached or even exceeded the minimum standards set by the government.
However, in reality, based on observations through direct interviews with
students, data obtained that 65% or most of the students felt they were still not
satisfied with the services provided by the school, this was indicated by students
being dissatisfied with their decision to attend this school because they were
considered not in line with expectations students when they first register.

Septia Syafriani et al. / Journal of Educational Sciences Vol. 5 No. 3 (July, 2021) 448-463
450
Educational services provided by schools, namely school facilities and
infrastructure that have not been adequate, have become a classic complaint
submitted by students. It also causes students to feel dissatisfied.
According to Tjiptono (2015), there are several factors that influence satisfaction,
namely product, price, promotion, location, service, facilities, and atmosphere.
Lupiyoadi & Hamdani (2008), also found that satisfaction is influenced by
product quality, service, emotion, price, and cost. Meanwhile, Irawan & Juwandi
(2004), stated that satisfaction is influenced by product quality, price, service
quality, emotionality, and convenience.
Several studies have found the quality of educational services to be the most
influential factor in student satisfaction. The quality of education services is the
most important thing for service providers. Therefore, service providers must
understand how to build service quality, identify gaps that may occur, and their
effect on student satisfaction and student behavior after using services (Lupiyoadi
& Hamdani, 2008). Education services are all activities carried out by schools that
organize teaching and learning processes, provide facilities that support learning,
and administration related to learning. Quality learning and teaching processes
will be a dream, both for schools and students as the main customers (Mahmud,
2012). The quality of education is very dependent on teachers who play a role and
are the biggest contributors in the world of education. Improving the quality of
education is a development goal in the field of national education and is an
inseparable part of efforts to improve the quality of the whole human being
(Desmita et al., 2021; Siagian et al., 2018).
In addition to the quality of educational services, the cost of education also affects
student satisfaction. The cost of education is an important component in the
educational process because without it, the educational process will not run
smoothly (Wijaya, 2009). The cost of education affects the educational process,
this is because the cost of education is defined as the amount of money generated
and spent for various educational needs (Sutriayu et al., 2020).
Student trust also affects student satisfaction according to Wuryan & Legowo
(2009), that there is a significant and positive influence between trust and student
satisfaction. Students' trust in schools is based on knowledge, truth, or news and
word of mouth references (Murty, 2014). Student trust is the expectation that
students have for the school for the reliability of services and the reliability of the
school in fulfilling its promises (Loureiro et al., 2014).
Suhardan & Suharto (2009), suggest that student satisfaction is the goal of
learning services in schools. In this case, students who are satisfied with the
learning services provided by the school will certainly show a positive attitude.
This definition is not much different from the opinion (Sumaedi et al., 2011),
which defines student satisfaction as an emotional evaluation of various outcomes
and experiences related to education that they actually get compared to
expectations. Based on the description that has been stated, it is important to
conduct this research with the aim of analyzing the effect of the quality of

Septia Syafriani et al. / Journal of Educational Sciences Vol. 5 No. 3 (July, 2021) 448-463
451
education services on perceptions of education costs and student confidence and
their impact on student satisfaction at SMA Negeri Ujungbatu.
2. Methodology
This study is a quantitative descriptive study that aims to analyze the effect of the
quality of education services on perceptions of education costs and student
confidence and their impact on student satisfaction at SMAN Ujungbatu. The
sample in this study were students of class XI SMAN Ujungbatu. The sampling
technique used Simple Random Sampling, in order to obtain a sample of 217
students from 475 populations. Data collection techniques was using a
questionnaire. The measurement instrument used a Likert scale to measure the
quality of educational services, perceptions of the cost of education, student
confidence, and student satisfaction.
The validity test was first carried out to test the extent to which the accuracy or
accuracy of an instrument as a measuring instrument for research variables was
carried out using the Corrected Item-Total Correlation. Reliability test is carried
out to determine the extent to which the results of a measurement can be trusted
using Cronbach's Alpha. The results of the instrument trial were 41 statements,
found that two statements were declared invalid. The research data was tested
with the prerequisite analysis test, namely the normality test. The data analysis
technique in this research is quantitative descriptive analysis and path analysis.
The results of descriptive statistics will be divided into 3 categories, namely if the
mean score is in the value of 1 - 2.33 then it is in the low category, if the mean
score is in the value of 2.34 - 3.66 then it is in the medium category, and if the
mean score is at a value of 3.67 – 5 then it is in the high category as shown in
Table 1.
Table 1. Subject Mean Score Category Norm
Category Skor Mean
Low
Middle
High
1 – 2,33
2,34 – 3,66
3,67 – 5
Source: Sugiyono (2013)
The data analysis technique uses path analysis with substructures presented in
Figure 1.

Septia Syafriani et al. / Journal of Educational Sciences Vol. 5 No. 3 (July, 2021) 448-463
452
Figure 1. Conceptual Design of Education Service Quality on Perceptions of
Educational Costs and Student Trust and Their Impact on Student Satisfaction
According to Figure 1. the following three equations are obtained
With the equation Z1 = Z1X + 1
With the equation Z2 = Z2X + 2
With the equation Y = YX + YZ1 + YZ2+ 3
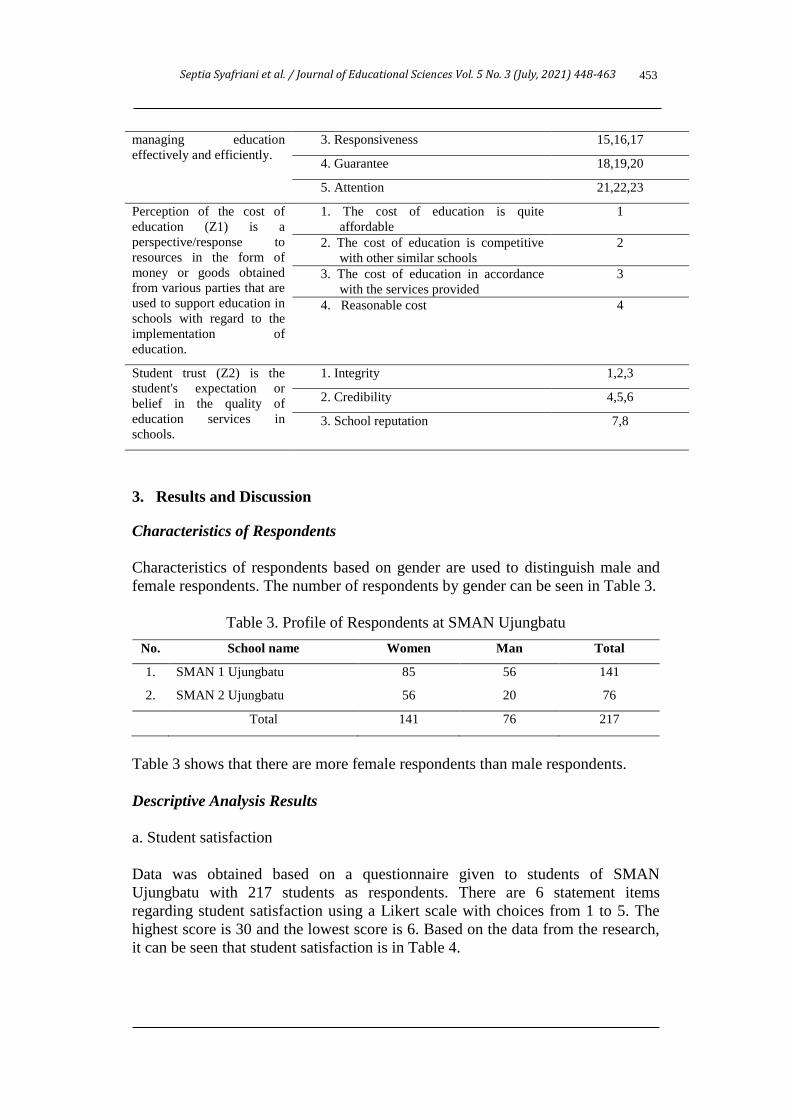
The following is a description of the indicators for each variable as presented in
Table 2.
Table 2. Operationalization of Research Variables
Variabel Indicator No. Item
Student satisfaction (Y) is a
feeling of pleasure shown
by a student towards the
services provided by the
school because his needs
and desires have been
fulfilled.
1. The level of satisfaction with the
school based on their own decisions
1
2. The level of satisfaction with school
through the desire to re-enroll in the
same school in the future
2
3. The level of confidence choosing
this school is the best choice
3
4. The level of satisfaction with the
decision to enroll in this school
4
5. The level of satisfaction in making
the decision to enroll in this school
5
6. The level of satisfaction of being
part of this school.
6
Quality of education
services (X) is a measure of
the level of excellence in
1. Physical evidence 1,2,3,4,5,6,7,8,9,10
2. Reliability 11,12,13,14
Septia Syafriani et al. / Journal of Educational Sciences Vol. 5 No. 3 (July, 2021) 448-463
453
managing education
effectively and efficiently.
3. Responsiveness 15,16,17
4. Guarantee 18,19,20
5. Attention 21,22,23
Perception of the cost of
education (Z1) is a
perspective/response to
resources in the form of
money or goods obtained
from various parties that are
used to support education in
schools with regard to the
implementation of
education.
1. The cost of education is quite
affordable
1
2. The cost of education is competitive
with other similar schools
2
3. The cost of education in accordance
with the services provided
3
4. Reasonable cost 4
Student trust (Z2) is the
student's expectation or
belief in the quality of
education services in
schools.
1. Integrity 1,2,3
2. Credibility 4,5,6
3. School reputation 7,8
3. Results and Discussion
Characteristics of Respondents
Characteristics of respondents based on gender are used to distinguish male and
female respondents. The number of respondents by gender can be seen in Table 3.
Table 3. Profile of Respondents at SMAN Ujungbatu
No. School name Women Man Total
1. SMAN 1 Ujungbatu 85 56 141
2. SMAN 2 Ujungbatu 56 20 76
Total 141 76 217
Table 3 shows that there are more female respondents than male respondents.
Descriptive Analysis Results
a. Student satisfaction
Data was obtained based on a questionnaire given to students of SMAN
Ujungbatu with 217 students as respondents. There are 6 statement items
regarding student satisfaction using a Likert scale with choices from 1 to 5. The
highest score is 30 and the lowest score is 6. Based on the data from the research,
it can be seen that student satisfaction is in Table 4.

Septia Syafriani et al. / Journal of Educational Sciences Vol. 5 No. 3 (July, 2021) 448-463
454
Table 4. Distribution of Student Satisfaction Frequency
Category Interval Frekuensi Persentase
Low 1 – 2,33 37 17,1
Middle 2,34 – 3,66 109 50,2
High 3,67 – 5 71 32,7
Total 217 100
Table 4 illustrates that the overall results of student satisfaction at SMAN
Ujungbatu are in the medium category. This is obtained from the average of
3.0913. However, there are still 37 students (17.1%) of student satisfaction in the
low category. This is because in the questionnaire statement item number 2 there
are 55 students who are not satisfied if there is an option to register at this school
again. This means that students still do not have high satisfaction with learning
activities and the state of education in the school.
b. Quality of education service
Data was obtained based on a questionnaire given to students of SMAN
Ujungbatu with 217 students as respondents. There are 21 statement items
regarding the quality of educational services using a Likert scale with choices
from 1 to 5. The highest score is 105 and the lowest score is 21. Based on the data
from the research, it can be seen the quality of education services in Table 5.
Table 5. Frequency Distribution of Education Service Quality
Category Interval Frequency Persentase
Low 1 – 2,33 4 1,8
Middle 2,34 – 3,66 152 70,1
High 3,67 – 5 61 28,1
Total 217 100
Table 5 illustrates that the overall results of the quality of education services at
SMAN Ujungbatu are in the medium category. This is obtained from the average
of 3.3203. However, there are still 4 students (1.8%) of student satisfaction in the
low category. This is because in the questionnaire statement item number 8 there
were 86 students who stated that they were not good with the number, size, and
toilet facilities owned by the school. This means that schools still need support
facilities so that the quality of education services in schools is getting better by
increasing physical (tangible) facilities.
c. Perception of the cost of education
Data was obtained based on a questionnaire given to students of SMAN
Ujungbatu with 217 students as respondents. There are 4 statement items
regarding the perception of the cost of education using a Likert scale with choices

Septia Syafriani et al. / Journal of Educational Sciences Vol. 5 No. 3 (July, 2021) 448-463
455
from 1 to 5. The highest score is 20 and the lowest score is 4. Based on the data
from the research, it can be seen the perception of the cost of education in Table 6.
Table 6. Distribution of the Perceived Frequency of Education Costs
Category Interval Frequency Persentase
Low 1 – 2,33 25 11,5
Mid 2,34 – 3,66 110 50,7
High 3,67 – 5 82 37,8
Total 217 100
Table 6 illustrates that the results of the overall perception of the cost of education
at SMAN Ujungbatu are in the medium category. This is obtained from the
average of 3.3525. However, there are still 25 students (11.5%) who perceive the
cost of education in the low category. This is because in the questionnaire
statement item number 4 there are as many as 51 students who stated that they did
not agree if the tuition fees at this school were only collected if there was a need
for the students' own interests. This means that there is still funding provided by
the school, which is proven that there are still fees charged to students.
d. Student trust
Data was obtained based on a questionnaire given to students of SMAN
Ujungbatu with 217 students as respondents. There are 8 statement items
regarding student confidence using a Likert scale with choices from 1 to 5. The
highest score is 40 and the lowest score is 8. Based on the data from the research,
it can be seen that the students' confidence in Table 7.
Table 7. Distribution of Student Trust Frequency
Category Interval Frequency Persentase
Low 1 – 2,33 7 3,3
Mid 2,34 – 3,66 119 54,8
High 3,67 – 5 91 41,9
Total 217 100
Table 7 illustrates that the results of the overall perception of the cost of education
at SMAN Ujungbatu are in the medium category. This is obtained from the
average of 3.5100. However, there are still 7 students (3.3%) of students'
confidence in the low category. This is because in the questionnaire statement
item 7 there are as many as 45 students who disagree if the school is known to
have a high level of discipline. This means that there are still students who have
low confidence, this condition is one of the formations of students' distrust of the
school.

Septia Syafriani et al. / Journal of Educational Sciences Vol. 5 No. 3 (July, 2021) 448-463
456
Path Analysis
Sub structure I
The effect of the quality of education services on the perception of the cost of
education is shown in Table 8.
Table 8. The Effect of Education Service Quality (X) on Perceptions of
Educational Costs (Z1)
Variabel Koefisien Path Sig(p) R Square
X → Z1 0,585 0,000 0,343
Table 8 shows that the probability value (ρ) of the quality of education services
(X) on the variable perception of the cost of education (Z1) is 0.000 because (0,) <
0.05, then at the 5% error level the path is significant. This means that the quality
of educational services affects the perception of the cost of education.
√ = √ = √ = 0,882
If the results of this path analysis are described in sub-structure I, it will be seen in
Figure 2.
Figure 2. The Effect of Education Service Quality on Perception Cost of
education
With the equation Z1 = Z1X + 1 Z1 = 0,585X + 0,882
This means that the equation shows that the variable quality of education services
(X) has a significant direct influence on the perception of the cost of education
(Z1) of 0.585. From this it is known that there is an effect of the quality of
education services on the perception of the cost of education with an error of
0.882.

Septia Syafriani et al. / Journal of Educational Sciences Vol. 5 No. 3 (July, 2021) 448-463
457
Sub structure II
The effect of the quality of education services on student confidence is shown in
Table 9.
Table 9. The Effect of Education Service Quality (X) on Student Trust (Z1)
Variabel Koefisien Path Sig(p) R Square
X → Z2 0,641 0,000 0,411
Table 9 shows that the probability value (ρ) of the quality of education services
(X) on student confidence (Z2) is 0.000 because (ρ) < 0.05 then the error level of
5% is significant. This means that the quality of educational services has an effect
on student confidence.
√ = √ = √ = 0,831
If the results of this path analysis are described in sub-structure II, it will be seen
in Figure 3.
Figure 3. The Effect of Quality of Education Services on Student Trust
With the equation Z2 = Z2X + 2
Z2 = 0,641X + 0,831
This means that the equation shows that the variable quality of education services
(X) has a significant direct effect on student confidence (Z2) of 0.641. From this it
is known that there is an influence of the quality of education services on student
confidence with an error of 0.831.
Sub structure III
The effect of educational service quality, perceived cost of education, and student
confidence on student satisfaction is shown in Table 10.

Septia Syafriani et al. / Journal of Educational Sciences Vol. 5 No. 3 (July, 2021) 448-463
458
Table 10. The Influence of Education Service Quality (X), Perception of
Education Costs (Z1), and Student Trust (Z2) on Student Satisfaction (Y)
Variabel Koefisien Path Sig(p) R Square
X→Y 0,181 0,013
0,461 Z1→Y 0,185 0,004
Z2→Y 0,425 0,000
Table 10 shows that the probability value (ρ) of the quality of education services
to student satisfaction is 0.013 < 0.05, so at the 5% error level the path is
significant. This means that the quality of educational services has a direct effect
on student satisfaction. The probability value (ρ) of the perception of the cost of
education to student satisfaction is 0.004 < 0.05, so at the 5% error level the path
is significant. This means that the perception of the cost of education has a direct
effect on student satisfaction. The probability value (ρ) of student confidence in
student satisfaction is 0.000 <0.05, so at the 5% error level the path is significant.
This means that student confidence has a direct effect on student satisfaction.
√ = √ = √ = 0,787
If the results of this path analysis are described in sub-structure III, it will be seen
in Figure 4.
Figure 4. The Influence of Education Service Quality, Perception of Tuition Fees,
and Student Trust on Student Satisfaction
With the equation Y = YX + YZ1 + YZ2+ 3
Y = 0,181X + 0,185Z1 + 0,425Z2+ 0,787
This means that the equation shows that the quality of education services has a
significant direct effect on student satisfaction of 0.181. The perception of the cost
of education has a significant direct effect on student satisfaction of 0.185. As
well as student confidence has a significant direct effect on student satisfaction of
0.425 with an error of 0.787.

Septia Syafriani et al. / Journal of Educational Sciences Vol. 5 No. 3 (July, 2021) 448-463
459
Combination of sub structure I, II, and III
In the following, a combined diagram of sub structure I, sub structure II, and sub
structure III will be presented which can be described as follows:
Figure 5. Combined Analysis of Sub Structures I, II, and III
Based on Figure 5, it is known that the quality of education services, perceptions
of educational costs, and student trust have a significant effect on student
satisfaction either directly or indirectly. The following describes the calculations
both directly and indirectly between variables shown in Table 11.
Table 11. Variable Direct and Indirect Contribution
No. Variabel Direct Indirect Total SE
1. X → Z1 0,585 - 0,585 34,22%
2. X → Z2 0,641 - 0,641 41,09%
3. Z1 → Y 0,185 - 0,185 3,42%
4. Z2 → Y 0,425 - 0,425 18,06%
5. X→ Y 0,181 - 0,181 3,28%
6. X→ Y by Z1 0,181 0,585*0,185 = 0,108 0,289 8,35%
7. X→ Y by Z2 0,181 0,641*0,425 = 0,272 0,453 20,52%
Table 11 shows that the variable that gives a large contribution is the variable
quality of education services (X) on student confidence (Z2) of 41.09%. Then the
variable that gives a small contribution is the quality of education education
services (X) to student satisfaction (Y) of 3.28%. This shows that the quality of
education services (X) will directly and indirectly affect student satisfaction (Y).
In this case, there are variables, namely the perception of the cost of education
(Z1) and student confidence (Z2).

Septia Syafriani et al. / Journal of Educational Sciences Vol. 5 No. 3 (July, 2021) 448-463
460
a. The effect of the quality of education services on the perception of the cost of
education
Based on the data analysis and hypothesis testing that have been carried out in this
study, the results show that there is a significant effect between the quality of
educational services on the perception of the cost of education. This means that
the better the quality of educational services provided by the school, the more
students will perceive positively the cost of education provided by the school. In
accordance with the opinion of Lupiyoadi & Hamdani (2008), states that the
various benefits possessed by a product/service must be compared with the
various costs incurred in consuming the service. Often also in determining the
value of an item/service, students compare the ability of a service to meet their
needs with the ability of substitute services, the perception that often applies is
that high costs reflect high quality.
b. The Effect of Educational Service Quality on Student Trust
Based on data analysis and hypothesis testing that have been carried out in this
study, the results showed that there was a significant effect between the quality of
educational services on student confidence. This means that the better the quality
of educational services provided by the school, the more students will trust the
services provided by the school. In accordance with research (Loureiro et al.,
2014), defining student trust is the expectation that students have for schools for
the reliability of services and the reliability of schools in fulfilling their promises.
Trust can be formed at a certain time based on customer satisfaction.
c. The Effect of Perceived Educational Costs on Student Satisfaction
Based on data analysis and hypothesis testing that have been carried out in this
study, the results showed that there was a significant influence between the
perception of the cost of education on student satisfaction. This means that the
more positive students perceive the cost of education, the higher the satisfaction
felt by students. In accordance with the opinion of Lupiyoadi & Hamdani (2008),
states that the various benefits possessed by a product/service must be compared
with the various costs incurred in consuming the service. If the service
received/perceived as expected, then the service quality is perceived to be
good/satisfactory and vice versa (Suarman et al., 2011)..
d. The Effect of Student Trust on Student Satisfaction
Based on data analysis and hypothesis testing that have been carried out in this
study, the results showed that there was a significant influence between student
confidence on student satisfaction. This means that the more students believe in
the education in the school, the higher the satisfaction felt by students. The quality
of educational services provided by the school is expected to be able to create
positive perceptions and students' trust in the school and result in student
satisfaction. Service quality can also create trust as a psychological variable that

Septia Syafriani et al. / Journal of Educational Sciences Vol. 5 No. 3 (July, 2021) 448-463
461
describes an accumulation of presumptions that show the credibility, integrity and
good name of a service in the eyes of customers (Cisse et al., 2009).
e. The Effect of Educational Service Quality on Student Satisfaction
Based on the data analysis and hypothesis testing that have been carried out in this
study, the results showed that there was a significant influence between the
quality of educational services on student satisfaction. This means that the better
the quality of educational services provided by the school, the higher the
satisfaction of students. In accordance with the opinion of Kotler & Armstrong
(2008), satisfaction is a person's level of satisfaction after comparing the
performance or perceived results compared to their expectations. So satisfaction
or dissatisfaction is formed from the interaction between expectations and
experiences after using the services or services provided.
f. The Effect of Educational Service Quality on Student Satisfaction Through
Perception of Educational Costs
Based on data analysis and hypothesis testing that have been carried out in this
study, the results showed that there was a significant influence between the
quality of educational services on student satisfaction through the perception of
education costs. This condition shows that students who have a positive
perception of the cost of education can provide a strong influence on the quality of
educational services with student satisfaction. Service quality is the expected level
of excellence and control over the level of excellence to meet customer desires. In
this case, there are two main factors that affect service quality, namely expected
service and perceived service. If the service received or perceived is as expected,
then the service quality is perceived as good or satisfactory (Suarman et al., 2011).
g. The Effect of Educational Service Quality on Student Satisfaction Through
Student Trust
Based on data analysis and hypothesis testing that have been carried out in this
study, the results showed that there was a significant influence between the
quality of educational services on student satisfaction through student trust. This
condition shows that students who have high confidence in the education in
schools can provide a strong influence on the quality of education services with
the satisfaction felt by students. The quality of educational services provided by
the school is expected to be able to create positive perceptions and students' trust
in the school and result in student satisfaction. Service quality can also create trust
as a psychological variable that describes an accumulation of presumptions that
show the credibility, integrity and good name of a service in the eyes of customers
(Cisse et al., 2009).

Septia Syafriani et al. / Journal of Educational Sciences Vol. 5 No. 3 (July, 2021) 448-463
462
4. Conclusion
Based on the results of descriptive analysis, the quality of education services,
perceptions of education costs, student confidence, and student satisfaction are in
the medium category. The quality of education services affects the perception of
the cost of education. The quality of educational services has an effect on student
confidence. Perception of the cost of education has an effect on student
satisfaction. Student trust has an effect on student satisfaction. The quality of
educational services has an effect on student satisfaction. The quality of
educational services affects student satisfaction through the perception of the cost
of education. The quality of educational services affects student satisfaction
through student trust.
References
Cisse, K. D., & N’Goala, G. (2009). The effects of satisfaction, trust and brand
commitment on consumers decision to boycott. Recherche et Application
en Marketing, 24(1), 43-66.
Desmita, Y., Suarman., & Gimin. (2021). Pedagogic and professional
competencies of social science subject teachers in relation to motivation
and learning achievement. Journal of Educational Sciences, 5(1), 188-197.
Indrawati, H. (2013). Upaya peningkatan kompetensi profesional guru mata
pelajaran ekonomi dalam proses pembelajaran. Jurnal Pendidikan, 4(2),
84-95.
Indrawati, H. (2019). Analysis of economic learning success. International
Journal of e-Collaboration (IJeC), 15(4), 18-30.
Irawan, H., & Juwandi. (2004). Kepuasan pelayanan jasa. Jakarta: Erlangga.
Kotler, P., & Amstrong, G. (2008). Prinsip-prinsip pemasaran (12 ed). Jakarta:
Erlangga.
Loureiro, S.M.C., Miranda, F. J., & Breazeale, M. (2014). Who needs delight?
The greater impact of value, trust and satisfaction in utilitarian, frequent-
use retail. Journal of Service Management, 25(1), 101-124.
Lupiyoadi, R., & Hamdani, A. (2008). Manajemen pemasaran jasa. Jakarta:
Salemba Empat.
Mahmud, M. (2012). Manajemen mutu perguruan tinggi. Jakarta: PT. Raja
Grafindo Persada.
Murty, Y. H. (2014). Pengaruh kualitas layanan pendidikan terhadap persepsi dan
kepercayaan siswa serta dampaknya terhadap kepuasan siswa di SMA
Santo Ignasius Singkawang.
Siagian, D., Rukun, K., Marsidin, S., & Anwar, S. (2018). Managerial
development model of head of SMA in Padangsidempuan to acieve quality
school. Journal of Educational Sciences, 2(1), 91-105.
Suarman., Sumarno., & Arum. (2011). Analisis kepuasan mahasiswa terhadap
kualitas pembelajaran dosen program studi pendidikan ekonomi FKIP
Universitas Riau. Jurnal Pendidikan Ekonomi dan Bisnis, 3(3), 549-559.
Sugiyono. (2013). Metode penelitian pendidikan pendekatan kuantitatif, kualitatif,
dan R&D. Bandung: Alfabeta.

Septia Syafriani et al. / Journal of Educational Sciences Vol. 5 No. 3 (July, 2021) 448-463
463
Suhardan., & Suharto. (2009). Manajemen pendidikan. Bandung: Alfabeta.
Sumaedi, S., Bakti, I. G M. Y., & Metasari, N. (2011). The effect of student’s
perceived service quality and perceived price on student satisfaction.
Management Science and Enginering, 5(1), 88-97.
Suryadi, A. (2010). Permasalahan dan alternatif kebijakan peningkatan relevansi
pendidikan (Studi relevansi pendidikan kerjasama UPI dengan balitbang
Kemendiknas. In Makalah Seminar Internasional Luar Sekolah.
Sutriayu., Makhdalena., & Sumarno. (2020). Effect of family environment and
education costs on student achievement with interest in reading as an
intervening variable. Journal of Educational Sciences, 4(1), 164-175.
Tjiptono, F. (2015). Strategi pemasaran (4 ed). Yogyakarta: Andi.
Wijaya, D. (2009). Implikasi manajemen keuangan sekolah terhadap kualitas
pendidikan. Jakarta: Bumi Aksara.
Wuryan, S., & Legowo, D. (2009). Pengaruh citra lembaga, kepercayaan
mahasiswa terhadap kepuasan mahasiswa dan implikasinya kepada
komitmen relasional mahasiswa pada Fakultas Ekonomi Universitas
Negeri Semarang. Telaah Manajemen, 6(2), 119-131.
How to cite this article:
Syafriani, S., Suarman, & Indrawati, H. (2021). The Effect of Quality of
Education Services on Perceptions of Educational Costs and Student Trust and
Their Impact on Student Satisfaction at SMA Negeri Ujungbatu. Journal of
Educational Sciences, 5(3), 448-463.