journal of food engineering - core.ac.uk · pdf filefood material by extraction processes. ......
TRANSCRIPT
Journal of Food Engineering 117 (2013) 450–457
Contents lists available at SciVerse ScienceDirect
Journal of Food Engineering
journal homepage: www.elsevier .com/locate / j foodeng
Study of alcoholic and aqueous extraction of pequi (Caryocar brasiliense Camb.)natural antioxidants and extracts concentration by nanofiltration
Mariana T.C. Machado ⇑, Beatriz C.B.S. Mello, Miriam D. HubingerDepartment of Food Engineering, School of Food Engineering, University of Campinas, Campinas, SP, Brazil
a r t i c l e i n f o a b s t r a c t
Article history:Available online 13 December 2012
Keywords:PequiCarotenoidsPolyphenolsExtractionNanofiltration
0260-8774 � 2012 Elsevier Ltd.http://dx.doi.org/10.1016/j.jfoodeng.2012.12.007
⇑ Corresponding author. Tel.: +55 19 3521 4036; faE-mail address: [email protected] (M.T.C. M
Open access under the E
Pequi (Caryocar brasilense Camb.) is a typical Brazilian fruit, rich in polyphenols and carotenoids. Thepresent work studied aqueous and alcoholic pequi extraction, in bench scale, evaluating time and tem-perature variation influence on polyphenols and carotenoids recovery. For the extraction best conditions(25 �C within 1 h for aqueous extract and 40 �C within 24 h for alcoholic extract), a residue reextractionwas carried out, which has increased compounds recovery from fruit material. The final extract (a mix-ture of the first and second extract) was submitted to a concentration step by nanofiltration (in a stirredcell with a temperature of 25 �C and a pressure of 800 kPa). For alcoholic extract, the rejection towardsbioactive compounds was small (around 10% for carotenoids and 15% for polyphenols). For aqueousextract, nanofiltration showed a high efficiency to concentrate the polyphenols and carotenoids (withretention coefficient around 100% and 97%, respectively).
� 2012 Elsevier Ltd. Open access under the Elsevier OA license.
1. Introduction
There is an increasing interest in replacing synthetic antioxi-dants, since some of them have restricted use in foods due to theirtoxicological effects on various species and suspected carcinogenicpotential. This fact has encouraged research on vegetable sources,which can be seen as potential natural and safe antioxidantssources (Lapornik et al., 2005; Spigno and De Faveri, 2007).
Pequi (Caryocar brasiliense Camb.) is typical fruit found in theBrazilian Cerrado. The fruit is economically exploited by the regio-nal population that consumes itself ‘‘in natura’’ as well to preparejuice, ice cream, liquor, jelly and traditional dishes. However, pequiis not widespread in Brazil, as it is highly perishable and its insidecontains a lot of thorns, which become its manipulation difficult,being its use limited.
Pequi contains natural antioxidants, such as phenolic com-pounds and carotenoids (Azevedo-Meleiro and Rodriguez-Amaya,2004; Lima et al., 2007). These compounds can be recovered fromfood material by extraction processes. Those processes allow theuse of some by-products of this fruit (such as endocarp) that showfunctional compounds in its composition. The technique mostcommonly applied for this aim is solid–liquid extraction (Spignoand De Faveri, 2007), that is a simple process and has low cost.Amongst the various factors contributing to the efficiency of thesolvent extraction process, solvent type, time and temperatureare often investigated (Lapornik et al., 2005; Qu et al., 2010; Spigno
x: +55 19 3521 4027.achado).
lsevier OA license.
and De Faveri, 2007). The temperature can reduce the process time.However, carotenoids are sensitive to temperature, when pro-cessed above 40 �C may degrade. In relation to the solvents, etha-nol is one of the most used in antioxidants extraction because itis a GRAS (generally-recognized-as-safe) solvent. In the other hand,ethanol shows residual flavor and its use could be limited in food-stuffs. Therefore, water is natural solvent, which showed efficientperformance for extraction in some works (Majhenic et al., 2007;Murakami et al., 2011; Roesler et al., 2007), being more advanta-geous mainly because it does not have limitations on its use.
Phenolic compounds are water-soluble, while carotenoids areoil-soluble, being well extractable with ethanol. However, somecarotenoids can be extracted, in smaller amounts, by water, suchas lycopene, lutein and zeaxanthin (Sánchez et al., 2008). Then, itis interesting to study the bioactive compounds extraction withboth solvents.
Pequi extract may be used as an ingredient in food industry,replacing synthetic antioxidants, or enriching functional and sup-plement foods. Thus, the pequi extraction production may increaseeconomic exploration of the fruit and add value to a Brazilian prod-uct. However, for extract application, it is necessary its concentra-tion, in order to increase bioactive compounds content. Unliketraditional concentration methods, membrane process can be ap-plied for this purpose, since it promotes a concentration of solu-tions using low temperatures (Rijn, 2004), with preservation ofthe functional compounds and minimal energy demand. This pro-cedure is based on the principle of selective permeation of the sol-utes molecules through semi-permeable membranes. In mostmembrane processes, such as microfiltration, ultrafiltration,
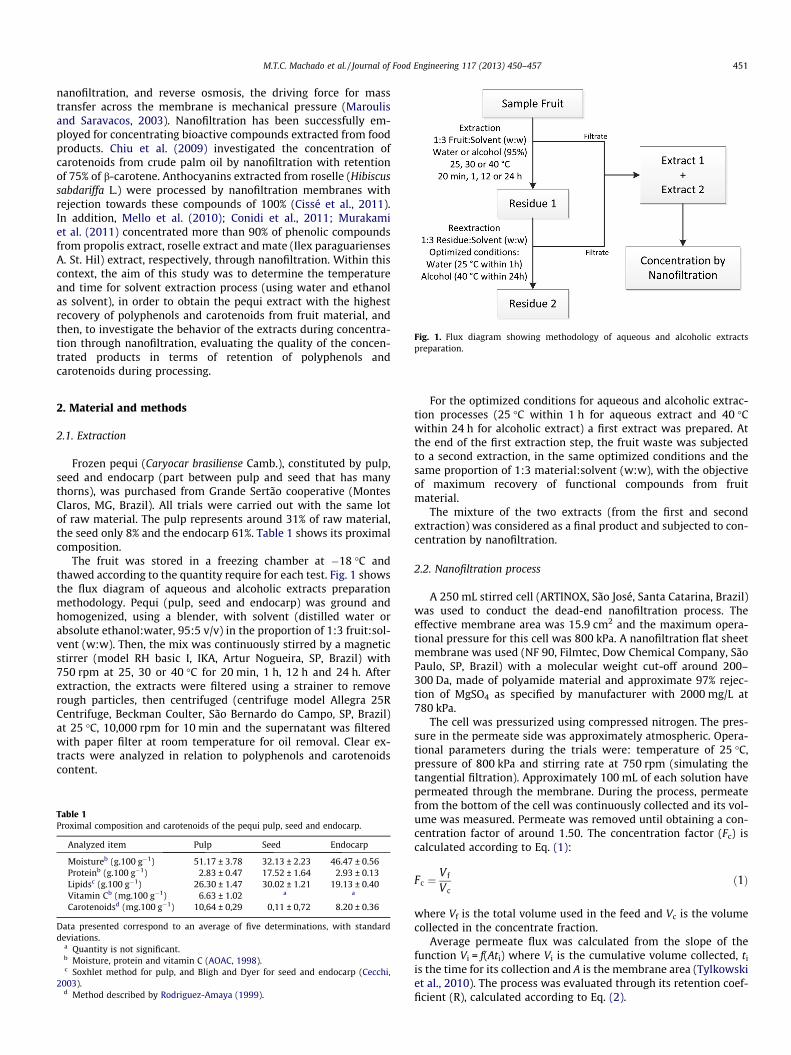
Fig. 1. Flux diagram showing methodology of aqueous and alcoholic extractspreparation.
M.T.C. Machado et al. / Journal of Food Engineering 117 (2013) 450–457 451
nanofiltration, and reverse osmosis, the driving force for masstransfer across the membrane is mechanical pressure (Maroulisand Saravacos, 2003). Nanofiltration has been successfully em-ployed for concentrating bioactive compounds extracted from foodproducts. Chiu et al. (2009) investigated the concentration ofcarotenoids from crude palm oil by nanofiltration with retentionof 75% of b-carotene. Anthocyanins extracted from roselle (Hibiscussabdariffa L.) were processed by nanofiltration membranes withrejection towards these compounds of 100% (Cissé et al., 2011).In addition, Mello et al. (2010); Conidi et al., 2011; Murakamiet al. (2011) concentrated more than 90% of phenolic compoundsfrom propolis extract, roselle extract and mate (Ilex paraguariensesA. St. Hil) extract, respectively, through nanofiltration. Within thiscontext, the aim of this study was to determine the temperatureand time for solvent extraction process (using water and ethanolas solvent), in order to obtain the pequi extract with the highestrecovery of polyphenols and carotenoids from fruit material, andthen, to investigate the behavior of the extracts during concentra-tion through nanofiltration, evaluating the quality of the concen-trated products in terms of retention of polyphenols andcarotenoids during processing.
2. Material and methods
2.1. Extraction
Frozen pequi (Caryocar brasiliense Camb.), constituted by pulp,seed and endocarp (part between pulp and seed that has manythorns), was purchased from Grande Sertão cooperative (MontesClaros, MG, Brazil). All trials were carried out with the same lotof raw material. The pulp represents around 31% of raw material,the seed only 8% and the endocarp 61%. Table 1 shows its proximalcomposition.
The fruit was stored in a freezing chamber at �18 �C andthawed according to the quantity require for each test. Fig. 1 showsthe flux diagram of aqueous and alcoholic extracts preparationmethodology. Pequi (pulp, seed and endocarp) was ground andhomogenized, using a blender, with solvent (distilled water orabsolute ethanol:water, 95:5 v/v) in the proportion of 1:3 fruit:sol-vent (w:w). Then, the mix was continuously stirred by a magneticstirrer (model RH basic I, IKA, Artur Nogueira, SP, Brazil) with750 rpm at 25, 30 or 40 �C for 20 min, 1 h, 12 h and 24 h. Afterextraction, the extracts were filtered using a strainer to removerough particles, then centrifuged (centrifuge model Allegra 25RCentrifuge, Beckman Coulter, São Bernardo do Campo, SP, Brazil)at 25 �C, 10,000 rpm for 10 min and the supernatant was filteredwith paper filter at room temperature for oil removal. Clear ex-tracts were analyzed in relation to polyphenols and carotenoidscontent.
Table 1Proximal composition and carotenoids of the pequi pulp, seed and endocarp.
Analyzed item Pulp Seed Endocarp
Moistureb (g.100 g�1) 51.17 ± 3.78 32.13 ± 2.23 46.47 ± 0.56Proteinb (g.100 g�1) 2.83 ± 0.47 17.52 ± 1.64 2.93 ± 0.13Lipidsc (g.100 g�1) 26.30 ± 1.47 30.02 ± 1.21 19.13 ± 0.40Vitamin Cb (mg.100 g�1) 6.63 ± 1.02 a a
Carotenoidsd (mg.100 g�1) 10,64 ± 0,29 0,11 ± 0,72 8.20 ± 0.36
Data presented correspond to an average of five determinations, with standarddeviations.
a Quantity is not significant.b Moisture, protein and vitamin C (AOAC, 1998).c Soxhlet method for pulp, and Bligh and Dyer for seed and endocarp (Cecchi,
2003).d Method described by Rodriguez-Amaya (1999).
For the optimized conditions for aqueous and alcoholic extrac-tion processes (25 �C within 1 h for aqueous extract and 40 �Cwithin 24 h for alcoholic extract) a first extract was prepared. Atthe end of the first extraction step, the fruit waste was subjectedto a second extraction, in the same optimized conditions and thesame proportion of 1:3 material:solvent (w:w), with the objectiveof maximum recovery of functional compounds from fruitmaterial.
The mixture of the two extracts (from the first and secondextraction) was considered as a final product and subjected to con-centration by nanofiltration.
2.2. Nanofiltration process
A 250 mL stirred cell (ARTINOX, São José, Santa Catarina, Brazil)was used to conduct the dead-end nanofiltration process. Theeffective membrane area was 15.9 cm2 and the maximum opera-tional pressure for this cell was 800 kPa. A nanofiltration flat sheetmembrane was used (NF 90, Filmtec, Dow Chemical Company, SãoPaulo, SP, Brazil) with a molecular weight cut-off around 200–300 Da, made of polyamide material and approximate 97% rejec-tion of MgSO4 as specified by manufacturer with 2000 mg/L at780 kPa.
The cell was pressurized using compressed nitrogen. The pres-sure in the permeate side was approximately atmospheric. Opera-tional parameters during the trials were: temperature of 25 �C,pressure of 800 kPa and stirring rate at 750 rpm (simulating thetangential filtration). Approximately 100 mL of each solution havepermeated through the membrane. During the process, permeatefrom the bottom of the cell was continuously collected and its vol-ume was measured. Permeate was removed until obtaining a con-centration factor of around 1.50. The concentration factor (Fc) iscalculated according to Eq. (1):
Fc ¼V f
V cð1Þ
where Vf is the total volume used in the feed and Vc is the volumecollected in the concentrate fraction.
Average permeate flux was calculated from the slope of thefunction Vi = f(Ati) where Vi is the cumulative volume collected, ti
is the time for its collection and A is the membrane area (Tylkowskiet al., 2010). The process was evaluated through its retention coef-ficient (R), calculated according to Eq. (2).
452 M.T.C. Machado et al. / Journal of Food Engineering 117 (2013) 450–457
R ¼ 1� Cp
Cf� 100% ð2Þ
where Cf and Cp (lg/mL) are the feed and permeate concentrationsof the biologically active compound.
2.3. Analysis assay
2.3.1. Total carotenoidsTotal carotenoids content of pequi extracts was determined
according to the method described by Rodriguez-Amaya, (1999).The carotenoids were extracted with acetone, separated in petro-leum ether, diluted in a volumetric flask and subsequent read ina spectrophotometer (model SQ-2800 UV/VIS, UNICO, United Prod-ucts & Instruments Inc., New Jersey, USA) at 450 nm wavelength.For quantification, Eq. (3) was used. The measurements were madein triplicate.
Total carotenoids ¼ Abs � V � 106
A1%1cm � v � 100
ð3Þ
where Total carotenoids were expressed in (lg b-carotene/mL of ex-tract), Abs was maximum absorbance at 450 nm, V was the dilutionvolume (mL), A1%
1cm was the absorption coefficient for b-carotene inpetroleum ether, which is equal to 2592 (Rodriguez-Amaya,1999), and v was the sample volume (mL).
2.3.2. Total phenolic substancesTotal polyphenols content of pequi extracts was quantified
using the Folin–Ciocalteau colorimetric method, according toSwain and Hilis, (1969). 0.5 mL of diluted extract (1:10 extract:sol-vent) was mixed with 2.5 mL of Folin–Ciocalteau reagent (10%).After 3 min, 2 mL of sodium carbonate solution (7.5%) were added.After 1 h at room temperature in the dark, the absorbance wasmeasured at 760 nm in spectrophotometer (model SQ-2800 UV/VIS, UNICO, United Products & Instruments Inc., New Jersey,USA), and the result calculated using a gallic acid calibration curve.The mean of three readings was used and the total phenolic con-tent expressed in lg of gallic acid equivalents (lg GAE/mL ofextract).
2.3.3. Vitamin C contentThe vitamin C content in extracts was determined based upon
the quantitative discoloration of 2,6-dichlorophenol indophenoltitrimetric method as described in AOAC (1998, 985.33). The vita-min C content was measured in triplicate samples and expressed aslg of ascorbic acid (lg AA/mL of extract).
2.3.4. Antioxidant capacityThe antioxidant capacity of each pequi extract was determined
by two methods, DPPH (Nagai et al., 2003) and Ferric ReducingAntioxidant Power, FRAP (Benzie and Strain, 1996). For DPPHmethod, the pequi solution was previously diluted in the propor-tion of 1:10 (0.3 mL) was mixed with 0.3 mL of ethanol solutioncontaining 0.5 mM 1,1-diphenyl-2-picrilhidrazyl (DPPH) and2.4 mL of ethanol (99.5%). For the control 0.3 mL of pure solventwas used in place of diluted extract. The absorbance was read at517 nm after 40 min of incubation at room temperature in thedark. The ability of scavenging free radicals was expressed as inhi-bition percentage (IP) of radical oxidation and calculated accordingto Eq. (4).
IP ð%inhibitionÞ ¼ Að0Þ � AðtÞAð0Þ
� �� 100 ð4Þ
where A(0) was control absorbance and A(t) was pequi extractabsorbance.
For FRAP essay, the extracted solution was previously diluted inthe proportion of 1:10 (100 lL), then mixed with 3 mL of freshlyprepared FRAP reagent (2,4,6-Tris(2-piridil)-s-triazine, FeCl3, ace-tate buffer). The absorbance was read at 593 nm after 30 min ofincubation at 37 �C in the dark. Fe (II) water solutions were usedas the standard to produce the calibration curve. The mean of threereadings was used and the antioxidant capacity expressed in lM ofFeSO4 (lg/mL of extract).
2.3.5. ColorThe color of the pequi extracts was measured using a Hunter
Lab colorimeter (model Color Quest II), with CIELab scale (L⁄, a⁄,and b⁄), using reflectance mode, D65 illuminant and a 10� observerangle as a reference system. The color measurements were ex-pressed in terms of lightness L⁄ (L⁄ = 0 for black and L⁄ = 100 forwhite), and the chromaticity parameters a⁄ (green [�] to red [+])and b⁄ (blue [�] to yellow [+]). From these parameters, the cylin-drical coordinates C⁄ (chroma) and H⁄ (hue angle) were calculatedaccording to Eqs. (5 and 6), respectively. The measurements weremade in triplicate
C� ¼ffiffiffiffiffiffiffiffiffiffiffiffiffiffiffiffiffiffiffiffiffiffiffiffi
a�2 þ b�2
� �rð5Þ
H� ¼ arctanb�
a�
� �ð6Þ
2.4. Statistical analysis
The responses obtained were analyzed by Tukey’s range testusing the software Statistica� 8.0 (Statsoft Inc. Tulsa, OK, USA).The variable effects for all responses were analyzed at a signifi-cance level of 5% (p < 0.05).
3. Results and discussion
3.1. Influence of process condition on the polyphenols and carotenoidsrecovery
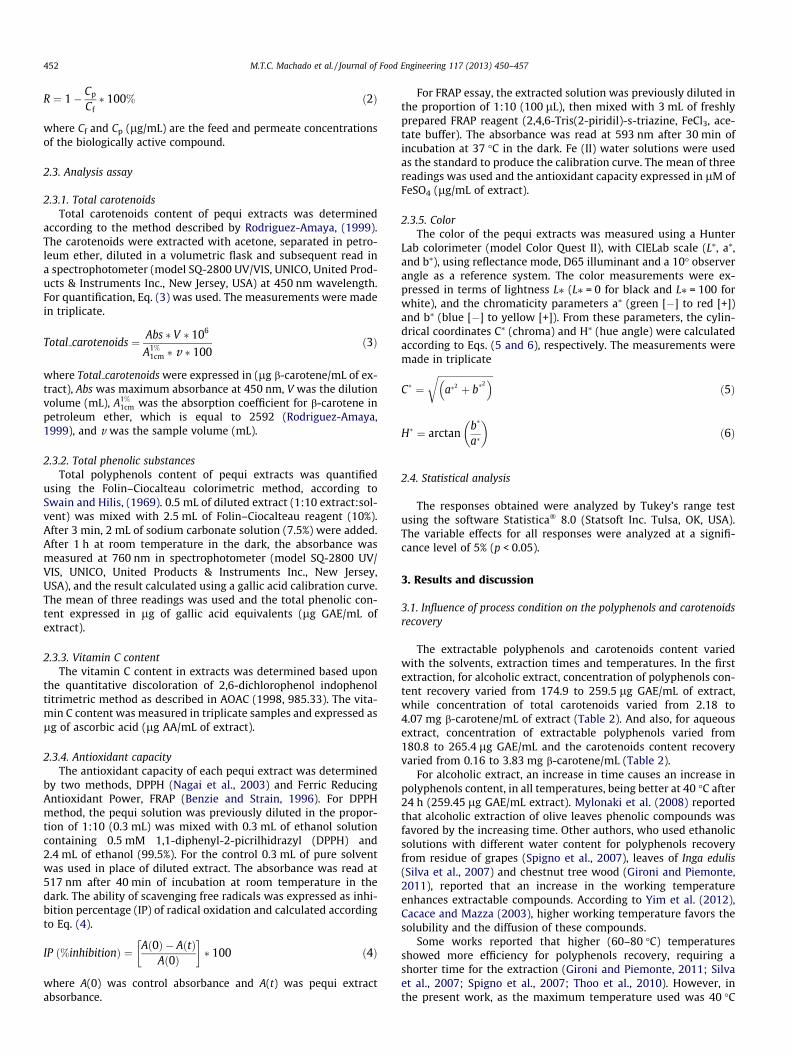
The extractable polyphenols and carotenoids content variedwith the solvents, extraction times and temperatures. In the firstextraction, for alcoholic extract, concentration of polyphenols con-tent recovery varied from 174.9 to 259.5 lg GAE/mL of extract,while concentration of total carotenoids varied from 2.18 to4.07 mg b-carotene/mL of extract (Table 2). And also, for aqueousextract, concentration of extractable polyphenols varied from180.8 to 265.4 lg GAE/mL and the carotenoids content recoveryvaried from 0.16 to 3.83 mg b-carotene/mL (Table 2).
For alcoholic extract, an increase in time causes an increase inpolyphenols content, in all temperatures, being better at 40 �C after24 h (259.45 lg GAE/mL extract). Mylonaki et al. (2008) reportedthat alcoholic extraction of olive leaves phenolic compounds wasfavored by the increasing time. Other authors, who used ethanolicsolutions with different water content for polyphenols recoveryfrom residue of grapes (Spigno et al., 2007), leaves of Inga edulis(Silva et al., 2007) and chestnut tree wood (Gironi and Piemonte,2011), reported that an increase in the working temperatureenhances extractable compounds. According to Yim et al. (2012),Cacace and Mazza (2003), higher working temperature favors thesolubility and the diffusion of these compounds.
Some works reported that higher (60–80 �C) temperaturesshowed more efficiency for polyphenols recovery, requiring ashorter time for the extraction (Gironi and Piemonte, 2011; Silvaet al., 2007; Spigno et al., 2007; Thoo et al., 2010). However, inthe present work, as the maximum temperature used was 40 �C
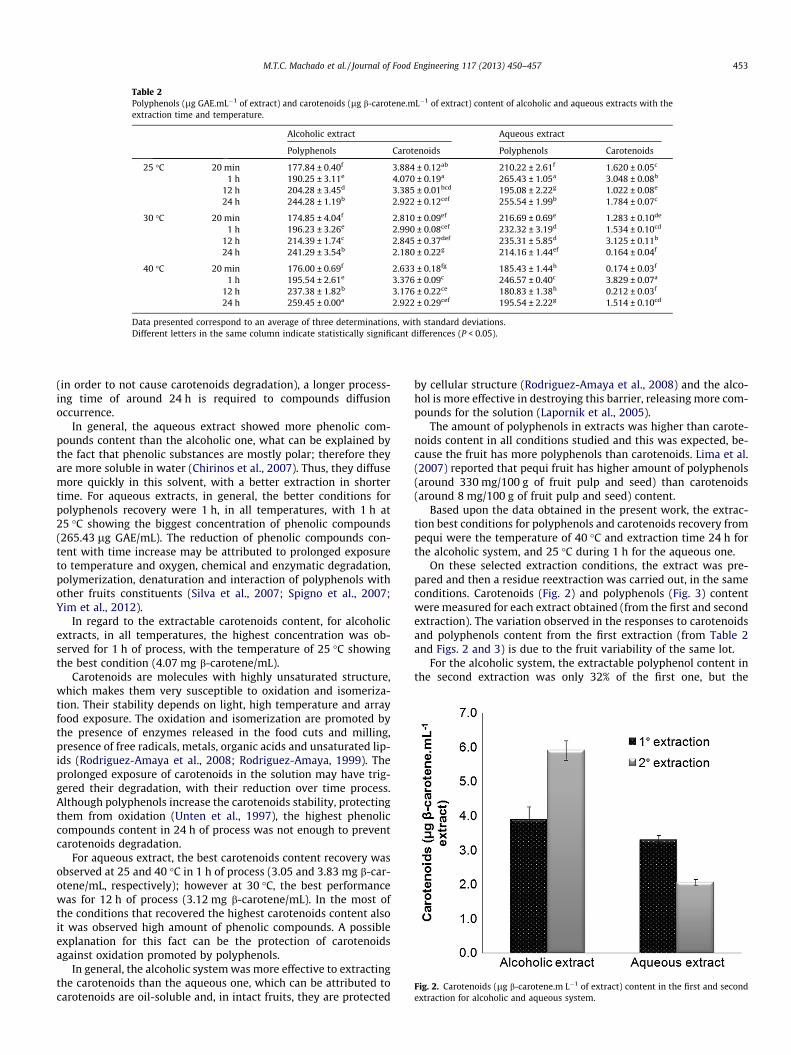
Table 2Polyphenols (lg GAE.mL�1 of extract) and carotenoids (lg b-carotene.mL�1 of extract) content of alcoholic and aqueous extracts with theextraction time and temperature.
Alcoholic extract Aqueous extract
Polyphenols Carotenoids Polyphenols Carotenoids
25 �C 20 min 177.84 ± 0.40f 3.884 ± 0.12ab 210.22 ± 2.61f 1.620 ± 0.05c
1 h 190.25 ± 3.11e 4.070 ± 0.19a 265.43 ± 1.05a 3.048 ± 0.08b
12 h 204.28 ± 3.45d 3.385 ± 0.01bcd 195.08 ± 2.22g 1.022 ± 0.08e
24 h 244.28 ± 1.19b 2.922 ± 0.12cef 255.54 ± 1.99b 1.784 ± 0.07c
30 �C 20 min 174.85 ± 4.04f 2.810 ± 0.09ef 216.69 ± 0.69e 1.283 ± 0.10de
1 h 196.23 ± 3.26e 2.990 ± 0.08cef 232.32 ± 3.19d 1.534 ± 0.10cd
12 h 214.39 ± 1.74c 2.845 ± 0.37def 235.31 ± 5.85d 3.125 ± 0.11b
24 h 241.29 ± 3.54b 2.180 ± 0.22g 214.16 ± 1.44ef 0.164 ± 0.04f
40 �C 20 min 176.00 ± 0.69f 2.633 ± 0.18fg 185.43 ± 1.44h 0.174 ± 0.03f
1 h 195.54 ± 2.61e 3.376 ± 0.09c 246.57 ± 0.40c 3.829 ± 0.07a
12 h 237.38 ± 1.82b 3.176 ± 0.22ce 180.83 ± 1.38h 0.212 ± 0.03f
24 h 259.45 ± 0.00a 2.922 ± 0.29cef 195.54 ± 2.22g 1.514 ± 0.10cd
Data presented correspond to an average of three determinations, with standard deviations.Different letters in the same column indicate statistically significant differences (P < 0.05).
Fig. 2. Carotenoids (lg b-carotene.m L�1 of extract) content in the first and secondextraction for alcoholic and aqueous system.
M.T.C. Machado et al. / Journal of Food Engineering 117 (2013) 450–457 453
(in order to not cause carotenoids degradation), a longer process-ing time of around 24 h is required to compounds diffusionoccurrence.
In general, the aqueous extract showed more phenolic com-pounds content than the alcoholic one, what can be explained bythe fact that phenolic substances are mostly polar; therefore theyare more soluble in water (Chirinos et al., 2007). Thus, they diffusemore quickly in this solvent, with a better extraction in shortertime. For aqueous extracts, in general, the better conditions forpolyphenols recovery were 1 h, in all temperatures, with 1 h at25 �C showing the biggest concentration of phenolic compounds(265.43 lg GAE/mL). The reduction of phenolic compounds con-tent with time increase may be attributed to prolonged exposureto temperature and oxygen, chemical and enzymatic degradation,polymerization, denaturation and interaction of polyphenols withother fruits constituents (Silva et al., 2007; Spigno et al., 2007;Yim et al., 2012).
In regard to the extractable carotenoids content, for alcoholicextracts, in all temperatures, the highest concentration was ob-served for 1 h of process, with the temperature of 25 �C showingthe best condition (4.07 mg b-carotene/mL).
Carotenoids are molecules with highly unsaturated structure,which makes them very susceptible to oxidation and isomeriza-tion. Their stability depends on light, high temperature and arrayfood exposure. The oxidation and isomerization are promoted bythe presence of enzymes released in the food cuts and milling,presence of free radicals, metals, organic acids and unsaturated lip-ids (Rodriguez-Amaya et al., 2008; Rodriguez-Amaya, 1999). Theprolonged exposure of carotenoids in the solution may have trig-gered their degradation, with their reduction over time process.Although polyphenols increase the carotenoids stability, protectingthem from oxidation (Unten et al., 1997), the highest phenoliccompounds content in 24 h of process was not enough to preventcarotenoids degradation.
For aqueous extract, the best carotenoids content recovery wasobserved at 25 and 40 �C in 1 h of process (3.05 and 3.83 mg b-car-otene/mL, respectively); however at 30 �C, the best performancewas for 12 h of process (3.12 mg b-carotene/mL). In the most ofthe conditions that recovered the highest carotenoids content alsoit was observed high amount of phenolic compounds. A possibleexplanation for this fact can be the protection of carotenoidsagainst oxidation promoted by polyphenols.
In general, the alcoholic system was more effective to extractingthe carotenoids than the aqueous one, which can be attributed tocarotenoids are oil-soluble and, in intact fruits, they are protected
by cellular structure (Rodriguez-Amaya et al., 2008) and the alco-hol is more effective in destroying this barrier, releasing more com-pounds for the solution (Lapornik et al., 2005).
The amount of polyphenols in extracts was higher than carote-noids content in all conditions studied and this was expected, be-cause the fruit has more polyphenols than carotenoids. Lima et al.(2007) reported that pequi fruit has higher amount of polyphenols(around 330 mg/100 g of fruit pulp and seed) than carotenoids(around 8 mg/100 g of fruit pulp and seed) content.
Based upon the data obtained in the present work, the extrac-tion best conditions for polyphenols and carotenoids recovery frompequi were the temperature of 40 �C and extraction time 24 h forthe alcoholic system, and 25 �C during 1 h for the aqueous one.
On these selected extraction conditions, the extract was pre-pared and then a residue reextraction was carried out, in the sameconditions. Carotenoids (Fig. 2) and polyphenols (Fig. 3) contentwere measured for each extract obtained (from the first and secondextraction). The variation observed in the responses to carotenoidsand polyphenols content from the first extraction (from Table 2and Figs. 2 and 3) is due to the fruit variability of the same lot.
For the alcoholic system, the extractable polyphenol content inthe second extraction was only 32% of the first one, but the
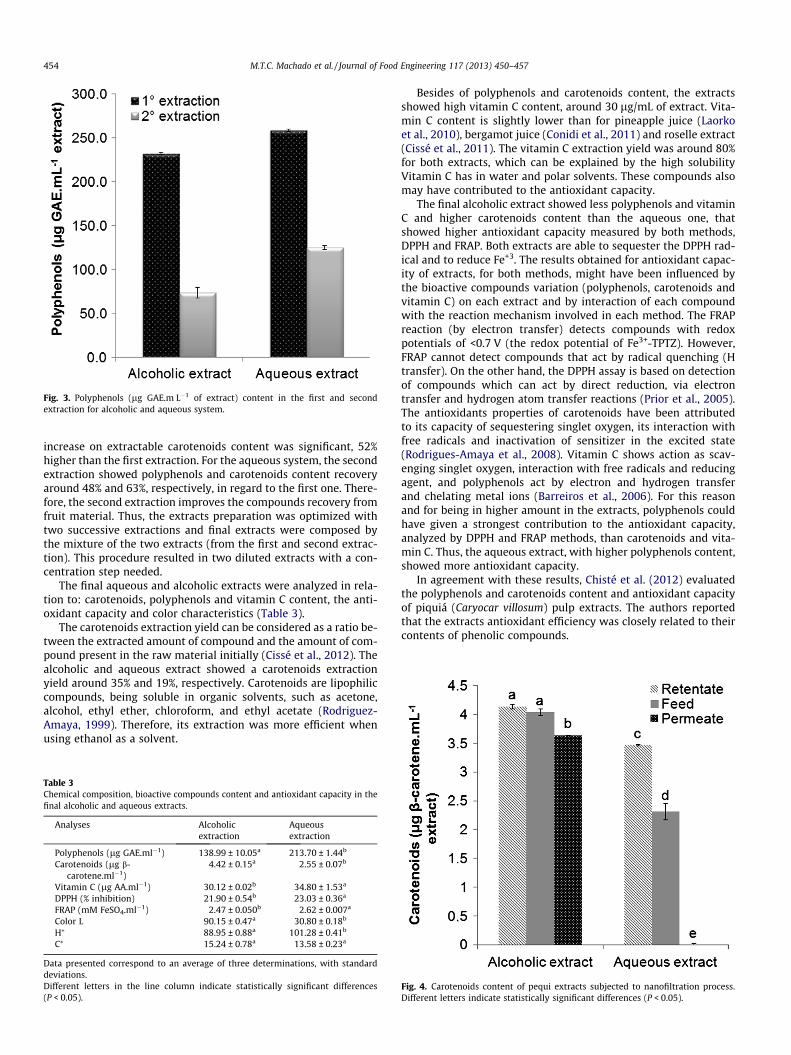
Fig. 3. Polyphenols (lg GAE.m L�1 of extract) content in the first and secondextraction for alcoholic and aqueous system.
454 M.T.C. Machado et al. / Journal of Food Engineering 117 (2013) 450–457
increase on extractable carotenoids content was significant, 52%higher than the first extraction. For the aqueous system, the secondextraction showed polyphenols and carotenoids content recoveryaround 48% and 63%, respectively, in regard to the first one. There-fore, the second extraction improves the compounds recovery fromfruit material. Thus, the extracts preparation was optimized withtwo successive extractions and final extracts were composed bythe mixture of the two extracts (from the first and second extrac-tion). This procedure resulted in two diluted extracts with a con-centration step needed.
The final aqueous and alcoholic extracts were analyzed in rela-tion to: carotenoids, polyphenols and vitamin C content, the anti-oxidant capacity and color characteristics (Table 3).
The carotenoids extraction yield can be considered as a ratio be-tween the extracted amount of compound and the amount of com-pound present in the raw material initially (Cissé et al., 2012). Thealcoholic and aqueous extract showed a carotenoids extractionyield around 35% and 19%, respectively. Carotenoids are lipophiliccompounds, being soluble in organic solvents, such as acetone,alcohol, ethyl ether, chloroform, and ethyl acetate (Rodriguez-Amaya, 1999). Therefore, its extraction was more efficient whenusing ethanol as a solvent.
Table 3Chemical composition, bioactive compounds content and antioxidant capacity in thefinal alcoholic and aqueous extracts.
Analyses Alcoholicextraction
Aqueousextraction
Polyphenols (lg GAE.ml�1) 138.99 ± 10.05a 213.70 ± 1.44b
Carotenoids (lg b-carotene.ml�1)
4.42 ± 0.15a 2.55 ± 0.07b
Vitamin C (lg AA.ml�1) 30.12 ± 0.02b 34.80 ± 1.53a
DPPH (% inhibition) 21.90 ± 0.54b 23.03 ± 0.36a
FRAP (mM FeSO4.ml�1) 2.47 ± 0.050b 2.62 ± 0.007a
Color L 90.15 ± 0.47a 30.80 ± 0.18b
H⁄ 88.95 ± 0.88a 101.28 ± 0.41b
C⁄ 15.24 ± 0.78a 13.58 ± 0.23a
Data presented correspond to an average of three determinations, with standarddeviations.Different letters in the line column indicate statistically significant differences(P < 0.05).
Besides of polyphenols and carotenoids content, the extractsshowed high vitamin C content, around 30 lg/mL of extract. Vita-min C content is slightly lower than for pineapple juice (Laorkoet al., 2010), bergamot juice (Conidi et al., 2011) and roselle extract(Cissé et al., 2011). The vitamin C extraction yield was around 80%for both extracts, which can be explained by the high solubilityVitamin C has in water and polar solvents. These compounds alsomay have contributed to the antioxidant capacity.
The final alcoholic extract showed less polyphenols and vitaminC and higher carotenoids content than the aqueous one, thatshowed higher antioxidant capacity measured by both methods,DPPH and FRAP. Both extracts are able to sequester the DPPH rad-ical and to reduce Fe+3. The results obtained for antioxidant capac-ity of extracts, for both methods, might have been influenced bythe bioactive compounds variation (polyphenols, carotenoids andvitamin C) on each extract and by interaction of each compoundwith the reaction mechanism involved in each method. The FRAPreaction (by electron transfer) detects compounds with redoxpotentials of <0.7 V (the redox potential of Fe3+-TPTZ). However,FRAP cannot detect compounds that act by radical quenching (Htransfer). On the other hand, the DPPH assay is based on detectionof compounds which can act by direct reduction, via electrontransfer and hydrogen atom transfer reactions (Prior et al., 2005).The antioxidants properties of carotenoids have been attributedto its capacity of sequestering singlet oxygen, its interaction withfree radicals and inactivation of sensitizer in the excited state(Rodrigues-Amaya et al., 2008). Vitamin C shows action as scav-enging singlet oxygen, interaction with free radicals and reducingagent, and polyphenols act by electron and hydrogen transferand chelating metal ions (Barreiros et al., 2006). For this reasonand for being in higher amount in the extracts, polyphenols couldhave given a strongest contribution to the antioxidant capacity,analyzed by DPPH and FRAP methods, than carotenoids and vita-min C. Thus, the aqueous extract, with higher polyphenols content,showed more antioxidant capacity.
In agreement with these results, Chisté et al. (2012) evaluatedthe polyphenols and carotenoids content and antioxidant capacityof piquiá (Caryocar villosum) pulp extracts. The authors reportedthat the extracts antioxidant efficiency was closely related to theircontents of phenolic compounds.
Fig. 4. Carotenoids content of pequi extracts subjected to nanofiltration process.Different letters indicate statistically significant differences (P < 0.05).
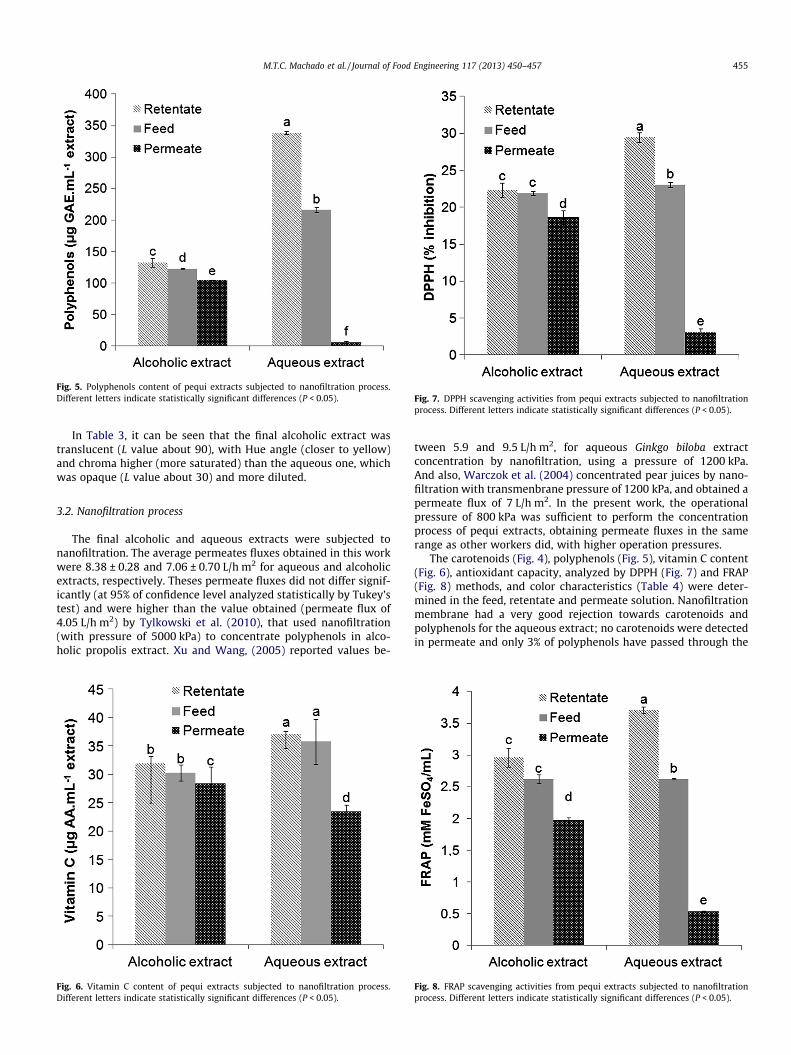
Fig. 5. Polyphenols content of pequi extracts subjected to nanofiltration process.Different letters indicate statistically significant differences (P < 0.05). Fig. 7. DPPH scavenging activities from pequi extracts subjected to nanofiltration
process. Different letters indicate statistically significant differences (P < 0.05).
M.T.C. Machado et al. / Journal of Food Engineering 117 (2013) 450–457 455
In Table 3, it can be seen that the final alcoholic extract wastranslucent (L value about 90), with Hue angle (closer to yellow)and chroma higher (more saturated) than the aqueous one, whichwas opaque (L value about 30) and more diluted.
3.2. Nanofiltration process
The final alcoholic and aqueous extracts were subjected tonanofiltration. The average permeates fluxes obtained in this workwere 8.38 ± 0.28 and 7.06 ± 0.70 L/h m2 for aqueous and alcoholicextracts, respectively. Theses permeate fluxes did not differ signif-icantly (at 95% of confidence level analyzed statistically by Tukey’stest) and were higher than the value obtained (permeate flux of4.05 L/h m2) by Tylkowski et al. (2010), that used nanofiltration(with pressure of 5000 kPa) to concentrate polyphenols in alco-holic propolis extract. Xu and Wang, (2005) reported values be-
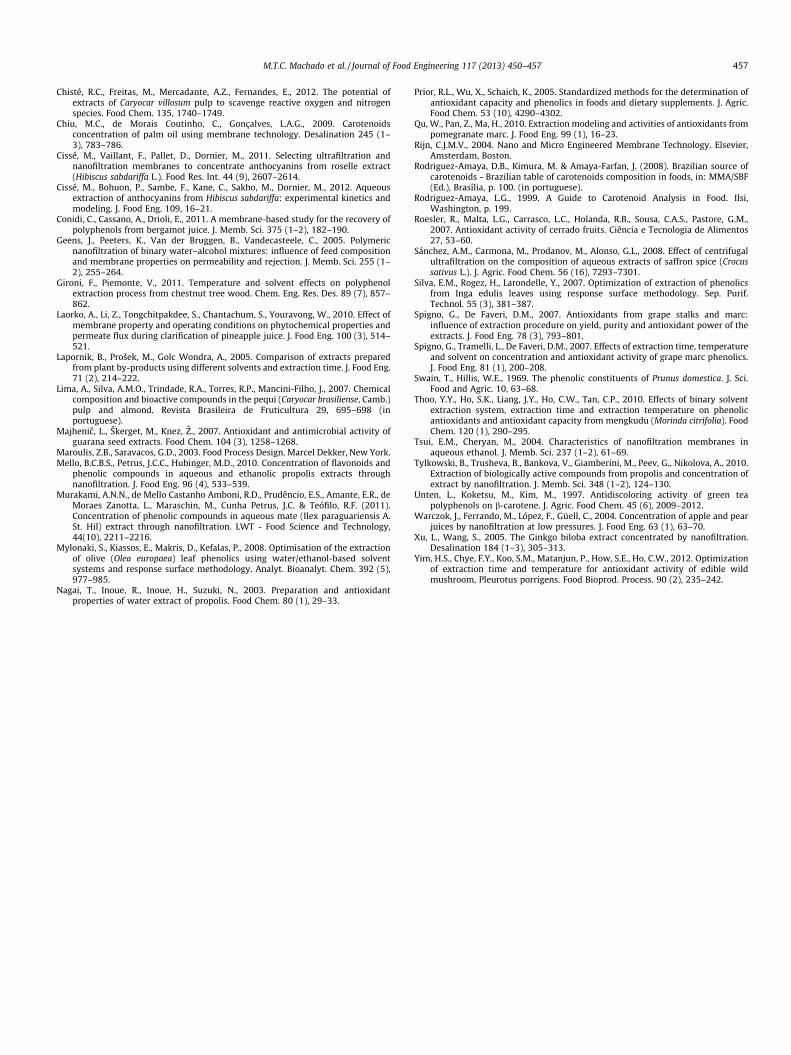
Fig. 6. Vitamin C content of pequi extracts subjected to nanofiltration process.Different letters indicate statistically significant differences (P < 0.05).
tween 5.9 and 9.5 L/h m2, for aqueous Ginkgo biloba extractconcentration by nanofiltration, using a pressure of 1200 kPa.And also, Warczok et al. (2004) concentrated pear juices by nano-filtration with transmenbrane pressure of 1200 kPa, and obtained apermeate flux of 7 L/h m2. In the present work, the operationalpressure of 800 kPa was sufficient to perform the concentrationprocess of pequi extracts, obtaining permeate fluxes in the samerange as other workers did, with higher operation pressures.
The carotenoids (Fig. 4), polyphenols (Fig. 5), vitamin C content(Fig. 6), antioxidant capacity, analyzed by DPPH (Fig. 7) and FRAP(Fig. 8) methods, and color characteristics (Table 4) were deter-mined in the feed, retentate and permeate solution. Nanofiltrationmembrane had a very good rejection towards carotenoids andpolyphenols for the aqueous extract; no carotenoids were detectedin permeate and only 3% of polyphenols have passed through the
Fig. 8. FRAP scavenging activities from pequi extracts subjected to nanofiltrationprocess. Different letters indicate statistically significant differences (P < 0.05).
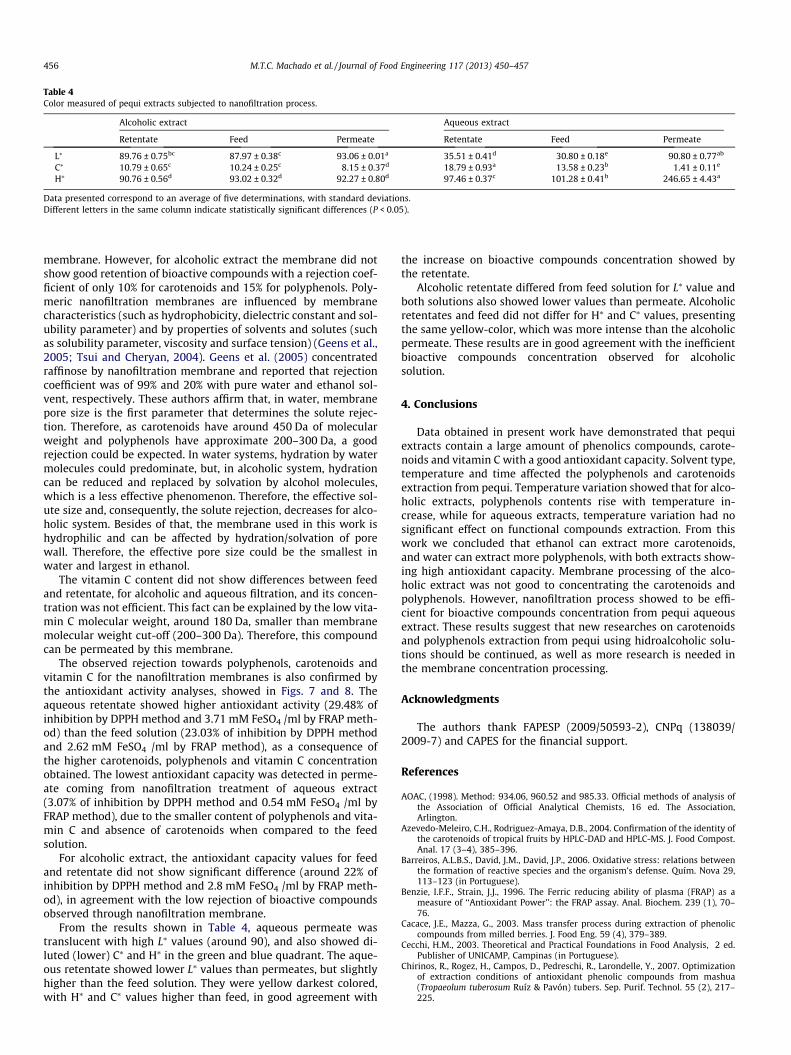
Table 4Color measured of pequi extracts subjected to nanofiltration process.
Alcoholic extract Aqueous extract
Retentate Feed Permeate Retentate Feed Permeate
L⁄ 89.76 ± 0.75bc 87.97 ± 0.38c 93.06 ± 0.01a 35.51 ± 0.41d 30.80 ± 0.18e 90.80 ± 0.77ab
C⁄ 10.79 ± 0.65c 10.24 ± 0.25c 8.15 ± 0.37d 18.79 ± 0.93a 13.58 ± 0.23b 1.41 ± 0.11e
H⁄ 90.76 ± 0.56d 93.02 ± 0.32d 92.27 ± 0.80d 97.46 ± 0.37c 101.28 ± 0.41b 246.65 ± 4.43a
Data presented correspond to an average of five determinations, with standard deviations.Different letters in the same column indicate statistically significant differences (P < 0.05).
456 M.T.C. Machado et al. / Journal of Food Engineering 117 (2013) 450–457
membrane. However, for alcoholic extract the membrane did notshow good retention of bioactive compounds with a rejection coef-ficient of only 10% for carotenoids and 15% for polyphenols. Poly-meric nanofiltration membranes are influenced by membranecharacteristics (such as hydrophobicity, dielectric constant and sol-ubility parameter) and by properties of solvents and solutes (suchas solubility parameter, viscosity and surface tension) (Geens et al.,2005; Tsui and Cheryan, 2004). Geens et al. (2005) concentratedraffinose by nanofiltration membrane and reported that rejectioncoefficient was of 99% and 20% with pure water and ethanol sol-vent, respectively. These authors affirm that, in water, membranepore size is the first parameter that determines the solute rejec-tion. Therefore, as carotenoids have around 450 Da of molecularweight and polyphenols have approximate 200–300 Da, a goodrejection could be expected. In water systems, hydration by watermolecules could predominate, but, in alcoholic system, hydrationcan be reduced and replaced by solvation by alcohol molecules,which is a less effective phenomenon. Therefore, the effective sol-ute size and, consequently, the solute rejection, decreases for alco-holic system. Besides of that, the membrane used in this work ishydrophilic and can be affected by hydration/solvation of porewall. Therefore, the effective pore size could be the smallest inwater and largest in ethanol.
The vitamin C content did not show differences between feedand retentate, for alcoholic and aqueous filtration, and its concen-tration was not efficient. This fact can be explained by the low vita-min C molecular weight, around 180 Da, smaller than membranemolecular weight cut-off (200–300 Da). Therefore, this compoundcan be permeated by this membrane.
The observed rejection towards polyphenols, carotenoids andvitamin C for the nanofiltration membranes is also confirmed bythe antioxidant activity analyses, showed in Figs. 7 and 8. Theaqueous retentate showed higher antioxidant activity (29.48% ofinhibition by DPPH method and 3.71 mM FeSO4 /ml by FRAP meth-od) than the feed solution (23.03% of inhibition by DPPH methodand 2.62 mM FeSO4 /ml by FRAP method), as a consequence ofthe higher carotenoids, polyphenols and vitamin C concentrationobtained. The lowest antioxidant capacity was detected in perme-ate coming from nanofiltration treatment of aqueous extract(3.07% of inhibition by DPPH method and 0.54 mM FeSO4 /ml byFRAP method), due to the smaller content of polyphenols and vita-min C and absence of carotenoids when compared to the feedsolution.
For alcoholic extract, the antioxidant capacity values for feedand retentate did not show significant difference (around 22% ofinhibition by DPPH method and 2.8 mM FeSO4 /ml by FRAP meth-od), in agreement with the low rejection of bioactive compoundsobserved through nanofiltration membrane.
From the results shown in Table 4, aqueous permeate wastranslucent with high L⁄ values (around 90), and also showed di-luted (lower) C⁄ and H⁄ in the green and blue quadrant. The aque-ous retentate showed lower L⁄ values than permeates, but slightlyhigher than the feed solution. They were yellow darkest colored,with H⁄ and C⁄ values higher than feed, in good agreement with
the increase on bioactive compounds concentration showed bythe retentate.
Alcoholic retentate differed from feed solution for L⁄ value andboth solutions also showed lower values than permeate. Alcoholicretentates and feed did not differ for H⁄ and C⁄ values, presentingthe same yellow-color, which was more intense than the alcoholicpermeate. These results are in good agreement with the inefficientbioactive compounds concentration observed for alcoholicsolution.
4. Conclusions
Data obtained in present work have demonstrated that pequiextracts contain a large amount of phenolics compounds, carote-noids and vitamin C with a good antioxidant capacity. Solvent type,temperature and time affected the polyphenols and carotenoidsextraction from pequi. Temperature variation showed that for alco-holic extracts, polyphenols contents rise with temperature in-crease, while for aqueous extracts, temperature variation had nosignificant effect on functional compounds extraction. From thiswork we concluded that ethanol can extract more carotenoids,and water can extract more polyphenols, with both extracts show-ing high antioxidant capacity. Membrane processing of the alco-holic extract was not good to concentrating the carotenoids andpolyphenols. However, nanofiltration process showed to be effi-cient for bioactive compounds concentration from pequi aqueousextract. These results suggest that new researches on carotenoidsand polyphenols extraction from pequi using hidroalcoholic solu-tions should be continued, as well as more research is needed inthe membrane concentration processing.
Acknowledgments
The authors thank FAPESP (2009/50593-2), CNPq (138039/2009-7) and CAPES for the financial support.
References
AOAC, (1998). Method: 934.06, 960.52 and 985.33. Official methods of analysis ofthe Association of Official Analytical Chemists, 16 ed. The Association,Arlington.
Azevedo-Meleiro, C.H., Rodriguez-Amaya, D.B., 2004. Confirmation of the identity ofthe carotenoids of tropical fruits by HPLC-DAD and HPLC-MS. J. Food Compost.Anal. 17 (3–4), 385–396.
Barreiros, A.L.B.S., David, J.M., David, J.P., 2006. Oxidative stress: relations betweenthe formation of reactive species and the organism’s defense. Quím. Nova 29,113–123 (in Portuguese).
Benzie, I.F.F., Strain, J.J., 1996. The Ferric reducing ability of plasma (FRAP) as ameasure of ‘‘Antioxidant Power’’: the FRAP assay. Anal. Biochem. 239 (1), 70–76.
Cacace, J.E., Mazza, G., 2003. Mass transfer process during extraction of phenoliccompounds from milled berries. J. Food Eng. 59 (4), 379–389.
Cecchi, H.M., 2003. Theoretical and Practical Foundations in Food Analysis, 2 ed.Publisher of UNICAMP, Campinas (in Portuguese).
Chirinos, R., Rogez, H., Campos, D., Pedreschi, R., Larondelle, Y., 2007. Optimizationof extraction conditions of antioxidant phenolic compounds from mashua(Tropaeolum tuberosum Ruíz & Pavón) tubers. Sep. Purif. Technol. 55 (2), 217–225.
M.T.C. Machado et al. / Journal of Food Engineering 117 (2013) 450–457 457
Chisté, R.C., Freitas, M., Mercadante, A.Z., Fernandes, E., 2012. The potential ofextracts of Caryocar villosum pulp to scavenge reactive oxygen and nitrogenspecies. Food Chem. 135, 1740–1749.
Chiu, M.C., de Morais Coutinho, C., Gonçalves, L.A.G., 2009. Carotenoidsconcentration of palm oil using membrane technology. Desalination 245 (1–3), 783–786.
Cissé, M., Vaillant, F., Pallet, D., Dornier, M., 2011. Selecting ultrafiltration andnanofiltration membranes to concentrate anthocyanins from roselle extract(Hibiscus sabdariffa L.). Food Res. Int. 44 (9), 2607–2614.
Cissé, M., Bohuon, P., Sambe, F., Kane, C., Sakho, M., Dornier, M., 2012. Aqueousextraction of anthocyanins from Hibiscus sabdariffa: experimental kinetics andmodeling. J. Food Eng. 109, 16–21.
Conidi, C., Cassano, A., Drioli, E., 2011. A membrane-based study for the recovery ofpolyphenols from bergamot juice. J. Memb. Sci. 375 (1–2), 182–190.
Geens, J., Peeters, K., Van der Bruggen, B., Vandecasteele, C., 2005. Polymericnanofiltration of binary water–alcohol mixtures: influence of feed compositionand membrane properties on permeability and rejection. J. Memb. Sci. 255 (1–2), 255–264.
Gironi, F., Piemonte, V., 2011. Temperature and solvent effects on polyphenolextraction process from chestnut tree wood. Chem. Eng. Res. Des. 89 (7), 857–862.
Laorko, A., Li, Z., Tongchitpakdee, S., Chantachum, S., Youravong, W., 2010. Effect ofmembrane property and operating conditions on phytochemical properties andpermeate flux during clarification of pineapple juice. J. Food Eng. 100 (3), 514–521.
Lapornik, B., Prošek, M., Golc Wondra, A., 2005. Comparison of extracts preparedfrom plant by-products using different solvents and extraction time. J. Food Eng.71 (2), 214–222.
Lima, A., Silva, A.M.O., Trindade, R.A., Torres, R.P., Mancini-Filho, J., 2007. Chemicalcomposition and bioactive compounds in the pequi (Caryocar brasiliense, Camb.)pulp and almond. Revista Brasileira de Fruticultura 29, 695–698 (inportuguese).
Majhenic, L., Škerget, M., Knez, Z., 2007. Antioxidant and antimicrobial activity ofguarana seed extracts. Food Chem. 104 (3), 1258–1268.
Maroulis, Z.B., Saravacos, G.D., 2003. Food Process Design. Marcel Dekker, New York.Mello, B.C.B.S., Petrus, J.C.C., Hubinger, M.D., 2010. Concentration of flavonoids and
phenolic compounds in aqueous and ethanolic propolis extracts throughnanofiltration. J. Food Eng. 96 (4), 533–539.
Murakami, A.N.N., de Mello Castanho Amboni, R.D., Prudêncio, E.S., Amante, E.R., deMoraes Zanotta, L., Maraschin, M., Cunha Petrus, J.C. & Teófilo, R.F. (2011).Concentration of phenolic compounds in aqueous mate (Ilex paraguariensis A.St. Hil) extract through nanofiltration. LWT - Food Science and Technology,44(10), 2211–2216.
Mylonaki, S., Kiassos, E., Makris, D., Kefalas, P., 2008. Optimisation of the extractionof olive (Olea europaea) leaf phenolics using water/ethanol-based solventsystems and response surface methodology. Analyt. Bioanalyt. Chem. 392 (5),977–985.
Nagai, T., Inoue, R., Inoue, H., Suzuki, N., 2003. Preparation and antioxidantproperties of water extract of propolis. Food Chem. 80 (1), 29–33.
Prior, R.L., Wu, X., Schaich, K., 2005. Standardized methods for the determination ofantioxidant capacity and phenolics in foods and dietary supplements. J. Agric.Food Chem. 53 (10), 4290–4302.
Qu, W., Pan, Z., Ma, H., 2010. Extraction modeling and activities of antioxidants frompomegranate marc. J. Food Eng. 99 (1), 16–23.
Rijn, C.J.M.V., 2004. Nano and Micro Engineered Membrane Technology. Elsevier,Amsterdam, Boston.
Rodriguez-Amaya, D.B., Kimura, M. & Amaya-Farfan, J. (2008). Brazilian source ofcarotenoids - Brazilian table of carotenoids composition in foods, in: MMA/SBF(Ed.), Brasília, p. 100. (in portuguese).
Rodriguez-Amaya, L.G., 1999. A Guide to Carotenoid Analysis in Food. Ilsi,Washington, p. 199.
Roesler, R., Malta, L.G., Carrasco, L.C., Holanda, R.B., Sousa, C.A.S., Pastore, G.M.,2007. Antioxidant activity of cerrado fruits. Ciência e Tecnologia de Alimentos27, 53–60.
Sánchez, A.M., Carmona, M., Prodanov, M., Alonso, G.L., 2008. Effect of centrifugalultrafiltration on the composition of aqueous extracts of saffron spice (Crocussativus L.). J. Agric. Food Chem. 56 (16), 7293–7301.
Silva, E.M., Rogez, H., Larondelle, Y., 2007. Optimization of extraction of phenolicsfrom Inga edulis leaves using response surface methodology. Sep. Purif.Technol. 55 (3), 381–387.
Spigno, G., De Faveri, D.M., 2007. Antioxidants from grape stalks and marc:influence of extraction procedure on yield, purity and antioxidant power of theextracts. J. Food Eng. 78 (3), 793–801.
Spigno, G., Tramelli, L., De Faveri, D.M., 2007. Effects of extraction time, temperatureand solvent on concentration and antioxidant activity of grape marc phenolics.J. Food Eng. 81 (1), 200–208.
Swain, T., Hillis, W.E., 1969. The phenolic constituents of Prunus domestica. J. Sci.Food and Agric. 10, 63–68.
Thoo, Y.Y., Ho, S.K., Liang, J.Y., Ho, C.W., Tan, C.P., 2010. Effects of binary solventextraction system, extraction time and extraction temperature on phenolicantioxidants and antioxidant capacity from mengkudu (Morinda citrifolia). FoodChem. 120 (1), 290–295.
Tsui, E.M., Cheryan, M., 2004. Characteristics of nanofiltration membranes inaqueous ethanol. J. Memb. Sci. 237 (1–2), 61–69.
Tylkowski, B., Trusheva, B., Bankova, V., Giamberini, M., Peev, G., Nikolova, A., 2010.Extraction of biologically active compounds from propolis and concentration ofextract by nanofiltration. J. Memb. Sci. 348 (1–2), 124–130.
Unten, L., Koketsu, M., Kim, M., 1997. Antidiscoloring activity of green teapolyphenols on b-carotene. J. Agric. Food Chem. 45 (6), 2009–2012.
Warczok, J., Ferrando, M., López, F., Güell, C., 2004. Concentration of apple and pearjuices by nanofiltration at low pressures. J. Food Eng. 63 (1), 63–70.
Xu, L., Wang, S., 2005. The Ginkgo biloba extract concentrated by nanofiltration.Desalination 184 (1–3), 305–313.
Yim, H.S., Chye, F.Y., Koo, S.M., Matanjun, P., How, S.E., Ho, C.W., 2012. Optimizationof extraction time and temperature for antioxidant activity of edible wildmushroom, Pleurotus porrigens. Food Bioprod. Process. 90 (2), 235–242.