journal of glaciology the red rock ice cliff revisited six
TRANSCRIPT
Journal of Glaciology
Article
Cite this article: Abermann J, Steiner JF, PrinzR, Wecht M, Lisager P (2020). The Red Rock icecliff revisited – six decades of frontal, massand area changes in the Nunatarssuaq area,Northwest Greenland. Journal of Glaciology 66(258), 567–576. https://doi.org/10.1017/jog.2020.28
Received: 18 November 2019Revised: 26 March 2020Accepted: 27 March 2020First published online: 23 April 2020
Key words:Arctic glaciology; glacier fluctuations; glaciermass balance
Author for correspondence:Jakob Abermann, E-mail: [email protected]
© The Author(s), 2020. Published byCambridge University Press. This is an OpenAccess article, distributed under the terms ofthe Creative Commons Attribution licence(http://creativecommons.org/licenses/by/4.0/),which permits unrestricted re-use,distribution, and reproduction in any medium,provided the original work is properly cited.
cambridge.org/jog
The Red Rock ice cliff revisited – six decades offrontal, mass and area changes in theNunatarssuaq area, Northwest Greenland
Jakob Abermann1,2 , Jakob F. Steiner3, Rainer Prinz4 , Matthias Wecht1
and Peter Lisager2
1University of Graz, Heinrichstraße 36, 8010 Graz, Austria; 2Asiaq, Greenland Survey, PB 1003, 3900 Nuuk,Greenland; 3Department of Physical Geography, Utrecht University, PO Box 80115, Utrecht, The Netherlands and4Department of Atmospheric and Cryospheric Sciences, University of Innsbruck, Innrain 52, 6020 Innsbruck,Austria
Abstract
We present changes of the ice margin in Northwest Greenland at the Eastern part of theNunatarssuaq Ice Cap (NIC) over six decades. The ice margin in this area terminates as anear-vertical ice cliff of between 9 and 33m thickness. During the years 1954–1957 and in1965 multi-disciplinary studies were performed. We digitise and orthorectify material, that isoften difficult to access, in order to use the historical data as an absolute starting point of ourchange assessment. We compare the cliff morphology of the mid-1950s and the mid-1960swith various time-steps between 1985 and 2017. The studied ice margin remained remarkablyconstant with very subtle changes of changing sign: rather slow advance rates are reportedfrom the 1950s and 1960s that accelerated until 1985 and were followed by a general retreatuntil 2012 and a subsequent advance until 2017. Thickness changes are negative throughoutthe entire time-period, however, different rates of thinning are shown and there is a positive rela-tionship with air temperature anomalies. Compared to similar elevations on the adjacentGreenland ice sheet, we find significantly weaker thinning rates at the NIC.
Introduction
The land-terminating part of the Greenland ice sheet (GrIS) is by far larger than the marine-terminating part – yet has so far received much less attention. Studies that deal withGreenland’s land-terminating glaciers have mainly focused on the southern and centralWest coast (Weidick, 1968; Sole and others, 2008; Tedstone and others, 2015; Carrivick andothers, 2018; Lesnek and Briner, 2018; Koziol and Arnold, 2018; Davison and others,2019), while fewer studies exist for North Greenland (Goldthwait, 1971; Osterberg and others,2015; Farnsworth and others, 2018). Additionally, most of the glaciers and ice caps (GIC) sur-rounding the GrIS are land-terminating. The GIC amount to ∼5% of the total ice covered areaof Greenland (Rastner and others, 2012; Citterio and Ahlstrøm, 2013), were an important con-tributor to sea level rise in the past (Jacob and others, 2012; Bolch and others, 2013; Box andothers, 2018; Zemp and others, 2019) and are expected to continue to be so in future decades(Machguth and others, 2013; Huss and Hock, 2015; Meredith and others, 2019).
The ice-sheet margins in both Greenland and Antarctica have experienced widespreadthinning in recent decades (Pritchard and others, 2009; Howat and Eddy, 2011; Kjeldsenand others, 2015) and generally, marine-terminating tongues thin at higher rates than land-terminating ones (Sole and others, 2008; Felikson and others, 2017). Some field studies, how-ever, have shown stability or a temporary advance of land-terminating GIC in both Antarctica(Fitzsimons and Colhoun, 1995; Fountain and others, 2004a; Swanger and others, 2017) andGreenland (Davies and Krinsley, 1962; Goldthwait, 1971; Dawes and van As, 2010; Farnsworthand others, 2018). A comprehensive dataset of length change observations in Greenland(Weidick, 1968; Leclercq and others, 2012) allows for a centennial perspective on glacier fluc-tuations: generally, retreat dominated since the end of the Little Ice Age with the highest dec-adal retreat rates in the 1930s. The database focusses on Southwest and West Greenland. ForNorth Greenland, Davies and Krinsley (1962) found a maximum glacier extent for several gla-ciers in Northwest Greenland between 1920 and 1930; Goldthwait (1961) found organicmaterial at the Red Rock (RR) ice cliff ∼30 m back of the cliff and 41 m under ice cover atthat time, which they dated to be ∼200 years old. This can be taken as evidence of net ice mar-gin advance on a centennial scale; however, it does not reveal information on possible fluctua-tions or changing advance rates. To our knowledge, there is no direct evidence ofhigh-resolution centennial glacier changes in Northwest Greenland.
The general hypothesis that recent warming could have increased the viscosity of ice andtherefore resulted in an advance, has been put forward (Goldthwait, 1971; Fountain andothers, 2004a) and for Greenland an increase in accumulation on ice caps has equally beenproposed (Davies and Krinsley, 1962; Dawes and van As, 2010), although observations aregenerally scarce for both local climate and ice dynamics. Larger scale observations suggest a
Downloaded from https://www.cambridge.org/core. 13 Nov 2021 at 14:57:36, subject to the Cambridge Core terms of use.
dynamic slowdown of the land-terminating sector with anincrease in meltwater production due to hydrodynamic coupling(Tedstone and others, 2015).
On the larger spatial scale, Davies and Krinsley (1962) foundmore of the GIC in North Greenland to be stationary ratherthan retreating in contrast to a retreating GrIS. The observationof an ice margin stationarity or advance from geodetic measure-ments is supported with exposure studies carried out decadeslater, finding evidence for ice margin advances during the lateHolocene (Farnsworth and others, 2018). On a longer time-scale,the process of advancing glaciers is relevant for studies as theGreenland ice margin underwent a series of advance and retreatcycles during the Pleistocene (Larsen and others, 2018; Knutzand others, 2019). Revisiting a study area in NorthwestGreenland where an advance was reported during the 1950sand 1960s, we provide a detailed history of cliff morphologychanges as a basis for further studies investigating the driversfor this behaviour.
The historical context
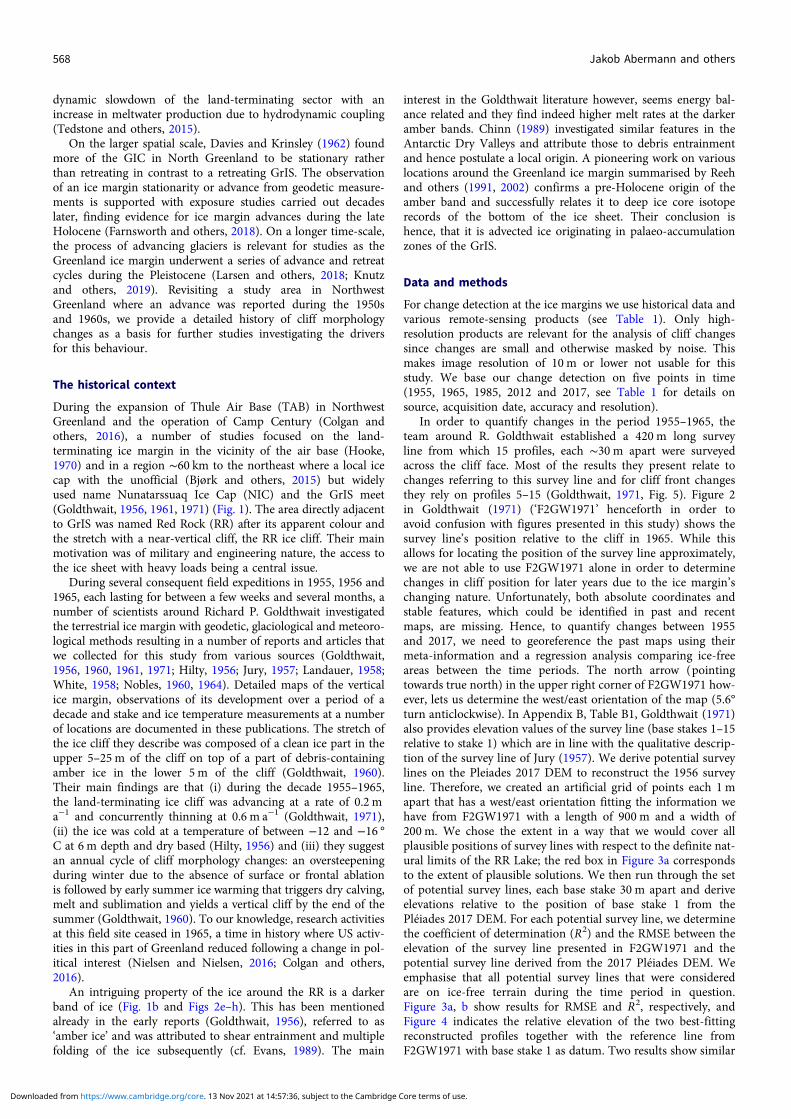
During the expansion of Thule Air Base (TAB) in NorthwestGreenland and the operation of Camp Century (Colgan andothers, 2016), a number of studies focused on the land-terminating ice margin in the vicinity of the air base (Hooke,1970) and in a region ∼60 km to the northeast where a local icecap with the unofficial (Bjørk and others, 2015) but widelyused name Nunatarssuaq Ice Cap (NIC) and the GrIS meet(Goldthwait, 1956, 1961, 1971) (Fig. 1). The area directly adjacentto GrIS was named Red Rock (RR) after its apparent colour andthe stretch with a near-vertical cliff, the RR ice cliff. Their mainmotivation was of military and engineering nature, the access tothe ice sheet with heavy loads being a central issue.
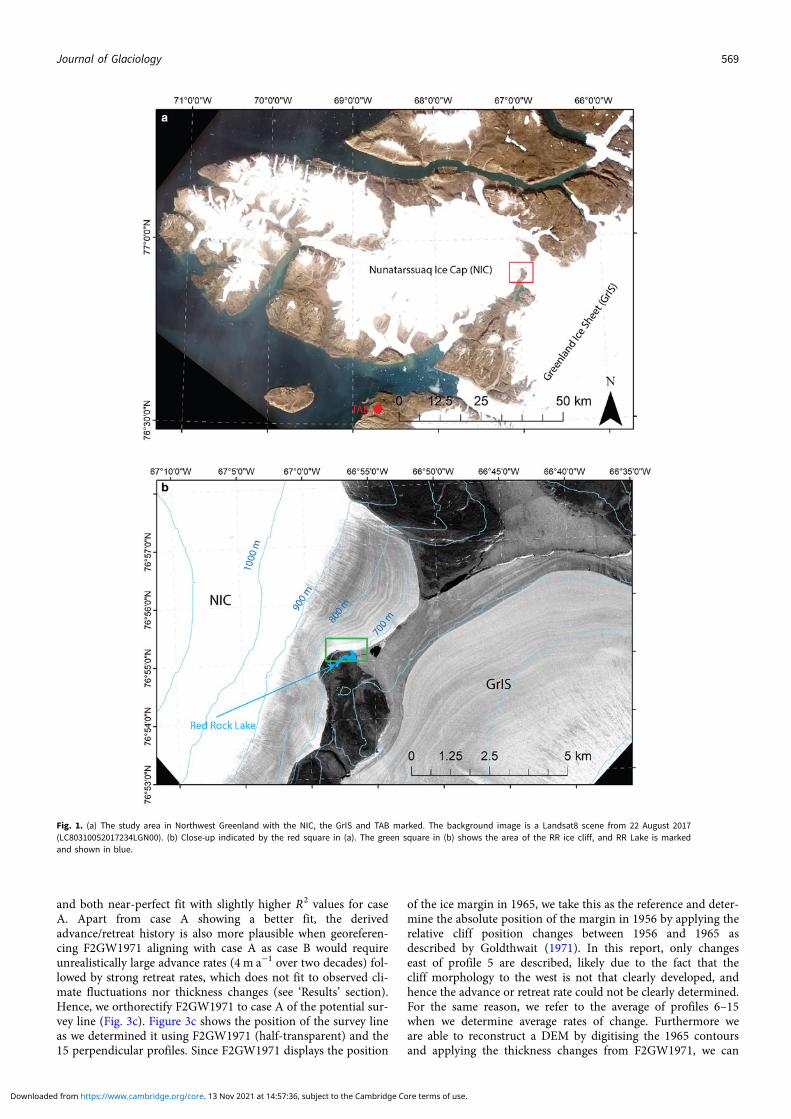
During several consequent field expeditions in 1955, 1956 and1965, each lasting for between a few weeks and several months, anumber of scientists around Richard P. Goldthwait investigatedthe terrestrial ice margin with geodetic, glaciological and meteoro-logical methods resulting in a number of reports and articles thatwe collected for this study from various sources (Goldthwait,1956, 1960, 1961, 1971; Hilty, 1956; Jury, 1957; Landauer, 1958;White, 1958; Nobles, 1960, 1964). Detailed maps of the verticalice margin, observations of its development over a period of adecade and stake and ice temperature measurements at a numberof locations are documented in these publications. The stretch ofthe ice cliff they describe was composed of a clean ice part in theupper 5–25 m of the cliff on top of a part of debris-containingamber ice in the lower 5 m of the cliff (Goldthwait, 1960).Their main findings are that (i) during the decade 1955–1965,the land-terminating ice cliff was advancing at a rate of 0.2 ma−1 and concurrently thinning at 0.6 m a−1 (Goldthwait, 1971),(ii) the ice was cold at a temperature of between −12 and −16 °C at 6 m depth and dry based (Hilty, 1956) and (iii) they suggestan annual cycle of cliff morphology changes: an oversteepeningduring winter due to the absence of surface or frontal ablationis followed by early summer ice warming that triggers dry calving,melt and sublimation and yields a vertical cliff by the end of thesummer (Goldthwait, 1960). To our knowledge, research activitiesat this field site ceased in 1965, a time in history where US activ-ities in this part of Greenland reduced following a change in pol-itical interest (Nielsen and Nielsen, 2016; Colgan and others,2016).
An intriguing property of the ice around the RR is a darkerband of ice (Fig. 1b and Figs 2e–h). This has been mentionedalready in the early reports (Goldthwait, 1956), referred to as‘amber ice’ and was attributed to shear entrainment and multiplefolding of the ice subsequently (cf. Evans, 1989). The main
interest in the Goldthwait literature however, seems energy bal-ance related and they find indeed higher melt rates at the darkeramber bands. Chinn (1989) investigated similar features in theAntarctic Dry Valleys and attribute those to debris entrainmentand hence postulate a local origin. A pioneering work on variouslocations around the Greenland ice margin summarised by Reehand others (1991, 2002) confirms a pre-Holocene origin of theamber band and successfully relates it to deep ice core isotoperecords of the bottom of the ice sheet. Their conclusion ishence, that it is advected ice originating in palaeo-accumulationzones of the GrIS.
Data and methods
For change detection at the ice margins we use historical data andvarious remote-sensing products (see Table 1). Only high-resolution products are relevant for the analysis of cliff changessince changes are small and otherwise masked by noise. Thismakes image resolution of 10 m or lower not usable for thisstudy. We base our change detection on five points in time(1955, 1965, 1985, 2012 and 2017, see Table 1 for details onsource, acquisition date, accuracy and resolution).
In order to quantify changes in the period 1955–1965, theteam around R. Goldthwait established a 420 m long surveyline from which 15 profiles, each ∼30 m apart were surveyedacross the cliff face. Most of the results they present relate tochanges referring to this survey line and for cliff front changesthey rely on profiles 5–15 (Goldthwait, 1971, Fig. 5). Figure 2in Goldthwait (1971) (‘F2GW1971’ henceforth in order toavoid confusion with figures presented in this study) shows thesurvey line’s position relative to the cliff in 1965. While thisallows for locating the position of the survey line approximately,we are not able to use F2GW1971 alone in order to determinechanges in cliff position for later years due to the ice margin’schanging nature. Unfortunately, both absolute coordinates andstable features, which could be identified in past and recentmaps, are missing. Hence, to quantify changes between 1955and 2017, we need to georeference the past maps using theirmeta-information and a regression analysis comparing ice-freeareas between the time periods. The north arrow (pointingtowards true north) in the upper right corner of F2GW1971 how-ever, lets us determine the west/east orientation of the map (5.6°turn anticlockwise). In Appendix B, Table B1, Goldthwait (1971)also provides elevation values of the survey line (base stakes 1–15relative to stake 1) which are in line with the qualitative descrip-tion of the survey line of Jury (1957). We derive potential surveylines on the Pleiades 2017 DEM to reconstruct the 1956 surveyline. Therefore, we created an artificial grid of points each 1 mapart that has a west/east orientation fitting the information wehave from F2GW1971 with a length of 900 m and a width of200 m. We chose the extent in a way that we would cover allplausible positions of survey lines with respect to the definite nat-ural limits of the RR Lake; the red box in Figure 3a correspondsto the extent of plausible solutions. We then run through the setof potential survey lines, each base stake 30 m apart and deriveelevations relative to the position of base stake 1 from thePléiades 2017 DEM. For each potential survey line, we determinethe coefficient of determination (R2) and the RMSE between theelevation of the survey line presented in F2GW1971 and thepotential survey line derived from the 2017 Pléiades DEM. Weemphasise that all potential survey lines that were consideredare on ice-free terrain during the time period in question.Figure 3a, b show results for RMSE and R2, respectively, andFigure 4 indicates the relative elevation of the two best-fittingreconstructed profiles together with the reference line fromF2GW1971 with base stake 1 as datum. Two results show similar
568 Jakob Abermann and others
Downloaded from https://www.cambridge.org/core. 13 Nov 2021 at 14:57:36, subject to the Cambridge Core terms of use.
and both near-perfect fit with slightly higher R2 values for caseA. Apart from case A showing a better fit, the derivedadvance/retreat history is also more plausible when georeferen-cing F2GW1971 aligning with case A as case B would requireunrealistically large advance rates (4 m a−1 over two decades) fol-lowed by strong retreat rates, which does not fit to observed cli-mate fluctuations nor thickness changes (see ‘Results’ section).Hence, we orthorectify F2GW1971 to case A of the potential sur-vey line (Fig. 3c). Figure 3c shows the position of the survey lineas we determined it using F2GW1971 (half-transparent) and the15 perpendicular profiles. Since F2GW1971 displays the position
of the ice margin in 1965, we take this as the reference and deter-mine the absolute position of the margin in 1956 by applying therelative cliff position changes between 1956 and 1965 asdescribed by Goldthwait (1971). In this report, only changeseast of profile 5 are described, likely due to the fact that thecliff morphology to the west is not that clearly developed, andhence the advance or retreat rate could not be clearly determined.For the same reason, we refer to the average of profiles 6–15when we determine average rates of change. Furthermore weare able to reconstruct a DEM by digitising the 1965 contoursand applying the thickness changes from F2GW1971, we can
Fig. 1. (a) The study area in Northwest Greenland with the NIC, the GrIS and TAB marked. The background image is a Landsat8 scene from 22 August 2017(LC80310052017234LGN00). (b) Close-up indicated by the red square in (a). The green square in (b) shows the area of the RR ice cliff, and RR Lake is markedand shown in blue.
Journal of Glaciology 569
Downloaded from https://www.cambridge.org/core. 13 Nov 2021 at 14:57:36, subject to the Cambridge Core terms of use.
then reconstruct the 1956 DEM. By georeferencing this figure wewere therefore able to directly compare the results from theGoldthwait campaigns with more recent remote-sensingproducts.
The 1985 DEM (Korsgaard and others, 2016) shows a highdegree of interpolation just around the cliff edge. This is the
reason why we do not calculate or display thickness changes atthe cliff edge there. Fortunately, the original 2 m orthoimagesare also provided by Korsgaard and others (2016) and with con-fidence we use the relevant one (‘g150_1985_utm19.jp2’) in orderto determine the position of the 1985 cliff edge after georeferen-cing it to the Pléiades orthoimage.
Fig. 2. Photographs from the campaigns in the 1950s and 1960s: (a, c, e) Hilty (1956); (g) Fristrup (1963) and from the approximate locations in 2017 (b, d, f, h). Notethe fact that the amber part covers a larger fraction of the cliff face in 2017 than in the 1950s and 1960s.
Table 1. Overview of the data used in this study including the acquisition date, image resolution, the DEMs’ resolution and wherever performed, the co-registrationresults
Resolution image Resolution DEM Co-registration shift x Co-registration shift y Co-registration shift zSource Year m m m m m
DEM 1956 1956 5.0DEM 1965 1965 5.0AeroDEM 1985 2.0 25.0 −6.9 2.2 3.0ArcticDEM 2012 0.4 1.0 −2.3 3.5 3.5Pléiades 2017 0.5 4.0UAV 2017 0.02 0.05GPR 2017 – 10.0ESA surface velocity 2018 500
570 Jakob Abermann and others
Downloaded from https://www.cambridge.org/core. 13 Nov 2021 at 14:57:36, subject to the Cambridge Core terms of use.

For deriving front position and thickness change from theremote-sensing sources after 1985, a 2-D co-registration proced-ure following Nuth and Kääb (2011) was performed and the1985 and the 2012 DEM aligned to the Pléiades DEM of 2017.The Pléiades DEM is of high quality and derived using theAMES stereo pipeline (Shean and others, 2016). The value ofthis high-resolution imagery has earlier been shown in detail inglaciological studies (Berthier and others, 2014; Prinz and others,2018). The horizontal shift introduced by the co-registration ofthe 1985 and 2012 DEMs, respectively, is shown in Table 1 andamounts to <7 m in one direction. In order to derive thicknesschanges, we apply a vertical correction to both the AeroDEMand the ArcticDEM. This was done by calculating the mean dif-ference with the Pléiades DEM at bare ground south of the clifffront for each profile of the survey line. This difference wasused to bias-correct the 1985 and 2012 DEMs. Deviations
remained below 3.5 m (Table 1). For the DEM-derived meanthickness changes at the cliff top, we used the co-registered andbias-corrected top of the ice cliffs at locations not impacted bythe advance of the cliff front (on average at 735 m a.s.l.) and com-puted the average thickness change over profiles 6–15 across thesurvey line. In order to discuss spatial gradients between theNIC and the GrIS we apply the same co-registration correctionsto the entire DEM.
Cliff thickness as well as the thickness of the amber ice part for1956 were derived by digitising Fig. 26 in Goldthwait (1960). Wecompare this with the thickness of the cliff from the PléiadesDEM and determine the thickness of the amber part in 2017from the UAV-derived orthophoto which was acquired for thecliff front.
The UAV-based image data were processed using the commer-cial software Agisoft Photoscan Professional (v. 1.2.3 2735) basedon the structure-from-motion principles. General steps of theprocessing were: (1) computation of the sparse point cloud inorder to find the relative camera position and orientation foreach photo, (2) location of markers in the individual images toset up the coordinate system and refine alignment optimisation,(3) bundle adjustment and camera calibration, (4) creation of adense point cloud and computation of the DEM by rasterisationof the dense point cloud which eventually led to a (5) georefer-enced orthophoto of the front of the cliff for which the heightof the amber part relative to the cliff bottom could be determined.Since we take both cliff position and thickness changes relative to2017 from the Pléiades DEM, we use the UAV-based DEM merelyfor quantification of the thickness of the amber part of the cliff,which is why the co-registration with the other remote-sensingproducts is not necessary.
During the 2017 field campaign, GPR data were acquired insitu with a Malå GPR and a 100MHz rough terrain antennaacquiring grid lines of ∼30 km in total. We use Reflex softwarein order to derive the ice thickness across the profiles and inter-polate the results to a 10 m grid. We estimate an overall accuracyof 10 m, including a positional error.
Long-term homogenised meteorological data exist from TABsince 1947. An access to air temperature data was obtainedfrom Cappelen and others (2018). For precipitation, we used bias-corrected and homogenised data from Wong and others (2015). Abias-correction was applied for the missing recent years (Balesand others, 2009) for which the raw data were provided byJ. Cappelen (personal communication).
Fig. 3. (a) RMSE, (b) R2 and (c) the orthorectified Figure 2 from Goldthwait (1971)overlaid over the Pléiades orthoimage with the determined survey line (white dots)and the perpendicular profiles (red). The two best-fitting reconstructions of the loca-tion of base stake 1 of the survey line from 1956 are denoted by A and B.
Fig. 4. The relative elevation of the survey line as given in Table B1 in Goldthwait(1971) with 100 referring to the elevation of stake 1 as the datum and the two best-fitting options A and B (both R2 > 0.99 and RMSE < 0.5 m) derived from the PléiadesDEM.
Journal of Glaciology 571
Downloaded from https://www.cambridge.org/core. 13 Nov 2021 at 14:57:36, subject to the Cambridge Core terms of use.

Results
Figure 5 shows the surface morphology changes of profiles 5–15from 1955 to 2017. It is apparent that cliff position changesalong the profiles are stronger at the eastern side (higher profilenumbers) than at the western side (lower profile numbers) ofthe cliff front. While profiles 5–8 for instance show a very stablecliff position during the six decades studied, stronger changesoccur from profile 10 upwards. Results show that the minoradvance between 1955 and 1965 already described byGoldthwait (1971) continued and increased in magnitude until1985, whereafter all profiles (except for profile 5) show a retreatuntil 2012. Between 2012 and 2017, a minor advance at the east-ern part of the survey line occurred. Profiles with flatter bedrock,with an overdeepening behind the cliff front and with larger icethicknesses closer to the lake level reveal both higher advanceand retreat rates. In terms of thickness changes distinct and con-tinuous thinning has taken place between 1955 and 1965. Profiles5–9 (Fig. 5) show only a very slight additional thinning until 1985.Thereafter through 2012 and until 2017 the thinning continued atall profile lines. Overall, at profiles 5–13 a net retreat of the cliffposition occurred between 1955 and 2017 while profiles 14 and15 remained at the same position as they were six decades ago.
Figure 6 gives a frontal representation of the cliff height com-paring 1956 and 2017 on the basis of Goldthwait (1960, 1971), thePléiades DEM for cliff height and the UAV orthoimage for theheight of amber ice in 2017, respectively. Amber ice refers tothe distinct darker band of debris near the bottom of the cliff.While the comparison of the cliff height for both points in timeshows the general thinning, it is striking that both absolute and
relative thickness of the amber part have increased significantly.While in 1956 the amber part was on the order of 5 m and inall profiles below 10 m, we notice a thickening to between 15and 20 m in 2017. This is independently confirmed by photo-graphic evidence (Fig. 2).
In order to facilitate comparison, in the following we averageover profiles 5–15 and derive the rates of change for both thick-ness and front position changes (Table 2, Fig. 7a). While the per-iods 1955–1985 and 2012–2017 show a general average advance,the period 1985–2012 shows a significant retreat. The largest aver-age advance rates occurred in the most recent period 2012–2017
Fig. 5. Profiles 5–15 of the RR ice cliff front as shown inFigure 3c. The cliff position of 1985 is taken from theorthoimage, hence the elevation is set to 30 m arbitrar-ily and should only indicate the location, not the height.For profiles 5–9 in the upper part of the profile, the qual-ity flag of the DEM is high enough in order to interpretcliff morphology. Five time-steps between 1955 and2017 of the surface are shown. In addition, the mea-sured bedrock (BR GPR) as well as the interpolatedstretches (BR interp) and the elevation of the lakelevel are shown.
Fig. 6. Ice cliff height above bottom and the height of amber ice for 1956 (Goldthwait,1960) and 2017 (Pléiades DEM; UAV survey).
572 Jakob Abermann and others
Downloaded from https://www.cambridge.org/core. 13 Nov 2021 at 14:57:36, subject to the Cambridge Core terms of use.
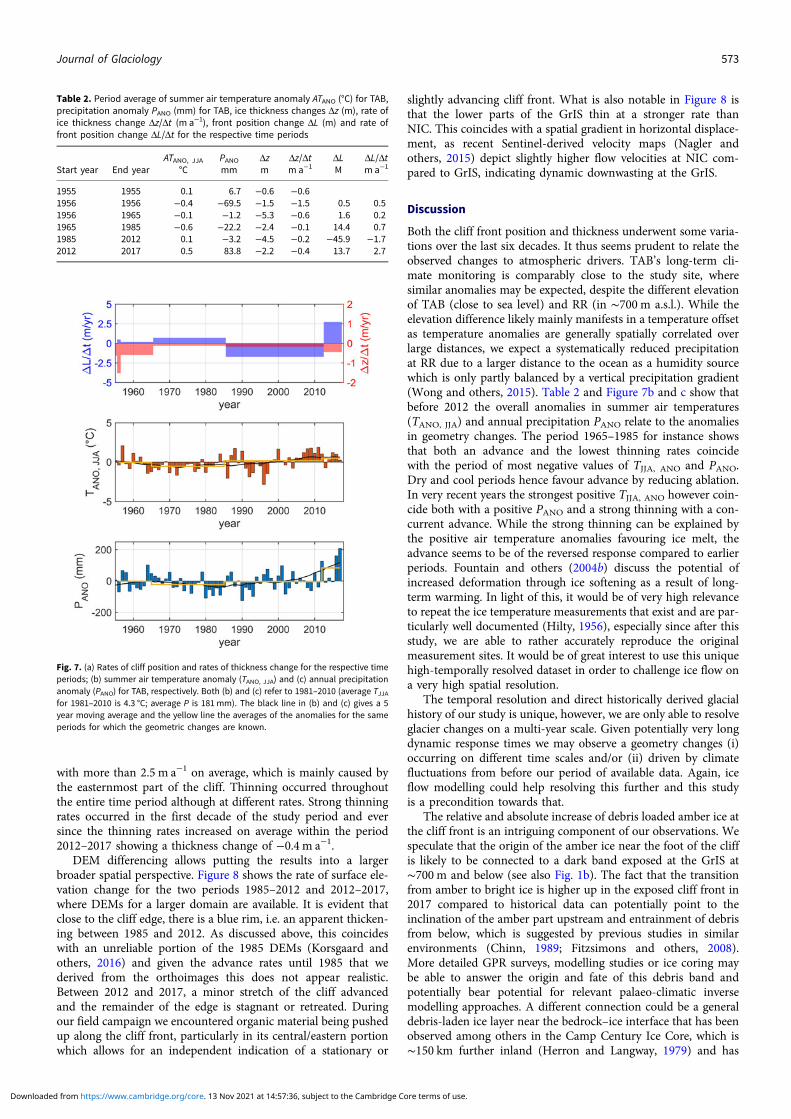
with more than 2.5 m a−1 on average, which is mainly caused bythe easternmost part of the cliff. Thinning occurred throughoutthe entire time period although at different rates. Strong thinningrates occurred in the first decade of the study period and eversince the thinning rates increased on average within the period2012–2017 showing a thickness change of −0.4 m a−1.
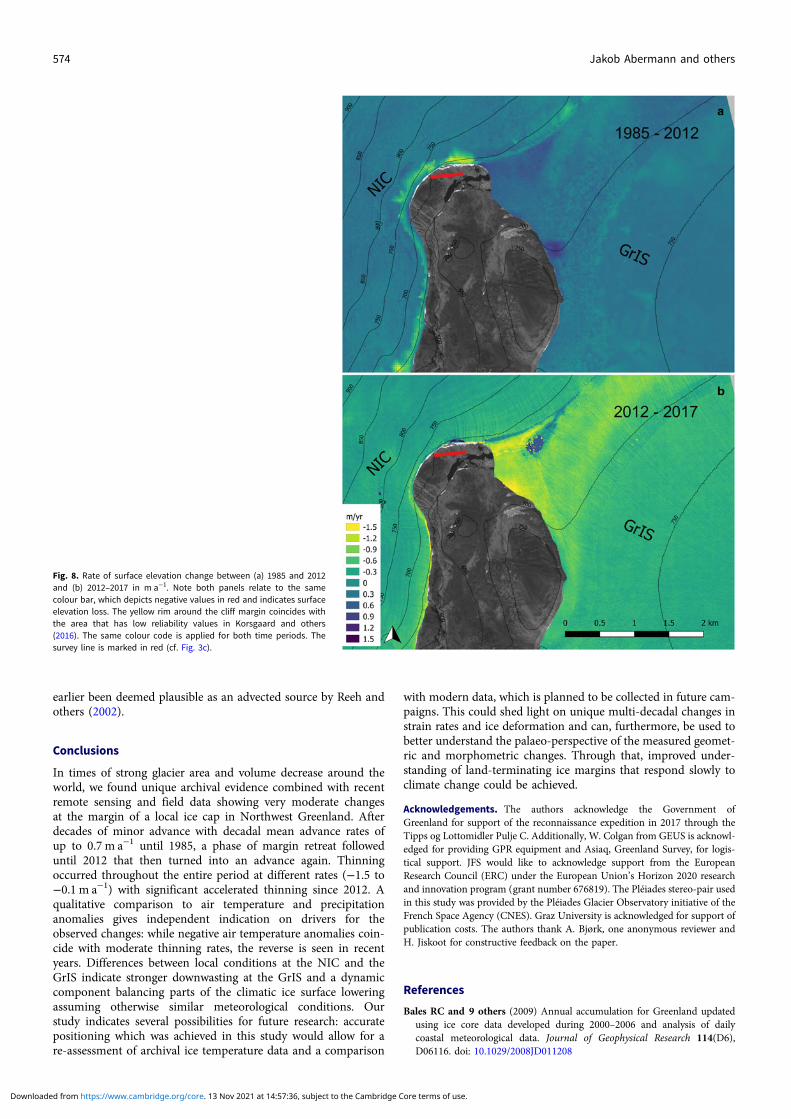
DEM differencing allows putting the results into a largerbroader spatial perspective. Figure 8 shows the rate of surface ele-vation change for the two periods 1985–2012 and 2012–2017,where DEMs for a larger domain are available. It is evident thatclose to the cliff edge, there is a blue rim, i.e. an apparent thicken-ing between 1985 and 2012. As discussed above, this coincideswith an unreliable portion of the 1985 DEMs (Korsgaard andothers, 2016) and given the advance rates until 1985 that wederived from the orthoimages this does not appear realistic.Between 2012 and 2017, a minor stretch of the cliff advancedand the remainder of the edge is stagnant or retreated. Duringour field campaign we encountered organic material being pushedup along the cliff front, particularly in its central/eastern portionwhich allows for an independent indication of a stationary or
slightly advancing cliff front. What is also notable in Figure 8 isthat the lower parts of the GrIS thin at a stronger rate thanNIC. This coincides with a spatial gradient in horizontal displace-ment, as recent Sentinel-derived velocity maps (Nagler andothers, 2015) depict slightly higher flow velocities at NIC com-pared to GrIS, indicating dynamic downwasting at the GrIS.
Discussion
Both the cliff front position and thickness underwent some varia-tions over the last six decades. It thus seems prudent to relate theobserved changes to atmospheric drivers. TAB’s long-term cli-mate monitoring is comparably close to the study site, wheresimilar anomalies may be expected, despite the different elevationof TAB (close to sea level) and RR (in ∼700 m a.s.l.). While theelevation difference likely mainly manifests in a temperature offsetas temperature anomalies are generally spatially correlated overlarge distances, we expect a systematically reduced precipitationat RR due to a larger distance to the ocean as a humidity sourcewhich is only partly balanced by a vertical precipitation gradient(Wong and others, 2015). Table 2 and Figure 7b and c show thatbefore 2012 the overall anomalies in summer air temperatures(TANO, JJA) and annual precipitation PANO relate to the anomaliesin geometry changes. The period 1965–1985 for instance showsthat both an advance and the lowest thinning rates coincidewith the period of most negative values of TJJA, ANO and PANO.Dry and cool periods hence favour advance by reducing ablation.In very recent years the strongest positive TJJA, ANO however coin-cide both with a positive PANO and a strong thinning with a con-current advance. While the strong thinning can be explained bythe positive air temperature anomalies favouring ice melt, theadvance seems to be of the reversed response compared to earlierperiods. Fountain and others (2004b) discuss the potential ofincreased deformation through ice softening as a result of long-term warming. In light of this, it would be of very high relevanceto repeat the ice temperature measurements that exist and are par-ticularly well documented (Hilty, 1956), especially since after thisstudy, we are able to rather accurately reproduce the originalmeasurement sites. It would be of great interest to use this uniquehigh-temporally resolved dataset in order to challenge ice flow ona very high spatial resolution.
The temporal resolution and direct historically derived glacialhistory of our study is unique, however, we are only able to resolveglacier changes on a multi-year scale. Given potentially very longdynamic response times we may observe a geometry changes (i)occurring on different time scales and/or (ii) driven by climatefluctuations from before our period of available data. Again, iceflow modelling could help resolving this further and this studyis a precondition towards that.
The relative and absolute increase of debris loaded amber ice atthe cliff front is an intriguing component of our observations. Wespeculate that the origin of the amber ice near the foot of the cliffis likely to be connected to a dark band exposed at the GrIS at∼700 m and below (see also Fig. 1b). The fact that the transitionfrom amber to bright ice is higher up in the exposed cliff front in2017 compared to historical data can potentially point to theinclination of the amber part upstream and entrainment of debrisfrom below, which is suggested by previous studies in similarenvironments (Chinn, 1989; Fitzsimons and others, 2008).More detailed GPR surveys, modelling studies or ice coring maybe able to answer the origin and fate of this debris band andpotentially bear potential for relevant palaeo-climatic inversemodelling approaches. A different connection could be a generaldebris-laden ice layer near the bedrock–ice interface that has beenobserved among others in the Camp Century Ice Core, which is∼150 km further inland (Herron and Langway, 1979) and has
Table 2. Period average of summer air temperature anomaly ATANO (°C) for TAB,precipitation anomaly PANO (mm) for TAB, ice thickness changes Δz (m), rate ofice thickness change Δz/Δt (m a−1), front position change ΔL (m) and rate offront position change ΔL/Δt for the respective time periods
ATANO, JJA PANO Δz Δz/Δt ΔL ΔL/ΔtStart year End year °C mm m m a−1 M m a−1
1955 1955 0.1 6.7 −0.6 −0.61956 1956 −0.4 −69.5 −1.5 −1.5 0.5 0.51956 1965 −0.1 −1.2 −5.3 −0.6 1.6 0.21965 1985 −0.6 −22.2 −2.4 −0.1 14.4 0.71985 2012 0.1 −3.2 −4.5 −0.2 −45.9 −1.72012 2017 0.5 83.8 −2.2 −0.4 13.7 2.7
Fig. 7. (a) Rates of cliff position and rates of thickness change for the respective timeperiods; (b) summer air temperature anomaly (TANO, JJA) and (c) annual precipitationanomaly (PANO) for TAB, respectively. Both (b) and (c) refer to 1981–2010 (average TJJAfor 1981–2010 is 4.3 °C; average P is 181 mm). The black line in (b) and (c) gives a 5year moving average and the yellow line the averages of the anomalies for the sameperiods for which the geometric changes are known.
Journal of Glaciology 573
Downloaded from https://www.cambridge.org/core. 13 Nov 2021 at 14:57:36, subject to the Cambridge Core terms of use.
earlier been deemed plausible as an advected source by Reeh andothers (2002).
Conclusions
In times of strong glacier area and volume decrease around theworld, we found unique archival evidence combined with recentremote sensing and field data showing very moderate changesat the margin of a local ice cap in Northwest Greenland. Afterdecades of minor advance with decadal mean advance rates ofup to 0.7 m a−1 until 1985, a phase of margin retreat followeduntil 2012 that then turned into an advance again. Thinningoccurred throughout the entire period at different rates (−1.5 to−0.1 m a−1) with significant accelerated thinning since 2012. Aqualitative comparison to air temperature and precipitationanomalies gives independent indication on drivers for theobserved changes: while negative air temperature anomalies coin-cide with moderate thinning rates, the reverse is seen in recentyears. Differences between local conditions at the NIC and theGrIS indicate stronger downwasting at the GrIS and a dynamiccomponent balancing parts of the climatic ice surface loweringassuming otherwise similar meteorological conditions. Ourstudy indicates several possibilities for future research: accuratepositioning which was achieved in this study would allow for are-assessment of archival ice temperature data and a comparison
with modern data, which is planned to be collected in future cam-paigns. This could shed light on unique multi-decadal changes instrain rates and ice deformation and can, furthermore, be used tobetter understand the palaeo-perspective of the measured geomet-ric and morphometric changes. Through that, improved under-standing of land-terminating ice margins that respond slowly toclimate change could be achieved.
Acknowledgements. The authors acknowledge the Government ofGreenland for support of the reconnaissance expedition in 2017 through theTipps og Lottomidler Pulje C. Additionally, W. Colgan from GEUS is acknowl-edged for providing GPR equipment and Asiaq, Greenland Survey, for logis-tical support. JFS would like to acknowledge support from the EuropeanResearch Council (ERC) under the European Union’s Horizon 2020 researchand innovation program (grant number 676819). The Pléiades stereo-pair usedin this study was provided by the Pléiades Glacier Observatory initiative of theFrench Space Agency (CNES). Graz University is acknowledged for support ofpublication costs. The authors thank A. Bjørk, one anonymous reviewer andH. Jiskoot for constructive feedback on the paper.
References
Bales RC and 9 others (2009) Annual accumulation for Greenland updatedusing ice core data developed during 2000–2006 and analysis of dailycoastal meteorological data. Journal of Geophysical Research 114(D6),D06116. doi: 10.1029/2008JD011208
Fig. 8. Rate of surface elevation change between (a) 1985 and 2012and (b) 2012–2017 in m a−1. Note both panels relate to the samecolour bar, which depicts negative values in red and indicates surfaceelevation loss. The yellow rim around the cliff margin coincides withthe area that has low reliability values in Korsgaard and others(2016). The same colour code is applied for both time periods. Thesurvey line is marked in red (cf. Fig. 3c).
574 Jakob Abermann and others
Downloaded from https://www.cambridge.org/core. 13 Nov 2021 at 14:57:36, subject to the Cambridge Core terms of use.
Berthier E and 10 others (2014) Glacier topography and elevation changesderived from Pléiades sub-meter stereo images. The Cryosphere 8(6),2275–2291. doi: 10.5194/tc-8-2275-2014
Bjørk AA, Kruse LM and Michaelsen PB (2015) Brief communication: gettingGreenland’s glaciers right – a new data set of all official Greenlandic glaciernames. The Cryosphere 9(6), 2215–2218. doi: 10.5194/tc-9-2215-2015
Bolch T and 6 others (2013) Mass loss of Greenland’s glaciers and ice caps2003–2008 revealed from ICESat laser altimetry data. GeophysicalResearch Letters 40(5), 875–881. doi: 10.1002/grl.50270
Box JE and 6 others (2018) Global sea-level contribution from Arctic land ice:1971–2017. Environmental Research Letters 13(12). doi: 10.1088/1748-9326/aaf2ed
Cappelen J, Vinther BM, Kern-hansen C, Vaarby E and Viskum P (2018)Greenland – DMI Historical Climate Data Collection 1784–2017, TR18-04. Copenhagen, Denmark.
Carrivick JL, Yde JC, Knudsen NT and Kronborg C (2018) Ice-dammed lakeand ice-margin evolution during the Holocene in the Kangerlussuaq area ofwest Greenland. Arctic Antarctic and Alpine Research 50(1). doi: 10.1080/15230430.2017.1420854
Chinn TJH (1989) Single folds at the margins of dry-based glaciers as indica-tors of a glacial advance. Annals of Glaciology 12, 23–30.
Citterio M and Ahlstrøm AP (2013) Brief communication the aerophoto-grammetric map of Greenland ice masses. The Cryosphere 7(2), 445–449.doi: 10.5194/tc-7-445-2013
Colgan W and 5 others (2016) The abandoned ice sheet base at CampCentury, Greenland, in a warming climate. Geophysical Research Letters43, 8091–8096. doi: 10.1002/2016GL069688
Davies WE and Krinsley DB (1962) The recent regimen of the ice cap marginin North Greenland. Proceedings of the International Association ofHydrological Sciences 58, 119–130.
Davison BJ, Sole AJ, Livingstone SJ, Cowton TR and Nienow PW (2019)The influence of hydrology on the dynamics of land-terminating sectorsof the Greenland ice sheet. Frontiers in Earth Science 7, 10. doi: 10.3389/feart.2019.00010
Dawes PR and van As D (2010) An advancing glacier in a recessive ice regime:Berlingske Bræ, North-West Greenland. Geological Survey of Denmark andGreenland Bulletin 20, 79–82.
Evans D (1989) Apron entrainment at the margins of sub-polar glaciers,North-West Ellesmere Island, Canadian High Arctic. Journal ofGlaciology 35, 317–324.
Farnsworth LB and 7 others (2018) Holocene history of the Greenland ice-sheet margin in Northern Nunatarssuaq, Northwest Greenland. Arktos 4(1), 10. doi: 10.1007/s41063-018-0044-0
Felikson D and 11 others (2017) Inland thinning on the Greenland ice sheetcontrolled by outlet glacier geometry. Nature Geoscience 10(5), 366–369.doi: 10.1038/ngeo2934
Fitzsimons S and 5 others (2008) Mechanisms of basal ice formation in polarglaciers: an evaluation of the apron entrainment model. Journal ofGeophysical Research 113(F2), F02010. doi: 10.1029/2006JF000698
Fitzsimons SJ and Colhoun EA (1995) Form, structure and stability of themargin of the Antarctic ice sheet, Vestfold Hills and Bunger Hills, EastAntarctica. Antarctic Science 7(2), 171–179. doi: 10.1017/S095410209500023X
Fountain AG, Neumann TA, Glenn PL and Chinn T (2004a) Can climatewarming induce glacier advance in Taylor Valley, Antarctica? Journal ofGlaciology 50(171), 556–564.
Fountain AG, Neumann TA, Glenn PL and Chinn T (2004b) Can warminginduce advances of polar glaciers, Taylor Valley, Antarctica. Journal ofGlaciology 50(171), 556–564.
Fristrup B (1963) Inlandsisen. Copenhagen: Rhodos.Goldthwait RP (1956) Study of Ice Cliff Nunatarssuaq, Greenland. SIPRE
Annual Report 11. Columbus (Ohio).Goldthwait RP (1960) Study of Ice Cliff in Nunatarssuaq, Greenland. CRREL
Technical Report 39. Hanover (New Hampshire).Goldthwait RP (1961) Regimen of an ice cliff on land in Northwest
Greenland. Folia Geografica Danica 9, 107–115.Goldthwait RP (1971) Restudy of Red Rock Ice Cliff Nunatarssuaq,
Greenland. CRREL Technical Report 224. Hanover (New Hampshire).Herron S and Langway CC (1979) The debris-laden ice at the bottom of the
Greenland ice sheet. Journal of Glaciology 23(89), 193–207. doi: 10.1017/S002214300002983X
Hilty R (1956) Glaciological Study of an Ice Cliff in Northwest Greenland (MSThesis). Ohio State University.
Hooke RL (1970) Morphology of the ice-sheet margin near Thule,Greenland. Journal of Glaciology 9(57), 303–324. doi: 10.3189/S0022143000022851
Howat IM and Eddy A (2011) Multi-decadal retreat of Greenland’s marine-terminating glaciers. Journal of Glaciology 57(203), 389–396. doi: 10.3189/002214311796905631
Huss M and Hock R (2015) A new model for global glacier change andsea-level rise. Frontiers in Earth Science 3, 1–22. doi: 10.3389/feart.2015.00054
Jacob T, Wahr J, Pfeffer WT and Swenson S (2012) Recent contributions ofglaciers and ice caps to sea level rise. Nature 482(7386), 514–518. doi: 10.1038/nature10847
Jury HL (1957) An application of terrestrial photogrammetry to glaciologyin Greenland. Photogrammetric Engineering and Remote Sensing 23,543–550.
Kjeldsen KK and 14 others (2015) Spatial and temporal distribution of massloss from the Greenland ice sheet since AD 1900. Nature 528, 396–400. doi:10.1038/nature16183
Knutz PC and 6 others (2019) Eleven phases of Greenland ice sheetshelf-edge advance over the past 2.7 million years. Nature Geoscience 12,361–368. doi: 10.1038/s41561–019-0340-8.
Korsgaard NJ and 6 others (2016) Data descriptor: digital elevation modeland orthophotographs of Greenland based on aerial photographs from1978–1987. Scientific Data 3, 1–15. doi: 10.1038/sdata.2016.32
Koziol CP and Arnold N (2018) Modelling seasonal meltwater forcing of thevelocity of land-terminating margins of the Greenland ice sheet. TheCryosphere 12(3), 971–991. doi: 10.5194/tc-12-971-2018
Landauer J (1958) Some preliminary observations on the plasticity ofGreenland Glaciers. Journal of Glaciology 3(26), 468–474.
Larsen NK and 7 others (2018) Instability of the Northeast Greenland icestream over the last 45,000 years. Nature Communications 9(1), 3–10. doi:10.1038/s41467-018-04312-7
Leclercq PW and 5 others (2012) Brief communication: Historical glacierlength changes in West Greenland. The Cryosphere 6, 1339–1343. doi: 10.5194/tc-6-1339-2012
Lesnek AJ and Briner JP (2018) Response of a land-terminating sector of thewestern Greenland ice sheet to early Holocene climate change: evidencefrom 10Be dating in the Søndre Isortoq region. Quaternary ScienceReview 180, 145–156. doi: 10.1016/j.quascirev.2017.11.028
Machguth H and 8 others (2013) The future sea-level rise contribution ofGreenland’s glaciers and ice caps. Environonmental Research Letters 8(2),025005. doi: 10.1088/1748-9326/8/2/025005
Meredith M and 13 others (2019) Polar regions. In Pörtner H.-O and 12others eds. IPCC Special Report on the Ocean and Cryosphere in aChanging Climate. In press.
Nagler T, Rott H, Hetzenecker M, Wuite J and Potin P (2015) TheSentinel-1 mission: new opportunities for ice sheet observations. RemoteSensing 7, 9371–9389. doi: doi:10.3390/rs70709371
Nielsen H and Nielsen KH (2016) Camp century — cold war city underthe ice. In Doel RE Harper KE and Heymann M eds. Exploring Greenland:Cold War Science and Technology on Ice. New York: Palgrave Macmillan,pp. 195–216.
Nobles LH (1960) Glaciological investigations, Nunatarssuaq ice ramp,Northwestern Greenland. CRREL Technical Report 66.
Nobles LH (1964) Investigations of structure and movement on the steep ice rampnear Red Rock Lake Nunatarssuaq, Greenland. CRREL Technical Report 43.
Nuth C and Kääb A (2011) Co-registration and bias corrections of satelliteelevation data sets for quantifying glacier thickness change. TheCryosphere 5, 271–290. doi: 10.5194/tc-5-271-2011
Osterberg EC and 5 others (2015) Coastal ice-core record of recent northwestGreenland temperature and sea-ice concentration. Journal of Glaciology 61(230), 1137–1146. doi: 10.3189/2015JoG15J054
Prinz R, Heller A, Ladner M, Nicholson LI and Kaser G (2018) Mapping theloss of Mt. Kenya’s glaciers: an example of the challenges of satellitemonitoring of very small glaciers. Geosciences 8(5), 1–14. doi: 10.3390/geosciences8050174
Pritchard HD, Arthern RJ, Vaughan DG and Edwards L (2009) Extensivedynamic thinning on the margins of the Greenland and Antarctic ice sheets.Nature 461(7266), 971–975. doi: 10.1038/nature08471
Rastner P and 5 others (2012) The first complete inventory of the localglaciers and ice caps on Greenland. The Cryosphere 6(6), 1483–1495. doi:10.5194/tc-6-1483-2012
Journal of Glaciology 575
Downloaded from https://www.cambridge.org/core. 13 Nov 2021 at 14:57:36, subject to the Cambridge Core terms of use.

Reeh N, Oerter H, Letréguilly A, Miller H and Hubberten HW (1991) Anew, detailed ice-age oxygen-18 record from the ice-sheet margin in centralWest Greenland. Global and Planetary Change 4(4), 373–383. doi: 10.1016/0921-8181(91)90003-F
Reeh N, Oerter H and Thomsen HH (2002) Comparison between Greenlandice-margin and ice-core oxygen-18 records. Annals of Glaciology 35, 136–144. doi: 10.3189/172756402781817365
Shean DE and 6 others (2016) An automated, open-source pipeline formass production of digital elevation models (DEMs) from very-high-resolution commercial stereo satellite imagery. ISPRS Journal ofPhotogrammetry and Remote Sensing 116, 101–117. doi: 10.1016/j.isprsjprs.2016.03.012
Sole A, Payne T, Bamber J, Nienow P and Krabill W (2008) Testing hypoth-eses of the cause of peripheral thinning of the Greenland ice sheet: island-terminating ice thinning at anomalously high rates? The Cryosphere2, 205–218. doi: 10.5194/tc-2-205-2008
Swanger KM, Lamp JL, Winckler G, Schaefer JM and Marchant DR (2017)Glacier advance during marine isotope stage 11 in the McMurdo dry valleysof Antarctica. Scientific Reports 7, 1–9. doi: 10.1038/srep41433
Tedstone AJ and 5 others (2015) Decadal slowdown of a land-terminatingsector of the Greenland ice sheet despite warming. Nature 526(7575),692–695. doi: 10.1038/nature15722
Weidick A (1968) Observations on some Holocene glacier fluctuations inWest Greenland. Meddelelser om Grønland 165(6), 202.
White S (1958) Preliminary studies of motion of an ice cliff Nunatarssuaq,Northwest Greenland 1955. IAHS Symposium de Chamonix, 64–71.
Wong GJ and 5 others (2015) Coast-to-interior gradient in recent northwestGreenland precipitation trends (1952–2012). Environmental ResearchLetters 10(11), 114008. doi: 10.1088/1748-9326/10/11/114008
Zemp M and 12 others (2019) Global glacier mass changes and their contri-butions to sea-level rise from 1961 to 2016. Nature 568, 382–386. doi: 10.1038/s41586-019-1071-0
576 Jakob Abermann and others
Downloaded from https://www.cambridge.org/core. 13 Nov 2021 at 14:57:36, subject to the Cambridge Core terms of use.