journal of great lakes research - ciglr.seas.umich.edu · tions including the federal governments...
TRANSCRIPT

Journal of Great Lakes Research 41 (2015) 584–596
Contents lists available at ScienceDirect
Journal of Great Lakes Research
j ourna l homepage: www.e lsev ie r .com/ locate / jg l r
A spatial classification and database for management, research, andpolicy making: The Great Lakes aquatic habitat framework
Lizhu Wang a,⁎, Catherine M. Riseng b, Lacey A. Mason b, Kevin E. Wehrly c, Edward S. Rutherford d,James E. McKenna Jr. e, Chris Castiglione f, Lucinda B. Johnson g, Dana M. Infante h, Scott Sowa i,Mike Robertson j, Jeff Schaeffer k, Mary Khoury l, John Gaiot j, Tom Hollenhorst m,Colin Brooks n, Mark Coscarelli o
a International Joint Commission, Great Lakes Office, P.O. Box 32869, Detroit, MI 48232, United Statesb School of Natural Resources and Environment, University of Michigan, 440 Church St., Ann Arbor, MI 48109-1041, United Statesc Institute for Fisheries Research, Michigan Department of Natural Resources and University of Michigan, 1109 N. University, Ann Arbor, MI 48109, United Statesd Great Lakes Environmental Research Laboratory, 4840 S State Road, Ann Arbor, MI, United Statese USGS Great Lakes Science Center, 3075 Gracie Road, Cortland, NY 13045, United Statesf U.S. Fish and Wildlife Service, Lower Great Lakes Fish and Wildlife Conservation Office, 1101 Casey Road, Basom, NY 14013, United Statesg Natural Resources Research Institute, University of Minnesota, Duluth, 5013 Miller Trunk Highway, Duluth, MN 55811, United Statesh Department of Fisheries and Wildlife, Michigan State University, 480 Wilson Road, East Lansing, MI 48824, United Statesi The Nature Conservancy, 101 E Grand River Ave., Lansing, MI 48906, United Statesj Ontario Ministry of Natural Resources and Forestry, 300 Water St., Peterborough, ON K9J 8M5, Canadak USGS Great Lakes Science Center, 1451 Green Rd, Ann Arbor, MI 48105, United Statesl The Nature Conservancy, 8 South Michigan Ave., Chicago, IL 60603, United Statesm U.S. EPA — Mid-Continent Ecology Division, 6201 Congdon Boulevard, Duluth, MN 55804, United Statesn Michigan Tech Research Institute, 3600 Green Ct., Suite 100, Ann Arbor, MI 48105, United Stateso Great Lakes Fishery Trust, 230 N. Washington Square, Suite 300, Lansing, MI 48933, United States
⁎ Corresponding author. Tel.: +1 519 562 4980.E-mail address: [email protected] (L. Wang).
http://dx.doi.org/10.1016/j.jglr.2015.03.0170380-1330/Published by Elsevier B.V. on behalf of Interna
a b s t r a c t
a r t i c l e i n f oArticle history:Received 4 August 2014Accepted 11 March 2015Available online 22 April 2015
Communicated by Craig Stow
Index words:DatabaseHierarchySpatial unitFrameworkClassificationGreat Lakes
Managing the world's largest and most complex freshwater ecosystem, the Laurentian Great Lakes, requires aspatially hierarchical basin-wide database of ecological and socioeconomic information that is comparable acrossthe region. To meet such a need, we developed a spatial classification framework and database — Great LakesAquatic Habitat Framework (GLAHF). GLAHF consists of catchments, coastal terrestrial, coastal margin, near-shore, and offshore zones that encompass the entire Great Lakes Basin. The catchments captured in the databaseas river pour points or coastline segments are attributed with data known to influence physicochemical andbiological characteristics of the lakes from the catchments. The coastal terrestrial zone consists of 30-m gridcells attributedwith data from the terrestrial region that has direct connectionwith the lakes. The coastal marginand nearshore zones consist of 30-m grid cells attributed with data describing the coastline conditions, coastalhuman disturbances, and moderately to highly variable physicochemical and biological characteristics. The off-shore zone consists of 1.8-km grid cells attributed with data that are spatially less variable compared with theother aquatic zones. These spatial classification zones and their associated data are nested within lake sub-basins and political boundaries and allow the synthesis of information from grid cells to classification zones,within and among political boundaries, lake sub-basins, Great Lakes, or within the entire Great Lakes Basin.This spatially structured database could help the development of basin-wide management plans, prioritize loca-tions for funding and specific management actions, track protection and restoration progress, and conductresearch for science-based decision making.
Published by Elsevier B.V. on behalf of International Association for Great Lakes Research.
Introduction
The Laurentian Great Lakes comprise the largest freshwater ecosys-tem in the world. Their immense surface area (about 246,000 km2) and
tional Association for Great Lakes Re
water volume (about 23,000 km3) support diverse physical, chemical,and biological components that exhibit complex ecosystem functionsand processes (USEPA and Government of Canada, 1995; Wehrlyet al., 2013). The Great Lakes drainage basin (about 765,000 km2)spans a large geographic extent that encompasses a diversity of climaticconditions, soils and vegetation types, streams, inland lakes, wetlands,and wildlife. The Great Lakes waters exhibit diverse habitats from
search.
585L. Wang et al. / Journal of Great Lakes Research 41 (2015) 584–596
shallow water in bays/estuaries in Western Lake Erie to deep waters ofLake Superior, freshwater spawning reefs, extensive length of coast-lines, and complex physical processes such as circulation and upwellingpatterns. The Great Lakes and their drainage basin provide water andother natural resources for urban, industry, agriculture, transportation,fisheries, and other recreational needs formore than 33.5million peoplein the basin (U.S. Census Bureau, 2000; Statistics Canada, 2002).
Managing such a large and complex ecosystem is challenging. Man-agement authority of theGreat Lakes is spread acrossmultiple organiza-tions including the federal governments of the U.S. and Canada, eightU.S. states, two Canadian provinces, and many local entities. Currentmanagement efforts are hampered by the lack of consistent informationthat can be shared and easily accessed by federal, state, and local orga-nizations (Wehrly et al., 2013). The development of a basin-wide data-base of comparable ecological and socioeconomic data informationacross the region is, therefore, highly desirable. A consistent databasecould be used to develop basin-widemanagement plans, prioritize loca-tions for funding and specific management actions, and to conduct re-search for science-based decision making. In addition, managers andpolicy makers are faced with the challenge of making management de-cisions atmultiple spatial scales from an individual beach to a particularlake sub-basin, and from a specific lake to the entire Great Lakes Basin(McKenna and Castiglione, 2010a,b). Consequently, there is a need toorganize information in a hierarchical spatial framework that allowsmanagers and policy makers to apply information and make decisionsat a variety of spatial scales.
The need for consistently managed and spatially comprehensiveGreat Lakes data and information has long been recognized andmany ef-forts and resources have been invested in data collection and synthesis,database development, information delivery, habitat classification, andmapping. For example, the Great Lakes National Program Office(GLNPO) has coordinated with Environment Canada and the Provinceof Ontario, and the U.S. Great Lakes states to collect physical, chemical,and biological data from open waters of the Great Lakes since the1960s and to manage those and other sampled environmental data inthe Great Lakes Environmental Database (GLENDA) since 2003 (http://www.epa.gov/glnpo/monitoring/data_proj/glenda/). The Great LakesObserving System (GLOS) provides access to near real-time and archivedobservations and modeled forecasts for water levels, wave heights, airand water temperatures, and other lake conditions (http://glos.us/).The Great Lakes Environmental Assessment andMapping (GLTranslatedby Susanne and Hans Ulrich RollEAM) project synthesized basin-widecoarse level anthropogenic data and assessed theGreat Lakes health con-ditions (Allan et al., 2013; http://greatlakesmapping.org/). Great LakesEnvironmental Indicator (GLEI; Niemi et al., 2007) and the Great LakesWetlands Consortium (GLWC) projects have developed environmentalindicator data and assessed condition of much of the Great Lakes coastalwetlands (Niemi et al., 2007). Several efforts also have been devoted tothe development of Great Lakes habitat and ecological classification sys-tems (Johnson et al., submitted for publication; Rutherford and Geddes,2007; McKenna and Castiglione, 2010a,b).
These efforts have met many critical information needs and helpedanswer management questions that could not be answered otherwise.However, each of these efforts had specific objectives and focused on par-ticular aspects of informationneeds related to those objectives. For exam-ple, most Great Lakes data collection programs (e.g., offshore focusedGLNPO, coastal focusedGLEI) have collected physicochemical and biolog-ical point data at selected locations. Extrapolation of those data or infer-ences made from those data to unsampled areas is difficult due to thelack of spatial linkage (how a spatial unit connects to, and is influencedby other spatial units) and a common spatial framework. Extrapolationof information from sampled data to unsampled areas is important be-cause scientists and managers lack the time or resources to sample allareas of the Great Lakes ecosystem. Many of the existing databases anddata delivery systems serve as data downloading sources for geographicinformation system (GIS) data layers that are either available for one
side of the U.S.–Canadian border or available for both sides but lackdata consistency (e.g., the Institute for Fisheries Research's Great LakesGIS [http://ifrgis.snre.umich.edu/projects/GLGIS/] and the Great LakesCommission's Information Network [http://www.great-lakes.net/]).Other existing databases and data delivery systems serve as data portalsfor locally synthesizeddata to provide links to otherweb-baseddatabasesand information (e.g., GLOS). These portals may be limited by databasesources that are discontinued, out of date, or haven't been linked by acommon spatial framework. Few of the databases mentioned above pro-vide the ability to scale spatial data as management needs dictate. Al-though those efforts serve well for their specific purposes, they do notsatisfy the increasing need for a Great Lakes basin-wide integrated data-base and information systemwith amechanism that allows spatial infor-mation linkage and hierarchical stratification.
The need for Great Lakes basin-wide information integration andspatial linkages has been widely recognized. The Protocol of GreatLakes Water Quality Agreement (GLWQA) of 2012 identified a needfor an integrated approach tomanaging information to achieve adaptivemanagement objectives for nearshore health improvement, nonpointsource pollution reduction from urban and agricultural sources, aquaticinvasive control and prevention, species and habitat restoration andprotection, nutrient load and concentration reduction, and climatechange prediction and adaptation (GLWQA, 2012). Emerging issues,such as record low water levels for Lakes Huron and Michigan in De-cember 2012 and January 2013 (Clites et al., 2014), the dramatic chang-es in offshore productivity and food web composition likely related toaquatic invasive species in lakes Huron andMichigan during the last de-cade (Fahnenstiel et al., 2010; Cha et al., 2011; Barbiero et al., 2012;Bunnell et al., 2013), the extraordinarily high nuisance algal blooms inLake Erie during 2011 (Michalak et al., 2013), and the Lake Erie algaltoxins that resulted in more than 400,000 people without tap waterfor two days in 2014 (http://ecowatch.com/2014/08/03/toxic-algae-bloom-500000-without-drinking-water-ohio/), require basin-wideand lake-wide binational strategies and management actions.
To address these ongoing and emerging challenges, both Canadianand U.S. governments need a spatial framework and database that pro-vides basin-wide information on the location, characterization, status,and quantity of Great Lakes physical, chemical, biological, and humanecosystem components (e.g., GLWQA 2012 Annex 2 — Lakewide Man-agement Plans and Annex 10 — Science). Ideally a basin-wide spatialframework and database would: (1) incorporate an integrated, objec-tive standard for basin-wide and lake-wide condition comparison;(2) provide access to key available data and spatial information to deci-sionmakers to enable rapid identification of high priority, cost-effectivelocations for protection, enhancement, and rehabilitation; and (3) pro-vide a spatial framework for reporting that allows the priority activitiesand progress of multiple government agencies to be synthesized,assessed, and reported at regional and basin-wide scales. Such a spatialframework and database is the foundation for the most efficient alloca-tion of resources and management actions by binational governmentagencies (Riseng et al., 2008; Wang et al., 2011).
In 2010, a research team was formed to address the need for GreatLakes basin-wide information integration and spatial linkages. Theteam was composed of Great Lakes researchers and managers with ex-tensive experience in collecting and synthesizing Great Lakes regionaldata, conducting regional assessments, or developing basin-wide habi-tat classifications. The goal of this team was to develop an operational,integrated basin-wide database and a hierarchical spatial classificationframework with basic spatial mapping units for the entire Great LakesBasin and their associated catchments in both Canada and U.S. Theresulting geospatial classification framework and database, the GreatLakes Aquatic Habitat Framework (GLAHF), has a common spatialframework attributed with sampled, calculated, and modeled data anda flexible nested structure that enables aggregation of data into largerunits characterized by specific criteria or constraint. This hierarchicalstructure allows data to be synthesized, utilized, and reported at any

586 L. Wang et al. / Journal of Great Lakes Research 41 (2015) 584–596
required spatial scales. The GLAHF database includes key availablebasin-wide data that describe natural and anthropogenically modifiedvariation in catchments, coastal, nearshore, and offshore conditions.
The objectives of this paper are to (1) describe the spatial classificationframework, hierarchical spatial database structure, data types andsources, and the processes used to attribute such data into the database;(2) report briefly on the Great Lakes aquatic habitat resources and theirpatterns in natural variation and levels of human disturbances at differentspatial scales; and (3) discuss the utility of the spatial framework and as-sociated database.
Methods
Development of hierarchical spatial database structure and classificationframework
Spatial database structureThe database structure of GLAHF was developed with input from
managers and policymakers fromGreat Lakes states/provinces, Canadi-an and U.S. federal management and research agencies, and non-governmental organizations. This binational database development pro-cess was intended to ensure that state-of-the-art knowledge and tech-niques were used, and the spatial framework was acceptable anduseful for multiple users and uses. The database structure is a hierarchi-cal network of grid cells across the Great Lakes aquatic and coastal areaswith attributed physicochemical and biological georeferenced data. The
Fig. 1. Data attribution spatial structure consists of catchments, 30-m grid cells in coa
GLAHF database incorporates five types of target spatial zones includingriver pour points that summarized their associated catchments vari-ables, coastal terrestrial, coastalmargin, nearshore, and offshore regions.
The spatial structure of GLAHF consists of 30 × 30 m grid cells in thecoastal terrestrial and aquatic regions (depth b 30 m) and 1.8 × 1.8 kmgrid cells in the offshore (depth N 30 m) region (Fig. 1). Each pourpoint consists of multiple 30 × 30 m cells (wider river mouths havemore cells) in the coastal margin zone where a tributary connects withthe coastalmargin. The smaller cell size in the coastal regionswas chosento provide datawith relatively high resolution formeasuring the variableconditions and to be consistent with the size of relevant spatial data inthe coastal terrestrial area (e.g., land use, digital elevations). The largercell size in the offshore region was chosen to provide the data resolutionfor measuring the relatively less variable conditions in the offshore wa-ters and for reducing database size and data processing time. Each 30-m or 1.8-km cell has a unique spatial identifier that locates the cell with-in a lake, a lake sub-basin, and management or political boundary units.The data attributed to each 30-m or 1.8-km cell are linked to the uniquecell identifier in the GLAHF relational database structure. This spatialstructure provides the mechanism for data attributed to each cell to beaggregated, synthesized, analyzed, scaled up or down, and reported atvarious spatial scales depending on research and management needs.
River pour point and catchment connection with the Great LakesAn important component of GLAHF is the incorporation of influences
from terrestrial catchments to the coastal and offshore regions of the
stal terrestrial and coastal aquatic zones, and 1.8-km grid cells in offshore zones.

587L. Wang et al. / Journal of Great Lakes Research 41 (2015) 584–596
Great Lakes. Catchment influences on the Great Lakes are quantified atlake–river connection pour points or coastline segments and furthertransferred into the coastal and offshore lake regions.
A river pour point is the downstream end of the downstream-mostreach of a river network at the coastal region of the Great Lakes. Riverpour points were identified for river reaches flowing directly into theGreat Lakes. The majority of these river reaches have cumulative catch-ment areas greater than or equal to an 8-digit Hydrologic Unit Code(HUCs, one of the six nested spatial scales of hydrological units used bythe U.S.), but small catchments that drain directly into the Great Lakesalso occur. We identified consistent basin-wide tributary catchmentboundaries using the most current hydrography datasets developed bythe U.S. and Canada and a documented repeatable methodology(Danielle et al., submitted for publication) modified from Hollenhorstet al. (2007). For U.S. tributaries, we used the 1:100,000 National Hy-drography Database Plus Version 2 (NHD + V2) developed by the U.S.Geological Survey and the U.S. Environmental Protection Agency (NHDPlus V2, 2012) that includes attributed data of physical, chemical, biolog-ical, and anthropogenic characteristics for Great Lakes tributaries. For Ca-nadian tributaries, we used the Ontario Integrated Hydrology Dataset(OIHD), hydrologically-enforced flow direction grids (OMNR, 2013) todevelop a synthetic stream network and catchments and to generate astream reach, local catchment, and aggregated catchment dataset thathas a similar spatial structure to the NHD + V2 (Hollenhorst et al.,2007; Danielle et al., submitted for publication).
A coastline segment is identified as a shoreline length bordered byinterfluve catchmentswith drainage areas that are between catchmentsof two river pour points along the Great Lakes coastline. Interfluvecatchmentswhichdrain local landscapes could have no streamdrainagenetwork connections to the shoreline. Data and information from suchinterfluve catchments were attributed to their corresponding coastlinecells, and the connection between the interfluve catchments and theGreat Lakes is through coastline segments rather than river pour points.
Spatial classification frameworkOur spatial classification framework identifies a hierarchy system
with zones that have similar environmental characteristics based on afew dominant processes that shape the physicochemical and biological
Fig. 2. Great Lakes spatial classification framework. The sub-basin here refers to lake sub-basinscells into ecological units and classifying such units into ecological types (indicated by dashed-
characteristics in the Great Lakes: tributary inflows, high-energy littoralprocesses, circulation patterns, and thermal stratification. These zonesintegrate previously established, ecosystem process defined areas ofthe Great Lakes (Rutherford and Geddes, 2007; Johnson et al.,submitted for publication; LEHTG, 2012).
We defined the largest three levels of GLAHF spatial classification hi-erarchy as the entire Great Lakes Basin, individual lakes, and lake sub-basins within a lake (Fig. 2). These three spatial scales also includetheir corresponding catchments and connecting channels (Fig. 3). Wedelineated four lake sub-basins within each of the lakes Erie, Ontario,and Superior, and five lake sub-basins for each of the lakes Michiganand Huron, including Lake St. Clair and the St. Mary River, St. ClairRiver, Detroit River, and Niagara River connecting channels (Fig. 3).These sub-basins were manually delineated based on physical and bio-logical processes of dominant spring and summer circulation patterns,bathymetric features, and characteristic biological communities. Thesub-basin delineation also considered existing sub-basin boundaries(McKenna and Castiglione, 2010a,b; Johnson et al., submitted forpublication) and incorporated reviews from Great Lakes region scien-tists (personal communication of Drs. J. Kelly and P. Yurista, USEPAMid-Continent Ecology Division, Duluth MN, and E. Reavie, Natural Re-sources Research Institute, Duluth MN; July 2013).
Our next level of spatial delineation divided each lake sub-basin intozones: coastal terrestrial, coastal margin, nearshore, and offshore. Thecoastal terrestrial zone begins at the lake shoreline and extends land-ward for 5 km (Fig. 1). We defined the lake shoreline as the ordinaryhigh water mark elevation, or the terrestrial edge of hydrologically con-nected coastal wetlands (Gronewold et al., 2013). The coastal marginzone is defined as lake areas with water depth between 0 and 3 m forall lakes, and the nearshore zone was defined as lake areas with waterdepth between 3 and 15 m for Lake Erie and 3 and 30 m for the otherfour lakes. The offshore zone is defined as the lake areas with waterdepths greater than 15 m for Lake Erie and greater than 30 m for theother four lakes.
These spatial classification zoneswere empirically derived by the re-search team through consideration of a combination of physical vari-ables (circulation patterns, thermocline depths, water depth, waveenergy, and water levels) and incorporation of knowledge from other
and their associated catchments. The single upward arrows illustrate the merging of gridline boxes), which is in progress and not addressed in this paper.

Fig. 3.Great Lakes lake sub-basins and their associated catchments.WSU—Western Lake Superior; CSU— Central Lake Superior; ESU— Eastern Lake Superior;WB—Whitefish Bay; SMR—
St.Marys River; NCGeB—North Channel andGeorgian Bay;NHU—Northern LakeHuron; EHU— Eastern Lake Huron; CHU— Central Lake Huron; SB— SaginawBay;NMI—Northern LakeMichigan; NCMI— North Central Lake Michigan; CMI— Central Lake Michigan; SMI— Southern Lake Michigan; GrB— Green Bay; LSC— Lake St. Clair; WER—Western Lake Erie; CER—
Central Lake Erie, EER — Eastern Lake Erie; NR — Niagara River; WON — Western Lake Ontario; CON — Central Lake Ontario; and EON — Eastern Lake Ontario.
588 L. Wang et al. / Journal of Great Lakes Research 41 (2015) 584–596
studies on Great Lakes habitat classifications that considered similargeophysical variables as drivers for structuring aquatic habitat(Rutherford and Geddes, 2007; McKenna and Castiglione, 2010a,b;LEHTG, 2012). Because the factors determining aquatic habitat are acombination of lake geomorphology and physicochemical processesthat occur in transition across multiple spatial scales, we used waterdepth as a surrogate factor to capture the variability in geomorphicand physicochemical components across a lake (Barton and Schelske,1982; Yurista et al., 2006; Howell et al., 2012). The coastal marginzone, bounded by the 0–3 m isobaths, is the area where water interactswith the shoreline and reflects wave and seiche energetics and tributaryinfluencesmost strongly (Johnson et al., submitted for publication). Thiscoastal margin captures embayments, coastal wetlands, rivermouths,and erosional habitats that have been frequently targeted for biologicalsampling to better understand the importance of coastal ecosystems inlife histories of invertebrates, fish, and birds of the Great Lakes region(Jude and Pappas, 1992;Wei et al., 2004). The nearshore zone, boundedby 3–30 m (or 15 m) isobaths, captures the water quality gradient be-tween coastal margin and offshore waters resulting from physical pro-cesses such as lake wide circulation patterns, geomorphology,tributary inputs, and alongshore currents that can be consistently delin-eated around the 30-m isobath (Yurista et al., 2006; Rao and Schwab,2007). The nearshore zone is also historically the area of the photiczone and is generally not thermally stratified. The offshore zone beyondthe 30 m (or 15 m) isobath includes the waters that are influenced bythermal stratification and limited light penetration into deep water.
Data attribution
The GLAHF database is an extensive dataset of over 300 variables or-ganized in a hierarchical folder structure by variable categories such as
landscape, climate, physicochemical, and biological data, includingtheir lengthy temporal coverage (Electronic Supplementary Material(ESM) Table S1; also available at http://ifrgis.snre.umich.edu/projects/GLAHF/). GLAHF data exist in spatial (raster and vector) and tabular for-mats and are stored in ESRI geodatabases and Microsoft Access data-bases. These data cover minimally a lake sub-basin and are from manysources. Because the data attributed to GLAHF are largely from govern-ment and academic research and monitoring programs, we incorporat-ed the metadata and QA/QC source information into the GLAHFmetadata. We used this source information to validate the QA/QC pro-cess and uncertainty associated with the data to guide our errorchecking as data were processed. Because GLAHF attributes only sum-marized data (not raw data), we developed GLAHF metadata followingFederal GeographicData Committee standards and include source refer-ences, data-processing and summarization methods, and constraintsand uncertainties. Here we briefly summarize methods used to stan-dardize, integrate, and attribute those data into the spatial framework.
River pour point, coastline segment, and coastal terrestrial zonedata attribution
We attributed vector and raster data from various sources that areavailable for the Great Lakes catchments to the tributary pour points,coastline segments, and coastal terrestrial zone (ESM Table S1). Forcatchments, we summarized and attributed upstream catchment dataof Great Lakes tributaries to the pour points or interfluve catchmentsto coastline segments. Vector data (e.g., surficial geology; shoreline geo-morphology)were summedby length or area using themaximumcom-bined area method that assigned a grid cell with the value that coversthe most area. Raster data (e.g., land use, including inland lakes) weresummed by area for each data category using the averaging methodthat assigned the average value from the source data to the grid cells.

589L. Wang et al. / Journal of Great Lakes Research 41 (2015) 584–596
Some variables were derived from multiple sources with various tem-poral and spatial resolutions and thus were cross-walked to arrive atconsistent classes across the basin. For example, land use/cover datawere available from the 2001 U.S. National Landcover Database(NLCD) with 8 level-I classes and 16 nested level-II classes, and fromthe 2000 Provincial Landcover Ontario (PLO) dataset with 28 classes.These land cover classes were reclassified into 12 common categoriesand mosaicked to create a seamless basin-wide dataset.
A series of available data were attributed to the tributary pourpoints, coastline segments, and coastal terrestrial zone grid cells asproportion (e.g., land use), average (e.g., population density), ortotal amount (e.g., road length). These data included surficial andbedrock geology types, soil types, land use/cover types, impervious-ness, farm animal density (Agricultural Census, ESM Table S1),human population density, length of road, wastewater treatmentplants, and 20-year means of air temperature and precipitation(ESM Table S1). The catchment size and slope, total river length,number of dams per river length, and percentage of groundwatercontribution were calculated by pour points or coastline segments.The lengths of rivers accessible from the Great Lakes were calculatedfrom pour points upstream along the NHD + V2 or OIHD to the firstbarrier. The barriers were included in the National AnthropogenicBarrier Dataset for the U.S. and the Dams and Barriers layer for On-tario (USACE and OMNR; ESM Table S1). The coastline segmentswere also attributed with number of boating docks and marinas,shipping ports, and shoreline development index values.
Coastal margin, nearshore, and offshore zones data attributionData attributed to the coastal margin, nearshore, and offshore zone
grid cells include modeled water thermal, wave, and movement vari-ables; mapped depth, substrate, and wetland variables sampled chemi-cal and biological variables; and occurrence of aquatic nuisance speciesand shipping traffic variables (ESM Table S1). Data were available invector, raster, and point format. Raster data were summarized using re-sampling methods and vector data using maximum combined areamethods similar to the catchment data described above. Point datawere attributed to a grid cell by geographic location.
Vertical water temperature, circulation, and wave data were avail-able from existing models (NOAA GLCFS; USACE WIS) (see ESMTable S1) for all aquatic areas of the Great Lakes at fine temporal resolu-tion (hourly or daily records). These data required intensive data pro-cessing to be summarized at spatial and temporal resolutions usefulfor characterizing trends. Temporal data with hourly or daily recordswere summarized across daily or monthly time-steps from 1990sthrough the most recent period available (ESM Table S1) to providemeasures of seasonal and annual variation. Monthly average verticalwater temperatures and circulation were modeled every three hoursfor 20 or 21 vertical levels (Beletsky et al., 2006; Schwab et al., 2009,NOAA's Great Lakes Coastal Forecasting System, ESM Table S1). Wesummarized the temperature data for three vertical depth classes of0–20 m, 20–40 m, and N40 m to represent the average conditions ofthe epilimnion, metalimnion, and hypolimnion strata within the GreatLakes (Cline et al., 2013). We also calculated mean cumulative degree-days by summarizing average daily water temperatures for the 0–20 m water column for all days that were above 0 °C from January 1through December 31 for 2006–2012. The circulation data were aver-aged monthly and seasonally across all depth bins for magnitude(m/s) and direction (degrees). A binary termdescribing the seasonal av-eraged on/offshore direction was derived by comparing the circulationdirection angle to the generalized shoreline angle in a clockwise patternaround each lake. The mean and maximum wave height and periodwere calculated monthly and seasonally from the modeled data of U.S.Army Corps of Engineers (USACE) and Wave Information Studies andbuoy data of Environment Canada (for Lake St. Clair hourly from 2000to 2012). The USACE modeled hourly waves for 1950 locations aroundthe shoreline of the Great Lakes from 1979 to 2012.
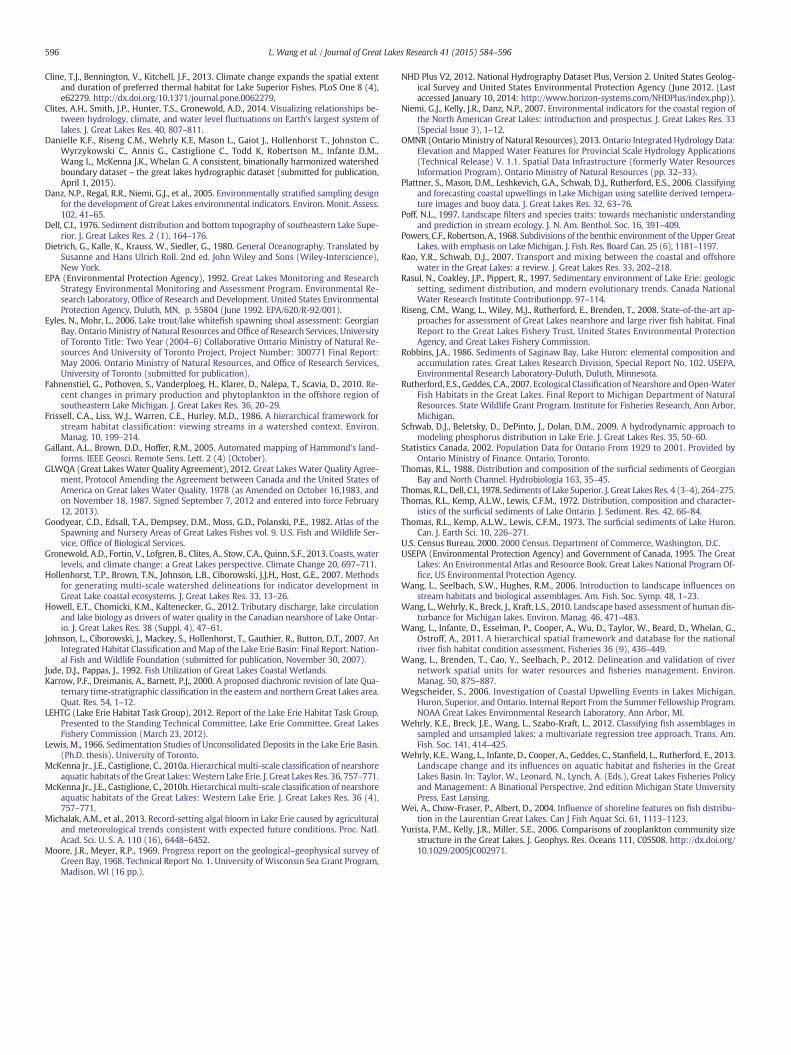
Averaged monthly estimates of surface water temperature wereobtained from remote sensing estimated daily data (NOAA GreatLakes CoastWatch, http://coastwatch.glerl.noaa.gov/) from 1994 to2013. From these surface water data we calculated two thermal met-rics relevant to Great Lakes biota: upwelling and spring rate ofwarming. We calculated daily areas of upwelling where surface tem-peratures are lower than a threshold value from the same data. Thethreshold value was calculated by taking themedian surface temper-ature minus 4 °C as a constant (Plattner et al., 2006; Wegscheider,2006). We then summarized these daily values annually from 1994to 2013 as an upwelling index for each of the coastal aquatic and off-shore grid cells (Fig. 4). We generated an index of spring warming toidentify areas of potentially higher spring and early summer produc-tivity (Fig. 4). This index is the difference between June 1 and March1 surface water temperatures (NOAA CoastWatch data from 1995 to2012) divided by the number of days during that period to estimatethe averaged change in temperature per day and was calculated foreach grid cell.
Themappeddepth, substrate, andwetland variableswere also avail-able for all areas of the three aquatic zones at a relatively coarse spatialresolution and required substantial data acquisition and assembling.Water depth was derived from NOAA's topobathymetry and bathymet-ric grids with 90-m horizontal resolution (ESM Table S1). Geologicallandforms of lake bottom were derived for the Great Lakes sub-aqueous terrain features by incorporating relief and depth into an inte-grated measure of bottom topology (Gallant et al., 2005; Fig. 4). Sub-strate compositions were aggregated from various publications(Lewis, 1966; Powers and Robertson, 1968; Moore and Meyer, 1969;Thomas et al., 1972, 1973; Bertrand et al., 1976; Dell, 1976; Thomasand Dell, 1978; Robbins, 1986; Thomas, 1988; Rasul et al., 1997;Boase, 2003; Eyles and Mohr, submitted for publication; LEHTG,2012). Substrate data included the dominant substrate type and per-centage of each substrate type. Substrate types were cross-walkedacross the five lakes into six substrate types (clay, silt, sand, mud,hard, rock) although the original substrate types for each lake weremaintained in the database because studies reported different levelsof substrate specificity among lakes. Fish spawning habitats were sum-marized from a variety of sources that were generated by examiningcatch records of spawning females, and from survey data on adultspawners, eggs, or larvae locations (Goodyear et al., 1982; also P.Chow Fraser and E. Rutherford, unpublished data). Coastal wetlanddata were obtained from the Great Lakes Coastal Wetland Consortium(Albert et al., 2005).
Chemical and biological data were included for areas wherebasin-wide sampling occurred and were available. The integrationof these data into our database required significant processing effortsdue to sampling method differences. The nitrogen and phosphorusconcentrations, organic toxic contaminants, heavy metal concentra-tions, and compositions of phytoplankton, zooplankton, and benthicmacroinvertebrate assemblages were obtained from the Great LakesEnvironmental Database and Environment Canada sources. Fish spe-cies occurrences were obtained from the U.S. Geological SurveyGreat Lakes Science Center, Ohio Department of Natural Resources,and Ontario Ministry of Natural Resources.
Occurrence data for aquatic nuisance species were obtained fromNOAA's Great Lakes Aquatic Nonindigenous Species Information Sys-tem. The shipping and vessel traffic data were from the U.S. CoastGuard and made available through Marine Cadastre for 2009–2011(ESM Table S1). The U.S. Coast Guard requires commercial and privateships of 30+ gross tons and passenger ships and tankers of 150+gross tons to use the automatic identification system to locate the ves-sels during their voyage in U.S. waters and records the information ona one minute time step. These locations were then compiled into buff-ered shipping paths to represent the dominant shipping lanes in theGreat Lakes. ESM Table S1 provides more details on data sources andvariable types.

Fig. 4.Mean (2006–2012) upwelling (a), geoform class (b), mean (2008–2012) chlorophyll-a concentrations (c), andmean (2008–2012) spring rate of warming (d). The geoform classesare calculated by classifying the combinations of lake bathymetry depth and lake bottom relief into 24 geoform classes labeled using standard marine classes (Dietrich et al., 1980).
590 L. Wang et al. / Journal of Great Lakes Research 41 (2015) 584–596
Results
Spatial classification framework and associated database
The resulting product of the binational research team is the GLAHFclassification framework and database. The classification frameworkconsists of catchments, coastal terrestrial zone, coastal margin zone,nearshore zone, and offshore zone from each lake ecosystem's outer-most boundary toward the center of the lake. The catchments capturedin the database as river pour points or coastline segmentswere attribut-ed with available data and information that are known to influence thelakes; the coastal terrestrial zonewas attributedwith data from the ter-restrial region that have direct impacts on lakes; the coastal marginzone was attributed with data about coastline conditions, coastalhuman disturbances, and highly variable physicochemical and biologi-cal characteristics; the nearshore zone was attributed with physico-chemical and biological data that are moderately variable; and theoffshore zone was attributed with data that are relatively spatially lessvariable compared with the other water zones.
These five spatial classification zones are further linked or nestedwithin lake sub-basins and political boundaries, such as state/provincialor management boundaries. The hierarchical structure of the databaseand spatial classification allows information to be synthesized followingecological hierarchy from grid cells to classification zones, a lake sub-basin, a lake, and all thefive Great Lakes (Fig. 5). It also allows informationto be synthesized following a political boundary hierarchy from grid cellsto classification zones, a management unit, a state or province, multiplestates/province, and the boundary between U.S. and Canada (Fig. 5).
The database contains over 300 variables (ESM Table S1) with hun-dreds of thousands of data records. The data sources include direct
website downloading, data acquired from partners (e.g., Rutherfordand Geddes, 2007; McKenna and Castiglione, 2010a,b), and personalcontacts with government agencies, research institutions, nongovern-ment organizations, and individual data holders. GLAHF database con-sists of three types of data in addition to its hierarchical spatial unitboundaries. The first type of data is GIS layers, such as land cover/useand bathometry,which are data largely generated by government agen-cies or government funded projects and are available for all spatialunits. The second type of data is model predicted data, such as dailywater temperature and water current, which are projections by re-searchers based on relationship among sampled data and predictorsand are largely available for all spatial units. The third type of data ismonitored or sampled data, which is generally available only for somespatial locations even if they are sampled to represent an entire lakeor a lake sub-basin.
Great Lakes aquatic resource distribution patterns
Below we summarize several key factors using both political andecological boundaries from the attributed data to describe general pat-terns. The intent of this description is to illustrate how informationcan be summarized and used at different spatial scales, rather than toexhaustively synthesize the characteristics of the Great Lakes usingthe many physicochemical and biological factors in our database.Although some information has been reported sporadically in the scien-tific literatures or government reports, integrating all relevant impor-tant information in one place provides a holistic view of spatialpatterns and driving forces that control the characteristics of the GreatLakes ecosystem.

Fig. 5. Great Lakes information synthesis and reporting spatial hierarchy system. The information can be summarized, analyzed, and reported from the grid cells up to the entire GreatLakes Basin and any spatial scales in between. Conversely, the information reported at the Great Lakes Basin scale can be analyzed down to individual grid cells and any spatial scalesin between.
591L. Wang et al. / Journal of Great Lakes Research 41 (2015) 584–596
Lake characteristics by political boundariesTheU.S. has greater Great Lakes surfacewater area (64%), coastal wet-
land area (71%), offshore area (68%), and developed shoreline length(82%) than Canada (Table 1). Canada has more shoreline length thanU.S. (67% vs 33%), primarily due to the sinuous shoreline of the north
side of Lake Huron (North Channel and Georgian Bay; 1:24,000 scale).The coastline lengths reported here are greater than previously published(Gronewold et al., 2013) because the GLAHF coastline was developedfrom finer resolution hydrography data (NHD + V2c 2012, OMNR2013) and included connecting channels andmajor estuaries (EPA, 1992).

Table 1Selected Great Lakes ecosystem characteristics summarized by U.S. states and Ontario of Canada.
IL IN MI MN NY OH PA WI ON Total US%
Lake characteristicsGreat Lakes surface water area (km2) 4080 606 100,035 6621 10,495 9233 1955 24,291 88,713 246,028 64Coastal terrestrial region area (km2) 356 462 21,214 1497 3922 2169 424 4959 27,786 62,789 56Coastal aquatic region area (km2) 1500 606 25,378 835 3180 9233 1535 6529 36,532 85,328 57Coastal wetland area (km2) 12 3 1110 1 115 75 4 194 576 2090 72Offshore region area (km2) 2580 0 74,806 5786 7346 0 419 17,762 52,127 160,827 68Length of shoreline (km) 150 104 6321 397 1128 748 149 1520 20,919 31,436 33Length of beach (km) 40 31 2347 17 203 142 37 319 2171 5307 59Length of developed shoreline (km) 83 55 501 46 120 182 20 205 267 1480 82
Catchment characteristicsTotal catchment area (km2) 260 9067 150,297 15,912 38,491 30,164 1571 44,457 236,893 527,112 55Total length of rivers (km) 100 k 82 5610 88,674 9494 32,989 28,587 1276 27,872 164,150 358,733 54Catchment — agriculture (km2) 3 5379 39,415 420 13,893 19,210 519 14,881 46,466 140,187 67Catchment — urban (km2) 211 1790 16,362 636 3311 5179 246 3794 5902 37,431 84Catchment — forest (km2) 14 872 55,879 9543 16,245 4327 716 15,507 144,573 247,675 42Catchment — wetland (km2) 18 720 28,650 5750 3447 693 5775 8460 6291 54,087 88Catchment — grassland & herbaceous (km2) 3 157 5615 56 304 453 24 267 9255 16,134 43Catchment — water (km2) 10 148 3472 644 1208 278 4 1509 22,934 30,208 24Population (1000 persons) 696 1329 9883 219 3468 4016 243 2799 11,168 33,822 67Number of wastewater treatment plants 0 55 370 22 199 274 12 183 351 1466 76Highway length (km) 2961 32,050 329,370 20,873 89,042 110,239 5131 91,055 158,522 839,243 81
592 L. Wang et al. / Journal of Great Lakes Research 41 (2015) 584–596
Among the states and province, Michigan (41%) and Ontario (36%)have the highest percentages of surface water area compared with theother states (Wisconsin ~10%, remaining states b5%). Michigan (52%,47%, 20%) and Ontario (29%, 32%, 67%) also have the most coastal wet-lands, offshore water areas, and shoreline length. Although Michiganand Ontario have the highest length of developed shoreline of theGreat Lakes, Illinois (55%), Indiana (52%), and Ohio (24%) have thehighest percentage of developed shoreline relative to their state or pro-vincial shoreline length.
Catchment characteristics by political boundariesThe U.S. has slightly more catchment areas (55%) and river lengths
(54%) than Canada (Table 1). Michigan has more catchment areas andtributary lengths (29%, 25%) than does New York (7%, 9%), Wisconsin(8%, 8%), or Ohio (6%, 8%). In contrast, Indiana, Illinois, Minnesota, andPennsylvania together have less than 5% of total catchment areas or trib-utary lengths of the Great Lakes.
The U.S. hasmore agricultural (67%) and urban (84%) lands in catch-ments than Canada. The proportion of agricultural land was highest inOntario (33%) and Michigan (28%) catchments. Urban land use washighest in Michigan (44%), followed by Ontario (16%), Ohio (14%),Wis-consin (10%), and New York (9%), and lowest (b5%) in the other states.About 33.8 million people inhabit the Great Lakes ecosystem (Table 1),with 67% in the U.S. and 29% inMichigan. Based on a preliminary survey(Arvai et al., 2014), therewere 1466wastewater treatment plants in theGreat Lakes ecosystem, of which 1115 were in the U.S. and 351 inCanada. In 2010–2011, there were about 839,200 km of highways inthe Great Lakes ecosystem and 81% was in the U.S.
Lake characteristics by lakesSurface area variation represents the major distinguishing charac-
teristics of the Great Lakes. Lakes Superior, Huron, and Michigan ac-count for the majority of the surface area of the Great Lakes (33%, 24%,and 24%) and lakes Erie and Ontario together accounted for less than19% (Table 2). Offshore zone areas are largest in Lake Superior (43%)and smallest in Lake Erie (1%), but the trend is the opposite for coastalmargin and offshore zones (13% vs 30%). Lake Huron has the longest(15,365 km) and Lake Ontario has the shortest (2648 km) shorelines,while Lake Michigan has the longest (1696 km) and Lake Ontario hasthe shortest (352 km) total length of beaches.
Wave and thermal conditions also vary considerably among theGreat Lakes (Table 2). Themeanwave height and duration, summarizedover the growing season when coastal areas are more vulnerable to
wave erosion, was 0.5 m and 3.2 s, respectively for all lakes. LakeHuron had the highest wave height (0.8 m) and longest wave duration(4.0 s), while Lake Erie had the smallest wave height (0.4 m) andshortest wave duration (2.7 s). Lake Superior had the deepest(19.2 m) and Lake Ontario had shallowest (15.0 m) August thermoclinedepth. Similarly, Lake Superior had the lowest (2252 degree-days) andLake Erie had the highest (4028 degree-days) degree-days.
The five Great Lakes experienced different thermal characteristicchanges during the past 18 years (Table 2). The difference in averagegrowing season (May 1–October 31) surface water temperatures be-tween 1995–1999 and 2008–2012 was greatest for lakes Superior(1.6 °C) andOntario (1.3 °C) and least for lakes Huron (1.1 °C) andMich-igan (1.0 °C). The mean spring warming rate (surface water tempera-ture increase from May–June) averaged over 5-year periods (from1995 to 1999 and from 2008 to 2012) increased the most for Lake On-tario (0.4 °C/10 days) and the least for lakes Huron and Michigan(0.2 °C/10 days). However, the relative change in spring warming be-tween these two periods was the most dramatic for Lake Superior(91%) and least for Lake Erie (21%). An index of five-year mean icecover, estimated from sequential days with over 30% coverage, de-creased by 8.2 days from 1995-1999 to 2008-2012 for all the GreatLakes considered together, but declined most for lakes Superior(18.2 days) and least for Lakes Ontario (0.8 days).
Catchment characteristics by lakesThe catchment areas, as proportion of total Great Lakes basin catch-
ment, for lakes Superior (26%), Huron (25%), and Michigan (23%) aremuch larger than that of lakes Erie (14%) and Ontario (12%, Table 2).In contrast, the catchment area per km2 of water surface area for lakesSuperior (1.7), Huron (2.3), and Michigan (2.1) are much smaller thanthose for lakes Erie (2.8) and Ontario (3.3).
The total proportions of agricultural land in catchments are greaterfor lakes Ontario (34%) and Erie (28%) than for lakes Michigan (20%),Huron (17%), and Superior (1%, Table 2). The agricultural land per km2
of water surface area is much greater for lakes Ontario (3.07) and Erie(1.80) than for lakes Michigan (0.61), Huron (0.49), and Superior(0.02). Total proportions of urban land in the catchment are higher forlakes Michigan (32%) and Erie (31%) than for lakes Huron (19%), Ontario(13%), and Superior (5%). The density of urban land area per km2ofwatersurface area is higher for Lake Erie (0.43) than for Lake Superior (0.02).
Among the 359,085 km of tributaries in the Great Lakes Basin, about50% of the length is distributed in the catchments of lakes Huron and Su-perior (each 25%) and the other 50% are in the catchments of the other

Table 2Selected Great lakes ecosystem characteristics summarized at a lake scale.
Great Lakes Erie Huron Michigan Ontario Superior All lakes
Lake characteristicsSurface water area (km2) 27,033 59,699 57,879 19,262 82,139 246,013Coastal terrestrial area (km2) 8543 18,610 12,216 7773 14,948 62,090Coastal aquatic area (km2) 25,317 23,804 18,018 5437 10,971 83,547Coastal wetlands area (km2) 385 717 467 234 278 2081Offshore area (km2) 1934 36,090 39,923 13,595 69,284 160,827Length of shoreline (km) 4372 15,365 2980 2648 5948 31,312Length of beach (km) 532 1507 1696 352 1155 5242Mean depth (m) 19 57 84 87 150 92Maximum depth (m) 63 224 275 245 405 405Area with depth b 3 m (%) 3.7 7.3 1.4 5.3 2.0 3.6Area with depth 3–30 m (%) 87.8 26.2 25.0 19.4 7.6 29.1Area with depth N 30 m (%) 8.5 66.5 73.5 75.3 90.4 54.1Mean June 1–Nov 30 wave height (m) 0.4 0.8 0.5 0.5 0.5 0.5Mean June 1–Nov 30 wave duration (s) 2.7 4.0 3.0 3.4 3.1 3.2Mean August thermocline depth (m) 1996–2010 18.0 17.4 18.3 15.0 19.2 17.6Mean August temperature (°C) at thermocline 1996–2010 15.1 12.7 12.4 13.2 8.9 12.4Mean spring (May–June) rate of warming (°C/day) 1995–2012 0.17 0.09 0.09 0.10 0.05 0.10Mean spring (May–June) rate of warming (°C/day) 1995–1999 0.14 0.07 0.07 0.08 0.02 0.08Mean spring (May–June) rate of warming (°C/day) 2008–2012 0.17 0.09 0.09 0.12 0.05 0.11Mean surface temperature May 1–Oct 31 (°C) 1995–2012 18.4 14.0 15.1 15.6 10.0 14.6Mean surface temperature May 1–Oct 31 (°C) 1995–1999 18.2 13.7 14.8 15.5 9.4 14.3Mean surface temperature May 1–Oct 31 (°C) 2008–2012 19.1 14.8 15.8 16.8 11.0 15.5Mean 0–20 m cumulative degree-days (2008–2012) 4028 3109 3414 3357 2252 3232Mean lake level (m, IGLD85) 1995–2012 174.19 176.20 176.20 74.79 183.25 NAMean lake level (m, IGLD85) 1995–1999 174.41 176.62 176.62 74.81 183.42 NAMean lake level (m, IGLD85) 2008–2012 174.17 176.07 176.07 74.78 183.16 NADays N 30% lake area covered by ice (1995–1999) 45.8 39.4 10.0 1.0 30.4 25.3Days N 30% lake area covered by ice (2008–2012) 43.6 26.8 3.0 0.2 12.2 17.2Substrate clay (%) 8.7 22.1 32.5 18.5 34.8 NASubstrate silt (%) 1.8 0.0 24.2 0.0 0.0 NASubstrate mud (%) 59.6 33.0 3.0 52.8 41.0 NASubstrate sand (%) 26.0 22.5 35.3 4.2 1.2 NASubstrate hard (%) 0.0 22.4 5.0 24.6 15.7 NASubstrate unknown (%) 0.7 0.0 0.0 0.0 7.3 NA
Catchment characteristicsTotal catchment area (km2) 74,843 134,375 120,609 63,305 141,715 534,846Land use — agriculture (km2) 48,693 29,252 35,570 59,155 1529 174,200Land use — urban (km2) 11,528 7139 12,181 4788 1987 37,622Land use — forest (km2) 12,420 74,068 37,165 26,389 98,546 248,589Land use — wetland (km2) 2619 9964 23,186 4867 9851 50,487Land use — grassland (km2) 716 4050 3410 579 7857 16,612Land use — water (km2) 926 10,049 3450 2828 14,476 31,729Number of wastewater treatment plants 532 247 361 247 81 1468Total length of rivers (km) (100 k) 66,363 88,564 61,853 51,875 90,430 359,085Length of river accessible from Great Lakes (km) 30,713 28,502 16,211 11,900 38,189 125,515
Costal terrestrial zone land use and populationCoastal agriculture (%) 49.2 21.4 20.5 48.1 0.0 23.9Coastal urban (%) 25.5 10.1 20.6 18.0 1.9 14.7Coastal forest (%) 15.2 49.5 29.5 23.1 5.6 46.2Coastal wetlands (%) 6.1 11.0 21.4 6.9 81.1 30.5Coastal grassland (%) 0.9 1.9 4.3 2.2 9.7 4.5Coastal water (%) 3.3 6.0 3.6 1.8 1.7 4.8Coastal population (#/km2) 320 26 183 408 19 148.3
Aquatic zone mean (2008–2012) chlorophyll-a (μg/L)Coastal margin zone (0–3 m) 14.7 4.3 4.6 6.0 1.9 6.3Nearshore zone (3–30 m or 3–15 m) 12.4 2.2 1.5 2.4 1.2 3.9Offshore zone (N30 m) 7.6 0.8 0.6 1.2 0.6 2.2
593L. Wang et al. / Journal of Great Lakes Research 41 (2015) 584–596
lakes (each 14–18%, Table 2). About 33% of the tributary lengths have nodams known to substantially block access from Great Lakes to tribu-taries. Lake Superior has the most length of accessible tributaries(30%), followed by lakes Huron (24%), Erie (21%), Michigan (16%), andOntario (9%).
Lake and catchment characteristics by classification zones
Coastal terrestrial zoneAmong the five Great Lakes, lakes Erie and Ontario have the highest
(49% and 48%), while Lake Superior has the lowest percentages of
agricultural land in the coastal terrestrial zone (Table 2). Lake Erie alsohas the highest percentage of urban land (26%), followed by lakes Ontar-io (21%), Michigan (18%), and Superior (5%). In contrast, Lake Ontariohas the highest (164/km2) and Lake Erie has the second highest (101/km2) human population densities, while Lake Huron (8/km2) and Supe-rior (3/km2) have the lowest.
Coastal margin, nearshore, and offshore zonesAlthough many factors in our database can be used to describe the
characteristics of the classification zones, we chose chlorophyll a to in-dicate the difference in primary productivities among those zones.

594 L. Wang et al. / Journal of Great Lakes Research 41 (2015) 584–596
Among the five Great Lakes, Lake Erie coastal margin zone had thehighest (15 μg/L) chlorophyll a concentrations, Lake Ontario coastalmargin had the second highest (6 μg/L), and that of the other threelakes had the lowest (2–5 μg/L) chlorophyll a concentrations(Table 2). Similarly, Lake Erie nearshore zone had much higher chloro-phyll a concentration (12.4 μg/L) than the other lakes (1.2–2.4 μg/L).Lake Erie offshore zone also had much higher chlorophyll a concentra-tion (7.7 μg/L) than the other lakes (0.6–1.2 μg/L). Among the zonesfor all five lakes, the coastal margin zone had the highest, the nearshorezone has the next highest, and the offshore zone had the lowest chloro-phyll a concentrations (Table 2).
Discussion
Value of the hierarchical spatial classification framework
Our hierarchical spatial classification framework helps resolve sev-eral challenges in data and information management and delivery ofthe Great Lakes. First, it provides the basic spatial units for data attribu-tion that facilitates incorporation of data from multiple sources into acommon spatial network, and integrates data across data types, scales,and ecosystem and political boundaries. Each of the five Great Lakes isa large (surface area and volume) and complex ecosystem with differ-ent physicochemical and biological characteristics that naturally varywithin and among lakes. The feature of our framework can potentiallybe used to answer how big an area that a sampling site can represent,how such data can be synthesized to represent larger spatial units,and how the variation within and among lake sub–basins can be prop-erly measured.
Second, it provides a mechanism to quantify connectivity amongspatial units and their positions within the system. This feature is ex-tremely important because the natural physicochemical and biologicalhabitat characteristics of a spatial unit are largely determined by the ba-thymetry, current, waves, geomorphic, and climate conditions at thespatial scales of interest. Those habitat characteristics are also stronglyinfluenced by their connectivity with major system features, such asdistance to and condition/size of river mouths, wetlands, shippingroutes, point pollution sources, and preserved areas. The importanceof connectivity in riverscape ecology has been well established(e.g., Frissell et al., 1986; Poff, 1997; Allan et al., 2004; Wang et al.,2006, 2012) and GLAHF includes multiple measures of connectivity re-lated to Great Lakes habitats and organisms. These features enable eco-logical modeling and forecasting of changes to Great Lakes food websand fisheries resulting from stressors and/or management actions. Theability to forecast changes allows management to move from a reactiveto a more proactive state.
Last, our hierarchical spatial classification framework and databaseprovides amechanism for synthesizingdata and information at local, re-gional, and basin-wide scales, or political jurisdictions. It enables man-agers and researchers to access data summarized for different spatialunits to better understand, conserve, and restore the lake ecosystems.
Uses of the spatial system and database
One of the important uses of our spatial system and database is thatthe data attributed at the smallest spatial units (30-m or 1.8-km grids)can be synthesized into information at multiple ecological, manage-ment, and political units for policy making and management planningand implementation. These units may include a lake sub-basin, a lake,or the entire five-lake ecosystem; lake sections within a specific localconservation area, a planning district, a state or province, or a multi-state/provincial region; or the entire Great Lakes basin in the U.S. andCanada. Such information can meet the needs of local stakeholderswho are interested in only the water quality of their beaches, coastalline protection, drinking water quality, or harbor operations; local gov-ernments and planners who are managing cities or districts; state/
provincial governments who are responsible for a lake area withintheir political boundaries; partnerships who have common interests inprotection and rehabilitation of a particular lake or all the five lakes;and the governments of U.S. and Canada who are responsible forimplementing the GLWQA.
Another important use of our database is to classify the spatial eco-logical units into habitat classes. Classifying spatial units and establish-ing physicochemical and biological expectations are critical for waterresource policy-making, regulation, and scientific hypothesis testing.Presently, such classifications and expectations have been well devel-oped for inland lakes (e.g., Cheruvelil et al., 2008; Wang et al., 2010;Wehrly et al., 2012) and river segments (e.g., Brenden et al., 2008;Wang et al., 2012), but for the Great Lakes it has been developed onlyfor specific resources or uses, such as Quaternary deposits of the GreatLakes (Karrow et al., 2000), coastal wetlands (Albert et al., 2005), fishhabitat (McKenna and Castiglione, 2010a,b; Chu et al. 2014), andhuman disturbances (Allan et al., 2013; Danz et al., 2005). Ecologicalclassifications of Lake Erie were conducted by Johnson et al.(submitted for publication) and a physical habitat classification ofGreat Lakes nearshore and offshore waters was conducted byRutherford and Geddes (2007). These efforts have provided classifica-tions of spatial units by type or status based on one or a composite setof variables. The GLAHF framework has been structured to allowmulti-ple user-defined classifications using specific sets of variables such asthose described above based on an objectively defined set of aquaticecological units. The next phase of GLAHF will be the development ofthese core or base units of classification within the hierarchical spatialclassification framework. Aquatic ecological units (AEUs)will be formedby merging neighboring data-attribution units of the 30-m or 1.8-kmgrid cells into AEUs that have relatively homogenous physicochemicaland biological characteristics (Fig. 2). TheseAEUs are thebuilding blocksfor habitat classification of the Great Lakes system, which are nestedwithin the coastal margin, nearshore, and offshore zones (Fig. 2). Sucha process allows for the classification and mapping of ecological unitsfor multiple uses or purposes across the entire binational Great Lakesecosystem.
An important potential use of the database is to serve the needs ofmanagers and policy makers trying to achieve many of the GLWQA ob-jectives. The hierarchical structure of the database and spatial frame-work will facilitate the assembling of critical information needed fordeveloping and implementing lake-widemanagement plans, and track-ing the progress of implementing the plans at local, lake sub-basin, lakebasin, and Great Lakes basin-wide scales. The GLAHF database can pro-vide data needed to quantify beneficial use impairments and locations,track distributions and invasion rates of aquatic non-indigenous species,and identify amounts and sources of point and non-point source pollut-ants. Our database provides a spatial classification framework that isneeded for overall assessment of condition of the nearshore waters,for identifying nearshore areas that may become subject to human dis-turbance stress and areas of high ecological value, and for establishingpriorities of protection and restoration using local and large scale fac-tors. Our hierarchical classification framework and database providesthe essential mapping tools and information for conducting a baselinehabitat survey, assessing net habitat gain, and developing andimplementing lake-wide habitat and species conservation strategies.The GLAHF spatial framework and database contains the data neededfor calculating major indicators and assessing status, trends, and prog-ress toward achieving the general and specific objectives of theGLWQA (GLWQA, 2012). It also provides a Great Lakes system-widetool for the development and implementation of coordinated data ac-counting, management, sharing, and delivery strategies.
Although spatial structure of GLAHF was subjectively decided by abi-national team of resource managers and scientists, it was reviewedby many scientists, managers, and policy makers in the Great Lakes re-gion to ensure each spatial zone is distinct from the other zones and isuseful for management and research. It is built on current knowledge

595L. Wang et al. / Journal of Great Lakes Research 41 (2015) 584–596
to ensure that the zones reflect the lake ecosystem spatial componentsand functionality. The 5-km landward coastal terrestrial zone (includingriver mouths and catchments above lake coastal line) was delineated tocapture themore important roles of natural and anthropogenic environ-ment adjacent to the lakes compared to those at distance (Hollenhorstet al., 200; Wang et al, 2010; Wehrly et al, 2013). Although the 30-mcell size at the coastal terrestrial, coastal aquatic margin, and coastalnearshore zones and the 1.8-km cell size at the offshore zone meet themajority data resolution needs and is an efficient way to manage theGreat Lakes Basin-wide data, at times the users maywish to incorporatetheir application at finer spatial resolution. In such a case, the users canuse data in GLAHF and further divide the cells into smaller sizes.
Limitations and future management of GLAHF
The intent of GLAHF database was not to include all data collectedfrom the Great Lakes. The goal of GLAHF spatial database has been theintegration of available basin-wide data to address the needs for datarectified to a common spatial framework. The outcome is a spatial data-base of consistent data available at the Great Lakes Basin scale andmin-imally at a lake system scale. For example, we did not attempt toassemble and harmonize data that were collected for specific objectivesat a local scale. For local users, our database provides a data backbone(spatial hierarchical framework) to link localized data with the readilyavailable broad scale data (e.g., bathymetry, temperature, wave, sub-strate, and ecological unit classifications, etc.) to meet their ownneeds. Because the spatial resolution, type, and availability of lakesystem-wide data could vary depending on data source, our data attri-bution process has simplified some of the data that were inconsistentacross the scales into common descriptors or common spatial units.Hence, some of the data in our database may have lost their fine detailor resolution.
Some of the data currently in our database are incomplete and canbe improved in the near future. Nearshore areas of the Great Lakeshave only recently been sampled and studied basin-wide and thesedata need to be incorporated into GLAHF when they become available.The ballast water loading and discharge locations in the Great Lakesare available only for the United States portion of the waters. The coast-line typology for the U.S. is much newer and more detailed than thosefor the Canada, which will need improvement when newer data be-come available. The approach of the first iteration of GLAHF is to includeasmuch of the best available data on a lake/system-wide scale as possi-ble. Given the fast development of information technology and increas-ingly availability of regional data, our database will require periodicupdate and improvement.
The GLAHF database is extensive (100 s GBs), which could becumbersome and difficult to manage. The advancement in fastercomputing power, larger hard drives, the advent cloud computing,and large database operation systems (e.g., SQL Server, ArcSDE)make the management of our database more efficient and easier.The GLAHF spatial data is stored in the ESRI proprietary format. Al-though this format requires specific software licenses and continuedfile maintenance and updating, it is the most commonly used GISplatform to facilitate multiple users. Data in this format can be storedin a compressed format and can be exported in open source spatialdata format standards (e.g., shapefile, csv, kml, GeoTIFF).
The GLAHF database and spatial framework have been developedthrough a research project with the goal of developing a publically ac-cessible database and classification system. The plans for long-term da-tabase management, data delivery, and data update were beyond thescope of this research project but are currently under development. Incollaboration with Institute for Fisheries Research, University of Michi-gan, and U.S. Geological Survey Great Lakes Science Center, we havebegun the work toward this direction.
Overall, our database provides the essential data for achieving someof the GLWQA objectives and for meeting the needs of many other
management and research programs. The utility of the database canbe improved by incorporating additional detailed localized data thatare not available at a lake or system-wide scale. Presently, many addi-tional data layers and data layers at a higher resolution are availableonly at a regional or local scale. Adding of these data to our lakesystem-wide database by regional agencies or partnerships will im-prove the utility of GLAHF for local users by providing informationthat otherwise could not be supplied by the lake system-wide databaseand by placing that data within a lake- or basin-wide framework. Thisdatabase also can be improved by incorporating updated or new datalayers, newly designed systematic collected information, and modeledphysicochemical and biological conditions under projected climatechanges.
Supplementary data to this article can be found online at http://dx.doi.org/10.1016/j.jglr.2015.03.017.
Acknowledgments
We thank Paul Seelbach, Michael Wiley, Jan Ciborowski, ScudderMackey, Travis Brenden, John Dettmers, Karen Rodriguez, MarkBurrows, and Michael Laitta for their support and strategic thinking inthe development of the Great Lakes spatial framework and database.We are grateful to the GIS and data acquisition support from JasonBreck, Danielle Forsyth, Beth Sparks-Jackson, and Gust Annis. This pro-ject was funded by the Great Lakes Fishery Trust (2010 1206) and re-ceived in-kind support from the University of Michigan, MichiganDepartment of Natural Resources, International Joint Commission, On-tario Ministry of Natural Resources, NOAA Great Lakes EnvironmentalResearch Laboratory, U.S. Geological Survey, U.S. Fish and Wildlife Ser-vices, U.S. Environmental Protection Agency, Environment Canada, TheNature Conservancy, The Great Lakes Fishery Commission, MichiganState University, University of Minnesota-Duluth, and University ofWindsor. This is contribution 1914 of the USGSGreat Lakes Science Cen-ter and contribution 1747 of the NOAA Great Lakes Environmental Re-search Laboratory.
References
Albert, D.A., Wilcox, D.A., Ingram, J.W., Thompson, T.A., 2005. Hydrogeomorphic classifica-tion for great lakes coastal wetlands. J. Great Lakes Res. 31 (Supp. 1), 129–146.
Allan, J.D., McIntyre, P.B., Smith, S.D.P., et al., 2004. Landscape and riverscapes: the influ-ence of land use on river ecosystems. Annu. Rev. Ecol. Evol. Syst. 35, 257–284.
Allan, J.D., et al., 2013. Joint analysis of stressors and ecosystem services to enhance resto-ration effectiveness. Proc. Natl. Acad. Sci. U. S. A. 110 (1), 372–377.
Arvai, A., Klecka, G., Jasim, S., Melcer, H., Laitta, M.T., 2014. Protecting our great lakes:assessing the effectiveness of wastewater treatments for the removal of chemicalsof emerging concern. Water Qual. Res. J. Can. 49 (1), 23–31.
Barbiero, R.P., Lesht, B.P., Warren, G.J., 2012. Convergence of trophic state and the lowerfood web in Lakes Huron, Michigan and Superior. J. Great Lakes Res. 38 (2), 368–380.
Barton, C.R., Schelske, C.L., 1982. Lake-wide seasonal changes in limnological condition sin Lake Michigan in 1976. J. Great Lakes Res. 8 (3), 413–427.
Beletsky, D., Schwab, D., McCormick, M., 2006. Modeling the 1998–2003 summer circula-tion and thermal structure in Lake Michigan. J. Geophys. Res. 111, C10010. http://dx.doi.org/10.1029/2005JC003222.
Bertrand, G., Lang, J., Ross, J., 1976. The Green Bay Watershed Past/Present/Future. Tech-nical Report No. 229. University of Wisconsin Sea Grant Program, Madison, WI(300 pp.).
Boase, J.C., 2003. Integrating Sonic Tracking and GIS to Determine Habitat Selection andBenthic Prey Distribution of Adult Lake Sturgeon in Lake St. Clair. (Master's thesis).University of Michigan, Ann Arbor.
Brenden, T., Wang, L., Seelbach, P.W., 2008. A river valley segment classification of Mich-igan streams based on fish and physical attributes. Trans. Am. Fish. Soc. 137,1621–1636.
Bunnell, D.B., Barbiero, R.P., Ludsin, S.A., et al., 2013. Changing ecosystem dynamics in theLaurentianGreat Lakes; bottom-up and top-down regulation. Bioscience 64 (1), 26–39.
Cha, Y.K., Stow, C.A., Nalepa, T.F., Reckhow, K.H., 2011. Do invasive mussels restrict off-shore phosphorus transport in Lake Huron? Environ. Sci. Technol. 45, 7226–7231.
Cheruvelil, K.S., Soranno, P.A., Bremigan, M.T., Wagner, T., Martin, S.L., 2008. GroupingLakes for water quality assessment and monitoring: the roles of regionalization andspatial scale. Environ. Manag. 41, 425–440.
Chu, C., Koops, M.A., Randall, R.G., Kraus, D., Doka, S.E., 2014. Linking the land and thelake: a fish habitat classification for the nearshore zone of Lake Ontario. FreshwaterScience. 33, 1159–1173.
596 L. Wang et al. / Journal of Great Lakes Research 41 (2015) 584–596
Cline, T.J., Bennington, V., Kitchell, J.F., 2013. Climate change expands the spatial extentand duration of preferred thermal habitat for Lake Superior Fishes. PLoS One 8 (4),e62279. http://dx.doi.org/10.1371/journal.pone.0062279.
Clites, A.H., Smith, J.P., Hunter, T.S., Gronewold, A.D., 2014. Visualizing relationships be-tween hydrology, climate, and water level fluctuations on Earth's largest system oflakes. J. Great Lakes Res. 40, 807–811.
Danielle K.F., Riseng C.M., Wehrly K.E, Mason L., Gaiot J., Hollenhorst T., Johnston C.,Wyrzykowski C., Annis G., Castiglione C., Todd K, Robertson M., Infante D.M.,Wang L., McKenna J.K., Whelan G. A consistent, binationally harmonized watershedboundary dataset – the great lakes hydrographic dataset (submitted for publication,April 1, 2015).
Danz, N.P., Regal, R.R., Niemi, G.J., et al., 2005. Environmentally stratified sampling designfor the development of Great Lakes environmental indicators. Environ. Monit. Assess.102, 41–65.
Dell, C.I., 1976. Sediment distribution and bottom topography of southeastern Lake Supe-rior. J. Great Lakes Res. 2 (1), 164–176.
Dietrich, G., Kalle, K., Krauss, W., Siedler, G., 1980. General Oceanography. Translated bySusanne and Hans Ulrich Roll. 2nd ed. John Wiley and Sons (Wiley-Interscience),New York.
EPA (Environmental Protection Agency), 1992. Great Lakes Monitoring and ResearchStrategy Environmental Monitoring and Assessment Program. Environmental Re-search Laboratory, Office of Research and Development. United States EnvironmentalProtection Agency, Duluth, MN, p. 55804 (June 1992. EPA/620/R-92/001).
Eyles, N., Mohr, L., 2006. Lake trout/lake whitefish spawning shoal assessment: GeorgianBay. OntarioMinistry of Natural Resources and Office of Research Services, Universityof Toronto Title: Two Year (2004–6) Collaborative Ontario Ministry of Natural Re-sources And University of Toronto Project, Project Number: 300771 Final Report:May 2006. Ontario Ministry of Natural Resources, and Office of Research Services,University of Toronto (submitted for publication).
Fahnenstiel, G., Pothoven, S., Vanderploeg, H., Klarer, D., Nalepa, T., Scavia, D., 2010. Re-cent changes in primary production and phytoplankton in the offshore region ofsoutheastern Lake Michigan. J. Great Lakes Res. 36, 20–29.
Frissell, C.A., Liss, W.J., Warren, C.E., Hurley, M.D., 1986. A hierarchical framework forstream habitat classification: viewing streams in a watershed context. Environ.Manag. 10, 199–214.
Gallant, A.L., Brown, D.D., Hoffer, R.M., 2005. Automated mapping of Hammond's land-forms. IEEE Geosci. Remote Sens. Lett. 2 (4) (October).
GLWQA (Great Lakes Water Quality Agreement), 2012. Great LakesWater Quality Agree-ment, Protocol Amending the Agreement between Canada and the United States ofAmerica on Great lakes Water Quality, 1978 (as Amended on October 16,1983, andon November 18, 1987. Signed September 7, 2012 and entered into force February12, 2013).
Goodyear, C.D., Edsall, T.A., Dempsey, D.M., Moss, G.D., Polanski, P.E., 1982. Atlas of theSpawning and Nursery Areas of Great Lakes Fishes vol. 9. U.S. Fish and Wildlife Ser-vice, Office of Biological Services.
Gronewold, A.D., Fortin, V., Lofgren, B., Clites, A., Stow, C.A., Quinn, S.F., 2013. Coasts, waterlevels, and climate change: a Great Lakes perspective. Climate Change 20, 697–711.
Hollenhorst, T.P., Brown, T.N., Johnson, L.B., Ciborowski, J.J.H., Host, G.E., 2007. Methodsfor generating multi-scale watershed delineations for indicator development inGreat Lake coastal ecosystems. J. Great Lakes Res. 33, 13–26.
Howell, E.T., Chomicki, K.M., Kaltenecker, G., 2012. Tributary discharge, lake circulationand lake biology as drivers of water quality in the Canadian nearshore of Lake Ontar-io. J. Great Lakes Res. 38 (Suppl. 4), 47–61.
Johnson, L., Ciborowski, J., Mackey, S., Hollenhorst, T., Gauthier, R., Button, D.T., 2007. AnIntegrated Habitat Classification andMap of the Lake Erie Basin: Final Report. Nation-al Fish and Wildlife Foundation (submitted for publication, November 30, 2007).
Jude, D.J., Pappas, J., 1992. Fish Utilization of Great Lakes Coastal Wetlands.Karrow, P.F., Dreimanis, A., Barnett, P.J., 2000. A proposed diachronic revision of late Qua-
ternary time-stratigraphic classification in the eastern and northern Great Lakes area.Quat. Res. 54, 1–12.
LEHTG (Lake Erie Habitat Task Group), 2012. Report of the Lake Erie Habitat Task Group,Presented to the Standing Technical Committee, Lake Erie Committee. Great LakesFishery Commission (March 23, 2012).
Lewis, M., 1966. Sedimentation Studies of Unconsolidated Deposits in the Lake Erie Basin.(Ph.D. thesis). University of Toronto.
McKenna Jr., J.E., Castiglione, C., 2010a. Hierarchical multi-scale classification of nearshoreaquatic habitats of the Great Lakes:Western Lake Erie. J. Great Lakes Res. 36, 757–771.
McKenna Jr., J.E., Castiglione, C., 2010b. Hierarchical multi-scale classification of nearshoreaquatic habitats of the Great Lakes: Western Lake Erie. J. Great Lakes Res. 36 (4),757–771.
Michalak, A.M., et al., 2013. Record-setting algal bloom in Lake Erie caused by agriculturaland meteorological trends consistent with expected future conditions. Proc. Natl.Acad. Sci. U. S. A. 110 (16), 6448–6452.
Moore, J.R., Meyer, R.P., 1969. Progress report on the geological–geophysical survey ofGreen Bay, 1968. Technical Report No. 1. University of Wisconsin Sea Grant Program,Madison, WI (16 pp.).
NHD Plus V2, 2012. National Hydrography Dataset Plus, Version 2. United States Geolog-ical Survey and United States Environmental Protection Agency (June 2012. (Lastaccessed January 10, 2014: http://www.horizon-systems.com/NHDPlus/index.php)).
Niemi, G.J., Kelly, J.R., Danz, N.P., 2007. Environmental indicators for the coastal region ofthe North American Great Lakes: introduction and prospectus. J. Great Lakes Res. 33(Special Issue 3), 1–12.
OMNR (Ontario Ministry of Natural Resources), 2013. Ontario Integrated Hydrology Data:Elevation and Mapped Water Features for Provincial Scale Hydrology Applications(Technical Release) V. 1.1. Spatial Data Infrastructure (formerly Water ResourcesInformation Program). Ontario Ministry of Natural Resources (pp. 32–33).
Plattner, S., Mason, D.M., Leshkevich, G.A., Schwab, D.J., Rutherford, E.S., 2006. Classifyingand forecasting coastal upwellings in Lake Michigan using satellite derived tempera-ture images and buoy data. J. Great Lakes Res. 32, 63–76.
Poff, N.L., 1997. Landscape filters and species traits: towards mechanistic understandingand prediction in stream ecology. J. N. Am. Benthol. Soc. 16, 391–409.
Powers, C.F., Robertson, A., 1968. Subdivisions of the benthic environment of the Upper GreatLakes, with emphasis on Lake Michigan. J. Fish. Res. Board Can. 25 (6), 1181–1197.
Rao, Y.R., Schwab, D.J., 2007. Transport and mixing between the coastal and offshorewater in the Great Lakes: a review. J. Great Lakes Res. 33, 202–218.
Rasul, N., Coakley, J.P., Pippert, R., 1997. Sedimentary environment of Lake Erie: geologicsetting, sediment distribution, and modern evolutionary trends. Canada NationalWater Research Institute Contributionpp. 97–114.
Riseng, C.M., Wang, L., Wiley, M.J., Rutherford, E., Brenden, T., 2008. State-of-the-art ap-proaches for assessment of Great Lakes nearshore and large river fish habitat. FinalReport to the Great Lakes Fishery Trust, United States Environmental ProtectionAgency, and Great Lakes Fishery Commission.
Robbins, J.A., 1986. Sediments of Saginaw Bay, Lake Huron: elemental composition andaccumulation rates. Great Lakes Research Division, Special Report No. 102. USEPA,Environmental Research Laboratory-Duluth, Duluth, Minnesota.
Rutherford, E.S., Geddes, C.A., 2007. Ecological Classification ofNearshore andOpen‐WaterFish Habitats in the Great Lakes. Final Report to Michigan Department of NaturalResources. State Wildlife Grant Program. Institute for Fisheries Research, Ann Arbor,Michigan.
Schwab, D.J., Beletsky, D., DePinto, J., Dolan, D.M., 2009. A hydrodynamic approach tomodeling phosphorus distribution in Lake Erie. J. Great Lakes Res. 35, 50–60.
Statistics Canada, 2002. Population Data for Ontario From 1929 to 2001. Provided byOntario Ministry of Finance. Ontario, Toronto.
Thomas, R.L., 1988. Distribution and composition of the surficial sediments of GeorgianBay and North Channel. Hydrobiologia 163, 35–45.
Thomas, R.L., Dell, C.I., 1978. Sediments of Lake Superior. J. Great Lakes Res. 4 (3–4), 264–275.Thomas, R.L., Kemp, A.L.W., Lewis, C.F.M., 1972. Distribution, composition and character-
istics of the surficial sediments of Lake Ontario. J. Sediment. Res. 42, 66–84.Thomas, R.L., Kemp, A.L.W., Lewis, C.F.M., 1973. The surficial sediments of Lake Huron.
Can. J. Earth Sci. 10, 226–271.U.S. Census Bureau, 2000. 2000 Census. Department of Commerce, Washington, D.C.USEPA (Environmental Protection Agency) and Government of Canada, 1995. The Great
Lakes: An Environmental Atlas and Resource Book. Great Lakes National Program Of-fice, US Environmental Protection Agency.
Wang, L., Seelbach, S.W., Hughes, R.M., 2006. Introduction to landscape influences onstream habitats and biological assemblages. Am. Fish. Soc. Symp. 48, 1–23.
Wang, L., Wehrly, K., Breck, J., Kraft, L.S., 2010. Landscape based assessment of human dis-turbance for Michigan lakes. Environ. Manag. 46, 471–483.
Wang, L., Infante, D., Esselman, P., Cooper, A., Wu, D., Taylor, W., Beard, D., Whelan, G.,Ostroff, A., 2011. A hierarchical spatial framework and database for the nationalriver fish habitat condition assessment. Fisheries 36 (9), 436–449.
Wang, L., Brenden, T., Cao, Y., Seelbach, P., 2012. Delineation and validation of rivernetwork spatial units for water resources and fisheries management. Environ.Manag. 50, 875–887.
Wegscheider, S., 2006. Investigation of Coastal Upwelling Events in Lakes Michigan,Huron, Superior, and Ontario. Internal Report From the Summer Fellowship Program.NOAA Great Lakes Environmental Research Laboratory, Ann Arbor, MI.
Wehrly, K.E., Breck, J.E., Wang, L., Szabo-Kraft, L., 2012. Classifying fish assemblages insampled and unsampled lakes: a multivariate regression tree approach. Trans. Am.Fish. Soc. 141, 414–425.
Wehrly, K.E., Wang, L., Infante, D., Cooper, A., Geddes, C., Stanfield, L., Rutherford, E., 2013.Landscape change and its influences on aquatic habitat and fisheries in the GreatLakes Basin. In: Taylor, W., Leonard, N., Lynch, A. (Eds.), Great Lakes Fisheries Policyand Management: A Binational Perspective, 2nd edition Michigan State UniversityPress, East Lansing.
Wei, A., Chow-Fraser, P., Albert, D., 2004. Influence of shoreline features on fish distribu-tion in the Laurentian Great Lakes. Can J Fish Aquat Sci. 61, 1113–1123.
Yurista, P.M., Kelly, J.R., Miller, S.E., 2006. Comparisons of zooplankton community sizestructure in the Great Lakes. J. Geophys. Res. Oceans 111, C05S08. http://dx.doi.org/10.1029/2005JC002971.