journal of hydrology, 105 (1989) 225-251 225 elsevier ... · pdf filevan genuchten 2, w.h. van...
TRANSCRIPT
Journal of Hydrology, 105 (1989) 225-251 Elsevier Science Publishers B.V., Amsterdam -- Printed in The Netherlands
[2]
E X P E R I M E N T A L A N D T H E O R E T I C A L A N A L Y S I S O F S O L U T E T R A N S P O R T F R O M A D I F F U S E S O U R C E O F P O L L U T I O N
225
H.C. VAN OMMEN 1., M. TH. VAN GENUCHTEN 2, W.H. VAN DER MOLEN 1, R. DIJKSMA ! and J. HULSHOF 1
1 Department of Land and Water Use, Agricultural University, Nieuwe Kanaal 11, 6709 PA Wageningen (The Netherlands) U.S. Salinity Laboratory, U.S.D.A./A.R.S., 4500 Glenwood Drive, Riverside, CA 92501 (U.S.A.)
(Received June 16, 1988; accepted for publication June 26, 1988)
ABSTRACT
Van Ommen, H.C., Van Genuchten, M. Th., Van der Molen, W.H., Dijksma, R. and Hulshof, J., 1989. Experimental and theoretical analysis of solute transport from a diffuse source of pollution. J. Hydrol., 105: 225--251.
Transport processes governing soil and groundwater contamination by a diffuse (non-point) source were studied by means of a field ~racer experiment in the Hupselse Beek catchment area in The Netherlands. A bromide tracer was applied to the intake area (11 m x 260m) of a drain, and subsequently monitored in the unsaturated zone, as well as in the drain efl]uent. Data from the unsaturated zone were analyzed using both the classical convection-dispersion solute transport equation (CDE) and a regional stochastic model (RSM) which assumes lognormal distributions of the pore water velocity and the dispersion coefficient across the field. Both models described the data equally well, with the CDE model giving a somewhat better mass balance of the recovered bromide. Calculated ~3olute fluxes leaving the unsaturated were used as input into a mixing cell type model for transport in the saturated zone. Drain efliuent concentrations predicted with the coupled unsaturated--saturated transport model were compared with the observed breakthrough curve; results indicate the presence of preferential flow in the unsaturated zone.
INTRODUCTION
Pub l i c a w a r e n e s s and c o n c e r n s a b o u t t he l e a c h i n g of n u t r i e n t s and pes t ic ides f rom a g r i c u l t u r a l l ands has neve r been h i g h e r t h a n i t is today . This is no t s u r p r i s i n g as more and m o r e ev idence showed t h a t diffuse (non-po in t ) sources of p o l l u t i o n p lay a m a j o r ro le in the d e g r a d a t i o n of the q u a l i t y of ou r soi l and g r o u n d w a t e r sys tems (Bruyn , 1984; V a n der Veen, 1986; F u n k , 1987).
G r o u n d w a t e r p o l l u t i o n s t e m m i n g f rom diffuse a g r i c u l t u r a l sources t yp ica l ly i nvo lves f irst t r a n s p o r t t h r o u g h t he u n s a t u r a t e d zone, fo l lowed by t r a n s p o r t in t he u n d e r l y i n g s a t u r a t e d g r o u n d w a t e r system. The t ime scale for t r a n s p o r t in t he u n s a t u r a t e d zone is u s u a l l y m u c h l a r g e r t h a n t h a t for t r a n s p o r t in the u n s a t u r a t e d zone, t h u s f u r t h e r c o n t r i b u t i n g to t he t i m e - c o n s u m i n g a n d cos t ly n a t u r e of field t r a c e r e x p e r i m e n t s i n v o l v i n g coup led u n s a t u r a t e d - s a t u r a t e d
* Present address: Grontmij Ltd., Engineers and Consultants, P.O. Box 203, 3730 AE, De Bilt (The Netherlands). 0022-1694/89/$06.65 © 1989 Elsevier Science Publishers B.V.
226
systems. Because of these considerations, field experimental studies of the migration of solutes from diffuse sources are best carried out in shallow aquifers with relatively short residence times. An aquifer of this type is located in the Hupselse Beek catchment area of The Netherlands. Soils in the region consist of an approximately 2m thick surface layer of thin fluviatile and aeolian deposits, underlain by a thick Miocene clay layer of low permeability. ity.
In this paper we present the results of a field transport experiment in the above Hupselse Beek groundwater basin using bromide as a tracer. The experiments were carried out in a I ha field with recently installed subsurface drains. A diffuse source of pollution was simulated by uniformly applying a small pulse of KBr solution to a strip of land, 260 m long and having a width twice the drain spacing (11 m). Main objective of the experiment was to study and evaluate field-scale solute transport processes operative i~ the unsaturated zone, and in a coupled unsaturated-saturated soil/groundwater system. Transport in the unsaturated zone will be analyzed by means of the classical convection-dispersion solute transport equation, and a regional stochastic model accounting for field-scale heterogeneity in the transport process. Transport in the saturated zone is described using a recently developed mixing cell type model (Van Ommen, 1986).
THEORETICAL
Transport in the unsaturated zone
Numerous theoretical studies of solute transport in the vadose zone have been carried out over the last several decades. Initially, solute transport was often simulated by applying the classical Fickian-type convection-dispersion equation (CDE) to field conditions. The CDE for nonreactive transport is given by:
~c ~2c V ~c ~--~ = D--- (1) ~x 2 ~x
where t is time [T], x is soil depth [L], c is the solution concentration [ML-3], D is the dispersion coefficient [L2T -' ], and V is the average pore water velocity [LT-'].
The CDE has been shown to describe solute transport under laboratory conditions quite satisfactorily (Danckwerts, 1953; Nielsen and Biggar, 1962; Lindstrom et al., 1967). Its extension to field conditions affects primarily the value of the dispersion coefficient, which presumably relates to the scale of the heterogeneities present in the flow field (Anderson, 1979; Dagan, 1986). This flow field is often considered to be at steady state with respect to water flow, and homogeneous with respect to water content. This was shown to be justified by experimental and theoretical studies by Cassel et al. (1975) and Wierenga (1977). The assumption of steacLy-state water flow associated with an average

227
water content for the soil gave similar solute distributions as those obtained by modeling solute transport during transient wster flow.
The dispersion coefficient D in eqn. (1) is often expressed mathematically by:
D = Do + ~V [L2T -1] (2)
where Do is the porous medium ionic or molecular diffusion coefficient [L2T - 1 ], and • is the dispersivity [L]. The applicability of this expression to transport in unsaturated soils has often been questioned (e.g., Beese and Wierenga, 1983). Still there is reasonably strong evidence that eqn. (2) holds if the scalar dispersivity is equal to a few centimeters (Sposito et al., 1986). In most cases the effect of Do on the value of the dispersion coefficient is negligible as compared to the effect of the dispersivity term in eqn. (2) (e.g., Biggar and Nieisen, 1976; Schulin et al., 1987a). In practice, D is often used as an empirical parameter representing the effects of all solute spreading mechanisms, such as transient water flow, or various physical and chemical nonequilibrium conditions (Nielsen et al., 1986). In our case we will assume that the dispersion coefficient is linearly related to the local pore water velocity, i.e.:
D = ~V (3)
There is now increasing evidence that solute transport in field soils cannot be adequately described by the CDE (Biggar and Nielsen, 1976; Van de Pol et al., 1977; Bowman and Rice, 1986; Richter and Jury, 1986). This appears specially true during surface ponding, when local variations in the pore water velocity can become so large that the dispersion process can no longer be described with a physically realistic value of the dispersivity. Dagan and Bresler (1979) introduced a method to determine variations in the pore water velocity in terms of the statistical distribution of the hydraulic conductivity. From these variations in the velocity, first- and second-order spatial and temporal moments of the concentration distribution can be derived. An application of this theory was given by Bresler and Dagan (1979) for constant input concentration. These authors compared solute profiles based on spatially variable data with solute profiles computed with the classical CDE. For both cases they derived expressions for the length of the transition zone, defined as the difference between the depths at which the concentration equalled 0.1 and 0.9 of the input. In case of the CDE, this zone expands as the square root of time, whereas in the Bresler-Dagan model the length of this zone increases linearly with time. The profile calculated with the proposed model could also be obtained with the CDE, provided the dispersivity used for predicting the concentration at I m depth ranged from 16.1 cm for low recharge cases to 334.0 cm for high recharge rates. From this the authors concluded that pore-scale dispersion is not signifi- cant for transport in heterogeneous fields.
Two years later Bresler and Dagan (1981) incorporated pore-scale dispersion into their earlier model. This had very little effect on the calculated solute distributions, as already had been foreseen in the 1979 paper. Finally, Bresler and Dagan (1983b) developed expressions for the first- and second-order

228
moments of the concentration distribution as a function of depth and time, using a simplified solution (Dagan and Bresler, 1983; Bresler and Dagan, 1983a) of the nonsteady water flow equation. The transient water flow description gave approximately the same results as the steady-state approach.
Jury (1982) introduced the concept of the transfer function model as a means of describing solute transport in heterogeneous fields. In this approach, a soil system is characterized uniquely by the way in which it transforms an input function into an output function, and assuming a log-normal distribution of travel times and no local dispersion. Jury et al. (1986) later gave a more general derivation of transfer function models for transport of solutes in soils. Solutes in the model may be conservative, or may undergo physico.chemical or biological transformations in a soil with spatially or temporally variable flow properties. The authors conclude that any mechanistic solute transport :~,aodel which maintains mass balance can be made consistent with the transfer function concept.
A slightly different approach was followed by Amoozegar-Fard et al. (1982) who used Monte Carlo simulation techniques to obtain various solute con- centration distributions as affected by variabilities in the pore water velocity and the dispersion coefficient. This approach assumes that the field can be represented by a large number of independent noninteracting soil columns in which vertical transport is described by the CDE. Each column has its own pore water velocity V, which is considered to be lognormally distributed among the individual columns. The lognormal distribution, p(V), with mean ~ and standard deviation a is given by:
1 [ - ( l n ( V ) - ~ ) 2] p(V) = Va~/(2n) exp 2a 2 (4)
The first moment of this distribution is the field average (global) velocity, (V) given by:
(V) = exp(l~ + a ~/2) (5)
The probability density function of the dispersion coefficient D is considered to be completely defined in terms of p(V) and deterministic ~.
The spreading of a solute pulse in a "field-averaged" soil profile can thus be attributed to two mechanisms: (1) local dispersion in the columns themselves; and (2) differences in the pore-water velocities among the columns.
Results of the Monte Carlo simulations by Amoozegar-Fard et al. (1982) show that the variability of Vhas a dominant effect on the field-averaged solute profile. In the limiting case of zero dispersivity, the approach is analogous to the transfer function model of Jury (!982).
In our study we will consider two methods of describing solute transport in the unsaturated soil profile: the classical CDE, and the method introduced by Amoozegar-Fard et al. (1982) commonly referred to as regional-stochastic model (RSM) (Parker and Van Genuchten, 1984a; Schulin et al., 1987b). To partially account for the transient flow regime in the system, we will use the

229
amount of drainage water, rather than time, as independent variable. This approach is somewhat similar to the linearization method used by Parker and Van Genuchten (1984).
T r a n s p o r t in the s a t u r a t e d zone
Once the bromide tracer leaves the unsaturated zone to reach the ground- water table, t ransport occurs in the saturated zone along flow lines in the direction of the drains. Transport in this part of the system is simulated by considering the saturated zone to be a perfectly mixed reservoir. Previous examples of such an analogy are given by Eldor and Dagan (1972), Ernst (1973), Gelhar and Wilson (1974), Raats (1983) and Van Ommen (1986), among others. The approach assumes that: (1) groundwater flow is at steady state in which case the drain discharge from the system becomes equal to the recharge rate multiplied with the total recharge area; (2) ~he thickness of the aquifer and its porosity are constant; and (3) groundwater flow is horizontal, thus making the Dupuit-Forchheimer assumptions valid. The concentration in the drainage water for a unit step input of a diffuse pollution source is then given by:
C(t) = 1 - e -N¢~H~ (6)
where C is the concentration of the drainage water, t is the time, N is the steady groundwater recharge rate [LT -1 ] and e [L3L -3] is the porosity of the aquifer of thickness H [L]. As before, the total amount of outflow, Nt, can be used as a substitute variable for time if the flow regime is transient.
Whereas flow in the direct vicinity of the drain is essentially radial the effect of this on the solute breakthrough curve is only of importance for values of H I 5 > 0.1, where L is the drain distance (Ernst, 1973). Groenend~jk (1986) ~h~wed that the concentration of the drainage water can be corrected for radial fl~w within a distance H from the drain by using a modified travel time distribution as first derived by Ernst (1973). Groenendijk's analysis leads to:
c(t) = 1 - A (7)
where:
A = 1 - 2 x / (2Nt ) / (~eL) - for t ___ (~H2)/(2NL)
and:
A = (1 - 2H]L) exp [ - ( N t ) / ( e H ) + (~H)/ (2L)] , for t > (~eH2) / (2NL)
Although H / L is generally smaller than 0.1 in our study, we still included the above correction for radial flow near the drain into our solution.
Drain water concentrations as a function of the cumulative amount of drainage is now calculated by the convolution integral of the impulse response of the saturated transport system with the solute loading rate leaving the unsaturated zone. We refer to the study of Van Ommen (1985) for a more detailed description of this technique.
230
MATERIALS AND METHODS
Geographical setting
The experimental field was located in the Hupsel catchment area in the Eastern part of The Netherlands. The field met the requirements with respect to the thickness of the saturated zone (see Introduction). Drains were first installed in the area in 1982. Soil type is a loamy sand Haplaquod (WSsten et al., 1985) with a top soil having a finer texture than the deeper soil layers (Dekker, pers. commun., 1986). Beneath these layers at a depth ranging from 1.5 to 2.5 m, a 20-30 m thick impervious clay layer of Miocene age was found. This clay layer forms a natural boundary for the unconfined groundwater flow system (Studygroup Hupselse Beek, 1974). One half of the drained field was under permanent grass and the remainder under corn during the growing season.
Tracking the drains
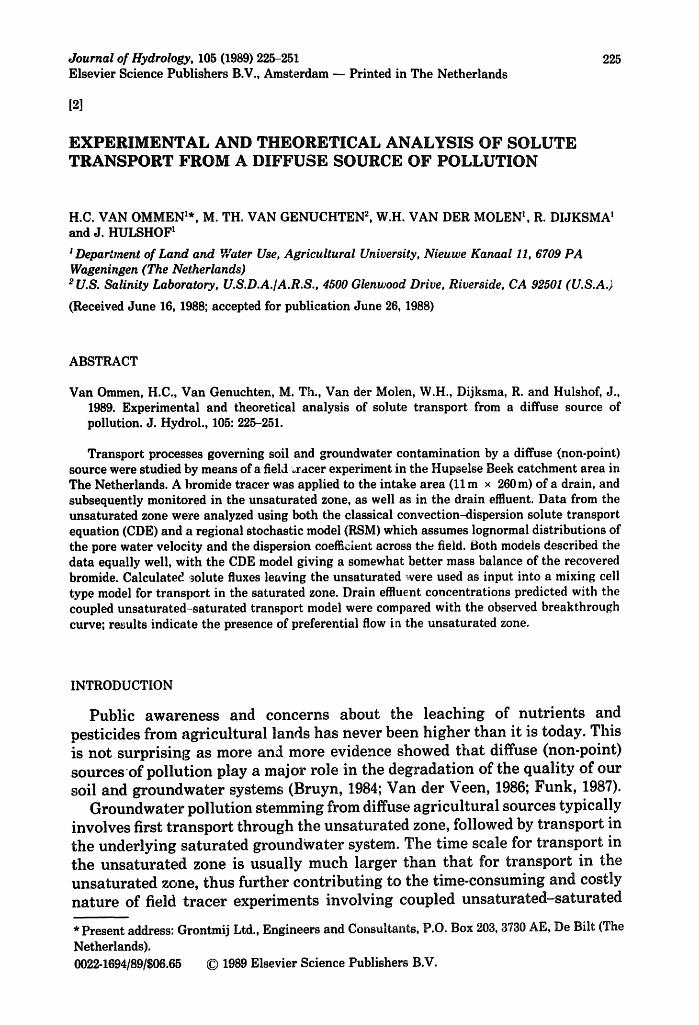
The bromide tracer was applied to the catchment area of one drain after this area had been determined in the field. Drains in the field were located by using the TRACKA system (manufacturer Hormann) which consisted of a radio wave emitter attached to a special jethead normally used for cleaning drainage tubes. At places where the emitted signals were most clearly received, a marker was put in the soil. Having tracked a whole drainage tube in this way, a cord was stretched along the markers. Three drains were jetted and tracked in this way: the drain to be sampled and the two adjacent ones. The average drain distance between the center drain and its two neighbors was taken to be half the distance between the outer drains. This resulted in an average drain spacing of about 10.85m. Because the drains were approximately 260m long, the catchment area comprised about 2850 m s. The markers of the outer drains also served as boundaries for the trace~- application. After application of the tracer the center drain was dug up at several places to determine its depth in the field. Figure la gives a schematic plane view of the experimental field; a vertical cross-section is shown in Fig. lb.
Application of the tracer
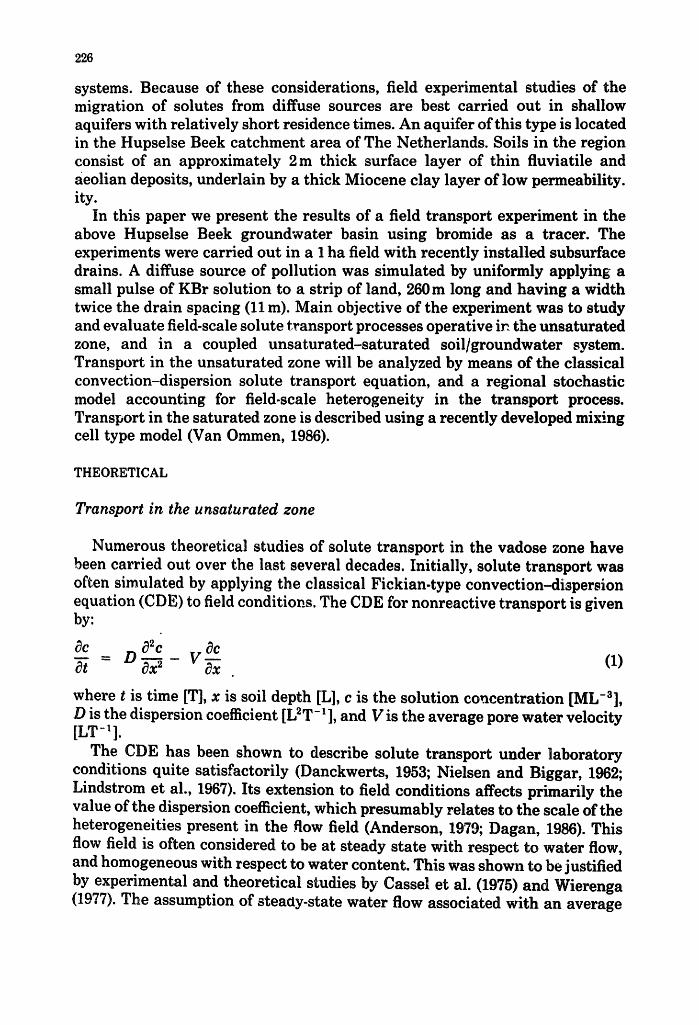
The tracer used in our study was the negatively charged bromide ion, often recommended as a soil water tracer (Jury et al., 1982; Bowman, 1984). Applica- tion took place on December 12, 1985 in the form of a 4.5mmKBr solution (2.55 g I -I) using a sprinkler irrigation system (Fig. 2) with a high application uniformity (the coefficient of variation was less than 2% when not driving, Institute for Soil Fertility, pers. commun., 1985). Two strips of 5 m width each on both sides of the drain were sprayed four times, resulting in a total applica- tion rate of 60kgBr- to a surface area of 20m × 260m. Thus, we treated an

(a)
cGtchment of center
drain booth
maize field ~L , .
E] ~i e m m
row of piezometers and microfi|ters
t~ In Q
~/~baseflow
grassland
drain
drain
row of piezometers and microfilters
drain
231
2pplication strip of Dec. 12,1985
IO m
0 50 m
==so~l sampling plot
(b) mm T 1400-
1000
600
200 BOOTH,
200,
600
1000
1400
1800
maize grassland 130 m ~l 130 m
/
I
i I : • ~
drain
"" ~.TrrlrlTzrf? TrrlTf/77TflTf/77r/77nz n'
l[Irrnnrnrnrr/B;nf/rr/Tr//" -50 cm
NfF 11 ~'I'I'If I'FI 0 50m I0 _..,nffll f l l f '
Fig. 1. (a) Schematic plane view of the experimental field. The small squares indicate the sampling spots; Co) vertical cross-section of the experimental field.

232
Fig. 2. Application of the tracer solution.
area nearly twice as large as the catchment area of the center drain. This was done to account for possible irregularities i,l the water divide between the drains. No ponding or surface runoff was observed during the application.
Soil sampling
To quantify solute transport processes in the unsaturated zone, soil samples after 69.5, 167.0, 225.0 and 304.5 mm of drain discharge were collected. At each sampling time, the soil was sampled at twenty plots regularly distributed along the drain: ten plots in the corn field and an equal number in the grassland. Each plot wa~ located in the center of the first "application strip" next to the central drain. The first plot was located in the corn field at the right-hand side of the central drain, the second plot at the left-hand side, etc. (Fig. la). Sampling within a plot consisted of taking soil samples every 5 cm with a 6 cm diameter auger up to a depth of 70 cm. Deeper sampling would sometimes lead to samples of the saturated zone (see Fig. lb). Distances within each sampling plot never exceeded 30cm. This procedure thus resulted in 20 × 14 = 280 soil samples at each sampling time. Analysis of these samples in the laboratory involved the preparation of 1:2 soil-water extracts, followed by bromide concentration de- termination.
Piezometers and sampling of the saturated zone
Rows of piezometers were installed perpendicular to the drain in the middle of the corn and grass fields (Fig. la). Bromide concentrations of the ground-
233
water at these same locations were monitored by means of microfilters (3/4" inner diameter and 10-cm length) which had been installed at different depths in the saturated zone. Groundwater samples were withdrawn after 109.5, 193.5, 278.0 and 353.0mm of drain discharge. Piezometer readings were taken at i rregular intervals.
Drain discharge measurements and sampling
Drain water was collected using a tank which was partially sunken into the bottom of the ditch at the drain outlet. Water was pumped automatically from this tank in increments of 0.089 m 3 whenever the water level reached a floating contact. Once every 16th time of pumping, an automatic water sampler (Manning $4400) received a signal to operate. In this way (16 x 0.089m3/ 2850m 2 soil surface area) a water sample was taken after every 0.5 mm of drain discharge. Samples were thus collected on a discharge-proportional basis. The entire system was controlled with a Hewlett Packard 75B programmable calculator. The equipment was installed in a booth with an electrical heating system to protect it against severe colds during the winter season.
Bromide analysis
Soil water extracts, drainage water samples and groundwater samples were analyzed for bromide using a high performance ion-chromatographic method with UV-detection at a wavelength of 193 nm (Neele, 1987).
Bromide uptake by plants
In order to account for possible bromide uptake during the winter season, grass samples were taken at the end oi" March, 1986. Grass was sampled at six plots, each randomly located in the application strip. The corn field remained uncult ivated until the end of May, 1986.
RESULTS AND DISCUSSION
Local water balance
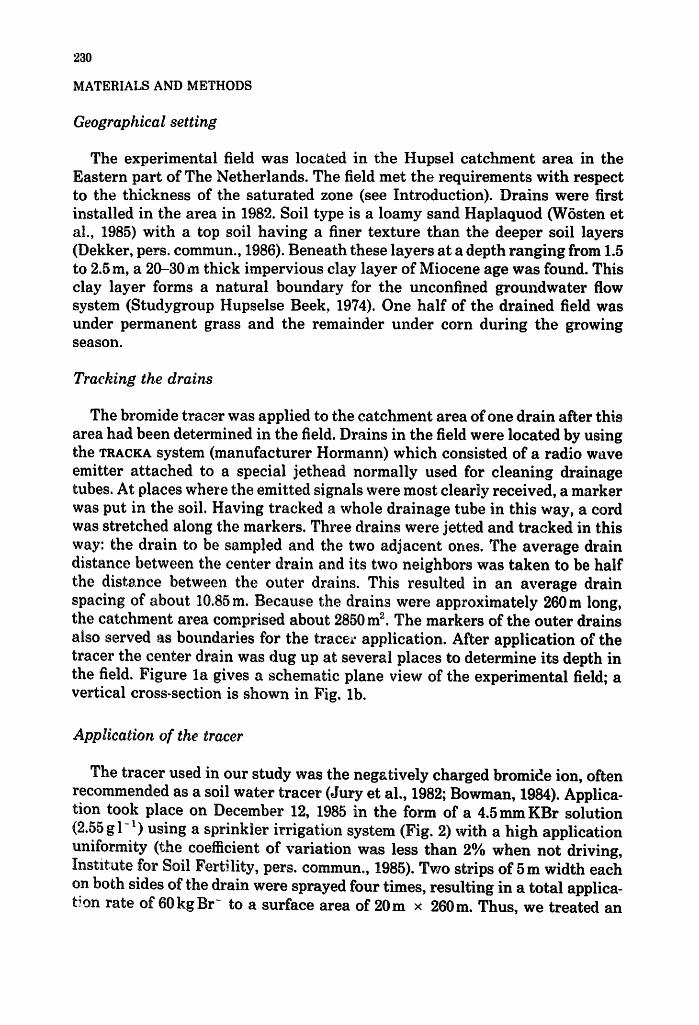
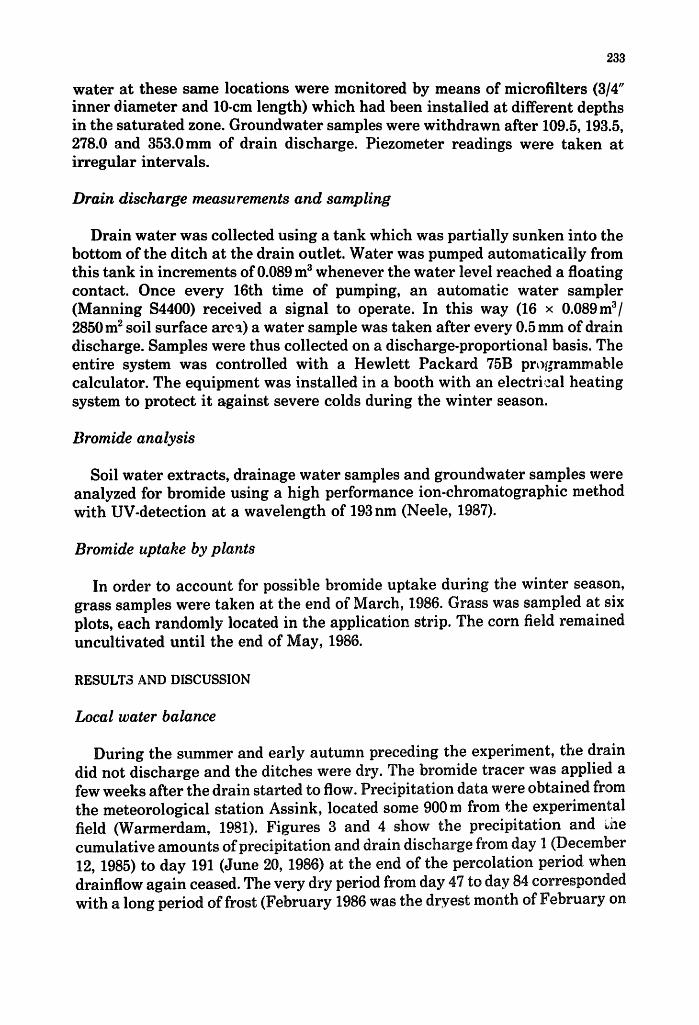
During the summer and early autumn preceding the experiment, the drain did not discharge and the ditches were dry. The bromide tracer was applied a few weeks after the drain started to flow. Precipitation data were obtained from the meteorological station Assink, located some 900 m from the experimental field (Warmerdam, 1981). Figures 3 and 4 show the precipitation and ~he cumulative amounts of precipitation and drain discharge from day I (December 12, 1985) to day 191 (June 20, 1986) at the end of the percolation period when drainflow again ceased. The very dry period from day 47 to day 84 corresponded with a long period of frost (February 1986 was the dryest month of February on

234
2, I _ 2/+ E E 20
t -
._o 16 4 - - • ~. 12
- 8
',t,,,I
precipifofion during the experiment
II r!l! ,.,,, I Ill
20 ....................... , ........... !! ................ I I,
40 60 80 100
I
!,, ,r,,I I,,, ,!f ........................... 120 140
day number 160 180
Fig. 3. Precipitat ion during the experiment.
...- 500
g
b 4oo e-- U
e-
300 \
(,.,
200
E ~ loo
cumutnfive rain cumutot'ive drain discharge
' , ' t ~ /
~/,°* . . . . . . . .
t I # J ' /
20 40 60 80 100 120 140 day number
f "
/ . J
i . e ~ . . . . • ° . /
f t
.., _ i , - ~ ~ ~
160 180
Fig. 4. Cumulstlve precipitation and drain discharge during the experiment.
record in The Netherlands). The differences between cumulative 8mounts of discharge and precipitation increased during the experiment because of increased evapotranspiration in the spring.
The experiment was continued until the summer of 1987. At the beginning of the experiment we assumed that drain discharge would result exclusively from water infiltrating the application strip between the water divides at each side of the center drain. Unfortunately, piezometer readings in the corn field later indicated that a regional baseflow was superimposed upon the local flows between the drains, at least during part of the experL~nental period (Fig. la). A simple hydrological calculation showed that this base~ow had a flux of at most a few cm per day, at least in the corn field. No head gradient was observed perpendicular to the drain in the grass area. Because the tracer was applied to

235
a strip that extended 5m beyond the water divide between the drains, horizontal inflow of bromide by water from the catchment of the central drain would only be guaranteed for some 250 days. Therefore, only results for the first percolation season ending in June, 1986, will be considered here. Drain water samples in autumn 1986 showed bromide cc~ncentrations of 1.4 mg 1-1 for the upstream drain, 14.0mg1-1 for the centre drain, and ll.8mg1-1 for the downstream drain, thus confirming the presence of the baseflow. Note that the average of the upstream and downstream drainage water concentrations is about half the concentration in the center drain, as would have been expected.
Soil samples and unsaturated transport
Soil bromide concentrations were grouped according to land use: grass or corn. They will be treated separately, even though about half of the concentra- tion distributions from the grass field were statistically not significantly different from those of the corn land, as predicated by the Kolmogorov-Smir- nov statistic (based on the maximum difference between two empirical cumulative distribution functions), and the Wilcoxon test (based on the rank of the data in both groups). Because the grass and corn fields were treated separately, the number of soil sample replications at each time and depth was ten. Distributions of the concentration~ were tested for normality and log- normality by the tests of Kolmogorov-Smirnov, Cramer-Von Mises (Rao et al., 1979) and Shapiro-Wilk (Shapiro and Wilk, 1965). No clear distinction could be made from these analyses: sometimes the distributions were better described by a normal probability density function (PDF), sometimes by a log-normal PDF, and sometimes neither of the two couL'! adequately describe the concentration data. Hence, spatially-averaged (global) bromide concentrations at given depths and times were determined by simply taking arithmetic mean of the concentrations. Confidence intervals (90%) were calculated using the boot- strapping procedures (Dane et al., 1986) which do not require a-priori assumptions regarding the probability distribution. The number of bootstrap replications was chosen at 5000. Concentration profiles for the four sampling times are presented in Figs. 5 (corn) and 6 (grass), together with the optimized curves for the CDE and RSM transport models.
The nonlinear least-squares optimization program developed by Parker and Van Genuchten (1984a) was used for the analysis of the field data. This program (called CXTFIT, version 1985) can be used to estimate the unknown parameters in several one-dimensional solute transport models from spatial distributions of the resident concentration (Parker and Van Genuchten, 1984b). In our study where the flow rate varied greatly in time, the controlling independent variable was taken to be the amount of drain discharge, expressed in mm. By doing so, the pore water velocity MVis given ~vith respect to the flux density of the drain discharge. Thus, a computed velocity MV of, say, 4.0 means that the pore water velocity is four times larger than the water flux density. Its reciprocal (MV-1 _ 0.25), corresponds then with the mobile water content of the system.

236
concentration (rag t -1) 6O 80 120 160 200
1 ~%--c-7
o.' 1 ' 0.2 , , <
• _I ~ COE_modet
0.6. .... RS _ mode[
02
conrc,,rrotion (rag I -I) I.O 80 120 160 200 0
E E
0-51 ~ sompIlng 2 CDE. mode[
o.61 i- ~ .... Rs .modet ][Z]-
O'7
c0ncentroh0n (rag t -1) ~0 80 120 160 200 0
0.1
0.2
g a3
(15
i ~ ~COE.modeL Q61 ~ . .... RS .modet
0,TJ
concentration (rag [-1) 0 40 80 120 160 200
• • ' • , • ' • • r , - - • ~ ~ , , i
0.2
~,0.3. ..,= • ~Qz,.
1 ; 3
"II Q6
0,7
sampling z, CDE .modet
.... RS . modet
Fig. 5. Concentration profiles in the corn field at different sampling times.
CDE results
Parameter estimation results for the convection-dinpersion equation (CDE) are given in Table ]. The sampling number refers to the accumulated drain discharge when the soil was sampled (i.e., sampling 1 corresponds with a discharge of 69.5turn, 2 with 167.0mm, 3 with 225.0mm, and 4 with 304.5mm). Because the application of the tracer solution was uniform, the applied tracer pulse length to was 4.5 mm. This value was not corrected for bromide uptake by grass as only an estimated 3% of the amount of bromide applied was recovered from the grass.
Initially, we optimized the pore water velocity MV and the dispersion coef- ficient D, of the CDE model. The mass balance was verified by carrying out a second optimization with unknown to but with MV and D fixed at their values from the first run. The optimized to value was divided by the known to value to yield the recovered fractions of the tracer as viewed by the CDE model. These

0.2
~03.
~0.~. 05.
(16.
0.7
I i
I' /I
concentration {rag 1-1}
i0.,. ~ , ~ , ~ I00 . 120
' / I / I
snmp[ing 1 - - [ D E_ model . . . . RS _ model
toncentrotion {rng t 1} 0 20 ~ 60 80 100 120
1
,i [ DE _ mode[
..--~_. RS _model 0.7.
237
0.1,
0.2
_ 0.3
0.4,
0.5
(16.
O]
i concentration (mg t "1 }
20 ~ 60 80 100 120 0 i , , | • ' ' |
0.1
-I 02.
03.
1~. O.t+,
_ 0,5
sampling 3 [DE. model 0,6.
...... RS _ modet 0.'~
concentration ling t -I } , 20 , ~ , ~, , SO ,IO.O . I ~ 0
I
sampling/-, - - ODE.model ..... RS. modet
Fig. 6. Concentrat ion profiles in grassfield at the different sampling times.
mass balance ratios are also indicated in Table 1. Values range between 0.911 and 1.008 times the amount applied. Optimizations were carried out for all four samplings, and for various combinations of these as shown in Table 1. Opti- mizations were also performed using data from all plots separately, instead of using areally-averaged values. Results for the individual plots were generally very similar to the global estimates except for substantially lower correlation coefficients between the fitted and observed concentrations because of fewer sampling replicates and the inclusion of spatial variability.
Because the relative pore water velocity in this study is the inverse of the volumetric water content, one should be able to estimate the average mobile volumetric water contents of the corn and grass plots from the optimized parameter values for MV in Table 1. Results compare well with the measured gravimetric water content distributions for the grass and corn fields shown in Figs. 7 and 8, respectively. These globally averaged distributions, with their

238
TABLE 1
Parameter estimation results for the convection dispersion equation (CDE)
Sampling Number of M V observations (-) (ram)
Mass balance
Land use: corn
1 14 3.27 37 0.981 2 14 5.40 196 0.988 3 14 3.77 95 0.992 4 14 3.68 95 1.00 I-4 56 3.19 62 0.911 1,3,4 42 3.33 42 0.957 2,3,4 42 4.31 178 0.953
Land use: permanent grass
1 14 3.04 145 0.966 2 14 7.16 322 0.984 3 14 3.28 211 1.01 4 14 3.78 173 0.997 1-4 56 3.03 198 0.931 1,3,4 42 3.09 154 0.951 2,3,4 42 4.15 353 0.934
90% confidence intervals, were based on measured gravimet:~ic water contents at the four sampling times. Dry soil bulk densities derived from open pit measurements ranged from 1.3 gcm -3 for the topsoil to about 1.7 for the deeper layers. At a few locations we found some thin peat layers with dry bulk densities of about 0.gg cm -'~. Unfortunately we were unable to measure the volumetric moisture content and the tracer concentration of the same soil sample. Confidence intervals of the water contents in Figs. 8 and 9 were based on the normal distribution of the gravimetric water contenlt. Validity of this assumption was verified with the same three statistical tests used previously. The inverses of the M V values in Table 1 correspond well with the measured water content profiles provided the b u ~ density factor of 1..3-1.7 is taken into account. An exception to this is the second sampling when the optimization procedure resulted in an unreasonably high pore water velocity. Note that pore water velocities for the corn field seem to be somewhat hi~;her than those for ~he grass because of lower water contents.
The dispersivitie~ ~ show an analogous behavior: for corn they are in reasonable agreement with values reported in the literature, except for the second sampling when a relatively large value resulted. The dispersivities for the grassfield were always larger than those for the corn field with the second sampling again showing a much larger value. The larger values of ~ for grass may be attributed to more prominent preferential flow paths in the soil because
O2
~0.3
0.5.
0.6,
0.7.
gro~ water content (g.woter/g.soi[) gray. vwoter content (g.wnter/g.soi[) 0.10 020 0.30 0.~ 0.50 0.60 0 0.10 0.20 030 OH 0,50 0.60
' ' ,~. .__:1 ' '1 ' ,,,, I I, 0.1
0.2
Q3
sampling I 05 t L ~ sampting 2
0.7
239
0
0.1.
0.2
"~ 0.3
"~ o.~..
0.5,
0,6,
0.'/,
gray. water content (g. water/g.soit ) 0.10 0.20 0.30 0.~0 050 Of&) 0 0.~
01
0.2
I g a3 I I ¢,.
~ or, sampling 3
0.5
0.6
o7
grav. water content (g.~ter/g.soit ) o~, 0.20 0.3o, o.~ o,so
I ' I I ' I
I ' I ~ J sompting ~,
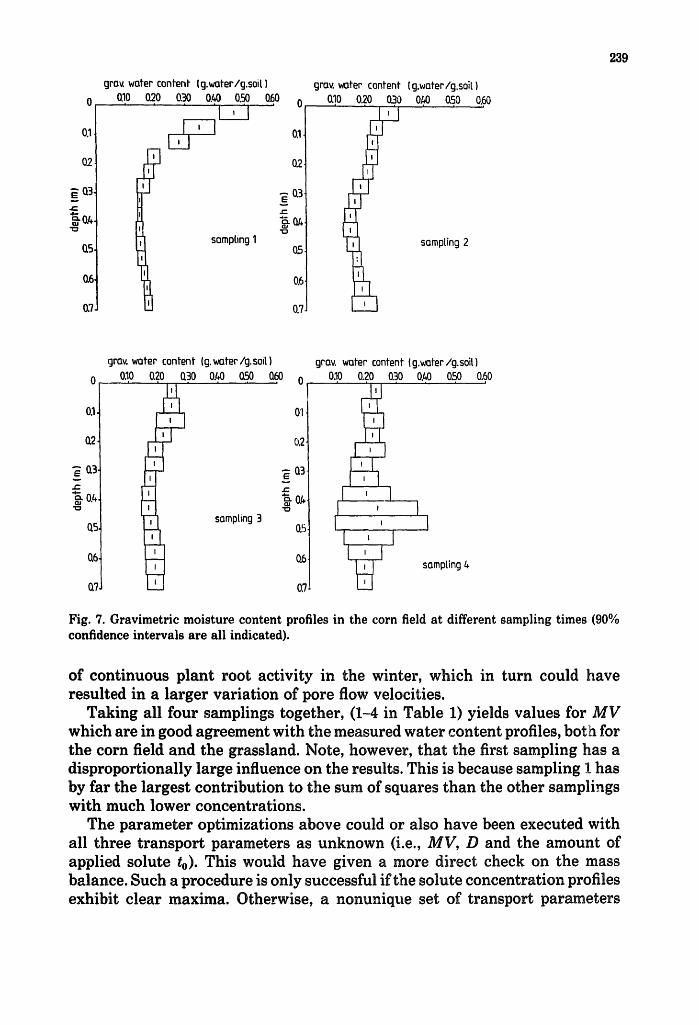
Fig. 7. Gravimetric moisture content profiles in the corn field at different sampling times (90% confidence intervals are all indicated).
of continuous plant root activity in the winter, which in turn could have resulted in a larger variation of pore flow velocities.
Taking all four samplings together, (1-4 in Table 1) yields values for MV which are in good agreement with the measured water content profiles, both for the corn field and the grassland. Note, however, that the first sampling has a disproportionally large influence on the results. This is because sampling ! has by far the largest contribution to the sum of squares than the other samplings with much lower concentrations.
The parameter optimizations above could or also have been executed with all three transport parameters as unknown (i.e., MV, D and the amount of applied solute to). This would have given a more direct check on the mass balance. Such a procedure is only successful if the solute concentration profiles exhibit clear maxima. Otherwise, a nonunique set of transport parameters
Q2.
e 0.3, .= ~0.4
0.5.
Q6.
0.7,
gray woter content (g.woter/g, soil) o.lo 0.20 0.30 o.~,o o.s,o 0.60
| | i
sompling I
[ , I ' I
I ' I '
0.1.
0.2
[ ~ 0.3
' I ~ 0.,.,. I _I 0.5.
I I D I 0.6.
grov. wofer content (g.woter/g.soit ) 0.10, (120, 0.30, 0.~ 0.50 0.60
~ , sompting 2
I , I Lr ,-q _
t " II
't '
' I , ' I
' I
0.1.
0.2.
- - 03 E
z :
~. 0.~,
0.5
0.6.
0.7.
grov. woter content (g.woter/g. soil ) 0.I0 0.20 030 0.~ 0.50 (160 A
i i i i i , U t,I I I 0,1 ~~ sampling 3
- 0.2
I , I I ' 1 g a3. L I = ~ 0.4,
ttl (16
~ ] 0.7
grov. woter con~enf (g.woter / g.soi[ ) 0.10 0.20 0.30 0.~ 0.50 0.60
I m I I | . . I .
I
[l ,
sompLing/+
I I
I
I I J
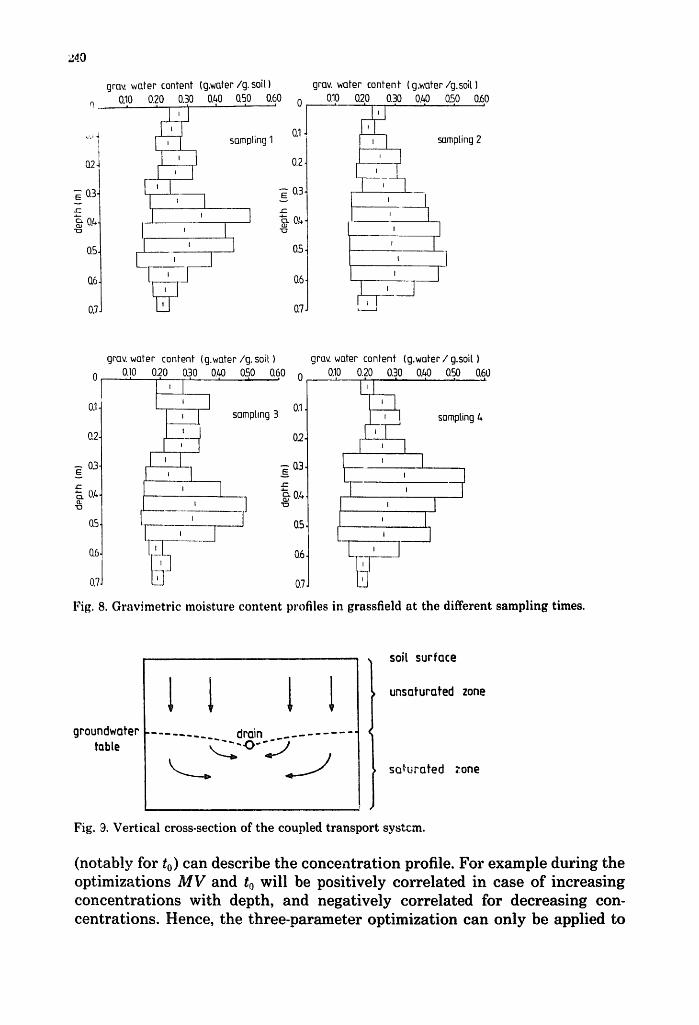
Fig. 8. G r a v i m e t r i c m o i s t u r e c o n t e n t prof i les in g ra s s f i e ld a t t he d i f f e r en t s a m p l i n g t imes.
groundwoter toble
soil surfoce
unsoturofed zone
sa,~urofed zone
Fig. 9. Vertical cross-section of the coupled transport systcm.
(notably for to) can describe the concentration profile. For example during the optimizations MV and t0 will be positively correlated in case of increasing concentrations with depth, and negatively correlated for decreasing con- centrations. Hence, the three-parameter optimization can only be applied to

TABLE 2
Mass balance results as based on data from the first sampling time
241
Convection dispersion equation
M V (-) • (mm) to (mm) Mass balance
L a n d use: corn
331 36 4.398 0.977
~and use: permanent grass land
741 101 3.812 0.847
?egional stochastic model
:MV~ (-) • (ram) aln{MV} Mass balance
Land use: grassland
?.61 92 0.210 0.812
the first sampling time when a distinct maximum is present. Results for this case are given in Table 2; they show relatively good mass recoveries. Velocities and dispersivities agree quite well with those found earlier, especially for the corn field.
R S M results
Parameter estimation results for the regional stochastic model (XSM) are presented in Table 3. Optimizations in this case were carried out for three transport parameters P~ncMV), aln{MV) and ~, instead of two as was done for the CDE model. A mass balance check was also made, similarly as for the CDE. Some results have been omitted since gin{My) at times converged towards zero during the optimization procedure, thus giving the same values of the transport parameters as the CDE optimization. Most values of the average pore water velocity- (MV) are somewhat higher than those calculated with the convec- tion-dispersion approach. The velocities calculated for the second sampling are again remarkably higher than the others. The mass balance checks generally showed a substantial decrease in the sum of squares when the amount of applied bromide (to) was also optimized. This amount was always less than the actually applied amount (4.5ram x 2.55g1-1 = l l .48gBr- m-2), thus resulting in mass balances of less than 100%.
A direct check on the mass balance was only carried out for the first sampling for the grass, again resulting in the relatively low recovery of 81.2% (Table 2). No explanation for this low recovery could be found.

242
TABLE 3
Parameter estimation results for the regional stochastic model
Sampiing Number of ~MV) (-) ~ (mm) #ln~Mv~ Mass number observations balance
Land use: corn
1 14 . . . . 2 14 8.26 64 0.651 0.65 3 14 4.71 33 0.457 0.801 4 14 . . . . 1-4 56 4.~ 15 0.411 0.748 1,3,4 42 3.53 33 0.186 0.917 2,3,4 42 6.42 46 0.607 0.665
Land use: grassland
1 14 3.85 85 9.303 0.779 2 14 20.03 0.2 1.010 0.352 3 14 . . . . 4 14 5.97 70 0.647 0.628 1-4 56 4.71 61 0.521 0.651 1,3,4 42 3.70 103 0.300 0.825 2,3,4 42 8.85 33 0.840 0.463
Statistical properties of the transport parameters
The transport parameters were also determined for every vertical concentra- tion profile separately, using a two.parameter fit for MV and D for the CDE (Table 4). The resulting distributions of velocities and dispersivities of the CDE optimization process were again tested for normality and log-normality by the Kolmogorov-Smirnov, Cramer-Von Mises and Shapiro-Wilk tests. In some cases we could not discriminate between these distributions as often noither the normal, the lognormal, or both, were found to be acceptable. This is indicated with a question mark in Table 4. The tab!e also shows correlations between MV and D, and between ln(MV) and ln(D). The values for (MV) assume a log-normal distribution of MV as based on eqn. (5). Correlations are often close to one, with some exceptions.
Linear relations between V and D assuming zero intercepts are presented in Table 5. If the intercept was not set equal to zero, the regression line would have crossed the D-axis often at values below the origin, which is physically not correct. Table 5 shows that very high values of the dispersivity will occur when the power of the velocity in eqn. (5) is set equal to one, as is often assumed in the literature.
The calculated values for ~MV) and ~ln~Mv~ (Table 4) at samplings 2 and 3 (corn) and 2 and 4 (grass) corresponded rather well with the values as determined from the field-averaged profiles (Table 3) and the RSM parameter

TABLE 4
Statist ical properties of the fitted t ransport parameters
243
Sampling Number of observations
Distribution of M V Distribution cf D
Land use: corn
I I0 normal log-normal 2 I0 log-normal ? 3 10 log-normal log-normal 4 10 ? log-normal 1-4 40 9 9
Correlation between MV-D
1 10 -0.194 2 10 0.993 3 10 0.933 4 10 0.997 1-4 40 0.915
( M V ) (-)
Correlation between ln(MV)- ln(D)
0.045 0.844 0.900 0.969 0.861
O'in(MV)
1 10 3.04 0.358 2 10 7.55 0.906 3 10 4.51 0.506 4 10 8.67 1.096 1-4 40 5.49 0.778
Land use: permanent grass
Distribution of M V
1 I0 ? 2 10 log.normal 3 10 log.normal 4 10 ? 1-4 40 ?
Correlation between M V - D
Distribution of D
log.normal log-normal log-normal log-normal log.normal
Correlation between ln(MV)- ln(D)
1 10 0.111 0.490 2 10 0.806 0.957 3 10 0.921 0.720 4 10 0.925 0.865 1-4 40 0.831 0.024
( M ~ (-) ~71n{M V )
1 10 3.06 0.467 2 10 14.89 1.202 3 10 4.38 0.614 4 10 5.16 0.560 1-4 40 5.90 0.819

244
T A B L E 5
Re la t i ons b e t w e e n t h e f i t ted d i s p e r s i o n coeff icient a n d t h e loca l r e l a t i v e po re w a t e r ve loc i t y
S a m p l i n g N u m b e r of D -- • M V D = • ( M V ) ~
o b s e r v a t i o n s
L a n d use: corn
1 10 D = 4 6 . 9 M V D = 70.1 M V °'14
2 10 D = 758 M V D = 10.2 M V TM
3 10 D = 309 M V D = 3 . 3 7 M V 2"~
4 10 D = 3770 M V D = 7 . 4 6 M V 249
1-4 40 D = 2870 M V D = 8 . 3 6 M V 223
L a n d use: p e r m a n e n t g r a s s l a n d
1 10 D = 182 M V
2 10 D = 1520 M V
3 10 D = 452 M V
4 10 D -- ~27 M V
1-4 4O D = 1 3 8 0 M V
D = 82 M V L23 D = 18.9 M V z15
D = 22.3 M V 2"1°
D = 16.1 M V 2"~
D = 523 M V °'°e
estimation process. Note that in the latter case, the effect of dispersion has been omitted, so that the results are not quite comparable. However, if we assume that the effect of dispersion is negligible with respect to the variability in the velocity as characterized by a~n~MV), then the comparison is justified.
We concluded that both the convection-dispersion equation and the region- al.stochastic model describe the field data reasonably well. Because of the surprisingly large local variations across a seemingly quite homogeneous and small area, a definite preference for one of the two models cannot be established from the available data. On the other hand, the CDE, performs somewhat better than the RSM in terms of the mass balance accuracy. Therefore, in the following we will only use the CDE description of the processes in the un- saturated zone.
Samples of the saturated zone
When the field tracer experiment was first initiated we planned to construct two-dimensional contour maps of the measured groundwater bromide con- centrations perpendicular to the drain, and to hopefully use the plots for discerning information about the transport of bromide along streamlines towards the drains. Unfortunately, groundwater samples withdz.awn from the microfilters installed at different depths in the aquifer yielded such an erratic concentration pattern that any attempt to analyze them in terms of the above objective was judged to be useless. We were also unable to clearly deduce the presence of a base flow in the saturated zone from the measured solute con- centrations, especially under the corn field. Still, as expected, concentrations at greater depths tended to increase somewhat with time during the

245
experiment. The large variability of the measured groundwater concentrations may be attributed to a large variability in the permeability of the aquifer at the scale of the sampling program, a feature which was recently described by Sudicky (1986), and/or to irregular bromide solute fluxes across the catchment from the unsaturated zone into the groundwater system.
Drainage water sampling and coupled breakthrough curves
Figure 10 shows the measured concentration distribution of the drainwater. The plot reflects the behavior of the coupled unsaturated-saturated transport system upon an instantaneous input of bromide across the catchment area. Careful analysis of this showed that about 53% of the total amount of applied bromide was recovered during the first 6 months of the experiment.
Having determined the parameters of the two transport models for solute transport in the unsaturated zone, and assuming that transport in the saturated zone obeys eqn. (7), it should be possible to predict the bromide concentration of the drainage water as a function of the drain discharge. The calculation procedure is schematically shown in Fig. 9, which gives a vertical cross section of the coupled unsaturated-saturated transport system perpen- dicular to the drain. The input concentration as a function of the amount (mm) of drain discharge for the saturated transport system is obtained by calculating the breakthrough curve from the unsaturated zone at the groundwater table. In this case, flux concentrations as defined by Parker and Van Genuchten
J
0
Z 0 o , . - , , l id I . - - -
n," o i . i . .
Z ~ W~ 0 Z o o d C.3
o.
I"M
PREDICTED/MEASURED BTCs MFASURED BTC
oPREDICTED FROM T2 0PREDICTED FROM T4 ~PREDICTED FROM T2 ,T3 ,T4 +PREDICTED FROM T; - 4
• 6 0 . 0 9 0 . 0 1 2 0 . 0 1 5 0 . 0 1 8 0 . 0 2 1 0 . 0 2 4 0 . 0 2 7 0 . 0 3 0 0 . 0 330 0 3 0 0 . 0
DRAIN DISCHARGE (MM)
Fig. 1O. Measured and predicted drain effluent BTC's using the fitted unsaturated solute transport parameters.

246
(1984b) were used, and not the resident concentrations employed in the p~rameter estimation process of the unsaturated transport models. The con- centration of the drainage water was obtained by numerically evaluating the convolution integral of the time-dependent input concentration with the proposed impulse response for the saturated transport system. Because the thicknesses of the unsaturated and saturated zones were not constant along the drain, the concentration of the drain water was calculated as the average solute concentration of twenty equally-spaced locations, each having its own coupled transport system. The breakthrough curve for a certain location along the drain then depends on land use, the thickness of the unsaturated zone, the thickness of the saturated zone, and its water content. The thickness of the unsaturated zone at a given location could be equate~, to the drain depth, except that piezometric observations during winter indicated that the un- saturated zone was about 10 to 20cm less. This correction i~creased the thickness of the saturated zone as well.
The liquid-filled porosity of the aquifer was determined from soil samples taken from the deepest layers (about 110 cm below the soil surface) exposed in ten profile pits; from measured dry bulk densities, the mean porosity was estimated to be 0.33; this value will be used in all subsequent calculations.
Figure 10 compares the measured breakthrough curve (I~TC) with four predicted curves which were chosen such that the full range of transport velocities as determined by CXTFXT was considered, including the highest velocities for sampling 2, and the lowest velocity resulting from the simul. taneous fit of all four samr~ing times. The simultaneous fit considerably un- derestimated the drain wa~er concentrations, especially at early times, e v e n
though the MV values were in good agreement with the measured soil water contents, while at the same time the dispersivity ~ agreed well with literature values. The predicted BTC based on the combined fit of samplings 2, 3 and 4 shows a slightly better fit although the breakthrough still starts too early, and the concentrations are still too low after about 120 mm of drain discharge. The fastest BTC obtained for sampling 2 considerably overestimates the drain water concentrations up to about 130ram of discharge, after which value the concentrations are being somewhat underestimated.
From Fig. 10 we conclude that solute transport in this soil system cannot be described adequately by assuming one average water flow velocity for the entire unsaturated zone. We believe that preferential flow may have caused some of the observed discrepancies.
Although solute transport in the topsoil was described qv.ite well with the CDE, we speculate that at a certain depth water flow co~ld have becof~e unstable, causing water to flow downwards along preferential flow paths (Glass et el., 1987). This type of preferential flow would result i~ an accelerated transport through the subsoil. Thus, "slow" transport in the topsoil may have been followed by relatively "fast" transport in the subsoil, thus resulting in a BTC that fits the measured data better.
Given the above considerations, we tried to predict the drain efIluent curve

247
by assuming a layered soil profile consisting of a uniform topsoil characterized by relatively slow bror.lide transport, and a more heterogeneous subsoil with relatively fast transport caused by some type of shortcircuiting. Transport in this layered system wa'.: calculated with a numerical finite element solution (Van Genuchten, 19~;) of the steady-state transport equation for layered profiles. For transport in the topsoil we used the fitted parameter values as listed in Table I for sampling 1. However, transport velocities for the subsoil were calculated from the fitted MV value of the second sampling. Since MV for this second sampling also included the residence time of the tracer in the topsoil, its value was corrected accordingly to yield a relative pore water velocity MV of 7.21 for the subsoil of the corn field, and 11.6 for the grass field. Dispersivities were assumed to be the same as for the first sampling time.
The BTC obtained in this way is shown in Fig. 11. The curve was found to be rather insensitive to changes of +/- 5 cm in the thickness of the topsoil; hence only the BTC for a topsoil of 25 cm is presented. Close examination of Fig. 11 shows that the peak concentration after about 159mm discharge is still somewhat underestimated but in general the measured BTC is predicted sur- prisingly well. Thus we conclude that the assumption of accelerated transport in the subsoil is justified. It still remains an open question, whether the transport parameters from the second, third and fourth samplings have a physical basis, or should be considered as a set of parameters describing fast breakthrough only.
o; oO IM
~ ' . t",d __1
Z ~
i , - . ,
I , - - - -
r f o I - - - • Z c ~
C.~ Z o
°i i CJ
. I L j " 30.0
/ PREDICTED/MEASURED BTC MEASURED BTC
• PREDICTED BTC
J J l I I I i I i l i I I I m I t~--.~ I , ~ I I , i I I I I ' ! l J I I z ~
60.0 90.0 120,0 150.0 180.0 210-0 240,0 270.0 300,0 ,330.0 ,360,0
DRAIN DISCHARGE (MM)
Fig. 11. Measured and the predicted drain effluent bTC using a numerical model for a layered soil system.

248
Additional evidence of accelerated (preferential) transport in the subsoil can be found in the literature, especially in cases where a fine-textured layer overlies a coarse-textured horizon. Starr et al. (1978, 1986) found similar results for field measurements, while Glass et al. (]987) showed this fingering phenomenon to be present during elaborate laboratory experiments. The occurrence of preferential flow in our study is indirectly supported by: (1) the presence of a textural change from a low permeable topsoil to a more permeable subsoil at approximately 25 cm depth (see Materials and Methods), which may cause unstable wetting fronts (Raats, 1973), and thus contribute to preferential flow even during wet conditions (Glass et al., 1987); and (2) the presence 9f water repellent layers throughout the profile; as shown by Hendrickx et al. (1988), these layers can also trigger the formation of preferential flow paths.
Experimental evidence of the presence of preferred flow zones in this field was further presented by Van Ommen et al. (1989, this volume), who were able to visualize these zones by means of a iodide-starch color technique described in Van Ommen et ai. (1988).
SUMMARY AND CONCLUSIONS
Transport of a nonreactive tracer (bromide) was studied in an unsaturated- saturated transport system. Two models were used to describe unsaturated transport: the convection--dispersion equation (CDE) and a regional stochastic model (RSM). Both transport models could describe the observed data reasonably well, although the CDE model performed slightly better in predicting the amount of recove~,ed bromide.
Solute migration velocities and dispersivities for transport in the topsoil generally agreed well with measured water contents and dispersivity values found in the literature. In the subsoil, however, transport velocities were not in agreement with observed water contents, especially for the grassfield. The accelerated breakthrough of the subsoil was probably caused by preferential flow (shortcircuiting) originating at the transition between topsoil and subsoil.
Using measured tracer concentration distributions for the unsaturated zone, the drain water quality could be predicted accurately only when the effects of fast transport in the subsoil was accounted for in the unsaturated-saturated transport system.
ACKNOWLEDGEMENTS
The experimental and theoretical objections of this study could only be realized thanks to the much-appreciated inputs by Mr. Stricker, Mr. Post, Mr. van den Abeele and Mr. Beem of the Agricultural University Wageningen; Mr. Verstrate of the Institute fur Inland Water Management and Waste Water Treatment; Mr. van der Plicht and Mr. De Klein of the Water Quality Control Service East-Gelderland; and Mr. Reijnders and Mr. Neele of the National Institute of Public Health and Environmental Hygiene. We would like to

249
acknowledge also the Province of Gelderland and the Institute for Inland Water Management and Waste Water Treatment for financially supporting the project, and Mr. Veehof and Mr. Beusink for their permission to use their fields during the experiment. Finally, Mr. Hopmans is acknowledged for his comments on the manuscript, and Mrs. Arissen for typing and editing the draft versions of the paper.
REFERENCES
Amoozegar-Fard, A., Nielsen, D.R. and Warrick, A.W., 1982. Soil solute concentration distribu- tions for spatially varying pore water velocities and apparent diffusion coefficients. Soil Sci. Soc. Am., J., 46: 3-9.
Anderson, M.P., 1979. Using models to simulate the movement of contaminants through ground- water flow systems. Dep. Geol. Geophys., University of Wisconsin, Madison, Wisc., CRC Critical Reviews in Environmental Control, pp. 97-156.
Beese, F. and Wierenga, P.J., 1983. The variability of the apparent diffusion coefficient in undis- turbed soil columns. Z. Pflantzenernaehr. Bodenk., 146: 302-3!5.
Biggar, J.W. and Nielsen, D.R., 1976. Spatial variability of the leaching characteristics of a field soil. Water Resour. Res., 12(1): 78-84.
Bowman, R.S., 1984. Evahiation of some new tracers for soil water studies. Soil Sci. Soc. Am., J., 48: 987-993.
Bowman, R.S. and Rice, R.C., 1986. Transport of conservative tracers in the field under intermittent flood irrigation. Water Resour. Res., 22(11): 1531-1536.
Bresler, E. and Dagan, G., 1979. Solute dispersion in unsaturated heterogeneous soil at field scale: II. Applications. Soil Sci. Soc. Am., J., 43: 467-472.
Bresler, E. and Dagan, G., 1981. Convective and pore scale dispersive s~lute transport in un- saturated heterogeneous fields. Water Resour. Re 3. 17(6): 1688-1993.
Bresler, E. and Dagan, G., 1983a. Unsaturated flow in spatially variable fields. 2. Application of water flow models to various fields. Water Resour. Res., 19(2): 421-428.
Bresler, E. and Dagan, G., 1983b. Unsaturated flow in spatially variable fields. 3. Transport models and their application to two fields. Water Resour. Res., 19(2): 429-435.
Bruyn, J., 1984. Groundwater quality - manuring: problems with nitrate in East-Gelderland. H20, 17:502 (in Dutch).
Cassel, D.K., Van Genuchten, M.Th. and Wierenga~ P.J., 1975. Predicting anion movement in disturbed and undisturbed soils. Soil Sci. Soc. Am., Proc., 39: 1015-1019.
Dagan, G., 1986. Statistical theory of groundwater flow and transport, pore to laboratory, laboratory to formation, and formation to regional scale. Water Resour. Res., 22(9): 120S-134S,
Dagan, G. and Bresler, E., 1979. Solute dispersion in unsaturated heterogeneous soil at fie!el scale: I. Theory. Soil Sci. Soc. Am., J, 43: 461-467.
Dagan, G. and Bresler, E., 1983. Unsaturated flow in spatially variable fields 1. Derivation of ~.aodels of in£1tration and redistribution. Water Resour. Res., 19(2): 413-420.
Danckwerts, P.V., 1953. Continuous flow systems: distribution of residence times. Chem. Eng. Sci., 2: 1-17.
Dane, J.H., Reed, R.B. and Hopmans, J.W., 1986. Estimating soil parameters and sample size by bootstrapping. Soil Sci. Soc. Am. J., 50: 283-287.
Eldor, M. and Dagan, G., 1972. Solutions of hydrodynamic dispersion in porous media. Water Resour. Res, 8(5): 1316-1331.
Ernst, L.F., 1973. The determination of residence times in case of saturated groundwater flow. Nota 755 !.C.W., "rst. Land Water Manage. Res., Wageningen, 42 pp. (in Dutch).
Funk, W.H, 1987. Water quantity and quality: the growing crisis. Washington's Land and People, Vok 1 (1): 5-7.
Gelhar, L.W. and Wilson, J.L., 1974. Groundwater quality modeling. Ground Water, 12: 399-408.

250
Glass, R.J,, Parlange, J.-Y. and Steenhuis, T.S., 1987. In: Yu-Si Fok (Editor), Infiltration Develop. ment and Application. Proc. Int. Conf. Infiltration Dev. Appl., pp. 66-81.
Groenendijk, P.: 1986. Onderzoek naar de effecten van wateraanvoer en peilveranderingen in agrarische gebieden op de waterkwaliteit in natuurgebieden. Deel 2: Modellering van twee. dimensionaal transport van een conservatieve stof in de verzadigde zone. Nota ICW 1736, 38 pp.
Hendrickx, J.M.H., Dekker, L.W., Bannink, M.H. and Van Ommen, H.C., 1988. Significance of soil survey for agrohydrological studies. Agric. Water Manage., 14: 195-208.
Jury, W.A., 1982. Simulation of solute transport using a transfer function model. Water ~¢sour. Res., 18(2): 363--368.
Jury, W.A., Sposito, G. and White, R.E., 1986. A transfer function model of solute transport through soil 1. Fundamental concepts. Water Resour. Res., 22(2): 243-247.
Lindstrom, F.T., Hague, R., Freed, V.H. and Boersma, L., 1967. Theory on the movement of some herbicides in soils: linear diffusion and convection of chemicals in soil. Environ. Sci. Tech., 1: 562-565.
Neele, J., 1988. Ion-chromatographic determination of bromide in soil water extracts and ground- water. I~.tern. Rep., Natl. Inst. Public Health Environ. Hygiene, Bilthoven (in prep.).
Nielsen, D.R. and Biggar, J.W., 1962. Miscible displacement: III. Theoretical considerations. Soil Sci. So::. Am., Proc., 26: 216-221.
Nielsen, D.R., Van Genuchten, M.Th. and Biggar, J.W., 1986. Water flow and solute transport processes in th~ unsaturated zone. Water Resour. Res., 22(9): 89S-108S.
Par~er, J.C. and V~.~ Genuchten, M.Th., 1984a. Determining transport parameters from laboratory and field tracer experiments. Va. Agric. Exp. Stn. Bull., 84-3, 96pp.
Parker, J.C. and Van Genuchten, M.Th., 1984b. Flux-averaged and volume.averaged concentra- tions in continuum approaches to solute transport. Water Resour. Res., 20(7): 866-872.
Raats, P.A.C., 1973. Unstable wetting fronts ir uniform and non-uniform soils. Soil Sci. Soc. Am., Proc., 37: 681-685.
Raats, P.A.C., 1983. Responses of hydrological systems to ~hanges in water quantity and quality. Relatiov of groundwater quantity and quality. Proc. Hamburg Syrup., IAHS Publ. No. 146.
Rao, P.V., Rao, P.S.C., Davidson, J.M. and Hammond, L.C., 1979. Use of goodness-of-fit tests for characterizing the spatial variability of soil properties. Soil Sci. Soc. Am., J., 43: 274-278.
Richter, G. and Jury, W.A., 1986. A microlysimeter field study of solute transport through a
structured sandy loam soil. Soil Sci. Soc. Am., J., 50: 863-868. Schulin, R., Wierenga, P.J., Fl~ihler, H. and Leuenberger, J., 1987a. Solute transport through a
stony soil. Soil Sci. Soc. Am., J., 51'. 36-42, Schulin, R., Van Genuchten, M.Th., Fliihler, H. and Ferlin, P., 1987b. Experimental and theoretical
analysis of solute transport in a stony field soil. Water Resour. Res., 23(4): 1785-1794. Shapiro, S,S, and Wilk, M.B., 1965, An analysis of variance test for normality (complete samples).
Biometrika, 52: 591-611. Sposito, G., Jury, W.A. and Gupta, V.K., 1986. Fundamental problems in the stochastic convection-
dispersion model of solute transport in aquifers and field soils. Water Resour. Res., 22(1): 77-88. Starr, J.L., DeRoo, H.C., Frink, C.R. and Parlange, J.-Y., 1978. Leaching characteristics of a
layered field soil. Soil Sci. Soc. Am., J., 42: 386-391. Starr, J.L., Parlange, J.-Y. and Frink, C.R., 1986. Water and chloride movement through a layered
field soil. Soil Sci. Soc. Am., J., 50: 1384-1390. Studygroup Hupselse Beek, 1974. Third report of the hydrologic research in the catchment of the
Hupselse Beek. Dep. Hydraul. Catchment Hydrol., Agric. Univ., Wageningen. Sudicky, E.A., 1986. A natural gradient experiment on solute transport in a sand aquifer: Spatial
variability of hydraulic conductivity and its role in the dispersion process. Water Resour. Res., 22(13): 2069-2082.
Van Genuchten, M.Th., 1986. A numerical model for water and solute movement in and below the root zone. Model description and user manual. Unpubl. Res. Rep., U.S. Salinity Lab., USDA/ ARS, Riverside, Calif.
Van Ommen, H.C., 1985. Systems approach to a coupled unsaturated/saturated groundwater quality model, including adsorption, decomposition and bypass. Agric. Water Manage., 10:

251
193-203. Van Ommen, ~.C., 1986. Influence of diffuse sources of contamination on the quality of outflowing
groundwater including non-equilibrium adsorption and decomposition. J. Hydrol., 88" 79-95. Van Ommen, H.C., Dekker, L.W., Dijksma, R., Hulshof, J. and Van der Molen, W.H., 1988. A new
technique for evaluating the presence of preferential flow paths in non.structured soils. Soil Sci. Soc. Am., J., 52: 1192-1193.
Van Ommen, H.C., Dijksma, R., Hendrickx, J.M.H., Dekker, L.W., Hulshoff, J. and Van den Heuvel, M., 1989. Experimental assessment of preferential flow paths in a field soil. J. Hydrol., 105: 253-262 (this volume).
Van de Pol, R.M., Wierenga, P.J. and Nielsen, D.R., 1977. Solute movement in a field soil. Soil Sci. Soc. Am., J., 41: 10-13.
Van der Veen, C., 1986. Tsjernobyl and drinking water supply. H20, 19: p. 266. (in Dutch). Warmerdam, P.M.M., 1981. Effect of wind on rainfall measurement. Comparison of raingauges.
H20, 14: p. 16 (in Dutch). Wierenga, P.J., 1977. Solute distribution ]~rofiles computed with steady state and transient water
movement models. Soil Sci. Soc. Am. J., 41: 1050-1055. W~sten, J.H.M., Bouma, J. and Stoffelsen, G., 1985. Use of Soil Survey data for regional soil water
simulation models. Soil Sci. Soc. Am., J., 49: 1238-1244.