journal of hydrology - uc santa cruzafisher/cvpubs/pubs/russo2012_jh... · journal of hydrology ......
TRANSCRIPT
Journal of Hydrology 432–433 (2012) 98–111
Contents lists available at SciVerse ScienceDirect
Journal of Hydrology
journal homepage: www.elsevier .com/locate / jhydrol
Improving riparian wetland conditions based on infiltration and drainagebehavior during and after controlled flooding
Tess A. Russo a,⇑, Andrew T. Fisher a, James W. Roche b
a Department of Earth and Planetary Sciences, University of California, 1156 High St., Santa Cruz, CA 95064, United Statesb Resources Management and Sciences Division, Yosemite National Park, 5083 Foresta Rd., P.O. Box 700, El Portal, CA 95318, United States
a r t i c l e i n f o s u m m a r y
Article history:Received 3 June 2011Received in revised form 13 December 2011Accepted 9 February 2012Available online 20 February 2012This manuscript was handled by PhilippeBaveye, Editor-in-Chief, with the assistanceof Peter Wolfgang Swarzenski, AssociateEditor
Keywords:Wetland hydrologyControlled floodRestorationVS2DH
0022-1694/$ - see front matter � 2012 Elsevier B.V. Adoi:10.1016/j.jhydrol.2012.02.022
⇑ Corresponding author.E-mail address: [email protected] (T.A. Russo).
We present results of an observational and modeling study of the hydrologic response of a riparian wet-land to controlled flooding. The study site is located in Poopenaut Valley, Yosemite National Park (USA),adjacent to the Tuolumne River. This area is flooded periodically by releases from the Hetch Hetchy Res-ervoir, and was monitored during one flood sequence to assess the relative importance of inundation ver-sus groundwater rise in establishing and maintaining riparian wetland conditions, defined on the basis ofa minimum depth and duration of soil saturation, and to determine how restoration benefits might beachieved while reducing total flood discharge. Soil moisture data show how shallow soils were wettedby both inundation and a rising water table as the river hydrograph rose repeatedly during the controlledflood. The shallow groundwater aquifer under wetland areas responded quickly to conditions in the adja-cent river, demonstrating a good connection between surface and subsurface regimes. The observed soildrainage response helped to calibrate a numerical model that was used to test scenarios for controlledflood releases. Modeling of this groundwater–wetland system suggests that inundation of surface soilsis the most effective mechanism for developing wetland conditions, although an elevated water tablehelps to extend the duration of soil saturation. Achievement of wetland conditions can be achieved witha smaller total flood release, provided that repeated cycling of higher and lower river elevations is timedto benefit from the characteristic drainage behavior of wetland soils. These results are robust to modestvariations in the initial water table elevation, as might result from wetter or dryer conditions prior to aflood. However, larger changes to initial water table elevation, as could be associated with long term cli-mate change or drought conditions, would have a significant influence on wetland development. Anongoing controlled flooding program in Poopenaut Valley should help to distribute fine grained overbankdeposits in wetland areas, extending the period of soil water retention in riparian soils.
� 2012 Elsevier B.V. All rights reserved.
1. Introduction
Wetlands provide essential environmental functions such aswater quality improvement, carbon sequestration, nutrient cyclingand biodiversity support (Brinson et al., 1981; Turner, 1991;Whiting and Chanton, 2001). More than 50% of the world’s wet-lands have been damaged or destroyed as a result of urbanization,agricultural development, reconfiguration of water ways, and othermanipulation of the natural landscape (Barbier, 1993). Californiahas lost 90% of its wetlands in the last 200 years, more than anyof the other United States (Dahl, 1990), comprising a massivereduction in aquatic habitat area, a driving force for soil transfor-mation (Ballantine and Schneider, 2009), and a significant releaseof nutrients into the environment (Orr et al., 2007). Because wet-lands have high ecosystem, economic and hazard mitigation value
ll rights reserved.
(Costanza et al., 1997), restoration projects are increasingly com-mon. Riparian wetlands (located adjacent to rivers and streams)are particularly vulnerable to modification by human activities be-cause these wetlands are readily influenced by subtle changes inevent and seasonal hydrographs related to channel modification,changes in land use and climate, and the construction of damsand other structures that regulate flow.
Different approaches have been applied to achieve wetland res-toration goals, depending on the physical, biological and hydro-logic setting, characteristics of available water, extent oflandscape manipulation needed, and other factors. Some wetlandrestoration projects have focused on benefiting a small numberof endangered or other species (Mahoney and Rood, 1998; Boveeand Scott, 2002), whereas other projects have assessed wetlandconditions on the basis of broader ecological metrics such asspecies diversity or total species cover (Bendix, 1997; Brock andRogers, 1998; Johansson and Nilsson, 2002; Capon, 2003;Siebentritt et al., 2004). Another approach is to attempt restoration

T.A. Russo et al. / Journal of Hydrology 432–433 (2012) 98–111 99
of natural hydrologic dynamics, with the idea that native biomesthat are adapted to pre-development conditions will be able tomake rapid progress towards recovery once hydrologic restorationis achieved (Bayley, 1995; Schiemer et al., 1999; Ward et al., 2001).This approach can be challenging because it requires that restora-tion projects be designed around a process-based understanding ofwetland function, including complex links between hydrologic,biological, and soil conditions and function. In cases where the lossof wetlands has taken place over many years, there may be a lackof baseline information regarding fundamental system propertiessuch as fluid flow pathways, residence times, and typical durationof inundation.
We present results of a study conducted as part of a long-termriparian wetland restoration project associated with controlledflooding downstream from a water supply dam and reservoir. Thisproject, a riparian wetland on a dammed river, is particularly chal-lenging because of the need to simultaneously satisfy environmen-tal and municipal needs. The site is in an area that is highlysensitive to ongoing and projected future climate change, and isdifficult to access to set up instrumentation and collect data andsamples prior to controlled flood events. All wetland restoration ef-forts are unique, but many of the characteristics present in thework site described in this study are also found in other wetlandsundergoing restoration, as discussed below.
Dams influence discharge on 77% of the rivers in the northernthird of the world (Dynesius and Nilsson, 1994), and there is sim-ilarly extensive river regulation in Latin America, Africa and South-East Asia (Revenga et al., 2000). In general, dams are designed spe-cifically to regulate downstream flow, often resulting in reductionsin the number, timing, and magnitude of high flow events, andreducing the variability of channel discharge in general (Graf,1999). Dams also change the sediment capacity and load of down-stream rivers; modify patterns of sediment supply, erosion, andchannel morphology; and impact river temperature and nutrientand carbon contents (Kondolf, 1997; Brandt, 2000; Nilsson andBerggren, 2000). All of these modifications have ecosystem im-pacts, but riparian wetlands are especially vulnerable because theirpresence may depend on all of the factors listed above. Thus therestoration of riparian wetlands downstream from dams is a par-ticularly important and vexing challenge.
Riparian wetlands and floodplain habitats are sensitive to thetiming and extent of inundation. In some cases, groundwater canprovide a significant fraction of the water that maintains shallowsoil saturation in these systems (Brunke, 2002), but the relativeinfluence of surface inundation versus groundwater inflow hasrarely been quantified. The connectivity between shallow ground-water and wetland soils depends on sediment characteristics andunderstory growth, and may be correlated to physical river fea-tures such as backflow channels and oxbow lakes (Cabezas et al.,2008). Given uncertainties in the relative importance of surfacewater and groundwater in natural riparian wetland systems, it isnot surprising that setting hydrologic goals for restoration can bedifficult.
As an added complication in this study, the field site is locatedon the western side of the central Sierra Nevada mountains, wes-tern United States, in an area undergoing significant hydrologictransformation as a result of regional and global climate change.Recent climate modeling predictions suggest that much of thesnow pack that accumulates annually in the Sierra Nevada moun-tains will fall as rain rather than snow by the year 2100 (Snyderand Sloan, 2005; IPCC, 2007). This will change the timing and mag-nitude of wet-season runoff events, in both unregulated basins andbasins where discharge is controlled by dams. Changes in the dis-tribution of the annual runoff hydrograph in many basins will im-pact the availability of environmental flows and water supplies formunicipal, agricultural and industrial purposes, and it is essential
to learn how controlled flood releases can be used efficiently forthe benefit of ecosystems and stakeholder communities so as toachieve the most benefit from limited resources.
Two primary questions are addressed through this study: (1)What are the relative roles of groundwater and surface water indeveloping and maintaining riparian wetland conditions duringand after a controlled flood, and how might these roles change un-der varying antecedent groundwater conditions? (2) How canriparian wetland conditions be improved while simultaneouslylimiting the total amount of water released during controlledfloods? These questions are addressed through a study comprisingthree main components: (a) quantitative observations of riparianwetland response to a controlled flood, (b) use of these data to cal-ibrate a variably-saturated model of wetland soil and groundwaterdynamics, and (c) application of the calibrated model to scenariosof controlled flooding that could achieve a similar wetland benefitas part of a smaller total reservoir release. For the purposes of thisstudy, we follow an established riparian wetland definition that in-cludes riverine wetlands and palustrine wetlands (emergent,scrub-shrub and forested) (Cowardin, 1978). We use the US ArmyCorps of Engineers (USACEs) wetland delineation definition,requiring saturation within 30 cm of the surface for 14 consecutivedays, five out of every ten years (US Army Corps of Engineers,2008). This metric is somewhat arbitrary, but it is widely applied,provides a clear test of observed and modeled wetland response,and is useful for comparative purposes. The emphasis of this studyis on the physical hydrology of controlled flooding and wetland soilresponse, but results of this work have implications for related top-ics such as valley geomorphology, biome development and sup-port, and riparian nutrient cycling. The present study is based onfield observations from a particular location, but a similar combi-nation of field techniques and modeling can be used in otherlocations.
2. Site and hydrologic description
The study site is located in Poopenaut Valley, adjacent to theTuolumne River on the western side of Yosemite National Park(YNP), USA (Fig. 1). Poopenaut Valley covers an area of 25 hectares,trending northeast to southwest. The valley was carved from gra-nitic rocks of the Sierra Nevada batholith primarily by glacial pro-cesses, the most recent of which, the Tioga glaciations, endedapproximately 18 kya (Huber, 1990). Subsequent alluvial and flu-vial processes have formed a broad valley with a gentle slope to-wards the southwest. Alluvial sedimentary fill extends across thevalley floor, ending at the steep northwestern and southeasternvalley walls, and abutting granitic massifs at upstream and down-stream ends of the valley.
The O’Shaughnessy Dam is located at the northeastern end ofPoopenaut Valley, forming the lower limit of the Hetch Hechy Res-ervoir. The dam was constructed to an initial height of 69 m in1923, and subsequently raised to 95 m in 1938; the current storagecapacity of the reservoir is 0.444 km3. The drainage basin that sup-plies water to Hetch Hechy Reservoir has an area of 1180 km2, andextends from an elevation of 1170 m to >3700 m on the northernslopes of Mt. Lyell. About 1/3 of the water collected behind theO’Shaughnessy Dam is conveyed to the San Francisco Bay Areausing a pipeline and aquaduct, providing >85% of the water usedby 2.5 million people across five counties in northern California(San Francisco Public Utilities Commission: Water Enterprise,2009). Additional benefit is provided through power generationand environmental flows, including those used for controlledflooding in the Poopenaut Valley, which is the focus of this paper.
Precipitation averages 89 cm annually at the Hetch Hetchyweather station, with 75% of precipitation occurring between
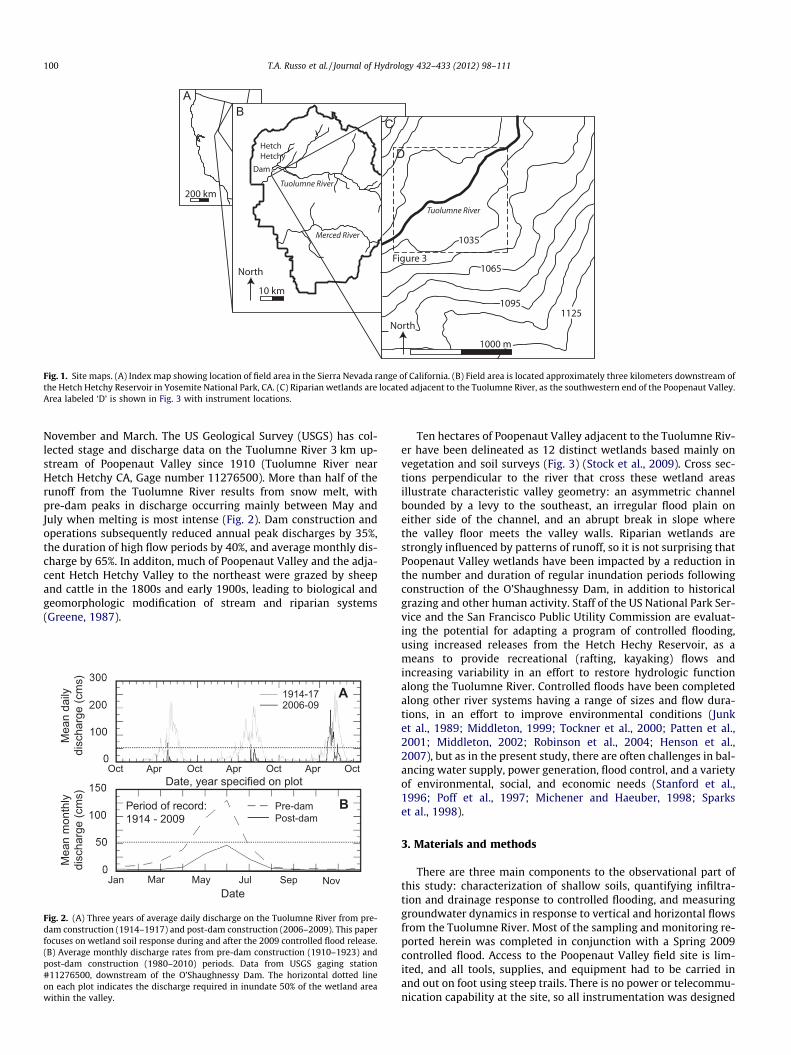
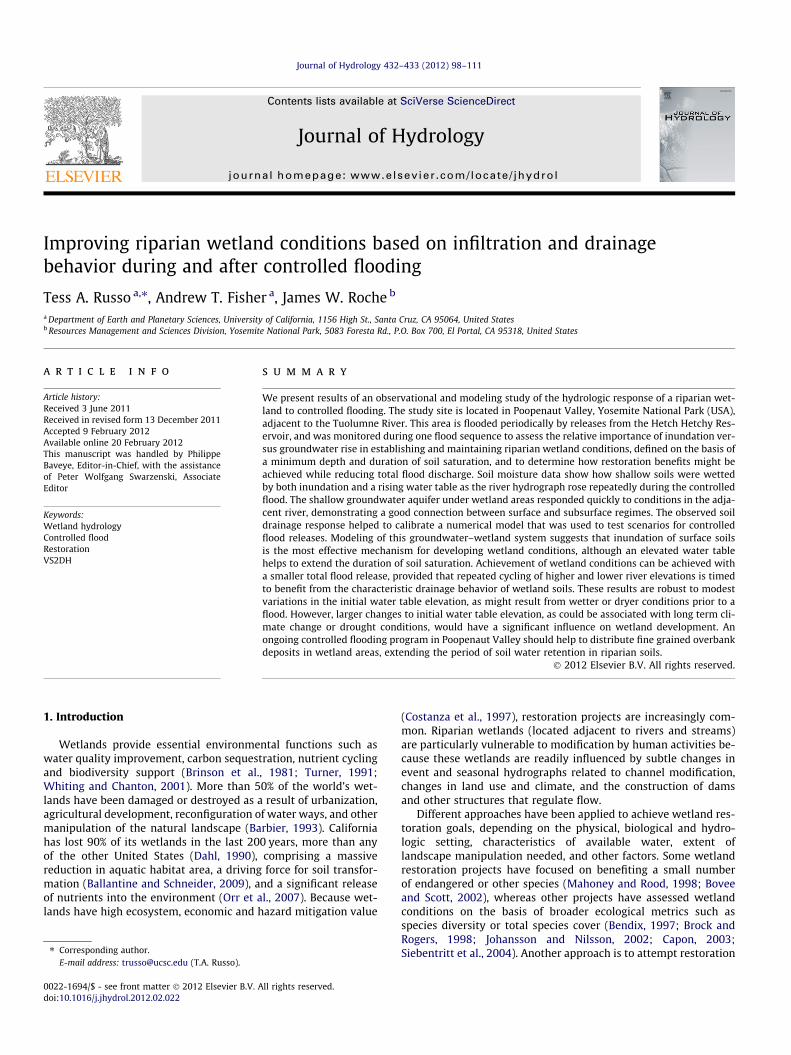
Fig. 1. Site maps. (A) Index map showing location of field area in the Sierra Nevada range of California. (B) Field area is located approximately three kilometers downstream ofthe Hetch Hetchy Reservoir in Yosemite National Park, CA. (C) Riparian wetlands are located adjacent to the Tuolumne River, as the southwestern end of the Poopenaut Valley.Area labeled ‘D’ is shown in Fig. 3 with instrument locations.
100 T.A. Russo et al. / Journal of Hydrology 432–433 (2012) 98–111
November and March. The US Geological Survey (USGS) has col-lected stage and discharge data on the Tuolumne River 3 km up-stream of Poopenaut Valley since 1910 (Tuolumne River nearHetch Hetchy CA, Gage number 11276500). More than half of therunoff from the Tuolumne River results from snow melt, withpre-dam peaks in discharge occurring mainly between May andJuly when melting is most intense (Fig. 2). Dam construction andoperations subsequently reduced annual peak discharges by 35%,the duration of high flow periods by 40%, and average monthly dis-charge by 65%. In additon, much of Poopenaut Valley and the adja-cent Hetch Hetchy Valley to the northeast were grazed by sheepand cattle in the 1800s and early 1900s, leading to biological andgeomorphologic modification of stream and riparian systems(Greene, 1987).
Date, year specified on plot
Pre-damPost-dam
Mea
n m
onth
lydi
scha
rge
(cm
s)M
ean
daily
disc
harg
e (c
ms)
Oct
1914-172006-09
Apr
Date
Oct Apr Oct Apr Oct
Jan Mar May Jul Sep Nov
A
BPeriod of record:1914 - 2009
Fig. 2. (A) Three years of average daily discharge on the Tuolumne River from pre-dam construction (1914–1917) and post-dam construction (2006–2009). This paperfocuses on wetland soil response during and after the 2009 controlled flood release.(B) Average monthly discharge rates from pre-dam construction (1910–1923) andpost-dam construction (1980–2010) periods. Data from USGS gaging station#11276500, downstream of the O’Shaughnessy Dam. The horizontal dotted lineon each plot indicates the discharge required in inundate 50% of the wetland areawithin the valley.
Ten hectares of Poopenaut Valley adjacent to the Tuolumne Riv-er have been delineated as 12 distinct wetlands based mainly onvegetation and soil surveys (Fig. 3) (Stock et al., 2009). Cross sec-tions perpendicular to the river that cross these wetland areasillustrate characteristic valley geometry: an asymmetric channelbounded by a levy to the southeast, an irregular flood plain oneither side of the channel, and an abrupt break in slope wherethe valley floor meets the valley walls. Riparian wetlands arestrongly influenced by patterns of runoff, so it is not surprising thatPoopenaut Valley wetlands have been impacted by a reduction inthe number and duration of regular inundation periods followingconstruction of the O’Shaughnessy Dam, in addition to historicalgrazing and other human activity. Staff of the US National Park Ser-vice and the San Francisco Public Utility Commission are evaluat-ing the potential for adapting a program of controlled flooding,using increased releases from the Hetch Hechy Reservoir, as ameans to provide recreational (rafting, kayaking) flows andincreasing variability in an effort to restore hydrologic functionalong the Tuolumne River. Controlled floods have been completedalong other river systems having a range of sizes and flow dura-tions, in an effort to improve environmental conditions (Junket al., 1989; Middleton, 1999; Tockner et al., 2000; Patten et al.,2001; Middleton, 2002; Robinson et al., 2004; Henson et al.,2007), but as in the present study, there are often challenges in bal-ancing water supply, power generation, flood control, and a varietyof environmental, social, and economic needs (Stanford et al.,1996; Poff et al., 1997; Michener and Haeuber, 1998; Sparkset al., 1998).
3. Materials and methods
There are three main components to the observational part ofthis study: characterization of shallow soils, quantifying infiltra-tion and drainage response to controlled flooding, and measuringgroundwater dynamics in response to vertical and horizontal flowsfrom the Tuolumne River. Most of the sampling and monitoring re-ported herein was completed in conjunction with a Spring 2009controlled flood. Access to the Poopenaut Valley field site is lim-ited, and all tools, supplies, and equipment had to be carried inand out on foot using steep trails. There is no power or telecommu-nication capability at the site, so all instrumentation was designed

Relative distance on transect (m)
Rel
ativ
e el
evat
ion
on tr
anse
ct (m
)
River
A
B
Primary transect
Tuolumne River
Wetland area
31 m relative elevation contour
L2L1
L3TD
TU
PiezometerThermal gauges
North
200 m
A
A’
E’
E
D’
D
B’
B
C’
C
A-A’
B-B’
C-C’
D-D’
E-E’
Fig. 3. (A) The study area showing instrument and field test locations. The modeling study simulates conditions along the primary transect. (B) Five elevation transectsperpindicular to the river.
T.A. Russo et al. / Journal of Hydrology 432–433 (2012) 98–111 101
to work autonomously before, during, and after flooding. In addi-tion, the 2009 project was initiated with only a few weeks noticeand on a limited budget, so the field and associated modeling pro-gram was designed to take maximum advantage of existing infor-mation, focusing on one wetland area where there was the bestopportunity to link surface water and groundwater processes andaddress key questions.
A series of shallow wells had been installed in Poopenaut Valleyin 2007 along three transects, running perpendicular and parallelto the Tuolumne River, and additional wells with pressure gaugeswere added in 2009 (Fig. 3). We focused instrumentation and mod-eling on a single cross-valley profile located at the southwestern
end of the valley (referred to as the ‘‘primary transect’’), for severalreasons. Capturing the full three-dimensional variability of soilinundation, saturation, and drainage would be impractical, givenlimitations of time and instrumentation, so we selected a transectof sampling and measurements that (a) had a significant fraction ofdelineated wetland, (b) was already instrumented with piezome-ters, (c) had a topographic profile consistent with other parts ofthe valley (Fig. 3B), (d) included a pre-installed stream gauge atthe river, and (e) was located where the dominant flow directionwould be to and from the river (rather than down-valley parallelto the river). The latter was assured by the nearby pinch out of allu-vial fill against granitic bedrock (Fig. 3). A study of one wetland

102 T.A. Russo et al. / Journal of Hydrology 432–433 (2012) 98–111
area such as this cannot be extrapolated across the entire valleywith confidence, but provides critical information about one areaand is useful for assessing the practicality, cost, effort, and poten-tial benefit of a more extensive sampling and monitoring programprior to future flood events.
Soil properties were evaluated to gain insight into infiltrationand drainage characteristics. Soil samples were collected at10 cm intervals from the ground to a depth of 180 cm at locationsL1, L2 and L3 along the primary transect (Fig. 3). A subset of soilsamples was analyzed for grain size distribution and organic car-bon content. Grain size distribution was measured using a laserdiffraction particle size analyzer, after digestion in hydrogen per-oxide to remove organics, freeze drying, and deflocculation in a li-quid suspension with sodium metaphosphate. Grain size fractionwas determined within 162 bins between 0.1 lm and 2 mm, thenbins were combined along standard divisions of clay, silt and sand(4 lm and 63 lm). Soil organic carbon was measured on separate(undigested) sample splits using an elemental analyzer coupledto an isotope ratio mass spectrometer.
Volumetric soil moisture content sensors were installed in nestsat locations L2 and L3, 55 m and 130 m from the Tuolumne River,respectively (Fig. 3). Sensors were placed at depths of 40 and 70 cmbelow ground surface (cm-bgs) at L3, and at 40, 70, and 100 cm-bgs at L2. The soil moisture sensors use digital time domaintransmissivity (TDT) to measure volumetric water content. TheTDT sensors determine the soil moisture content within a sphericalregion having a diameter of 15 cm. Data collected with these TDTsensors has been compared to results based on time domain reflec-tometry, impedance probes, capacitance probes and other meth-ods, and the TDT probes have proven accurate across a variety ofsoil types, environments, and temperatures (Blonquist et al.,2005). Soil moisture sensors were wired to a nearby control systemand data logger, and were powered by a sealed lead-acid batterythat was trickle-charged using a solar panel.
Autonomous pressure gauges were deployed in 19 shallow(water table) wells, arranged along three transects, and screenedto depths of 1.6–4.9 m below ground surface (m-bgs) (Fig. 3). Halfof the wells were installed in April 2007, and the remainder in April2009, prior to the controlled flood discussed in this paper. Wells in-stalled in 2007 were constructed with 5.1 cm (2 in.) diameter ma-chine-slotted PVC, whereas the wells installed in 2009 used 3.2 cm(1.25 in.) diameter galvanized steel pipe with a 45.7 cm (18 in.)long screened drive-tip. Pressure gauges in the wells were pro-grammed to record water levels at 15-min intervals. Absolute pres-sure readings were corrected for barometric response, based on aseparate pressure logger deployed in air at the site. Corrected pres-sures were converted to water levels based on field measurementsof absolute sensor depths below ground, and water levels were ref-erenced to a common elevation datum (also used for measuringstream stage).
Instantaneous discharge values for the Tuolumne River used inthis study were determined at US Geological Survey at Gage num-ber 11276500 located at the outlet from the O’Shaughnessy Dam,with data recorded every 15 min. Local measurements of riverstage were also made at 15-min intervals at temporary stations lo-cated upstream and downstream from the ends of the primarywetland area discussed in this paper (locations TU and TD, respec-tively, Fig. 3), using pressure gauges deployed in stilling wells andreferenced to staff plates. Precipitation data were collected by theCalifornia Department of Water Resources from the Hetch HetchyDam (Fig. 1) station (HTH), operated by Hetch Hetchy Water andPower.
Subsurface temperature data were collected to quantify verticalseepage directions and rates in shallow soils in the wetland andadjacent streambed, using analytical methods described in thenext section. Autonomous temperature loggers were installed in
the shallow streambed of the Tuolumne River in sealed PVC tubesat locations TU and TD (Fig. 3). Each thermal tube contained twologgers suspended 20 cm apart below the base of the stream, andthe tubes were backfilled with water to ensure a good thermal con-tact with the surrounding soil. Thermal data were also collected atmultiple depths by the soil moisture content sensors deployed atL2 and L3.
4. Analytical methods
4.1. Interpretation of seepage from thermal data
The magnitude and direction of vertical seepage were deter-mined using heat as a tracer (e.g. Constantz and Thomas, 1996)based on time-series analysis of subsurface temperature data,summarized briefly herein (Hatch et al., 2006). Calculations weremade only when conditions adjacent to subsurface temperatureloggers (both in shallow wetland soils and below the TuolumneRiver) were fully saturated. The method is based on the observa-tion that daily variations in subsurface temperatures propagateas a thermal wave, being reduced in amplitude and shifted in phasewith time and depth. Data are interpreted based on the analyticalsolution to a one-dimensional (vertical) conduction–advection–dispersion equation, and changes in the amplitude and phase ofthermal oscillations between a pair of subsurface sensors sepa-rated by a known distance. Temperature data from each sensorare filtered to isolate diurnal signals, and pairs of records are ana-lyzed to determine the amplitude ratio (Ar) and phase shift (D/) ofpropagating thermal waves. Thermal front velocities are calculatedas:
mAr ¼2je
Dzln Ar þ
ffiffiffiffiffiffiffiffiffiffiffiffiffiffiaþ m2
2
rð1Þ
mD/ ¼
ffiffiffiffiffiffiffiffiffiffiffiffiffiffiffiffiffiffiffiffiffiffiffiffiffiffiffiffiffiffiffiffiffiffiffiffiffiffiffia� 2
D/4pje
PDz
� �2s
ð2Þ
where mAr and mD/ are the thermal front velocities (m d�1) calcu-lated using the amplitude ratio and phase shift, respectively. je isthe effective thermal diffusivity of saturated soil between thermalsensors (m2 d�1), Dz is the vertical distance between sensors (m),P is period of temperature variations (d), and a is a function of fluidvelocity, thermal diffusivity, and signal period. The apparent fluidvelocity is calculated once per day as: mf = mc, where mf is the velocityof the fluid front and c is the ratio of heat capacity of the saturatedsoil to fluid. Because this analytical method depends on tempera-ture sensor spacing, rather than absolute depth, it is relativelyinsensitive to sedimentation and scour (common processes associ-ated with flood events). The method is described in greater detailelsewhere (Hatch et al., 2006), and has been applied in streambedsand shallow soils undergoing managed aquifer recharge (Hatchet al., 2010; Racz et al., 2011).
4.2. Infiltration, drainage, and groundwater modeling
Modeling is a useful approach for understanding wetlandhydrologic processes (Bradley and Gilvear, 2000; Bradley, 2002;Joris and Feyen, 2003; Boswell and Olyphant, 2007; Dimitrovet al., 2010; Shafroth et al., 2010), correlating flow regimes to hyd-roperiods, geomorphological and ecological changes (Bendix,1997; Mertes, 1997; Cabezas et al., 2008; Shafroth et al., 2010),and evaluating flood response and restoration options (Springeret al., 1999; Rains et al., 2004; Acreman et al., 2007). In the presentstudy, we focus on representing physical hydrologic processes toelucidate some of the mechanisms responsible for wetland forma-tion and maintenance. This approach should help to make the

Q = -0.96s3 + 89.3s2 - 2690.8s +26445
Dis
char
ge, Q
(cm
s)%
Inun
date
d w
etla
ndar
ea
Relative stage, s (m)
Inundated wetland
area (ha)
A
B
Fig. 4. (A) Rating curve developed using river stage data from Poopenaut Valley anddischarge measured at the USGS gaging station #11276500, (B) River stage andinundated wetland area, shown as percent of total wetland area and in hectares.
T.A. Russo et al. / Journal of Hydrology 432–433 (2012) 98–111 103
results broadly applicable, although the detailed characteristics ofindividual model and restoration sites is expected to vary locationby location (Schiemer et al., 1999). We have chosen to take a ‘‘soilwater–groundwater’’ approach to wetland modeling because wewished to determine explicitly the connections between surfaceand subsurface water regimes, to understand which is most impor-tant for maintaining riparian wetland conditions, as has been as-sessed in other settings (Bradley and Gilvear, 2000; Boswell andOlyphant, 2007; Staes et al., 2009; Dimitrov et al., 2010).
Our approach was to use moisture content data to quantify soilwater retention and drainage characteristics, under a range ofgroundwater and flood scenarios, to assess the importance of com-peting processes. The movement and storage of soil water andgroundwater were simulated using VS2DH, a variable saturation,transient, two-dimensional, porous medium model (Lapalla et al.,1987; Healy, 1990). VS2DH conserves water mass using the Rich-ards equation for variably saturated flow (for which saturatedgroundwater flow is a special case):
@
@xKðwÞ @h
@x
� �þ @
@zKðwÞ @h
@z
� �¼ CðwÞ @w
@tð3Þ
where x and z are spatial dimensions, K is hydraulic conductivity(m s�1), w is pressure head (m), h is the total head (m), C is specificmoisture capacity (m�1), and t is time (s). The specific moisturecapacity (C) is the slope of the moisture characteristic curve, dh/dw. The modeling domain was defined based on observations alongthe primary study transect, oriented perpendicular to the TuolumneRiver near the downstream end of Poopenaut Valley riparian wet-lands (Fig. 3). The model domain extended from the middle of theriver channel to the southeastern valley wall, 400 m away, and rep-resented the upper 30 m of saturated aquifer and unsaturated soilsabove valley bedrock. The model contained 9295 grid cells withdimensions ranging from 0.1 � 1.5 m (height �width) near theground surface in wetland areas, to 3 � 10 m at depth near the farfield boundary. No-flow boundaries were assigned to the verticalside of the model domain in the middle of the river (based on sym-metry) and the horizontal base of the domain. The far-field bound-ary opposite the river was set as a Dirichlet (constant head)boundary such that there was a pre-flood gradient resulting ingroundwater flow to the river, consistent with pre-flood data fromshallow wells. Initial conditions were determined from stream,groundwater, and soil water measurements made prior to flooding.A time-varying total head boundary was imposed on the groundsurface of inundated areas during the flood, with the water levelat the ground surface forced to follow the flood hydrograph. Waterwas allowed to ‘‘pond’’ on the ground surface, and the upper surfaceof the domain was made a potential seepage face throughout thesimulations. The total head boundary representing the flood hydro-graph had periods ranging from 1 to 7 days, and model time stepswere 1 to 5 � 103 s, several orders of magnitude shorter than theperiods used to model the flood hydrograph. The time steps were1 s at the start of each boundary condition period, with a time stepmultiplier of 1.5 to allow a smooth system response, up to a maxi-mum time step of 5000 s.
Unsaturated soil characteristics were modeled using theBrooks–Corey equations (Brooks and Corey, 1964), which relatesoil moisture content, fluid pressure, and variably saturatedhydraulic conductivity:
S ¼ h� hr
hs � hr¼ w
we
� ��k
ð4Þ
KKs¼ Sg ð5Þ
where S is effective saturation (0–1), h is volumetric water content,hr is residual volumetric water content, hs is saturated volumetric
water content, w is pressure head (m), we is air entry pressure head(m), K is variably saturated hydraulic conductivity (m s�1), and Ks issaturated hydraulic conductivity (m s�1). k and g are fitted param-eters (determined for the present application by matching modeledand observed soil water contents) where k is an index of pore sizedistribution and g is a function of k. hr was inferred to be equal tothe pre-flood soil moisture content (based on field observations,as described later), and porosity was determined from the maxi-mum observed saturated soil moisture content. Calibrated hydrau-lic conductivities of saturated soils were also compared to standardrelations based on grain size distributions (Carman, 1956; Bear,1972; Shepherd, 1989; Fetter, 2001; Hazen, 1911).
The quality of the model fit to data was quantified as the rootmean square error (RMSE) of 3000 soil moisture observations (n)from the shallowest water content sensor at L2 during the periodof drainage following passage of the flood wave, where:
RMSE ¼
ffiffiffiffiffiffiffiffiffiffiffiffiffiffiffiffiffiffiffiffiffiffiffiffiffiffiffiffiffiffiffiRðxobs � xcalcÞ2
n
sð6Þ
The ability of the model to replicate the behavior of shallowgroundwater, as measured with pressure transducers in wells alongthe primary transect, was also used to adjust simulation parame-ters, but it was determined that soil drainage characteristics wereof greater importance for calibrating the model, particularly be-cause these parameters had the greatest influence on the lengthof time during which shallow wetland conditions were maintainedafter passage of a flood wave. We explored fitting modeled to ob-served soil moisture values based on the Van Genuchten equation(Van Genuchten, 1980), but found that this resulted in drainagebehavior that was less consistent with observed soil drainagebehavior than did the Brooks–Corey equation.
5. Results
5.1. Controlled flood and extent of inundation
The Spring 2009 controlled flood in Poopenaut Valley began on 4May (Flood Day 1, FD-1) and ended on 7 July (FD-65), with a totalwater release of 3.5 � 108 m3. Prior to the flood, discharge in theTuolumne River was 15 cubic meters per second (cms). There wasa brief, intense precipitation event several days just prior to thestart of the flood, and another brief precipitation event on FD-28(Fig. 5A), but these had little influence on channel discharge, partic-ularly in comparison to the magnitude of the controlled flood. A rat-ing curve for location TU, near the center of the Poopenaut Valleywetlands (Fig. 3), was developed using stage data from this locationand discharge data from USGS Gage number 11276500 (Fig. 4A).
104 T.A. Russo et al. / Journal of Hydrology 432–433 (2012) 98–111
This rating curve was used with the DEM to calculate the extent ofinundation of Poopenaut Valley wetlands as a function of stage(Fig. 4B). The discharge hydrograph (Fig. 5B) during the controlledflood was irregular in form, having three distinct peaks within ahigh-flow period lasting from 8 May to 8 June (FD-5 to FD-36).The peak of the flood occurred during 18–21 May (FD-15 to FD-18) with discharge reaching 220 cms, at which time the stage was>4 m above pre-flood conditions, and 90% of the riparian wetlandarea in Poopenaut Valley was inundated (Fig. 4B).
5.2. Soil characteristics
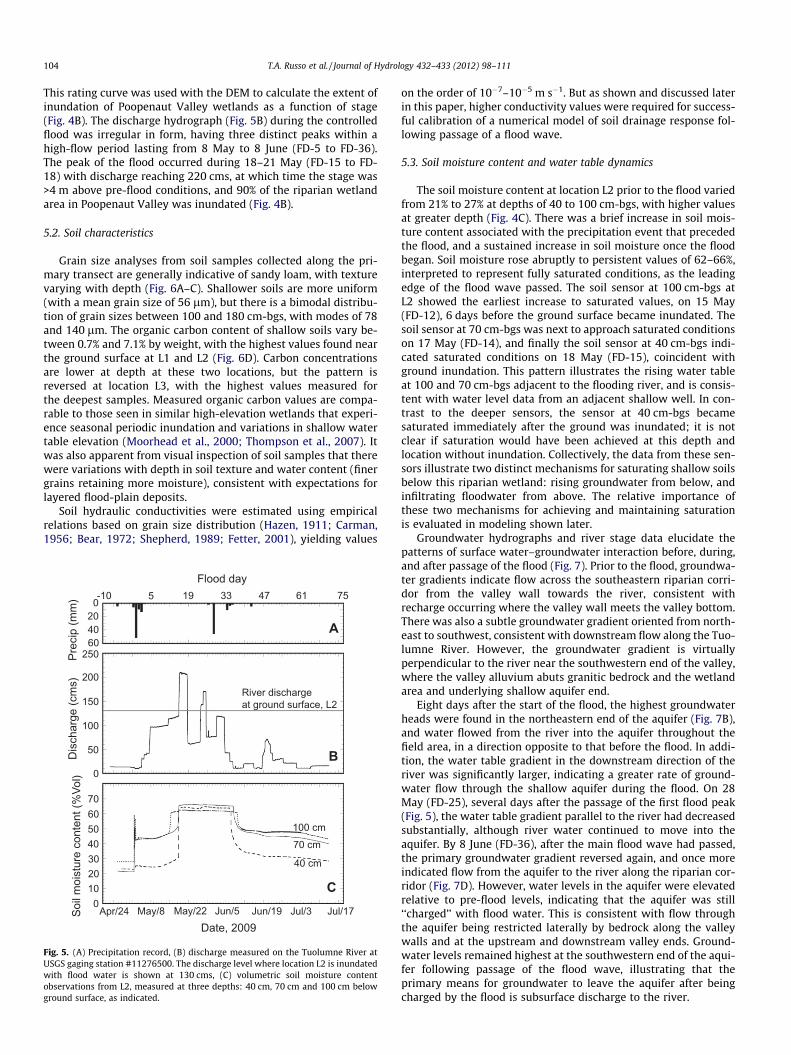
Grain size analyses from soil samples collected along the pri-mary transect are generally indicative of sandy loam, with texturevarying with depth (Fig. 6A–C). Shallower soils are more uniform(with a mean grain size of 56 lm), but there is a bimodal distribu-tion of grain sizes between 100 and 180 cm-bgs, with modes of 78and 140 lm. The organic carbon content of shallow soils vary be-tween 0.7% and 7.1% by weight, with the highest values found nearthe ground surface at L1 and L2 (Fig. 6D). Carbon concentrationsare lower at depth at these two locations, but the pattern isreversed at location L3, with the highest values measured forthe deepest samples. Measured organic carbon values are compa-rable to those seen in similar high-elevation wetlands that experi-ence seasonal periodic inundation and variations in shallow watertable elevation (Moorhead et al., 2000; Thompson et al., 2007). Itwas also apparent from visual inspection of soil samples that therewere variations with depth in soil texture and water content (finergrains retaining more moisture), consistent with expectations forlayered flood-plain deposits.
Soil hydraulic conductivities were estimated using empiricalrelations based on grain size distribution (Hazen, 1911; Carman,1956; Bear, 1972; Shepherd, 1989; Fetter, 2001), yielding values
River dischargeat ground surface, L2
-10 5 19 33 47 61 75
Prec
ip (m
m)
Dis
char
ge (c
ms)
Soil
moi
stur
e co
nten
t (%
Vol)
Date, 2009Apr/24 Jul/3Jun/19Jun/5May/22May/8 Jul/17
100 cm
70 cm
40 cm
0
604020
200
150
100
50
0
250
706050403020100
A
C
B
Flood day
Fig. 5. (A) Precipitation record, (B) discharge measured on the Tuolumne River atUSGS gaging station #11276500. The discharge level where location L2 is inundatedwith flood water is shown at 130 cms, (C) volumetric soil moisture contentobservations from L2, measured at three depths: 40 cm, 70 cm and 100 cm belowground surface, as indicated.
on the order of 10�7–10�5 m s�1. But as shown and discussed laterin this paper, higher conductivity values were required for success-ful calibration of a numerical model of soil drainage response fol-lowing passage of a flood wave.
5.3. Soil moisture content and water table dynamics
The soil moisture content at location L2 prior to the flood variedfrom 21% to 27% at depths of 40 to 100 cm-bgs, with higher valuesat greater depth (Fig. 4C). There was a brief increase in soil mois-ture content associated with the precipitation event that precededthe flood, and a sustained increase in soil moisture once the floodbegan. Soil moisture rose abruptly to persistent values of 62–66%,interpreted to represent fully saturated conditions, as the leadingedge of the flood wave passed. The soil sensor at 100 cm-bgs atL2 showed the earliest increase to saturated values, on 15 May(FD-12), 6 days before the ground surface became inundated. Thesoil sensor at 70 cm-bgs was next to approach saturated conditionson 17 May (FD-14), and finally the soil sensor at 40 cm-bgs indi-cated saturated conditions on 18 May (FD-15), coincident withground inundation. This pattern illustrates the rising water tableat 100 and 70 cm-bgs adjacent to the flooding river, and is consis-tent with water level data from an adjacent shallow well. In con-trast to the deeper sensors, the sensor at 40 cm-bgs becamesaturated immediately after the ground was inundated; it is notclear if saturation would have been achieved at this depth andlocation without inundation. Collectively, the data from these sen-sors illustrate two distinct mechanisms for saturating shallow soilsbelow this riparian wetland: rising groundwater from below, andinfiltrating floodwater from above. The relative importance ofthese two mechanisms for achieving and maintaining saturationis evaluated in modeling shown later.
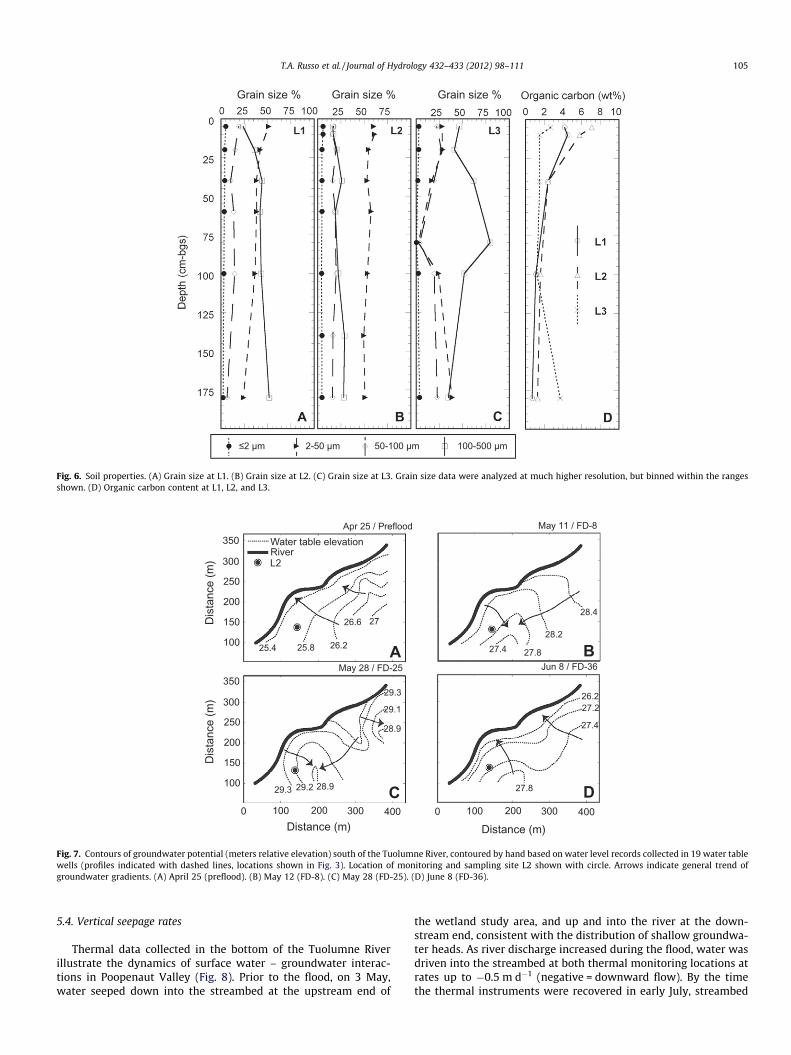
Groundwater hydrographs and river stage data elucidate thepatterns of surface water–groundwater interaction before, during,and after passage of the flood (Fig. 7). Prior to the flood, groundwa-ter gradients indicate flow across the southeastern riparian corri-dor from the valley wall towards the river, consistent withrecharge occurring where the valley wall meets the valley bottom.There was also a subtle groundwater gradient oriented from north-east to southwest, consistent with downstream flow along the Tuo-lumne River. However, the groundwater gradient is virtuallyperpendicular to the river near the southwestern end of the valley,where the valley alluvium abuts granitic bedrock and the wetlandarea and underlying shallow aquifer end.
Eight days after the start of the flood, the highest groundwaterheads were found in the northeastern end of the aquifer (Fig. 7B),and water flowed from the river into the aquifer throughout thefield area, in a direction opposite to that before the flood. In addi-tion, the water table gradient in the downstream direction of theriver was significantly larger, indicating a greater rate of ground-water flow through the shallow aquifer during the flood. On 28May (FD-25), several days after the passage of the first flood peak(Fig. 5), the water table gradient parallel to the river had decreasedsubstantially, although river water continued to move into theaquifer. By 8 June (FD-36), after the main flood wave had passed,the primary groundwater gradient reversed again, and once moreindicated flow from the aquifer to the river along the riparian cor-ridor (Fig. 7D). However, water levels in the aquifer were elevatedrelative to pre-flood levels, indicating that the aquifer was still‘‘charged’’ with flood water. This is consistent with flow throughthe aquifer being restricted laterally by bedrock along the valleywalls and at the upstream and downstream valley ends. Ground-water levels remained highest at the southwestern end of the aqui-fer following passage of the flood wave, illustrating that theprimary means for groundwater to leave the aquifer after beingcharged by the flood is subsurface discharge to the river.
≤2 µm 2-50 µm 50-100 µm 100-500 µm
Grain size % Grain size % Grain size %
Fig. 6. Soil properties. (A) Grain size at L1. (B) Grain size at L2. (C) Grain size at L3. Grain size data were analyzed at much higher resolution, but binned within the rangesshown. (D) Organic carbon content at L1, L2, and L3.
River
25.825.4
2726.6
26.2
Water table elevation
28.929.229.3
28.9
29.3
29.1
27.4
28.4
28.2
27.8
27.8
27.4
26.227.2
Distance (m)
Dis
tanc
e (m
)D
ista
nce
(m)
Distance (m)0 4003002001000 400300200100
100
350
300
250
200
150
100
350
300
250
200
150
L2
Apr 25 / Preflood May 11 / FD-8
May 28 / FD-25 Jun 8 / FD-36 A
D
B
C
Fig. 7. Contours of groundwater potential (meters relative elevation) south of the Tuolumne River, contoured by hand based on water level records collected in 19 water tablewells (profiles indicated with dashed lines, locations shown in Fig. 3). Location of monitoring and sampling site L2 shown with circle. Arrows indicate general trend ofgroundwater gradients. (A) April 25 (preflood). (B) May 12 (FD-8). (C) May 28 (FD-25). (D) June 8 (FD-36).
T.A. Russo et al. / Journal of Hydrology 432–433 (2012) 98–111 105
5.4. Vertical seepage rates
Thermal data collected in the bottom of the Tuolumne Riverillustrate the dynamics of surface water – groundwater interac-tions in Poopenaut Valley (Fig. 8). Prior to the flood, on 3 May,water seeped down into the streambed at the upstream end of
the wetland study area, and up and into the river at the down-stream end, consistent with the distribution of shallow groundwa-ter heads. As river discharge increased during the flood, water wasdriven into the streambed at both thermal monitoring locations atrates up to �0.5 m d�1 (negative = downward flow). By the timethe thermal instruments were recovered in early July, streambed
A
TU
L2
TD
May/1 May/15 May/29 Jun/12 Jun/26 Jul/10Date, 2009
Seep
age
(m/d
)R
elat
ive
stag
e (m
)
25
-0.8
-0.4
0
-0.8
-0.4
0.40
29
27
0.4
B
C
Flood day-3 12 26 40 54 68
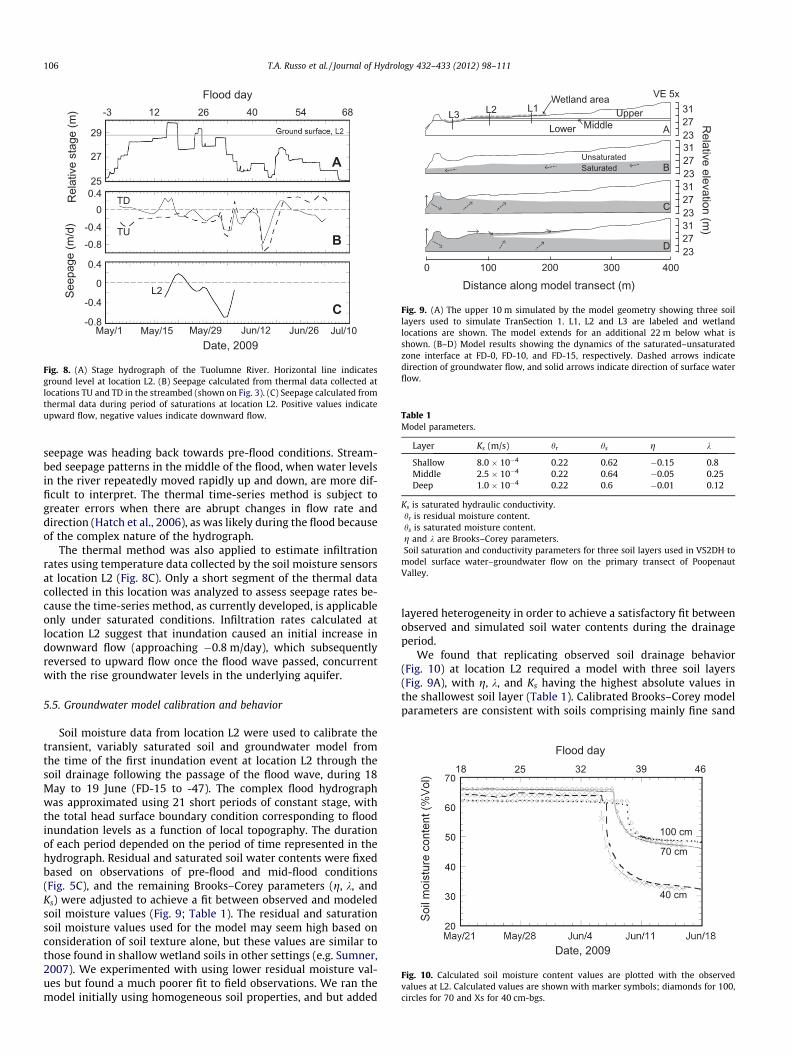
Fig. 8. (A) Stage hydrograph of the Tuolumne River. Horizontal line indicatesground level at location L2. (B) Seepage calculated from thermal data collected atlocations TU and TD in the streambed (shown on Fig. 3). (C) Seepage calculated fromthermal data during period of saturations at location L2. Positive values indicateupward flow, negative values indicate downward flow.
VE 5x
UpperLower Middle
L3 L2 L1
A
B
C
D
0 100 200 300 400
312723
312723
312723
312723
Saturated Unsaturated
Distance along model transect (m)
Relative elevation (m
)Wetland area
Fig. 9. (A) The upper 10 m simulated by the model geometry showing three soillayers used to simulate TranSection 1. L1, L2 and L3 are labeled and wetlandlocations are shown. The model extends for an additional 22 m below what isshown. (B–D) Model results showing the dynamics of the saturated–unsaturatedzone interface at FD-0, FD-10, and FD-15, respectively. Dashed arrows indicatedirection of groundwater flow, and solid arrows indicate direction of surface waterflow.
Table 1Model parameters.
Layer Ks (m/s) hr hs g k
Shallow 8.0 � 10�4 0.22 0.62 �0.15 0.8Middle 2.5 � 10�4 0.22 0.64 �0.05 0.25Deep 1.0 � 10�4 0.22 0.6 �0.01 0.12
Ks is saturated hydraulic conductivity.hr is residual moisture content.hs is saturated moisture content.g and k are Brooks–Corey parameters.Soil saturation and conductivity parameters for three soil layers used in VS2DH to
model surface water–groundwater flow on the primary transect of PoopenautValley.
18 393225 46
Date, 2009
100 cm
40 cm
70 cm
Flood day
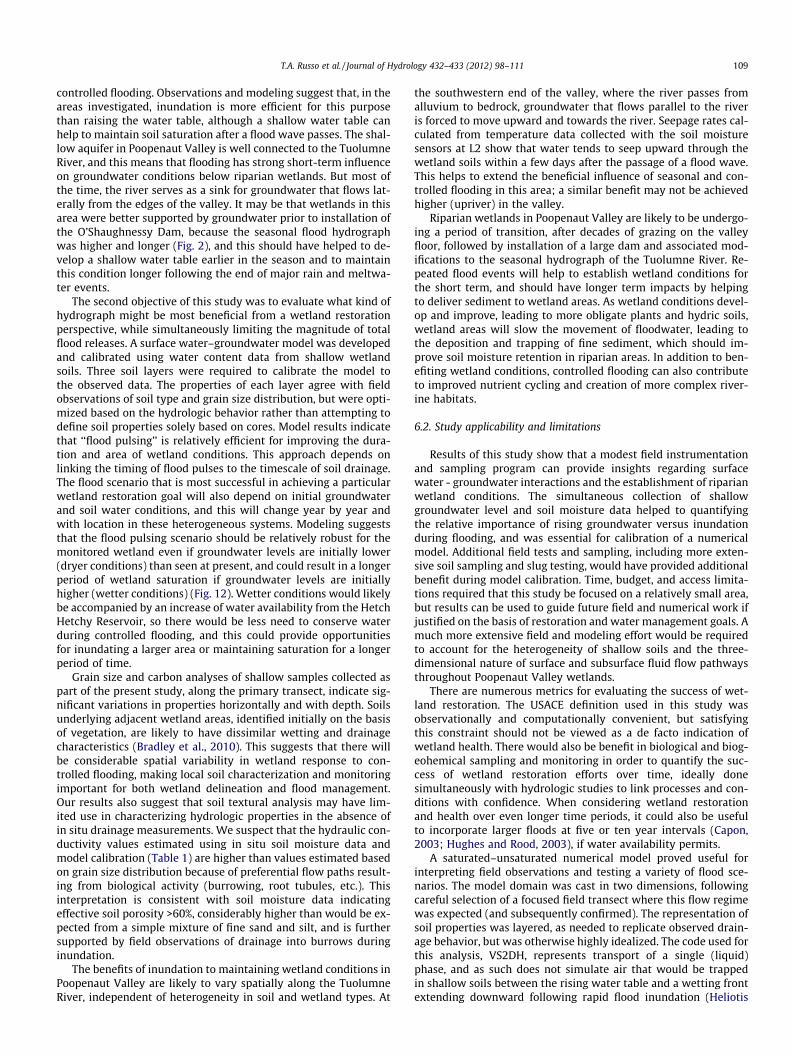
Fig. 10. Calculated soil moisture content values are plotted with the observedvalues at L2. Calculated values are shown with marker symbols; diamonds for 100,circles for 70 and Xs for 40 cm-bgs.
106 T.A. Russo et al. / Journal of Hydrology 432–433 (2012) 98–111
seepage was heading back towards pre-flood conditions. Stream-bed seepage patterns in the middle of the flood, when water levelsin the river repeatedly moved rapidly up and down, are more dif-ficult to interpret. The thermal time-series method is subject togreater errors when there are abrupt changes in flow rate anddirection (Hatch et al., 2006), as was likely during the flood becauseof the complex nature of the hydrograph.
The thermal method was also applied to estimate infiltrationrates using temperature data collected by the soil moisture sensorsat location L2 (Fig. 8C). Only a short segment of the thermal datacollected in this location was analyzed to assess seepage rates be-cause the time-series method, as currently developed, is applicableonly under saturated conditions. Infiltration rates calculated atlocation L2 suggest that inundation caused an initial increase indownward flow (approaching �0.8 m/day), which subsequentlyreversed to upward flow once the flood wave passed, concurrentwith the rise groundwater levels in the underlying aquifer.
5.5. Groundwater model calibration and behavior
Soil moisture data from location L2 were used to calibrate thetransient, variably saturated soil and groundwater model fromthe time of the first inundation event at location L2 through thesoil drainage following the passage of the flood wave, during 18May to 19 June (FD-15 to -47). The complex flood hydrographwas approximated using 21 short periods of constant stage, withthe total head surface boundary condition corresponding to floodinundation levels as a function of local topography. The durationof each period depended on the period of time represented in thehydrograph. Residual and saturated soil water contents were fixedbased on observations of pre-flood and mid-flood conditions(Fig. 5C), and the remaining Brooks–Corey parameters (g, k, andKs) were adjusted to achieve a fit between observed and modeledsoil moisture values (Fig. 9; Table 1). The residual and saturationsoil moisture values used for the model may seem high based onconsideration of soil texture alone, but these values are similar tothose found in shallow wetland soils in other settings (e.g. Sumner,2007). We experimented with using lower residual moisture val-ues but found a much poorer fit to field observations. We ran themodel initially using homogeneous soil properties, and but added
layered heterogeneity in order to achieve a satisfactory fit betweenobserved and simulated soil water contents during the drainageperiod.
We found that replicating observed soil drainage behavior(Fig. 10) at location L2 required a model with three soil layers(Fig. 9A), with g, k, and Ks having the highest absolute values inthe shallowest soil layer (Table 1). Calibrated Brooks–Corey modelparameters are consistent with soils comprising mainly fine sand

Table 2Model parameter sensitivity analysis results.
Variation Ks g k
10% Increase 1.1 1.1 1.210% Decrease 2.9 1.7 3.8
The RMSE between water content values measured during the drainage period andthose calculated by the model, varying the Brooks–Corey parameters and saturatedhydraulic conductivity by ±10%. The RMSE for the original model parameters is 1.0%volumetric moisture content.
T.A. Russo et al. / Journal of Hydrology 432–433 (2012) 98–111 107
and silt, as observed at the field site. Both Ks and k (the pore sizedistribution index) appear to decrease with depth, consistent withthe unimodal grain size distributions of surface soil samples, andbimodal distributions of samples at 100 cm and 180 cm depth.We do not suggest that this model stratigraphy is unique in repli-cating observed soil drainage behavior, or that this layering mustapply throughout the wetland area. Our preferred set of Brooks–Corey parameters generated a RMSE of 1.0% volumetric moisturecontent, based on comparison of 3000 model results and soil mois-ture data collected with the sensor at 40 cm-bgs. A sensitivity anal-ysis of the Brooks–Corey parameters shows that k and K have thegreatest impact on model results (Table 2). Changes in theseparameters by ±10% increased the RMSE value by up to 370%.
Having calibrated for soil properties, we ran a series of simula-tions that included the entire controlled flood hydrograph to exam-ine the importance of surface inundation versus groundwater risein maintaining wetland conditions. Prior to the start of the flood,modeled groundwater flow was from the far field boundary to-wards the river, as observed (Fig. 9B). The net flow from the aquiferto the river was 9.6 � 10�3 m3 s�1 m�1 of river reach. If extrapo-lated along the reach of the Tuolumne River that flows throughPoopenaut Valley, this would comprise a net gain to river dischargeof 4.8 � 10�3 m3 s�1, a value too small to be resolved with confi-dence using standard stream gauging techniques, which have typ-ical uncertainties that are the greater of 5–10% of gauged dischargeor 0.04 m3 s�1 (Schmadel et al., 2010). As the first part of the floodwave passes and river stage rises, but before the area adjacent tothe river is inundated, water flows from the river into the adjacentaquifer, and the water table rises, causing a reversal in the lateralgroundwater gradient (Fig. 9C). As the river continues to rise andriparian wetlands are inundated, there is a zone of unsaturatedsoils that becomes temporarily trapped between infiltration fromabove and the rising water table from below (Fig. 9D). Eventuallythe simulated groundwater gradient reverses again after the floodwave passes, and groundwater flow is restored to the pre-flooddirection, towards the river.
5.6. Modeling alternative flood scenarios
We explored alternative flood scenarios to evaluate options tobenefit riparian wetlands while releasing less total water fromthe Hetch Hetchy Reservoir. The minimum acceptable wetlandbenefit was defined, following the USACE definition, as saturationfor 14 consecutive days at 30 cm below ground surface. In the caseof Hetch Hetchy flood releases, additional considerations includeretaining sufficient water in the reservoir to meet anticipated mu-nicipal demand, and supplying downstream recreational benefits.In addition, there are limitations on the rate of change of reservoirreleases from Hetch Hetchy (how abruptly a flood wave can be ini-tiated and ended) specified in the US Department of the Interior1985 flow stipulation, and because of the mechanical operationsneeded to open and close valves in the O’Shaunessey Dam. At othersites where water is released from reservoirs, additional consider-
ations could include power generation needs and restoring capac-ity for flood control by lowering reservoir levels.
Because there are so many considerations involved in design-ing a controlled flood release, we focus for illustrative purposeson three scenarios that emphasize surface water inundation ofthe wetland at location L2 (Fig. 11). The extent to which any floodscenario will achieve wetland conditions will depend on soilproperties, local elevation and topography, and other factors,but we use location L2 for this analysis because achieving wet-land conditions at this location by inundation should result ininundation of 90% of Poopenaut Valley riparian wetlands(Fig. 4B). The characteristics of each flood scenario hydrograph,including stage, and duration of both inundating and non-inun-dating periods, have been adjusted specifically to reduce the totalwater requirement while meeting wetland conditions in the cali-brated model.
The first scenario is a sustained release lasting 12 days, whichresults in 14 days of saturation at 30 cm-bgs. This is a referencecase, with the water level set high enough to inundate the areaof interest. The second scenario includes two days of higher stage,to inundate a larger initial area, followed by a somewhat lowerstage for the remainder of a 12-day flood. Scenario 2 was intendedto test whether it might be possible to delay drainage following theinitially high flood stage, using a combination of inundation andraising the underlying water table, without discharging as muchwater as needed to maintain the higher stage throughout the flood.Scenario 3 comprises multiple cycles of higher and lower stagewithin a flood of the same 12 day duration, a ‘‘flood pulsing’’ ap-proach that has proven useful in other restoration projects (Mid-dleton, 1999; Tockner et al., 2000; Middleton, 2002). Floodingduring short periods, rather than constant discharge for long peri-ods (Springer et al., 1999; Rains et al., 2004), allows for more effi-cient water releases that account for soil retention and drainagecharacteristics. In all scenarios presented, peak stages and dura-tions were adjusted incrementally so as to achieve the minimalsaturation (wetland) objective at modeled location L2, releasingas little water as possible. Once this goal was achieved, we con-verted the individual stage hydrographs to discharge hydrographsbased on a rating curve developed from data collected during the2009 controlled flood (Fig. 4). Integrating under these idealizeddischarge hydrographs allowed calculation of how much waterwould need to be released from the reservoir to achieve the desiredresult. Numerous alternative flood scenarios could also achieve theminimal hydrologic objective (14 days of continuous saturationdown to 30 cm depth), but these three show a range of optionsand illustrate key issues that should be considered in designing aflood release plan.
All three flood scenarios were capable of meeting minimumwetland conditions at location L2, as did the 2009 controlled flood(Table 3). However, the modeled scenarios used only 28–40% of thetotal 2009 flood release, in part because the scenarios minimizedthe period of the flood that put river stage below the ground eleva-tion at location L2 (before 19 May, after 7 June). The third floodscenario, based on cycling between higher and lower flood stage,was ideally timed to take advantage of the delayed drainagebehavior of Poopenaut Valley soils, and so required the least riverdischarge to achieve minimal wetland goals.
We also attempted to achieve wetland conditions at location L2with shallow saturation supported mainly by rising groundwater,but it proved to be impractical to extend wetland conditions far en-ough from the river in this way. In scenarios that achieved wetlandconditions by shallow groundwater alone, the river dischargerequirements associated with maintaining an elevated water tablewere far greater than those of the other idealized flood scenarios,and were also greater than the observed total discharge duringthe 2009 controlled flood.
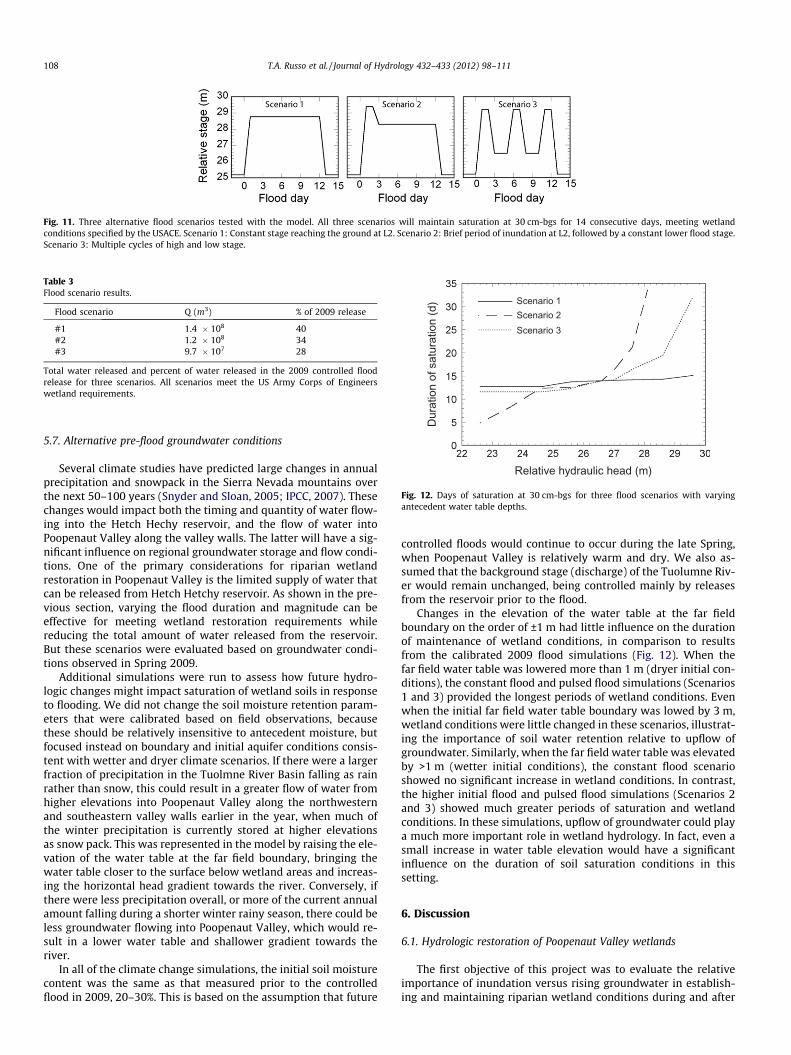
Fig. 11. Three alternative flood scenarios tested with the model. All three scenarios will maintain saturation at 30 cm-bgs for 14 consecutive days, meeting wetlandconditions specified by the USACE. Scenario 1: Constant stage reaching the ground at L2. Scenario 2: Brief period of inundation at L2, followed by a constant lower flood stage.Scenario 3: Multiple cycles of high and low stage.
Table 3Flood scenario results.
Flood scenario Q (m3) % of 2009 release
#1 1.4 � 108 40#2 1.2 � 108 34#3 9.7 � 107 28
Total water released and percent of water released in the 2009 controlled floodrelease for three scenarios. All scenarios meet the US Army Corps of Engineerswetland requirements.
Scenario 1
Scenario 3Scenario 2
Relative hydraulic head (m)
Dur
atio
n of
sat
urat
ion
(d)
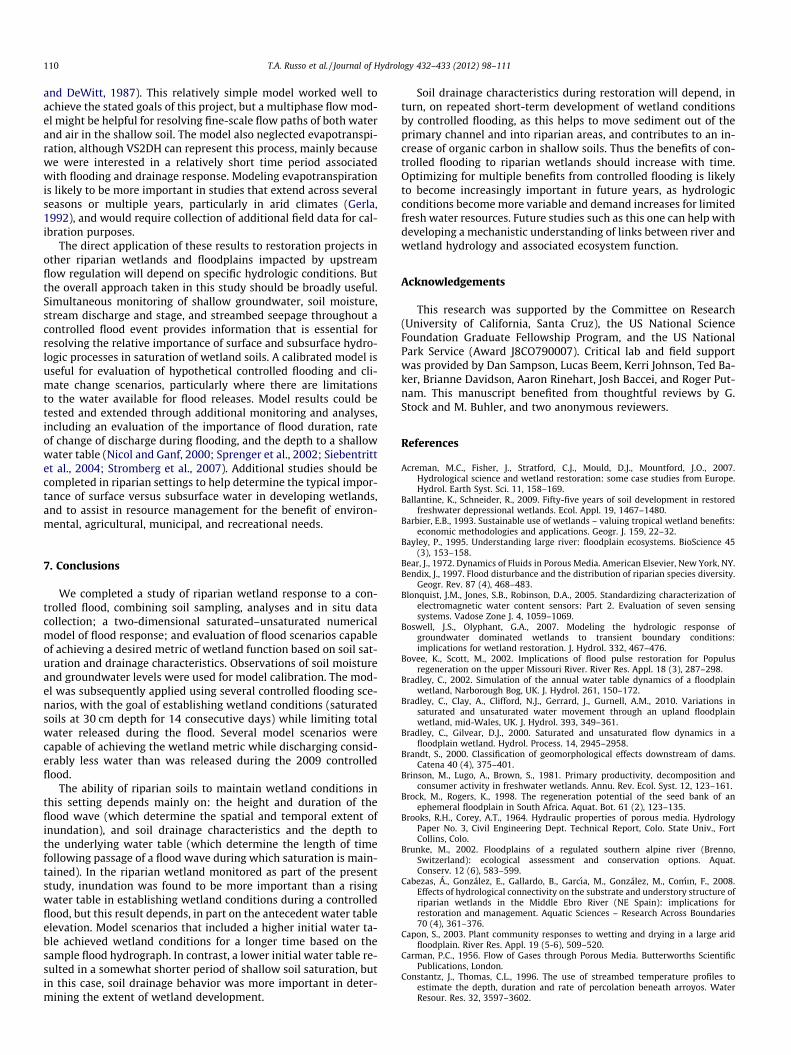
Fig. 12. Days of saturation at 30 cm-bgs for three flood scenarios with varyingantecedent water table depths.
108 T.A. Russo et al. / Journal of Hydrology 432–433 (2012) 98–111
5.7. Alternative pre-flood groundwater conditions
Several climate studies have predicted large changes in annualprecipitation and snowpack in the Sierra Nevada mountains overthe next 50–100 years (Snyder and Sloan, 2005; IPCC, 2007). Thesechanges would impact both the timing and quantity of water flow-ing into the Hetch Hechy reservoir, and the flow of water intoPoopenaut Valley along the valley walls. The latter will have a sig-nificant influence on regional groundwater storage and flow condi-tions. One of the primary considerations for riparian wetlandrestoration in Poopenaut Valley is the limited supply of water thatcan be released from Hetch Hetchy reservoir. As shown in the pre-vious section, varying the flood duration and magnitude can beeffective for meeting wetland restoration requirements whilereducing the total amount of water released from the reservoir.But these scenarios were evaluated based on groundwater condi-tions observed in Spring 2009.
Additional simulations were run to assess how future hydro-logic changes might impact saturation of wetland soils in responseto flooding. We did not change the soil moisture retention param-eters that were calibrated based on field observations, becausethese should be relatively insensitive to antecedent moisture, butfocused instead on boundary and initial aquifer conditions consis-tent with wetter and dryer climate scenarios. If there were a largerfraction of precipitation in the Tuolmne River Basin falling as rainrather than snow, this could result in a greater flow of water fromhigher elevations into Poopenaut Valley along the northwesternand southeastern valley walls earlier in the year, when much ofthe winter precipitation is currently stored at higher elevationsas snow pack. This was represented in the model by raising the ele-vation of the water table at the far field boundary, bringing thewater table closer to the surface below wetland areas and increas-ing the horizontal head gradient towards the river. Conversely, ifthere were less precipitation overall, or more of the current annualamount falling during a shorter winter rainy season, there could beless groundwater flowing into Poopenaut Valley, which would re-sult in a lower water table and shallower gradient towards theriver.
In all of the climate change simulations, the initial soil moisturecontent was the same as that measured prior to the controlledflood in 2009, 20–30%. This is based on the assumption that future
controlled floods would continue to occur during the late Spring,when Poopenaut Valley is relatively warm and dry. We also as-sumed that the background stage (discharge) of the Tuolumne Riv-er would remain unchanged, being controlled mainly by releasesfrom the reservoir prior to the flood.
Changes in the elevation of the water table at the far fieldboundary on the order of ±1 m had little influence on the durationof maintenance of wetland conditions, in comparison to resultsfrom the calibrated 2009 flood simulations (Fig. 12). When thefar field water table was lowered more than 1 m (dryer initial con-ditions), the constant flood and pulsed flood simulations (Scenarios1 and 3) provided the longest periods of wetland conditions. Evenwhen the initial far field water table boundary was lowed by 3 m,wetland conditions were little changed in these scenarios, illustrat-ing the importance of soil water retention relative to upflow ofgroundwater. Similarly, when the far field water table was elevatedby >1 m (wetter initial conditions), the constant flood scenarioshowed no significant increase in wetland conditions. In contrast,the higher initial flood and pulsed flood simulations (Scenarios 2and 3) showed much greater periods of saturation and wetlandconditions. In these simulations, upflow of groundwater could playa much more important role in wetland hydrology. In fact, even asmall increase in water table elevation would have a significantinfluence on the duration of soil saturation conditions in thissetting.
6. Discussion
6.1. Hydrologic restoration of Poopenaut Valley wetlands
The first objective of this project was to evaluate the relativeimportance of inundation versus rising groundwater in establish-ing and maintaining riparian wetland conditions during and after
T.A. Russo et al. / Journal of Hydrology 432–433 (2012) 98–111 109
controlled flooding. Observations and modeling suggest that, in theareas investigated, inundation is more efficient for this purposethan raising the water table, although a shallow water table canhelp to maintain soil saturation after a flood wave passes. The shal-low aquifer in Poopenaut Valley is well connected to the TuolumneRiver, and this means that flooding has strong short-term influenceon groundwater conditions below riparian wetlands. But most ofthe time, the river serves as a sink for groundwater that flows lat-erally from the edges of the valley. It may be that wetlands in thisarea were better supported by groundwater prior to installation ofthe O’Shaughnessy Dam, because the seasonal flood hydrographwas higher and longer (Fig. 2), and this should have helped to de-velop a shallow water table earlier in the season and to maintainthis condition longer following the end of major rain and meltwa-ter events.
The second objective of this study was to evaluate what kind ofhydrograph might be most beneficial from a wetland restorationperspective, while simultaneously limiting the magnitude of totalflood releases. A surface water–groundwater model was developedand calibrated using water content data from shallow wetlandsoils. Three soil layers were required to calibrate the model tothe observed data. The properties of each layer agree with fieldobservations of soil type and grain size distribution, but were opti-mized based on the hydrologic behavior rather than attempting todefine soil properties solely based on cores. Model results indicatethat ‘‘flood pulsing’’ is relatively efficient for improving the dura-tion and area of wetland conditions. This approach depends onlinking the timing of flood pulses to the timescale of soil drainage.The flood scenario that is most successful in achieving a particularwetland restoration goal will also depend on initial groundwaterand soil water conditions, and this will change year by year andwith location in these heterogeneous systems. Modeling suggeststhat the flood pulsing scenario should be relatively robust for themonitored wetland even if groundwater levels are initially lower(dryer conditions) than seen at present, and could result in a longerperiod of wetland saturation if groundwater levels are initiallyhigher (wetter conditions) (Fig. 12). Wetter conditions would likelybe accompanied by an increase of water availability from the HetchHetchy Reservoir, so there would be less need to conserve waterduring controlled flooding, and this could provide opportunitiesfor inundating a larger area or maintaining saturation for a longerperiod of time.
Grain size and carbon analyses of shallow samples collected aspart of the present study, along the primary transect, indicate sig-nificant variations in properties horizontally and with depth. Soilsunderlying adjacent wetland areas, identified initially on the basisof vegetation, are likely to have dissimilar wetting and drainagecharacteristics (Bradley et al., 2010). This suggests that there willbe considerable spatial variability in wetland response to con-trolled flooding, making local soil characterization and monitoringimportant for both wetland delineation and flood management.Our results also suggest that soil textural analysis may have lim-ited use in characterizing hydrologic properties in the absence ofin situ drainage measurements. We suspect that the hydraulic con-ductivity values estimated using in situ soil moisture data andmodel calibration (Table 1) are higher than values estimated basedon grain size distribution because of preferential flow paths result-ing from biological activity (burrowing, root tubules, etc.). Thisinterpretation is consistent with soil moisture data indicatingeffective soil porosity >60%, considerably higher than would be ex-pected from a simple mixture of fine sand and silt, and is furthersupported by field observations of drainage into burrows duringinundation.
The benefits of inundation to maintaining wetland conditions inPoopenaut Valley are likely to vary spatially along the TuolumneRiver, independent of heterogeneity in soil and wetland types. At
the southwestern end of the valley, where the river passes fromalluvium to bedrock, groundwater that flows parallel to the riveris forced to move upward and towards the river. Seepage rates cal-culated from temperature data collected with the soil moisturesensors at L2 show that water tends to seep upward through thewetland soils within a few days after the passage of a flood wave.This helps to extend the beneficial influence of seasonal and con-trolled flooding in this area; a similar benefit may not be achievedhigher (upriver) in the valley.
Riparian wetlands in Poopenaut Valley are likely to be undergo-ing a period of transition, after decades of grazing on the valleyfloor, followed by installation of a large dam and associated mod-ifications to the seasonal hydrograph of the Tuolumne River. Re-peated flood events will help to establish wetland conditions forthe short term, and should have longer term impacts by helpingto deliver sediment to wetland areas. As wetland conditions devel-op and improve, leading to more obligate plants and hydric soils,wetland areas will slow the movement of floodwater, leading tothe deposition and trapping of fine sediment, which should im-prove soil moisture retention in riparian areas. In addition to ben-efiting wetland conditions, controlled flooding can also contributeto improved nutrient cycling and creation of more complex river-ine habitats.
6.2. Study applicability and limitations
Results of this study show that a modest field instrumentationand sampling program can provide insights regarding surfacewater - groundwater interactions and the establishment of riparianwetland conditions. The simultaneous collection of shallowgroundwater level and soil moisture data helped to quantifyingthe relative importance of rising groundwater versus inundationduring flooding, and was essential for calibration of a numericalmodel. Additional field tests and sampling, including more exten-sive soil sampling and slug testing, would have provided additionalbenefit during model calibration. Time, budget, and access limita-tions required that this study be focused on a relatively small area,but results can be used to guide future field and numerical work ifjustified on the basis of restoration and water management goals. Amuch more extensive field and modeling effort would be requiredto account for the heterogeneity of shallow soils and the three-dimensional nature of surface and subsurface fluid flow pathwaysthroughout Poopenaut Valley wetlands.
There are numerous metrics for evaluating the success of wet-land restoration. The USACE definition used in this study wasobservationally and computationally convenient, but satisfyingthis constraint should not be viewed as a de facto indication ofwetland health. There would also be benefit in biological and biog-eohemical sampling and monitoring in order to quantify the suc-cess of wetland restoration efforts over time, ideally donesimultaneously with hydrologic studies to link processes and con-ditions with confidence. When considering wetland restorationand health over even longer time periods, it could also be usefulto incorporate larger floods at five or ten year intervals (Capon,2003; Hughes and Rood, 2003), if water availability permits.
A saturated–unsaturated numerical model proved useful forinterpreting field observations and testing a variety of flood sce-narios. The model domain was cast in two dimensions, followingcareful selection of a focused field transect where this flow regimewas expected (and subsequently confirmed). The representation ofsoil properties was layered, as needed to replicate observed drain-age behavior, but was otherwise highly idealized. The code used forthis analysis, VS2DH, represents transport of a single (liquid)phase, and as such does not simulate air that would be trappedin shallow soils between the rising water table and a wetting frontextending downward following rapid flood inundation (Heliotis
110 T.A. Russo et al. / Journal of Hydrology 432–433 (2012) 98–111
and DeWitt, 1987). This relatively simple model worked well toachieve the stated goals of this project, but a multiphase flow mod-el might be helpful for resolving fine-scale flow paths of both waterand air in the shallow soil. The model also neglected evapotranspi-ration, although VS2DH can represent this process, mainly becausewe were interested in a relatively short time period associatedwith flooding and drainage response. Modeling evapotranspirationis likely to be more important in studies that extend across severalseasons or multiple years, particularly in arid climates (Gerla,1992), and would require collection of additional field data for cal-ibration purposes.
The direct application of these results to restoration projects inother riparian wetlands and floodplains impacted by upstreamflow regulation will depend on specific hydrologic conditions. Butthe overall approach taken in this study should be broadly useful.Simultaneous monitoring of shallow groundwater, soil moisture,stream discharge and stage, and streambed seepage throughout acontrolled flood event provides information that is essential forresolving the relative importance of surface and subsurface hydro-logic processes in saturation of wetland soils. A calibrated model isuseful for evaluation of hypothetical controlled flooding and cli-mate change scenarios, particularly where there are limitationsto the water available for flood releases. Model results could betested and extended through additional monitoring and analyses,including an evaluation of the importance of flood duration, rateof change of discharge during flooding, and the depth to a shallowwater table (Nicol and Ganf, 2000; Sprenger et al., 2002; Siebentrittet al., 2004; Stromberg et al., 2007). Additional studies should becompleted in riparian settings to help determine the typical impor-tance of surface versus subsurface water in developing wetlands,and to assist in resource management for the benefit of environ-mental, agricultural, municipal, and recreational needs.
7. Conclusions
We completed a study of riparian wetland response to a con-trolled flood, combining soil sampling, analyses and in situ datacollection; a two-dimensional saturated–unsaturated numericalmodel of flood response; and evaluation of flood scenarios capableof achieving a desired metric of wetland function based on soil sat-uration and drainage characteristics. Observations of soil moistureand groundwater levels were used for model calibration. The mod-el was subsequently applied using several controlled flooding sce-narios, with the goal of establishing wetland conditions (saturatedsoils at 30 cm depth for 14 consecutive days) while limiting totalwater released during the flood. Several model scenarios werecapable of achieving the wetland metric while discharging consid-erably less water than was released during the 2009 controlledflood.
The ability of riparian soils to maintain wetland conditions inthis setting depends mainly on: the height and duration of theflood wave (which determine the spatial and temporal extent ofinundation), and soil drainage characteristics and the depth tothe underlying water table (which determine the length of timefollowing passage of a flood wave during which saturation is main-tained). In the riparian wetland monitored as part of the presentstudy, inundation was found to be more important than a risingwater table in establishing wetland conditions during a controlledflood, but this result depends, in part on the antecedent water tableelevation. Model scenarios that included a higher initial water ta-ble achieved wetland conditions for a longer time based on thesample flood hydrograph. In contrast, a lower initial water table re-sulted in a somewhat shorter period of shallow soil saturation, butin this case, soil drainage behavior was more important in deter-mining the extent of wetland development.
Soil drainage characteristics during restoration will depend, inturn, on repeated short-term development of wetland conditionsby controlled flooding, as this helps to move sediment out of theprimary channel and into riparian areas, and contributes to an in-crease of organic carbon in shallow soils. Thus the benefits of con-trolled flooding to riparian wetlands should increase with time.Optimizing for multiple benefits from controlled flooding is likelyto become increasingly important in future years, as hydrologicconditions become more variable and demand increases for limitedfresh water resources. Future studies such as this one can help withdeveloping a mechanistic understanding of links between river andwetland hydrology and associated ecosystem function.
Acknowledgements
This research was supported by the Committee on Research(University of California, Santa Cruz), the US National ScienceFoundation Graduate Fellowship Program, and the US NationalPark Service (Award J8CO790007). Critical lab and field supportwas provided by Dan Sampson, Lucas Beem, Kerri Johnson, Ted Ba-ker, Brianne Davidson, Aaron Rinehart, Josh Baccei, and Roger Put-nam. This manuscript benefited from thoughtful reviews by G.Stock and M. Buhler, and two anonymous reviewers.
References
Acreman, M.C., Fisher, J., Stratford, C.J., Mould, D.J., Mountford, J.O., 2007.Hydrological science and wetland restoration: some case studies from Europe.Hydrol. Earth Syst. Sci. 11, 158–169.
Ballantine, K., Schneider, R., 2009. Fifty-five years of soil development in restoredfreshwater depressional wetlands. Ecol. Appl. 19, 1467–1480.
Barbier, E.B., 1993. Sustainable use of wetlands – valuing tropical wetland benefits:economic methodologies and applications. Geogr. J. 159, 22–32.
Bayley, P., 1995. Understanding large river: floodplain ecosystems. BioScience 45(3), 153–158.
Bear, J., 1972. Dynamics of Fluids in Porous Media. American Elsevier, New York, NY.Bendix, J., 1997. Flood disturbance and the distribution of riparian species diversity.
Geogr. Rev. 87 (4), 468–483.Blonquist, J.M., Jones, S.B., Robinson, D.A., 2005. Standardizing characterization of
electromagnetic water content sensors: Part 2. Evaluation of seven sensingsystems. Vadose Zone J. 4, 1059–1069.
Boswell, J.S., Olyphant, G.A., 2007. Modeling the hydrologic response ofgroundwater dominated wetlands to transient boundary conditions:implications for wetland restoration. J. Hydrol. 332, 467–476.
Bovee, K., Scott, M., 2002. Implications of flood pulse restoration for Populusregeneration on the upper Missouri River. River Res. Appl. 18 (3), 287–298.
Bradley, C., 2002. Simulation of the annual water table dynamics of a floodplainwetland, Narborough Bog, UK. J. Hydrol. 261, 150–172.
Bradley, C., Clay, A., Clifford, N.J., Gerrard, J., Gurnell, A.M., 2010. Variations insaturated and unsaturated water movement through an upland floodplainwetland, mid-Wales, UK. J. Hydrol. 393, 349–361.
Bradley, C., Gilvear, D.J., 2000. Saturated and unsaturated flow dynamics in afloodplain wetland. Hydrol. Process. 14, 2945–2958.
Brandt, S., 2000. Classification of geomorphological effects downstream of dams.Catena 40 (4), 375–401.
Brinson, M., Lugo, A., Brown, S., 1981. Primary productivity, decomposition andconsumer activity in freshwater wetlands. Annu. Rev. Ecol. Syst. 12, 123–161.
Brock, M., Rogers, K., 1998. The regeneration potential of the seed bank of anephemeral floodplain in South Africa. Aquat. Bot. 61 (2), 123–135.
Brooks, R.H., Corey, A.T., 1964. Hydraulic properties of porous media. HydrologyPaper No. 3, Civil Engineering Dept. Technical Report, Colo. State Univ., FortCollins, Colo.
Brunke, M., 2002. Floodplains of a regulated southern alpine river (Brenno,Switzerland): ecological assessment and conservation options. Aquat.Conserv. 12 (6), 583–599.
Cabezas, Á., González, E., Gallardo, B., Garcı́a, M., González, M., Comı´ n, F., 2008.Effects of hydrological connectivity on the substrate and understory structure ofriparian wetlands in the Middle Ebro River (NE Spain): implications forrestoration and management. Aquatic Sciences – Research Across Boundaries70 (4), 361–376.
Capon, S., 2003. Plant community responses to wetting and drying in a large aridfloodplain. River Res. Appl. 19 (5-6), 509–520.
Carman, P.C., 1956. Flow of Gases through Porous Media. Butterworths ScientificPublications, London.
Constantz, J., Thomas, C.L., 1996. The use of streambed temperature profiles toestimate the depth, duration and rate of percolation beneath arroyos. WaterResour. Res. 32, 3597–3602.
T.A. Russo et al. / Journal of Hydrology 432–433 (2012) 98–111 111
Costanza, R., dArge, R., de Groot, R., Farber, S., Grasso, M., Hannon, B., Limburg, K.,Naeem, S., ONeill, R., Paruelo, J., Raskin, R., Sutton, P., van den Belt, M., 1997. Thevalue of the world’s ecosystem services and natural capital. Nature 387, 253–260.
Cowardin, L.M., 1978. Wetland classification in United-States. J. Forest. 76, 666–668.Dahl, T.E., 1990. Wetlands Losses in the United States, 1780s to 1980s. Department
of the Interior, Fish and Wildlife Service, Washington, DC.Dimitrov, D.D., Grant, R.F., Lafleur, P.M., Humphreys, E.R., 2010. Modeling the
subsurface hydrology of Mer Bleue Bog. Soil Sci. Soc. Am. J. 74, 680–694.Dynesius, M., Nilsson, C., 1994. Fragmentation and flow regulation of river systems
in the northern third of the world. Science 266, 753–762.Fetter, C.W., 2001. Applied Hydrogeology. Prentice-Hall, NJ.Gerla, P., 1992. The relationship of water-table changes to the capillary fringe,
evapotranspiration, and precipitation in intermittent wetlands. Wetlands 12(2), 91–98.
Graf, W.L., 1999. Dam nation: a geographic census of American dams and theirlarge-scale hydrologic impacts. Water Resour. Res. 35, 1305–1311.
Greene, L., 1987. Yosemite: The park and it’s resources; A history of the discovery,management, and physical development of Yosemite National Park, California.Technical report, National Park Service.
Hatch, C.E., Fisher, A.T., Revenaugh, J.S., Constanz, J., Ruehl, C., 2006. Quantifyingsurface water–groundwater interactions using time series analysis ofstreambed thermal records: method development. Water Resour. Res., 42,W10410.
Hatch, C.E., Fisher, A.T., Ruehl, C., Stemler, G., 2010. Spatial and temporal variationsin streambed hydraulic conductivity quantified with time-series thermalmethods. J. Hydrol. 389, 276–288.
Hazen, A. In Discussion of ‘Dams on sand foundations’ by A.C. Koenig. Trans. AGU,14th Ann. Mtg., 1911, pp. 446–460.
Healy, R.W., 1990. Simulation of solute transport in variably saturated porousmedia with supplemental information on modifications to the US GeologicalSurvey’s computer program VS2D. Technical report, US Geol. Surv. WaterResour. Invest. Rep.
Heliotis, F., DeWitt, C., 1987. Rapid water table responses to rainfall in a northernpeatland ecosystem. J. Am. Water. Resour. Assoc. 23 (6), 1011–1016.
Henson, S.S., Ahearn, D.S., Dahlgren, R.A., Nieuwenhuyse, E.V., Tate, K.W., Fleenor,W.E., 2007. Water quality response to a pulsed-flow event on the MokelumneRiver, California. River Res. Appl. 23, 185–200.
Huber, N.K., 1990. The late Cenozoic evolution of the Tuolumne River, CentralSierra-Nevada, California. Geol. Soc. Am. Bull. 102, 102–115.
Hughes, F.M.R., Rood, S.B., 2003. Allocation of river flows for restoration offloodplain forest ecosystems: a review of approaches and their applicabilityin Europe. Environ. Manage. 32, 12–33.
IPCC. Fourth Assessment Report of the Intergovernmental Panel on Climate Change,2007.
Johansson, M., Nilsson, C., 2002. Responses of riparian plants to flooding in free-flowing and regulated boreal rivers: an experimental study. J. Appl. Ecol. 39 (6),971–986.
Joris, I., Feyen, J., 2003. Modelling water flow and seasonal soil moisture dynamicsin an alluvial groundwater-fed wetland. Hydrol. Earth Syst. Sci. 7 (1), 57–66.
Junk, W.J., Bayley, P.B., Sparks, R.E., 1989. The flood pulse concept in river–floodplain systems. Can. Spec. Publ. Fish. Aqua. Sci. 106, 110–127.
Kondolf, G., 1997. Hungry water: effects of dams and gravel mining on riverchannels. Environ. Manage. 21, 533–552.
Lapalla, E., Healy, R., Weeks, E., 1987. Documentation of computer program vs2d tosolve the equations of fluid flow in variable saturated porous media. Technicalreport, US Geol. Survey. Water Resour. Invest. Rep.
Mahoney, J.M., Rood, S.B., 1998. Streamflow requirements for cottonwood seedlingrecruitment: an integrative model. Wetlands 18, 634–645.
Mertes, L., 1997. Documentation and significance of the perirheic zone oninundated floodplains. Water Resour. Res. 33 (7), 1749–1762.
Michener, W.K., Haeuber, R.A., 1998. Flooding: natural and managed disturbances –a special issue of bioscience devoted to flooding as a disturbance. BioScience 48,677–680.
Middleton, B., 1999. Wetland Restoration: Flood Pulsing and Disturbance Dynamics.John C. Wiley & Sons, Inc., New York.
Middleton, B., 2002. Flood Pulsing in Wetlands: Restoring the Natural HydrologicBalance. John C. Wiley & Sons, Inc., New York.
Moorhead, K., Moynihan, R., Simpson, S., 2000. Soil characteristics of four southernAppalachian fens in North Carolina, USA. Wetlands 20 (3), 560–564.
Nicol, J., Ganf, G., 2000. Water regimes, seedling recruitment and establishment inthree wetland plant species. Mar. Freshwater Res. 51 (4), 305–309.
Nilsson, C., Berggren, K., 2000. Alterations of riparian ecosystems caused by riverregulation. BioScience 50 (9), 783–792.
Orr, C.H., Stanley, E.H., Wilson, K.A., Finlay, J.C., 2007. Effects of restoration andreflooding on soil denitrification in a leveed midwestern floodplain. Ecol. Appl.17, 2365–2376.
Patten, D.T., Harpman, D.A., Voita, M.I., Randle, T.J., 2001. A managed flood on theColorado River: background, objectives, design and implementation. Ecol. Appl.11, 635–643.
Poff, N.L., Allan, J.D., Bain, M.B., Karr, J.R., Prestegaard, K.L., Richter, B.D., Sparks, R.E.,Stromberg, J.C., 1997. The natural flow regime: a paradigm for riverconservation and restoration. BioScience 47, 769–784.
Racz, A.J., Fisher, A.T., Schmidt, C.I., Lockwood, B., Huertos, M.L., 2011. The spatialand temporal dynamics of infiltration during managed aquifer recharge, asquantified using mass balance and thermal methods. Ground Water, in press.
Rains, M., Mount, J., Larsen, E., 2004. Simulated changes in shallow groundwater andvegetation distributions under different reservoir operations scenarios. Ecol.Appl. 14 (1), 192–207.
Revenga, C., Brunner, J., Henninger, N., Payne, R., Kassem, K., 2000. Pilot analysis ofglobal ecosystems. Freshwater systems. Technical report, World ResourcesInstitute.
Robinson, C.T., Uehlinger, U., Monaghan, M.T., 2004. Stream ecosystem response tomultiple experimental floods from a reservoir. Riv. Res. Appl. 20, 359–377.
San Francisco Public Utilities Commission: Water Enterprise, 2009. Water supplyavailability study for city and county of san francisco. Technical report.
Schiemer, F., Baumgartner, C., Tockner, K., 1999. Restoration of floodplain rivers: theDanube restoration project. Regul. River 15 (1-3), 231–244.
Schmadel, N., Neilson, B., Stevens, D., 2010. Approaches to estimate uncertainty inlongitudinal channel water balances. J. Hydrol. 394 (3–4), 357–369.
Shafroth, P., Wilcox, A., Lytle, D., Hickey, J., Andersen, D., Beauchamp, V., Hautzinger,A., McMullen, L., Warner, A., 2010. Ecosystem effects of environmental flows:modelling and experimental floods in a dryland river. Freshwater Biol. 55 (1),68–85.
Shepherd, R.G., 1989. Correlations of Permeability and Grain Size. Ground Water 27,633–638.
Siebentritt, M., Ganf, G., Walker, K., 2004. Effects of an enhanced flood on riparianplants of the River Murray, South Australia. River Res. Appl. 20 (7), 765–774.
Snyder, M., Sloan, L., 2005. Transient future climate over the western United Statesusing a regional climate model. Earth Interact. 9 (11), 1–21.
Sparks, R.E., Nelson, J.C., Yin, Y., 1998. Naturalization of the flood regime inregulated rivers: the case of the upper Mississippi River. BioScience 48, 706–720.
Sprenger, M., Smith, L., Taylor, J., 2002. Restoration of riparian habitat usingexperimental flooding. Wetlands 22 (1), 49–57.
Springer, A.E., Wright, J.M., Shafroth, P.B., Stromberg, J.C., Patten, D.T., 1999.Coupling groundwater and riparian vegetation models to assess effects ofreservoir releases. Water Resour. Res. 35, 3621–3630.
Staes, J., Rubarenzya, M.H., Meire, P., Willems, P., 2009. Modelling hydrologicaleffects of wetland restoration: a differentiated view. Water Sci. Technol. 59,433–441.
Stanford, J., Ward, J., Liss, W., Frissell, C., Williams, R., Lichatowich, J., Coutant, C.,1996. A general protocol for restoration of regulated rivers. Regul. River 12 (4),391–414.
Stock, G.J., Roche, J., Butler, M., Della-Santina, D., Clor, L., Holmquist, J., Schmidt-Gengenbach, J., 2009. Looking downstream: ecological responses to an alteredhydrologic regime downstream of Hetch Hetchy reservoir, yosemite nationalpark 2007. Technical report, Yosemite National Park Division of ResourcesManagement and Science.
Stromberg, J., Beauchamp, V., Dixon, M., Lite, S., Paradzick, C., 2007. Importance oflow-flow and high-flow characteristics to restoration of riparian vegetationalong rivers in arid south-western United States. Freshwater Biol. 52 (4), 651.
Sumner, D., 2007. Effects of capillarity and microtopography on wetland specificyield. Wetlands 27 (3), 693–701.
Thompson, Y., Sandefur, B., Miller, J., Karathanasis, A., 2007. Hydrologic and edaphiccharacteristics of three mountain wetlands in southeastern Kentucky, USA.Wetlands 27 (1), 174–188.
Tockner, K., Malard, F., Ward, J.V., 2000. An extension of the flood pulse concept.Hydrol. Process. 14, 2861–2883.
Turner, K., 1991. Economics and wetland management. Ambio, 59–63.US Army Corps of Engineers, 2008. Interim regional supplement to the corps of
engineers wetland delineation manual: Western mountains, valleys, and coastregion. Technical report, Vicksburg, MS. ERDC/EL TR-08-13.
Van Genuchten, M.T., 1980. A closed-form equation for predicting hydraulicconductivity of unsaturated soils. Soil Sci. Soc. Am. J. 44, 892–898.
Ward, J., Tockner, K., Uehlinger, U., Malard, F., 2001. Understanding natural patternsand processes in river corridors as the basis for effective river restoration. Regul.River 17 (4-5), 311–323.
Whiting, G., Chanton, J., 2001. Greenhouse carbon balance of wetlands: methaneemission versus carbon sequestration. Tellus B 53 (5), 521–528.