journal of issn 1998-2062 - painsa
TRANSCRIPT

Journal of
The South African Chapter of the IASP
ISSN 1998-2062
Volume 13 Number 3
2018
Professionals underestimate patients’ pain: a comprehensive review
Effectiveness of a healthy lifestyle intervention for chronic low back pain: a randomised controlled trial
Psychological factors predict an unfavorable pain trajectory after hysterectomy: a prospective cohort study on chronic postsurgical pain
Use of prescription opioids before and after an operation for chronic pain (lumbar fusion surgery)
Promoting chronic pain self-management education

Journal of The South African Chapter of the IASPVolume 13 Number 3
Editorial
All correspondence to the editor should be addressed to: [email protected]
We all see patients with a range of pathologies requiring our expert medical attention. It is interesting to note that the majority of patients presenting to health professionals complain of pain as their predominant symptom.
The current pain training in South Africa is hopelessly inadequate and most of us are ill prepared to handle or manage these patients. Are we different from other Developed or Developing countries? The simple answer to this is no? Pain education for health professionals is notoriously poor in all countries. The need for better pain education has been identified and changes to medical and paramedical carriculae is being altered in some countries but still remains poor in global terms. Our parent body, the IASP, has recognized the need for better pain education and, as you know, has instituted the Global year as the Global Year for Excellence in Pain Education. You will note that I have included one
fact sheet from this programme in each of our issues this year.
The other situation that arises is that when we do see patients complaining of pain, their pain state appears to be underestimated by us as their health professional. This fact is discussed in one of the featured articles by Seers et al. It is noted that all clinical trials involving pain require some form of measurement of pain intensity. This is mandatory as comparators need to be measurable especially the severity of pain. This enables a researcher to determine whether an analgesic or intervention is proving effective or ineffective.
It follows that we, as clinicians, should be doing exactly the same to determine whether our interventions or drugs are proving effective or not. We see that this is not the case and very few practitioners keep “pain scores” of their patients at the primary or follow-up visits. One of the consequences of this action is that we rely purely on memory to determine therapeutic efficacy. As per the article, we also tend to underestimate the pain severity.
There is a clear message that health care professionals are often poor at assessing the pain of patients for whom they care. Professionals were more likely to underestimate patients’ pain than were the patients’ relatives. Patients reported considerable discordance between the patient and professional rating of global assessment, with patient estimate of a worse state, driven by pain and function. Children reported higher acute pain scores than those of their parents.
Professionals cannot be sure of accurately assessing the pain experience of
the patient before them. It is the patient’s own experience that is important. Patient self-assessment of pain should be the rule in clinical practice, as it is in clinical trials. Pain scoring systems are tools to help. Categorical, visual analogue, and other scoring systems are generally well correlated. Patients with pain consider a satisfactory result to be a pain level of no worse than mild pain, achieved quickly. Patient reported pain of moderate or severe is usually a reason to act.
There is a pressing need for quality control to check that patients are asked about their pain levels and that what they themselves report is accurately recorded. We are abundantly aware of a problem, and in many circumstances, we know the solution, but implementation is long overdue.
Dr. Milton RaffBSc MB ChB FFA(SA)
1

EDITORDr M Raff
BSc (WITS), MBChB (Pret), FFA (SA)
EDITORIAL BOARDProf H Meyer
MBChB(Pret) MPraxMed(Pret) MFGP(SA)
Prof C L Odendaal MBChB, MMed(Anest),
GFN(SA)
Prof D MitchellBSc Hons, MSc, PhD
(all University of the Witwatersrand)
Dr S BaumannBA. Mb.Ch.B.(U.C.T.),
P.G.C.E.(University College of Wales), M.R.C.Psych.(London),
F.C.Psych (S.A.)
Mrs P BergerBSc Physio (Wits), Acup (SA)
Prof E FrohlichMD(Tel-Aviv), DA(SA),
FCA(SA), Master (Med) Pain Management (Syd)
This work is subject to copyright. All rights are reserved, whether the whole or part of the material is concerned, specifically the rights for translation, reprinting reuse of illustrations, broad-casting, reproduction of CD-Rom, microfilm, online publication, or in any other way, and storage in data banks.
The use of registered names trademarks etc. in this publication does not imply, even in the absence of a specific statement, that such names are exempt for the relevant laws and regulations and therefore free for general use.
Product liability: the publishers cannot guarantee the accuracy of any information about the publication of medications contained in this publication. In every individual case, the user must check such information by consulting the relevant literature.
PUBLISHER / MEDSPEC PUBLISHING / ADVERTISING & RATES
Reni Rouncivell, Tel: (012) 657 2327 Fax: 086 561 5122, Cell: 082 441 6904, e-mail: [email protected], Private Bag X1036, Lyttelton, South Africa 0140
SUBSCRIPTIONS & ACCOUNTS
Chantel du Toit, Tel: 082 385 5524, e-mail: [email protected]/[email protected]
COMPREHENSIVE REVIEWProfessionals underestimate patients’ pain: a comprehensive reviewTim Seers, Sheena Derry, Kate Seers, R. Andrew Moore
5
RESEARCH PAPEREffectiveness of a healthy lifestyle intervention for chronic low back pain: a randomised controlled trialAmanda Williams, John Wiggers, Kate M. O’Brien, Luke Wolfenden, Sze Lin Yoong,Rebecca K. Hodder, Hopin Lee, Emma K. Robson, James H. McAuley, Robin Haskins,Steven J. Kamper, Chris Rissel, Christopher M. Williams
15
RESEARCH PAPERUse of prescription opioids before and after an operation for chronic pain (lumbar fusion surgery)Richard A. Deyo, Sara E. Hallvik, Christi Hildebran, Miguel Marino, Nicole O’Kane, Jody Carson, Joshua Van Otterloo, Dagan A. Wright, Lisa M. Millet, Wayne Wakeland
39
GLOBAL YEAR EXCELLENCE IN PAIN EDUCATIONPromoting chronic pain self-management educationGill Furze, Sigridur Zoëga
47
Psychological factors predict an unfavorable pain trajectory after hysterectomy: a prospective cohort study on chronic postsurgical painPatrícia R. Pinto, Teresa McIntyre, Vera Araújo-Soares, Armando Almeida, Patrício Costa
27
2


Comprehensive Review
Professionals underestimate patients’ pain:a comprehensive reviewTim Seersa,b, Sheena Derryb, Kate Seersc, R. Andrew Mooreb,*
AbstractPain assessment by patients is the rule in clinical trials but may not be in clinical practice. We examined studies comparingassessment of pain by patients and professionals in clinical practice using published studies (1990-2016;$20 patients), in English,in an institutional setting, comparing pain assessment within 24 hours by patients and health care professionals. A difference of atleast 10%of themaximum scorewas considered significant.We judged quality on samplingmethod, blinding, and study size. Eightystudies (20,496 patients) provided data from a range of settings and locations; most (51%) used unbiased sampling, andmost (68%)were blind or probably blind. Nine studies with$500 patients involved 58% of patients; 60 with,200 patients involved 25%. Largestudies were more likely to use comprehensive or random sampling and blinding of patients and professionals. Underestimation ofpain by professionals compared with patients was reported by 62/80 studies (78%); there was no difference in 17 (21%) andoverestimation in 1 (1%). Underestimation was reported in 75% of large studies (.500 patients), 91% of mid-sized studies (200-400), and 78% of small studies (,200). High-quality studies (blind, comprehensive, or random sampling, .200 patients)consistently reported underestimation (10/11; 91%). The extent of underestimation tended to increase with pain severity.Professionals consistently tend to underestimate pain compared with assessment by patients. This tendency is more pronouncedwith more severe pain, and the extent of underestimation can be large. It is likely that this contributes to undertreatment of pain.
Keywords: Pain, Measurement, Professional, Patient, Concordance
1. Introduction
The development of modern clinical analgesic research wascharacterised by intense scrutiny of methodology to make resultsreliable and free from bias. Key elements identified early wererandomisation, blinding, and a minimum pain level. Because ofthe subjective nature of pain, another key element was thatpatients made their own assessment of pain intensity orrelief.3,4,22,28,38 No objective test of pain has been developed,and measurement by the patient has been the rule in clinical trialsto this day; early methodological criteria have stood the test oftime.35
Why then do journals carry substantial numbers of articles(around 20 in the past 10 years) examining the question ofdifferences in pain assessment between patients and profes-sionals? Such studiesmay reflect some aspect of clinical practicesuch as a test of new record systems,18 quality improvement
systems,61 or a clinical classification.6 Anecdotally, professionalrather than patient assessment of pain can seem to be the normin everyday practice.
Professionals can have views that are very different frompatients about what is important. In rheumatoid arthritis, forexample, patients consider that pain is the most importantsymptom but rheumatologists consider the number of swollenjoints to have primacy,57 leading to significant discordance inpatient and professional global assessments.13 In advancedcancer, agreement between patient and observer ratings forvarious measures, including pain, was generally modest to low.55
Patients are often not consulted over their pain, evenwhen pain isto be expected, after surgery for example. A third of respondentsto the large European PATHOS study said that pain was notassessed, and 60% had no threshold pain score above whichanalgesics should be given,5 despite low pain being a driver forpatient satisfaction.37 Chronic pain is more complicated, but lowpain is associated with better economic outcomes, includingwork.39,45 Even in standardised settings, pain comes at differenttimes, at different intensities, and sometimes not at all.34 Thoseexperiencing moderate or severe pain consistently desire painreduced to no pain or only mild pain and quickly.42 Members ofthe general public equate moderate, and especially severe, painwith large decrements in health utility values, irrespective of theirown pain status.14
It is over 15 years since a narrative review of the agreementbetween patient and professional pain ratings concluded: “healthprofessionals are not particularly accurate in their pain assess-ments and often tend to underestimate pain in others.”53 Pain isunderestimated.25 Why this is so is unclear. Imaging studiessuggest that the human brain can detect pain intensity of othersfrom facial expressions51; empathy for pain may be underpinned
Sponsorships or competing interests that may be relevant to content are disclosed
at the end of this article.
a Faculty of Medicine, Imperial College London, South Kensington, London, United
Kingdom, b Pain Research and Nuffield Division of Anaesthetics, University of
Oxford, The Churchill, Oxford, United Kingdom, c RCN Research Institute, Warwick
Medical School, University of Warwick, United Kingdom
*Corresponding author. Address: Pain Research and Nuffield Division of Anaes-
thetics, Nuffield Department of Clinical Neurology, University of Oxford, The
Churchill, Oxford OX3 7LE, United Kingdom. Tel.: 144 1865 225674. E-mail
address: [email protected] (R.A. Moore).
Supplemental digital content is available for this article. Direct URL citations appear
in the printed text and are provided in the HTML and PDF versions of this article on
the journal’s Web site (www.painjournalonline.com).
PAIN 159 (2018) 811–818
© 2018 International Association for the Study of Pain
http://dx.doi.org/10.1097/j.pain.0000000000001165
May 2018·Volume 159·Number 5 www.painjournalonline.com 811
Copyright � 2018 by the International Association for the Study of Pain. Unauthorized reproduction of this article is prohibited.5

by neural structures involved in the experience of pain.27
Exhaustive review of factors affecting social judgement of paindescribes its complexity.58
To obtain a more complete assessment of concordance in painrating between patients and professionals, we conducted a system-atic review across all pain states, in adults able to communicate.
2. Methods
2.1. Searching
We searched electronic databases (MEDLINE, EMBASE, CINAHLand PsychInfo) using the terms: “Pain measurement OR (painmeasurement).mp AND (agreement OR disagreement OR concor-dance OR discordance OR judge* OR underestimat* OR over-estimat*). Searching was limited to the period 1990 to May 2016 toensure the contemporary value of comparisons or conclusions.Electronic searches were run independently by 2 authors.
Because observational studies are difficult to identify electron-ically, we supplemented electronic searches with extensiveeclectic searching using reference lists, review articles, andsuggestive applications in PubMed and Google Scholar.31,50 Forexample, titles of studies considered possible includes werepasted into PubMed, and the lists of “Similar articles” and “Citedby PubMed articles” were examined to find whether any otherarticles fulfilled the inclusion criteria. The same process wasfollowed with Google Scholar, in that case examining the citationlist for the index article. For any probable include found by thismethod, a similar process was followed. Extensive eclecticsearching was performed by all authors in different ways.
All likely articles were then discussed by all authors to choosean agreed list of included articles.
We included only English language studies because we did nothaveexpertise to translate nuanced information.Wedidnot considershort abstracts or unpublished studies or contact authors.
2.2. Criteria for inclusion
Included studies had to fulfil the following criteria:(1) Used valid pain assessment method (categorical verbal ratingscale [VRS], numerical rating scale [NRS], or visual analoguescale [VAS]).
(2) Conducted in an institutional setting, comparing painassessment between a patient and any recognised healthcare professional, with paired assessments made within 24hours.
(3) Patient able to understand and convey their rating of pain in thecontext of an appropriate pain assessment tool (for instance,scoring $23 on the mini-mental state examination (MMSE) ornot having severe trauma or dementia).
(4) Study population was $18 years of age.(5) Study involved $20 patients because a small size is highly
affected by the random play of chance.40,43,44,59
Two authors independently reviewed the titles and abstracts todetermine whether they satisfied the inclusion criteria; disagree-ments were resolved through discussion between all authors.Review authors were not blinded at any stage to author’s namesand institutions, journal of publication, or study results.
2.3. Assessment of methodological quality
We made no formal assessment of the risk of bias in studies. Weanticipated that we would find mainly small observational studies
that were heterogeneous in population, setting, and methods.Deeks et al.12 considered that biases in nonrandomised studiesare highly variable in causation, direction, and magnitude. Theyare believed to introduce additional uncertainty, rather than anestimable systematic bias.21
Our interest was in the assessment of pain intensity by 2 ormore individuals, not an intervention to change a patient’scondition. We therefore considered the most important criteria toevaluate were:(1) Study recruitment. We considered that studies encompassinga whole population were less likely to be subject to anyselection bias. Higher quality might then be expected fromcomprehensive samples or randomly selected populationsthan from a convenience population in which selection mighthave occurred.
(2) Blinding. We considered blinded studies in which the 2 partieswere unaware of the other’s assessment to be of higher qualitythan unblinded studies.
(3) Study size. Small studies are highly susceptible to randomchance effects,40,43,59 and considerable biases have beenobserved in small studies.10,11,16,24,44,49,60 We thereforelooked for agreement or disagreement in studies of more than500 patients (large), 200 to 500 patients (moderate), or fewerthan 200 patients (small size, minimum 20).
2.4. Outcome measures
We considered any attempt to provide an estimation of thelevel of disagreement between the patient self-reported painand the pain recorded by the health care professional. Thiscould be by stating the average discrepancy, reportingnumbers within classes of discordance or concordance, orany appropriate statistical result. In cases in which studiesreported observations of multiple episodes of pain, we usedthe average pain intensity or highest reported pain intensity (orthe closest possible approximation to this). Our preferredmeasure of disagreement was for patient–professional scoresto differ by at least 10% of the pain scale being used; thatwould be 1 cm or 10 mm on a VAS, 1 point on a 0- to 10-pointNRS,23 or the equivalent on any categorical or verbal ratingscale. This “Iafrati criterion” is widely reported in studies,though it has been criticised as being somewhat arbitrary.47
We also looked for any other measure of agreement ordisagreement between the patient and health professional.For each study, all authors agreed a judgement on whether itreported evidence of underestimation, overestimation, or nodifference between the patient and professional.
2.5. Data extraction and analysis
Data extracted from studies were entered into a standard formby one of 2 authors. This was then checked by another of the 2authors, and where necessary, by a third review author. Anydisagreements were resolved through discussion.
No statistical analysis was planned a priori. A descriptiveanalysis was considered likely to be the best approachbecause we expected considerable heterogeneity betweenstudies in terms of pain condition, professionals involved, andpain assessment tools used, as well as the almost 25-yearperiod over which they were conducted and published,together with the considerable variation in size. We used theGRADE approach to assess the quality of evidence.20
812 T. Seers et al.·159 (2018) 811–818 PAIN®
Copyright � 2018 by the International Association for the Study of Pain. Unauthorized reproduction of this article is prohibited.6

3. Results
3.1. Description and quality of studies
Individual author searches tended to identify the same potentiallyrelevant studies/articles. The inclusion criteria were met by 80studies, with 20,496 patients providing relevant data (Table 1).
Most patients (58%) were in the 9 studies involving over 500patients, whereas 60 studies reporting on fewer than 200 patients
involved only 25% of the total. A range of different pain states wasincluded, with acute pain, cancer pain, chronic noncancer pain,and pain in the community or nursing homes all represented.Settings for studies were diverse, involving whole hospitals ordepartments, or were limited to specific situations such as unitsfor older people, critical care, burns, or nursing homes. Studieswere predominantly set in Europe, the United States, Australia, orCanada (71/80 studies), but some were conducted in Israel (3),
Table 1
Clinical setting and geographical distribution of studies, according to study size.
Studysize
No. of Setting Country (individual country wherestated)
Sampling Blinding
Studies Participants (range, mean,median)
.500 9 563-3575, 1325, 869 General hospital Finland 8 comprehensive 4 blind
Teaching hospital France 0 random sample 3 probably
blind
Palliative care centres Italy 1 RCT 2 unclear
Outpatients United Kingdom 0 convenience 0 not blind
Cancer wards USA
VA hospital outpatients 11 European countries (1 study)
Emergency department 8 countries worldwide
Primary care
200-
500
11 200-465, 308, 252 General hospital France 9 comprehensive 7 blind
University hospital Italy 1 random sample 0 probably
blind
Cancer centres South Korea 1 RCT 3 unclear
Urology ward Sweden 0 convenience 1 not blind
Emergency department USA
Gynaecology outpatients
Private clinics
Community clinics
Various centres
,200 60 20-198, 87, 71 Teaching hospital Australia 16 comprehensive 30 blind
District hospital Austria 2 random sample 10 probably
blind
Maternity hospital Canada 3 RCT 18 unclear
Chemotherapy unit Finland 29 convenience 2 not blind
Oncology Germany 10 insufficient or no
details
Geriatric unit Iran
ICU Ireland
Critical care Israel
Palliative care unit Italy
Burns unit the Netherlands
Coronary care unit Slovenia
Medical ward South Africa
Emergency department Sweden
Urology ward Switzerland
Hospital outpatients Turkey
Orthopaedic outpatients United Kingdom
Rheumatology outpatients USA
General surgery
Gynaecological surgery
Orthopaedic surgery
Trauma surgery
Vascular surgery
Out-of-hospital emergency
services
Family medicine
Sheltered accommodation
Nursing homes, community
care
Community
ICU, intensive care unit; RCT, randomised controlled trial; VA, Veterans Administration.
May 2018·Volume 159·Number 5 www.painjournalonline.com 813
Copyright � 2018 by the International Association for the Study of Pain. Unauthorized reproduction of this article is prohibited.7

Turkey (2), Iran (1), Kuwait (1), South Korea (1), and South Africa(1). References for the included studies are in Supplementary file1 (available online at http://links.lww.com/PAIN/A535), anda detailed table describing the studies in terms of setting,location, sampling, and blinding in Supplementary file 2, togetherwith a summary of the results in individual studies (available onlineat http://links.lww.com/PAIN/A535).
There was a tendency for older studies to be smaller (Supple-mentary file 3, available online at http://links.lww.com/PAIN/A535).The decade between 1990 and 1999 had 43% of all studies, but24%of all patients. Thedecadebetween2000and2009had41%ofstudies and49%ofpatients. Theperiod from2010 to2016had16%of studies but 27% of patients. Sixteen of the 20 studies involvingmore than 200 patients were published since 2000, and wereconducted principally in the United States and Europe.
About half of the studies used comprehensive (or probablycomprehensive) sampling (41%), random sampling (4%), or wereanalyses of randomised trials (6%); the remainder were conve-nience samples (38%), or there was insufficient information tomake a judgement (10%). Only one of the 20 studies involvingmore than 200 patients used a convenience sample comparedwith 29/60 studies involving fewer than 200.
Most studies (68%) were blind or probably blind, meaning thatneither the patient nor the professional was aware of each other’spain assessment score; the largest studies (.500 patients) weremore likely to be blind (78%). Only 3 studies (4%) were explicitlynot blind, and in the remainder (18%), the method of blinding wasunclear or not given (Table 1).
Pain assessments were usually made using the standard VASor NRS (100 mm or 10 cm) or VRS (4-point), although a fewstudies used nonstandard variations, such as a 15-cm VAS, a 3-or 6-point VRS, and a 21-point box scale. Some studies usedmore than one scale, and others converted one scale intoanother, for example, a VAS score into a VRS. A few studiesreported only the presence or absence of pain, without anyattempt to measure its intensity. Almost all of the studies involvedpatients with a range of pain scores, frommild pain to severe pain.
Agreement or disagreement was formally assessed in 59studies, most frequently in larger studies; definitions of discor-dance used in the studies are shown in Table 2. All definitions ofdisagreement were equivalent to a difference of at least 1 in 10, or10%of the available score, and frequently higher, especially in thelargest studies. Although the level of disagreement was notassessed in the remaining 21 studies, information was providedthat allowed a comparison to bemade on the level of discrepancybetween the patient and professional, such as mean pain scoresor statistical comparisons.
3.2. Degree of patient and professional agreement
Using these criteria, underestimation of pain by the professionalcompared with the patient was reported by 62 of the 80 studies
(78%; Table 3); 17 showed no difference, and in only a singlestudy in patients with burns was there any consistentoverestimation.15
Nine studies assessed between 563 and 3575 patients each(mean study size 1325, median 869). In 7, disagreement betweenthe patient and professional occurred in 10% to 68% of dyads,and group means disagreed by 10/100 to 30/100. Professionalunderestimation of pain compared with the patient was reportedin 6 studies, ranging from “minor” (undefined) to 9 times morefrequent underestimation than overestimation. No clear directionwas apparent in 3 studies, one of which reported overestimationfor incident pain and underestimation for neuropathic pain. The 4studies that were both blinded and had comprehensive orrandom selection reported significant underestimation. Morefrequent underestimation than overestimation was reported forhigher levels of pain intensity in 3 studies that specifically lookedfor an effect.30,32,36
Eleven studies assessed 200 to 465 patients each (mean studysize 308, median 252). In 6 studies, disagreement between thepatient and professional occurred in 33% to 68% of dyads butanother reported 65% to 80% for patients with moderate or severepain. Another reported a mean difference between patient andprofessional pain scores of 29/100. Professional underestimation ofpain compared with the patient was reported in 10 studies, rangingfrom 1.5 to 3 times greater underestimation than overestimation or“significant” or “mainly underestimation”; in 1 study, there was noclear direction. More frequent underestimation than overestimationwas reportedwith higher pain intensity in 1 study. Six of 7 studies thatwere both blinded and had comprehensive or random selectionreported significant underestimation.
Sixty studies assessed 20 to 198 patients each (mean studysize 87, median 71). In 30 studies, disagreement between patientand professional occurred in 15% to 98% of dyads. Professionalunderestimation of pain compared with that of the patient wasreported in 46 studies, ranging from 1.5 to 10 times greaterunderestimation than overestimation, or from “minor” to “major”underestimation. No direction was reported in 13 studies. Onestudy in patients with burns reported overestimation. Morefrequent underestimation than overestimation was reported withhigher pain intensity in 13 studies. Twenty-three of 27 studies thatwere both blinded and had comprehensive or random selectionreported significant underestimation.
3.3. GRADE evaluation
Because of the observational design of the studies, our initialevaluation of the evidence was low quality. We uprated ourassessment of quality to moderate-to-high for 4 reasons:(1) Themagnitude of the degree of underestimation was large andconsistent.
(2) We could identify no confounding that would suggesta spurious cause for underestimation or overestimation.
Table 2
Definitions of discordance.
Study size No. of studies (%) No. of patients (%) Definitions of disagreement (VAS equivalent)
‡1/10 ‡2/10 ‡3/10 Other Undefined Not assessed*
.500 9 (11) 11,922 (58) 1 4 0 4 0 0
200-500 11 (14) 3387 (16) 3 1 0 2 5 0
,200 60 (74) 5187 (25) 14 7 1 6 11 21
* Discordance not formally assessed but patient and professional results reported.
814 T. Seers et al.·159 (2018) 811–818 PAIN®
Copyright � 2018 by the International Association for the Study of Pain. Unauthorized reproduction of this article is prohibited.8

(3) There was a greater effect in studies of higher quality,irrespective of size. A greater proportion of studies reportedunderestimation in which studies were both blind and hadcomprehensive or random sampling (33/38; 87% comparedwith 78% overall), and with 10/11 (91%) of studies with .200patients reporting underestimation.
(4) We judged there to be the equivalent of a dose–response inunderestimation. A number of large studies examining a linkbetween the degree of underestimation and the patient-reported pain severity showed greater underestimation inpatients with more severe pain.
4. Discussion
This systematic review has several strengths. Studies involveddifferent countries and a broad range of clinical conditions wherepain is frequent, such as hospital settings, outpatients, primarycare, and nursing homes. There was a clear and consistentmessage, that is, professionals frequently underestimate paincompared with the patient report. Underestimation was reportedin 75% of large studies, 91% of mid-sized studies, and 78% ofsmall studies. Underestimation was more frequent in larger ofhigher quality studies. Findingswere consistent in different clinicalsettings, and despite the use of different pain scales and varyingdefinitions of agreement or disagreement. Consistent over-estimation of pain by professionals was reported in a single smallstudy. Although there may be concerns over quality and size ofthe studies and the measurement and magnitude of theunderestimation, the fact of generalised underestimation seemsto be incontrovertible. This was especially the case with higherlevels of pain intensity. Our GRADE assessment indicated theevidence to be moderate-to-high quality.
Assessment of sources of bias is largely undefined for the typeof studies in this review. We judged the most critical issues weresampling method, blinding of the patient and professional to theother’s score, and study size. Most studies (51%) usedcomprehensive (or probably comprehensive) sampling, randomsampling, or analyses of randomised trials; 19/20 of the largeststudies used unbiased sampling. Most studies (68%) were blindor probably blind, with only 4% clearly not blind. Few studies werelarge, with only 9 studies (but 58% of all patients) involving over500 patients, and 74%of patients were in the 20 studies with over200 patients. Large studies were more likely to use comprehen-sive or random sampling, and blinding of the patient andprofessional. Large studies of the highest quality were moreconsistent in reporting underestimation.
A particular issue was the degree of difference required fora result to be judged a disagreement. All of the formal measuresused a criterion of 10%of the value of the pain scale used (1/10 or10/100). This is not a small difference. Farrar et al.17 suggestedthat minimal clinically important differences in pain were around33%, but that was an absolute change in an individual.Differences of 10% or above in mean pain scores between activedrug and placebo are indicative of “effective” drugs becausesome get good pain relief but some do not, even with the bestdrugs.41 Nevertheless, varying definitions of what constituteddisagreement represents a weakness, although no reasonableexplanation of changing definitions would affect the direction ofthe result. An analysis according to whether or not pain was at theacceptable level of no pain or noworse thanmild pain is unlikely tohave changed the findings, and may have made the comparisonmore stark.42
A further weakness is the difficulty of ascertaining whether allappropriate studies have been identified. Searching for observa-tional studies electronically has weaknesses, but we supple-mented this with other methods found to be successful in similarcircumstances.31,50 We did not have the skills adequately totranslate studies in languages other than English. An updatedsearch in PubMed to May 2017 identified one additional studythat satisfied our inclusion criteria. This study supports thegeneral findings of this review, and in particular the greaterunderestimation of severe pain.52
There is a clear message that health care professionals areoften poor at assessing the pain of patients for whom they care.Our findings extend those of Kappesser and Williams,26 whoreviewed 13 studies that looked at patient-observer agreementand found that professionals were more likely to underestimatepatients’ pain than were the patients’ relatives. A systematicreview of 12 studies in rheumatoid arthritis (11,879 patients)reported considerable discordance between the patient andprofessional rating of global assessment, with patient estimate ofa worse state, driven by pain and function.13 Children reportedhigher acute pain scores than those of their parents.33 It has beenargued that professionals can become “numb” to suffering.47
Pain professionals may be better than other health careprofessionals in assessing patients’ pain, at least in one exampleof paediatric intensive care nurses.29
The reason why pain is underestimated is interesting. Patientand clinician use information largely inaccessible to the other: thepatient uses his or her own beliefs about the pain and underlyingcauses; the clinician uses the patient’s behaviour, facialexpression, and information about the disorder presumed to
Table 3
Direction of disagreement.
Study size Professional pain score compared with that of patients
Underestimation No direction Overestimation
All studies
.500 6 3 0
200-500 10 1 0
,200 46 13 1
All studies 62 17 1
Studies both blind and comprehensive and
random sampling
.500 4 0 0
200-500 6 1 0
,200 23 2 0
All studies 24 3 0
May 2018·Volume 159·Number 5 www.painjournalonline.com 815
Copyright � 2018 by the International Association for the Study of Pain. Unauthorized reproduction of this article is prohibited.9

cause the pain, and knowledge of the condition.58 Perhapsdifferent estimations are to be expected and may be resistant tochange. Even when exposed to the patient’s rating of pain afterestimating it blind to that rating, clinicians do not adjust theirestimates much toward the patient’s rating.48
Understanding of causation is likely to help in finding ways toovercome underestimation by professionals.58 At present,however, the fact of significant underestimation is of primaryimportance. Pain assessment and report by the patient has beenaccepted as an absolute requirement for pain trials for over halfa century.3,4,22,28,38 A recent guideline on management ofpostoperative pain states “because pain is inherently subjective,patient self-report is the primary basis of all pain assessments.”7
Moreover, studies consistently demonstrate that improvementsin pain therapy in hospital and especially in postoperative patientscome from pain assessment by the patient, action when painbreaches a threshold, and re-evaluation of pain by thepatient.1,2,46,61 Yet painful conditions are among the mostcommon afflicting humans worldwide, and associated withconsiderable numbers of years living with disability,63 and surveysconsistently show pain, including severe pain, to be a commonexperience even in the hospital.19
These studies were conducted between 1991 and 2016, withno indication that the situation is improving. There will becircumstances in which patients cannot communicate their pain,but when they can, it is the patient’s report that is important, asaccepted for clinical trials for decades22 and as current guidancemakes clear in some institutions.54 When professionals do notask or believe the patient, the result is that significant pain isundertreated in a large proportion of them.64 The practicalmessage is to have pain measured regularly by the patient wherepossible, to set thresholds for action and to act on high painscores, again as some guidance recommends.1,54
Because professionals can only ever estimate the patient’spain, it may not be surprising that patient and professional actualpain scores do not always agree. Professionals should thereforeavoid assuming that their estimated score is accurate—thepatient needs to be asked about their own pain. A concern is thathealth care professionals may value their own rating over that ofthe patient: they know the patient’s rating but discount it.
5. Conclusions and recommendations
(1) Results of this systematic review emphasise that professionalscannot be sure of accurately assessing the pain experience ofthe patient before them. It is the patient’s own experience thatis important. In 1946, Beecher4 described eliciting pain levelsfrom awounded soldier by asking the question “As you lie thereare you having any pain?” This would be a good first step.
(2) Patient self-assessment of pain should be the rule in clinicalpractice, as it is in clinical trials.
(3) Other than for quality improvement purposes,18,61 there is nocompelling reason for continuing to perform and publishstudies comparing pain scoring by the patient and pro-fessional. With half a century of research consistently pro-ducing the same result, it is time to stop. Systematic researchhas identified similar circumstances previously.56
(4) New research might profitably take different directions tobetter understand the problem of pain underestimation byprofessionals. These may include, but are not restricted to,investigating what impact it may have on patients and healthcare systems, its psychological underpinnings, the identifica-tion of its correlates, and perhaps pragmatic mechanisms to
manipulate its magnitude or ameliorate its effects, for example,along the lines of providing a pain-free hospital.62
(5) Pain scoring systems are tools to help. Categorical, visualanalogue, and other scoring systems are generally wellcorrelated.8,9
(6) Patients with pain consider a satisfactory result to be a painlevel of no worse than mild pain, achieved quickly. Patient-reported pain of moderate or severe (more than 30/100mm ona 100-mm VAS) is usually a reason to act.There is a pressing need for quality control to check that
patients are asked about their pain levels and that what theythemselves report is accurately recorded. That, together withexamples of what canwork in particular pain situations, especiallyinmanaging chronic noncancer pain, is today’s research agenda.We are abundantly aware of a problem, and in many circum-stances, we know the solution, but implementation is longoverdue.
Conflict of interest statement
The authors have no conflict of interest to declare.This work had no specific funding, other than with institutional
support from the Oxford Pain Research Trust. All authors wereinvolved with the initial discussions about the scope of the reviewand whether such a review was possible. T. Seers and S. Derryextracted data, which was checked and added to by K. Seersand R. A. Moore. All authors were involved in the analyses andinterpretation of available data, in the writing of the various drafts,and in approving the final version of the article.
Acknowledgements
The authors are grateful for additional insights and adviceprovided by 3 anonymous peer reviewers.
Appendix A. Supplemental digital content
Supplemental digital content associated with this article can befound online at http://links.lww.com/PAIN/A535.
Article history:Received 25 May 2017Received in revised form 16 November 2017Accepted 12 January 2018Available online 18 January 2018
References
[1] Aldington DJ, McQuay HJ, Moore RA. End-to-end military painmanagement. Philos Trans R Soc Lond B Biol Sci 2011;366:268–75.
[2] Bardiau FM, Taviaux NF, Albert A, Boogaerts JG, Stadler M. Anintervention study to enhance postoperative pain management. AnesthAnalg 2003;96:179–85.
[3] Beecher HK, Keats AS, Mosteller F, Lasagna L. The effectiveness of oralanalgesics (morphine, codeine, acetylsalicylic acid) and the problem ofplacebo “reactors” and “non-reactors”. J Pharmacol Exp Ther 1953;109:393–400.
[4] Beecher HK. Pain in menwounded in battle. Ann Surg 1946;123:96–105.[5] Benhamou D, Berti M, Brodner G, De Andres J, Draisci G, Moreno-
Azcoita M, Neugebauer EA, SchwenkW, Torres LM, Viel E. Postoperativeanalgesic therapy observational survey (PATHOS): a practice patternstudy in 7 central/southern European countries. PAIN 2008;136:134–41.
[6] Brunelli C, Costantini M, Di Giulio P, Gallucci M, Fusco F, Miccinesi G,Paci E, Peruselli C, Morino P, Piazza M, Tamburini M, Toscani F. Quality-of-life evaluation: when do terminal cancer patients and health-careproviders agree? J Pain Symptom Manage 1998;15:151–8.
816 T. Seers et al.·159 (2018) 811–818 PAIN®
Copyright � 2018 by the International Association for the Study of Pain. Unauthorized reproduction of this article is prohibited.10
[7] Chou R, Gordon DB, de Leon-Casasola OA, Rosenberg JM, Bickler S,Brennan T, Carter T, Cassidy CL, Chittenden EH, Degenhardt E,Griffith S, Manworren R, McCarberg B, Montgomery R, Murphy J,Perkal MF, Suresh S, Sluka K, Strassels S, Thirlby R, Viscusi E, WalcoGA, Warner L, Weisman SJ, Wu CL. Management of postoperativepain: a clinical practice guideline from the American Pain Society, theAmerican Society of Regional Anesthesia and Pain Medicine, and theAmerican Society of Anesthesiologists’ Committee on RegionalAnesthesia, Executive Committee, and Administrative Council.J Pain 2016;17:131–57.
[8] Collins SL, Edwards J, Moore RA, Smith LA, McQuay HJ. Seekinga simple measure of analgesia for mega-trials: is a single globalassessment good enough? PAIN 2001;91:189–94.
[9] De Conno F, Caraceni A, Gamba A, Mariani L, Abbattista A, Brunelli C, LaMura A, Ventafridda V. Pain measurement in cancer patients:a comparison of six methods. PAIN 1994;57:161–6.
[10] Dechartres A, Altman DG, Trinquart L, Boutron I, Ravaud P. Associationbetween analytic strategy and estimates of treatment outcomes in meta-analyses. JAMA 2014;312:623–30.
[11] Dechartres A, Trinquart L, Boutron I, Ravaud P. Influence of trial samplesize on treatment effect estimates: meta-epidemiological study. BMJ2013;346:f2304.
[12] Deeks JJ, Dinnes J, D’Amico R, Sowden AJ, Sakarovitch C, Song F,Petticrew M, Altman DG; International Stroke Trial Collaborative Group,European Carotid Surgery Trial Collaborative Group. Evaluating non-randomised intervention studies. Health Technol Assess 2003;7:iii–x,1–173.
[13] Desthieux C, Hermet A, Granger B, Fautrel B, Gossec L. Patient-physician discordance in global assessment in rheumatoid arthritis:a systematic literature review with meta-analysis. Arthritis Care Res(Hoboken) 2016;68:1767–73.
[14] Eldabe S, Lloyd A, Verdian L, Meguro M, Maclaine G, Dewilde S. Elicitinghealth state utilities from the general public for severe chronic pain. Eur JHealth Econ 2010;11:323–30.
[15] Everett JJ, Patterson DR, Marvin JA, Montgomery B, Ordonez N,Campbell K. Pain assessment from patients with burns and their nurses.J Burn Care Rehabil 1994;15:194–8.
[16] Fanelli D, Costas R, Ioannidis JP. Meta-assessment of bias in science.Proc Natl Acad Sci U S A 2017;114:3714–9.
[17] Farrar JT, Portenoy RK, Berlin JA, Kinman JL, Strom BL. Defining theclinically important difference in pain outcome measures. PAIN 2000;88:287–94.
[18] Goulet JL, Brandt C, Crystal S, Fiellin DA, Gibert C, Gordon AJ, Kerns RD,Maisto S, Justice AC. Agreement between electronic medical record-based and self-administered pain numeric rating scale: clinical andresearch implications. Med Care 2013;51:245–50.
[19] Gregory J, McGowan L. An examination of the prevalence of acute painfor hospitalised adult patients: a systematic review. J Clin Nurs 2016;25:583–98.
[20] Guyatt GH, Oxman AD, Vist GE, Kunz R, Falck-Ytter Y, Alonso-Coello P,Schunemann HJ; GRADE Working Group. GRADE: an emergingconsensus on rating quality of evidence and strength ofrecommendations. BMJ 2008;336:924–6.
[21] Higgins JP, Green S, editors. Cochrane handbook for systematic reviewsof interventions version 5.1.0 (updated March 2011). The CochraneCollaboration, 2011. Available from handbookcochrane.org. Chapter13.5.1.2.
[22] Houde RW, Wallenstein SL, Rogers A. Clinical pharmacology ofanalgesics. 1. A method of assaying analgesic effect. Clin PharmacolTher 1960;1:163–74.
[23] Iafrati NS. Pain on the burn unit: patient vs nurse perceptions. J Burn CareRehabil 1986;7:413–6.
[24] IntHout J, Ioannidis JP, Borm GF, Goeman JJ. Small studies are moreheterogeneous than large ones: a meta-meta-analysis. J Clin Epidemiol2015;68:860–9.
[25] Kappesser J, Williams AC, Prkachin KM. Testing two accounts of painunderestimation. PAIN 2006;124:109–16.
[26] Kappesser J, Williams AC. Pain estimation: asking the right questions.PAIN 2010;148:184–7.
[27] Lamm C, Decety J, Singer T. Meta-analytic evidence for common anddistinct neural networks associated with directly experienced pain andempathy for pain. Neuroimage 2011;54:2492–502.
[28] Lasagna L, De Kornfeld TJ. Analgesic potency of normorphine in patientswith postoperative pain. J Pharmacol Exp Ther 1958;124:260–3.
[29] Latimer M, Jackson PL, Eugene F, MacLeod E, Hatfield T, Vachon-Presseau E, Michon PE, Prkachin KM. Empathy in paediatric intensivecare nurses part 1: behavioural and psychological correlates. J Adv Nurs2017;73:2676–85.
[30] Laugsand EA, Sprangers MA, Bjordal K, Skorpen F, Kaasa S, Klepstad P.Health care providers underestimate symptom intensities of cancerpatients: a multicenter European study. Health Qual Life Outcomes 2010;8:104.
[31] Lemeshow AR, Blum RE, Berlin JA, Stoto MA, Colditz GA. Searching oneor two databases was insufficient for meta-analysis of observationalstudies. J Clin Epidemiol 2005;58:867–73.
[32] Mantyselka P, Kumpusalo E, Ahonen R, Takala J. Patients’ versusgeneral practitioners’ assessments of pain intensity in primary carepatients with non-cancer pain. Br J Gen Pract 2001;51:995–7.
[33] Matziou V, Vlachioti E, Megapanou E, Ntoumou A, Dionisakopoulou C,Dimitriou V, Tsoumakas K, Matziou T, Perdikaris P. Perceptions ofchildren and their parents about the pain experienced during theirhospitalization and its impact on parents’ quality of life. Jpn J Clin Oncol2016;46:862–70.
[34] McQuay HJ, Bullingham RE, Moore RA, Evans PJ, Lloyd JW. Somepatients don’t need analgesics after surgery. J R Soc Med 1982;75:705–8.
[35] McQuay HJ, Derry S, Eccleston C, Wiffen PJ, Moore RA. Evidence foranalgesic effect in acute pain—50 years on. PAIN 2012;153:1364–7.
[36] Melotti RM, Samolsky Dekel BG, Carosi F, Ricchi E, Chiari P, D’Andrea R,Di NinoG.Categories of congruence between inpatient self-reported painand nurses evaluation. Eur J Pain 2009;13:992–1000.
[37] Mhuircheartaigh RJ, Moore RA,McQuay HJ. Analysis of individual patientdata from clinical trials: epidural morphine for postoperative pain. Br JAnaesth 2009;103:874–81.
[38] Modell W, Houde RW. Factors influencing clinical evaluation of drugs;with special reference to the double-blind technique. J Am Med Assoc1958;167:2190–9.
[39] Moore RA, Derry S, Taylor RS, Straube S, Phillips CJ. The costs andconsequences of adequately managed chronic non-cancer pain andchronic neuropathic pain. Pain Pract 2014;14:79–94.
[40] Moore RA, Gavaghan D, Tramer MR, Collins SL, McQuay HJ. Size iseverything—large amounts of information are needed to overcomerandom effects in estimating direction and magnitude of treatmenteffects. PAIN 1998;78:209–16.
[41] Moore RA, Moore OA, Derry S, Peloso PM, Gammaitoni AR, Wang H.Responder analysis for pain relief and numbers needed to treat in ameta-analysis of etoricoxib osteoarthritis trials: bridging a gap between clinicaltrials and clinical practice. Ann Rheum Dis 2010;69:374–9.
[42] Moore RA, Straube S, Aldington D. Pain measures and cut-offs—“noworse than mild pain” as a simple, universal outcome. Anaesthesia 2013;68:400–12.
[43] Nguyen TL, Collins GS, Lamy A, Devereaux PJ, Daures JP, Landais P, LeManach Y, Le Manach Y. Simple randomization did not protect againstbias in smaller trials. J Clin Epidemiol 2017;84:105–13.
[44] Nuesch E, Trelle S, Reichenbach S, Rutjes AW, Tschannen B, AltmanDG, Egger M, Juni P. Small study effects in meta-analyses ofosteoarthritis trials: meta-epidemiological study. BMJ 2010;341:c3515.
[45] Patel AS, Farquharson R, Carroll D, Moore A, Phillips CJ, Taylor RS,Barden J. The impact and burden of chronic pain in the workplace:a qualitative systematic review. Pain Pract 2012;12:578–89.
[46] Pogatzki-Zahn E, Kutschar P, Nestler N, Osterbrink J. A prospectivemulticentre study to improve postoperative pain: identification ofpotentialities and problems. PLoS One 2015;10:e0143508.
[47] Prkachin KM, Solomon PE, Ross J. Underestimation of pain by health-care providers: towards a model of the process of inferring pain in others.Can J Nurs Res 2007;39:88–106.
[48] Riva P, Rusconi P, Montali L, Cherubini P. The influence of anchoring onpain judgment. J Pain Symptom Manage 2011;42:265–77.
[49] Roberts I, Ker K, Edwards P, Beecher D, Manno D, Sydenham E. Theknowledge system underpinning healthcare is not fit for purpose andmust change. BMJ 2015;350:h2463.
[50] Ruppen W, Derry S, McQuay H, Moore RA. Incidence of epiduralhematoma, infection, and neurologic injury in obstetric patients withepidural analgesia/anesthesia. Anesthesiology 2006;105:394–9.
[51] Saarela MV, Hlushchuk Y, Williams AC, Schurmann M, Kalso E, Hari R.The compassionate brain: humans detect intensity of pain from another’sface. Cereb Cortex 2007;17:230–7.
[52] Samolsky Dekel BG, Gori A, Vasarri A, Sorella MC, Di Nino G, Melotti RM.Medical evidence influence on inpatients and nurses pain ratingsagreement. Pain Res Manag 2016;2016:9267536.
[53] Solomon P. Congruence between health professionals’ and patients’pain ratings: a review of the literature. Scand J Caring Sci 2001;15:174–80.
[54] Somerset J. Pain assessment and management guidance for all wardsand units. Mid Essex Hospital Services NHS Trust Clinical Guideline11027. September 2014.
May 2018·Volume 159·Number 5 www.painjournalonline.com 817
Copyright � 2018 by the International Association for the Study of Pain. Unauthorized reproduction of this article is prohibited.11

[55] Stone P, Gwilliam B, Keeley V, Todd C, Gittins M, Kelly L, Barclay S,Roberts C. Patients’ reports or clinicians’ assessments: which are betterfor prognosticating? BMJ Support Palliat Care 2012;2:219–23.
[56] Straube S, HardenM, Schroder H, Arendacka B, Fan X,Moore RA, FriedeT. Back schools for the treatment of chronic low back pain: possibility ofbenefit but no convincing evidence after 47 years of research-systematicreview and meta-analysis. PAIN 2016;157:2160–72.
[57] Studenic P, Radner H, Smolen JS, Aletaha D. Discrepancies betweenpatients and physicians in their perceptions of rheumatoid arthritisdisease activity. Arthritis Rheum 2012;64:2814–23.
[58] Tait RC, Chibnall JT, Kalauokalani D. Provider judgments of patients inpain: seeking symptom certainty. Pain Med 2009;10:11–34.
[59] Thorlund K, Imberger G, Walsh M, Chu R, Gluud C, Wetterslev J, GuyattG, Devereaux PJ, Thabane L. The number of patients and events requiredto limit the risk of overestimation of intervention effects in meta-analysis–asimulation study. PLoS One 2011;6:e25491.
[60] Turner RM, Bird SM, Higgins JP. The impact of study size on meta-analyses: examination of underpowered studies in Cochrane reviews.PLoS One 2013;8:e59202.
[61] Usichenko TI, Rottenbacher I, Kohlmann T, Julich A, Lange J, Mustea A,Engel G, Wendt M. Implementation of the quality management systemimproves postoperative pain treatment: a prospective pre-/post-interventional questionnaire study. Br J Anaesth 2013;110:87–95.
[62] VisentinM. Towards a pain-free hospital. A project and a campaign for theimprovement of health care [in Italian]. Recenti ProgMed 1999;90:321–4.
[63] Vos T, Flaxman AD, Naghavi M, Lozano R, Michaud C, Ezzati M, ShibuyaK, Salomon JA, Abdalla S, Aboyans V, Abraham J, Ackerman I, AggarwalR, Ahn SY, Ali MK, Alvarado M, Anderson HR, Anderson LM, AndrewsKG, Atkinson C, Baddour LM, Bahalim AN, Barker-Collo S, Barrero LH,Bartels DH, Basanez MG, Baxter A, Bell ML, Benjamin EJ, Bennett D,Bernabe E, Bhalla K, Bhandari B, Bikbov B, Bin Abdulhak A, Birbeck G,Black JA, Blencowe H, Blore JD, Blyth F, Bolliger I, Bonaventure A,Boufous S, Bourne R, Boussinesq M, Braithwaite T, Brayne C, Bridgett L,Brooker S, Brooks P, Brugha TS, Bryan-Hancock C, Bucello C,Buchbinder R, Buckle G, Budke CM, Burch M, Burney P, Burstein R,Calabria B, Campbell B, Canter CE, Carabin H, Carapetis J, Carmona L,Cella C, Charlson F, Chen H, Cheng AT, Chou D, Chugh SS, Coffeng LE,Colan SD, Colquhoun S, Colson KE, Condon J, Connor MD, Cooper LT,Corriere M, Cortinovis M, de Vaccaro KC, Couser W, Cowie BC, CriquiMH, Cross M, Dabhadkar KC, Dahiya M, Dahodwala N, Damsere-DerryJ, Danaei G, Davis A, De Leo D, Degenhardt L, Dellavalle R, DelossantosA, Denenberg J, Derrett S, Des Jarlais DC, Dharmaratne SD, Dherani M,Diaz-Torne C, Dolk H, Dorsey ER, Driscoll T, Duber H, Ebel B, Edmond K,Elbaz A, Ali SE, Erskine H, Erwin PJ, Espindola P, Ewoigbokhan SE,Farzadfar F, Feigin V, Felson DT, Ferrari A, Ferri CP, Fevre EM, FinucaneMM, Flaxman S, Flood L, Foreman K, Forouzanfar MH, Fowkes FG,
Franklin R, Fransen M, Freeman MK, Gabbe BJ, Gabriel SE, Gakidou E,Ganatra HA, Garcia B, Gaspari F, Gillum RF, Gmel G, Gosselin R,Grainger R, Groeger J, Guillemin F, Gunnell D, Gupta R, Haagsma J,Hagan H, Halasa YA, Hall W, Haring D, Haro JM, Harrison JE, HavmoellerR, Hay RJ, Higashi H, Hill C, Hoen B, Hoffman H, Hotez PJ, Hoy D, HuangJJ, Ibeanusi SE, Jacobsen KH, James SL, Jarvis D, Jasrasaria R,Jayaraman S, Johns N, Jonas JB, Karthikeyan G, Kassebaum N,Kawakami N, Keren A, Khoo JP, King CH, Knowlton LM, Kobusingye O,Koranteng A, Krishnamurthi R, Lalloo R, Laslett LL, Lathlean T, LeasherJL, Lee YY, Leigh J, Lim SS, Limb E, Lin JK, Lipnick M, Lipshultz SE, LiuW, Loane M, Ohno SL, Lyons R, Ma J, Mabweijano J, MacIntyre MF,Malekzadeh R, Mallinger L, Manivannan S, Marcenes W, March L,Margolis DJ, Marks GB, Marks R, Matsumori A, Matzopoulos R, MayosiBM, McAnulty JH, McDermott MM, McGill N, McGrath J, Medina-MoraME, Meltzer M, Mensah GA, Merriman TR, Meyer AC, Miglioli V, Miller M,Miller TR, Mitchell PB, Mocumbi AO, Moffitt TE, Mokdad AA, Monasta L,Montico M, Moradi-Lakeh M, Moran A, Morawska L, Mori R, MurdochME, Mwaniki MK, Naidoo K, Nair MN, Naldi L, Narayan KM, Nelson PK,Nelson RG, Nevitt MC, Newton CR, Nolte S, Norman P, Norman R,O’Donnell M, O’Hanlon S, Olives C, Omer SB, Ortblad K, Osborne R,Ozgediz D, Page A, Pahari B, Pandian JD, Rivero AP, Patten SB, PearceN, Padilla RP, Perez-Ruiz F, Perico N, Pesudovs K, Phillips D, Phillips MR,Pierce K, Pion S, PolanczykGV, Polinder S, PopeCA III, PopovaS, PorriniE, Pourmalek F, Prince M, Pullan RL, Ramaiah KD, Ranganathan D,Razavi H, ReganM, Rehm JT, Rein DB, Remuzzi G, Richardson K, RivaraFP, Roberts T, Robinson C, De Leon FR, Ronfani L, Room R, RosenfeldLC, Rushton L, Sacco RL, Saha S, Sampson U, Sanchez-Riera L,Sanman E, Schwebel DC, Scott JG, Segui-Gomez M, Shahraz S,Shepard DS, Shin H, Shivakoti R, SinghD, SinghGM, Singh JA, SingletonJ, Sleet DA, Sliwa K, Smith E, Smith JL, Stapelberg NJ, Steer A, Steiner T,Stolk WA, Stovner LJ, Sudfeld C, Syed S, Tamburlini G, Tavakkoli M,Taylor HR, Taylor JA, Taylor WJ, Thomas B, ThomsonWM, Thurston GD,Tleyjeh IM, Tonelli M, Towbin JA, Truelsen T, Tsilimbaris MK, Ubeda C,Undurraga EA, van der Werf MJ, van Os J, Vavilala MS,Venketasubramanian N, Wang M, Wang W, Watt K, Weatherall DJ,Weinstock MA, Weintraub R, Weisskopf MG, Weissman MM, White RA,Whiteford H,Wiersma ST,Wilkinson JD,WilliamsHC,Williams SR,Witt E,Wolfe F, Woolf AD, Wulf S, Yeh PH, Zaidi AK, Zheng ZJ, Zonies D, LopezAD, Murray CJ, AlMazroa MA, Memish ZA. Years lived with disability(YLDs) for 1160 sequelae of 289 diseases and injuries 1990-2010:a systematic analysis for the Global Burden of Disease Study 2010.Lancet 2012;380:2163–96.
[64] Watt-Watson J, Stevens B, Garfinkel P, Streiner D, Gallop R.Relationship between nurses’ pain knowledge and painmanagement outcomes for their postoperative cardiac patients.J Adv Nurs 2001;36:535–45.
818 T. Seers et al.·159 (2018) 811–818 PAIN®
Copyright � 2018 by the International Association for the Study of Pain. Unauthorized reproduction of this article is prohibited.12


Research Paper
Effectiveness of a healthy lifestyle intervention forchronic low back pain: a randomised controlled trialAmanda Williamsa,b,c,*, John Wiggersa,b, Kate M. O’Briena,b,c, Luke Wolfendena,b, Sze Lin Yoonga,b,Rebecca K. Hoddera,b,c, Hopin Leeb,c,d,e, Emma K. Robsona,c, James H. McAuleyd,f, Robin Haskinsg,Steven J. Kamperc,h, Chris Risseli, Christopher M. Williamsa,b,c
AbstractWeassessed the effectiveness of a 6-month healthy lifestyle intervention, on pain intensity in patients with chronic lowback painwhowere overweight or obese. We conducted a pragmatic randomised controlled trial, embedded within a cohort multiple randomisedcontrolled trial of patients on a waiting list for outpatient orthopaedic consultation at a tertiary hospital in NSW, Australia. Eligiblepatients with chronic low back pain (.3 months in duration) and body mass index $27 kg/m2 and ,40 kg/m2 were randomlyallocated, using a central concealed random allocation process, to receive advice and education and referral to a 6-monthtelephone-based healthy lifestyle coaching service, or usual care. The primary outcome was pain intensity measured using an 11-point numerical rating scale, at baseline, 2 weeks, and monthly for 6 months. Data analysis was by intention-to-treat according toa prepublished analysis plan. Between May 13, 2015, and October 27, 2015, 160 patients were randomly assigned in a 1:1 ratio tothe intervention or usual care. We found no difference between groups for pain intensity over 6 months (area under the curve, meandifference5 6.5, 95% confidence interval28.0 to 21.0; P5 0.38) or any secondary outcome. In the intervention group, 41% (n532) of participants reported an adverse event compared with 56% (n 5 45) in the control group. Our findings show that providingeducation and advice and telephone-based healthy lifestyle coaching did not benefit patients with low back pain who wereoverweight or obese, comparedwith usual care. The intervention did not influence the targeted healthy lifestyle behaviours proposedto improve pain in this patient group.
Keywords: Low back pain, Lifestyle, Obesity, Randomised controlled trial
1. Background
Low back pain is the leading cause of disability worldwide andimposes considerable economic burden.11,13 There is strongevidence that the development and persistence of low back painis linked to “lifestyle risks,” such as overweight and obesity.34
Clinical practice guidelines recommend that patients with lowback pain should be advised to engage in physical activity,23,30
and there is widespread suggestion that managing lifestyle risks,such asweight, should be a key focus of care for patients with lowback pain.12,37
Systematic review evidence suggests that targeting lifestylerisk factors reduces pain and disability in other musculoskel-etal conditions such as knee osteoarthritis (OA).10 A meta-analysis of randomised controlled trials (RCTs) showed thatbehavioural weight loss interventions lead to moderateimprovements in pain and physical function for patients withknee OA who were overweight or obese.10 Furthermore,patients who achieve at least a 5% weight loss experiencea significant reduction in disability.10 In contrast to knee OA, noRCTs have assessed the impact of lifestyle interventions onpatient outcomes for low back pain.37 This means that despitethe known links between lifestyle risks and low back pain, thereis currently no evidence about the effectiveness of lifestylemanagement to guide clinical practice recommendations forlow back pain.
There are several theories for why targeting lifestyle risk factorscould improve patient-reported outcomes such as pain anddisability for people with low back pain. Weight loss may reducemechanical load on the spine, reduce systemic inflammation,12,32
or reduce mood or emotional distress which is believed toexacerbate the effect of weight on the experience of pain.9
Furthermore, increased physical activity and a better diet (ie, lessenergy-dense, nutrient-poor foods) may influence these pro-cesses by contributing to weight loss.12
Sponsorships or competing interests that may be relevant to content are disclosed
at the end of this article.
a Hunter New England Population Health, Wallsend, New South Wales, Australia,b School of Medicine and Public Health, Hunter Medical Research Institute,
University of Newcastle, Newcastle, New South Wales, Australia, c Centre for Pain,
Health and Lifestyle, New South Wales, Australia, d Neuroscience Research
Australia (NeuRA), Randwick, New South Wales, Australia, e Centre for Statistics in
Medicine, Nuffield Department of Orthopaedics Rheumatology andMusculoskeletal
Sciences, University of Oxford, Oxford, United Kingdom, f School of Medical
Sciences, Faculty of Medicine, University of NSW, Sydney, New South Wales,
Australia, g Outpatient Services, John Hunter Hospital, Hunter New England Local
Health District, New Lambton, New South Wales, Australia, h School of Public
Health, University of Sydney, Camperdown, New South Wales, Australia, i NSW
Office of Preventive Health, Liverpool Hospital, South West Sydney Local Health
District, Liverpool BC, New South Wales, Australia
*Corresponding author. Address: Hunter NewEngland Local Health District, Locked
Bag 10, Wallsend, New South Wales 2287, Australia. Tel.: 161 2 4924 6206;
fax: 161 2 4924 6490. E-mail address: [email protected]
(A. Williams).
Supplemental digital content is available for this article. Direct URL citations appear
in the printed text and are provided in the HTML and PDF versions of this article on
the journal’s Web site (www.painjournalonline.com).
PAIN 159 (2018) 1137–1146
© 2018 International Association for the Study of Pain
http://dx.doi.org/10.1097/j.pain.0000000000001198
June 2018·Volume 159·Number 6 www.painjournalonline.com 1137
Copyright � 2018 by the International Association for the Study of Pain. Unauthorized reproduction of this article is prohibited.15

In view of this, we aimed to assess the effectiveness ofa healthy lifestyle intervention, which targeted weight, physicalactivity, and diet behaviours, to reduce pain intensity forpatients with chronic low back pain who were overweight orobese, compared with usual care. The trial also aimed to
determine whether the intervention approach improveddisability, weight, body mass index (BMI), physical activity,diet, sleep quality, global rating of symptom change, emotionaldistress, quality of life, and health care use, compared withusual care.
Figure 1. Trial profile. BMI, body mass index; NRS, numerical rating scale.
1138 A. Williams et al.·159 (2018) 1137–1146 PAIN®
Copyright � 2018 by the International Association for the Study of Pain. Unauthorized reproduction of this article is prohibited.16

2. Methods
2.1. Study design and participants
The study was a 2-arm pragmatic parallel group RCT, part ofa cohort multiple RCT.31 Details of the study are reported in thestudy protocol and statistical analysis plan.26,39 Protocol devia-tions are specified in Text S1 in the supplementary file (availableonline at http://links.lww.com/PAIN/A548). The study was con-ducted at the John Hunter Hospital, New South Wales (NSW),Australia. Patients with musculoskeletal conditions, who were onthe waiting list for outpatient consultation with an orthopaedicspecialist, were invited to participate in the cohort study involvingtelephone assessments. All patients in the cohort were informed
that regular surveys were being conducted as part of hospitalaudit processes and to track patient health while waiting forconsultation. During one of the telephone assessments, partic-ipants of the cohort study with chronic low back pain wereassessed for eligibility for the RCT. Eligible consenting patientswere randomised to study conditions: (1) offered the intervention(intervention group), or (2) remained in the cohort follow-up (usualcare control group).
Participant inclusion criteria were: a primary complaint ofchronic low back pain (defined as pain between the 12th rib andbuttock creasewith or without leg pain for longer than 3months)2;with an average low back pain intensity $3 of 10 on a 0 to 10numerical rating scale (NRS) over the past week, or moderate
Table 1
Baseline characteristics.
Intervention (n 5 79) Control (n 5 80)
Demographic characteristics
Age (y), mean (SD) 56.0 (13.3) 57.4 (13.6)
Sex (male), n (%) 31 (39.2) 34 (42.5)
Aboriginal and/or Torres Strait Islander status, n (%) 7 (8.9) 5 (6.3)
Employment status, n (%)
Employed 17 (21.5) 17 (21.3)
Unemployed 15 (19.0) 9 (11.3)
Retired 27 (34.2) 29 (36.3)
Can not work (health reasons) 20 (25.3) 25 (31.3)
Country of origin (Australia), n (%) 69 (87.3) 68 (85.0)
Highest level of education, n (%)
.High school 27 (34.2) 31 (38.8)
Private health insurance, n (%) 6 (7.6) 9 (11.3)
Other coexisting medical conditions needing medication, n (%) 67 (84.8) 68 (85.0)
Current time on the waiting list for consultation (d), median (IQR) 685 (255-1289) 525 (184-1185)
Triage classification, n (%)*
Nonurgent 5 (6.3) 3 (3.8)
Semiurgent 64 (81.0) 66 (82.5)
Urgent 8 (10.1) 9 (11.3)
Clinical characteristics
Pain intensity (NRS), mean (SD) 6.7 (1.8) 6.8 (1.6)
Pain duration (how long have you been troubled with your pain) (y), mean (SD) 13.0 (11.9) 18.5 (15.7)
Disability and function (RMDQ), mean (SD) 14.7 (5.2) 15.8 (5.1)
Self-reported weight, mean (SD) 91.9 (16.5) 90.8 (14.6)
Subjective BMI, mean (SD) 32.4 (3.5) 32.1 (3.6)
Quality of life (SF12.v2), mean (SD)
PCS 31.3 (9.2) 29.2 (9.6)
MCS 46.7 (13.9) 46.1 (13.8)
Emotional distress (DASS-21), mean (SD)
Depression subscale 11.3 (10.9) 9.9 (9.1)
Anxiety subscale 9.3 (7.7) 9.0 (7.8)
Stress subscale 13.3 (9.3) 13.6 (9.0)
Poor sleep quality (item 6, Pittsburgh Sleep Quality Index), n (%)† 11 (14) 24 (30)
Physical activity (mins MVPA/wk), mean (SD) 73.9 (219.3) 146.7 (504.0)
Diet, n (%)
Daily fruit intake (,2 serves) 40 (51) 41 (51)
Daily vegetable intake (,5 serves) 64 (81) 67 (84)
Consumes discretionary foods more than once a wk 9 (11) 11 (14)
Alcohol consumption (AUDIT), mean (SD) 2.2 (2.5) 2.2 (2.6)
Smoking prevalence, n (%) 17 (22) 21 (26)
Pain attitudes (SOPA), mean (SD) 16.9 (4.7) 16.5 (4.7)
Fear avoidance beliefs (FABQ), mean (SD) 17.2 (5.5) 17.5 (6.0)
Health care utilisation, n (%)
Medication use for back pain 66 (84) 63 (79)
Health care visits for back pain 37 (47) 47 (59)
* Note that these percentages do not add up to 100% because n 5 4 participants had no triage classification recorded (intervention, n 5 2; control, n 5 2).
† Item 6 from the Pittsburgh Sleep Quality Index dichotomised as very bad and fairly bad vs very good and fairly good.
AUDIT, Alcohol Use Disorders Identification Test; BMI, body mass index; DASS-21, Depression Anxiety Stress Scale; FABQ, Fear Avoidance Beliefs Questionnaire; IQR, interquartile range; MCS, Mental Component Score;
MVPA, moderate-to-vigorous physical activity; NRS, numerical rating scale; PCS, Physical Component Score; RMDQ, Roland Morris Disability Questionnaire; SF12.v2, Short Form Health Survey Version 2; SOPA, survey of pain
attitudes.
June 2018·Volume 159·Number 6 www.painjournalonline.com 1139
Copyright � 2018 by the International Association for the Study of Pain. Unauthorized reproduction of this article is prohibited.17

level of interference in activities of daily living (adaptation of item 8on SF36); 18 years or older; overweight or obese (BMI$27 kg/m2
and ,40 kg/m2) based on self-reported weight and height; andaccess to a telephone. Exclusion criteria were: known orsuspected serious pathology as the cause of back pain asadvised by their general practitioner (eg, fracture, cancer,infection, inflammatory arthritis, and cauda equina syndrome);previous obesity surgery; currently participating in any pre-scribed, medically supervised or commercial weight loss pro-gram; back surgery in the past 6 months or booked for surgery inthe next 6 months; unable to comply with the study protocol thatrequired adaption of meals or exercise due to nonindependentliving arrangements; any medical or physical impairment pre-cluding safe participation in exercise, such as uncontrolledhypertension; and unable to speak and read English sufficientlyto complete the study procedures.
Ethical approval was obtained from the Hunter New EnglandHuman Research Ethics Committee (approval No. 13/12/11/5.18) and the University of Newcastle Human Research EthicsCommittee (approval No. H-2015-0043). This study adheres tothe Consolidated Standards of Reporting Trials (CONSORT)guidelines.
2.2. Randomisation and masking
The randomisation schedule was prepared a priori by anindependent investigator using SAS 9.3 through the SURVEY-SELECT procedure. Patients were randomised into studyconditions (offered the intervention, or usual care control) in a 1:1 ratio, using a central concealed random allocation process.Specifically, when a patient was deemed eligible, they wereallocated the next available study identification number whichcorresponded with study identification numbers of the random-isation schedule. At this point, the patient was consideredrandomised to the study. After baseline assessment, interviewersopened a prepacked opaque envelope labelled with thecorresponding study identification number and contained theparticipant’s group status. The envelopes were arranged bya research assistant, whowas not involved in the study. Outcomeassessors conducting follow-up data collection telephone inter-views, and trial statisticians were masked to group allocation.Because of the design of the study (ie, cohort multiple RCT),31
participants were not aware of alternate study conditions.
2.3. Interventions
Participants randomised to the intervention group were offereda healthy lifestyle intervention involving brief telephone advice,offer of a clinical consultation followed by referral to a 6-monthtelephone-based healthy lifestyle coaching service. The ap-proach was based on formative evaluation which identifiedtelephone services as the most preferred method by patients tosupport lifestyle change and weight loss.40 Participants in theintervention group remained on the waiting list for orthopaedicspecialist consultation and could attend a consultation during thestudy period. Patients were free to access care outside the study,as they saw fit.
The brief telephone advice was provided by trained telephoneinterviewers after baseline assessment, immediately after ran-domisation. This advice included information that a broad rangeof factors contribute to the experience of low back pain, followedby description of the potential benefits of weight loss and physicalactivity for reducing low back pain.
The clinical consultation was a face-to-face consultation (up to1 hour) conducted in a community health centre with the studyphysiotherapist, who was not involved in data collection. Asdetailed in our protocol,39 the consultation was informed by SelfDetermination Theory and involved 2 broad approaches: (1)clinical assessment followed by low back pain education andadvice and (2) behaviour change techniques.1
In brief, the patient education and advice aimed to improveunderstanding about low back pain, correct erroneous beliefs aboutthecauseofbackpain, (ie, provide informationabout thenatureof thecondition, that persistent low back pain is multifactorial with multipleinfluences and not usually the result of pathological tissue damage),reduce pain-related fear and distress thatmay hamper participation inthe intervention, as well as describe the broader influences of backpain including lifestyle risks (overweight, inactivity, nutrition, smoking,alcohol, and poor sleep). The education and advice includedinformation about the role of weight loss and physical activity inmanaging low back pain symptoms and introduced the telephonehealth coaching service as a way to support weight loss, physicalactivity, and diet. The behaviour change techniques were incorpo-rated to facilitate intentions tochangeandadopthealthy lifestyle habitsfor back pain self-management, using the following techniques:intention formation1 (by encouragingcommitment from theparticipantto engagewith the coaching service and confirming thatmonitoring of
Table 2
Analyses of primary outcome (pain intensity).
Analysis Outcome Intervention mean(95% CI) (n 5 79)
Control mean (95% CI)(n 5 80)
Mean difference*(95% CI)
P
Primary (ITT and MI) Area under the pain
intensity curve (AUC)
156.8 (146.2 to 167.5) 163.4 (153.6 to 173.1) 6.5 (28.0 to 21.0) 0.38
Analysis Outcome Intervention mean (SD)(n 5 79)
Control mean (SD)(n 5 80)
Mean difference*(95% CI)
P
Secondary Pain intensity score
Baseline 6.7 (1.8) 6.8 (1.6)
Week 2 6.4 (2.1) 6.4 (1.9) 0.0 (20.6 to 0.6) 1.00
Week 6 6.2 (2.1) 6.2 (2.1) 20.1 (20.8 to 0.5) 0.72
Week 10 5.7 (2.4) 6.4 (2.0) 0.6 (0.0 to 1.3) 0.05
Week 14 6.4 (2.3) 6.8 (1.8) 0.4 (20.2 to 1.1) 0.20
Week 18 5.6 (2.5) 6.5 (1.8) 0.8 (0.2 to 1.5) 0.01
Week 22 5.7 (2.5) 6.2 (2.0) 0.4 (20.3 to 1.1) 0.24
Week 26 5.8 (2.7) 6.3 (2.4) 0.3 (20.4 to 1.0) 0.36
Monthly trend 0.08 (20.04 to 0.21) 0.19
* Mean difference 5 control 2 intervention.
AUC, area under the curve; CI, confidence interval; ITT, intention to treat; MI, multiple imputation.
1140 A. Williams et al.·159 (2018) 1137–1146 PAIN®
Copyright � 2018 by the International Association for the Study of Pain. Unauthorized reproduction of this article is prohibited.18

Table 3
Analyses of secondary outcomes.
Outcome Time point Intervention Control Mean difference*(95% CI)Mean (SD) Mean (SD)
Disability score (RMDQ) Baseline 14.7 (5.2); n 5 79 15.8 (5.1); n 5 80
Week 6 14.2 (5.6); n 5 57 15.8 (5.1); n 5 69 0.8 (20.6 to 2.2)
Week 26 13.9 (6.5); n 5 38 14.7 (5.9); n 5 55 20.1 (21.7 to 1.5)
Self-reported weight Baseline 91.9 (16.5); n 5 79 90.8 (14.6); n 5 80
Week 6 93.9 (18.0); n 5 62 90.2 (15.0); n 5 72 20.3 (21.9 to 1.2)
Week 26 93.5 (17.4); n 5 54 93.3 (16.8); n 5 63 1.8 (0.2 to 3.5)
Objective weight Baseline† 98.5 (18.6); n 5 25 —
Week 26 96.1 (15.7); n 5 13 97.9 (20.3); n 5 26 1.8 (211.2 to 14.8)
Subjective BMI Baseline 32.4 (3.5); n 5 79 32.1 (3.6); n 5 80
Week 6 32.8 (4.1); n 5 62 32.0 (4.1); n 5 72 20.1 (20.6 to 0.5)
Week 26 32.7 (4.3); n 5 54 32.5 (4.6); n 5 63 0.6 (0.0 to 1.2)
Objective BMI Week 26 33.3 (4.3); n 5 12 35.2 (6.5); n 5 26 1.8 (22.3 to 6.0)
Objective waist circumference Week 26 121.0 (21.9); n 5 10 110.8 (17.7); n 5 23 210.1 (224.8 to 4.6)
Quality of life PCS (SF12.v2) Baseline 31.3 (9.2); n 5 79 29.2 (9.6); n 5 79
Week 6 31.8 (9.1); n 5 57 30.3 (10.6); n 5 69 20.3 (23.0 to 2.4)
Week 26 32.1 (10.9); n 5 43 30.5 (10.1); n 5 61 20.6 (23.5 to 2.4)
Quality of life MCS (SF12.v2) Baseline 46.7 (13.9); n 5 79 46.1 (13.8); n 5 79
Week 6 46.6 (11.0); n 5 57 45.0 (11.6); n 5 69 20.9 (24.3 to 2.4)
Week 26 46.5 (13.8); n 5 43 44.3 (13.3); n 5 61 21.7 (25.4 to 2.0)
Global rating of symptom
change (GPE)
Week 6 4.3 (1.8); n 5 58 4.5 (1.8); n 5 70 0.2 (20.5 to 0.9)
Week 26 4.9 (2.2); n 5 41 4.2 (1.9); n 5 58 20.6 (21.3 to 0.2)
DASS-21, depression Baseline 11.3 (10.9); n 5 79 9.9 (9.1); n 5 79
Week 26 13.1 (11.2); n 5 43 11.9 (11.1); n 5 61 0.5 (22.7 to 3.7)
DASS-21, anxiety Baseline 9.3 (7.7); n 5 79 9.0 (7.8); n 5 79
Week 26 9.8 (8.3); n 5 43 9.4 (9.0); n 5 61 20.3 (23.2 to 2.7)
DASS-21, stress Baseline 13.3 (9.3); n 5 79 13.6 (9.0); n 5 79
Week 26 14.3 (10.7); n 5 43 13.8 (11.1); n 5 61 20.2 (23.9 to 3.4)
Physical activity (MVPA/wk) Baseline 73.9 (219.3); n 5 79 146.7 (504.0); n 5 80
Week 6 95.8 (208.3); n 5 59 130.6 (382.1); n 5 71 27.1 (2150.0 to 135.8)
Week 26 229.2 (755.1); n 5 43 148.6 (400.0); n 5 61 299.3 (2260.2 to 61.5)
Alcohol consumption (AUDIT) Baseline 2.2 (2.5); n 5 79 2.2 (2.6); n 5 80
Week 6 2.3 (2.8); n 5 58 2.3 (2.6); n 5 70 20.1 (20.5 to 0.4)
Week 26 2.2 (2.6); n 5 43 2.3 (2.7); n 5 58 0.1 (20.4 to 0.6)
Pain attitudes (SOPA) Baseline 16.9 (4.7); n 5 79 16.5 (4.7); n 5 80
Week 6 16.2 (4.2); n 5 59 16.1 (4.7); n 5 71 0.3 (21.3 to 1.8)
Week 26 16.9 (5.5); n 5 43 15.8 (5.3); n 5 61 20.5 (22.3 to 1.2)
Fear avoidance beliefs scale
(FABQ)
Baseline 17.2 (5.5); n 5 79 17.5 (6.0); n 5 79
Week 26 15.4 (7.4); n 5 43 16.6 (6.4); n 5 60 1.0 (21.4 to 3.5)
Outcome Time point Intervention, n/N (%) Control, n/N (%) OR (95% CI)ref 5 control
Poor sleep quality‡ Baseline 11/79 (14) 24/80 (30)
Week 6 7/58 (12) 15/71 (21) 0.59 (0.23 to 1.51)
Week 26 5/43 (12) 8/61 (13) 1.04 (0.37 to 2.96)
Diet—daily fruit intake (0-1
serves)§
Baseline 40/79 (51) 41/80 (51)
Week 6 24/59 (41) 37/71 (52) 0.63 (0.32 to 1.24)
Week 26 16/43 (37) 25/61 (41) 0.79 (0.38 to 1.63)
Diet—daily vegetable intake
(0-2 serves)
Baseline 35/79 (44) 37/80 (46)
Week 6 27/59 (46) 37/71 (52) —
Week 26 21/42 (50) 29/61 (48) —
Diet—daily vegetable intake
(3-4 serves)
Baseline 29/79 (37) 30/80 (38)
Week 6 27/59 (46) 22/71 (31) —
Week 26 17/42 (40) 20/61 (33) —
Diet—daily vegetable intake‖ Week 6 — — 0.96 (0.50 to 1.82)
Week 26 — — 1.30 (0.62 to 2.72)
(continued on next page)
June 2018·Volume 159·Number 6 www.painjournalonline.com 1141
Copyright � 2018 by the International Association for the Study of Pain. Unauthorized reproduction of this article is prohibited.19

participation and lifestyle behaviours would occur throughout theprogram); setting graded tasks and specific behaviour goals1;prompting barrier identification1 (by discussing patient-specificpotential barriers to behaviour change); and prompting self-monitoring of behaviour and outcomes.1
The telephone-based health coaching service was the NSWGet Healthy Service (GHS) (www.gethealthynsw.com.au).27 Theservice involves 10 individually tailored coaching calls, based onnational Healthy Eating and Physical Activity guidelines,5,24
delivered over 6 months by qualified health professionals.27 TheGHS is a public health telephone-based service to supportindividuals tomodify eating behaviours, increase physical activity,achieve and maintain a healthy weight, and where appropriate,referral to smoking cessation services. The GHS is funded by theNSWgovernment and provided free to all residents of the state. Apre–post study showed the GHS to be effective for reducingweight, BMI, and waist circumference in the general population,for those adherent to the program.27
Participant referrals to the GHS were sent by the researchersthrough fax or email and indicated that referred participants werepatients with low back pain. The GHS directly contacted theparticipants. All GHS health coaches were trained in evidence-based advice for low back pain by a study investigator (C.W.).This training involved a 2-hour interactive workshop and in-formation resources to facilitate adaption of advice for studyparticipants. The workshop and resources were based oninformation contained in international clinical practice guidelinesfor low back pain and included topics of diagnosis, prognosis,pain-related distress, evidence-based management strategies,and the role of a healthy lifestyle and weight loss.
Participants randomised to the control group continued on theusual care pathway (ie, remained on the waiting list to have anorthopaedic specialist consultation and could progress toconsultation if scheduled) and took part in data collection duringthe study period. No other active intervention was provided aspart of the study; however, no restrictions were placed on the useof other health services during the study period. Controlparticipants were informed that a new clinical service would be
available in approximately 6 months involving clinical assessmentand support from other services for their back pain should theyneed it. No other details about the new service, or that otherpatients had started this service were disclosed.
2.4. Outcome measures
The primary outcome was average self-reported back painintensity, over the 6-month follow-up. At baseline, and weeks 2,6, 10, 14, 18, 22, and 26 participants were asked to report the“average pain intensity experienced in their back over the pastweek” on an NRS, where 0 was “no pain” and 10 was the “worstpossible pain.” The NRS is a widely used and validatedmeasure.15 Pain intensity was chosen as the primary outcome,as it is recommend as a core outcome for clinical trials innonspecific low back pain and is a key priority for patients.8
Secondary outcomeswere: self-reported weight (kg); low backpain disability, using the Roland Morris Disability Questionnaire(0-24 scale; high score indicates greater disability)33; quality oflife, using the 12-item Short Form Health Survey (physical andmental health component scores [0-100 scale; high scoreindicates greater quality of life])38; sleep quality using item 6 fromthe Pittsburgh Sleep Quality Index (very bad, fairly bad, fairlygood, and very good)6; physical activity, using the Active AustraliaSurvey (average minutes spent participating in moderate-to-vigorous physical activity per week)3; diet, using a short foodfrequency questionnaire (serves of fruit [0-1, 2, or more]; serves ofvegetables [0-2, 3-4, 5, or more]); serves of discretionary foods,for example, processed meats, salty snacks, confectionary,sugar-sweetened beverages (more than once per week, once perweek, or less)7; alcohol consumption using the Alcohol UseDisorders Identification Test (0-12 scale; high score indicatesgreater risk of alcohol-related harm)4; smoking prevalence (haveyou smoked any tobacco in the past 4 weeks? [includingcigarettes, roll your own, pipes, cigars, or any other tobaccoproducts])35; back pain beliefs, using the 1-item Survey of PainAttitudes (0-28 scale; a high score indicates worse pain attitude);19
and health care utilisation over the past 6 weeks including
Table 3 (continued)
Outcome Time point Intervention, n/N (%) Control, n/N (%) OR (95% CI)ref 5 control
Diet—consumes discretionary
foods more than once a wk
Baseline 73/79 (92) 73/80 (91)
Week 6 51/58 (88) 60/71 (85) 1.17 (0.44 to 3.12)
Week 26 37/43 (86) 52/61 (85) 1.11 (0.36 to 3.41)
Smoking prevalence Baseline 17/79 (22) 21/80 (26)
Week 6 11/59 (19) 14/71 (20) 0.93 (0.43 to 2.00)
Week 26 4/43 (9) 11/61 (18) 0.56 (0.24 to 1.27)
Participants using other health
care for back pain
Baseline 37/79 (47) 47/80 (59)
Week 6 24/60 (40) 39/72 (54) 0.56 (0.28 to 1.12)
Week 26 14/38 (37) 25/56 (45) 0.73 (0.33 to 1.65)
Attended orthopaedic
consultation for back pain
Baseline 4/79 (5) 6/80 (8)
Week 6 3/60 (5) 4/72 (6) —
Week 26 0/38 (0) 2/56 (4) —
Participants using medication
for back pain
Baseline 66/79 (84) 63/80 (79)
Week 6 44/60 (73) 58/72 (81) 0.64 (0.29 to 1.44)
Week 26 27/38 (71) 45/56 (80) 0.54 (0.20 to 1.44)
* Mean difference 5 control 2 intervention, adjusted for baseline values (where baseline value exists).
† Measured for intervention group only at the clinical consultation.
‡ Item 6 from the Pittsburgh Sleep Quality Index dichotomised as very bad and fairly bad vs very good and fairly good.
§ Reference 5 2 or more serves.
‖ Vegetable intake categories 5 0 to 2 serves, 3 to 4 serves, and 5 or more serves; OR is the proportional odds of reporting a lower category of vegetable intake for the intervention group.
AUDIT, Alcohol Use Disorders Identification Test; BMI, body mass index; CI, confidence interval; DASS-21, Depression Anxiety Stress Scale; FABQ, Fear Avoidance Beliefs Questionnaire; GPE, Global Perceived Effect Scale;
MCS, Mental Component Score; MVPA, moderate-to-vigorous physical activity; OR, odds ratio; PCS, Physical Component Score; RMDQ, Roland Morris Disability Questionnaire; SF12.v2, Short Form Health Survey Version 2;
SOPA, survey of pain attitudes.
1142 A. Williams et al.·159 (2018) 1137–1146 PAIN®
Copyright � 2018 by the International Association for the Study of Pain. Unauthorized reproduction of this article is prohibited.20
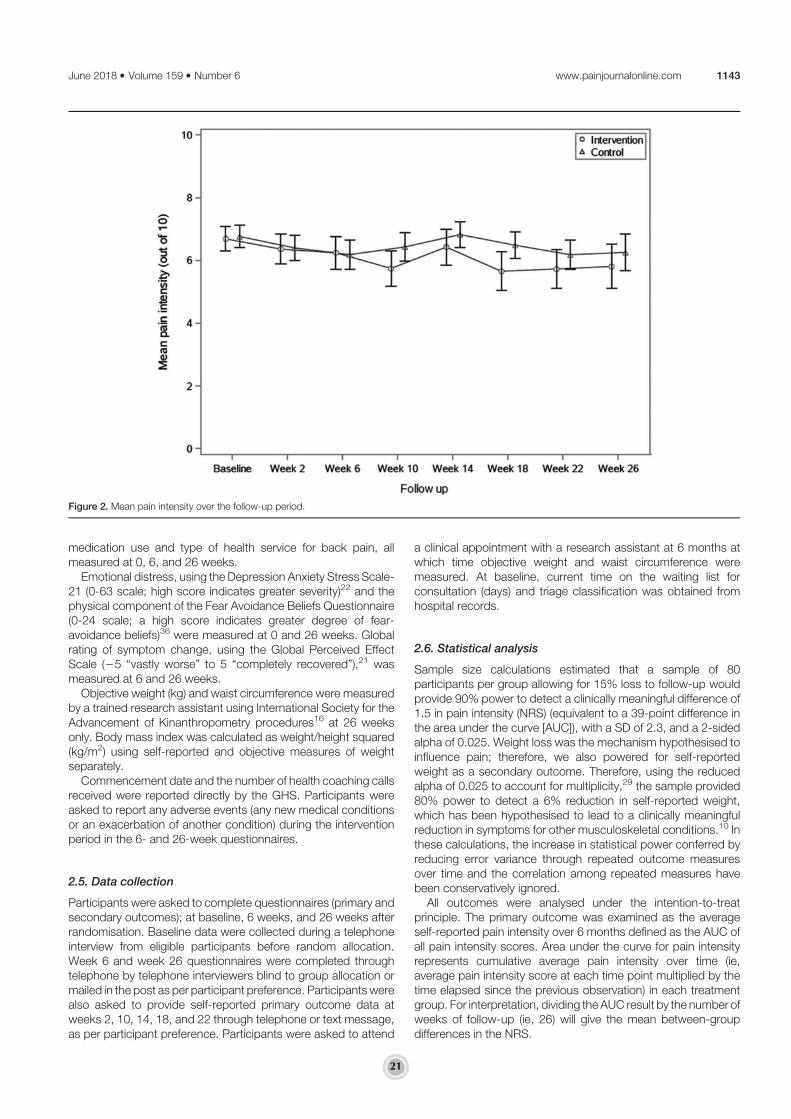
medication use and type of health service for back pain, allmeasured at 0, 6, and 26 weeks.
Emotional distress, using the Depression Anxiety Stress Scale-21 (0-63 scale; high score indicates greater severity)22 and thephysical component of the Fear Avoidance Beliefs Questionnaire(0-24 scale; a high score indicates greater degree of fear-avoidance beliefs)36 were measured at 0 and 26 weeks. Globalrating of symptom change, using the Global Perceived EffectScale (25 “vastly worse” to 5 “completely recovered”),21 wasmeasured at 6 and 26 weeks.
Objective weight (kg) and waist circumference were measuredby a trained research assistant using International Society for theAdvancement of Kinanthropometry procedures16 at 26 weeksonly. Body mass index was calculated as weight/height squared(kg/m2) using self-reported and objective measures of weightseparately.
Commencement date and the number of health coaching callsreceived were reported directly by the GHS. Participants wereasked to report any adverse events (any new medical conditionsor an exacerbation of another condition) during the interventionperiod in the 6- and 26-week questionnaires.
2.5. Data collection
Participants were asked to complete questionnaires (primary andsecondary outcomes); at baseline, 6 weeks, and 26 weeks afterrandomisation. Baseline data were collected during a telephoneinterview from eligible participants before random allocation.Week 6 and week 26 questionnaires were completed throughtelephone by telephone interviewers blind to group allocation ormailed in the post as per participant preference. Participants werealso asked to provide self-reported primary outcome data atweeks 2, 10, 14, 18, and 22 through telephone or text message,as per participant preference. Participants were asked to attend
a clinical appointment with a research assistant at 6 months atwhich time objective weight and waist circumference weremeasured. At baseline, current time on the waiting list forconsultation (days) and triage classification was obtained fromhospital records.
2.6. Statistical analysis
Sample size calculations estimated that a sample of 80participants per group allowing for 15% loss to follow-up wouldprovide 90% power to detect a clinically meaningful difference of1.5 in pain intensity (NRS) (equivalent to a 39-point difference inthe area under the curve [AUC]), with a SD of 2.3, and a 2-sidedalpha of 0.025. Weight loss was the mechanism hypothesised toinfluence pain; therefore, we also powered for self-reportedweight as a secondary outcome. Therefore, using the reducedalpha of 0.025 to account for multiplicity,29 the sample provided80% power to detect a 6% reduction in self-reported weight,which has been hypothesised to lead to a clinically meaningfulreduction in symptoms for other musculoskeletal conditions.10 Inthese calculations, the increase in statistical power conferred byreducing error variance through repeated outcome measuresover time and the correlation among repeated measures havebeen conservatively ignored.
All outcomes were analysed under the intention-to-treatprinciple. The primary outcome was examined as the averageself-reported pain intensity over 6 months defined as the AUC ofall pain intensity scores. Area under the curve for pain intensityrepresents cumulative average pain intensity over time (ie,average pain intensity score at each time point multiplied by thetime elapsed since the previous observation) in each treatmentgroup. For interpretation, dividing the AUC result by the number ofweeks of follow-up (ie, 26) will give the mean between-groupdifferences in the NRS.
Figure 2. Mean pain intensity over the follow-up period.
June 2018·Volume 159·Number 6 www.painjournalonline.com 1143
Copyright � 2018 by the International Association for the Study of Pain. Unauthorized reproduction of this article is prohibited.21

For participants with ,10% missing pain intensity values, themissing values were interpolated and an AUC computed. Forparticipants with 10% or greater missing data, an AUC was notcomputed. Multiple imputation using the chained equationsmethodwas used to impute missing AUC data. The imputation modelincluded a range of covariates believed to be associated withmissingness or the outcome itself (baseline back pain intensity, timesince onset of pain, waiting time, and baseline BMI). The primaryoutcome analysis assessed the between-group differences in AUCusing an independent sample Student t test. Statistical significancewas defined as P values less than 0.025.
Continuous secondary outcomes were assessed usingbaseline-adjusted hierarchical linear models with fixed effectsfor treatment group, time, group 3 time interaction, baselinevalue of the outcome, and random subject-level intercepts.Continuous outcomes measured at baseline and week 26 wereassessed using baseline-adjusted analysis of covariance at 26weeks. Continuous outcomes measured at week 26 only wereassessed using 2 sample t-tests. Categorical secondary out-comes were assessed using General Estimating Equations withfixed effects for treatment group, time, and group 3 timeinteraction. Dichotomous outcomes used the binomial distribu-tion (with logit link), ordinal outcomes used the multinomialdistribution (with cumulative logit link), and count outcomes usedthe negative-binomial distribution (with a log link function).Adverse events were classified according to the InternationalClassification of Diseases version 10 by research personnel; theproportion of participants reporting an adverse event wascompared between groups using the x2 test. A secondaryanalysis of the primary outcomeused hierarchical linearmodels toassess between-group differences in the trajectory of painintensities over the follow-up period, modelled using growthcurve modelling. Sensitivity analysis for the primary outcomeanalysis (AUC) used linear regression models adjusting forbaseline prognostic variables (back pain intensity, time sinceonset of pain, waiting time, and BMI). Statistical significance inthese models was defined as P values less than 0.01 to accountfor multiple comparisons.29
The analysis plan was approved and published before analysisof data.26 Independent statistician(s) who were blinded toallocation completed the statistical analyses as per the publishedprotocol using SAS V9.4 (SAS Institute, Cary, NC). The trial wasprospectively registered with the Australian New Zealand ClinicalTrials Registry (ACTRN12615000478516).
3. Results
Patients were recruited and randomly assigned to study groupsbetween May 13, 2015, and October 27, 2015. Of 521 patientsscreened, 179 were eligible, and 160 (89.4%) provided consentandwere randomised to either the lifestyle intervention (n5 80) orusual care (n 5 80) (Fig. 1). One participant was excluded afterrandomisation, as he was found to be ineligible. Participants hada mean age of 56.7 (SD 13.4) years and 94 (59.1%) were female.The mean baseline pain intensity was 6.7 (SD 1.7) and mean painduration was 15.8 (SD 14.2) years. The mean self-reportedweight at baseline was 91.4 (SD 15.6) kg. Participant character-istics at baseline were similar between groups (Table 1).
The completeness of the primary outcome data, back painintensity, over the follow-up period was 87.7%. Missingness forprimary outcome data was associated with a lower baselineweight (mean difference528.0 kg, 95% confidence interval [CI]23.0 to 213.1; P 5 0.002). At 26 weeks, 22 participants in theintervention group and 13 participants in the control group did not
complete data collection (Fig. 1). There were no meaningfuldifferences in baseline characteristics between participants lostto follow-up and participants who completed 26-week follow-up.
Pain intensity over the 6-month follow-up period was notsignificantly different between groups (AUC mean difference 56.5 of total pain scores, 95% CI 28.0 to 21.0; P 5 0.38;equivalent to a 0.25 point difference on the pain intensity NRS95% CI 20.31 to 0.81) (Table 2). Similarly, there were nosignificant differences between groups for any secondary out-come during follow-up (Table 3).
Adverse events per group are reported in Table S1 in thesupplementary file (available online at http://links.lww.com/PAIN/A548). The proportion of participants reporting an adverse eventwas not different between groups; 41% (n5 32) and 56% (n5 45)for the intervention and control group, respectively. The numberand type of health services and medications used were similaracross groups (Table S2 and S3 in the supplementary file,available online at http://links.lww.com/PAIN/A548).
In regard to intervention adherence, 37 (46.8%) participantsfrom the intervention group attended the single consultation withthe study physiotherapist. Get Healthy Service data showed that76 participants (96.2%) in the intervention group commencedGHS coaching calls (received at least 1 call), 38 (48.1%)participants received at least 3 calls (median 3; interquartilerange: 1-9), and 33 (41.8%) participants receiving 6 or more calls.The mean number calls conducted with participants was 5.1 (SD4.5). Twenty-three participants (29.1%) attended the clinicalconsult and received 6 or more GHS calls.
Analysis of the pain intensity trajectory found no significantbetween-group difference in mean pain intensity over 6 months(20.08, 95%CI20.04 to 0.21;P5 0.19) (Fig. 2 andTable 2). Wealso noted no between-group difference in the primary outcomewhen adjusted for prognostic variables (baseline pain intensity,time since onset of pain, waiting time, and baseline BMI), (AUCmean difference 5 6.2, 95% CI 26.3 to 18.8; P 5 0.32).
After consideration of the adherence results, we undertooka post hoc analysis to assess the effect of receiving the clinicalconsult and 6 ormore GHS calls in the intervention group (ie, 29%of participants) compared with the control group. This analysisshowed no between-group difference for pain intensity or self-reported weight (Table S4 and S5 in the supplementary file,available online at http://links.lww.com/PAIN/A548).
4. Discussion
We have shown that a healthy lifestyle intervention involving brieftelephone advice, offer of a clinical consultation involving detailededucation, and referral to a 6-month telephone-based healthylifestyle coaching service targeting weight loss, physical activity,and diet did not improve pain intensity for patients with low backpain who were overweight or obese. The intervention did notreduce self-reported weight, the hypothesised mechanism toinfluence pain, nor did the intervention improve other secondaryoutcomes including physical activity, diet, disability, sleep quality,emotional distress, global rating of symptom change, quality oflife, or health care use.
4.1. Strengths and limitations of this study
Several study features ensured low risk of bias including centralrandomisation and allocation concealment, blinding of outcomeassessors and statisticians, and prepublication of a study pro-tocol and statistical analysis plan.26,39 The cohort multiple RCTdesign meant that patients were not aware of the alternate study
1144 A. Williams et al.·159 (2018) 1137–1146 PAIN®
Copyright � 2018 by the International Association for the Study of Pain. Unauthorized reproduction of this article is prohibited.22

group. This mimics real-world heath care, reduces participantperformance bias, and minimises sampling bias by reducingnonconsent.31
A potential limitation of the trial is that participants wererecruited from 1 tertiary hospital. Although this hospital has awidereferral base of general practitioners (n . 1300), from a largehealth district (population size . 900,000), the single centredesign may impact generalisability of the findings. Because of thepragmatic design of the study, it was not feasible to collectobjective weight across the intervention period, so our measure-ment of weight relied on self-report. Measuring objective weightacross all time points may have increased the validity of ourassessment of weight outcomes.
Our intervention included several pragmatically deliveredcomponents. The overall adherence to these components waslow. Around half (47%) of the intervention group attended theinitial consult, and although 96% of patients commenced theGHS, just 42% received 6 or more (of 10) GHS calls. Only 29%attended the consult and received 6 or more calls. Poorengagement with the intervention may explain why the in-tervention failed to provide benefits to participants. However, inour post hoc analysis, we did not note any signal of an effect onpain intensity or weight loss for participants who received theclinical consultation and 6 or more GHS calls.
Although our approach was based on formative evaluation,which indicated telephone services as themost preferredmethodto support healthy lifestyle and weight loss,40 for patients with lowback pain who are overweight, it remains unclear how toencourage patient adherence and support patients to makelifestyle changes. In the general population, telephone serviceshave been shown to be as effective as face-to-face serviceswhenaddressing lifestyle risks.14 In our study, we used a nondisease-specific healthy lifestyle intervention designed for the generalpopulation. Current best practice guidelines for weight loss andbehaviour change recommend tailored support to cater for theneeds of different patient groups and to provide support for atleast 3 months.25 Although our study aimed to provide up to 6months of support, it is possible that patients with long-standingchronic low back pain require more intensive and disease-specific support to adequately manage their pain and facilitatelifestyle changes; for example, such as that offered in multidis-ciplinary pain management programs.20 Certainly, patients withlow back pain who are overweight may encounter additionalchallenges to engaging in positive behaviour changes. Combinedwith mobility restrictions, patients with chronic pain are oftenfearful that physical activity will make their condition worse.28
There is also evidence that patients may use food to help copewith their pain, as eating certain foods can elicit a chemicalresponse in the brain providing feelings of comfort.17,18 In ourstudy, it is unclear if these additional challenges contributed topoor adherence and led to no effect, or if a lack of benefit fromparticipating in the service resulted in poor adherence or drop outover time. Future studies should appropriately identify how tooptimise involvement of patients with low back pain in healthbehaviour change to elicit and assess any potential effect oflifestyle-focused care.
Lifestyle risks suchasoverweight andobesity havebeenshown toincrease persistent low back pain and health care seeking for lowback pain.34 Accordingly, targeting lifestyle as part of themanagement of low back pain is widely recommended.12,37
However, there is no direct evidence that addressing lifestyle andweight, in particular, benefits these patients.37 Evidence from othermusculoskeletal conditions indicates that clinically meaningfulweight loss of 6% of body weight leads to reduced pain intensity.10
As our intervention did not affect patients’ weight,we cannot confirmwhether targeting this, or other aspects of lifestyle, has a meaningfulinfluence on patients with low back pain.
Given the link between lifestyle risks and chronic low back pain,it is surprising that no other trials in this area have beenconducted.37 Currently, there is no evidence to guide the clinicalmanagement of patients with these comorbid health issues. Thisis a significant oversight, as patients with low back pain who arealso overweight and have other poor lifestyle behaviours are likelyto face additional challenges, managing these coexisting healthissues. As together they are likely to elicit a greater burden on thehealth of individuals and across the population, there is a need forresearch which aims to understand the interaction betweenlifestyle and back pain, and also develop integrative managementapproaches to guide the development of effective interventions.
5. Conclusions
Our study provides high-quality evidence that a healthy lifestyleintervention involving brief advice, clinical education and advice, andreferral to a telephone-based health coaching service was noteffective in reducing back pain intensity, weight, disability, and otheroutcomes in patients with low back pain who were overweight orobese. Clinical education and advice coupled with referral tonondisease-specific telephone-based healthy lifestyle coachingservice is unlikely to provide benefits to this patient group.
Conflict of interest statement
The authors have no conflict of interest to declare.This study was funded by Hunter New England Local Health
District, the University of Newcastle and the Hunter MedicalResearch Institute. The institutions had no involvement in thedesign and conduct of the study; collection, management,analysis, and interpretation of the data; preparation, review, orapproval of the manuscript; and decision to submit themanuscript for publication.
A version of this article was presented as an oral presentation atthe 2016 International Congress of Behavioural Medicine.
Acknowledgements
The authors thank the statistical analysis specialists at the HunterMedical Research Institute (HMRI) Clinical Research Design,Information Technology and Statistical Support (CReDITSS). Theauthors also thank all participants involved in setting the researchquestion, all participants who were involved in the trial, and theinterviewers for conducting all the follow-up interviews.
Appendix A. Supplemental digital content
Supplemental digital content associated with this article can befound online at http://links.lww.com/PAIN/A548.
Article history:Received 3 October 2017Received in revised form 7 February 2018Accepted 28 February 2018Available online 8 March 2018
References
[1] AbrahamC,Michie S. A taxonomy of behavior change techniques used ininterventions. Health Psychol 2008;27:379–87.
June 2018·Volume 159·Number 6 www.painjournalonline.com 1145
Copyright � 2018 by the International Association for the Study of Pain. Unauthorized reproduction of this article is prohibited.23

[2] Airaksinen O, Brox JI, Cedraschi C, Hildebrandt J, Klaber-Moffett J,Kovacs F, Mannion AF, Reis S, Staal JB, Ursin H, Zanoli G. Chapter 4:European guidelines for themanagement of chronic nonspecific low backpain. Eur Spine J 2006;15:S192–300.
[3] Australian Institute of Health and Welfare (AIHW). The Active AustraliaSurvey: a guide and manual for implementation, analysis and reporting.Canberra: AIHW, 2003.
[4] Babor T, Higgins-Biddle JC, Saunders JB, Monteiro MG. AUDIT: TheAlcohol Use Disorders Identification Test. Guidelines for Use in PrimaryCare. 2nd edn. Geneva: World Health Organization, 1992.
[5] Brown W, Bauman A, Bull F, Burton N. Development of evidence-basedphysical activity recommendations for adults (18-64 years). Reportprepared for the Australian Government Department of Health 2012.
[6] Buysse DJ, Reynolds CF, Monk TH, Berman SR, Kupfer DJ. ThePittsburgh Sleep Quality Index: a new instrument for psychiatric practiceand research. Psychiatry Res 1989;28:193–213.
[7] Centre for Epidemiology Research. NSW population health survey.Sydney: NSW Department of Health, 2014.
[8] Chiarotto A, Deyo RA, Terwee CB, Boers M, Buchbinder R, Corbin TP,Costa LOP, Foster NE, Grotle M, Koes BW, Kovacs FM, Lin CWC, MaherCG, Pearson AM, Peul WC, Schoene ML, Turk DC, van Tulder MW,Ostelo RW. Core outcome domains for clinical trials in non-specific lowback pain. Eur Spine J 2015;24:1127–42.
[9] Chou L, Brady SRE, Urquhart DM, Teichtahl AJ, Cicuttini FM, Pasco JA,Brennan-Olsen SL, Wluka AE. The association between obesity and lowback pain and disability is affected by Mood disorders. Medicine(Baltimore) 2016;95:e3367.
[10] Christensen R, Bartels EM, Astrup A, Bliddal H. Effect of weight reductionin obese patients diagnosed with knee osteoarthritis: a systematic reviewand meta-analysis. Ann Rheum Dis 2007;66:433–9.
[11] Dagenais S, Caro J, Haldeman S. A systematic review of low back paincost of illness studies in the United States and internationally. Spine J2008;8:8–20.
[12] Dean E, Soderlund A. What is the role of lifestyle behaviour changeassociated with non-communicable disease risk in managingmusculoskeletal health conditions with special reference to chronicpain? BMC Musculoskelet Disord 2015;16:87.
[13] GBD 2015 Disease and Injury Incidence and Prevalence Collaborators.Global, regional, and national incidence, prevalence, and years lived withdisability for 310 diseases and injuries, 1990-2015: a systematic analysisfor the Global Burden of Disease Study 2015. Lancet 2016;388:1545–602.
[14] Goode AD, Reeves MM, Eakin EG. Telephone-delivered interventions forphysical activity and dietary behavior change: an updated systematicreview. Am J Prev Med 2012;42:81–8.
[15] Hawker GA, Mian S, Kendzerska T, French M. Measures of adult pain:Visual Analog Scale for Pain (VAS Pain), Numeric Rating Scale for Pain(NRS Pain), McGill Pain Questionnaire (MPQ), Short-Form McGill PainQuestionnaire (SF-MPQ), Chronic Pain Grade Scale (CPGS), Short Form-36 Bodily Pain Scale (SF-36 BPS), and Measure of Intermittent andConstant Osteoarthritis Pain (ICOAP). Arthritis Care Res 2011;63:240–52.
[16] International Society for the Advancement of Kinanthropometry (ISAK).International Standards for Anthropometric Assessment. Underdale:ISAK, 2001.
[17] Janke EA, Jones E, Hopkins CM, Ruggieri M, Hruska A. Catastrophizingand anxiety sensitivity mediate the relationship between persistent painand emotional eating. Appetite 2016;103:64–71.
[18] Janke EA, Kozak AT. “The more pain i have, the more i want to eat”:obesity in the context of chronic pain. Obesity (Silver Spring) 2012;20:2027–34.
[19] Jensen MP, Keefe FJ, Lefebvre JC, Romano JM, Turner JA. One-andtwo-itemmeasures of pain beliefs and coping strategies. PAIN 2003;104:453–69.
[20] Kamper SJ, Apeldoorn AT, Chiarotto A, Smeets RJ, Ostelo RW, GuzmanJ, van Tulder MW. Multidisciplinary biopsychosocial rehabilitation forchronic low back pain. Cochrane Database Syst Rev 2014:CD000963.
[21] Kamper SJ, Ostelo RWJG, Knol DL, Maher CG, de Vet HCW, HancockMJ. Global Perceived Effect Scales provided reliable assessments of
health transition in people with musculoskeletal disorders, but ratings arestrongly influenced by current status. J Clin Epidemiol 2010;63:760–6.
[22] Lovibond PF, Lovibond SH. The structure of negative emotional states:comparison of the Depression Anxiety Stress Scales (DASS) with thebeck depression and anxiety inventories. Behav Res Ther 1995;33:335–43.
[23] National Clinical Guideline Centre (NICE). Low back pain and sciatica inover 16s: assessment and management. NICE Clinical Guideline NG59.London, United Kingdom: NICE, 2016.
[24] National Health and Medical Research Council (NHMRC). Australiandietary guidelines. Canberra: NHMRC, 2013.
[25] National Clinical Guideline Centre (NICE). Weight management: lifestyleservices for overweight or obese adults. NICE Clinical Guideline PH53.London, United Kingdom: NICE, 2014.
[26] O’Brien KM, Williams A, Wiggers J, Wolfenden L, Yoong S, Campbell E,Kamper SJ, McAuley J, Attia J, OldmeadowC,Williams CM, O’Brien KM,Williams A, Wiggers J, Wolfenden L, Yoong S, Campbell E, Kamper SJ,McAuley J, Attia J, OldmeadowC,WilliamsCM. Effectiveness of a healthylifestyle intervention for low back pain and osteoarthritis of the knee:protocol and statistical analysis plan for two randomised controlled trials.Braz J Phys Ther 2016;20:477–89.
[27] O’Hara BJ, Phongsavan P, Venugopal K, Eakin EG, Eggins D, CatersonH, King L, Allman-Farinelli M, Haas M, Bauman AE. Effectiveness ofAustralia’s Get Healthy Information and Coaching Service: translationalresearch with population wide impact. Prev Med 2012;55:292–8.
[28] Okifuji A, Hare BD. The association between chronic pain and obesity.J Pain Res 2015;8:399–408.
[29] Proschan MA, Waclawiw MA. Practical guidelines for multiplicityadjustment in clinical trials. Control Clin Trials 2000;21:527–39.
[30] Qaseem A, Wilt TJ, McLean RM, Forciea MA; Clinical GuidelinesCommittee of the American College of Physicians. Noninvasivetreatments for acute, subacute, and chronic low back pain: a clinicalpractice guideline from the American College of Physicians. Ann InternMed 2017;166:514–530.
[31] Relton C, Torgerson D, O’Cathain A, Nicholl J. Rethinking pragmaticrandomised controlled trials: introducing the “cohort multiple randomisedcontrolled trial” design. BMJ 2010;340:963–7.
[32] Roffey D, Budiansky A, Coyle MJ, Wai EK. Obesity and low back pain: isthere a weight of evidence to support a positive relationship? Curr ObesRep 2013;2:241.
[33] Roland M, Morris R. A study of the natural history of back pain: part I:development of a reliable and sensitive measure of disability in low-backpain. Spine (Phila Pa 1976) 1983;8:141–4.
[34] Shiri R, Karppinen J, Leino-Arjas P, Solovieva S, Viikari-Juntura E. Theassociation between obesity and low back pain: a meta-analysis. Am JEpidemiol 2010;171:135–54.
[35] Shiri R, Karppinen J, Leino-Arjas P, Solovieva S, Viikari-Juntura E. Theassociation between smoking and low back pain: a meta-analysis. Am JMed 2010;123:87.e7–35.
[36] Waddell G, Newton M, Henderson I, Somerville D, Main CJ. A Fear-Avoidance Beliefs Questionnaire (FABQ) and the role of fear-avoidancebeliefs in chronic low back pain and disability. PAIN 1993;52:157–68.
[37] Wai EK, Rodriguez S, Dagenais S, Hall H. Evidence-informedmanagement of chronic low back pain with physical activity, smokingcessation, and weight loss. Spine J 2008;8:195–202.
[38] Ware J, Kosinski M, Bjorner J, Turner-Bowker D, Gandek B, Maruish M.User’s manual for the SF-12v2 health survey (with a supplementdocumenting SF-12 health survey). Boston, Lincoln: QualityMetricIncorporated, 2002.
[39] Williams A, Wiggers J, O’Brien KM, Wolfenden L, Yoong S, Campbell E,Robson E, McAuley J, Haskins R, Kamper SJ. A randomised controlledtrial of a lifestyle behavioural intervention for patients with low back pain,who are overweight or obese: study protocol. BMCMusculoskelet Disord2016;17:1.
[40] Williams CM,Williams A, O’Brien K,Wolfenden L,Wiggers J. Preventativecare strategies for common risk factors of chronic disease andmusculoskeletal pain in patients waiting for specialist consultation.Obes Res Clin Pract 2014;8(suppl 1):115.
1146 A. Williams et al.·159 (2018) 1137–1146 PAIN®
Copyright � 2018 by the International Association for the Study of Pain. Unauthorized reproduction of this article is prohibited.24


Research Paper
Psychological factors predict an unfavorable paintrajectory after hysterectomy: a prospective cohortstudy on chronic postsurgical painPatrıcia R. Pintoa,b,*, Teresa McIntyrec, Vera Araujo-Soaresd, Armando Almeidaa,b, Patrıcio Costaa,b,e
AbstractChronic postsurgical pain (CPSP) is a well-recognized potential complication with negative personal, social, and health careconsequences. However, limited data exist on CPSP and on the course of pain over time after hysterectomy. Using data froma prospective cohort study on a consecutive sample assessed at 4 time points, presurgery (T1), 48 hours (T2), 4 months (T3), and 5years postsurgery (T4), we sought to examine women’s PSP trajectories using assessments of pain at T3 and T4. In addition, thisstudy aimed to investigate presurgical and postsurgical risk factors associated with an unfavourable pain trajectory (PT). Based onpain data collected at T3 and T4, 3 distinct trajectories of PSP emerged: no CPSP (PT1; n5 88), prolonged PSP (PT2; n5 53), andCPSP (PT3; n5 29). Moreover, reported CPSP prevalence at 5 years was 17.1%.Multinomial logistic regression models controllingfor age, presurgical pain, and type of hysterectomy tested for baseline and acute postsurgical predictive variables. Membership inPT2 and PT3 was predicted by presurgical anxiety (odds ratio [OR] 5 1.131, P 5 0.015; OR 5 1.175, P 5 0.009, respectively),emotional representation of the surgical disease (OR 5 1.155, P 5 0.034; OR 5 1.213, P 5 0.020, respectively), and paincatastrophizing (OR 5 1.079, P 5 0.043; OR 5 1.143, P 5 0.001, respectively). Furthermore, acute PSP intensity and frequencydetermined membership of women in PT3 (OR5 1.211, P5 0.033; OR5 3.000, P5 0.029, respectively), and postsurgical anxiety(OR5 1.182, P5 0.026) also played a key predictive role. This study identified factors that can be easily screened before and aftersurgery and are amenable to change through carefully designed timely and tailored interventions for women at risk of an unfavorablePSP trajectory posthysterectomy.
Keywords: Hysterectomy, Postsurgical pain trajectory, Chronic postsurgical pain, Prospective cohort study, Psychologicalfactors, Acute postsurgical pain
1. Introduction
Chronic pain after surgery is a well-recognized potentialcomplication, being acknowledged as a major clinical problemwith significant individual, social, and health care costs.51,55,59 It isa serious public health issue because surgeries are widelyperformed, increasing the numbers of those at risk.13,48,55
Indeed, the current version of the International Classification ofDiseases (ICD-11) for chronic pain categorization already
proposes chronic postsurgical pain (CPSP) as a new distinctentity among 7 groups of chronic pain disorders.102
Chronic PSP was first mentioned in 1998,26 being highlightedthat 22.5% of patients attending 10 pain clinics pointed surgeryas the cause of chronic pain. Despite improvements inknowledge regarding epidemiology and CPSP burden, itsunderlying mechanisms are not fully understood.47,104 However,evidence suggests that CPSP development is multifactorial,rooted in a dynamic and complex interplay among biological,psychosocial, and environmental factors.23,48 To increaseknowledge, research has focused increasingly on understandingrisk factors, in hopes of finding new ways to treat and ultimatelyprevent CPSP from occurring.
Risk factors are often conceptualized into presurgical,intrasurgical, and postsurgical, embracing variables such asage, surgery type, previous pain, and acute PSP.51,52,59,62,73
Psychological factors are well-documented predictors forCPSP across different surgeries,2,15,41,44,61,76 including anx-iety,58,61,99 depression,108 pain catastrophizing,28,50,56,58,99
and optimism.40,82 In an attempt to systematize information,VanDenKerkhof et al.104 proposed a framework wherein riskfactors are organized into 5 domains: demographic, pain,clinical, surgery related, and psychological.
Hysterectomy is the most common gynecologic surgeryperformed in women in Western countries.85,98 In a reviewincluding 11 hysterectomy studies, with follow-up times up to 2years, CPSP was reported by 5% to 32% of women.8
Sponsorships or competing interests that may be relevant to content are disclosed
at the end of this article.
a Life and Health Sciences Research Institute (ICVS), School of Medicine, University
of Minho, Braga, Portugal, b ICVS/3B’s—PT Government Associate Laboratory,
Braga/Guimaraes, Portugal, c Department of Psychology, College of Education and
Behavioral Sciences, Houston Baptist University, Houston, TX, USA, d Institute of
Health and Society, Faculty of Medical Sciences, Newcastle University, Newcastle
upon Tyne, United Kingdom, e Faculty of Psychology and Education Sciences,
University of Porto, Porto, Portugal
*Corresponding author. Address: Life and Health Sciences Research Institute
(ICVS), School of Medicine, Campus de Gualtar, University of Minho, Braga 4710-
057, Portugal. Tel.:351-253-604926; fax: 351-253-604809. E-mail address:
[email protected] (P.R. Pinto).
Supplemental digital content is available for this article. Direct URL citations appear
in the printed text and are provided in the HTML and PDF versions of this article on
the journal’s Web site (www.painjournalonline.com).
PAIN 159 (2018) 956–967
© 2018 International Association for the Study of Pain
http://dx.doi.org/10.1097/j.pain.0000000000001170
956 P.R. Pinto et al.·159 (2018) 956–967 PAIN®
Copyright � 2018 by the International Association for the Study of Pain. Unauthorized reproduction of this article is prohibited.27

Subsequent studies kept diverging on prevalence rates. Thesedifferences were likely due to distinct CPSP definitions,heterogeneity of measurement, and differences in follow-uptimes; some were 3,100 4,6,67,79 6 months,80,103 17,67,100 or 2years.67 Simultaneously, risk factors that have been mosthighlighted were age,67,79 presurgical pain,7,67,100,103 otherpain problems,6,7,67,79 and psychological factors.67,79,100,103
Within the latter, there was some heterogeneity because ofdifferent measures used. Furthermore, acute PSP intensitywas more strongly related with CPSP in some hysterectomystudies6,100,103 than in others,67,79 with one of the studiesproposing PSP frequency as a better predictor thanintensity.79
Although the incidence and risk factors for CPSP have beenwidely explored, knowledge on the course of PSP over time islimited. Identifying patients who are at risk of an unfavorable paintrajectory (PT), culminating in CPSP, provides a unique oppor-tunity to investigate the transition from acute to chronic pain andis critical to developing a more comprehensive understanding ofCPSP and establishing potential targets for psychosocial andclinical interventions.
Therefore, the aims of this study were: (1) to examine PSPtrajectory up to 5 years after hysterectomy; (2) to investigatebaseline predictors of different pain trajectories; and (3) to furtherexplore the added predictive value of acute postsurgical factors inpain chronification.
2. Methods
2.1. Participants and procedure
This study was conducted in a central hospital in northernPortugal and approval was granted by the Hospital EthicsCommittee. This was a prospective cohort study withlongitudinal assessments at 4 time points: 24 hours beforesurgery (T1), 48 hours (T2), 4 months (T3), and 5 years (T4) aftersurgery. Assessments were performed between March 2009and January 2015. A consecutive sample of 203 women,undergoing hysterectomy due to benign causes, was invited toparticipate in the study and all provided written informedconsent. Inclusion criteria were age between 18 and 80 years,and the ability to understand consent procedures andquestionnaire materials. Exclusion criteria were the presenceof psychiatric or neurologic pathology (eg, dementia) andundergoing hysterectomy due to malign conditions or inemergency setting. Time 1 and T2 assessments took placein hospital, T3 and T4 follow-up assessments were conductedby telephone interview. Inclusion in each assessment pointand the reasons for loss to T2, T3, and T4 are shown ina flowchart (Fig. 1). The final sample is comprised of 170women (retention rate: 83.7%; age: M 5 50.8; SD 5 9.03;minimum 5 35; maximum 5 76) with assessments performedat T1, T2, T3, and T4. The 33 women lost to follow-up, from T1to T4, did not differ significantly from the women evaluatedover 5 years in terms of baseline demographic, psychological,and clinical characteristics, namely on surgical, anesthetic,and analgesic issues.
Data related to this sample have been described in 4previous publications reporting predictors of acute PSP,75,76
predictors of rescue analgesia administration,78 and predic-tors of persistent PSP 4 months after hysterectomy.79 Thepresent work is the first to report the long-term outcomes inthis sample, 5 years posthysterectomy, including the 4assessment points.
2.2. Data collection
2.2.1. Presurgical assessment—24 hours before surgery (T1)
At hospital admission, and to get a baseline evaluation of women,the Portuguese versions of the following questionnaires wereadministered, in a face-to-face interview, by a trained healthpsychologist.
2.2.1.1. Sociodemographic Questionnaire
Included questions on age, height, weight, education, residence,marital status, professional status, household, and parity.
2.2.1.2. Clinical Questionnaire
Enquired about previous pain, either related to the cause ofsurgery or due to other causes, previous surgeries, menopausestatus, diagnosis/indication for hysterectomy and disease onset,uterus height andweight, aswell as the use of psychotropic drugs(anxiolytics and antidepressants).
2.2.1.3. The Brief Pain Inventory—short form
Used among women reporting presurgical pain (related with thedisease underlying the surgery).24 It measured pain location in thebody; pain intensity on an 11-point numerical rating scale (NRS;0 represents “no pain” and 10 the “worst pain imaginable”);analgesic intake; perception of analgesic relief; and pain in-terference with daily life on an 11-point NRS (0 5 “does notinterfere” and 105 “completely interferes”) in distinct dimensions(general activity, mood, walking, work, relations with others,sleep, and enjoyment of life). Higher scores represent higherlevels of pain interference. In this study, the internal consistencyreliability27 for the pain interference subscale scores was high (a5 0.90).
2.2.1.4. The Hospital Anxiety and Depression Scale
Comprised by 2 subscales used to measure anxiety anddepression through 7 items each.110 Subscale scores rangefrom 0 to 21 and result from the sum of each item (Likert scaleranging from 0 to 3). Higher scores correspond to higher levels ofanxiety and depression. In the current sample, internal consis-tency reliability was adequate for both anxiety (T1: a5 0.77; T2: a5 0.84) and depression (T1: a 5 0.81).
2.2.1.5. The Surgical Fear Questionnaire
Used to evaluate specific surgical fears through 8 itemsaggregated in 2 subscales, “fear of immediate consequences ofsurgery” (a5 0.77; 4 items) and “fear of long-term consequencesof surgery” (a 5 0.75; 4 items).101 Each item score ranges from0 to 10; item scores are summed to calculate each total subscalescore. Subscale scores range between 0 and 40, with highervalues indicating higher levels of fear.
2.2.1.6. The Revised Illness Perception Questionnaire
Used to assess patient beliefs about the underlying diseasethat lead to surgery, is comprised by 7 dimensions.68 In thecurrent study, and with the aim of diminishing participantburden, a psychometrically shortened version77,79 was used,with 3 items composing each one of the 7 subscales: “timelineacute/chronic” (a 5 0.79; eg, “My illness will last for a longtime”); “timeline cyclical” (a 5 0.74; eg, “My symptoms comeand go in cycles”); “consequences” (a 5 0.56; eg, “Thedisease underlying surgery has major consequences on mylife”); “personal control” (a 5 0.53; eg, “I have the power to
May 2018·Volume 159·Number 5 www.painjournalonline.com 957
Copyright � 2018 by the International Association for the Study of Pain. Unauthorized reproduction of this article is prohibited.28

influence my illness”); “treatment control” (a 5 0.76; eg,“Surgery can control my illness”); “illness coherence” (a 50.78; eg, “My illness is a mystery for me”); and “emotionalrepresentation” (a5 0.88; eg, “When I think about my illness Iget upset”). “Consequences” and “personal control” were notincluded because of their low score reliability in this sample (a5 0.56 and a 5 0.53, respectively). Each item is rated ona scale of 1 to 5 and to calculate each total subscale score,items are summed. Each subscale varies between 5 and 15,with high scores revealing less adaptive illness perceptions,with the exception of personal and treatment control sub-scales, which score inversely.
2.2.1.7. The Coping Strategies Questionnaire—revised form
Used to evaluate 6 pain coping strategies: “pain catastroph-izing” (5 items; a 5 0.88); “praying and hoping” (3 items; a 50.88); “ignoring pain” (5 items; a5 0.92); “distraction/divertingattention” (5 items; a 5 0.77); “reinterpreting pain” (4 items; a5 0.74); and “pain coping self-statements” (4 items; a5 0.70).During pilot testing, subjects were often confused by the usual7-point Likert-type scale.87 Therefore, a 5-point rating scalewas used (1 5 never, 2 5 almost never, 3 5 sometimes, 4 5almost always, and 5 5 always), which was shown to be moreeasily understood. The total subscale score was obtained bythe sum of the item scores, with higher scores indicatinggreater use of the specific coping strategy.
2.2.1.8. Life Orientation Test—revised
Evaluated the personality trait optimism using 8 items.92 The totalscore ranges from 0 to 12 (a5 0.95), with high values associatedwith more optimism.
2.2.2. Postsurgical assessment—48 hours after surgery (T2)
Forty-eight hours after surgery, women were again assessed ina face-to-face interview by the same psychologist who performedthe baseline assessment in T1.
2.2.2.1. Acute postsurgical pain measurement
Worst and average levels of acute pain intensity, within the first 48hours after surgery, were assessed using an 11-point NRS (fromthe BPI-SF described above).24
The PSP frequency assessment was performed using thefrequency scale of the McGill Pain Questionnaire.66 Pain couldbe defined either as constant (continuous and steady),intermittent (periodic and rhythmic), or brief (momentary andtransient).
2.2.2.2. Postsurgical anxiety
Postsurgical anxiety was evaluated again at this time point usingthe Hospital Anxiety and Depression Scale anxiety subscale110
already described.
Figure 1. Flowchart of women undergoing hysterectomy.
958 P.R. Pinto et al.·159 (2018) 956–967 PAIN®
Copyright � 2018 by the International Association for the Study of Pain. Unauthorized reproduction of this article is prohibited.29
2.2.3. Postsurgical assessment—4 months (T3) and 5 yearsafter surgery (T4)
Four months and 5 years after surgery, telephone calls weremade to every participant to check for the presence of pain.The question was: “Do you still have any pain that you couldlink to surgery or that you could relate to the surgicalprocedure?” This is an adaptation of the BPI-SF first questionon pain prospection. If women answered no, those womenwere classified as cases without pain. Contrarily, if womenanswered yes, they were considered pain cases. For thosewomen reporting pain, additional measures were used, whichfocused on pain assessment.
2.2.3.1. The Brief Pain Inventory—short form
As described above.24
2.2.3.2. Pain frequency description
Pain frequency could be described as constant, daily, severaltimes a week but not daily, several times a month but not weekly,during sexual intercourse, by touch or lifting weight.
2.2.3.3. Neuropathic Pain Questionnaire (DN-4)
Previous research described CPSP as a potential neuropathicpain.4,48,51 This instrument assesses pain characteristics/qualityusing 10 items. Seven of them refer to specific pain sensorydescriptors, such as burning, pinpricking or numbness, andpatients answer if their pain has those characteristics usinga dichotomous response format (yes or no). The last 3 items resultfrom the sensory examination of patients performed by a clinician.For the purpose of this study, only the first 7 itemswere included.5
Besides the information regarding pain quality, this questionnairealso provides information concerning the potential likelihood ofneuropathic pain, corresponding to a cutoff of 3 (DN4 $ 3).
2.3. Surgical procedures, anesthetic, andanalgesic techniques
Clinical data related to the surgery, anesthesia and analgesiawere collected from medical records.
Regarding surgical procedure, among the 170 women whounderwent surgery, 122 (71.8%) were submitted to totalabdominal hysterectomy, 31 (18.2%) to vaginal hysterectomy,11 (6.5%) to total laparoscopic hysterectomy, and 6 (3.5%) tolaparoscopically assisted vaginal hysterectomy. In abdominalhysterectomy (n5 122), a Pfannenstiel incision was performed in102 women (83.6%), being established as the first choice, witha vertical infraumbilical incision being performed in 20 women(16.4%), corresponding to cases wherein a previous verticalsurgical scar was present.
Concomitant procedures, such as oophorectomy, ovariancystectomy, salpingectomy, cystoscopy, or vaginal repair, werealso performed in a few patients. Moreover, uterus weight andheight were also recorded.
Concerning the type of anesthesia, 51 (30.0%) patients hadgeneral anesthesia, 22 (12.9%) had locoregional, and 97 (57.1%)were submitted to combined anesthesia (general1 locoregional).ASA score (physical status classification of the American Societyof Anesthesiologists) was recorded, including cases of ASA gradeI (49, 28.8%), II (107, 62.9%), and III (14, 8.2%).
In what regards analgesic procedures, a postsurgical 48 hoursstandardized analgesia protocol was assigned to all patients. Thisprotocol was established and supervised by the Acute PainService, before the transferring of patients to the infirmary.
Delivery of the analgesic protocol was either epidural orintravenous. The standardized epidural protocols could be: (1)a continuous epidural infusion delivered infusion balloon withropivacaine (0.1%) and fentanyl (3 mg/mL), administrated to 105(61.8%) women; or (2) administration of an epidural morphinebolus (2-3 mg, 12/12 h), assigned to 14 (8.2%) women. Theintravenous protocol consisted in a continuous intravenousinfusion delivered infusion balloon of tramadol (600 mg),metamizol (6 g), and metoclopramide (60 mg) and was usedwith 51 (30.0%) patients.
Paracetamol (1 g 6/6 h) and nonsteroidal anti-inflammatorydrugs (ketorolac 30mg 12/12 h or parecoxib 40mg 12/12 h) werealways included as coadjuvant analgesics. In addition, allanalgesic regimens included prokinetic treatment that wasstandardized to metoclopramide (10 mg intravenously 8/8 h). Incases of moderate or severe acute PSP levels (NRS. 3), rescueanalgesia was prescribed beyond the standardized analgesicprotocol. Because of the great variability in analgesics’ protocoland dosages, no attempt was made to determine totalequianalgesic medication dosages. Instead, it was recordedwhether rescue analgesics were given to patients or not.
The use of psychotropic drugs (anxiolytics and antidepres-sants) during hospital stay was detailed from hospital records.
2.4. Statistical analyses
The primary outcome variable under study is PSP trajectory,corresponding to 3 possible PT groups: (1) No CPSP or paintrajectory 1 (PT1), comprised by women who did not report painneither at 4months nor at 5 years after surgery; (2) prolonged PSPor pain trajectory 2 (PT2), including women who complained ofpain 4months after surgery, but not 5 years after; and (3) CPSP orpain trajectory 3 (PT3), comprising those women whoreported pain both at 4 months and 5 years after hysterectomy.These groups were defined taking into account pain report (yes[presence] or no [absence]) 4 months and 5 years afterhysterectomy (T3 and T4).
To compare the 3 groups on the variables under analysis, chi-square or Fisher tests and one-way analysis of variance statisticaltests were computed. For the latter, in the case of significantresults (P , 0.05), Bonferroni post hoc tests were performed tofurther investigate between-group differences. These preliminaryanalyses were exploratory and were performed to determine thepredictor variables to include in the subsequent regressionanalyses.
Finally, a set of predictive multinomial logistic regressionmodels were conducted to investigate risk factors associatedwith PT group membership. The sociodemographic, clinical, andpsychological variables selected for the regression analyses werethose that distinguished PT groups in univariate analyses. Twostructural models were developed: model 1 (M1), investigatingthe role of baseline presurgical variables (T1), allowing for theestablishment of a presurgical risk profile; and model 2 (M2),aiming at further understanding the role of acute postsurgicalfactors, 48 hours after hysterectomy (T2). These basic structuralmodels, include demographic (age) and clinical (pain-related[presurgical pain] and surgery-related [type of hysterectomy])variables that significantly distinguished the groups in univariateanalyses, to control these effects in group comparisons.
Considering the role of presurgical baseline predictors, anddue to shared variance among the 5 psychological predictors(and consequent multicollinearity), which emerged as significantin the distinction of the 3 groups, 3 different submodels wereconsidered. The first model (M1A) focused on emotional variables
May 2018·Volume 159·Number 5 www.painjournalonline.com 959
Copyright � 2018 by the International Association for the Study of Pain. Unauthorized reproduction of this article is prohibited.30

(presurgical anxiety and fear), the second (M1B) centered onillness perceptions (emotional representation of the diseaseunderlying surgery), and the third model (M1C) tested the roleof pain coping strategies (pain catastrophizing).
Regarding acute postsurgical factors, 2 models were com-puted, both controlling for the same abovementioned de-mographic and clinical variables that were controlled for inpresurgical models. Beyond these covariates, the first model(M2A) tested for the specific predictive role of acute PSP intensityand frequency. The second postsurgical model (M2B) was akin tothe first, although it had the addition of postsurgical anxiety.
Data were analyzed using the IBM SPSS Statistics version24.0. Internal consistency of responses to the questionnaires wasassessed using Cronbach alpha.27 Results were consideredsignificant for P values , 0.05. Effect size (ES) measures wereinterpreted considering theCohen25 rule of thumb for eta squared(h2): small ES 5 0.02; medium ES 5 0.13; large ES 5 0.26; andRea and Parker84 for Cramer phi (w) or Cramer V for nominal data:negligible association: 0 and under 0.10; weak association: 0.10and under 0.20; moderate association: 0.20 and under 0.40;relatively strong association: 0.40 and under 0.60; strongassociation: 0.60 and under 0.80; and very strong association:0.80 and under 1.00.
3. Results
3.1. Pain trajectory according to pain report 4 months (T3)and 5 years (T4) after hysterectomy
Table 1 presents the number of women within each PT group,according to the course of pain up to 5 years after surgery.
Considering PT, 88 (51.8%, PT1) women did not complain ofpain at 4 months or 5 years after surgery. This was the largestgroup and was called “No Chronic Post-Surgical Pain.” This PT isa typical, expected, and desirable one in terms of healing andnormal recovery. The second groupwas comprised of 53 (31.2%,PT2) women who complained of pain 4 months postsurgery, butat 5 years after surgery did not experience any related pain. Thisgroup was labelled “Prolonged Post-Surgical Pain.” The third PTgroup (PT3) included 29 (17.1%) women who reported pain bothat 4 months and 5 years after hysterectomy. As their painpersisted over time, this group was labelled “Chronic Post-Surgical Pain.” All patients reporting pain at the 5-year follow-upalso had reported pain at 4 months postsurgery. Patients notreporting pain at the 4-month follow-up also did not report pain 5years later. Thus, there were no cases of “new pain” with a lateronset beyond the 4-month follow-up time point.
3.2. Differences among pain trajectory groups onsociodemographic, clinical, and psychological variables
Table 2 shows that before surgery, PT groups differed in age(P 5 0.013; h2 5 0.051, small ES), with PT1 being older than
PT2 (P 5 0.003). Concerning clinical measures, the groupswere similar in terms of surgical disease onset, body massindex, previous surgical procedures, or presurgical psycho-tropic use. Regarding presurgical pain, the 3 groups of womendiffered significantly on presurgical pain related to thecondition underlying surgery (P5 0.032; w5 0.201, moderateassociation), but not on previous chronic pain because of othercauses (Table 2). Among the 3 empirically derived PT groups,and regarding psychological variables measured beforesurgery, there were significant differences in anxiety (P ,0.001; h25 0.094, small ES), surgical fear related to long-termconsequences of surgery (P 5 0.022; h2 5 0.045, small ES),emotional representation of surgical disease (P 5 0.001; h2 50.081, small ES), and pain catastrophizing (P , 0.001; h2 50.090, small ES). For all these variables, higher values wereassociated with chronic pain groupmembership in PT2 or PT3.
In terms of surgery, the PT groups could be distinguishedbased on the type of surgical approach (P 5 0.007; w 5 0.242,moderate association) and among those undergoing abdominalhysterectomy, there were also differences across groups on thetype of abdominal incision (P 5 0.003; w 5 0.260, moderateassociation). The PT2 and PT3 groups had more womenundergoing abdominal hysterectomy and a Pfannenstiel incision.
In the acute postsurgical period, 48 hours after surgery, the 3PT groups of women showed differences in acute pain report,regarding worst (P , 0.001; h2 5 0.096, small ES) and average(P 5 0.001; h2 5 0.086, small ES) pain intensity, pain frequency(P 5 0.001; w 5 0.286, moderate association), and postsurgicalanxiety (P , 0.001; h2 5 0.109, small ES). These differencesshowed that the PT2 and PT3 groups scored more negatively onthese variables.
3.3. Pain incidence, characteristics, and perceived impact 5years after hysterectomy
Among the 170 women who completed the 4 assessments, 29(17.1%) revealed an unfavorable PT after hysterectomy, reportingpain both at 4 months and 5 years after surgery, therefore beingconsidered CPSP cases (Table 3). From these 29 cases ofCPSP, Table 3 highlights that in terms of pain frequency, mostwomen (44.8%) reported pain several times a week, with 24.2%ofwomenperceiving pain on a daily basis and 20.7%complainingof pain only during sexual intercourse or by touch. In addition, themean of worst pain intensity was 3.17 (SD5 1.61) and the meanaverage level of pain intensity was 1.89 (SD5 0.88), on the 0 to 10NRS. It was also shown that 34.5% of CPSP women rated theirworst pain intensity above 3 (NRS. 3), indicating moderate and/or severe pain levels. Table 3 also reveals that the pain sensorycharacteristics more often described by patients with CPSPwerefeeling of pins and needles (51.7%) and numbness (31.0%). Interms of a potential neuropathic pain component of CPSP, 5(17.2%) women presented a DN4 $ 3 value. Pain interference
Table 1
Pain trajectory groups according to pain report at 4 months (T3) and 5 years (T4) after hysterectomy.
Pain trajectories Chronic pain report (N 5 170) n (%) Group designation
T3 (4 mo after surgery) T4 (5 y after surgery)
Pain trajectory 1 No No 88 (51.8) No chronic postsurgical pain
Pain trajectory 2 Yes No 53 (31.2) Prolonged postsurgical pain
Pain trajectory 3 Yes Yes 29 (17.1) Chronic postsurgical pain
960 P.R. Pinto et al.·159 (2018) 956–967 PAIN®
Copyright � 2018 by the International Association for the Study of Pain. Unauthorized reproduction of this article is prohibited.31
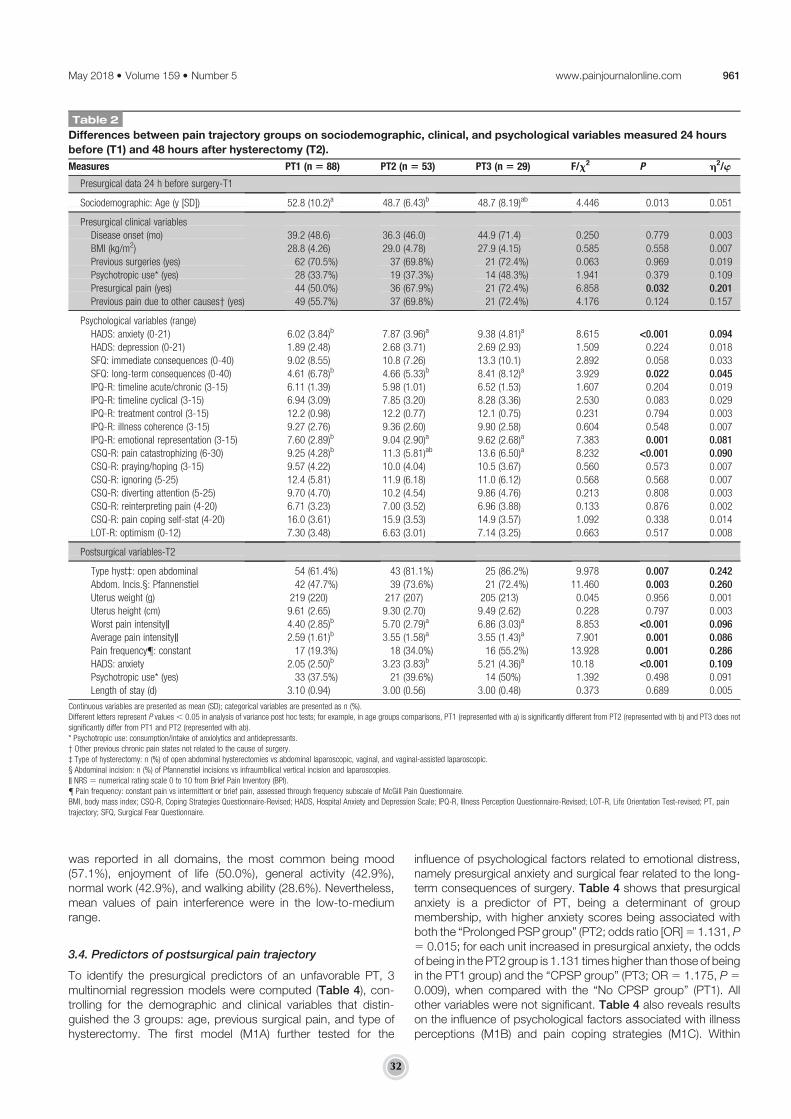
was reported in all domains, the most common being mood(57.1%), enjoyment of life (50.0%), general activity (42.9%),normal work (42.9%), and walking ability (28.6%). Nevertheless,mean values of pain interference were in the low-to-mediumrange.
3.4. Predictors of postsurgical pain trajectory
To identify the presurgical predictors of an unfavorable PT, 3multinomial regression models were computed (Table 4), con-trolling for the demographic and clinical variables that distin-guished the 3 groups: age, previous surgical pain, and type ofhysterectomy. The first model (M1A) further tested for the
influence of psychological factors related to emotional distress,namely presurgical anxiety and surgical fear related to the long-term consequences of surgery. Table 4 shows that presurgicalanxiety is a predictor of PT, being a determinant of groupmembership, with higher anxiety scores being associated withboth the “Prolonged PSP group” (PT2; odds ratio [OR]5 1.131, P5 0.015; for each unit increased in presurgical anxiety, the oddsof being in the PT2 group is 1.131 times higher than those of beingin the PT1 group) and the “CPSP group” (PT3; OR5 1.175, P50.009), when compared with the “No CPSP group” (PT1). Allother variables were not significant. Table 4 also reveals resultson the influence of psychological factors associated with illnessperceptions (M1B) and pain coping strategies (M1C). Within
Table 2
Differences between pain trajectory groups on sociodemographic, clinical, and psychological variables measured 24 hours
before (T1) and 48 hours after hysterectomy (T2).
Measures PT1 (n 5 88) PT2 (n 5 53) PT3 (n 5 29) F/x2 P h2/w
Presurgical data 24 h before surgery-T1
Sociodemographic: Age (y [SD]) 52.8 (10.2)a 48.7 (6.43)b 48.7 (8.19)ab 4.446 0.013 0.051
Presurgical clinical variables
Disease onset (mo) 39.2 (48.6) 36.3 (46.0) 44.9 (71.4) 0.250 0.779 0.003
BMI (kg/m2) 28.8 (4.26) 29.0 (4.78) 27.9 (4.15) 0.585 0.558 0.007
Previous surgeries (yes) 62 (70.5%) 37 (69.8%) 21 (72.4%) 0.063 0.969 0.019
Psychotropic use* (yes) 28 (33.7%) 19 (37.3%) 14 (48.3%) 1.941 0.379 0.109
Presurgical pain (yes) 44 (50.0%) 36 (67.9%) 21 (72.4%) 6.858 0.032 0.201Previous pain due to other causes† (yes) 49 (55.7%) 37 (69.8%) 21 (72.4%) 4.176 0.124 0.157
Psychological variables (range)
HADS: anxiety (0-21) 6.02 (3.84)b 7.87 (3.96)a 9.38 (4.81)a 8.615 <0.001 0.094HADS: depression (0-21) 1.89 (2.48) 2.68 (3.71) 2.69 (2.93) 1.509 0.224 0.018
SFQ: immediate consequences (0-40) 9.02 (8.55) 10.8 (7.26) 13.3 (10.1) 2.892 0.058 0.033
SFQ: long-term consequences (0-40) 4.61 (6.78)b 4.66 (5.33)b 8.41 (8.12)a 3.929 0.022 0.045IPQ-R: timeline acute/chronic (3-15) 6.11 (1.39) 5.98 (1.01) 6.52 (1.53) 1.607 0.204 0.019
IPQ-R: timeline cyclical (3-15) 6.94 (3.09) 7.85 (3.20) 8.28 (3.36) 2.530 0.083 0.029
IPQ-R: treatment control (3-15) 12.2 (0.98) 12.2 (0.77) 12.1 (0.75) 0.231 0.794 0.003
IPQ-R: illness coherence (3-15) 9.27 (2.76) 9.36 (2.60) 9.90 (2.58) 0.604 0.548 0.007
IPQ-R: emotional representation (3-15) 7.60 (2.89)b 9.04 (2.90)a 9.62 (2.68)a 7.383 0.001 0.081CSQ-R: pain catastrophizing (6-30) 9.25 (4.28)b 11.3 (5.81)ab 13.6 (6.50)a 8.232 <0.001 0.090CSQ-R: praying/hoping (3-15) 9.57 (4.22) 10.0 (4.04) 10.5 (3.67) 0.560 0.573 0.007
CSQ-R: ignoring (5-25) 12.4 (5.81) 11.9 (6.18) 11.0 (6.12) 0.568 0.568 0.007
CSQ-R: diverting attention (5-25) 9.70 (4.70) 10.2 (4.54) 9.86 (4.76) 0.213 0.808 0.003
CSQ-R: reinterpreting pain (4-20) 6.71 (3.23) 7.00 (3.52) 6.96 (3.88) 0.133 0.876 0.002
CSQ-R: pain coping self-stat (4-20) 16.0 (3.61) 15.9 (3.53) 14.9 (3.57) 1.092 0.338 0.014
LOT-R: optimism (0-12) 7.30 (3.48) 6.63 (3.01) 7.14 (3.25) 0.663 0.517 0.008
Postsurgical variables-T2
Type hyst‡: open abdominal 54 (61.4%) 43 (81.1%) 25 (86.2%) 9.978 0.007 0.242Abdom. Incis.§: Pfannenstiel 42 (47.7%) 39 (73.6%) 21 (72.4%) 11.460 0.003 0.260Uterus weight (g) 219 (220) 217 (207) 205 (213) 0.045 0.956 0.001
Uterus height (cm) 9.61 (2.65) 9.30 (2.70) 9.49 (2.62) 0.228 0.797 0.003
Worst pain intensity‖ 4.40 (2.85)b 5.70 (2.79)a 6.86 (3.03)a 8.853 <0.001 0.096Average pain intensity‖ 2.59 (1.61)b 3.55 (1.58)a 3.55 (1.43)a 7.901 0.001 0.086Pain frequency{: constant 17 (19.3%) 18 (34.0%) 16 (55.2%) 13.928 0.001 0.286HADS: anxiety 2.05 (2.50)b 3.23 (3.83)b 5.21 (4.36)a 10.18 <0.001 0.109Psychotropic use* (yes) 33 (37.5%) 21 (39.6%) 14 (50%) 1.392 0.498 0.091
Length of stay (d) 3.10 (0.94) 3.00 (0.56) 3.00 (0.48) 0.373 0.689 0.005
Continuous variables are presented as mean (SD); categorical variables are presented as n (%).
Different letters represent P values, 0.05 in analysis of variance post hoc tests; for example, in age groups comparisons, PT1 (represented with a) is significantly different from PT2 (represented with b) and PT3 does not
significantly differ from PT1 and PT2 (represented with ab).
* Psychotropic use: consumption/intake of anxiolytics and antidepressants.
† Other previous chronic pain states not related to the cause of surgery.
‡ Type of hysterectomy: n (%) of open abdominal hysterectomies vs abdominal laparoscopic, vaginal, and vaginal-assisted laparoscopic.
§ Abdominal incision: n (%) of Pfannenstiel incisions vs infraumbilical vertical incision and laparoscopies.
‖ NRS 5 numerical rating scale 0 to 10 from Brief Pain Inventory (BPI).
{ Pain frequency: constant pain vs intermittent or brief pain, assessed through frequency subscale of McGill Pain Questionnaire.
BMI, body mass index; CSQ-R, Coping Strategies Questionnaire-Revised; HADS, Hospital Anxiety and Depression Scale; IPQ-R, Illness Perception Questionnaire-Revised; LOT-R, Life Orientation Test-revised; PT, pain
trajectory; SFQ, Surgical Fear Questionnaire.
May 2018·Volume 159·Number 5 www.painjournalonline.com 961
Copyright � 2018 by the International Association for the Study of Pain. Unauthorized reproduction of this article is prohibited.32
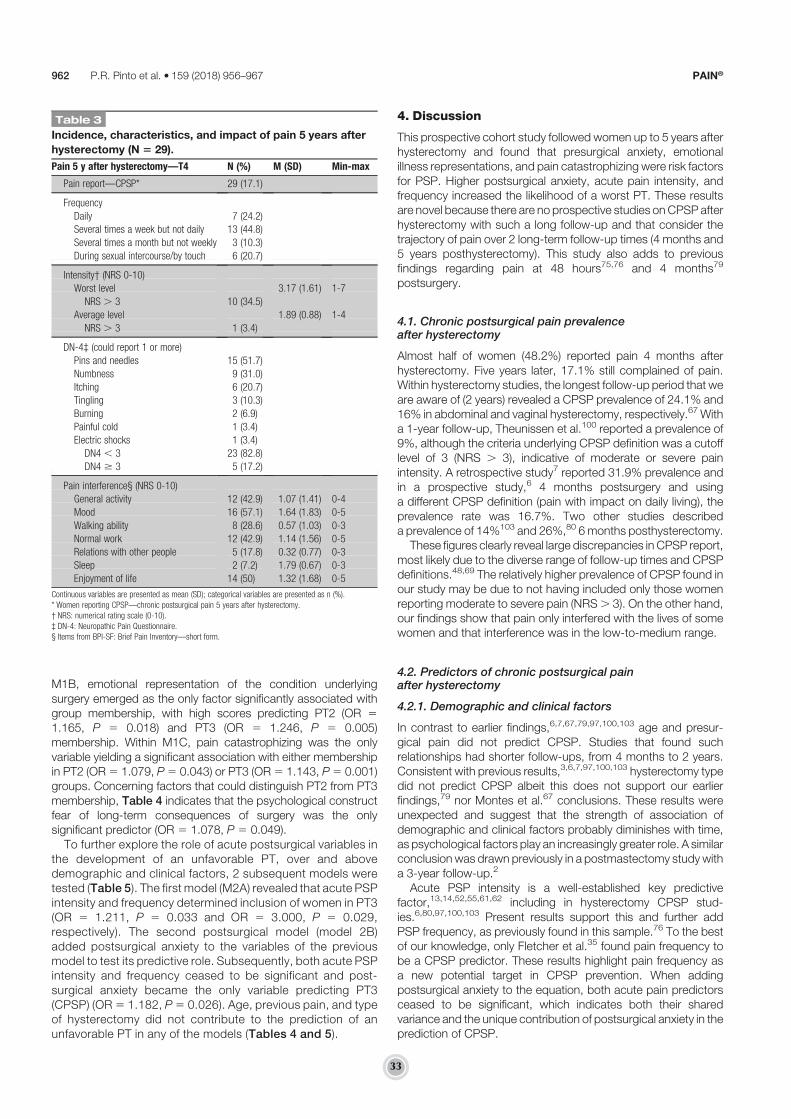
M1B, emotional representation of the condition underlyingsurgery emerged as the only factor significantly associated withgroup membership, with high scores predicting PT2 (OR 51.165, P 5 0.018) and PT3 (OR 5 1.246, P 5 0.005)membership. Within M1C, pain catastrophizing was the onlyvariable yielding a significant association with either membershipin PT2 (OR5 1.079, P5 0.043) or PT3 (OR5 1.143, P5 0.001)groups. Concerning factors that could distinguish PT2 from PT3membership, Table 4 indicates that the psychological constructfear of long-term consequences of surgery was the onlysignificant predictor (OR 5 1.078, P 5 0.049).
To further explore the role of acute postsurgical variables inthe development of an unfavorable PT, over and abovedemographic and clinical factors, 2 subsequent models weretested (Table 5). The first model (M2A) revealed that acute PSPintensity and frequency determined inclusion of women in PT3(OR 5 1.211, P 5 0.033 and OR 5 3.000, P 5 0.029,respectively). The second postsurgical model (model 2B)added postsurgical anxiety to the variables of the previousmodel to test its predictive role. Subsequently, both acute PSPintensity and frequency ceased to be significant and post-surgical anxiety became the only variable predicting PT3(CPSP) (OR5 1.182, P5 0.026). Age, previous pain, and typeof hysterectomy did not contribute to the prediction of anunfavorable PT in any of the models (Tables 4 and 5).
4. Discussion
This prospective cohort study followed women up to 5 years afterhysterectomy and found that presurgical anxiety, emotionalillness representations, and pain catastrophizing were risk factorsfor PSP. Higher postsurgical anxiety, acute pain intensity, andfrequency increased the likelihood of a worst PT. These resultsare novel because there are no prospective studies onCPSP afterhysterectomy with such a long follow-up and that consider thetrajectory of pain over 2 long-term follow-up times (4 months and5 years posthysterectomy). This study also adds to previousfindings regarding pain at 48 hours75,76 and 4 months79
postsurgery.
4.1. Chronic postsurgical pain prevalenceafter hysterectomy
Almost half of women (48.2%) reported pain 4 months afterhysterectomy. Five years later, 17.1% still complained of pain.Within hysterectomy studies, the longest follow-up period that weare aware of (2 years) revealed a CPSP prevalence of 24.1% and16% in abdominal and vaginal hysterectomy, respectively.67 Witha 1-year follow-up, Theunissen et al.100 reported a prevalence of9%, although the criteria underlying CPSP definition was a cutofflevel of 3 (NRS . 3), indicative of moderate or severe painintensity. A retrospective study7 reported 31.9% prevalence andin a prospective study,6 4 months postsurgery and usinga different CPSP definition (pain with impact on daily living), theprevalence rate was 16.7%. Two other studies describeda prevalence of 14%103 and 26%,80 6 months posthysterectomy.
These figures clearly reveal large discrepancies in CPSP report,most likely due to the diverse range of follow-up times and CPSPdefinitions.48,69 The relatively higher prevalence of CPSP found inour study may be due to not having included only those womenreporting moderate to severe pain (NRS. 3). On the other hand,our findings show that pain only interfered with the lives of somewomen and that interference was in the low-to-medium range.
4.2. Predictors of chronic postsurgical painafter hysterectomy
4.2.1. Demographic and clinical factors
In contrast to earlier findings,6,7,67,79,97,100,103 age and presur-gical pain did not predict CPSP. Studies that found suchrelationships had shorter follow-ups, from 4 months to 2 years.Consistent with previous results,3,6,7,97,100,103 hysterectomy typedid not predict CPSP albeit this does not support our earlierfindings,79 nor Montes et al.67 conclusions. These results wereunexpected and suggest that the strength of association ofdemographic and clinical factors probably diminishes with time,as psychological factors play an increasingly greater role. A similarconclusion was drawn previously in a postmastectomy study witha 3-year follow-up.2
Acute PSP intensity is a well-established key predictivefactor,13,14,52,55,61,62 including in hysterectomy CPSP stud-ies.6,80,97,100,103 Present results support this and further addPSP frequency, as previously found in this sample.76 To the bestof our knowledge, only Fletcher et al.35 found pain frequency tobe a CPSP predictor. These results highlight pain frequency asa new potential target in CPSP prevention. When addingpostsurgical anxiety to the equation, both acute pain predictorsceased to be significant, which indicates both their sharedvariance and the unique contribution of postsurgical anxiety in theprediction of CPSP.
Table 3
Incidence, characteristics, and impact of pain 5 years after
hysterectomy (N 5 29).
Pain 5 y after hysterectomy—T4 N (%) M (SD) Min-max
Pain report—CPSP* 29 (17.1)
Frequency
Daily 7 (24.2)
Several times a week but not daily 13 (44.8)
Several times a month but not weekly 3 (10.3)
During sexual intercourse/by touch 6 (20.7)
Intensity† (NRS 0-10)
Worst level 3.17 (1.61) 1-7
NRS . 3 10 (34.5)
Average level 1.89 (0.88) 1-4
NRS . 3 1 (3.4)
DN-4‡ (could report 1 or more)
Pins and needles 15 (51.7)
Numbness 9 (31.0)
Itching 6 (20.7)
Tingling 3 (10.3)
Burning 2 (6.9)
Painful cold 1 (3.4)
Electric shocks 1 (3.4)
DN4 , 3 23 (82.8)
DN4 $ 3 5 (17.2)
Pain interference§ (NRS 0-10)
General activity 12 (42.9) 1.07 (1.41) 0-4
Mood 16 (57.1) 1.64 (1.83) 0-5
Walking ability 8 (28.6) 0.57 (1.03) 0-3
Normal work 12 (42.9) 1.14 (1.56) 0-5
Relations with other people 5 (17.8) 0.32 (0.77) 0-3
Sleep 2 (7.2) 1.79 (0.67) 0-3
Enjoyment of life 14 (50) 1.32 (1.68) 0-5
Continuous variables are presented as mean (SD); categorical variables are presented as n (%).
* Women reporting CPSP—chronic postsurgical pain 5 years after hysterectomy.
† NRS: numerical rating scale (0-10).
‡ DN-4: Neuropathic Pain Questionnaire.
§ Items from BPI-SF: Brief Pain Inventory—short form.
962 P.R. Pinto et al.·159 (2018) 956–967 PAIN®
Copyright � 2018 by the International Association for the Study of Pain. Unauthorized reproduction of this article is prohibited.33

It is noteworthy that the acute postsurgical variables onlypredicted pain 5 years later. This suggests that to prevent long-term posthysterectomy pain, women should be screened andtargeted throughout the perioperative period, and not only beforesurgery. Baseline assessments are useful for medium- and long-term pain prediction, whereas acute postsurgical variables seemto better predict long-term chronic pain.
4.2.2. The key role of psychological predictors
Presurgical anxiety and pain catastrophizing were predictive of anunfavorable PSP trajectory and CPSP, which corroboratesprevious findings.16,44,99 Presurgical anxiety, already shown to
be a predictor of CPSP 4 and 6 months79,103 posthysterectomy,is also predictive of CPSP 5 years later. Furthermore, paincatastrophizing, a well-established CPSP psychological riskfactor,2,15,50,56,83 emerges as a predictor for the first time in ourhysterectomy studies.79
Our results also confirm the important role of emotionalrepresentation of the surgical disease and of postsurgical anxiety.79
Other studies have demonstrated the impact of cognitive andaffective responses triggered by illness on health outcomes,57,91
although the investigation of their predictive role on PSP has beenscarce.77,79 Postsurgical anxiety is such a response, presentfindings highlighting the need to address anxiety throughout theperioperative period, and not only before surgery.
Table 4
Multinomial logistic regressionmodel relating pain trajectory membership with presurgical variables measured 24 hours before
hysterectomy.
Pain trajectory comparison Presurgical models Nagelkerke R2 B SE Wald OR 95% CI
LL UL
Model 1A—emotional distress 0.206
PT1 vs PT2 Age† 20.036 0.024 2.334 0.964 0.920 1.010
Presurgical pain‡ 0.231 0.416 0.309 1.260 0.557 2.851
Type of hysterectomy§ 0.750 0.447 2.820 2.118 0.882 5.084
Presurgical anxiety‖ 0.123 0.051 5.924* 1.131 1.024 1.249
Presurgical fear{ 20.044 0.034 1.677 0.957 0.895 1.023
PT1 vs PT3 Age† 20.013 0.032 0.157 0.987 0.927 1.052
Presurgical pain‡ 0.706 0.534 1.752 2.026 0.712 5.767
Type of hysterectomy§ 1.010 0.621 2.650 2.747 0.814 9.273
Presurgical anxiety‖ 0.161 0.062 6.799** 1.175 1.041 1.326
Presurgical fear{ 0.031 0.035 0.802 1.032 0.964 1.104
PT2 vs PT3 Age† 0.024 0.034 0.471 1.024 0.957 1.095
Presurgical pain‡ 0.475 0.557 0.726 1.608 0.540 4.790
Type of hysterectomy§ 0.260 0.669 0.151 1.297 0.350 4.809
Presurgical anxiety‖ 0.038 0.062 0.376 1.039 0.920 1.173
Presurgical fear{ 0.075 0.038 3.880* 1.078 1.000 1.162
Model 1B‡‡—illness perceptions 0.171
PT1 vs PT2 Age† 20.030 0.023 1.697 0.970 0.928 1.015
Presurgical pain‡ 0.263 0.405 0.423 1.301 0.588 2.878
Type of hysterectomy§ 0.793 0.445 3.168 2.209 0.923 5.290
Emotional representation# 0.152 0.064 5.586* 1.165 1.026 1.321
PT1 vs PT3 Age† 20.018 0.030 0.378 0.982 0.926 1.041
Presurgical pain‡ 0.430 0.515 0.698 1.538 0.560 4.219
Type of hysterectomy§ 1.166 0.621 3.530 3.209 0.951 10.829
Emotional representation# 0.220 0.079 7.821** 1.246 1.068 1.455
Model 1C‡‡—pain coping strategies 0.178
PT1 vs PT2 Age† 20.037 0.023 2.611 0.963 0.921 1.008
Presurgical pain‡ 0.373 0.402 0.862 1.452 0.661 3.190
Type of hysterectomy§ 0.609 0.045 1.878 1.839 0.769 4.395
Pain catastrophizing†† 0.076 0.038 4.086* 1.079 1.002 1.162
PT1 vs PT3 Age† 20.034 0.031 1.172 0.967 0.910 1.028
Presurgical pain‡ 0.577 0.520 1.231 1.781 0.642 4.940
Type of hysterectomy§ 0.798 0.623 1.641 2.221 0.655 7.532
Pain catastrophizing†† 0.134 0.042 10.170*** 1.143 1.053 1.241
*P , 0.05; **P , 0.01; and ***P , 0.001.
PT1—Reference Group (In MODEL 1A PT2 vs PT3, PT2 is the reference group).
† Continuous variable, in years.
‡ Dichotomous variable: 0 5 no and 1 5 yes.
§ Dichotomous variable: 0 5 abdominal laparoscopic, vaginal, and vaginal-assisted laparoscopic and 1 5 open abdominal hysterectomies.
‖ Continuous variable, HADS-A: Hospital Anxiety and Depression Scale—anxiety subscale.
{ Continuous variable, Surgical Fear Questionnaire—fear of immediate consequences of surgery subscale.
# Continuous variable, IPQ-R: Illness Perception Questionnaire-Revised—all subscales.
†† Continuous variable, CSQ-R: Coping Strategies Questionnaire-Revised—all subscales.
‡‡ For models 1B and 1C, no significant predictors were found in the comparison of PT2 and PT3.
CI, confidence interval; LL, lower limit; OR, odds ratio; PT1, pain trajectory group 1 (no chronic postsurgical pain); PT2, pain trajectory group 2 (prolonged postsurgical pain); PT3, pain trajectory group 3 (chronic postsurgical
pain); UL, upper limit.
May 2018·Volume 159·Number 5 www.painjournalonline.com 963
Copyright � 2018 by the International Association for the Study of Pain. Unauthorized reproduction of this article is prohibited.34

Although all baseline psychological factors are commonpredictive factors for both PT2 and PT3 membership, presurgicalfear of long-term consequences of surgery was the only variablespecifically distinguishing these groups. Hence, presentinghigher levels of fear related with long-term issues, such as fearof health deterioration or long-lasting surgical recovery, seems toconfer a greater risk of long-lasting pain.
The set of predictive models used in this study, which includepreoperative and perioperative emotion and cognitions, seem toreveal a psychological vulnerability profile, influencing PSPtrajectory and ultimately the development of CPSP. This criticalrole of psychological factors on pain experience helps tounderstand the discrepancy that sometimes emerges betweenphysical pathology, injury, and pain report.16,55,86,107 Thesefindings are also in accordance with the gate control andneuromatrix theories of pain,64,65 as well as with the biopsy-chosocial approach to pain,37 which recognize pain as a multi-dimensional subjective experience.
Peripheral sensitization, central sensitization, and descendingmodulation constitute 3 interweaved processes believed tounderlie CPSP.62 Augmented activation of pain pathways maystem from peripheral and/or central sensitization, although painamplification may also arise from abnormalities in descendingmodulatory systems.72,81,109 These descending pathways
involve endogenous opioids, serotonin, and noradrenaline,presenting both excitatory and inhibitory actions on spinal cordafferent projection neurons and could be activated by psycho-logical factors.11 Catastrophizing, anxiety, and other negativeemotions are associated with reduced effectiveness in descend-ing pain-inhibitory systems,83,105 facilitating spinal nociception,and pain, whereas positive affect and self-regulatory skills inhibitspinal nociception and pain.28,39,88–90 The primary role ofcatastrophizing in pain modulation has been high-lighted16,18,34,39,50,94 and suggested to be associated withdiminished endogenous inhibition of pain coupled with centralsensitization.83 Moreover, an association was shown betweenadaptive pain coping strategies and activation of descendingendogenous opioid systems1 and between depressedmood andimpaired endogenous inhibition of pain.30
4.3. Practical and clinical implications
Because chronic pain is very difficult to treat, the importance ofsecondary prevention is highlighted.38,93 Besides, and despitethe enthusiastic and promising findings of some trials focusing onpreventive analgesic approaches,10,12,21,29,74,96 there is not yetany robust evidence to support the unequivocal efficacy ofsystemic drugs for CPSP prevention.9,17,19,43,53,60,63,86
Table 5
Multinomial logistic regression model relating pain trajectory membership with postsurgical variables measured 48 hours after
hysterectomy.
Pain trajectory comparison Postsurgical models Nagelkerke R2 B SE Wald OR 95% CI
LL UL
Model 2A††—acute pain 0.192
PT1 vs PT2 Age 20.031 0.023 1.774 0.970 0.927 1.015
Presurgical pain‡ 0.289 0.404 0.511 1.335 0.605 2.946
Type of hysterectomy§ 0.640 0.443 2.083 1.896 0.795 4.552
Acute postsurgical pain intensity‖ 0.067 0.069 0.957 1.070 0.935 1.224
Acute postsurgical pain frequency{ 0.429 0.431 0.992 1.535 0.660 3.571
PT1 vs PT3 Age 20.011 0.032 0.114 0.989 0.929 1.053
Presurgical pain‡ 0.388 0.527 0.543 1.474 0.525 4.139
Type of Hysterectomy§ 0.765 0.634 1.457 2.149 0.620 7.441
Acute postsurgical pain intensity‖ 0.191 0.090 4.525* 1.211 1.015 1.444
Acute postsurgical pain frequency{ 1.099 0.505 4.741* 3.000 1.116 8.065
Model 2B††—Acute pain 1 anxiety 0.222
PT1 vs PT2 Age† 20.031 0.023 1.743 0.970 0.926 1.015
Presurgical pain‡ 0.360 0.410 0.771 1.433 0.642 3.201
Type of hysterectomy§ 0.637 0.446 2.041 1.890 0.789 4.527
Acute postsurgical pain intensity‖ 0.031 0.074 0.172 1.031 0.892 1.192
Acute postsurgical pain frequency{ 0.306 0.445 0.474 1.358 0.568 3.250
Postsurgical anxiety# 0.093 0.068 1.863 1.098 0.960 1.255
PT1 vs PT3 Age† 20.016 0.033 0.234 0.984 0.923 1.050
Presurgical pain‡ 0.430 0.536 0.643 1.537 0.538 4.391
Type of hysterectomy§ 0.715 0.646 1.224 2.044 0.576 7.255
Acute postsurgical pain intensity‖ 0.123 0.097 1.620 1.131 0.936 1.367
Acute postsurgical pain frequency{ 0.786 0.536 2.152 2.195 0.768 6.277
Postsurgical anxiety# 0.167 0.075 4.945* 1.182 1.020 1.370
*P , 0.05; **P , 0.01; and ***P , 0.001.
PT1—Reference Group.
† Continuous variable, in years.
‡ Dichotomous variable: 0 5 no and 1 5 yes.
§ Dichotomous variable: 0 5 abdominal laparoscopic, vaginal, and vaginal-assisted laparoscopic and 1 5 open abdominal hysterectomies.
‖ Continuous variable, NRS 0 to 10 from BPI-SF: Brief Pain Inventory—short form.
{ Dichotomous variable: 0 5 intermittent or brief pain, 1 5 constant pain, frequency subscale of McGill Pain Questionnaire.
# Continuous variable, HADS-A: Hospital Anxiety and Depression Scale—anxiety subscale.
†† For models 2A and 2B, no significant predictors were found in the comparison of PT2 and PT3.
CI, confidence interval; LL, lower limit; NRS, numerical rating scale; OR, odds ratio; PT1, pain trajectory group 1 (no chronic postsurgical pain); PT2, pain trajectory group 2 (prolonged postsurgical pain); PT3, pain trajectory
group 3 (chronic postsurgical pain); UL, upper limit.
964 P.R. Pinto et al.·159 (2018) 956–967 PAIN®
Copyright � 2018 by the International Association for the Study of Pain. Unauthorized reproduction of this article is prohibited.35

Moreover, notwithstanding the advances in knowledge aboutpain genetics,22,31,32,70,71 there is not, until now, sustainedevidence for genetic predisposition for CPSP develop-ment22,48,67,86 that could assist in screening for pain-pronepatients and in informing a personalized pain treatment protocol.This leaves room for the implementation of psychologicalinterventions aimed at preventing CPSP.15,23,33,47–49,62,99 In-deed, present findings point to CPSP predictors that aremodifiable risk factors, amenable to change or to activemanagement, precisely through psychological interventions.Targeting them might yield adaptive and functional changes inbrain pain processing, thus being an effective way to preventCPSP development.34,94
The effectiveness of psychological interventions in pain is wellestablished,36,46 although in the surgical field it is overdue.15,47,55
As substantial advances are being made in identifying risk factorsfor CPSP, the design and testing of preventive pain managementstrategies stemming from this evidence is warranted as well asthe analysis of their cost-effectiveness. An enthusiastic andpromising novelty in this field is the development and implemen-tation of a Transitional Pain Service, a multidisciplinary programaimed at preventing and managing CPSP, which offers simulta-neous psychological and pharmacologicalinterventions.20,23,42,49
Psychological interventions have the power to impact supra-spinal mechanisms involving higher pain centers,62 influencingendogenous modulation of pain, thereby improving endogenousanalgesia, similarly to mechanisms underlying pharmacologicalanalgesia.34,45,46,83 For example, cognitive-behavioral therapyhas been related to changes in brain limbic activity, which hasbeen implicated in improvement of anxiety and potentiation ofdescending modulatory inhibition of pain.54,106 Increased graymatter in prefrontal and parietal brain regions linked with chronicpain, was also observed after cognitive-behavioral therapy, beingassociated with a decrease in pain catastrophizing.95
4.4. Limitations and strengths
This is a single-site and single-country study, which compromisesits external validity, thus limiting the generalization of results.Sample attrition is a potential limitation, stemming from thelongitudinal design, although our study showed high retentionover time. Other potential limitation is the absence of a physicalexamination at T3 and T4, screening for inflammation or nerveinjury.
The breath of presurgical measures, embracing demographic,clinical, and a thorough range of psychological variables wasa strength, along with the long-term follow-up of 5 years.
4.5. Conclusions
This study identified risk factors that can be easily screenedbefore and after surgery, and are amenable to intervention. Thedesign of timely and tailored interventions for women at risk of anunfavorable PSP trajectory after hysterectomy is a key priority.Incorporating risk-targeted multidisciplinary and feasible inter-ventions focused on CPSP prevention into surgical routinepractice is an important challenge that is likely to contribute tothe improvement of pain management and patient carethroughout the process of surgery.
Conflict of interest statement
The authors have no conflict of interest to declare.
This work was supported by 2 grants (SFRH/BD/36368/2007and SFRH/BPD/103529/2014) from the Portuguese Foundationof Science and Technology.
Supplemental video content
Video content associated with this article can be found at http://links.lww.com/PAIN/A540.
Article history:Received 18 September 2017Received in revised form 8 December 2017Accepted 3 January 2018Available online 5 February 2018
References
[1] Bandura A, O’Leary A, Taylor CB, Gauthier J, Gossard D. Perceived self-efficacy and pain control: opioid and nonopioid mechanisms. J Pers SocPsychol 1987;53:563–71.
[2] Belfer I, Schreiber KL, Shaffer JR, Shnol H, Blaney K,Morando A, EnglertD, Greco C, Brufsky A, Ahrendt G, Kehlet H, Edwards RR, Bovbjerg DH.Persistent postmastectomy pain in breast cancer survivors: analysis ofclinical, demographic, and psychosocial factors. J Pain 2013;14:1185–95.
[3] Beyaz SG, Ozocak H, Ergonenc T, Palabyk O, Tuna AT, Kaya B,Erkorkmaz U, Akdemir N. Chronic postsurgical pain and neuropathicsymptoms after abdominal hysterectomy: a silent epidemic. Medicine2016;95:e4484.
[4] Bouhassira D, Attal N, Alchaar H, Boureau F, Brochet B, Bruxelle J,Cunin G, Fermanian J, Ginies P, Grun-Overdyking A, Jafari-Schluepi H,Lanteri-Minet M, Laurent B, Mick G, Serrie A, Valade D, Vicaut E.Comparison of pain syndromes associated with nervous or somaticlesions and development of a new neuropathic pain diagnosticquestionnaire (DN4). PAIN 2005;114:29–36.
[5] Bouhassira D, Lanteri-Minet M, Attal N, Laurent B, Touboul C.Prevalence of chronic pain with neuropathic characteristics in thegeneral population. PAIN 2008;136:380–7.
[6] Brandsborg B, Dueholm M, Nikolajsen L, Kehlet H, Jensen TS. Aprospective study of risk factors for pain persisting 4 months afterhysterectomy. Clin J Pain 2009;25:263–8.
[7] Brandsborg B, Nikolajsen L, Hansen CT, Kehlet H, Jensen TS. Riskfactors for chronic pain after hysterectomy: a nationwide questionnaireand database study. Anesthesiology 2007;106:1003–12.
[8] Brandsborg B, Nikolajsen L, Kehlet H, Jensen TS. Chronic pain afterhysterectomy. Acta Anaesthesiol Scand 2008;52:327–31.
[9] Breivik H. Ketamine has anti-hyperalgesic effects and relieves acutepain, but does not prevent persistent postoperative pain (PPP). Scand JPain 2015;7:40–1.
[10] Burke SM, Shorten GD. Perioperative pregabalin improves pain andfunctional outcomes 3 months after lumbar discectomy. Anesth Analg2010;110:1180–5.
[11] Bushnell MC, Ceko M, Low LA. Cognitive and emotional control of painand its disruption in chronic pain. Nat Rev Neurosci 2013;14:502–11.
[12] Buvanendran A, Kroin JS, Della Valle CJ, Kari M, Moric M, Tuman KJ.Perioperative oral pregabalin reduces chronic pain after total kneearthroplasty: a prospective, randomized, controlled trial. Anesth Analg2010;110:199–207.
[13] Bruce J, Quinlan J. Chronic post surgical pain. Rev pain 2011;5:23–9.[14] Bruce J, Thornton AJ, Powell R, Johnston M, Wells M, Heyes SD,
Thompson AM, Smith WC, Chambers WA; Scott NW on Behalf of theRecovery Study Group. Psychological, surgical and sociodemographicpredictors of pain outcomes after breast cancer surgery: a population-based cohort study. PAIN 2014;155:232–43.
[15] Burns JW, Moric M. Psychosocial factors appear to predictpostoperative pain: Interesting, but how can such information be usedto reduce risk? Tech Reg Anesth Pain Manag 2011;15:90–9.
[16] Campbell CM, Edwards RR. Mind–body interactions in pain: theneurophysiology of anxious and catastrophic pain-related thoughts.Translational Res 2009;153:97–101.
[17] Chaparro LE, Smith SA, Moore RA, Wiffen PJ, Gilron I.Pharmacotherapy for the prevention of chronic pain after surgery inadults. Cochrane Database Syst Rev 2013;CD008307. doi: 10.1002/14651858.CD008307.pub2.
May 2018·Volume 159·Number 5 www.painjournalonline.com 965
Copyright � 2018 by the International Association for the Study of Pain. Unauthorized reproduction of this article is prohibited.36

[18] Chehadi O, Suchan B, Konietzny K, Koster O, Schmidt-Wilcke T,Hasenbring MI. Gray matter alteration associated with paincatastrophizing in patients 6 months after lumbar disk surgery:a voxel-based morphometry study. Pain Rep 2017;00:e617.
[19] Chelly JE. Pregabalin effective for the prevention of chronic postsurgicalpain: really? Anesth Analg 2013;116:507–8.
[20] Clarke H. Transitional pain medicine: novel pharmacological treatmentsfor themanagement ofmoderate to severe postsurgical pain. Expert RevClin Pharmacol 2016;9:345–9.
[21] Clarke H, Bonin RP, Orser BA, Englesakis M, Wijeysundera DN, Katz J.The prevention of chronic postsurgical pain using gabapentin andpregabalin: a combined systematic review and meta-analysis. AnesthAnalg 2012;115:428–42.
[22] Clarke H, Katz J, Flor H, Rietschel M, Diehl SR, Seltzer ZE. Genetics ofchronic post-surgical pain: a crucial step toward personal painmedicine. Can J Anaesth 2015;62:294–303.
[23] Clarke H, Poon M, Weinrib A, Katznelson R, Wentlandt K, Katz J.Preventive analgesia and novel strategies for the prevention of chronicpost-surgical pain. Drugs 2015;75:339–51.
[24] Cleeland C, Ryan KM. Pain assessment: global use of the Brief PainInventory. Ann Acad Med 1994;23:129–38.
[25] Cohen J. Statistical power analysis for the behavioural sciences. 2nd ed.Hillsdale: Lawrence Erlbaum Associates, 1998.
[26] Crombie IK, Davies HT, MacraeWA. Cut and thrust: antecedent surgeryand trauma among patients attending a chronic pain clinic. PAIN 1998;76:167–71.
[27] Cronbach LJ. Coefficient alpha and the internal structure of tests.Psychometrika 1951;16:297–334.
[28] Darnall BD. Pain psychology and pain catastrophizing in theperioperative setting a review of impacts, interventions, and unmetneeds. Hand Clin 2016;32:33–9.
[29] De KockM, Lavand’hommeP,Waterloos H. “Balanced analgesia” in theperioperative period: is there a place for ketamine? PAIN 2001;92:373–80.
[30] De Souza JB, Potvin S, Goffaux P, Charest J, Marchand S. The deficit ofpain inhibition in fibromyalgia is more pronounced in patients withcomorbid depressive symptoms. Clin J Pain 2009;25:123–7.
[31] Diatchenko L, Anderson AD, Slade GD, Fillingim RB, Shabalina SA,Higgins TJ, Sama S, Belfer I, Goldman D, MaxMB, Weir BS, Maixner W.Three major haplotypes of the beta2 adrenergic receptor definepsychological profile, blood pressure, and the risk for development ofa common musculoskeletal pain disorder. Am J Med Genet BNeuropsychiatr Genet 2006;141B:449–62.
[32] Diatchenko L, Slade GD, Nackley AG, Bhalang K, Sigurdsson A, Belfer I,Goldman D, Xu K, Shabalina SA, Max D, Makarov SS, Maixner W.Genetic basis for individual variations in pain perception and thedevelopment of a chronic pain condition. Hum Mol Genet 2005;14:135–43.
[33] Dworkin RH, McDermott MP, Raja SN. Preventing chronic postsurgicalpain: how much of a difference makes a difference? Anesthesiology2010;112:516–8.
[34] Edwards RR, Dworkin RH, Sullivan MD, Turk DC,Wasan AD. The role ofpsychosocial processes in the development and maintenance ofchronic pain. J Pain 2016;17:T70–92.
[35] Fletcher D, Stamer UM, Pogatzki-Zahn E, Zaslansky R, Tanase NV,Perruchoud C, Kranke P, Komann M, Lehman T; euCPSP Group for theClinical Trial Network Group of the European Society ofAnaesthesiology, Meissner W. Chronic postsurgical pain in Europe: anobservational study. Eur J Anaesthesiol 2015;32:725–34.
[36] Gatchel RJ, Okifuji A. Evidence-based scientific data documenting thetreatment and cost-effectiveness of comprehensive pain programs forchronic nonmalignant pain. J Pain 2006;7:779–93.
[37] Gatchel RJ, Peng YB, Peters ML, Fuchs PN, Turk DC. Thebiopsychosocial approach to chronic pain: scientific advances andfuture directions. Psychol Bull 2007;133:581–624.
[38] Gilron I, Kehlet H. Prevention of chronic pain after surgery: new insightsfor future research and patient care. Can J Anaesth 2014;61:101–11.
[39] Goodin BR, McGuire L, Allshouse M, Stapleton L, Haythornthwaite JA,Burns N, Mayes LA, Edwards RR. Associations betweencatastrophizing and endogenous pain-inhibitory processes: sexdifferences. J Pain 2009;10:180–90.
[40] Hetmann F, Kongsgaard UE, Sandvik L, Schou-Bredal I. Prevalence andpredictors of persistent post-surgical pain 12months after thoracotomy.Acta Anaesthesiol Scand 2015;59:740–48.
[41] Hinrichs-Rocker A, Schulz K, Jarvinen I, Lefering R, Simanski C,Neugebauer EA. Psychosocial predictors and correlates for chronicpost-surgical pain (CPSP)—a systematic review. Eur J Pain 2009;13:719–30.
[42] Huang A, Katz J, Clarke H. Ensuring safe prescribing of controlledsubstances for pain following surgery by developing a transitional painservice. Pain Manag 2015;5:97–105.
[43] Humble SR, Dalton AJ, Li L. A systematic review of therapeuticinterventions to reduce acute and chronic post-surgical pain afteramputation, thoracotomy or mastectomy. Eur J Pain 2015;19:451–65.
[44] Jackson T, Tian P, Wang Y, Lezzi T, Xie W. Towards identifyingmoderators of associations between pre-surgery emotional distress andpost-operative pain outcomes: a meta-analysis of longitudinal studies.J Pain 2016;17:874–88.
[45] Jensen MP. A neuropsychological model of pain: research and clinicalimplications. J Pain 2010;11:2–12.
[46] Jensen MP, Turk DC. Contributions of psychology to the understandingand treatment of people with chronic pain: why it matters to ALLpsychologists. Am Psychol 2014;69:105–18.
[47] Kalso E. IV. Persistent post-surgery pain: research agenda formechanisms, prevention, and treatment. Br J Anaesth 2013;111:9–12.
[48] Katz J, Seltzer Z. Transition from acute to chronic postsurgical pain: riskfactors and protective factors. Expert Rev Neurother 2009;9:723–44.
[49] Katz J, Weinrib A, Fashler SR, Katznelzon R, Shah BR, Ladak SS, JiangJiao, Li Q, McMillan K, Mina DS, Wentlandt K, McRae K, Tamir D, Lyn S,de Perrot M, Rao V, Grant D, Roche-Nagle G, Cleary S, Hofer S, GilbertR, Wijeysundera D, Ritvo P, Janmohamed T, O’Leary G, Clarke H. TheToronto General Hospital Transitional Pain Service: development andimplementation of a multidisciplinary program to prevent chronicpostsurgical pain. J Pain Res 2015;8:1–8.
[50] Khan RS, Ahmed K, Blakewayet E, Skapinakis P, Nihoyannopoulos L,Macleod K, Sevdalis N, Ashrafian H, Platt M, Darzi A, Athanasiou T.Catastrophizing: a predictive factor for postoperative pain. Am J Surg2011;201:122–31.
[51] Kehlet H, Jensen TS, Woolf C. Persistent postsurgical pain: risk factorsand prevention. Lancet 2006;367:1618–25.
[52] Kehlet H, Rathmell JP. Persistent postsurgical pain: the path forwardthrough better design of clinical studies. Anesthesiology 2010;112:514–5.
[53] Klatt E, Zumbrunn T, Bandschapp O, Girard T, Ruppen W. Intra- andpostoperative intravenous ketamine does not prevent chronic pain:a systematic review and meta-analysis. Scand J Pain 2015;7:42–54.
[54] Lackner JM, Lou CM,Mertz HR,Wack DS, Katz LA, Krasner SS, Firth R,Mahl TC, Lockwood AH. Cognitive therapy for irritable bowel syndromeis associated with reduced limbic activity, GI symptoms, and anxiety.Behav Res Ther 2006;44:621–38.
[55] Lavand’homme P. Transition from acute to chronic pain after surgery.PAIN 2017;158:S50–4.
[56] Lewis GN, Rice DA, McNair PJ, Kluger M. Predictors of persistent painafter total knee arthroplasty: a systematic review andmeta-analysis. Br JAnaesth 2015;114:551–61.
[57] Llewellyn CD, McGurk M, Weinman K. Illness and treatment beliefs inhead and neck cancer: is Leventhal’s common sense model a usefulframework for determining changes in outcomes over time?J Psychosom Res 2007;63:17–26.
[58] Lunn TH, Gaarn-Larsen L, Kehlet H. Prediction of postoperative pain bypreoperative pain response to heat stimulation in total knee arthroplasty.PAIN 2013;154:1878–85.
[59] Macrae WA. Chronic postsurgical pain: 10 years on. Br J Anaesth 2008;101:77–86.
[60] Martinez V, Pichard X, Fletcher D. Perioperative pregabalinadministration does not prevent chronic postoperative pain:systematic review with a meta-analysis of randomized trials. PAIN2017;158:775–83.
[61] Masselin-Dubois A, Attal N, Fletcher D, Jayr C, Albi A, Fermanian J,Bouhassira D, Baudic S. Are psychological predictors of chronicpostsurgical pain dependent on the surgical model? A comparison oftotal knee arthroplasty and breast surgery for cancer. J Pain 2013;14:854–64.
[62] McGreevy K, Bottros MM, Srinivasa NR. Preventing chronic painfollowing acute pain: risk factors, preventive strategies, and theirefficacy. Eur J Pain Suppl 2011;5:365–76.
[63] McNicol ED, Schumann R, Haroutounian S. A systematic review andmeta-analysis of ketamine for the prevention of persistent post-surgicalpain. Acta Anaesthesiol Scand 2014;58:1199–213.
[64] Melzack R. From the gate to the neuromatrix. PAIN 1999;6(suppl):S121–26.
[65] Melzack R. Pain—an overview. Acta Anaesthesiol Scand 1999;43:880–4.
[66] Melzack R. TheMcGill Pain Questionnaire: major properties and scoringmethods. PAIN 1975;1:277–99.
[67] Montes A, Roca G, Sabate S, Lao JI, Navarro A, Cantillo J, Canet J.Genetic and clinical factors associated with chronic postsurgical pain
966 P.R. Pinto et al.·159 (2018) 956–967 PAIN®
Copyright � 2018 by the International Association for the Study of Pain. Unauthorized reproduction of this article is prohibited.37

after hernia repair, hysterectomy, and thoracotomy: a two-yearmulticenter cohort study. Anesthesiology 2015;122:1123–41.
[68] Moss-Morris R, Weinman J, Petrie KJ, Horne R, Cameron LD, Buick D.The Revised Illness Perception Questionnaire (IPQ-R). Psychol Health2002;17:1–16.
[69] Nikolajsen L. Perioperative interventions for the reduction of chronicpostsurgical pain. PAIN 2017;158:769–70.
[70] Nissenbaum J, Devor M, Seltzer ZE, Gebauer M, Michaelis M, Tal M,Dorfman R, Abitbul-Yarkoni M, Lu Y, Elahipanah T, delCanho S, MinertA, Fried K, Persson AK, Shpigler H, Shabo E, Yakir B, Pisante A, DarvasiA. Susceptibility to chronic pain following nerve injury is geneticallyaffected by CACNG2. Genome Res 2010;20:1180–90.
[71] Oertel B, Lotsch J. Genetic mutations that prevent pain: implications forfuture pain medication. Pharmacogenomics 2008;9:179–94.
[72] Ossipov MH, Dussor GO, Porreca F. Central modulation of pain. J ClinInvest 2010;120:3779–87.
[73] Perkins FM, Kehlet H. Chronic pain as an outcome of surgery. A reviewof predictive factors. Anesthesiology 2000;93:1123–33.
[74] Pesonen A, Suojaranta-Ylinen R, Hammaren E, Kontinen VK, Raivio P,Tarkkila P, Rosenberg PH. Pregabalin has an opioid sparing effect inelderly patients after cardiac surgery: a randomized placebo-controlledtrial. Br J Anaesth 2011;106:873–81.
[75] Pinto PR, McIntyre T, Almeida A, Araujo-Soares V. The mediating role ofpain catastrophizing in the relationship between presurgical anxiety andacute postsurgical pain after hysterectomy. PAIN 2012;153:218–26.
[76] Pinto PR, McIntyre T, Araujo-Soares V, Costa P, Almeida A. Differentialpredictors of acutepost-surgical pain intensity after abdominal hysterectomyand major joint arthroplasty. Ann Behav Med 2015;49:384–97.
[77] Pinto PR, McIntyre T, Ferrero R, Almeida A, Araujo-Soares V. Riskfactors for moderate and severe persistent pain in patients undergoingtotal knee and hip arthroplasty: a prospective predictive study. PLoSOne 2013;8:e73917.
[78] Pinto PR, McIntyre T, Fonseca C, Almeida A, Araujo-Soares V. Pre- andpost-surgical factors that predict the provision of rescue analgesiafollowing hysterectomy. Eur J Pain 2013;17:423–33.
[79] Pinto PR, McIntyre T, Nogueira-Silva C, Almeida A, Araujo-Soares V.Risk factors for persistent postsurgical pain in women undergoinghysterectomy due to benign causes: a prospective predictive study.J Pain 2012;13:1045–57.
[80] Pokkinen SM, Nieminen K, Yli-Hankala A, Kalliomaki ML. Persistentposthysterectomy pain: a prospective, observational study. Eur JAnaesth 2015;32:718–24.
[81] Porreca F, Ossipov MH, Gebhart GF. Chronic pain and medullarydescending facilitation. Trends Neurosci 2002;25:319–25.
[82] Powell R, Johnston M, Smith WC, King PM, Chambers WA, KrukowskiZ, McKee L, Bruce J. Psychological risk factors for chronic post-surgicalpain after inguinal hernia repair surgery: a prospective cohort study. EurJ Pain 2012;16:600–10.
[83] Quartana PJ, Campbell CM, Edwards RR. Pain catastrophizing:a critical review. Expert Rev Neurother 2009;9:745–58.
[84] Rea LM, Parker RA. Designing and conducting survey research. SanFrancisco: Jossey–Bass, 1992.
[85] Recker DC, Perry PM. Postsurgical pain syndromes: chronic pain afterhysterectomy and cesarean section. Tech Reg Anesth Pain Manag2011;15:133–9.
[86] Richebe P, Julien M, Brulotte V. Potential strategies for preventingchronic postoperative pain: a practical approach: continuingprofessional development. Can J Anesth 2015;62:1329–41.
[87] Riley JL, Robinson ME. CSQ: five factors or fiction? Clin J Pain 1997;13:156–62.
[88] Rhudy JL, Williams AE, McCabe K, Nguyen MA, Rambo P. Affectivemodulation of nociception at spinal and supraspinal levels.Psychophysiology 2005;42:579–87.
[89] Rhudy JL, Williams AE, McCabe KM, Rambo PL, Russell JL. Emotionalmodulation of spinal nociception and pain: the impact of predictablenoxious stimulation. PAIN 2006;126:221–33.
[90] Rhudy JL,Williams AE, McCabe KM, Russell JL, Maynard LJ. Emotionalcontrol of nociceptive reactions (ECON): do affective valence andarousal play a role? PAIN 2008;136:250–61.
[91] Scharloo M, de Jong RJ, Langeveld TP, Velzen-Verkaik E, Akker MM,Kaptein AA. Quality of life and illness perceptions in patients with recentlydiagnosed head and neck cancer. Head Neck 2005;27:857–63.
[92] Scheier MF, Carver CS, Bridges MW. Distinguishing optimism fromneuroticism (and trait anxiety, self-mastery, and self-esteem):a reevaluation of the Life Orientation Test. J Pers Soc Psychol 1994;67:1063–78.
[93] Schug SA, Pogatzki-Zahn EM. Chronic pain after surgery or injury. PAIN2011;19:1–5.
[94] Seminowicz DA, Davis KD. Cortical responses to pain in healthyindividuals depends on pain catastrophizing. PAIN 2006;120:297–306.
[95] Seminowicz DA, Shpaner M, Keaser ML, Krauthamer GM, Mantegna J,Dumas JA, Newhouse PA, Filippi CG, Keefe FJ, Naylor MR. Cognitive-behavioral therapy increases prefrontal cortex gray matter in patientswith chronic pain. J Pain 2013;14:1573–84.
[96] Sen H, Sizlan A, Yanarates O, Emirkadi H, Ozkan S, Dagli G, Turan A. Acomparison of gabapentin and ketamine in acute and chronic pain afterhysterectomy. Anesth Analg 2009;109:1645–50.
[97] Sørensen J, Kjeldsen J, Kugathasan P, Lunde S, Andersen E, Skov M,Arendt-Nielsen L. The risk of developing postoperative chronic pain afterabdominal and robot-assisted laparoscopic hysterectomy: a cross-sectional study. J Gynecol Surg 2015;31:198–204.
[98] Thakar R, Ayers S, Clarkson P, Stanton S, Manyonda I. Outcomes aftertotal versus subtotal abdominal hysterectomy. N Engl J Med 2002;347:1318–25.
[99] Theunissen M, Peters ML, Bruce J, Gramke HF, Marcus MA.Preoperative anxiety and catastrophizing: a systematic review andmeta-analysis of the association with chronic postsurgical pain. Clin JPain 2012;28:819–41.
[100] Theunissen M, Peters ML, Schepers J, Maas JW, Tournois F, vanSuijlekom HA, Gramke HF, Marcus MA. Recovery 3 and 12 monthsafter hysterectomy. epidemiology and predictors of chronic pain,physical functioning, and global surgical recovery. Medicine 2016;95:e3980.
[101] TheunissenM, Peters ML, Schouten EG, Fiddelers AA,WillemsenMGA,Pinto PR, Gramke HF, Marcus MA. Validation of the Surgical FearQuestionnaire in adult patients waiting for elective surgery. PLoS One2014;9:e100225.
[102] Treede RD, Rief W, Barke A, Aziz Q, Bennett MI, Benoliel R, Cohen M,Evers S, Finnerup NB, First MB, Giamberardino MA, Kaasa S, Kosec E,Lavand’homme P, Nicholas M, Perrot S, Scholz J, Schug S, Smith BH,Svensson P, Vlaeyen J, Wang S. A classification of chronic pain for ICD-11. PAIN 2015;156:1003–7.
[103] VanDenKerkhof EG, Hopman WM, Goldstein DH, Wilson RA, TowheedTE, Lam M, Harrison MB, Reitsma ML, Johnston SL, James D, Gilron I.Impact of perioperative pain intensity, pain qualities, and opioid use onchronic pain after surgery: a prospective cohort study. Reg Anesth PainMed 2012;37:19–27.
[104] VanDenKerkhof EG, Peters ML, Bruce J. Chronic pain after surgery:time for standardization? A framework to establish core risk factor andoutcome domains for epidemiological studies. Clin J Pain 2013;29:2–8.
[105] van Wijk G, Veldhuijzen DS. Perspective on diffuse noxious inhibitorycontrols as a model of endogenous pain modulation in clinical painsyndromes. J Pain 2010;11:408–19.
[106] Wilder-Smith CH, Schindler D, Lovblad K, Redmond SM, Nirkko A.Brain functional magnetic resonance imaging of rectal pain andactivation of endogenous inhibitory mechanisms in irritable bowelsyndrome patient subgroups and healthy controls. Gut 2004;53:1595–601.
[107] Wildgaard K, Ringsted TK, Hansen HJ, Petersen RH, Werner MU,Kehlet H. Quantitative sensory testing of persistent pain after video-assisted thoracic surgery lobectomy. Br J Anaesth 2012;108:126–33.
[108] Wylde V, Hewlett S, Learmonth ID, Dieppe P. Persistent pain after jointreplacement: prevalence, sensory qualities, and postoperativedeterminants. PAIN 2011;152:566–72.
[109] Zhuo M. Descending facilitation: from basic science to the treatment ofchronic pain. Mol Pain 2017;13:1–12.
[110] Zigmond AS, Snaith RP. The Hospital Anxiety and Depression Scale.Acta Psychiatrica Scand 1983;67:361–70.
May 2018·Volume 159·Number 5 www.painjournalonline.com 967
Copyright � 2018 by the International Association for the Study of Pain. Unauthorized reproduction of this article is prohibited.38

Research Paper
Use of prescription opioids before and after anoperation for chronic pain (lumbar fusion surgery)Richard A. Deyoa,b,*, Sara E. Hallvikc, Christi Hildebranc, Miguel Marinoa,d, Nicole O’Kanec, Jody Carsonc,Joshua Van Otterlooe, Dagan A. Wrighte, Lisa M. Millete, Wayne Wakelandf
AbstractLumbar fusion surgery is usually prompted by chronic back pain, and many patients receive long-term preoperative opioidanalgesics. Many expect surgery to eliminate the need for opioids. We sought to determine what fraction of long-term preoperativeopioid users discontinue or reduce dosage postoperatively; what fraction of patients with little preoperative use initiate long-termuse; andwhat predicts long-term postoperative use. This retrospective cohort study included 2491 adults undergoing lumbar fusionsurgery for degenerative conditions, using Oregon’s prescription drug monitoring program to quantify opioid use before and afterhospitalization.We defined long-term postoperative use as$4 prescriptions filled in the 7months after hospitalization, with at least 3occurring .30 days after hospitalization. Overall, 1045 patients received long-term opioids preoperatively, and 1094postoperatively. Among long-term preoperative users, 77.1% continued long-term postoperative use, and 13.8% had episodicuse. Only 9.1% discontinued or had short-term postoperative use. Among preoperative users, 34.4% received a lower dosepostoperatively, but 44.8% received a higher long-term dose. Among patients with no preoperative opioids, 12.8% became long-term users. In multivariablemodels, the strongest predictor of long-term postoperative usewas cumulative preoperative opioid dose(odds ratio of 15.47 [95% confidence interval 8.53-28.06] in the highest quartile). Cumulative dose and number of opioid prescribersin the 30-day postoperative period were also associated with long-term use. Thus, lumbar fusion surgery infrequently eliminatedlong-term opioid use. Opioid-naive patients had a substantial risk of initiating long-term use. Patients should have realisticexpectations regarding opioid use after lumbar fusion surgery.
Keywords: Opioids, Spine surgery, Spinal fusion, Chronic pain
1. Introduction
Increased use of prescription opioids over the past 2 decades hasbeen associated with major increases in opioid-related over-doses and addiction treatment.28,30 One response has beencloser examination of factors leading to opioid initiation, includinganalgesic prescriptions after surgical procedures.1,7,31
Many studies of postoperative opioid prescribing haveincluded surgical procedures not primarily performed for chronicpain symptoms, such as cataract surgery, transurethral prostateresection, cesarean section, or thyroidectomy.1,7,31 Surgicalprocedures for patients with chronic painful conditions, such as
many orthopedic procedures, pose additional challenges be-cause many patients receive long-term opioids before surgery.
Spine surgery, in particular, may be associated with a high riskof preoperative and persistent postoperative opioid use.7,23
Lumbar fusion surgery for degenerative spinal disorders is usuallyundertaken to treat chronic back pain, and is more invasive thandecompression surgery alone. Nationally, the number of spinalfusion operations has tripled in the past 2 decades.17
Patients considering fusion surgery often expect to discontinueopioids after surgery. For example, among patients scheduled toundergo lumbar fusion surgery for degenerative disc disease,over 90% “considered continued narcotic requirements to beneither an expected nor acceptable outcome.”8 However, recentstudies find that 30% to 60%of patients receive long-term opioidsafter spine surgery.4,12,24 Preoperative opioid use is consistentlya major predictor of long-term postoperative use.2,4,12
However, data on long-term opioid use after spine or otherorthopedic surgery are often limited by reliance on patient self-report,4 continual insurance enrollment,12,24 or relatively smallpatient samples.4,26 For spinal fusion surgery, few data addresshow preoperative dosagemay influence the likelihood of long-termpostoperative opioid use or the ability to reduce dosage, whatfraction of those with no preoperative opioid use initiate long-termuse postoperatively, or how perioperative opioid managementinfluences the likelihood of long-term postoperative use.
We used a state hospital discharge registry linked withstatewide prescription drug monitoring program (PDMP) data toidentify lumbar fusion operations and opioid prescription fills,regardless of insurance coverage or source of prescriptions. We
Sponsorships or competing interests that may be relevant to content are disclosed
at the end of this article.
a Department of Family Medicine, Oregon Health and Science University, Portland,
OR, USA, b Department of Medicine, The Oregon Institute for Occupational Health
Sciences, Oregon Health and Science University, Portland, OR, USA, c HealthIn-
sight Oregon, Portland, OR, USA, d Biostatistics Group, OHSU-PSU School of
Public Health, Oregon Health and Science University, Portland, OR, USA, e Injury
and Violence Prevention Program for the State of Oregon, Oregon Health Authority,
Portland, OR, USA, f Systems Science Program, Portland State University,
Portland, OR, USA
*Corresponding author. Address: Department of Family Medicine, Oregon
Health and Science University, 3181 SW. Sam Jackson Park Rd, Mail code FM,
Portland, OR 97239, USA. Tel.: 503-494-1694; fax: 503-494-2746. E-mail address:
[email protected] (R.A. Deyo).
PAIN 159 (2018) 1147–1154
© 2018 International Association for the Study of Pain
http://dx.doi.org/10.1097/j.pain.0000000000001202
June 2018·Volume 159·Number 6 www.painjournalonline.com 1147
Copyright � 2018 by the International Association for the Study of Pain. Unauthorized reproduction of this article is prohibited.39
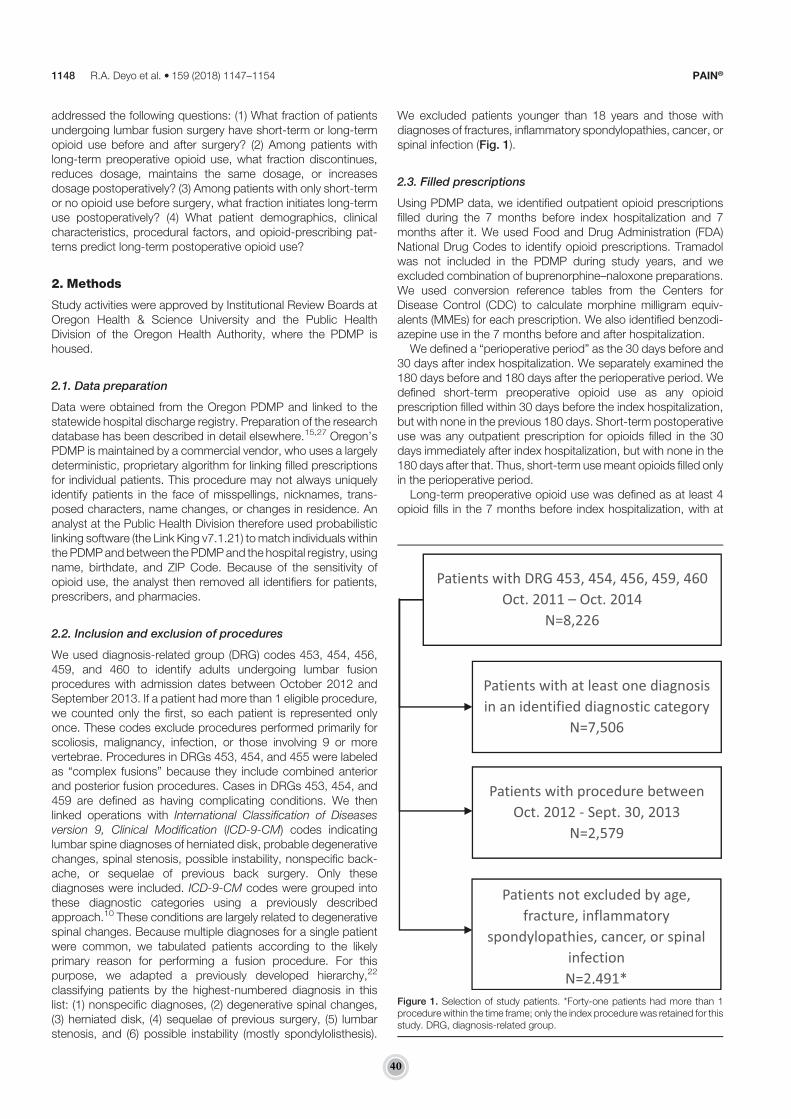
addressed the following questions: (1) What fraction of patientsundergoing lumbar fusion surgery have short-term or long-termopioid use before and after surgery? (2) Among patients withlong-term preoperative opioid use, what fraction discontinues,reduces dosage, maintains the same dosage, or increasesdosage postoperatively? (3) Among patients with only short-termor no opioid use before surgery, what fraction initiates long-termuse postoperatively? (4) What patient demographics, clinicalcharacteristics, procedural factors, and opioid-prescribing pat-terns predict long-term postoperative opioid use?
2. Methods
Study activities were approved by Institutional Review Boards atOregon Health & Science University and the Public HealthDivision of the Oregon Health Authority, where the PDMP ishoused.
2.1. Data preparation
Data were obtained from the Oregon PDMP and linked to thestatewide hospital discharge registry. Preparation of the researchdatabase has been described in detail elsewhere.15,27 Oregon’sPDMP is maintained by a commercial vendor, who uses a largelydeterministic, proprietary algorithm for linking filled prescriptionsfor individual patients. This procedure may not always uniquelyidentify patients in the face of misspellings, nicknames, trans-posed characters, name changes, or changes in residence. Ananalyst at the Public Health Division therefore used probabilisticlinking software (the Link King v7.1.21) tomatch individuals withinthe PDMPand between the PDMPand the hospital registry, usingname, birthdate, and ZIP Code. Because of the sensitivity ofopioid use, the analyst then removed all identifiers for patients,prescribers, and pharmacies.
2.2. Inclusion and exclusion of procedures
We used diagnosis-related group (DRG) codes 453, 454, 456,459, and 460 to identify adults undergoing lumbar fusionprocedures with admission dates between October 2012 andSeptember 2013. If a patient had more than 1 eligible procedure,we counted only the first, so each patient is represented onlyonce. These codes exclude procedures performed primarily forscoliosis, malignancy, infection, or those involving 9 or morevertebrae. Procedures in DRGs 453, 454, and 455 were labeledas “complex fusions” because they include combined anteriorand posterior fusion procedures. Cases in DRGs 453, 454, and459 are defined as having complicating conditions. We thenlinked operations with International Classification of Diseasesversion 9, Clinical Modification (ICD-9-CM) codes indicatinglumbar spine diagnoses of herniated disk, probable degenerativechanges, spinal stenosis, possible instability, nonspecific back-ache, or sequelae of previous back surgery. Only thesediagnoses were included. ICD-9-CM codes were grouped intothese diagnostic categories using a previously describedapproach.10 These conditions are largely related to degenerativespinal changes. Because multiple diagnoses for a single patientwere common, we tabulated patients according to the likelyprimary reason for performing a fusion procedure. For thispurpose, we adapted a previously developed hierarchy,22
classifying patients by the highest-numbered diagnosis in thislist: (1) nonspecific diagnoses, (2) degenerative spinal changes,(3) herniated disk, (4) sequelae of previous surgery, (5) lumbarstenosis, and (6) possible instability (mostly spondylolisthesis).
We excluded patients younger than 18 years and those withdiagnoses of fractures, inflammatory spondylopathies, cancer, orspinal infection (Fig. 1).
2.3. Filled prescriptions
Using PDMP data, we identified outpatient opioid prescriptionsfilled during the 7 months before index hospitalization and 7months after it. We used Food and Drug Administration (FDA)National Drug Codes to identify opioid prescriptions. Tramadolwas not included in the PDMP during study years, and weexcluded combination of buprenorphine–naloxone preparations.We used conversion reference tables from the Centers forDisease Control (CDC) to calculate morphine milligram equiv-alents (MMEs) for each prescription. We also identified benzodi-azepine use in the 7 months before and after hospitalization.
We defined a “perioperative period” as the 30 days before and30 days after index hospitalization. We separately examined the180 days before and 180 days after the perioperative period. Wedefined short-term preoperative opioid use as any opioidprescription filled within 30 days before the index hospitalization,but with none in the previous 180 days. Short-term postoperativeuse was any outpatient prescription for opioids filled in the 30days immediately after index hospitalization, but with none in the180 days after that. Thus, short-term usemeant opioids filled onlyin the perioperative period.
Long-term preoperative opioid use was defined as at least 4opioid fills in the 7 months before index hospitalization, with at
Figure 1. Selection of study patients. *Forty-one patients had more than 1procedure within the time frame; only the index procedure was retained for thisstudy. DRG, diagnosis-related group.
1148 R.A. Deyo et al.·159 (2018) 1147–1154 PAIN®
Copyright � 2018 by the International Association for the Study of Pain. Unauthorized reproduction of this article is prohibited.40

least 3 fills in the 180 days before the perioperative period. Long-term postoperative use was at least 4 opioid fills in the 7 monthsafter index hospitalization, with at least 3 of those more than 30days after hospitalization. These definitions of long-term usewereconsistent with a definition of 6 fills in 12 months which has beenused in previous studies, and which was associated with a 7-foldincrease (vs those with fewer fills) in hospitalizations with opioid-related adverse events.15,25
Some patients who received opioids would not fit ourdefinitions of short-term or long-term use. For example, a patientwith 2 prescriptions before the perioperative period, or one whohad a single prescription in the preoperative 30 days and a singleprescription before that, would meet neither definition. Welabeled such patients as having “episodic” opioid use. Our dataincluded only outpatient prescription fills. Opioids used duringinpatient care, or provided from the hospital at discharge, werenot identified in our data.
The “long-term preoperative cumulative dose” was defined asthe sum of all MMEs prescribed in the 180 days before theperioperative period. The “long-term postoperative cumulativedose” was defined as the sum of all MMEs filled in the 180 daysafter the perioperative interval. These definitions of cumulativedose excluded medications during the perioperative period,when greater analgesic doses are usually necessary andexpected. A cumulative dose exceeding 16,200 MMEs in 180days (an average of$90 MMEs/d) was defined as “high dose.”16
A change from preoperative cumulative dose to postoperativecumulative dose of $10% was considered an increase ora decrease. A change of ,10% was considered a stable dose.Changes in opioid doses were based on cumulative MMEs filledduring the 180 days before and the 180 days after theperioperative interval. All definitions were established before dataanalysis.
2.4. Comorbid conditions
We calculated the ICD-9-CM version of the Charlson comorbidityindex14 using diagnoses recorded in the index hospital dischargerecord.
2.5. Analysis
Characteristics of patients who did or did not become long-termpostoperative opioid users were compared with x2 statistics,rank-sum tests, or t tests as appropriate. Independent predictorsof long-term postoperative opioid use were identified usingmultivariable logistic regression. Candidate predictors includedpatient demographic characteristics, comorbidity score, surgicalprocedure characteristics, and features of preoperative andperioperative opioid prescribing. The final regression modelincluded all these variables, so predictors of long-term use wereadjusted for possible confounding by each of these features. Toassess the impact of opioid dose on predicting long-term use, wefirst constructed a logistic model without dosing information, butwith an indicator for whether the patient received long-termpreoperative opioids. We then constructed a second logisticmodel incorporating preoperative and perioperative opioid doseinformation. The distribution of opioid doses was right skewed.Rather than identifying and removing outliers to use dose asa continuous variable, we decided to keep all patients in the studyand categorize cumulative opioid doses into quartiles. Thismitigates any effect of patients with very high doses and allowsthe relationship to vary arbitrarily in the logit (ie, does not assumelinearity in the logit). Dividing into quartiles also helped to facilitate
clinical understanding of the results, as opposed to determiningodds ratios (ORs) for every milligram increase in dose. Regardingsurgical indications, we combined the least specific diagnoses(nonspecific, miscellaneous, and degenerative changes) asa reference category, because of small numbers in the non-specific category. Statistical tests were 2 sided and significancewas defined as P , 0.05; analyses were performed using SASv.9.3. Model fit was assessed with the Hosmer–Lemeshowstatistic and the area under a receiver-operating characteristiccurve (AUC) distinguishing those who exhibited long-term post-operative opioid use from those who did not.
We also conducted a sensitivity analysis using an alternativedefinition of long-term opioid use: at least 3 opioid fills in the 7months before index hospitalization, with at least 2 fills in the 180days before the perioperative period. Long-term postoperativeuse was at least 3 opioid fills in the 7 months after indexhospitalization, with at least 2 of those more than 30 days afterhospitalization. The results of this sensitivity analysis werequalitatively the same as our base case analysis and are notpresented here.
3. Results
3.1. Patients and procedures
There were 2491 patients who underwent an eligible fusionoperation and all were included. Over half (59.7%) were female,45.8% were aged 65 years or older, and only 12.6% wereyounger than 45 years. Reflecting the Oregon population, 93.5%were white (Table 1).
Most surgical procedures (n5 2113; 84.8%) were classified inDRG 460: “fusion without major complicating conditions.” Next,most frequent (n 5 207; 8.3%) was “combined anterior andposterior fusion without complicating conditions.” Overall, 6.9%of procedures were coded with complications (DRGs 453, 454,and 459). Combined anterior and posterior procedures (with orwithout complications) accounted for 12.9% (n 5 320).
The most common primary reason for surgery was “possibleinstability” (n5 1479, 59.4%) which wasmainly spondylolisthesis(n 5 1421, or 96.1% of the category). Degenerative spinalchanges accounted for 12.0% (n5 299). Spinal stenosis primarilyaccounted for 298 procedures (12.0%) and herniated disk for 256cases (10.3%). There were 133 cases (5.3%) with diagnosiscodes indicating sequelae of previous back surgery, and theremainder (1.0%) fell intomiscellaneous or nonspecific diagnosticcategories (Table 1).
3.2. Opioid use
More patients received long-term opioids after spinal fusionsurgery than before. Overall, 1045 patients received preoperativelong-term opioids, and 1094 received long-term postoperativeopioids. Among patients receiving long-term preoperativeopioids, 806 (77.1%) continued long-term postoperative use,and 144 (13.8%) had episodic postoperative use. Only 95 (9.1%)discontinued opioids or had short-term postoperative use only(Table 2). Among those with long-term postoperative use were352 receiving high-dose opioids (32.2%) (Table 1).
There were 609 (24.5%) patients with episodic preoperativeopioid use, and 133 patients (5.3%) with short-term preoperativeopioid use. Another 704 (28.3%) had no opioid use in the 7months before hospitalization. Among patients with no pre-operative opioid use, 90 (12.8%) received long-term postoper-ative opioids (Table 2).
June 2018·Volume 159·Number 6 www.painjournalonline.com 1149
Copyright � 2018 by the International Association for the Study of Pain. Unauthorized reproduction of this article is prohibited.41

3.3. Opioid dosage
Among the 1045 patients with long-term preoperative opioid use,34.4% received a lower comparative dose postoperatively, and9.1% discontinued opioids after the perioperative period.However, 44.8% received a higher dose postoperatively, and11.8% received an equivalent dose. Among patients withepisodic preoperative opioid use, 13.0% decreased dosagespostoperatively, and 41.4% received no opioids beyond theperioperative interval. However, 41.7% increased cumulativedoses after the perioperative interval (Table 3).
3.4. Predictors of long-term postoperative opioid use
In simple bivariate comparisons between thosewho did or did notreceive long-term postoperative opioids, younger age, urbanresidence, indication for surgery, complex fusion procedures,preoperative benzodiazepine use, and all opioid-prescribingvariables were significantly associated with greater long-termpostoperative use (Table 1). Long-term postoperative opioidusers had higher comorbidity scores (0.62 vs 0.53, P 5 0.009).
In regression models, 21 patients with missing age data wereexcluded. In our first logistic regression model, excluding opioid
Table 1
Demographic, clinical, and prescription features of full patient sample and patients with or without long-term postoperative
opioid use (percents are column percents).
Full sample(n 5 2491)
No long-term postoperative opioid use(n 5 1397)
Long-term postoperative opioid use(n 5 1094)
P*
Sex, female, n (%) 1486 (59.7) 833 (59.6) 653 (59.7) 0.98
Age category, n (%)†
18-44 310 (12.6) 133 (9.7) 177 (16.2)
45-54 412 (16.7) 169 (12.3) 243 (22.2)
55-64 616 (24.9) 309 (22.5) 307 (28.1) ,0.001
65-74 763 (30.9) 502 (36.5) 261 (23.9)
751 369 (14.9) 263 (19.1) 106 (9.7)
Race, n (%)
American Indian or Alaska Native 29 (1.2) 13 (0.9) 16 (1.5)
Asian 36 (1.5) 25 (1.8) 11 (1.0)
African American 22 (0.9) 7 (0.5) 15 (1.4) 0.06
Native Hawaiian or Pacific Islander 3 (0.1) 1 (0.07) 2 (0.2)
White 2328 (93.5) 1313 (94.0) 1015 (92.8)
Ethnicity, n (%)†
Hispanic or Latino 70 (2.8) 40 (2.9) 30 (2.7) 0.3
Not Hispanic 2378 (95.5) 1338 (95.8) 1040 (95.1)
Residence, n (%)†
Rural 1017 (41.2) 579 (42.1) 438 (40.0) ,0.001
Urban 1316 (53.3) 684 (49.7) 632 (57.8)
Indication for surgery (diagnosis), n (%)
Nonspecific backache, miscellaneous 26 (1.0) 12 (0.9) 14 (1.3) ,0.0001
Probable degenerative changes 299 (12.0) 151 (10.8) 148 (13.5)
Herniated disk 256 (10.3) 119 (8.5) 137 (12.5)
Sequelae of previous back surgery 133 (5.3) 53 (3.8) 80 (7.3)
Spinal stenosis 298 (12.0) 176 (12.6) 122 (11.2)
Possible instability 1479 (59.4) 886 (62.4) 593 (54.2)
Comorbidity
Comorbidity score, mean (SD) 0.57 (0.86) 0.53 (0.82) 0.62 (0.90) 0.009
Surgery features
Complex fusion procedure‡, n (%) 320 (12.9) 159 (11.4) 161 (14.7) 0.01
Procedure with complications§, n (%) 171 (6.9) 90 (6.4) 81 (7.4) 0.4
Opioid-prescribing features
Long-term prehospital opioids, n (%) 1045 (58.5) 239 (30.5) 806 (80.3) ,0.001
Total prehospital MMEs (7 mo), median (IQR)
(median MME/d)
950 (4950) (4.5/d) 200 (1020) (0.95/d) 5175 (13,140) (25/d) ,0.001
MME in 30 d posthospital, median (IQR)
(median MME/d)
1600 (2413) (53/d) 960 (975) (32/d) 3000 (3950) (100/d) ,0.001
Preoperative benzodiazepine, n (%) 743 (29.8) 303 (21.7) 440 (40.2) ,0.001
Opioid prescribers in 30 d postoperative,
median (IQR)
2.00 (2.00) 1.00 (1.00) 3.00 (2.00) ,0.001
High-dose opioids (cumulative MME
$16,200) in 7 mo after surgery, n (%)
355 (14.3) 3 (0.26) 352 (32.2) ,0.001
* Comparing patients with or without long-term postoperative opioid use; t test or x2.
† Twenty-one missing age category; 73 unknown or other race; 43 unknown ethnicity; 158 residence unknown or outside Oregon.
‡ Combined anterior and posterior fusion, DRGs 453, 454, and 455.
§ DRGs 453,454, and 459.
DRG, diagnosis-related group; IQR, interquartile range; MME, morphine milligram equivalent.
1150 R.A. Deyo et al.·159 (2018) 1147–1154 PAIN®
Copyright � 2018 by the International Association for the Study of Pain. Unauthorized reproduction of this article is prohibited.42

dose variables, long-term preoperative opioid use was thestrongest predictor of long-term postoperative use, with an ORof 10.8 (95% confidence interval [CI] 8.2-13.2) (Table 4). Anypreoperative use of benzodiazepines was also significant (OR1.49; 95% CI 1.20-1.85). Patient sex and urban residence werenot statistically significant. Increasing age was monotonicallyassociated with lower risk of long-term opioid use, and increasingCharlson comorbidity score was monotonically associated withincreasing risk. Complex fusion procedures were no longerassociated with long-term opioid use after adjustment for otherfactors. The AUC was 0.82.
In our second regression model, incorporating opioid doseinformation, patient demographics, urban or rural residence, andsurgical indication were not independently associated with long-term postoperative opioid use (Table 5). Preoperative long-termopioid use remained a significant independent predictor of long-term postoperative use (OR 1.68, 95% CI 1.19-2.34), but theopioid dose variables now showed the strongest associations, indose–response fashion. The strongest predictor was cumulativeopioid dose in the 7 months before surgery. There was a mono-tonic increase in the odds of long-term postoperative use withincreasing preoperative dose,with OR15.47 (95%CI 8.53-28.06)in the highest quartile (cumulative doses .8100 MMEs in theprevious 7 months, or a mean daily dose .39 MME) (Table 4).Even after adjusting for cumulative preoperative opioid dose, thetotal MME prescribed in the 30-day immediate postoperativeperiod remained significantly associated with long-term opioiduse, again in dose–response fashion. In the highest quartile(cumulative dose .3300 MMEs, or a mean daily dose .110MME), the OR was 7.96 (95% CI 4.25-14.91).
The number of opioid prescribers in the 30-day immediatepostoperative period was also significantly associated with odds
of long-term opioid use, even after adjustment for the dosingvariables, in a “dose-response” fashion. After adjusting for opioiddosing and numbers of prescribers, preoperative benzodiazepineuse was no longer associated with the probability of long-termopioid use. The Hosmer–Lemeshow goodness-of-fit index forthis model was acceptable at 0.85, and the AUC improvedto 0.90.
4. Discussion
More patients received long-term opioids after spinal fusionsurgery than before surgery. Most patients receiving long-termpreoperative opioids continued, and 57% maintained the samedose or increased their dose by more than 10% after theperioperative interval. Furthermore, almost 13% of patients whoreceived no preoperative opioids ended up receiving long-termpostoperative opioids. The strongest independent predictors oflong-term postoperative opioid use were the cumulative pre-operative dose and the cumulative dose of opioids prescribed inthe immediate postoperative (30 days postdischarge) interval.
Our findings are consistent with other studies indicating thatlong-term opioid use is common for both before and after lumbarsurgery, and that preoperative long-term opioid use is a powerfulpredictor of long-term postoperative use.4,12 Our data furthersuggest the importance of both the cumulative preoperative doseand the cumulative dose in the immediate postoperative period.The latter may argue for devising anesthetic and operativetechniques that minimize postoperative opioid use,13,19 alongwith greater use of nonpharmacologic and nonopioid medicationstrategies for pain management.29 Strategies to help patientstaper opioids in the immediate postoperative period and attentionto the amount of opioids prescribed are also likely to be helpful.
Table 2
Prehospitalization and posthospitalization opioid use (n 5 2491).
Posthospitalization opioid use Prehospitalization opioid use
None, n 5 704 Short term only, n 5 133 Episodic, n 5 609 Long term, n 5 1045
None, n 5 220* 109 (15.5) 35 (26.3) 60 (9.85%) 16 (1.5)
Short term only, n 5 649† 340 (48.3) 38 (28.6) 192 (31.5) 79 (7.6)
Episodic, n 5 528‡ 165 (23.4) 29 (21.8) 190 (31.2) 144 (13.8)
Long term, n 5 1094§ 90 (12.8) 31 (23.3) 167 (27.4) 806 (77.1)
Tabulated numbers are frequency counts (column %).
* No opioid fills in the 7-month posthospitalization.
† Some opioids in the 30-day posthospitalization, none in the subsequent 6 months.
‡ Patients who do not meet definitions of no opioid use, short-term opioid use, or long-term opioid use.
§ At least 4 opioid fills in 7 months after surgery, at least 3 of which were .30 days after surgery.
Table 3
Postoperative change from cumulative preoperative opioid dose among long-term and episodic preoperative opioid users.*
Posthospitalization opioid dose, 6 mo after theperioperative interval
Prehospitalization opioid use
Episodic use, n 5 609† Long-term use, n 5 1045‡
No opioids after the perioperative interval, n
(column %)
252 (41.4) 95 (9.1)
Decreased dosage by .10%, n (column %) 79 (13.0) 359 (34.4)
Same dose as prehospitalization (,10%
change), n (column %)
24 (3.9) 123 (11.8)
Increased dose by .10%, n (column %) 254 (41.7) 468 (44.8)
* Cumulative doses calculated using prescriptions filled in the 6 months preceding the perioperative interval and 6 months after the perioperative interval (excluding the perioperative interval of 30-day prehospitalization and 30-
day posthospitalization).
† Patients who do not meet definitions of no opioid use, short-term opioid use, or long-term opioid use.
‡ At least 4 opioid fills in 7 months before surgery, at least 3 of which were .30 days before hospitalization.
June 2018·Volume 159·Number 6 www.painjournalonline.com 1151
Copyright � 2018 by the International Association for the Study of Pain. Unauthorized reproduction of this article is prohibited.43

Other investigators have noted that presurgical opioid usepredicts several other adverse outcomes, including worsesurgical site pain, increased hospital length of stay, delayedreturn to work, greater surgical complications, and adversefunctional outcomes.2,5,20,21 Together with the increased likeli-hood of long-term opioid use, and the paucity of evidence forefficacy of long-term opioids,11 these findings suggest thatminimizing long-term opioids for back pain may be important. Anassociation of preoperative opioid use with anxiety and de-pression also suggests that addressing mood disorders may beimportant in minimizing opioid use.3
Surgical patients in general seem often to receive excessivepostoperative opioid prescriptions, exceeding requirements foranalgesia.6,18,21 In a study of women after cesarean section, thequantity of opioids prescribed exceeded the amount consumedby a substantial margin. Smaller opioid prescriptions wereassociated with lower consumption, but no worse pain scoresor satisfaction.6 Our findings suggest that minimizing the post-operative dosemay also help to reduce the likelihood of long-termuse. Our data further suggest that minimizing the number ofopioid prescribers in the perioperative period may help minimizethis risk, a concern noted with other orthopedic procedures.26
Our results, and others, indicate that discontinuation of long-term opioids after spinal fusion surgery is not the norm. Oneexplanation would be that many patients do not achieve the
expected pain relief from surgery. However, the fact thatpreoperative opioid use is a major predictor of long-termpostoperative use suggests that opioid dependence may beequally or more important, making postoperative discontinuationor dose reduction more difficult. Patients considering fusionsurgery for degenerative conditions should be informed thatdiscontinuation of long-term opioid medications is an unlikelyresult.
Our study has the advantage of representing a true population-based sample, regardless of insurance coverage or sources ofpayment. Use of the PDMP assured identification of allprescriptions filled, even with insurance changes or out-of-pocket payments. This measure of opioid use does not dependon patient recall or continuous insurance coverage.
However, there are important limitations as well. We cannotknowwhether patients consumed themedications they received.Patient’s race and ethnicity are not routinely collected withconsistent methods. Controlled prescriptions not filled bya licensed Oregon outpatient pharmacy were not captured inthe PDMP.We had no information on inpatient opioid prescribingand have not characterized the impact of individual clinicianprescribing habits. The definitions of long-term postoperativeopioid use are not standardized, although our results areconsistent with studies using other definitions. In 2014, Oregonhad relatively high use of prescription opioids compared with
Table 4
Multivariable logistic model without dosing information, predicting long-term postoperative opioid use, n 5 2470.*
Independent variables Odds ratio 95% CI P
Sex, female 1.00 0.82-1.23 0.97
Age category
18-44 Reference
45-54 1.11 0.77-1.60 ,0.001†
55-64 0.87 0.62-1.22
65-74 0.52 0.37-0.73
751 0.45 0.30-0.67
Non-white race 0.99 0.65-1.50 0.95
Hispanic ethnicity 1.05 0.56-1.96 0.91
Residence
Rural Reference
Urban 1.13 0.92-1.38 0.23
Missing 0.51 0.30-0.87 0.013
Indication for surgery (diagnosis)
Probable degenerative changes, nonspecific
backache, miscellaneous
Reference
Herniated disk 1.33 0.89-2.00 0.17
Sequelae of previous back surgery 1.77 1.06-2.96 0.03
Spinal stenosis 0.95 0.64-1.40 0.78
Possible instability 1.08 0.80-1.46 0.62
Comorbidity score
0 Reference
1 1.21 0.96-1.52 0.005†
2 1.30 0.88-1.90
31 1.83 1.12-2.99
Complex fusion 1.06 0.76-1.47 0.57
Procedure with complications 1.06 0.69-1.62 0.76
Received long-term preoperative opioids 10.80 8.23-13.21 ,0.001
Any preoperative benzodiazepine use (7 mo) 1.49 1.20-1.85 0.004
* Excludes 21 patients with missing age.
† P value is a test for trend.
CI, confidence interval.
1152 R.A. Deyo et al.·159 (2018) 1147–1154 PAIN®
Copyright � 2018 by the International Association for the Study of Pain. Unauthorized reproduction of this article is prohibited.44

most other states,9 and we cannot know how well our resultsgeneralize to other states.
In summary, lumbar fusion surgery infrequently reduced theuse of opioid therapy postoperatively, especially among thosereceiving long-term opioids preoperatively. Among opioid-naivepatients undergoing surgery, there was a substantial risk ofinitiating long-term opioid use. Patients should be well informedand have realistic expectations regarding opioid use when
considering lumbar fusion surgery. Clinicians treating patientswith back pain may need to give greater attention to minimizinglong-term opioid use; addressing mood disorders; minimizingpostoperative opioid use; and minimizing numbers of opioidprescribers in the perioperative setting. In predicting prolongedpostoperative opioid use, previous prescription opioid exposuremay be more important than patient characteristics or surgicalcomplexity and is a factor that clinicians control.
Table 5
Multivariable logistic model with dose information, predicting long-term postoperative use, n 5 2470.*
Independent variables Odds ratio 95% CI P
Sex, female 1.14 0.90-1.45 0.27
Age category
18-44 Reference
45-54 1.31 0.85-2.55
55-64 1.20 0.80-1.81 0.79†
65-74 1.03 0.68-1.54
751 1.36 0.85-2.19
Non-white race 1.33 0.84-2.12 0.23
Hispanic ethnicity 1.18 0.59-2.35 0.64
Residence
Rural Reference
Urban 1.14 0.91-1.44 0.26
Missing 0.59 0.31-1.13 0.11
Indication for surgery (diagnosis)
Probable degenerative changes, nonspecific
backache, miscellaneous
Reference
Herniated disk 1.12 0.70-1.81 0.64
Sequelae of previous back surgery 1.38 0.75-2.55 0.30
Spinal stenosis 0.96 0.61-1.51 0.86
Possible instability 1.07 0.74-1.52 0.73
Comorbidity score
0 Reference
1 1.22 0.94-1.59 0.005†
2 1.32 0.86-2.03
31 2.09 1.21-3.62
Complex fusion 1.055 0.72-1.54 0.69
Procedure with complications 1.07 0.65-1.77 0.78
Received long-term preoperative opioids 1.68 1.19-2.34 0.004
Total preoperative MMEs (7 mo), quartiles
0 Reference
1-750 (mean 0.005-3.6/d) 1.41 0.99-2.00
751-2350 (mean 3.6-11.2/d) 2.56 1.77-3.69 ,0.001†
2351-8100 (mean 11.2-38.6/d) 6.54 4.15-10.30
$8101 (mean $ 38.6/d) 15.47 8.53-28.06
Total MME in 30 d postoperative, in quartiles
0 Reference
1-887 (mean 0.03-29.6/d) 1.93 1.21-3.07
888-1600 (mean 29.6-53.3/d) 2.52 1.53-4.14 ,0.001†
1601-3300 (mean 53.3-110/d) 3.92 2.23-6.68
$3301 (mean $ 110/d) 7.96 4.25-14.91
Any preoperative benzodiazepine use (7 mo) 1.09 0.85-1.41 0.50
Opioid prescribers in 30 d postoperative
1 Reference
2 1.701 1.21-2.39
3 2.065 1.38-3.09 ,0.001†
41 5.047 3.17-8.04
* Excludes 21 patients with missing age.
† P value is a test for trend.
CI, confidence interval; MME, morphine milligram equivalent.
June 2018·Volume 159·Number 6 www.painjournalonline.com 1153
Copyright � 2018 by the International Association for the Study of Pain. Unauthorized reproduction of this article is prohibited.45

Conflict of interest statement
R.A. Deyo discloses that he receives royalties from UpToDate forauthoring topics on low back pain. His salary at Oregon Health &Science University is supported in part by an endowment fromKaiser Permanente. He received a financial gift from NuVasive aspart of a lifetimeachievement award from the International Society forStudyof the LumbarSpine.Noneof theother authors report financialarrangements that may represent a possible conflict of interest.
This project was supported by grant number R01 DA031208from the National Institute on Drug Abuse and by grant numberUL1 RR024140 from the National Center for Advancing Trans-lational Sciences. The opinions and conclusions presented arethose of the authors, and not necessarily those of the sponsors.
The sponsors had no role in design and conduct of the study;collection, management, analysis, and interpretation of the data;and preparation, review, or approval of the manuscript.
J. Van Otterloo and S.E. Hallvik had full access to all the data inthe study and take responsibility for the integrity of the data andthe accuracy of the data analysis. R.A. Deyo, S.E. Hallvik, M.Marino, and J. Van Otterloo are responsible for the data analysis.
Article history:Received 30 November 2017Received in revised form 8 February 2018Accepted 2 March 2018Available online 6 March 2018
References
[1] Alam A, Gomes T, Zheng H, Mamdani MM, Juurlink DN, Bell CM. Long-term analgesic use after low-risk surgery: a retrospective cohort study.Arch Intern Med 2012;172:425–30.
[2] Anderson JT, Haas AR, Percy R, Woods ST, Ahn UM, Anh NU. Chronicopioid therapy after lumbar fusion surgery for degenerative disc disease ina workers compensation setting. Spine (Phila Pa 1976) 2015;40:1775–84.
[3] Armaghani SJ, Lee DS, Bible JE, Archer KR, Shau DN, Kay H, Zhang C,McGirt MJ, Devin CJ. Preoperative narcotic use and its relation todepression and anxiety in patients undergoing spine surgery. Spine(Phila Pa 1976) 2013;38:2196–200.
[4] Armaghani SJ, Lee DS, Bible JE, Archer KR, Shau DN, Kay H, Zhang C,McGirt MJ, Devin CJ. Preoperative opioid use and its association withperioperative opioid demand and postoperative opioid independence inpatients undergoing spine surgery. Spine (Phila Pa 1976) 2014;39:E1524–30.
[5] Armaghani SJ, Lee DS, Bible JE, Shau DN, Kay H, Zhang C, McGirt MJ,Devin CJ. Increased pre-operative narcotic use and its association withpostoperative complications and length of hospital stay in patientsundergoing spine surgery. Clin Spine Surg 2016;29:E93–8.
[6] Bateman BT, Cole NM, Maeda A, Burns SM, Houle TT, Huybrechts KF,Clancy CR, Hopp SB, Ecker JL, Ende H, Grewe K, Raposo Corradini B,Schoenfeld RE, Sankar K, Day LJ, Harris L, Booth JL, Flood P, Bauer ME,Tsen LC, Landau R, Leffert LR. Patterns of opioid prescription and useafter cesarean delivery. Obstet Gynecol 2017;130:29–35.
[7] Brummett CM, Waljee JF, Goesling J, Moser S, Lin P, Englesbe MJ,Bohnert ASB, Kheterpal S, Nallamothu BK. New persistent opioid useafter minor andmajor surgical procedures in US adults. JAMA Surg 2017;152:e170504.
[8] Carragee EJ, Cheng I. Minimum acceptable outcomes after lumbar spinalfusion. Spine J 2010;10:313–20.
[9] Centers for Disease Control and Prevention. Opioid overdose: U.S.prescribing rate maps. Available at: https://www.cdc.gov/drugoverdose/maps/rxrate-maps.html. Accessed September 8, 2017.
[10] Cherkin DC, Deyo RA, Volinn E, Loeser JD. Use of the InternationalClassification of Diseases (ICD-9-CM) to identify hospitalizations for
mechanical low back problems in administrative data bases. Spine(Phila Pa 1976) 1992;17:817–25.
[11] ChouR, Turner JA, Devine EB, Hansen RN, Sullivan SD, Blazina I, Dana T,Bougatsos C, Deyo RA. The effectiveness and risks of long-term opioidtherapy for chronic pain: a systematic review for a National Institutes ofHealth Pathways to Prevention Workshop. Ann Intern Med 2015;162:276–86.
[12] Connolly J, Javed Z, Raji MA, Chan W, Kuo YF, Baillargeon J. Predictorsof long-term opioid use following lumbar fusion surgery. Spine (Phila Pa1976) 2017;42:1405–11.
[13] Devin CJ, Lee DS, Armaghani SJ, Bible J, Shau DN, Martin PR, EhrenfeldJM. Approach to pain management in chronic opioid users undergoingorthopedic surgery. J Am Acad Orthop Surg 2014;22:614–22.
[14] Deyo RA, Cherkin DC, Ciol MA. Adapting a clinical comorbidity index foruse with ICD-9-CM administrative databases. J Clin Epidemiol 1992;45:613–9.
[15] Deyo RA, Hallvik SE, Hildebran C, Marino M, Dexter E, Irvine JM, O’KaneN, Van Otterloo J, Wright DA, Leichtling G, Millet LM. Associationbetween initial opioid prescribing patterns and subsequent long-term useamong opioid-naıve patients: a statewide retrospective cohort study.J Gen Intern Med 2017;32:21–7.
[16] Dowell D, Haegerich TM, Chou R. CDC guideline for prescribing opioidsfor chronic pain—United States, 2016. JAMA 2016;315:1624–45.
[17] HCUPnet. Agency for healthcare research and quality. Available at:https://hcupnet.ahrq.gov/. Accessed May 24, 2017.
[18] Hill MV, McMahon ML, Stucke RS, Barth RJ Jr. Wide variation andexcessive dosage of opioid prescriptions for common general surgicalprocedures. Ann Surg 2017;265:709–14.
[19] Kharasch ED, Brunt LM. Perioperative opioids and public health.Anesthesiology 2016;124:960–5.
[20] Lee D, Armaghani S, Archer KR, Bible J, Shau D, Kay H, Zhang C, McGirtMJ, Devin C. Preoperative opioid use as a predictor of adversepostoperative self-reported outcomes in patients undergoing spinesurgery. J Bone Joint Surg Am 2014;96:e89.
[21] Lee JS, Hu HM, Brummett CM, Syrjamaki JD, Dupree JM, Englesbe MJ,Waljee JF. Postoperative opioid prescribing and the pain scores onhospital consumer assessment of healthcare providers and systemssurvey. JAMA 2017;317:2013–15.
[22] Martin BI, Lurie JD, Tosteson ANA, Deyo RA, Tosteson TD,Weinstein JN,Mercer SK. Indications for spine surgery: validation of an administrativecoding algorithm to classify degenerative diagnoses. Spine (Phila Pa1976) 2014;39:769–79.
[23] Menendez ME, Ring D, Bateman BT. Preoperative opioid misuse isassociated with increased morbidity and mortality and after electiveorthopedic surgery. Clin Orthop Relat Res 2015;473:2402–12.
[24] Mino DE, Munterich JE, Castel LD. Lumbar fusion surgery fordegenerative conditions is associated with significant resource andnarcotic use 2 years postoperatively in the commercially insured:a medical and pharmacy claims study. J Spine Surg 2017;3:141–8.
[25] Morden NE, Munson JC, Colla CH, Skinner JS, Bynum JPW, Zhou W,Meara E. Prescription opioid use among disabled Medicare beneficiaries:intensity, trends, and regional variation. Med Care 2014;52:852–9.
[26] Morris BJ, Zumsteg JW, Archer KR, Cash B, Mir HR. Narcotic use andpostoperative doctor shopping in the orthopedic trauma population.J Bone Joint Surg Am 2014;96:1257–62.
[27] O’KaneN,Hallvik SE,MarinoM, VanOtterloo J, Hildebran C, Leichtling G,Deyo RA. Preparing a prescription drug monitoring program data set forresearch purposes. Pharmacoepidemiol Drug Saf 2016;25:993–7.
[28] Okie S. A flood of opioids, a rising tide of deaths. N Engl J Med 2010;363:1981–5.
[29] Qaseem A, Wilt TJ, McLean RM, Forciea MA; Clinical GuidelinesCommittee of the American College of Physicians. Noninvasivetreatments for acute, subacute, and chronic low back pain: a clinicalpractice guideline from the American College of Physicians. Ann InternMed 2017;166:514–30.
[30] Rudd RA, Aleshire N, Zibbell JE, Gladden RM. Increases in drug andopioid overdose deaths—United States, 2000-2014. MMWR MorbMortal Wkly Rep 2016;64:1378–82.
[31] Sun EC, Darnall BD, Baker LC,Mackey S. Incidence of and risk factors forchronic opioid use among opioid-naıve patients in the postoperativeperiod. JAMA Intern Med 2016;176:1286–93.
1154 R.A. Deyo et al.·159 (2018) 1147–1154 PAIN®
Copyright � 2018 by the International Association for the Study of Pain. Unauthorized reproduction of this article is prohibited.46

FACT SHEET No. 7
Promoting Chronic Pain Self-Management Education Self-management is the first rung of the ladder in pain care—followed by primary care, with specialty care and pain centers most appropriately used for the most complex problems (4, 7, 17). Individuals with chronic pain live the majority of their lives outside the health-care system at home with their families. It is in this context that they manage the consequences of their pain condition on their lives every day (2). According to Lorig et al. (8), successfully managing the daily problems arising from a condition like chronic pain is an educational process that requires mastering a set of key tasks including:
Building partnerships with health-care providers Using active cognitive and behavioral strategies to maximize function and reduce pain and other symptoms Modifying family, social, and work responsibilities as needed to maintain important relationships and meaningful life roles Dealing with the emotional ups and downs of living with a chronic pain condition Maintaining and/or building a healthy lifestyle that features stress management, regular exercise, healthy eating, and sound sleep habits Using appropriate resources and managing decisions for interventions such as medication use, surgical procedures, and complementary therapies
As one pain patient put it: “I had to relearn how to live” (4).
The educational processes of successful self-management programs are typically grounded in social, cognitive, and behavioral theories, targeting improved confidence to achieve optimal functioning, acceptance of limitations, as well as more positive ways of thinking, feeling, and behaving (11). The application of self-efficacy theory, for example, has been well established. Beyond conveying educational content, the targeting of self-efficacy involves enhancing individuals’ capacity to organize and integrate cognitive, social, and behavioral skills in order to manage chronic conditions on a daily basis.
47
_____________________________________________________________________________________________
© Copyright 2018 International Association for the Study of Pain. All rights reserved.
IASP brings together scientists, clinicians, health-care providers, and policymakers to stimulate and support the study of pain and translate that knowledge into improved pain relief worldwide.
To operationalize self-efficacy principles, self-management programs improve patients’ confidence to achieve optimal health by providing opportunities for
Skills mastery—practicing self-management techniques in a supportive environment Modeling—learning positive health behaviors from facilitators and peers Reinterpretation of symptoms—examination of illness-related beliefs that may lead to maladaptive behaviors (e.g., sedentary behavior as a means to avoid continued pain) Social persuasion—support and encouragement from like-minded peers (11)
What are chronic pain self-management interventions?
Without information, support, and education, mastering self-management tasks is often a lengthy and frustrating process of trial and error that can take considerable time. The purpose of chronic pain self-management education is to speed up trial-and-error learning by providing evidence-based information and, most importantly, a supportive environment that fosters the acquisition of such self-management skills as problem solving, decision making, using appropriate resources, and taking action for change (1, 9).
While a wide variety of self-management programs exist, a review of chronic pain self-management intervention studies published since 2007 (10) found that most interventions can be classified under three broad categories:
1. The Stanford model that aims to provide a tool kit of knowledge and skills for managing pain and its physical, social, and emotional consequences (7, 12, 16)
2. Acceptance and commitment therapy with a focus on changing behaviors that are motivated by fear of pain to those motivated by a willingness to reengage in valued activities despite pain (5, 19)
3. Cognitive-behavioral therapy using principles to help identify the relationships between thoughts, emotions, and behaviors and encourage positive self-management behaviors (3, 14, 18)
While the overwhelming majority of trials report that self-management interventions play a role in reducing the physical and psychosocial burden of chronic pain, there is also evidence of a lack of effect, which may be related to facilitator skill level, the heterogeneity of pain conditions in study samples, and other methodological issues (10, 13). A key feature of all successful self-management interventions is building people’s confidence or self-efficacy to manage pain and its impact on their lives (6, 10).
48

_____________________________________________________________________________________________
© Copyright 2018 International Association for the Study of Pain. All rights reserved.
IASP brings together scientists, clinicians, health-care providers, and policymakers to stimulate and support the study of pain and translate that knowledge into improved pain relief worldwide.
Resources and Strategies
The following actions are recommended to increase educators’ awareness and promotion of chronic pain self-management education. These actions include:
Enhancing training of health professionals and persons with pain on chronic pain self-management principles and communication skills (2, 4, 10, 20) Providing information about chronic pain self-management programs Ensuring access to programs to all who can benefit regardless of income or place of residence
This will necessitate new models of delivery such as using social media, better collaboration between community-based programs and services and primary health-care providers in order to enhance appropriate and timely referral, and stabilizing funding for both community-based and primary care self-management education (1, 4, 15). Regardless of approach, it is essential to:
Tailor evidence-based educational materials and programs to be appropriate across ages, pain conditions and disabilities, cultures, and literacy levels (1, 4, 10) Continue to refine self-management interventions to target self-efficacy enhancing strategies Conduct more research in patient readiness for self-management interventions and the best combination of therapies (e.g., anti-depression medication, structured exercise, etc.) with self-management interventions (10).
RESOURCE TEXT
English: LeFort SM, Webster L, Lorig K, Holman H, Sobel D, Laurent D, Gonzalez V, Minor M. Living a healthy life with chronic pain. Boulder, CO: Bull Publishing; 2015. http://www.bullpub.com/
Spanish: LeFort SM, Webster L, Lorig K, Holman H, Sobel D, Laurent D, Gonzalez V, Minor M. Vivir una vida sana con dolor cronico. Boulder, CO: Bull Publishing; 2016.
REFERENCES
1. Aloha Kohut SA, Stinson JN, Ruskin D, Forgeron P, Harris L, van Wyk M, Luca S, Campbell F. iPeer2Peer program: a pilot feasibility study in adolescents with chronic pain. Pain 2016; 157: 1146-1155. 2. Blyth FM, March LM, Nicholas MK, Cousins MJ. Self-management of chronic pain: a population-based study. Pain 2005; 113: 285-292. 3. Guidelines for Pain Management Programmes for Adults. British Pain Society 2013. https://www.britishpainsociety.org/static/uploads/resources/files/pmp2013_main_FINAL_v6.pdf. 4. Institute of Medicine of the National Academies (IOM). Committee on Advancing Pain Research and Education. Relieving pain in America: a blueprint for transforming prevention, care, education and research. Washington, D.C.: National Academies Press; 2011. 5. Johnston M, Foster M, Shennan J, Starkey N, Johnson A. The effectiveness of an acceptance and commitment therapy self-help intervention for chronic pain. Clinical Journal of Pain 2010; 26: 393-402.
49
_____________________________________________________________________________________________
© Copyright 2018 International Association for the Study of Pain. All rights reserved.
IASP brings together scientists, clinicians, health-care providers, and policymakers to stimulate and support the study of pain and translate that knowledge into improved pain relief worldwide.
6. Keefe FJ, Somers TJ, Maitre, LM. Psychologic interventions and lifestyle modifications for arthritis pain management. Rheumatic Disease Clinics of North America 2008; 34(2): 351-368. 7. LeFort SM, Webster L, Lorig K, Holman H, Sobel D, Laurent D, Gonzalez V, Minor M. Living a healthy life with chronic pain. Boulder, CO: Bull Publishing; 2015. 8. Lorig KR, Bodenheimer T, Holman H et al. Patient self-management of chronic disease in primary care. JAMA 2002; 288: 2469-2475. 9. Lorig KR, Holman HR. Self-management education: history, definition, outcomes and mechanisms. Ann Behav Med 2003; 26: 1-7. 10. Mann EG, LeFort SM, van Den Kerkhof EG. Self-management interventions for chronic pain. Pain Manage 2013; 3: 211-222. 11. McGillion M, LeFort S, Stinson J. Chronic Pain Self-Management. In: Rashiq S, Schopflocher D, Taenzer P (Eds). Chronic pain: a health policy perspective (pp. 167-176). Wiley-VCH Verlag. Weinheim Germany. 2008. 12. McGillion M, Watt-Watson J, Stevens B, LeFort S, Coyte P, Graham A. Randomized controlled trial of a psychoeducation program for the self-management of chronic cardiac pain. JPSM 2008; 36:126-140. 13. Mehlsen M, Hegaard L, Ornbol E, Jensen JS, Fink P, Frostholm L. The effect of a lay-led, group-based self-management program for patients with chronic pain: a randomized controlled trial of the Danish version of the chronic Pain Self-Management Programme. Pain 2017;158: 1437-1445. 14. Newton-John T, Geddes J. The non-specifc effects of group-based cognitive-behavioural treatment of chronic pain. Chronic Illness 2008;4:199-208. 15. Ory MG, Lee Smith M, Patton Kulinski K, Lorig K, Zenker W. Self-management at the tipping point: reaching 100,000 Americans with evidence-based programs. Journal of the American Geriatric Society 2013; 61: 821-823. 16. Osborne RH, Wilson T, Lorig KR, McColl GJ. Does self-management lead to sustainable healh benefits in people with arthritis? A 2-year transition study of 452 Australians. J Rheumatology 2007; 35: 1112-1117. 17. Smith BH, Elliott AM. Active self-management of chronic pain in the community 2005; 113: 249-250. 18.Thorn BE, Day MA, Burns J et al. Randomized controlled trial of group cognitive behavioural therapy compared with a pain education control for low-literacy rural people with chronic pain. Pain 2011;152: 2710-2720. 19. Volwes, KE, McCracken L, O’Brien JZ. M. Acceptance and value-based action in chronic pain: a three-year follow-up analysis of treatment effectiveness and process. Behav. Res. Ther 2011;49:748-755. 20. Yank V, Laurent D, Plant K, Lorig K. Web-based self-management support training for health professionals. Patient Education and Counseling 2013; 90: 29-37.
RESOURCES
1. Bair MJ, Matthias MS, Nyland KA et al. Barriers and facilitators to chronic pain self-management: a qualitative study of primary care patients with comorbid musculoskeletal pain and depression. Pain Med 2009; 10: 1280-1290. 2. Dear BF, Gandy M, Karin E, Ricciardi T, Fogliati VJ, McDonald S, Staples LG, Nicholson Perry K, Sharpe L, Nicholas MK, Titov N. The pain course: an RCT comparing a remote-delivered chronic pain management program when provided online and workbook formats. PAIN 2017;158(7):1289-1301. 3. Forman J. A nation in pain. Healing our biggest health problem. New York, N. Y.: Oxford University Press; 2014. 4. Hadjistavropoulos T, Hadjistavropoulos HD. (Eds.). Pain management for older adults. A self-help guide. Seattle, WA: IASP Press; 2008. (Note: new edition in press) 5. Institute of Medicine of the National Academies (IOM). Committee on Advancing Pain Research and Education. Relieving pain in America: a blueprint for transforming prevention, care, education and research. Washington, D.C.: National Academies Press; 2011. (Note: Especially Chapter 4). 6. Lorig KR, Holman HR. Self-management education: history, definition, outcomes and mechanisms. Ann Behav Med 2003; 26: 1-7. (Note: Provides a comprehensive overview of self-management).
50

_____________________________________________________________________________________________
© Copyright 2018 International Association for the Study of Pain. All rights reserved.
IASP brings together scientists, clinicians, health-care providers, and policymakers to stimulate and support the study of pain and translate that knowledge into improved pain relief worldwide.
7. Mann EG, LeFort SM, van Den Kerkhof EG. Self-management interventions for chronic pain. Pain Manage 2013; 3: 211-222. (Note: Provides a recent overview of studies on self-management published since 2007). 8. McGillion M, Watt-Watson J, Stevens B, LeFort S, Coyte P, Graham A. Randomized controlled trial of a psychoeducation program for the self-management of chronic cardiac pain. J PSM 2008; 36():126-140. 9. Palermo TM, Wilson AC, Peters M, Lewandowski A, Somhegyi H. Randomized controlled trial of an internet-delivered family cognitive-behavioural therapy intervention for children and adolescents with chronic pain. Pain 2009; 146 (1-2): 205-213. (Note: Highlights a new approach to addressing self-management in pediatric groups involving the family unit). 10. Thorn BE, Day MA, Burns J et al. Randomized controlled trial of group cognitive behavioural therapy compared with a pain education control for low-literacy rural people with chronic pain. Pain 2011; 152; 2710 2720. (Note: Describes how self-management interventions can be tailored to meet the needs of unique groups). AUTHORS
Sandra LeFort, MN, PhD Professor Emeritus, School of Nursing Memorial University of Newfoundland St. John's, Newfoundland and Labrador, Canada
Michael McGillion, RN, PhD Associate Professor and Assistant Dean, Research Heart and Stroke Foundation/Michael G. DeGroote Endowed Chair in Cardiovascular Nursing Research Scientist, Population Health Research Institute International Visiting Professor of Cardiovascular Nursing Faculty of Health and Life Sciences, Coventry University School of Nursing, Faculty of Health Sciences McMaster University Hamilton, Ontario, Canada REVIEWERS
Gill Furze, RN, PhD Professor Emeritus Faculty of Health and Life Sciences Coventry University Coventry, UK Sigridur Zoëga, RN, PhD Assistant Professor and Clinical Nurse Specialist University of Iceland and Landspítali – University Hospital Reykjavík, Iceland
51

South Africa instrumental in WHO recognition of Rheumatic Fever (RF) and
Rheumatic Heart Disease (RHD) as global health priorities
Resolution at 71st World Health Assembly will lead to coordinated global response
Cape Town – 09 July 2018 – At the recent 71st World Health Assembly in Geneva, Switzerland, Member States of the World Health Organization unanimously adopted a Global Resolution on Rheumatic Fever and Rheumatic Heart Disease. This historic decision marks the first time that Rheumatic Fever (RF) and Rheumatic Heart Disease (RHD) have been recognized as global health priorities on the world health stage.
Local scientists have been instrumental in driving the agenda to achieve this landmark decision1, 2. The Resolution was co-sponsored by countries from all six WHO regions, including South Africa. Rheumatic heart disease is a preventable condition arising from acute rheumatic fever.
“We have worked consistently to demonstrate the urgent need for a unified response to these serious conditions,” said Professor Liesl Zühlke, Associate Professor at the Red Cross Memorial Children’s Hospital, who specialises in paediatric heart disease. “According to the WHO, rheumatic heart disease affects around 30 million people each year. In 2015, the disease was estimated to have caused 250 000 deaths.3 The disease most commonly occurs in childhood and adolescence and disproportionately affects girls and women,” continued Professor Zühlke.
At the WHA, there was strong consensus among governments that action was needed on a range of fronts, including strengthening primary and secondary prevention of RF and RHD, integrating RHD services into primary health care, securing a reliable supply of benzathine penicillin G, and ensuring a well-resourced and trained health workforce to provide RHD services.
Professor Liesl Zühlke is the newly elected president of the RHD Evidence, Advocacy, Communication and Hope (Rheach) organisation. Rheach is a global organisation which aims to identify, describe and disseminate solutions for this neglected disease and to reduce the burden on vulnerable populations around the world. Rheach will partner the WHO to implement, monitor and provide advice on RF and RHD to endemic countries. Several members of the South Africa Cardiology community have also been key figures in driving the adoption of this resolution, including Prof. Karen Sliwa, President-elect of the World Heart Federation and Prof. Bongani Mayosi, Dean of the Faculty of Health Sciences at UCT.
Discussions at the WHA highlighted that vulnerable groups and marginalized communities are the most affected by RF and RHD, and that its prevention and control is essential to achieving the Sustainable Development Goals and universal health coverage.
“Now that this policy has been adopted by the full World Health Assembly, the Resolution stands as the first global commitment on RHD to be endorsed by all governments. It now serves as a high-level global policy that demands national and international decision-makers to take action to prioritise and fund RHD prevention and control in all endemic settings,” concluded Professor Zühlke.
1. Zuhlke L, Engel ME, Karthikeyan G, Rangarajan S, Mackie P, Cupido B, Mauff K, Islam S, Joachim A, Daniels R, Francis V, Ogendo S, Gitura B, Mondo C, Okello E, Lwabi P, Al-Kebsi MM, Hugo-Hamman C, Sheta SS, Haileamlak A, Daniel W, Goshu DY, Abdissa SG, Desta AG, Shasho BA, Begna DM, ElSayed A, Ibrahim AS, Musuku J, Bode-Thomas F, Okeahialam BN, Ige O, Sutton C, Misra R, Abul Fadl A, Kennedy N, Damasceno A, Sani M, Ogah OS, Olunuga T, Elhassan HH, Mocumbi AO, Adeoye AM, Mntla P, Ojji D, Mucumbitsi J, Teo K, Yusuf S and Mayosi BM. Characteristics, complications, and gaps in evidence-based interventions in rheumatic heart disease: the Global Rheumatic Heart Disease Registry (the REMEDY study). Eur Heart J. 2015;36:1115-22a.
2. Mayosi B. The four pillars of rheumatic heart disease control. S Afr Med J. 2009;100:506.
3. Watkins DA, Johnson CO, Colquhoun SM, Karthikeyan G, Beaton A, Bukhman G, Forouzanfar MH, Longenecker CT, Mayosi BM, Mensah GA, Nascimento BR, Ribeiro ALP, Sable CA, Steer AC, Naghavi M, Mokdad AH, Murray CJL, Vos T, Carapetis JR and Roth GA. Global, Regional, and National Burden of Rheumatic Heart Disease, 1990-2015. N Engl J Med. 2017;377:713-722.
Product & NewsProduct & News
52
