journal of la ppt fusion: pyramid patch transformer for a
TRANSCRIPT

JOURNAL OF LATEX CLASS FILES, VOL. 14, NO. 8, AUGUST 2015 1
PPT Fusion: Pyramid Patch Transformerfor a Case Study in Image FusionYu Fu, Tianyang Xu, Xiao-Jun Wu, Josef Kittler, Life Member, IEEE
Abstract—The Transformer architecture has witnessed a rapiddevelopment in recent years, outperforming the CNN architec-tures in many computer vision tasks, as exemplified by the VisionTransformers (ViT) for image classification. However, existingvisual transformer models aim to extract semantic informationfor high-level tasks, such as classification and detection. Thesemethods ignore the importance of the spatial resolution of theinput image, thus sacrificing the local correlation informationof neighboring pixels. In this paper, we propose a Patch Pyra-mid Transformer(PPT) to effectively address the above issues.Specifically, we first design a Patch Transformer to transform theimage into a sequence of patches, where transformer encodingis performed for each patch to extract local representations.In addition, we construct a Pyramid Transformer to effectivelyextract the non-local information from the entire image. Afterobtaining a set of multi-scale, multi-dimensional, and multi-anglefeatures of the original image, we design the image reconstructionnetwork to ensure that the features can be reconstructed intothe original input. To validate the effectiveness, we apply theproposed Patch Pyramid Transformer to image fusion tasks.The experimental results demonstrate its superior performance,compared to the state-of-the-art fusion approaches, achievingthe best results on several evaluation indicators. Thanks to theunderlying representational capacity of the PPT network, itcan directly be applied to different image fusion tasks withoutredesigning or retraining the network.
Index Terms—image fusion, deep learning, transformer, low-level vision
I. INTRODUCTION
IN recent years, Transformer models have received wideattention from the research community recently, thanks to
their promising performance in many visual tasks. Vaswaniet al. proposed the Vision Transformer structure at NIPS2017, as a 2D data extension of the transformer originallydesigned for the Natural Language Processing (NLP) tasks,such as Bert [1] using Transformer as encoder, GPT [2]using Transformer as decoder, Transformer-XL [3] solvingthe problem of long sequences, etc. It is also widely usedin the field of Recommendation Systems to improve their per-formance. Examples include BST [4] for behavioral sequencemodeling, Autoint [5] for feature combination of CTR(Click-Through-Rate) prediction model, re-ranking model PRM [6],
Y. Fu and X.-J. Wu are with the School of Artificial Intelligence andComputer Science, Jiangnan University, Wuxi 214122, P.R. China. (e-mail:@163.com, wu [email protected])
T. Xu is with the School of Artificial Intelligence and Computer Science,Jiangnan University, Wuxi 214122, P.R. China and the Centre for Vision,Speech and Signal Processing, University of Surrey, Guildford, GU2 7XH,UK. (e-mail: tianyang [email protected])
J. Kittler is with the Centre for Vision, Speech and Signal Processing, Uni-versity of Surrey, Guildford, GU2 7XH, UK. (e-mail: [email protected])
etc. Recently in the field of computer vision, many excel-lent methods demonstrated that Transformer can also obtainpromising performance in tasks, such as image classificationViT [7], object detection DETR [8], semantic segmentationSETR [9], 3D point cloud processing Point Transformer [10],image generation TransGAN [11], etc.
Generally speaking, the transformer uses the self-attentionmodule, which models global relations between patches forencoding features. The global operations provide a view ofthe input image which is more complete than local convo-lutions for semantic tasks such as classification, detection,and recognition. But for other visual tasks such as imagefusion, defogging, super-resolution reconstruction, etc., suchglobal aggregations would sacrifice the local feature extrac-tion capacity, degrading its effectiveness in low-level visionfields. Therefore, in this paper, we explore the potential ofTransformer in low-level vision tasks, balancing its semanticfeature-saliency perception and pixel-level perception.
In principle, the seminal work on ViT proves that usinga pure Transformer network could achieve the state-of-the-artperformance in image classification. Specifically, ViT splits theinput into 14×14 or 16×16 patches. Each patch is flattenedto a vector, acting as a token for the Transformer system.ViT is the first transformer model designed to extract imagefeatures, but it still suffers the following two limitations: 1)ViT requires a huge dataset such as the JFT-300M dataset forpre-training to better explore the relationship between pixels.It cannot obtain satisfactory results using a midsize datasetsuch as ImageNet-1K. 2) The Transformer structure in ViTextracts non-local interactions from the entire image, whichis not suitable for learning local patterns, including textureand edges. We believe that local patterns are essential forvisual recognition tasks, which has been proved by existingCNN(Convelutional Neural Network) techniques. In particu-lar, CNN extract various shallow features, and then obtainssemantic information through multi-layer nonlinear stacking.Therefore, ViT focus on the semantic features while ignoringshallow features, which is not conducive to low-level visualtasks. Motivated by this analysis, we design a new transformermodel to address the above issues, endowing the Transformerwith pixel-level perception.
To extract low-level visual representations, we divide theoriginal image into several patches of appropriate size. Foreach patch, the transformer is used to calculate the globalcorrelation features of all pixels, with which the source imagepatches can be reconstructed. Therefore, we can obtain a set oflow-level features of the image, sharing similar characteristics.We coin this module as ”Patch Transformer”. Different from
arX
iv:2
107.
1396
7v2
[cs
.CV
] 1
5 D
ec 2
021

JOURNAL OF LATEX CLASS FILES, VOL. 14, NO. 8, AUGUST 2015 2
ViT, as shown in Fig. 2, Patch Transformer operate on allpixels in each patch, focusing on extracting the correlationof local pixels, thus extracting more local features. Second,to explicitly extract the global patterns of the image, wedesign a down-sampling pyramid to achieve local-to-globalperception. Specifically, we down-sample the input imageonce, obtaining a half size image, where we perform PatchTransformer. After repeating down-sampling and performingthe Patch Transformer until the image becomes the same sizeas the predefined patch. The obtained features correspondingto different scales are then up-sampled to the original size.We name this operation as “Pyramid Transformer”. Based onthe Patch Transformer and Pyramid Transformer, we developa Pyramid Patch Transformer (PPT) image feature extractionmodel. The PPT model can fully extract the features of theinput image, including local context and global saliency. Wefurther design a reconstruction auto-encoder network to ensurethat the extracted features can reconstruct the input image.
To verify the effectiveness of the proposed PPT model, weapply this feature extraction approach to the image fusiontask. The input images are obtained by different kinds ofsensors, such as infrared images and visible light images,medical CT images and X-ray images, or images with differentfocus, images with different exposures and so on. These multi-source images reflect different physical attributes of the samescene. In general, image fusion tasks aim to fuse images ofdifferent modalities according to a certain algorithm, so thatthe fused image contains more information than any singleimage. An example of the fusing a visible light image and aninfrared image is shown in Fig.1. The fused images containmore comprehensive information for easy recognition andobservation by humans and machines.
(a) Visible Light Image (b) Infrared Image (c) Fused Image
Fig. 1. Image Fusion. (a) is a visible light image. (b) is an infrared image.(c) is a fused image.
Overall, the proposed Pyramid Patch Transformer possessesthe following merits. First of all, compared to ViT that onlyfocuses semantic information, Patch Transformer can extractlow-level texture features of the image. Secondly, comparedwith CNN, PPT uses Pyramid Transformer to calculate globalcorrelation, its receptive field is the entire image. Besides,the common Transformer model requires a large data set, andwe only need to train PPT on MS-COCO [12] and Imagenet[13] with less computing resources. Finally, to the best ofour knowledge, we are the first to perform image fusiontasks using an effective low-level vision Transformer model,which is entirely convolution-free. Compared with the existingimage fusion methods, the fusion image of PPT have achievedpromising results in both subjective and objective evaluation.
The PPT model can extract a variety of multi-scale featuresfrom the input image. We use PPT model as the featureextraction network, and then design a feature decoder forfeature compression and image reconstruction. In summary,our contributions are four-fold:
• A new Pyramid Patch Transformer as a general featureextraction module for low-level vision tasks is proposed,supplementing the local feature extraction capacity oftransformer in the CV field, with its successful appli-cation in the field of image fusion, demonstrating itsfeasibility.
• The designed Patch Transformer can reflect intrinsic localfeatures via directly modelling the pixels in each Patch.Besides, the proposed position embedded dimension ex-tends to all spatial pixels, achieving fine-grained location-aware attention against the other Transformers.
• A novel Pyramid Transformer is constructed to reflectthe global relationships of multi-scale patches, achievinglocal-to-global perception.
• The receptive field is applied to the Transformer modelfor the first time. In particular, existing Transformers canonly aggregate global features. But our PPT can achievemulti-range and multi-level pixel perception like CNN,hierarchically passing the visual clues.
II. RELATED WORK
A. Transformer in Vision
Transformer is a powerful model in the NLP field. It hasswept all NLP areas, with the eye-catching title and excel-lent performance since Attention is All You Need. Recently,Transformer has extended in the CV field. For example, a self-supervised learning method with Vision Transformers as thebackbone architecture MoB [14], a new tracker network basedon powerful attention mechanism TrTr [15], a deformationfield learning method that solves the problem of deformableimage registration AiR [16], a new Semantic segmentationmethod Segmenter [17], and more excellent Transformer mod-els for other vision tasks such as image classification [7], [18],[19], object detection [8], [20], [21], etc. Among these works,most of them follow the Vision Transformer (ViT) to establishthe corresponding models.
Typically, a Transformer encoder is composed of a multi-head self-attention layer (MSA) and a Multi-layer Perception(MLP) block. A Layer Norm (LN) operation is used, withthe residual structure, before each MSA and MLP layer. Theessential design of Transformer is that the input vector is com-bined with the position embedding to preserve the localizationclues for each token. To introduce the basic Transformer to thevisual task, ViT splits an input image X ∈ RH×W into w×hpatches by a p× p size sliding window to obtain a 1-D vectorY 1 ∈ Rh×w×p2
. However, ViT maps Y 1 to E ∈ Rp2·C×D,which ignores the fine-grained information of all pixels in thew×h patch, only retaining the semantic information betweenpatches. ViT uses 16 vectors represents the w × h size patchfeature. The obtained output at z0L is the classification result.

JOURNAL OF LATEX CLASS FILES, VOL. 14, NO. 8, AUGUST 2015 3
A ViT network structure for image classification is as follows,
z0 =[xclass ;x
1pE;x2
pE; · · · ;xNp E]+Epos,
E ∈ R(P2·C)×D,Epos ∈ R(N+1)×D
z′` = MSA(LN (z`−1)) + z`−1, ` = 1 . . . L
z` = MLP (LN (z′`)) + z′`, ` = 1 . . . L
y = LN(z0L)
. (1)
ViT roughly split images as a 16 × 16 size vector. It isuseful for semantic information extraction, but it is disastrousfor local features of low-level visual tasks. In Fig. 2(a), wesimply draw the ViT process. Purple highlight the process ofobtaining a patch token.
In addition, SiT [22] supplements the lack of image recon-struction tasks in self-supervised low-level vision. Sit performwell in tasks including image reconstruction, rotation predic-tion and contrastive learning. SiT uses the global computingpower of Transformer to model semantic concepts withinpatches. Similarly, it does not attach importance to shallowinformation.
To summarize, most existing Transformer model also fo-cuses on solving high-level semantic tasks, while there arestill few explorations for low-level visual tasks.
B. Image Fusion
There are numerous algorithms that can achieve promisingimage fusion performance with the developing computer vsiontechniques [23], [24]. Existing image fusion approaches canbe roughly divided into two categories: traditional methodsand CNN-based methods.
Traditional image fusion methods use algorithms to decom-pose or convert images to other domains for fusion, and theninversely transform them into general domain images. In thiscategory, 1) use pyramid [25], curvelet [26], contourlet [27],etc. to perform multi-scale image decomposition. 2) use SparseRepresentation (SR) [28], Joint Sparse Representation (JSR)[29] or approximate sparse representation [30] to represent theimages in the sparse subspace. 3) perform low-rank represen-tation of the image such as LRR [31] or MDLatLRR [32]. 4)convert images to a subspace domain, such as PCA [33], ICA[34], NMF [35].
Image fusion approach based on CNN can be dividedinto two categories: 1) The method based on autoencodersuses an encoder to extract features into the latent space forfeature fusion, and then the fused features are input to thedecoder to obtain the fused image [36]–[39] . 2)The end-to-end fusion network designs a suitable structure and lossfunction to realize the end-to-end image generation [40]–[42]. In ICCV 2017, Prabhakar et al. proposed DeepFuse [36]approach, introducing the auto-encoder structure for multi-exposure image fusion task. Specifically, DeepFuse trains theauto-encoder network, with the encoder extracting features ofthe image. After performing an addition fusion strategy in themiddle layer, the fused features are input to the decoder toobtain the final output. Similar structures are further developed
by DenseFuse [37] and IFCNN [43]. The general steps of theseauto-encoder-based image fusion methods are as follows:
Xfeatures = Encode(Xinput)
Yfeatures = Encode(Yinput)
Zfeatures = Fusion(Xfeatures, Yfeatures)
Zoutput = Decode(Zfeatures)
. (2)
The learned convolution kernels can gradually extract high-level abstract features. In theory, the receptive field shouldcover the entire image, but [44] have shown that the actualreceptive field is much smaller than the theoretical one. Thisimpedes the full use of context information to capture thevisual features. Although we can continuously deepen theconvolutional layers, this would obviously heavy the modeland increase the amount of calculation dramatically. Therefore,the CNN based deep learning image fusion algorithm cannotsupport a suitable scope for perceiving the visual clues.After analysing the deep learning auto-encoder image fusionframework, we conduct an exploration to to use Pyramid PatchTransformer instead of the traditional CNN to address theabove limitations.
III. PYRAMID PATCH TRANSFORMER
For high-resolution images, most of the existing transformerapproaches split the image into several patches. Suppose theresolution of an image is W×H , we split it into w×h vectorswith each patch being p × p, where w = W/p, h = H/p.Therefore, the features with size w× h are the 2D sequentialrepresentations of the original image W ×H
Transformer then regards each patch as a minimum com-puting unit. It calculate the correlation between w×h patches.However, the p× p elements in the patches will be scrambledinto the 2D vectors and will not directly participate in the cor-relation calculation which is named Attention in Transformer.This operation can strongly perceive the context informationof any patch, but it is difficult to perceive the local informationof pixels in the patch.
To reflect the pixel details, a straightforward solution is toset the size of the patch to 1. This means that the Transformeris performed on the original resolution image, resulting ininoperable issue. For example, if a transformer is appliedto a 256 × 256 image, at least one attention matrix of(256 × 256) ∗ (256 × 256) = 4294967296 parameter will begenerated, which requires huge memory. In order to overcomethis problem, we propose the Pyramid Patch Transformer,a network framework that uses fully-transformer for imagefeature extraction. The PPT model consists of two parts:1). a memory-friendly Patch Transformer for large-resolutionimages. 2). Pyramid Transformer designed to capture theglobal information of the local patches.
PPT model can perceive the local information of pixels inany patch and the contextual information between patches.
A. Patch Transformer
The Patch Transformer module is designed to alleviate thememory consumption caused by general transformers with

JOURNAL OF LATEX CLASS FILES, VOL. 14, NO. 8, AUGUST 2015 4
ReconstructTransformer
...
...
...
...
...
...
slide T2P Reshape MLP
Tran
sform
er
Tran
sform
er
Tran
sform
er
...
...
...
...
...
...
...
...
...
...
...
...
...
...
...
...
...
...
...
...
Trans to PatchesX
Y0YY1
.. .
.. .
.. .
.. .
...
.. .
.. .
.. .
.. .
...
Pos
Y
Z
FZout
...patch Reshape MLP
(a) ViT TransformerX
Y0
Y1 E Z
Tran
sform
er Label
(b) Patch Transformer
...... ......
Fig. 2. Comparison between ViT and Patch Transformer. (a) Illustration of the ViT. ViT maps the image to a high-latitude space, learning more semanticinformation but also destroying the pixel-level relationship. (b) Illustration of the Patch Transformer. The first step is to split the input to multiple patches.A p × p sliding window is used to split the image into a sequence of patches. Each patch is reshaped into a 1-D vector, and an MLP is used to extendthe channels. The second step is to use the multi-layer Transformer module to obtain the non-local representations within this patch. The third step is toreconstruct the two-dimensional patch from the learned representations.
exceeding tokens when processing large-resolution images.Each Patch Transformer module contains three steps: 1, Transto Patches, 2, Transformer and 3, Reconstruct. The PatchTransformer process is shown in the Fig.
Patch Transformer performs weight-sharing Transformersfor each patch to calculate the correlation of all pixels in thepatches and obtain local information in each patch of the inputimage.
2(b).
As shown in the Fig. 2(b), given an H×W input image X ∈RH×W , X is split into w×h patches by a sliding window withp×p size, where h = H/p,w = W/p. We name this operationT2P. We can obtain a sequence of h×w×p×p patch featuresY0, Y0 = [x0, x1, x2 · · ·xh×w], xi ∈ Rp×p. We reshape eachxi into a 1-D vector. Y0 ∈ Rh×w×p×p is reshaped into Y1 ∈Rh×w×p2
. In order to enhance the information, we use MLPto increase the dimension of Y1 to obtain Y ∈ Rh×w×p2×C ,equivalent to a sequence of h×w patch features with size with
p2 and C channels, Y = [y0, y1, y2 · · · yh×w], yi ∈ Rp2×C .Y0 = T2P(X)
Y1 = Reshape(Y0)
Y = MLP(Y1)
. (3)
We set a learnable position embedding vector Pos. In addition,we extend the vector Pos to the same dimension as Y , Pos ∈Rh×w×p2×C , enabling learning the location clues among theembedding vectors. Therefore, we can obtain the feature Z ∈Rh×w×p2×C .
Z = [y0, y1, · · · yh×w] + Pos (4)
Then we conduct transformers for each patch zi in Z, Z =[z0, z1, z2 · · · zw×h]. The Transformer encoder module canbe applied several times in the network. Each Transformermodule is divided into two steps,multi-head self-attentionlayer (MSA) and Multi-layer Perception (MLP). A standardTransformer module with LayerNorm and Residual structureis shown in the Fig. 4.{
z′i = MSA(LN(zi)) + zi
z′′i = MLP(LN(z′i)) + z′i. (5)

JOURNAL OF LATEX CLASS FILES, VOL. 14, NO. 8, AUGUST 2015 5
Pa
tchT
rasn
form
er
PatchT
rasnform
er
PatchTrasnform
er
... ...
... ...
DownSample
DownSample
CCC
UpSample
UpSample
X
Xlowi
Xlowm
F
Fi
Fm CCC concatenate
Fout
Fig. 3. Pyramid Transformer. The input image X is down-sampled m times. Each time the down-sampled image employs the Patch Transformer to extractfeatures to obtain Fi. Finally, all different scaled features Fi are upsampled and concatenated to obtain Fout.
十,一乍
Fig. 4. Transformer module.
We restore Zout = [z′′0 , z′′1 , z′′2 · · · z′′w×h] according to the
order of split X . The corresponding output is a set of featuresF ∈ RH×W×C mapped from the original image to the latentspace.
F = Re(Zout) (6)
B. Pyramid Transformer
Pyramid Transformer uses the pyramid structure to perceivethe contextual information between patches. Using the abovePatch Transformer, each input image will be split into severalpatches. The representations of each patch are only related tothe pixels within the patch, without considering the long-rangedependency between pixels in the entire image. To address thisissue, we refer to the multi-scale approach with the followingdesign to construct a pyramid structure. First, the image isdown-sampled once to obtain an image Xlow with size ofW/2 × H/2, Xlow ∈ RH/2×W/2. Apply the correspondingPatch Transformer to Xlow to get the representations Flow,Flow ∈ RH/2×W/2×C . Then Flow is upsampled to obtain F1
with the same size as the input image X .Xlow = Downsample(X)
Flow = PatchTransformer(Xlow)
F1 = Upsample(Flow)
. (7)
1) Continue to downsample the image Xlow,2) Use Patch Transformer to extract representations,
3) Upsample to H ×W to get Fi.Repeat the above operations recursively until the the down-
sampled image Xlow can be split into one patch. We performthese operations m times. Suppose the image is of S × Ssize, and the spitted patch is of p × p size, we can obtainm = log2(S/p). After concatenating all the features atdifferent scales, we get a set of multi-scale features Fout =[F, F1, F2 · · ·Fm], as shown in Fig.3. Patch Transformers indifferent pyramid scales focus on diverse granularities, suchthat different scales are specifically trained without sharing theweights.
C. Transformer Receptive Field
In general, CNN performs well in the computer vision field.One essential factor is the receptive field of CNN, which caneffectively capture the local features in each specific spatialscales of the image. With the size of the convolution kernelincreasing or the depth of the convolution layer deepening,each cell of the feature maps reflects a relevant spatial regionin the original image. As shown in the Fig. 5 (a), a PatchTransformer is performed on the image, with each pixel of itsfeature being associated with all the pixels of the entire patch.This patch size can be considered as the receptive field of thisPatch Transformer. The receptive field can expands four timeslarger after downsampling once, as the length and width ofthe image are both half.
With the gradual deepening of the pyramid, the range ofassociated pixels expands from the local area to global. Thereceptive field of the Patch Transformer has also becomelarger. In particular, the pixels that are close to each othercontribute more correlation, and the pixels with a long distancepreserve weak long-range dependence. With the bottom PatchTransformer layer in the Pyramid Transformer, the receptivefield is expanded to the entire image, as shown in the Fig.5(b). The continuous down-sampling is designed to obtaina large receptive field here. A large receptive field on the

JOURNAL OF LATEX CLASS FILES, VOL. 14, NO. 8, AUGUST 2015 6
Pa
tchTrasn
form
erP
atchTrasn
form
er
(a) Middle Layer
(b) Bottom Layer
Fig. 5. Transformer Receptive Field. a) is the mapping of the feature pixels inthe middle of the Pyramid Transformer. b) shows the mapping in the bottomlayer of the Pyramid Transformer.
original image captures more large-scale or global semanticfeatures with less detail information. While the upper severallayers in the Pyramid Transformer captures low-level details.Therefore, we argue that the Pyramid Transformer can extractboth shallow and semantic information simultaneously.
D. Network Architecture
We design the auto-encoder network for image reconstruc-tion, as shown in the Fig. 6. The encoder is composed ofthe Pyramid Transformer and the Patch Transformer. Afterobtaining a set of multi-scale features after encoding, thereconstructed image can be generated with the decoder.
PPT M
od
ule
MLP
Reshape Tanh
Loss = MSE(X, Xre)
X Xre
Fig. 6. Network Architecture.
The decoder is an MLP composed of two Fully Connected(FC) layers, and uses the GELU [45] activation function andTanh activation to output.
Xre = Tanh(GELU(FC(GELU(FC(X))) (8)
We use the mean square error (MSE) loss function as thereconstruction loss for the network.
Loss = MSE(X,Xre)
MSE(X,Y ) =1
N
N∑n=1
(Xn − Yn)2. (9)
E. Features Visualization
As shown in the Fig. 7, we obtain the extracted features bythe PPT module. We select the features from three differentreceptive fields in the Pyramid Transformer. In the first rowwith the smallest receptive field, it can be seen that the featuresrepresent more low-level features such as edge contour andcolor distribution of the image. While in the third row of thefeatures with the largest receptive field, it can be seen thatthe features represent the concerned area of the related object,reflecting the semantic related feature of the pixels.
...
...
...
...
...
PPT Transfo
rmer
Fig. 7. Features Visualization. Features in the first row are generated by thetop layer in the Pyramid Transformer. They have the smallest receptive fieldand represent low-level features. Features in the third row are generated bythe bottom layer of the Pyramid Transformer. They have the largest receptivefields and represent semantic features.
IV. PYRAMID PATCH TRANSFORMER FOR IMAGEFUSION
The primary purpose of the image fusion task is to generatea fusion image that contains as much useful information aspossible from the two source images. We use the designedPPT module to extract the image features for image fusiontasks.
A. Fusion Network Architecture
We take the infrared image and visible light image fusiontask as an example. We input the visible light image Xvi
and the infrared image Xir into the pre-trained PPT encodermodule to obtain Fvi and Fir. The PPT encoder can mapany image X to a high-dimensional feature space to obtainfeatures F . These features F can represent the input image Xfrom different angles such as edge, texture, color distribution,semantic information, etc.. As we use the Siamese structurewith a same PPT encoder module to extract features, Fvi andFir are mapped to the same feature space. We can easilyperform fusion operations on Fvi and Fir across the channeldimension, thus get a new fused feature representation Ffused.
Because the features F obtained by the PPT encoder canbe reversely mapped to the original space by the trained MLPdecoder in Equ.(8), the Ffused we calculated is also in the
JOURNAL OF LATEX CLASS FILES, VOL. 14, NO. 8, AUGUST 2015 7
PPT Transfo
rmer
MLP
Reshape Tanh
PPT Transfo
rmer
Fusion
Strategy
Ivi
Iir
Ifused
Fvi
Fir
Ffused
a
c
b
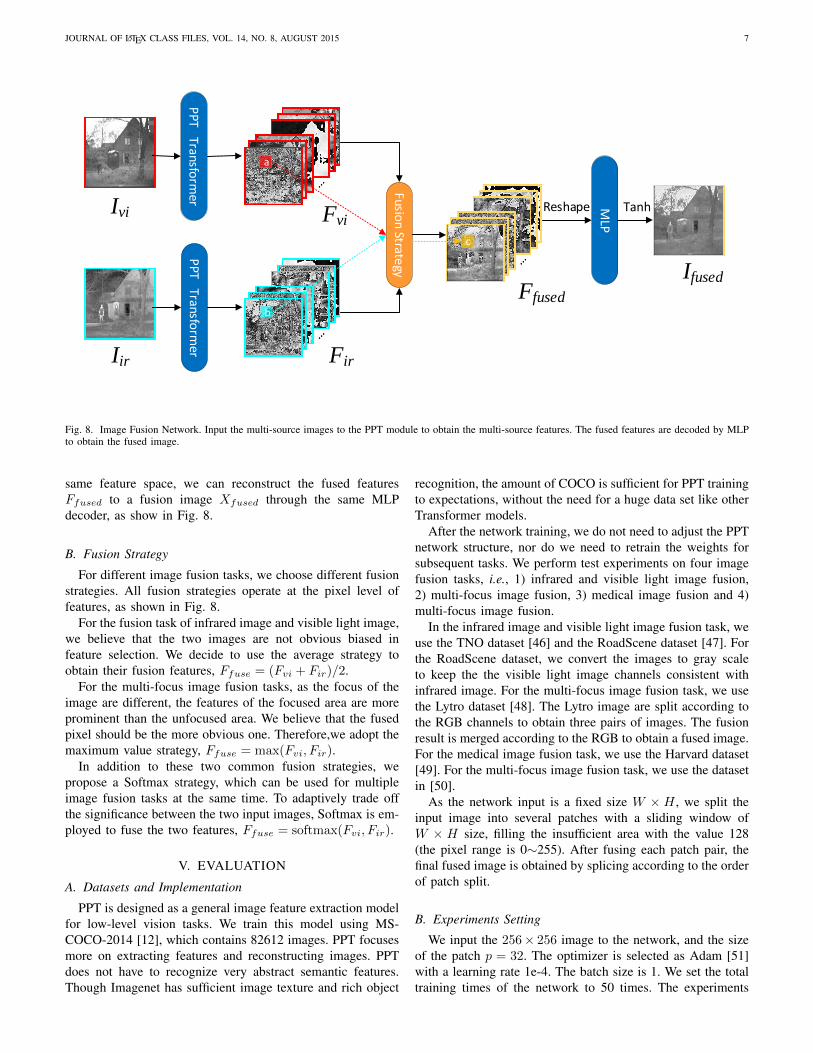
Fig. 8. Image Fusion Network. Input the multi-source images to the PPT module to obtain the multi-source features. The fused features are decoded by MLPto obtain the fused image.
same feature space, we can reconstruct the fused featuresFfused to a fusion image Xfused through the same MLPdecoder, as show in Fig. 8.
B. Fusion Strategy
For different image fusion tasks, we choose different fusionstrategies. All fusion strategies operate at the pixel level offeatures, as shown in Fig. 8.
For the fusion task of infrared image and visible light image,we believe that the two images are not obvious biased infeature selection. We decide to use the average strategy toobtain their fusion features, Ffuse = (Fvi + Fir)/2.
For the multi-focus image fusion tasks, as the focus of theimage are different, the features of the focused area are moreprominent than the unfocused area. We believe that the fusedpixel should be the more obvious one. Therefore,we adopt themaximum value strategy, Ffuse = max(Fvi, Fir).
In addition to these two common fusion strategies, wepropose a Softmax strategy, which can be used for multipleimage fusion tasks at the same time. To adaptively trade offthe significance between the two input images, Softmax is em-ployed to fuse the two features, Ffuse = softmax(Fvi, Fir).
V. EVALUATION
A. Datasets and Implementation
PPT is designed as a general image feature extraction modelfor low-level vision tasks. We train this model using MS-COCO-2014 [12], which contains 82612 images. PPT focusesmore on extracting features and reconstructing images. PPTdoes not have to recognize very abstract semantic features.Though Imagenet has sufficient image texture and rich object
recognition, the amount of COCO is sufficient for PPT trainingto expectations, without the need for a huge data set like otherTransformer models.
After the network training, we do not need to adjust the PPTnetwork structure, nor do we need to retrain the weights forsubsequent tasks. We perform test experiments on four imagefusion tasks, i.e., 1) infrared and visible light image fusion,2) multi-focus image fusion, 3) medical image fusion and 4)multi-focus image fusion.
In the infrared image and visible light image fusion task, weuse the TNO dataset [46] and the RoadScene dataset [47]. Forthe RoadScene dataset, we convert the images to gray scaleto keep the the visible light image channels consistent withinfrared image. For the multi-focus image fusion task, we usethe Lytro dataset [48]. The Lytro image are split according tothe RGB channels to obtain three pairs of images. The fusionresult is merged according to the RGB to obtain a fused image.For the medical image fusion task, we use the Harvard dataset[49]. For the multi-focus image fusion task, we use the datasetin [50].
As the network input is a fixed size W × H , we split theinput image into several patches with a sliding window ofW × H size, filling the insufficient area with the value 128(the pixel range is 0∼255). After fusing each patch pair, thefinal fused image is obtained by splicing according to the orderof patch split.
B. Experiments Setting
We input the 256× 256 image to the network, and the sizeof the patch p = 32. The optimizer is selected as Adam [51]with a learning rate 1e-4. The batch size is 1. We set the totaltraining times of the network to 50 times. The experiments

JOURNAL OF LATEX CLASS FILES, VOL. 14, NO. 8, AUGUST 2015 8
Visible Infrared
(a) CBF (b) CVT (c) DTCWT (d) GTF
(e) MSVD (f) RP (g) DeepFuse (h) DenseFuse
(i) FusionGan (j) IFCNN (k) MDLatLRR (l) DDcGAN
(1) Results in the TNO Dataset. (2) Results in the RoadScene Dataset.
(m) ResNetFusion (n) NestFuse (o) FusionDN (p) HybridMSD
(q) PMGI (r) U2Fusion (s) Ours-Average (t) Ours-SoftMax
Visible Infrared
(a) CBF (b) CVT (c) DTCWT (d) GTF
(e) MSVD (f) RP (g) DeepFuse (h) DenseFuse
(i) FusionGan (j) IFCNN (k) MDLatLRR (l) DDcGAN
(m) ResNetFusion (n) NestFuse (o) FusionDN (p) HybridMSD
(q) PMGI (r) U2Fusion (s) Ours-Average (t) Ours-SoftMax
Fig. 9. Comparison of our PPT Fusio with 18 state-of-the-art methods on one pair of Visible light and Infrared image in the (1) TNO dataset and (2)RoadScene dataset.
TNO RoadMethods SCD SSIM FMIpixel Nabf QS CC SCD SSIM FMIpixel Nabf QS CC
CBF 1.3193 0.6142 0.8888 0.0621 0.7395 0.6560 0.8784 0.6028 0.8312 0.0388 0.7387 0.7118CVT 1.5812 0.7025 0.9156 0.0275 0.8118 0.7111 1.3418 0.6641 0.8643 0.0318 0.7568 0.7439
DTCWT 1.5829 0.7057 0.9186 0.0232 0.8182 0.7121 1.3329 0.6567 0.8509 0.0412 0.7326 0.7420GTF 1.0516 0.6798 0.9056 0.0126 0.7536 0.6514 0.8072 0.6748 0.8654 0.0096 0.7037 0.6961
MSVD 1.5857 0.7360 0.9036 0.0022 0.7888 0.7280 1.3458 0.7128 0.8459 0.0034 0.7356 0.7518RP 1.5769 0.6705 0.8929 0.0583 0.7542 0.7124 1.2829 0.6341 0.8408 0.0773 0.7229 0.7300
DeepFuse 1.5523 0.7135 0.9041 0.0202 0.7698 0.7243 0.5462 0.4601 0.8215 0.2213 0.5387 0.6687DenseFuse 1.5329 0.7108 0.9061 0.0352 0.7847 0.6966 1.3491 0.7404 0.8520 0.0001 0.7602 0.7543FusionGan 0.6876 0.6235 0.8875 0.0352 0.6422 0.6161 0.8671 0.6142 0.8398 0.0168 0.6433 0.7312
IFCNN 1.6126 0.7168 0.9007 0.0346 0.8257 0.7004 1.3801 0.7046 0.8509 0.0315 0.7606 0.7647MdLatLRR 1.6248 0.7306 0.9148 0.0216 0.8427 0.7137 1.3636 0.7369 0.8575 0.0004 0.7758 0.7527DDcGAN 1.3831 0.5593 0.8764 0.1323 0.6571 0.7079 0.5462 0.4601 0.8215 0.2213 0.5387 0.6687
ResNetFusion 0.1937 0.4560 0.8692 0.0550 0.4247 0.3887 0.2179 0.3599 0.7963 0.0550 0.3462 0.5376Nestfuse 1.5742 0.7057 0.9029 0.0428 0.7833 0.7006 1.2583 0.6666 0.8571 0.0459 0.6894 0.7539
FusionDN 1.6148 0.6201 0.8833 0.1540 0.7328 0.7170 1.1882 0.6454 0.8423 0.0780 0.7658 0.7204HybridMSD 1.5773 0.7094 0.9083 0.0435 0.8208 0.7072 1.2642 0.6961 0.8552 0.0460 0.7679 0.7565
PMGI 1.5738 0.6976 0.9001 0.0340 0.7632 0.7281 1.0989 0.6640 0.8487 0.0146 0.7606 0.7195U2Fusion 1.5946 0.6758 0.8942 0.0800 0.7439 0.7238 1.3551 0.6813 0.8453 0.0671 0.7831 0.7266
Average 1.6261 0.7487 0.8954 0.0060 0.7719 0.7313 1.5888 0.7528 0.8982 0.0109 0.7953 0.7183Ours Softmax 1.5858 0.7568 0.9077 0.0005 0.7945 0.7401 1.5870 0.7505 0.8959 0.0145 0.7836 0.7159
TABLE IVISIBLE AND INFRARED IMAGE FUSION QUANTITATIVE ANALYSIS. THIS TABLE CONTAINS QUANTITATIVE ANALYSIS INDICATORS OF THE TNO AND
ROADSCENE DATASETS.

JOURNAL OF LATEX CLASS FILES, VOL. 14, NO. 8, AUGUST 2015 9
Methods SD EN QS CC VIFF CrossEntropy SSIM FMIpixel MI Nabf
GFF 50.1114 7.2605 0.9167 0.9545 0.7699 0.0634 0.8147 0.8867 14.5211 0.0115LPSR 50.6157 7.2640 0.9185 0.9557 0.8102 0.0672 0.8154 0.8845 14.5279 0.0731
MFCNN 50.2571 7.2538 0.9127 0.9544 0.7699 0.0643 0.8134 0.8870 14.5075 0.0015densefuse 52.6174 7.2882 0.8875 0.9671 0.7781 0.5948 0.8382 0.8744 14.5765 0.0110IFCNN 49.7551 7.2384 0.9112 0.9600 0.7742 0.0779 0.8300 0.8735 14.4768 0.0762
Max 60.6446 7.5239 0.9176 0.9870 0.8086 0.0242 0.8802 0.8911 15.0478 0.0101Ours Softmax 60.3025 7.5252 0.9182 0.9871 0.8020 0.0278 0.8818 0.8911 15.0504 0.0103
TABLE IIMULTI-FOCUS IMAGE FUSION QUANTITATIVE ANALYSIS. THIS TABLE CONTAINS QUANTITATIVE ANALYSIS INDICATORS OF THE LYTRO DATASETS.
are performed on an NVIDIA Geforce GTX1080 GPU and3.60GHz Intel Core i7-6850K with 64GB of memory. PPTuses fewer computing resources, it can use 8GB GPU mem-ory to process 512-size images, which is parsimonious thanclassical Transformers.
C. Qualitative and Quantitative Analysis
We conduct qualitative and quantitative experiments to vali-date the effectivenes. We apply the PPT module to imagefusion, compare with the stat of the art methods, and userelevant indicators to analyze the quality of image fusion.
We compare PPT Fusion with state-of-the-a methods con-tain traditional, auto-encoder based and end-to-end basedmethods, such as Cross Bilateral Filter fusion method (CBF)[52], Curvelet Transform (CVT) [53], Dual-Tree ComplexWavelet Transform (DTCWT) [54], Gradient Transfer(GTF)[55], Multi-resolution Singular Value Decomposition (MSVD)[56], Ratio of Low-pass Pyramid (RP) [57], Deepfuse [36],DenseFuse [37], Guided Filtering Fusion (GFF) [58], LaplacePyramid Sparse Representation (LPSR) [59], MFCNN [60],IFCNN [43], FusionGan [40], MDLatLRR [32], DDcGan[61], ResNetFusion [62], NestFuse [38], FusionDN [47],HybridMSD [63], PMGI [64], multi-exposure image fusion[65], Guided Filter focus region detection (GFDF) [66] andU2Fusion [67] respectively.
We also exploit related indicators to quantitatively evaluatethe fusion image quality, with different appropriate indica-tors being used for different tasks, namely Sum of Corre-lation Coefficients (SCD) [68], Structural SIMilarity (SSIM)[69], pixel feature mutual information(FMIpixel) [70], Nabf
[71], QS [72], correlation coefficient (CC) [73], Entropy(EN)[74], Visual Information Fidelity(VIFF) [75], Cross Entropy[71], Mutual Information (MI) [76], Fast Mutual Information(FMIw and FMIdct) [70], modified structural similarity(MS-SSIM) [77],Nabf [71], Visual Information Fidelity (VIF)[78],Standard Deviation of Image (SD) [79], Revised MutualInformation (QMI) [80], Nonlinear Correlation InformationEntropy (QNCIE) [81] and Phase Congruency Measurement(QP) [82].
In particular, SCD and CC calculates the correlation coeffi-cients between images. SSIM and QS calculate the similaritybetween images. FMIpixel calculate the mutual informationbetween features. Nabf represents the ratio of noise addedto the final image. EN measure the amount of information.VIFF is used to measure the loss of image information to the
distortion process. Cross Entropy and MI measure the degreeof information correlation between images. Among them, thelower the value of the Nab/f and the Cross Entropy andthe higher other values, the better the fusion quality of theapproach.
1) Visible and Infrared Image Fusion: As shown in Fig.9, we report the results of all approaches and highlight somespecific local areas. It can be seen that the fusion result of ourPPT Fusion retains the necessary person radiation information.The global semantic feature of our results is more obvious,that is, the contrast between the sky and the house. Afterhighlighting the details of the branches, our results reflectmore details from both the visible light image and the infraredimage.
As shown in Table. I, the best value in the quality tableis made the bold red font in italic, and the second-best valueis in the bold black font in italic. It can be seen that PPTFusion rank in top 2 in multiple indicators. Other indicatorsare also better than most methods. It can be demonstrated thatPPT Fusion maintains a effective structural similarity with thesource images, preserving a large information correlation withthe source images, without introducing noise, artifacts, etc.
2) Multi-focus Image Fusion: As shown in Fig. 12, wereport the results of all approaches and highlight some specificlocal areas.
From Table II, we can see that PPT Fusion can rank in top2 in all indicators. This shows that the fusion image of PPTFusion effectively extract the source details while making thegenerated image clear enough.
3) Medical Image Fusion: As shown in Fig. 11, we reportthe results of all approaches and highlight some specific localareas. The texture structure information of MRI and the colordistribution information of PET are both very important. It canbe seen that our results not only retain the color distribution,but also significantly retain the texture information. The resultsof other methods lose a lot of MRI information.
As shown in Table. III, the best value in the quality table ismade the bold red font in italic, and the second-best value isin the bold black font in italic. It can be seen that PPT Fusionrank in top 2 in all indicators. Other indicators are also betterthan most methods.
4) Multi-exposure Image Fusion: Both over-exposed andunder-exposed information are incorrect. Our results do notlook as bright as other methods, but they actually retainmore detailed information. For example, the contrast betweenflowers and trees, the texture of weeds, and the distribution

JOURNAL OF LATEX CLASS FILES, VOL. 14, NO. 8, AUGUST 2015 10
Methods SCD FMIw FMIdct SSIM MS-SSIM Nabf VIF SD QMI QS QNCIE MI CC VIFF QP
PMGI 0.4087 0.1778 0.1468 0.1396 0.5801 0.0249 0.2634 52.7224 0.4978 0.1678 0.8048 2.2892 0.8613 0.1660 0.0574U2Fusion 0.4754 0.2154 0.1712 0.2005 0.5696 0.0191 0.3018 57.6757 0.5786 0.2102 0.8052 2.4827 0.8718 0.1840 0.0646IFCNN 0.4887 0.2149 0.1424 0.5780 0.6090 0.0309 0.3351 64.2122 0.5735 0.5399 0.8051 2.4056 0.8625 0.2029 0.0602
DCHWT 0.4187 0.1607 0.1486 0.5531 0.6085 0.0222 0.2919 56.6969 0.4911 0.5243 0.8046 2.2234 0.8634 0.1878 0.0624CSR 0.4219 0.2071 0.1386 0.5629 0.5902 0.0299 0.2871 55.2012 0.5144 0.5309 0.8046 2.2151 0.8529 0.1731 0.0489CBF 0.4459 0.2157 0.1472 0.5695 0.6012 0.0291 0.2983 56.2595 0.5471 0.5374 0.8048 2.2932 0.8574 0.1836 0.0536
Average 0.9100 0.2180 0.1461 0.5833 0.6106 0.0196 0.2936 67.2116 0.6007 0.5445 0.8054 2.5538 0.8833 0.2130 0.0519Ours Max 0.9661 0.2219 0.1705 0.5924 0.6134 0.0187 0.3236 66.5805 0.6133 0.5476 0.8055 2.6003 0.8875 0.2129 0.0633
TABLE IIIMEDICAL IMAGE FUSION QUANTITATIVE ANALYSIS. THIS TABLE CONTAINS QUANTITATIVE ANALYSIS INDICATORS OF THE HARVARD MEDICAL IMAGE
DATASETS.
Near-Focus Far-Focus (a) GFF
(b) LPSR (c) MFCNN (d) DenseFuse
(e) IFCNN (f) Ours-Max (g)Ours-SoftMax
Fig. 10. Comparison of PPT Fusion result with five state-of-the-art methodson one pair of multi-focus image in the Lytro dataset.
and shape of clouds in the sky. Other methods tend to retainthe over-exposed information, resulting in unclear details.
Methods Nabf QMI QNCIE MI QP QCB
U2Fusion 0.1107 0.7651 0.8188 4.9059 0.6950 0.4505GFDF 0.0476 0.9034 0.8276 6.0607 0.5276 0.4645PMGI 0.1076 0.8772 0.8232 5.7564 0.0000 0.4597IFCNN 0.0585 0.7714 0.8188 4.9013 0.7147 0.3740
DeepFuse 0.0371 1.0276 0.8125 7.1086 0.7648 0.4122FMMEF 0.0212 0.4972 0.8143 3.3467 0.0000 0.4573
GFF 0.0290 0.7246 0.8236 4.9657 0.0000 0.4749Max 0.0162 1.0355 0.8289 6.6366 0.7161 0.4829Ours Softmax 0.0203 1.0360 0.8290 6.6598 0.7190 0.4784
TABLE IVMULTI-EXPOSURE IMAGE FUSION QUANTITATIVE ANALYSIS. THIS TABLE
CONTAINS QUANTITATIVE ANALYSIS INDICATORS OF THEMULTI-EXPOSURE IMAGE DATASETS.
As shown in Table. IV, the best value in the quality table ismade the bold red font in italic, and the second-best value isin the bold black font in italic. It can be seen that PPT Fusionrank in top 2 in all indicators. Other indicators are also betterthan most methods.
D. Results Analysis
In the subjective comparison of fused images, it can beclearly seen that the PPT fusion results exhibit more contrastinformation, such as TNO infrared visible light images, med-ical images and multi-exposure images. The self-attention inPatch Transformer combined with Pyramid Transformer canobtain the context information of each pixel of the imagefrom the long-range perception. This helps to maintain theconsistency of the same semantic object, and to distinguishthe foreground object from the background significantly. Atthe same time, just like convolution, Patch Transformer withminimum receptive field focuses on extracting the texturestructure of the image. So that the PPT fusion results preservesufficient detailed information. The details of the object aremore clear in the obvious contrast environment. Quantitativeindicators of our method show that our PPT results containmore information, texture details, stronger contrast, and ahigher similarity with the source image with less distortionor artifacts, verifying the effectiveness of the PPT networkstructure.
After training on about 80,000 pictures with 10GB memory,PPT model can be used for several different image fusiontasks. The training difficulty is much lower than other Trans-former model. PPT can be used without retraining, it hasstrong generalization. Although our PPT model cannot get thefirst place in all tasks. PPT can decompose image featureswell and perform feature fusion in the feature space. We thinkPPT feature extraction ability can be used successfully in otherlow-level vision tasks.
VI. CONCLUSION
In this study, we propose a feature extraction modulethat uses Fully-Transformer, termed as the Pyramid PatchTransformer (PPT) module. First, the Patch Transformer weproposed can not only perceive the local features of the image,but also perceive non-local context information. Second, wepropose the Pyramid Transformer with transformer receptivefield to extract texture information and context informationfrom images. The PPT module can map images into a set ofmulti-scale, multi-dimensional, and multi-angle features. Wesuccessfully apply the PPT module to different image fusiontasks and achieve the state-of-the-art. This proves that usinga Fully-Transformer and designing a reasonably structure canrepresent the image features with its extracted local featuresand global features, demonstrating the effectiveness and uni-versality of the PPT module. We use image fusion to verify the

JOURNAL OF LATEX CLASS FILES, VOL. 14, NO. 8, AUGUST 2015 11
MRI PET (a) CBF (b) DCHWT (c) IFCNN
(d) PMGI (e) FusionDN (f) U2Fusion (g) Ours-Average (h) Ours-Softmax
Fig. 11. Comparison of PPT Fusion result with 6 state-of-the-art methods on one pair of medical image in the Harvard Medical Image dataset.
Over-exposed Under-exposed (a) FMMEF (b) GFDF (c) FusionDN
(d) IFCNN (e) PMGI (f) U2Fusion (g) Ours-Max (h) Ours-Softmax
Fig. 12. Comparison of PPT Fusion result with 6 state-of-the-art methods on one pair of multi-exposure image in the HDR dataset.
feasibility of PPT in the low-level vision applications. How-ever, high-level visual tasks such as classification, detection,segmentation are not considered. Just as ViT can only handleadvanced semantic visual tasks, PPT is typically designedfor low-level visual tasks. We believe that the propsoed PPTmodule has reference significance for low-level vision tasksand image generation tasks.
REFERENCES
[1] J. Devlin, M.-W. Chang, K. Lee, and K. Toutanova, “Bert: Pre-trainingof deep bidirectional transformers for language understanding,” arXivpreprint arXiv:1810.04805, 2018.
[2] A. Radford, J. Wu, R. Child, D. Luan, D. Amodei, and I. Sutskever,“Language models are unsupervised multitask learners,” OpenAI blog,vol. 1, no. 8, p. 9, 2019.
[3] Z. Dai, Z. Yang, Y. Yang, J. Carbonell, Q. V. Le, and R. Salakhutdi-nov, “Transformer-xl: Attentive language models beyond a fixed-lengthcontext,” arXiv preprint arXiv:1901.02860, 2019.
[4] Q. Chen, H. Zhao, W. Li, P. Huang, and W. Ou, “Behavior sequencetransformer for e-commerce recommendation in alibaba,” in Proceedingsof the 1st International Workshop on Deep Learning Practice for High-Dimensional Sparse Data, 2019, pp. 1–4.
[5] W. Song, C. Shi, Z. Xiao, Z. Duan, Y. Xu, M. Zhang, and J. Tang,“Autoint: Automatic feature interaction learning via self-attentive neuralnetworks,” in Proceedings of the 28th ACM International Conferenceon Information and Knowledge Management, 2019, pp. 1161–1170.
[6] C. Pei, Y. Zhang, Y. Zhang, F. Sun, X. Lin, H. Sun, J. Wu, P. Jiang,J. Ge, W. Ou et al., “Personalized re-ranking for recommendation,” inProceedings of the 13th ACM Conference on Recommender Systems,2019, pp. 3–11.
[7] A. Dosovitskiy, L. Beyer, A. Kolesnikov, D. Weissenborn, X. Zhai,T. Unterthiner, M. Dehghani, M. Minderer, G. Heigold, S. Gelly et al.,“An image is worth 16x16 words: Transformers for image recognitionat scale,” arXiv preprint arXiv:2010.11929, 2020.
[8] X. Zhu, W. Su, L. Lu, B. Li, X. Wang, and J. Dai, “Deformable detr:Deformable transformers for end-to-end object detection,” arXiv preprintarXiv:2010.04159, 2020.
[9] S. Zheng, J. Lu, H. Zhao, X. Zhu, Z. Luo, Y. Wang, Y. Fu, J. Feng,T. Xiang, P. H. Torr et al., “Rethinking semantic segmentation froma sequence-to-sequence perspective with transformers,” arXiv preprintarXiv:2012.15840, 2020.
[10] X. Pan, Z. Xia, S. Song, L. E. Li, and G. Huang, “3d object detectionwith pointformer,” arXiv preprint arXiv:2012.11409, 2020.
[11] Y. Jiang, S. Chang, and Z. Wang, “Transgan: Two transformers can makeone strong gan,” arXiv preprint arXiv:2102.07074, 2021.
[12] T.-Y. Lin, M. Maire, S. Belongie, J. Hays, P. Perona, D. Ramanan,P. Dollar, and C. L. Zitnick, “Microsoft coco: Common objects incontext,” in European conference on computer vision. Springer, 2014,pp. 740–755.
[13] J. Deng, W. Dong, R. Socher, L.-J. Li, K. Li, and L. Fei-Fei, “Imagenet:A large-scale hierarchical image database,” in 2009 IEEE conference oncomputer vision and pattern recognition. Ieee, 2009, pp. 248–255.
[14] Z. Xie, Y. Lin, Z. Yao, Z. Zhang, Q. Dai, Y. Cao, and H. Hu,“Self-supervised learning with swin transformers,” arXiv preprintarXiv:2105.04553, 2021.

JOURNAL OF LATEX CLASS FILES, VOL. 14, NO. 8, AUGUST 2015 12
[15] M. Zhao, K. Okada, and M. Inaba, “Trtr: Visual tracking with trans-former,” arXiv preprint arXiv:2105.03817, 2021.
[16] Z. Wang and H. Delingette, “Attention for image registration (air): anunsupervised transformer approach,” arXiv preprint arXiv:2105.02282,2021.
[17] R. Strudel, R. Garcia, I. Laptev, and C. Schmid, “Segmenter: Trans-former for semantic segmentation,” arXiv preprint arXiv:2105.05633,2021.
[18] M. Chen, A. Radford, R. Child, J. Wu, H. Jun, D. Luan, and I. Sutskever,“Generative pretraining from pixels,” in International Conference onMachine Learning. PMLR, 2020, pp. 1691–1703.
[19] B. Wu, C. Xu, X. Dai, A. Wan, P. Zhang, Z. Yan, M. Tomizuka,J. Gonzalez, K. Keutzer, and P. Vajda, “Visual transformers: Token-based image representation and processing for computer vision,” arXivpreprint arXiv:2006.03677, 2020.
[20] N. Carion, F. Massa, G. Synnaeve, N. Usunier, A. Kirillov, andS. Zagoruyko, “End-to-end object detection with transformers,” inEuropean Conference on Computer Vision. Springer, 2020, pp. 213–229.
[21] G. Amato, L. Ciampi, F. Falchi, C. Gennaro, and N. Messina, “Learningpedestrian detection from virtual worlds,” in International Conferenceon Image Analysis and Processing. Springer, 2019, pp. 302–312.
[22] S. Atito, M. Awais, and J. Kittler, “Sit: Self-supervised vision trans-former,” arXiv preprint arXiv:2104.03602, 2021.
[23] S. Li, X. Kang, L. Fang, J. Hu, and H. Yin, “Pixel-level image fusion: Asurvey of the state of the art,” information Fusion, vol. 33, pp. 100–112,2017.
[24] J. Ma, Y. Ma, and C. Li, “Infrared and visible image fusion methodsand applications: A survey,” Information Fusion, vol. 45, pp. 153–178,2019.
[25] T. Mertens, J. Kautz, and F. Van Reeth, “Exposure fusion: A simpleand practical alternative to high dynamic range photography,” ComputerGraphics Forum, vol. 28, no. 1, pp. 161–171, 2009.
[26] Z. Zhang and R. S. Blum, “A categorization of multiscale-decomposition-based image fusion schemes with a performance studyfor a digital camera application,” Proceedings of the IEEE, vol. 87, no. 8,pp. 1315–1326, 1999.
[27] K. P. Upla, M. V. Joshi, and P. P. Gajjar, “An edge preserving mul-tiresolution fusion: Use of contourlet transform and mrf prior,” IEEETransactions on Geoscience and Remote Sensing, vol. 53, no. 6, pp.3210–3220, 2014.
[28] J.-j. Zong and T.-s. Qiu, “Medical image fusion based on sparse rep-resentation of classified image patches,” Biomedical Signal Processingand Control, vol. 34, pp. 195–205, 2017.
[29] Q. Zhang, Y. Fu, H. Li, and J. Zou, “Dictionary learning method forjoint sparse representation-based image fusion,” Optical Engineering,vol. 52, no. 5, p. 057006, 2013.
[30] Y. Bin, Y. Chao, and H. Guoyu, “Efficient image fusion with ap-proximate sparse representation,” International Journal of Wavelets,Multiresolution and Information Processing, vol. 14, no. 04, p. 1650024,2016.
[31] H. Li and X.-J. Wu, “Multi-focus image fusion using dictionary learningand low-rank representation,” in International Conference on Image andGraphics. Springer, 2017, pp. 675–686.
[32] H. Li, X.-J. Wu, and J. Kittler, “Mdlatlrr: A novel decomposition methodfor infrared and visible image fusion,” IEEE Transactions on ImageProcessing, 2020.
[33] D. P. Bavirisetti, G. Xiao, and G. Liu, “Multi-sensor image fusion basedon fourth order partial differential equations,” in 2017 20th InternationalConference on Information Fusion (Fusion). IEEE, 2017, pp. 1–9.
[34] N. Cvejic, D. Bull, and N. Canagarajah, “Region-based multimodalimage fusion using ica bases,” IEEE Sensors Journal, vol. 7, no. 5,pp. 743–751, 2007.
[35] J. Mou, W. Gao, and Z. Song, “Image fusion based on non-negativematrix factorization and infrared feature extraction,” in 2013 6th In-ternational Congress on Image and Signal Processing (CISP), vol. 2.IEEE, 2013, pp. 1046–1050.
[36] K. R. Prabhakar, V. S. Srikar, and R. V. Babu, “Deepfuse: A deepunsupervised approach for exposure fusion with extreme exposure imagepairs.” in ICCV, 2017, pp. 4724–4732.
[37] H. Li and X.-J. Wu, “Densefuse: A fusion approach to infrared andvisible images,” IEEE Transactions on Image Processing, vol. 28, no. 5,pp. 2614–2623, 2018.
[38] H. Li, X.-J. Wu, and T. Durrani, “Nestfuse: An infrared and visibleimage fusion architecture based on nest connection and spatial/channelattention models,” IEEE Transactions on Instrumentation and Measure-ment, 2020.
[39] Y. Fu and X.-J. Wu, “A dual-branch network for infrared and visibleimage fusion,” arXiv preprint arXiv:2101.09643, 2021.
[40] J. Ma, W. Yu, P. Liang, C. Li, and J. Jiang, “Fusiongan: A generativeadversarial network for infrared and visible image fusion,” InformationFusion, vol. 48, pp. 11–26, 2019.
[41] J. Ma, W. Yu, C. Chen, P. Liang, X. Guo, and J. Jiang, “Pan-gan: Anunsupervised learning method for pan-sharpening in remote sensing im-age fusion using a generative adversarial network,” Information Fusion,2020.
[42] Y. Fu, X.-J. Wu, and T. Durrani, “Image fusion based on generativeadversarial network consistent with perception,” Information Fusion,2021.
[43] Y. Zhang, Y. Liu, P. Sun, H. Yan, X. Zhao, and L. Zhang, “Ifcnn: Ageneral image fusion framework based on convolutional neural network,”Information Fusion, vol. 54, pp. 99–118, 2020.
[44] W. Luo, Y. Li, R. Urtasun, and R. Zemel, “Understanding the effectivereceptive field in deep convolutional neural networks,” in Proceedingsof the 30th International Conference on Neural Information ProcessingSystems, 2016, pp. 4905–4913.
[45] D. Hendrycks and K. Gimpel, “Gaussian error linear units (gelus),” arXivpreprint arXiv:1606.08415, 2016.
[46] A. Toet et al., “Tno image fusion dataset,” Figshare. data, 2014.[47] H. Xu, J. Ma, Z. Le, J. Jiang, and X. Guo, “Fusiondn: A unified densely
connected network for image fusion.” in AAAI, 2020, pp. 12 484–12 491.[48] M. Nejati, S. Samavi, and S. Shirani, “Multi-focus image fusion using
dictionary-based sparse representation,” Information Fusion, vol. 25, pp.72–84, 2015.
[49] Harvard, “[online],” http://www.med.harvard.edu/Aanlib/.[50] J. Cai, S. Gu, and L. Zhang, “Learning a deep single image contrast
enhancer from multi-exposure images,” IEEE Transactions on ImageProcessing, vol. 27, no. 4, pp. 2049–2062, 2018.
[51] D. P. Kingma and J. Ba, “Adam: A method for stochastic optimization,”arXiv: Learning, 2014.
[52] B. S. Kumar, “Image fusion based on pixel significance using crossbilateral filter,” Signal, image and video processing, vol. 9, no. 5, pp.1193–1204, 2015.
[53] F. Nencini, A. Garzelli, S. Baronti, and L. Alparone, “Remote sensingimage fusion using the curvelet transform,” Information fusion, vol. 8,no. 2, pp. 143–156, 2007.
[54] J. J. Lewis, R. J. Callaghan, S. G. Nikolov, D. R. Bull, and N. Cana-garajah, “Pixel-and region-based image fusion with complex wavelets,”Information fusion, vol. 8, no. 2, pp. 119–130, 2007.
[55] J. Ma, C. Chen, C. Li, and J. Huang, “Infrared and visible image fusionvia gradient transfer and total variation minimization,” InformationFusion, vol. 31, pp. 100–109, 2016.
[56] V. Naidu, “Image fusion technique using multi-resolution singular valuedecomposition,” Defence Science Journal, vol. 61, no. 5, p. 479, 2011.
[57] A. Toet, “Image fusion by a ration of low-pass pyramid.” PatternRecognition Letters, vol. 9, no. 4, pp. 245–253, 1989.
[58] S. Li, X. Kang, and J. Hu, “Image fusion with guided filtering,” IEEETransactions on Image processing, vol. 22, no. 7, pp. 2864–2875, 2013.
[59] Y. Liu, S. Liu, and Z. Wang, “A general framework for image fusionbased on multi-scale transform and sparse representation,” Informationfusion, vol. 24, pp. 147–164, 2015.
[60] Y. Liu, X. Chen, H. Peng, and Z. Wang, “Multi-focus image fusion witha deep convolutional neural network,” Information Fusion, vol. 36, pp.191–207, 2017.
[61] J. Ma, H. Xu, J. Jiang, X. Mei, and X. Zhang, “Ddcgan: A dual-discriminator conditional generative adversarial network for multi-resolution image fusion,” IEEE Transactions on Image Processing,vol. 29, pp. 4980–4995, 2020.
[62] J. Ma, P. Liang, W. Yu, C. Chen, X. Guo, J. Wu, and J. Jiang, “Infraredand visible image fusion via detail preserving adversarial learning,”Information Fusion, vol. 54, pp. 85–98, 2020.
[63] Z. Zhou, B. Wang, S. Li, and M. Dong, “Perceptual fusion of infraredand visible images through a hybrid multi-scale decomposition withgaussian and bilateral filters,” Information Fusion, vol. 30, pp. 15–26,2016.
[64] H. Zhang, H. Xu, Y. Xiao, X. Guo, and J. Ma, “Rethinking the imagefusion: A fast unified image fusion network based on proportionalmaintenance of gradient and intensity.” in AAAI, 2020, pp. 12 797–12 804.
[65] H. Li, K. Ma, H. Yong, and L. Zhang, “Fast multi-scale structural patchdecomposition for multi-exposure image fusion,” IEEE Transactions onImage Processing, vol. 29, pp. 5805–5816, 2020.

JOURNAL OF LATEX CLASS FILES, VOL. 14, NO. 8, AUGUST 2015 13
[66] X. Qiu, M. Li, L. Zhang, and X. Yuan, “Guided filter-based multi-focusimage fusion through focus region detection,” Signal Processing: ImageCommunication, 2019.
[67] H. Xu, J. Ma, J. Jiang, X. Guo, and H. Ling, “U2fusion: A unifiedunsupervised image fusion network,” IEEE Transactions on PatternAnalysis and Machine Intelligence, 2020.
[68] V. Aslantas and E. Bendes, “A new image quality metric for imagefusion: the sum of the correlations of differences,” Aeu-internationalJournal of electronics and communications, vol. 69, no. 12, pp. 1890–1896, 2015.
[69] Z. Wang, A. C. Bovik, H. R. Sheikh, and E. P. Simoncelli, “Imagequality assessment: from error visibility to structural similarity,” IEEEtransactions on image processing, vol. 13, no. 4, pp. 600–612, 2004.
[70] M. Haghighat and M. A. Razian, “Fast-fmi: non-reference image fusionmetric,” in 2014 IEEE 8th International Conference on Application ofInformation and Communication Technologies (AICT). IEEE, 2014,pp. 1–3.
[71] B. S. Kumar, “Multifocus and multispectral image fusion based on pixelsignificance using discrete cosine harmonic wavelet transform,” Signal,Image and Video Processing, vol. 7, no. 6, pp. 1125–1143, 2013.
[72] Z. Liu, E. Blasch, Z. Xue, J. Zhao, R. Laganiere, and W. Wu, “Objec-tive assessment of multiresolution image fusion algorithms for contextenhancement in night vision: a comparative study,” IEEE transactionson pattern analysis and machine intelligence, vol. 34, no. 1, pp. 94–109,2011.
[73] S. Han, H. Li, H. Gu et al., “The study on image fusion for high spatialresolution remote sensing images,” Int. Arch. Photogramm. Remote Sens.Spat. Inf. Sci. XXXVII. Part B, vol. 7, pp. 1159–1164, 2008.
[74] J. W. Roberts, J. A. van Aardt, and F. B. Ahmed, “Assessment ofimage fusion procedures using entropy, image quality, and multispectralclassification,” Journal of Applied Remote Sensing, vol. 2, no. 1, p.023522, 2008.
[75] Y. Han, Y. Cai, Y. Cao, and X. Xu, “A new image fusion performancemetric based on visual information fidelity,” Information Fusion, vol. 14,no. 2, pp. 127–135, 2013.
[76] H. Peng, F. Long, and C. Ding, “Feature selection based on mu-tual information criteria of max-dependency, max-relevance, and min-redundancy,” IEEE Transactions on Pattern Analysis and MachineIntelligence, vol. 27, no. 8, pp. 1226–1238, 2005.
[77] K. Ma, K. Zeng, and Z. Wang, “Perceptual quality assessment formulti-exposure image fusion,” IEEE Transactions on Image Processing,vol. 24, no. 11, pp. 3345–3356, 2015.
[78] H. R. Sheikh and A. C. Bovik, “Image information and visual quality,”IEEE Transactions on Image Processing, vol. 15, no. 2, pp. 430–444,2006.
[79] Y.-J. Rao, “In-fibre bragg grating sensors,” Measurement science andtechnology, vol. 8, no. 4, p. 355, 1997.
[80] N. Cvejic, C. N. Canagarajah, and D. Bull, “Image fusion metric basedon mutual information and tsallis entropy,” Electronics Letters, vol. 42,no. 11, pp. 626–627, 2006.
[81] Q. Wang, Y. Shen, and J. Jin, “Performance evaluation of image fusiontechniques,” Image fusion: algorithms and applications, vol. 19, pp.469–492, 2008.
[82] J. Zhao, R. Laganiere, and L. Zheng, “Performance assessment ofcombinative pixel-level image fusion based on an absolute feature mea-surement,” International Journal of Innovative Computing Information& Control Ijicic, vol. 3, no. 6, 2006.
Yu Fu received the M.S. degree from JiangnanUniversity, China and A.B. degree from North ChinaInstitute Of Science And Technology, China. He iscurrently a Master student in the Jiangsu ProvincialEngineerinig Laboratory of Pattern Recognition andComputational Intelligence, Jiangnan University. Hisresearch interests include image fusion, machinelearning and deep learning.
Tianyang Xu received the B.Sc. degree in electronicscience and engineering from Nanjing University,Nanjing, China, in 2011. He received the PhD degreeat the School of Artificial Intelligence and ComputerScience, Jiangnan University, Wuxi, China, in 2019.He was a research fellow at the Centre for Vision,Speech and Signal Processing (CVSSP), Universityof Surrey, Guildford, United Kingdom, from 2019to 2021. He is currently an Associate Professor atthe School of Artificial Intelligence and ComputerScience, Jiangnan University, Wuxi, China. His re-
search interests include visual tracking and deep learning. He has publishedseveral scientific papers, including IJCV, ICCV, TIP, TIFS, TKDE, TMM,TCSVT etc. He achieved top 1 tracking performance in several competitions,including the VOT2018 public dataset (ECCV18), VOT2020 RGBT challenge(ECCV20), and Anti-UAV challenge (CVPR20).
XiaoJun Wu received the B.Sc. degree in mathemat-ics from Nanjing Normal University, Nanjing, China,in 1991, and the M.S. and Ph.D. degrees in patternrecognition and intelligent system from the NanjingUniversity of Science and Technology, Nanjing, in1996 and 2002, respectively
From 1996 to 2006, he taught at the School ofElectronics and Information, Jiangsu University ofScience and Technology, where he was promoted toa Professor. He was a Fellow of the InternationalInstitute for Software Technology, United Nations
University, from 1999 to 2000. He was a Visiting Researcher with the Centrefor Vision, Speech, and Signal Processing (CVSSP), University of Surrey,U.K., from 2003 to 2004. Since 2006, he has been with the School of Infor-mation Engineering, Jiangnan University, where he is currently a Professorof pattern recognition and computational intelligence. His current researchinterests include pattern recognition, computer vision, and computationalintelligence. He has published over 300 articles in his fields of research. Hewas a recipient of the Most Outstanding Postgraduate Award from the NanjingUniversity of Science and Technology.
Josef Kittler (Life Member, IEEE) received theB.A., Ph.D., and D.Sc. degrees from the Universityof Cambridge, in 1971, 1974, and 1991, respec-tively.
He is currently a Distinguished Professor of ma-chine intelligence at Centre for Vision, Speech andSignal Processing, University of Surrey, Guildford,U.K. He conducts research on biometrics, video andimage database retrieval, medical image analysis,and cognitive vision. He published the textbookPattern Recognition: A Statistical Approach and over
700 scientific papers. His publications have been cited over 60,000 times(Google Scholar). He is a Series Editor of Lecture Notes in Computer Science(Springer). He currently serves on the Editorial Boards of Pattern RecognitionLetters, International Journal of Pattern Recognition and Artificial Intelligence,and Pattern Analysis and Applications. He has also served as a member of theEditorial Board for the IEEE TRANSACTIONS ON PATTERN ANALYS ISAND MACHINE INTELLIGENCE from 1982 to 1985. He served on theGoverning Board of the International Association for Pattern Recognition(IAPR), as one of the two British representatives, from 1982 to 2005, andthe President of the IAPR from 1994 to 1996.