journal of lightwave technology, vol. 28, no. 1, …
TRANSCRIPT

JOURNAL OF LIGHTWAVE TECHNOLOGY, VOL. 28, NO. 1, JANUARY 1, 2010 79
Filter Design for SOA-Assisted SS-WDM SystemsUsing Parallel Multicanonical Monte Carlo
Amirhossein Ghazisaeidi, Francesco Vacondio, and Leslie Ann Rusch, Fellow, IEEE
Abstract—We address design and optimization of optical filtersfor spectrum-sliced wavelength division multiplexed (SS-WDM)systems employing saturated semiconductor optical amplifiers(SOAs) to suppress intensity noise. We study the impact of theshape of both slicing and channel selecting optical filters vis-à-vistwo important impairments: the filtering effect and the crosstalk.The quantification of bit error rate (BER) is made possible bya parallel implementation of the multicanonical Monte Carloalgorithm. The intensity noise suppression by the SOA and signaldegradation by subsequent optical filtering are studied bothnumerically and experimentally. We find optical filter shape andbandwidth that minimizes BER.
By varying channel spacing and width, we estimate the achiev-able spectral efficiency when using both noise-cleaning SOA andforward error correction. We show that when constrained to usea symmetric architecture, i.e., identical filters for both slicing andchannel selecting filters, there is a degradation in achievable spec-tral efficiency. We show that noise suppression is robust to varia-tions in relative channel powers in multichannel systems. Our nu-merical simulations, vetted experimentally, provide accurate andquantitative results on optimized system performance.
Index Terms—Forward error correction (FEC), noise sup-pression, modeling, multicanoncial monte carlo, parallel, SOA,SS-WDM.
I. INTRODUCTION
S PECTRUM-SLICED wavelength division multiplexing(SS-WDM) is an important candidate for future (metro
or access) all-optical networks due to its low cost. Unliketraditional WDM using an array of highly stabilized lasers,SS-WDM employs a shared thermal-like broadband source[1]–[3]. However, the incoherent nature of the light source inSS-WDM systems significantly curtails system performance,as bit error rate (BER) floors are induced by the excess intensitynoise of the thermal source [4]. For example, at 2.5 Gb/s over a21 GHz slice width, a BER floor is reported in [5] fora single-user experiment.
Researchers have suggested various suppression schemes tomitigate intensity noise in SS-WDM systems [6]–[15]. Amongthe proposed methods, placing a saturated semiconductor op-tical amplifier (SOA) after the spectrum-sliced source, and be-fore the modulator, is an attractive all-optical signal processing
Manuscript received June 11, 2009; revised September 02, 2009. First pub-lished September 22, 2009; current version published December 16, 2009. Partsof this work are presented in IEEE GLOBECOM2009.
The authors are with Electrical and Computer Engineering Department,Center for Optics, Photonics and Lasers (COPL), Université Laval, Quebec,QC G1V 0A6, Canada (e-mail: [email protected]).
Digital Object Identifier 10.1109/JLT.2009.2032428
technique due to its efficiency, low complexity, cost-efficiency,and integrability [9]–[15]. As an example, the BER floor atat 2.5 Gb/s could be lowered to below in the single-channel SOA-based noise suppression experiment, as reportedin [5].
Noise suppression in SOA-assisted SS-WDM is due to thenonlinear operation of the saturated SOA. Various device pa-rameters influence the SOA dynamics, most notably the car-rier lifetime and the saturation power, as well as the loss andthe linewidth enhancement factor, and directly impact the noisecleaning performance [5], [11], [14]. Moreover, it has been ob-served that optical filtering of the noise-suppressed light signifi-cantly degrades noise suppression [5], [13], [14], a phenomenonwhich is referred to as the filtering effect or post-filtering effect.For instance, when a Gaussian slicing filter (SF) of 21 GHz 3 dBbandwidth, and a Gaussian channel selecting filter (CSF) of25 GHz 3 dB bandwidth were used in the single-channel SOA-assisted SS-WDM experiments of [5], the filtering effect de-graded the BER floor of the SOA-assisted system fromto .
Fiber group velocity dispersion (GVD) has a great impact onSS-WDM systems due to the large linewidth of the sliced source[2]. In SOA-assisted SS-WDM the GVD penalty is even higher,since the nonuniform phase profile of the dispersive fiber overthe signal bandwidth induces partial loss of noise suppression[14], [16]. Throughout this work we assume dispersion is fullycompensated.
Theoretical analysis of SOA-assisted SS-WDM systems isprohibitively complex for two reasons: 1) the SOA operatesin the nonlinear regime resulting in highly non-Gaussianlight statistics at its output [5]1, and 2) linear filtering ofthis non-Gaussian process couples phase and amplitude effectsthrough a complex process parameterized by the SOA linewidthenhancement factor. Due to the limitations of the analyticaltreatment of SOA-assisted SS-WDM systems, we resort tonumerical simulations.
We recently proposed a new simulation tool based on the mul-ticanonical Monte Carlo (MMC) method to estimate the condi-tional probability density functions (PDFs) of marks and spacesof optical links containing nonlinear SOAs for both incoherent[5] and coherent applications [19]. In [5] we demonstrated thatthe numerical PDF estimation of the signal at the receiver of asingle-channel SOA-assisted SS-WDM link matches the exper-imental data, and we were able to correctly estimate the mea-sured BERs using our proposed simulator.
1Although analytical approximations based on perturbation theory are avail-able for SOA output light statistics when the input light is coherent light [17],[18], the zero-average property of the incoherent optical field does not allow usto extend those methods.
0733-8724/$26.00 © 2009 IEEE
Authorized licensed use limited to: BIBLIOTHEQUE DE L'UNIVERSITE LAVAL. Downloaded on February 11, 2010 at 13:29 from IEEE Xplore. Restrictions apply.

80 JOURNAL OF LIGHTWAVE TECHNOLOGY, VOL. 28, NO. 1, JANUARY 1, 2010
Fig. 1. The single channel SOA-assisted SS-WDM system; MZM: Mach-Zehnder modulator, PD: photodetector.
We focus on the impact of the shape and bandwidth of opticalfilters in the transmitter (slicing filter SF), and receiver (channelselect filter CSF) on the overall performance of multi-channelSOA-assisted SS-WDM systems. Similar studies for coherentWDM have already appeared in the literature [20].
First we consider continuous-wave (CW) operation of asingle-channel system, and focus on the relative intensity noise(RIN) spectrum of the received signal, and the impact of thefilter shape on the intensity noise. Since CW RIN simulationsare fast, we can obtain a global qualitative picture of how noisesuppression degradation behaves in the filter space, where theonly impairment is the filtering effect. This analysis does notcapture dynamics in the modulated systems, so next we turn toMMC techniques.
In the second step, we choose a limited set of filter shapes(four cases) and estimate both the single-channel and the multi-channel BERs, when SF and CSF are independently varied. Toestimate the BER, we extend the single-channel MMC simulatorreported in [5] to a multi-channel version.
MMC offers a tremendous acceleration of simulation com-pared to conventional Monte Carlo (MC). To reliably estimateBERs as small as by MC, bits should be simulated,whereas using MMC, we can typically get as accurate BER es-timates with only bits. The remarkable speedup by MMCenables us to perform simulations that would need astronomicrun times when using MC. However, in order to develop a prac-tical design and optimization tool for complex optical systems,MMC should be further accelerated. To this end, we introduceda novel parallelized implementation of the MMC (PMMC) [21].
The non-Gaussian nature of noise statistics lead to BER cal-culations from MMC that outperform the simple Q-factor ap-proximation. An Appendix compares published experimentalstudies, and find our simulation results are still in good agree-ment with the published measurements.
Forward error correction (FEC) offers an alternative approachto cope with the BER floor in the SS-WDM [22]. FECs areespecially manageable in the metro-access applications, wherebit-rates are below 10 Gb/s. In SOA-assisted SS-WDM appli-cations we can combine FEC and SOA noise suppression toachieve high spectral efficiency (SE). By varying the channelspacing and channel width, we calculate the optimal spectralefficiency attainable when combining FEC and SOA. We con-sider two scenarios: one where the designer is constrained to useidentical optical filters throughout the network, (a lower cost so-lution), and one where optimal SF and CSF can be used.
The novelty of the present work is threefold: 1) we quantifythe exact BER of multi-channel SOA-assisted SS-WDM sys-tems for the first time, and study the impact of the optical filters,2) we introduce the PMMC, a parallelized implementation of theMMC, and 3) we calculate the optimum spectral efficiency that
we can obtain for SS-WDM. Our numerical simulations, vettedexperimentally, provide accurate and quantitative results on op-timized system performance. The achievable spectral efficiencywhen using both FEC and SOA noise suppression could nothave been found by any analytical or semi-analytical means; ourefficient numerical simulator was a key enabler for this result.In the literature there are many reported improvements due toSOA noise cleaning, but no investigation as to how these exper-imental results compare to the optimum that could be achieved.Experimental results are often limited by equipment on hand;our tools help the designer determine the value of striving to-wards better performance.
The paper is organized as follows. In Section II we discuss theRIN spectra and the excess intensity noise in the CW regime. InSection III we introduce the PMMC simulator. In Section IVwe present the BER results. In Section V we present resultsconcerning the achievable SE by using FEC. In Section VI weconclude. A short discussion of SOA parameters, and the cross-validations of the simulator against published measurements arepresented in the two appendices.
II. INTENSITY NOISE IN THE CW REGIME
Consider our experiment setup for the single-channel SOA-assisted SS-WDM system given in Fig. 1. Our goal in this sec-tion is to study the impact of the choice of SF and CSF on theRIN spectrum of the electrical signal after the photodiode, andon the intensity noise of the signal after the electrical filter atthe receiver. To this end, first we measure the RIN spectrum fora specific pair of SF and CSF, when data modulation is not ap-plied, and use the experimental data to calibrate and validate ourlink simulator. Then we use the link simulator to sweep throughvarious choices of SF and CSF and calculate the resultant inten-sity noise following electrical filtering. The frequency responsesof SF and CSF are independently varied.
A. Experimental Validation of Simulator
In our experiment, we used a broadband source (BBS) with38 nm bandwidth, which was sliced, amplified by an erbium-doped fiber amplifier (EDFA), and sliced again, to provide a
dBm source, enough to drive the SOA into deep saturation.The unpolarized emssion of the BBS source was passed througha polarization beam splitter (PBS), and the stronger PBS outputwas fed through a polarization controller (PC) to the SOA input.The SOA output was coupled to the Mach-Zehnder modulatorthrough a second PC. The EDFA, PBS, and the PCs are notshown in Fig. 1, and the two optical filters in the transmitterside are lumped into the SF block. The two optical filters at thetransmitter, as well as the CSF at the receiver, were identical JDSTB9 filters with a 3 dB bandwidth of 0.24 nm. Since the BBSspectrum was much wider than the filter bandwidths, the BBS
Authorized licensed use limited to: BIBLIOTHEQUE DE L'UNIVERSITE LAVAL. Downloaded on February 11, 2010 at 13:29 from IEEE Xplore. Restrictions apply.

GHAZISAEIDI et al.: SOA-ASSISTED SS-WDM SYSTEMS 81
was modeled as complex white noise over the simulation band-width. The frequency responses of all optical filters were wellmodeled as having a Gaussian profile over their 30 dB band-width; their group delays were flat over the passband. The SOAparameters were the same as those found in [5].
We model optical filters in the frequency domain. Thespectrum-sliced source was implemented with two identical.25 nm bandwidth Gaussian-like optical filters. The equivalentSF model is a single Gaussian filter of 21 GHz 3 dB bandwidth;the CSF has a 25 GHz bandwidth (single filter). The phaseresponse of SF and CSF were assumed flat in simulations.Since we are in the CW regime, any electrical bandwidth ispermissible, but to be consistent with the later BER simulationresults at 5 Gb/s, in our calculations of the intensity noisewe used a 4th-order Bessel-Thompson electrical filter with3.75 GHz 3 dB bandwidth.
We used the Cassioli-Mecozzi SOA model [24] parsing theSOA into 10 sections. We compared estimated PDFs for marksand spaces resulting from the Cassioli-Mecozzi with amplifiedstimulated emission (ASE) and ultrafast terms, and withoutthem (as in [5]); the two predictions coincided. The SOA isdeeply saturated, so ASE is negligible; input optical signalbandwidth is 21 GHz, hence ultrafast features can be neglected.For the balance of this article we neglect ASE and ultrafastterms.
Relative intensity noise (RIN) for a spectrum-sliced source isgiven by
(1)
where represents convolution in the frequency domain,and is the SF frequency response with[23]. The same normalization is used for , the CSFfrequency response. The RIN at the SOA output can be ap-proximated semi-analytically using first-order perturbation inintensity [11]. We validate our numerical model both withexperiment and the perturbation theory approximation.
To measure the intensity noise suppression efficiency, we de-fine the noise suppression ratio (NSR)
(2)
where indicates that the noise cleaning SOA ispresent, but the CSF is absent; is the “post-filtered” casewith a CSF present. Fig. 2 shows the results of measured andsimulated and , as well as the analytical(perturbation theory) approximation of the .
The good match between measured and simulated NSRs inFig. 1 confirms that our link simulator is well-calibrated, andthat it captures the filtering effect. As can be seen in Fig. 1, theRIN attains a minimum at DC: a 14 dB reduction when no CSFis present, and a 6 dB reduction when using a CSF.
All components of the SOA-assisted system, i.e., SF, SOA,CSF, and electrical filter (EF), play a role in determining theoverall performance, and in principle, should be jointly opti-mized to achieve the maximum performance. However, to makethe problem tractable, the focus of our effort in the present paperwill be only on the impact of SF and CSF filter shape and band-width. Details of SOA parameters are given in the Appendix.
Fig. 2. Measured and simulated noise suppression ratios (NSR) of CW inten-sity-smoothed light by the SOA, with and without post-filtering. When post-fil-tering is absent, the analytical approximation is also plotted.
Fig. 3. Contour plots of �������� versus orders of SF and CSF super-Gaussian filters with flat phase response.
B. Impact of SF and CSF on EIN
The excess intensity noise (EIN) of the electrically filteredvoltage at the receiver is defined as [23]
(3)
where stands for expectation. In direct detection, the EIN iscalculated by integrating RIN over the receiver electrical band-width [28]. For a specific choice of SF and CSF, we define theEIN penalty (EINP) as follows
(4)
where is the electrical filter frequency response. Weassume the following general form for the optical filters
(5)
where . We confine our examination to amplituderesponse, and assume linear phase.
Authorized licensed use limited to: BIBLIOTHEQUE DE L'UNIVERSITE LAVAL. Downloaded on February 11, 2010 at 13:29 from IEEE Xplore. Restrictions apply.
82 JOURNAL OF LIGHTWAVE TECHNOLOGY, VOL. 28, NO. 1, JANUARY 1, 2010
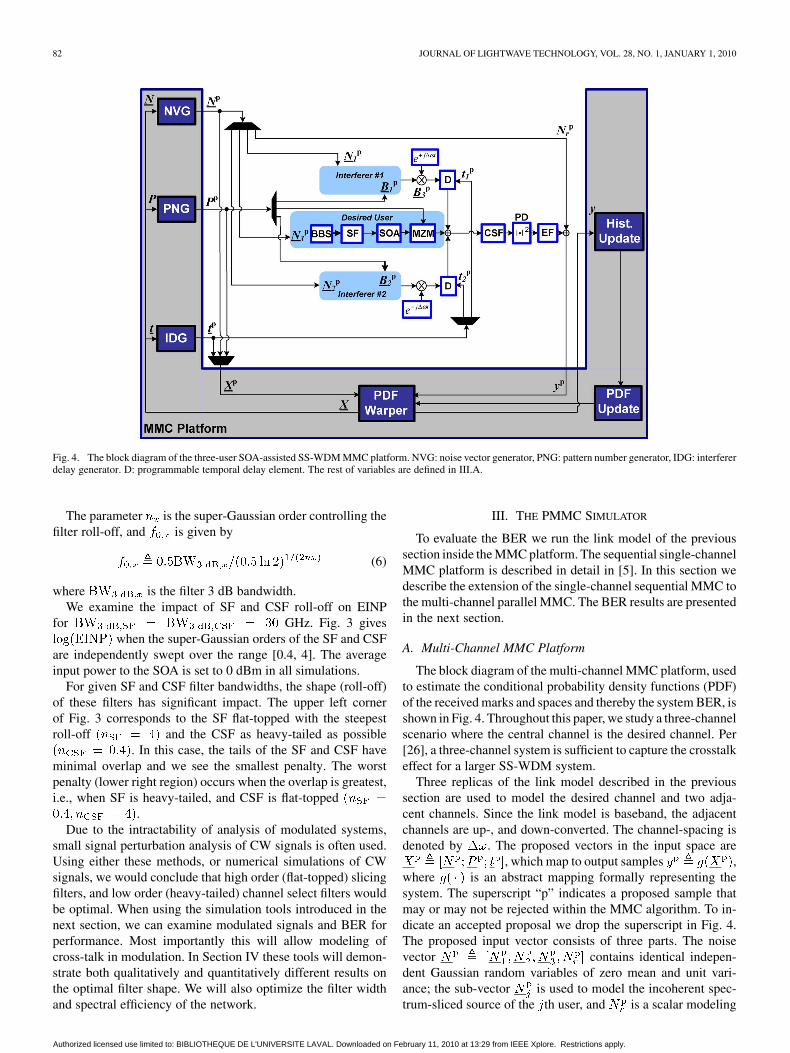
Fig. 4. The block diagram of the three-user SOA-assisted SS-WDM MMC platform. NVG: noise vector generator, PNG: pattern number generator, IDG: interfererdelay generator. D: programmable temporal delay element. The rest of variables are defined in III.A.
The parameter is the super-Gaussian order controlling thefilter roll-off, and is given by
(6)
where is the filter 3 dB bandwidth.We examine the impact of SF and CSF roll-off on EINP
for GHz. Fig. 3 giveswhen the super-Gaussian orders of the SF and CSF
are independently swept over the range [0.4, 4]. The averageinput power to the SOA is set to 0 dBm in all simulations.
For given SF and CSF filter bandwidths, the shape (roll-off)of these filters has significant impact. The upper left cornerof Fig. 3 corresponds to the SF flat-topped with the steepestroll-off and the CSF as heavy-tailed as possible
. In this case, the tails of the SF and CSF haveminimal overlap and we see the smallest penalty. The worstpenalty (lower right region) occurs when the overlap is greatest,i.e., when SF is heavy-tailed, and CSF is flat-topped
.Due to the intractability of analysis of modulated systems,
small signal perturbation analysis of CW signals is often used.Using either these methods, or numerical simulations of CWsignals, we would conclude that high order (flat-topped) slicingfilters, and low order (heavy-tailed) channel select filters wouldbe optimal. When using the simulation tools introduced in thenext section, we can examine modulated signals and BER forperformance. Most importantly this will allow modeling ofcross-talk in modulation. In Section IV these tools will demon-strate both qualitatively and quantitatively different results onthe optimal filter shape. We will also optimize the filter widthand spectral efficiency of the network.
III. THE PMMC SIMULATOR
To evaluate the BER we run the link model of the previoussection inside the MMC platform. The sequential single-channelMMC platform is described in detail in [5]. In this section wedescribe the extension of the single-channel sequential MMC tothe multi-channel parallel MMC. The BER results are presentedin the next section.
A. Multi-Channel MMC Platform
The block diagram of the multi-channel MMC platform, usedto estimate the conditional probability density functions (PDF)of the received marks and spaces and thereby the system BER, isshown in Fig. 4. Throughout this paper, we study a three-channelscenario where the central channel is the desired channel. Per[26], a three-channel system is sufficient to capture the crosstalkeffect for a larger SS-WDM system.
Three replicas of the link model described in the previoussection are used to model the desired channel and two adja-cent channels. Since the link model is baseband, the adjacentchannels are up-, and down-converted. The channel-spacing isdenoted by . The proposed vectors in the input space are
, which map to output samples ,where is an abstract mapping formally representing thesystem. The superscript “p” indicates a proposed sample thatmay or may not be rejected within the MMC algorithm. To in-dicate an accepted proposal we drop the superscript in Fig. 4.The proposed input vector consists of three parts. The noisevector contains identical indepen-dent Gaussian random variables of zero mean and unit vari-ance; the sub-vector is used to model the incoherent spec-trum-sliced source of the th user, and is a scalar modeling
Authorized licensed use limited to: BIBLIOTHEQUE DE L'UNIVERSITE LAVAL. Downloaded on February 11, 2010 at 13:29 from IEEE Xplore. Restrictions apply.

GHAZISAEIDI et al.: SOA-ASSISTED SS-WDM SYSTEMS 83
receiver electrical noise. The noise vectors are generated by aMetropolis-Hastings machine called the noise vector generator(NVG). The proposed bit pattern vector is ,where is the decimal representation of the binary bit patternof the th channel. The bit pattern proposed for the th channelis denoted by [5], [29]. The pattern numbers are proposed bya Metropolis-Hastings machine called the pattern number gen-erator (PNG). The relative delay vector is , which iscomposed of random variables representing the time delays be-tween the desired channel and the adjacent interfering channels.The vector of relative delays is proposed by a Metropolis-Hast-ings machine called the interferer delay generator (IDG). Theeffective memory of the single-user system is assumed to be
bits. To estimate the conditional PDF of marks (spaces)of the desired user, the current bit of the center channel is setto 1 (0), and the past bits are adaptively changed by theMMC platform; therefore is an integer random variable (rv)uniformly distributed between 0 and . and areinteger rvs uniform between 0 and . The relative de-lays and are integer rvs uniform over 0 and , where
is the number of time samples per bit duration.
B. Parallelization of MMC
Conventional MC for PDF estimation of rv’s is “embarrass-ingly” parallelizable, as random samples can be independentlygenerated by different cluster nodes. At the end of the simula-tion, all samples are collected and the histogram is calculatedover all collected samples. In the case of MMC, the proposedsamples are generated by Markov chains (using the Metropolis-Hastings algorithm), a process which is sequential in nature.While at first blush MMC does not appear parallelizable, weshow that, fortunately, this is not the case.
Consider a 1-dimensional input space where sequential MMCis used to estimate the output PDF. During each MMC cycle, theMetropolis-Hastings module of the MMC generates a randomwalk in the 1-dimensional input space. Suppose we periodicallyperturb the random walk in the input space by re-initializingit, as shown in Fig. 5(a). Each random walk is generated bythe same Metropolis-Hastings submodule as before, but at timeinstants , and , we select a new random state inthe input space. The initial states are assumed independent anduniformly distributed over the input space.
The perturbed Markov chain is not statistically equivalent tothe original unperturbed Markov chain, required by the MMCplatform, as the forced jumps induce transients. If, however, theMMC platform discards the transient samples after each forcedjump, the remaining samples of the perturbed Markov chain willlead the MMC to the same solution as the single Markov chaincase. The perturbed random walk provides the transition fromsequential to parallel implementations of the MMC. The gen-eration of each segment of the perturbed random walk can beassigned to a different computing node, as shown in Fig. 5(b),allowing for parallel processing.
During each MMC cycle, all nodes run exactly the same codeto propose new samples, and perform an accept/reject operationaccordingly. At the end of each MMC cycle, all the output sam-ples are collected by a pre-specified head node, the PDF update
Fig. 5. Parallelization of MMC: (a) Random walk in a 1-dimensional inputspace perturbed by periodic re-initializations. (b) Sections of the perturbedMarkov chain are mapped to various computing nodes, (c) the flowchart of theparallel MMC; � counts the MMC cycles, � is the pre-specified number ofcycles, �� is the histogram computed by node � at the end of cycle �.
and smoothing are executed, and the updated PDF is broadcastto all nodes for the next MMC cycle. We call this parallel im-plementation of MMC the PMMC. The flowchart of PMMC isshown in Fig. 5(c). The PMMC follows the paradigm of SPMD(single program multiple data). In [30] another parallel imple-mentation of MMC is introduced; however, as explained by theauthor, the resulting algorithm is a problem-dependent, modi-fied MMC without the important PDF smoothing feature. OurPMMC, on the other hand, is a natural parallelization of theMMC, without any modification to the original algorithm.
Note that even in sequential MMC, we discard transient el-ements at the beginning of each MMC cycle. The length ofthe transient period is problem-dependent, and is fixed duringthe code development and fine-tuning of the simulator. We dis-carded the first 100 samples at the beginning of each MMCcycle per node. We parallelized four cores of a Quad Intel pro-cessor, and obtained a three-fold speedup. The rigorous theoret-ical analysis and optimization of PMMC will be addressed infuture work.
IV. BER RESULTS
We introduce in Fig. 6 the set of filter types to be examined,covering a representative collection of realizable optical filtersbased on the super-Gaussian shape. The filters are labeled asheavy-tailed (HT), Gaussian (GA), S2, and S4. These filters areall super-Gaussian, with orders ,and . The phase response of all filters was assumed to beflat. Each entry of the table in Fig. 6 corresponds to a specificcombination of SF (rows), and CSF (columns) filter types fora three-channel SOA-assisted SS-WDM link. Simulations arerun at Gb/s and channel spacing GHz. Weseparately simulated all sixteen cases. In each simulation, the 3dB bandwidth of the SF, , was set to 30 GHz, and the 3dB bandwidth of the CSF, , was varied from to
, i.e., 30 to 140 GHz. The output of each casewas a 10-point curve of BER versus . The input power
Authorized licensed use limited to: BIBLIOTHEQUE DE L'UNIVERSITE LAVAL. Downloaded on February 11, 2010 at 13:29 from IEEE Xplore. Restrictions apply.

84 JOURNAL OF LIGHTWAVE TECHNOLOGY, VOL. 28, NO. 1, JANUARY 1, 2010
Fig. 6. Left: Table defining (SF, CSF) combinations. SF filter types are distinguished by markers and CSF types are distinguished by line type (also colors).Right: the frequency response of the filter types used for BER simulations; � is the super-Gaussian order.
Fig. 7. BER of the multi-channel system as predicted by PMMC simulations.SF filter types are distinguished by markers and CSF filter types are distin-guished by line type (also color).
to the receiver was fixed to 0 dBm, so that all BER values cor-respond to the intensity-noise limited regime. Markers in Fig. 6distinguish different SFs, whereas color and line-type discrimi-nate CSF types.
Fig. 7 reports results of the multi-channel BER simulationsfor all 16 cases. For each BER point, two MMC simulationswere performed to estimate the conditional PDFs of marks andspaces; the BER was calculated by integrating the overlappingtails of the two conditional PDFs. Each MMC simulation con-sisted of 12 cycles; 50 000 samples were generated per cycle.We assumed bits of effective channel memory. Afterparallelization, each BER point was calculated in 25 minutes. Inorder to better understand the relative importance of filtering ef-fect vis-à-vis crosstalk, simulations were repeated for the single
Fig. 8. BERs of the single-channel system as predicted by PMMC simulations.SF filter types are distinguished by markers and CSF filter types are distin-guished by line type (also color).
channel scenario, with results in Fig. 8. The number of samplesper cycle was raised to 150 000 in order to estimate much lowerBERs; other parameters were unchanged.
The relative importance of the filtering effect vis-à-vis thecrosstalk can be understood by comparing the multi-channelBERs of Fig. 7 to single-channel BERs of Fig. 8. In the multi-channel scenario CSFs with steep roll-offs are fa-vored. In the single-channel case, where the only impairmentis the filtering effect, an optimal (SF, CSF) pair does not exist.The relative performance of (SF, CSF) pairs follow EINP trendsfor the CW analysis, as seen in Fig. 3. At the rightmost pointsof BER curves of Fig. 8, the filtering effect is negligible, as theCSF bandwidth far exceeds that of the SF. In this region theperformance is set by the source intensity noise; smoother SFroll-off results in lower M-factors [4] and thus less noise.
Authorized licensed use limited to: BIBLIOTHEQUE DE L'UNIVERSITE LAVAL. Downloaded on February 11, 2010 at 13:29 from IEEE Xplore. Restrictions apply.
GHAZISAEIDI et al.: SOA-ASSISTED SS-WDM SYSTEMS 85
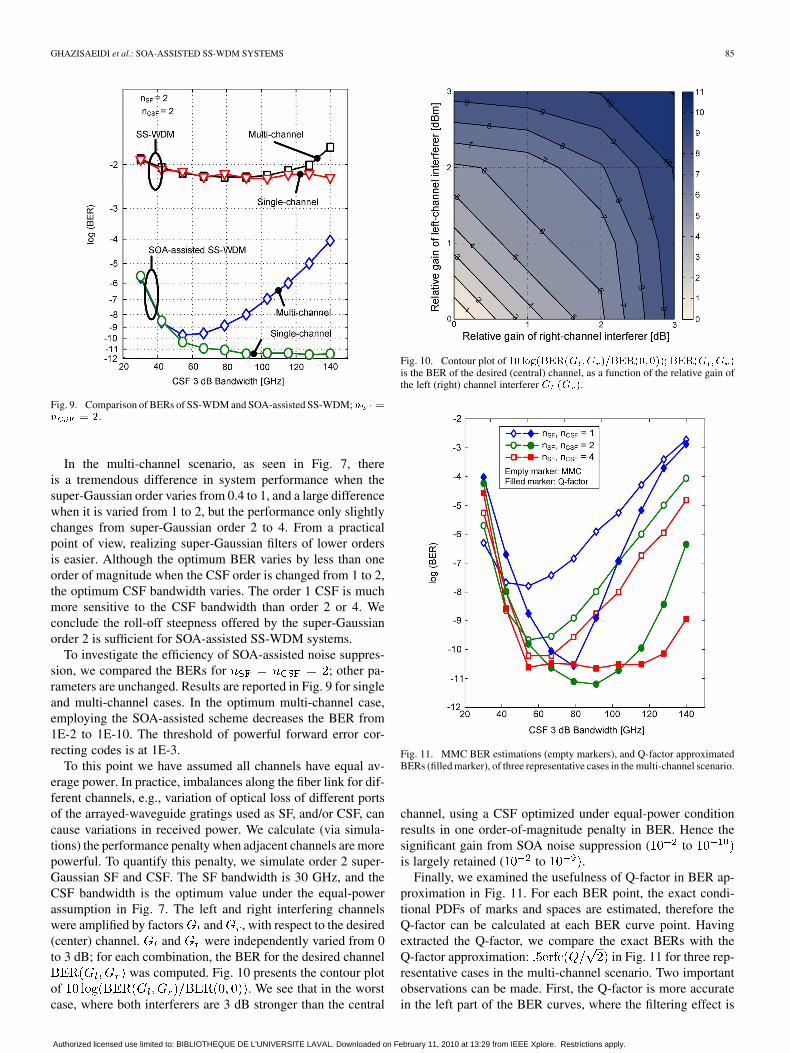
Fig. 9. Comparison of BERs of SS-WDM and SOA-assisted SS-WDM;� �� � �.
In the multi-channel scenario, as seen in Fig. 7, thereis a tremendous difference in system performance when thesuper-Gaussian order varies from 0.4 to 1, and a large differencewhen it is varied from 1 to 2, but the performance only slightlychanges from super-Gaussian order 2 to 4. From a practicalpoint of view, realizing super-Gaussian filters of lower ordersis easier. Although the optimum BER varies by less than oneorder of magnitude when the CSF order is changed from 1 to 2,the optimum CSF bandwidth varies. The order 1 CSF is muchmore sensitive to the CSF bandwidth than order 2 or 4. Weconclude the roll-off steepness offered by the super-Gaussianorder 2 is sufficient for SOA-assisted SS-WDM systems.
To investigate the efficiency of SOA-assisted noise suppres-sion, we compared the BERs for ; other pa-rameters are unchanged. Results are reported in Fig. 9 for singleand multi-channel cases. In the optimum multi-channel case,employing the SOA-assisted scheme decreases the BER from1E-2 to 1E-10. The threshold of powerful forward error cor-recting codes is at 1E-3.
To this point we have assumed all channels have equal av-erage power. In practice, imbalances along the fiber link for dif-ferent channels, e.g., variation of optical loss of different portsof the arrayed-waveguide gratings used as SF, and/or CSF, cancause variations in received power. We calculate (via simula-tions) the performance penalty when adjacent channels are morepowerful. To quantify this penalty, we simulate order 2 super-Gaussian SF and CSF. The SF bandwidth is 30 GHz, and theCSF bandwidth is the optimum value under the equal-powerassumption in Fig. 7. The left and right interfering channelswere amplified by factors and , with respect to the desired(center) channel. and were independently varied from 0to 3 dB; for each combination, the BER for the desired channel
was computed. Fig. 10 presents the contour plotof . We see that in the worstcase, where both interferers are 3 dB stronger than the central
Fig. 10. Contour plot of �� ������� �� ��������� ��� �� �is the BER of the desired (central) channel, as a function of the relative gain ofthe left (right) channel interferer � �� �.
Fig. 11. MMC BER estimations (empty markers), and Q-factor approximatedBERs (filled marker), of three representative cases in the multi-channel scenario.
channel, using a CSF optimized under equal-power conditionresults in one order-of-magnitude penalty in BER. Hence thesignificant gain from SOA noise suppression ( tois largely retained ( to .
Finally, we examined the usefulness of Q-factor in BER ap-proximation in Fig. 11. For each BER point, the exact condi-tional PDFs of marks and spaces are estimated, therefore theQ-factor can be calculated at each BER curve point. Havingextracted the Q-factor, we compare the exact BERs with theQ-factor approximation: in Fig. 11 for three rep-resentative cases in the multi-channel scenario. Two importantobservations can be made. First, the Q-factor is more accuratein the left part of the BER curves, where the filtering effect is
Authorized licensed use limited to: BIBLIOTHEQUE DE L'UNIVERSITE LAVAL. Downloaded on February 11, 2010 at 13:29 from IEEE Xplore. Restrictions apply.
86 JOURNAL OF LIGHTWAVE TECHNOLOGY, VOL. 28, NO. 1, JANUARY 1, 2010
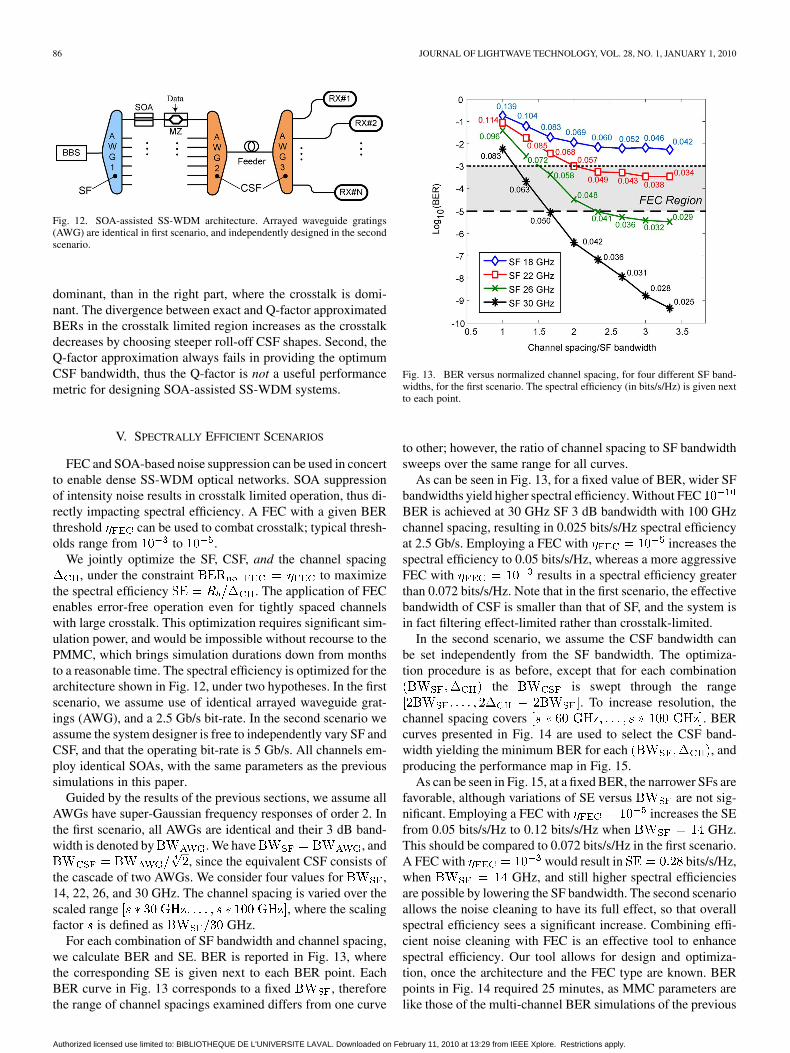
Fig. 12. SOA-assisted SS-WDM architecture. Arrayed waveguide gratings(AWG) are identical in first scenario, and independently designed in the secondscenario.
dominant, than in the right part, where the crosstalk is domi-nant. The divergence between exact and Q-factor approximatedBERs in the crosstalk limited region increases as the crosstalkdecreases by choosing steeper roll-off CSF shapes. Second, theQ-factor approximation always fails in providing the optimumCSF bandwidth, thus the Q-factor is not a useful performancemetric for designing SOA-assisted SS-WDM systems.
V. SPECTRALLY EFFICIENT SCENARIOS
FEC and SOA-based noise suppression can be used in concertto enable dense SS-WDM optical networks. SOA suppressionof intensity noise results in crosstalk limited operation, thus di-rectly impacting spectral efficiency. A FEC with a given BERthreshold can be used to combat crosstalk; typical thresh-olds range from to .
We jointly optimize the SF, CSF, and the channel spacing, under the constraint to maximize
the spectral efficiency . The application of FECenables error-free operation even for tightly spaced channelswith large crosstalk. This optimization requires significant sim-ulation power, and would be impossible without recourse to thePMMC, which brings simulation durations down from monthsto a reasonable time. The spectral efficiency is optimized for thearchitecture shown in Fig. 12, under two hypotheses. In the firstscenario, we assume use of identical arrayed waveguide grat-ings (AWG), and a 2.5 Gb/s bit-rate. In the second scenario weassume the system designer is free to independently vary SF andCSF, and that the operating bit-rate is 5 Gb/s. All channels em-ploy identical SOAs, with the same parameters as the previoussimulations in this paper.
Guided by the results of the previous sections, we assume allAWGs have super-Gaussian frequency responses of order 2. Inthe first scenario, all AWGs are identical and their 3 dB band-width is denoted by . We have , and
, since the equivalent CSF consists ofthe cascade of two AWGs. We consider four values for ,14, 22, 26, and 30 GHz. The channel spacing is varied over thescaled range , where the scalingfactor is defined as GHz.
For each combination of SF bandwidth and channel spacing,we calculate BER and SE. BER is reported in Fig. 13, wherethe corresponding SE is given next to each BER point. EachBER curve in Fig. 13 corresponds to a fixed , thereforethe range of channel spacings examined differs from one curve
Fig. 13. BER versus normalized channel spacing, for four different SF band-widths, for the first scenario. The spectral efficiency (in bits/s/Hz) is given nextto each point.
to other; however, the ratio of channel spacing to SF bandwidthsweeps over the same range for all curves.
As can be seen in Fig. 13, for a fixed value of BER, wider SFbandwidths yield higher spectral efficiency. Without FECBER is achieved at 30 GHz SF 3 dB bandwidth with 100 GHzchannel spacing, resulting in 0.025 bits/s/Hz spectral efficiencyat 2.5 Gb/s. Employing a FEC with increases thespectral efficiency to 0.05 bits/s/Hz, whereas a more aggressiveFEC with results in a spectral efficiency greaterthan 0.072 bits/s/Hz. Note that in the first scenario, the effectivebandwidth of CSF is smaller than that of SF, and the system isin fact filtering effect-limited rather than crosstalk-limited.
In the second scenario, we assume the CSF bandwidth canbe set independently from the SF bandwidth. The optimiza-tion procedure is as before, except that for each combination
the is swept through the range. To increase resolution, the
channel spacing covers . BERcurves presented in Fig. 14 are used to select the CSF band-width yielding the minimum BER for each , andproducing the performance map in Fig. 15.
As can be seen in Fig. 15, at a fixed BER, the narrower SFs arefavorable, although variations of SE versus are not sig-nificant. Employing a FEC with increases the SEfrom 0.05 bits/s/Hz to 0.12 bits/s/Hz when GHz.This should be compared to 0.072 bits/s/Hz in the first scenario.A FEC with would result in bits/s/Hz,when GHz, and still higher spectral efficienciesare possible by lowering the SF bandwidth. The second scenarioallows the noise cleaning to have its full effect, so that overallspectral efficiency sees a significant increase. Combining effi-cient noise cleaning with FEC is an effective tool to enhancespectral efficiency. Our tool allows for design and optimiza-tion, once the architecture and the FEC type are known. BERpoints in Fig. 14 required 25 minutes, as MMC parameters arelike those of the multi-channel BER simulations of the previous
Authorized licensed use limited to: BIBLIOTHEQUE DE L'UNIVERSITE LAVAL. Downloaded on February 11, 2010 at 13:29 from IEEE Xplore. Restrictions apply.

GHAZISAEIDI et al.: SOA-ASSISTED SS-WDM SYSTEMS 87
Fig. 14. All BER curves estimated by PMMC during the SE optimizationprocess for the second scenario. Each curve corresponds to a different channelseparation, as described in the text.
Fig. 15. Minimum BER (CSF bandwidth optimized) versus normalizedchannel spacing, corresponding to four systems with different SF bandwidths,for the second scenario. The spectral efficiency (in bits/s/Hz) is given next toeach point.
section. Generating all results of Fig. 14 took 5.5 day; our com-puting cluster was limited to four nodes.
VI. CONCLUSION
We introduced a multi-channel parallel MMC simulatorto study SOA-assisted SS-WDM systems, which enables usto evaluate extremely low BERs in spite of the prohibitivecomplexity of the system model. We used this simulator tooptimize the performance of SOA-assisted system with respectto optical filters at transmitter and receiver. Specifically, welooked into the impact of the bandwidth and roll-off of SF andCSF in single and multi-channel cases. The excess intensitynoise was studied for a large number of filter combinations;BER curves were estimated for a limited set of filters.
Although conventional analysis of the filtering effect suggestsfavoring CSFs with smooth roll-off, the SOA-assisted system isultimately crosstalk limited. Our simulation of BER in modu-alted systems found the best performance is achieved by usingflat-topped optical filters at TX and RX. The Q-factor approxi-mation of the BER was shown to poorly predict the BER, high-lighting the non-Gaussian nature of the noise in SOA-assistedSS-WDM systems.
The simulation power offered by the parallel implementationof MMC allowed optimization of spectral efficiency when bothSOA and FEC are employed to counter the intensity noise. Thereliability of our link simulator was demonstrated by matchingthe measured noise suppression ratio spectra in the CW regime.The reliability of the BER simulator is demonstrated in theAppendix by cross-validating against published BER mea-surements. The parallel MMC we introduce is a powerfulsimulation paradigm, whose applicability goes far beyond thespecific problem addressed in the present work.
APPENDIX ISOA PARAMETERS FOR SIMULATION
The EF is fixed to the 4th-order Bessel-Thompson, and itsbandwidth is fixed to , where is the bit-rate. The SOAparameters carrier lifetime , saturation power , loss coef-ficient , and small-signal gain [24], [25] directly impact thenoise suppression by the SOA when no CSF is present [11]. Inthe presence of a CSF, the SOA linewidth enhancement factoralso has an impact. Generally speaking, SOAs with lower car-rier lifetimes, “fast SOAs”, have wider noise suppression band-widths. Lower saturation power, resulting in deeper saturationfor a fixed input average power, results in better noise sup-pression performance. For the simulations of Fig. 2, we used
ps, coming from the characterization of the SOA usedin the experiments, whereas for the rest of the paper, we insteaduse ps, corresponding to commercially available fasterSOAs. We assumed dBm. As demonstrated in [26],cascading two SOAs results in better noise suppression perfor-mance due to the overall speedup offered by the “turbo” struc-ture [27]. We assume the noise cleaning module consists of thecascade of two identical SOAs, each having 25 dB small-signalgain. Optimization of SOA parameters can be the subject of aseparate study.
In general, SOAs with lower enhancement factors are morerobust to the filtering effect. In Fig. 16, where both SF and CSFare Gaussian filters with 3 dB bandwidth of 30 GHz, we simu-late RIN for various enhancement factors. Even for linewidthenhancement factor approaching zero, the filtering effect canstill significantly curtail noise-suppression efficiency.
In the multi-channel scenario, high linewidth enhancementfactors result in more spectral broadening of the adjacentchannel SOAs, and consequently, enhanced crosstalk. ThusSOAs with low enhancement factors are preferred for SOA-as-sisted SS-WDM systems. Throughout this paper, unlessexplicitly stated otherwise, we fix the enhancement factor tothe rather low value of , corresponding to the charac-terization of the multi-quantum-well SOA used in [5].
Authorized licensed use limited to: BIBLIOTHEQUE DE L'UNIVERSITE LAVAL. Downloaded on February 11, 2010 at 13:29 from IEEE Xplore. Restrictions apply.

88 JOURNAL OF LIGHTWAVE TECHNOLOGY, VOL. 28, NO. 1, JANUARY 1, 2010
Fig. 16. RIN spectra of SS source i) without SOA, ii) with SOA noise cleaning,iii) post-filtered for several linewidth enhancement factors �; identical 30 GHzGaussian filters for SF and CSF.
Fig. 17. Q-factor versus CSF bandwidth simulations, and measurements takenfrom Fig. 17 of [14].
APPENDIX IICROSS VALIDATIONS
In this Appendix we demonstrate the accuracy of our sim-ulator by cross-validating it against published measurementsof three different multi-channel SOA-based SS-WDM systems[14], [26], [31]. Good agreement of our simulated results withthe published measurements, despite the lack of exact charac-terizations, indicates the reliability of our simulator.
In their experimental study of the SOA-based noise suppres-sion in SS-WDM, McCoy, et al. measured the Q-factor versusCSF bandwidth of a three-channel system at 2.5 Gb/s, whenthe SF bandwidth was fixed to 0.24 nm; CSF filters of var-ious bandwidths were used. Flat-topped filters were used forboth SF and CSF and the measurements were repeated at dif-ferent channel spacings. We present our simulations results inFig. 17, as well as reproducing in the square markers the mea-sured values reported in Fig. 17 of [14]. The exact characteri-zation of the system in [14] was unavailable, however, we usedthe measured optical spectra before and after the SOA reportedin Fig. 16 of [14], as a guide to fine-tune our simulator (see insetin Fig. 17). A good match is observed.
Fig. 18. BER versus received power simulations, and measurements takenfrom Fig. 3 of [26].
Fig. 19. Back-to-back BER versus received power simulations, and measure-ments taken from Fig. 4(a) of [31].
In [26], Mathlouthi, et al. reported BER measurements forvarious bit-rates and SOA-assisted SS-WDM receiver architec-tures. One case corresponds to a three-channel system oper-ating at 5 Gb/s, with 30 GHz 3 dB bandwidth for SF, 100 GHzchannel spacing, and 100 GHz CSF 3 dB bandwidth. The “con-ventional receiver” (CR) reported in [26] is the receiver we usedthroughout this paper; SF and CSF were both flat-topped. Wepresent our simulations results in Fig. 18, as well as reproducingthe measured values reported in Fig. 3 of [26]. For the BERcurve of Fig. 18, only one pair of PMMC simulations were exe-cuted to estimated the conditional PDFs in the intensity limitedregime. Each point of the BER curve was then calculated byrescaling the original conditional PDFs, and convolving them
Authorized licensed use limited to: BIBLIOTHEQUE DE L'UNIVERSITE LAVAL. Downloaded on February 11, 2010 at 13:29 from IEEE Xplore. Restrictions apply.
GHAZISAEIDI et al.: SOA-ASSISTED SS-WDM SYSTEMS 89
with the receiver Gaussian noise PDF. Again a good correspon-dence is observed between our simulations and the experimentalresults.
Finally, Lee, et al. recently published experiments comparingthe impact of filter shapes in a single-channel SOA-basedSS-WDM system [31]. They measured BERs at 1.25 Gb/s,for two scenarios: when both SF and CSF are Gaussian with1 dB bandwidth of 0.3 nm, and when both SF and CSF aresuper-Gaussian with 1 dB bandwidth of 0.5 nm. Using thefilter parameters in [31], we simulated the BERs of these twoscenarios in back-to-back operation. We present our simula-tions results in Fig. 19, as well as reproducing in markers themeasured values reported in Fig. 4(a) of [31].
ACKNOWLEDGMENT
The authors would like to thank Prof. A. Bononi for manyhelpful discussions regarding multicanonical Monte Carlotechniques.
REFERENCES
[1] J. S. Lee, Y. C. Chung, and D. J. DiGiovanni, “Spectrum-sliced fiberamplifier light source for multichannel WDM applications,” IEEEPhoton. Technol. Lett., vol. 5, no. 12, pp. 1458–1461, Dec. 1993.
[2] G. J. Pendock and D. D. Sampson, “Transmission performance of highbit rate spectrum-sliced WDM systems,” J. Lightw. Technol., vol. 14,no. 10, pp. 2141–2148, Oct. 1996.
[3] K. Akimoto, J. Kani, M. Teshima, and K. Iwatsuki, “Super-denseWDM transmission of spectrum-sliced incoherent light for wide-areaaccess network,” J. Lightw. Technol., vol. 21, no. 11, p. 2175, Nov.2003.
[4] J. W. Goodman, Statistical Optics. New York: Wiley, 1985.[5] A. Ghazisaeidi, F. Vacondio, A. Bononi, and L. A. Rusch, “SOA inten-
sity noise suppression in spectrum sliced systems: A multicanonicalMonte Carlo simulator of extremely low BER,” J. Lightw. Technol.,vol. 27, no. 14, pp. 2667–2677, Jul. 2009.
[6] P. R. Morkel, R. I. Laming, H. O. Edwards, and D. N. Payne, “Elimi-nation of excess photon noise from fiber super-radiant sources,” Proc.CLEO 90, pp. 154–155, 1990.
[7] A. J. Keating, W. T. Holloway, and D. D. Sampson, “Feedforwardnoise reduction of incoherent light for spectrum-sliced transmission at2.5 Gb/s,” IEEE Photon. Technol. Lett., vol. 7, no. 12, pp. 1513–1515,Dec. 1995.
[8] J. Han, J. W. Ko, J. S. Lee, and S. Y. Shin, “0.1-nm Narrow bandwidthtransmission of a 2.5-Gb/s spectrum-sliced incoherent light channelusing an all-optical bandwidth expansion technique at the receiver,”IEEE Photon. Technol. Lett., vol. 10, no. 10, pp. 1501–1503, Oct. 1998.
[9] S. J. Kim, J. H. Han, J. S. Lee, and C. S. Park, “Intensity noise sup-pression in spectrum-sliced incoherent light communication systemsusing a gain-saturated semiconductor optical amplifier,” IEEE Photon.Technol. Lett., vol. 11, no. 8, pp. 1042–1044, Aug. 1999.
[10] M. Zhao, G. Morthier, R. Baets, and J. Dekoster, “Investigation ofthe intensity noise reduction using a saturated semiconductor opticalamplifier in spectrum sliced WDM systems,” Proc. CLEO2001, pp.383–384, 2001.
[11] M. Zhao, G. Morthier, and R. Baets, “Analysis and optimization of in-tensity noise reduction in spectrum-sliced WDM systems using a sat-urated semiconductor optical amplifier,” IEEE Photon. Technol. Lett.,vol. 14, no. 3, pp. 390–392, Mar. 2002.
[12] T. Yamatoya and F. Koyama, “Noise suppression of spectrum-slicedlight using semiconductor optical amplifiers,” Electron. Commun. Jpn.2, vol. 86, pp. 28–35, 2003.
[13] A. D. McCoy, B. C. Thomsen, M. Ibsen, and D. J. Richardson,“Filtering effects in a spectrum-sliced WDM system using SOA-basednoise reduction,” IEEE Photon. Technol. Lett., vol. 16, no. 2, pp.680–682, Feb. 2004.
[14] A. D. McCoy, P. Horak, B. C. Thomsen, M. Ibsen, and D. J.Richardson, “Noise suppression of incoherent light using a gain-sat-urated SOA: Implications for spectrum-sliced WDM systems,” J.Lightw. Technol., vol. 23, no. 8, pp. 2399–2409, Aug. 2005.
[15] A. D. McCoy, P. Horak, M. Ibsen, and D. J. Richardson, “Performancecomparison of spectrum-slicing techniques employing SOA-basednoise suppression at the transmitter or receiver,” IEEE Photon.Technol. Lett., vol. 18, no. 14, pp. 1494–1496, Jul. 2006.
[16] H. Kim, S. Kim, S. Hwang, and Y. Oh, “Impact of dispersion, PMD,and PDL on the performance of spectrum-sliced incoherent lightsources using gain-saturated semiconductor optical amplifiers,” J.Lightw. Technol., vol. 24, no. 2, pp. 775–785, Feb. 2006.
[17] M. Shtaif, B. Tromborg, and G. Eisenstein, “Noise spectra of semicon-ductor optical amplifiers: Relation between semiclassical and quantumdescriptions,” IEEE J. Quantum Electron., vol. 34, no. 5, pp. 869–878,May 1998.
[18] F. Ohman, J. Mork, and B. Tromborg, “Output power PDF of a sat-urated semiconductor optical amplifier: Second-order noise contribu-tions by path integral method,” IEEE J. Quantum Electron., vol. 43, no.12, pp. 1188–1197, Dec. 2007.
[19] A. Ghazisaeidi, F. Vacondio, A. Bononi, and L. A. Rusch, “Bit pat-terning in SOAs: Statistical characterization through multicanonicalMonte Carlo simulations,” IEEE J. Quantum Electron., to be published.
[20] M. Pfennigbauer and P. J. Winzer, “Choice of MUX/DEMUX filtercharacteristics for NRZ, RZ, and CSRZ DWDM systems,” J. Lightw.Technol., vol. 24, no. 4, pp. 1689–1696, Apr. 2006.
[21] A. Ghazisaeidi, F. Vacondio, and L. Rusch, “Evaluation of the impactof filter shape on the performance of SOA-assisted SS-WDM systemsusing parallelized multicanonical Monte Carlo,” Globecom 2009, to bepublished.
[22] S. Kaneko, J. Kani, K. Iwatsuki, A. Ohki, M. Sugo, and S. Kamei,“Scalability of spectrum-sliced DWDM transmission and its expansionusing forward error correction,” J. Lightw. Technol., vol. 24, no. 3, pp.1295–1301, Mar. 2006.
[23] G. P. Agrawal, Fiber-Optic Communications Systems, 3rd ed. NewYork: Wiley, 2002, pp. 115–116.
[24] D. Cassioli, S. Scotti, and A. Mecozzi, “A time-domain computer sim-ulator of the nonlinear response of semiconductor optical amplifiers,”IEEE J. Quantum Electron., vol. 36, no. 7, pp. 1072–1080, Jul. 2000.
[25] G. P. Agrawal and N. A. Olsson, “Self-phase modulation and spectralbroadening of optical pulses in semiconductor laser amplifiers,” IEEEJ. Quantum Electron., vol. 25, no. 11, pp. 2297–2306, Nov. 1989.
[26] W. Mathlouthi, F. Vacondio, J. Penon, A. Ghazisaeidi, and L. A. Rusch,“DWDM achieved with thermal sources: A future-proof PON solu-tion,” in Proc. ECOC, 2007, Tu 04.4.5.
[27] R. J. Manning, X. Yang, R. P. Webb, R. Giller, F. C. G. Gunning, and A.D. Ellis, “The “Turbo-switch”—A novel technique to increase the high-speed response of SOAs for wavelength conversion,” in Proc. OFC,2006, OWS8.
[28] E. Desurvire, Erbium-Doped Fiber Amplifiers, Principles and Appli-cations. New York: Wiley, 1994, p. 196.
[29] L. Gerardi, M. Secondini, and E. Forestieri, “Pattern perturbationmethod for multicanonical Monte Carlo simulations in optical com-munications,” IEEE Photon. Technol. Lett., vol. 19, no. 23, pp.1934–1936, Dec. 2007.
[30] T. I. Lakoba, “Multicanonical Monte Carlo study of the BER of an all-optically 2R regenerated signal,” IEEE J. Sel. Topic Quantum Electron.,vol. 14, no. 3, pp. 599–609, Jun. 2008.
[31] H. H. Lee, M. Y. Park, S. H. Cho, J. H. Lee, J. H. Yu, and B. W. Kim,“Filtering effects in a spectrum-sliced WDM-PON system using a gain-saturated reflected-SOA,” in Proc. OFC 2009, JWA72.
Amirhossein Ghazisaeidi received the M.A. degreein communications systems, and the B.S. degreein electrical engineering from Sharif University ofTechnology, Tehran, Iran. He is currently workingtoward the Ph.D. in the Department of Electrical andComputer Engineering, Center for Optics, Photonicsand Lasers (COPL), Université Laval, Quebec, QC,Canada.
His research interests include optical-code-di-vision multiple access and spectrum sliced WDMusing incoherent sources, dynamics, and noise prop-
erties of optical amplifiers, modeling optoelectronic devices, and performanceanalysis of optical links.
Authorized licensed use limited to: BIBLIOTHEQUE DE L'UNIVERSITE LAVAL. Downloaded on February 11, 2010 at 13:29 from IEEE Xplore. Restrictions apply.

90 JOURNAL OF LIGHTWAVE TECHNOLOGY, VOL. 28, NO. 1, JANUARY 1, 2010
Francesco Vacondio was born on December 18,1981 in Reggio Emilia, Italy. He received theLaurea Magistrale degree (cum laude) in electricalengineering from the University of Parma, Parma,Italy. He is working toward the Ph.D. degree at theDepartment of Electrical and Computer Engineering,Center for Optics, Photonics and Lasers (COPL),Université Laval, Quebec, QC, Canada.
His research interests include performanceanalysis and design of spectrally efficient opticalnetworks, the exploitation of nonlinear properties of
semiconductor optical amplifiers, and microwave photonics.
Leslie Ann Rusch (S’91–M’94–SM’00–F’10)received the B.S.E.E. (hons) degree from the Cali-fornia Institute of Technology, Pasadena, in 1980 andthe M.A. and Ph.D. degrees in electrical engineeringfrom Princeton University, Princeton, NJ, in 1992and 1994, respectively.
In 1994 she joined the Department of Electricaland Computer Engineering at Universit Laval,Quebec, QC, Canada, where she is currently aFull Professor performing research in wireless andoptical communications. She spent two years as the
manager of a group researching new wireless technologies at Intel Corp. from2001 to 2002. Her research interests include optical-code-division multipleaccess and spectrum sliced WDM using incoherent sources for passive opticalnetworks; semiconductor and erbium-doped optical amplifiers and their dy-namics; radio over fiber; and in wireless communications, high performance,reduced complexity receivers for ultra-wide-band systems employing opticalprocessing.
Authorized licensed use limited to: BIBLIOTHEQUE DE L'UNIVERSITE LAVAL. Downloaded on February 11, 2010 at 13:29 from IEEE Xplore. Restrictions apply.