journal of media and social development - volume -2 issue-3
TRANSCRIPT

JMSD, July-Sept. 2014 / 1
University of Mysore
JOURNAL OF MEDIAAND
SOCIAL DEVELOPMENT
Volume 2 Issue 3 July- September 2014
1. Participation of Women in Panchayat RajInstitutions: A Step towards Inclusive Governance SHRUTI I.L
2. Usage of Mobile Communication for Sustainable ONKARGOUDA KAKADEAgricultural Development in Karnataka, India TAHMEENA NIGAR
SULTANA KOLAR
3. Cinema and Construction of Identity:Dr Rajkumar Phenomenon in Karnataka ROOPA K.N
4. Communication Technology and Development –A Study of E-learning Intervention in Engineering N. USHA RANIEducation in Karnataka, India NESARA KADANAKUPPE
JMSD, July-Sept. 2014 / 2 JMSD, July-Sept. 2014 / 3
Participation of Women inPanchayat Raj Institutions: A Steptowards Inclusive Governance
SHRUTI I.LAbstract
The 73rd and 74th constitutional amendments opened up the governancestructures in Panchayat Raj Institutions and urban local bodies towomen, by reserving 33 percent of the seats for them. In fact it wasthe first step towards gender inclusive governance. Though India hashad a long tryst with Panchayats, women were not represented inthese governing bodies for centuries. In fact it was the state ofKarnataka that took the lead in setting special spaces for women inPRI institutions. It was the Karnataka Zilla Panchayat, talukPanchayat Samiti, Mandal Pnanchayat and Nyaya Panchayat thatpaved the way for the 73rd and 74th constitutional amendments. Theentry of women into power politics that was facilitated by the 73rd
and 74th constitutional amendments no doubt gave them a voice andvisibility in the decision making process, but the path of power wasstrewn with many hurdles that included a change resistant patriarchalvalue system, the reluctance on the part of male politicians to sharepower and interference of male members of their families. But manywomen PRI members have taken the initiative to introduce proactivemeasures that have especially tried to address issues that are of specialrelevance to women. This article brings to light the need andsignificance of a gender inclusive governance policy and how it couldempower women.

JMSD, July-Sept. 2014 / 4 JMSD, July-Sept. 2014 / 5
If democracy is to assume real meaning it should make way forinclusive governance.
In theory democracy ensures the right of equal participation toall groups in a society. But in reality many groups are excluded fromthe governance process. What then is inclusive governance? It“represents the extent to which Governance Institutions provide ‘space’to overcome the systematic exclusion of disadvantaged groups seekingto participate in decision making, affecting them” ( Making democracyReal Dialogue, 2013). This is especially true of vulnerable sectionsin our society, among whom women are in the fore front. Womenconstitute nearly half the population of the world and a system ofgovernance that does not include them and issues that are relevant totheir lives is no true democracy.
Women’s Political Participation as a Gateway totheir Empowerment
A real democracy can emerge as an inclusive system only whenit gives equal access for participation in the decision making processto all groups. An inclusive system of governance is one that givesmeaningful representation to voices that have hitherto been deprivedof access to opportunities for change or development. Representationagain is not one of mere tokenism, but actual participation in thedecision making process, not just in politics, but all social institutions.This is especially true of women. It is being increasingly realized that“one of the important steps in deepening democracy and democraticgovernance is to ensure a better representation of women in politics.More women in politics across the world, inclusive of Africa, arepresumed to assist in ensuring that gender lenses are applied togovernance and in so doing, transform the lives of women on the
Key WordsPanchayat Raj, Inclusive Governance, 73rd and 74th ConstitutionalAmendments, Women’s Empowerment
Author: Shruti I.L., Research Scholar, Department of Studies inCommunication and Journalism, Manasagangotri,University of Mysore,Mysore -570 006. email: [email protected]
INTRODUCTIONThe whole world is witnessing a revolutionary change in the
pattern of governance, aptly described by academicians and activistsas democratic decentralization. The most visible symbol of this processof decentralization is the breakdown of gender hierarchies. The doorsof democracies are opening up for women in different parts of theworld in different proportions and ways. Experiments of redistributionof power are happening across the world. India has been witness tosuch a revolutionary change and has attempted to establish a modelthat is globally replicable.
In the true sense of the term democratic decentralization meansthat opportunities are created for meaningful participation by differentgroups in a given society. Development is possible only when politicalinstitutions become inclusive (Acemoglu and Robinson, 2012).Democratic decentralization also envisages redistribution of politicalpower. In human societies characterized by racial, caste, gender andclass hierarchy power is also generally concentrated in the hands ofthe elite. This system perpetuates itself and keeps the marginalizedand vulnerable communities in a constant state of dependence. Thoughdemocracy is projected as a participatory system of governance giving‘voice’ and ‘visibility’ to people, their participation to a large extentis limited to casting their votes in elections, but the leaders are generallyfrom the advantaged groups, the most excluded group being women.
Participation of Women in Panchayat Raj Institutions: A Step towards Inclusive GovernanceShruti I.L.
JMSD, July-Sept. 2014 / 6 JMSD, July-Sept. 2014 / 7
continent. From Mexico in 1975 to Beijing in 1995, a lot of progresshas been made for the advancement of women but one area whichdemands more scrutiny is the political representation of women”(Council for the Development of Social Science Research in Africa,2012).
The last two decades have witnessed the whole worlddebating the concept of women’s empowerment and their politicalparticipation is definitely one of the parameters for deciding thestate of their empowerment. What then is women’s empowerment?The United Nations Guidelines to Women’s Empowerment([email protected]) identifies the following five components todescribe a state of empowerment, these being:
• Women’s sense of self-worth;• Right to have and to determine choices; • Right to have access to opportunities and resources; • Right to have the power to control their own lives,
both within and outside the home; • Ability to influence the direction of social change to create a
more just social and economic order, nationally andinternationally.
If we examine the extent of political participation of women indemocratic governments at all levels of governance, it becomes evidentthat they fair very poorly on all the five indicators of empowermentcited above. Low representation of women in political institutions isa ubiquitous feature of all societies. Though political participation isrecognized as a basic human right in the Universal Declaration ofhuman Rights no society has given them their due (see Batliwala,2014).
It is this realization that was the driving force for the emergenceof the idea of giving them special representation, to begin with inlocal governments. India stands out as the harbinger of this ideabecause almost three decades ago, the country saw the opening up ofthese special opportunities in rural local self-government, with thestate of Karnataka taking the lead. With this move democraticdecentralization got a new meaning.
Panchayat Raj, the rural local self government has a long historyin India. The state of Karnataka has been a key player in ushering asystem of people centric rural governance. But women were not givenan opportunity to contest elections until the Karnataka Zilla Parishad,Taluk Samiti; Mandal Panchayat Act 1983 was passed. But at thenational level women’s entry into local governance happened only in1993-94, with the 73rd constitutional amendment.
As a backdrop to the discussion on the need and relevance ofthe participation of women in rural governance, in the section thatfollows a brief description of the history of Panchayat Raj in Indiaand Karnataka is presented.
Panchayat Raj in IndiaIndia’s experiences with grassroots level governance dates back
to early vedic times (1200 BC). In almost every village in India, villagebodies called Sabhas oversaw administration of villages that cameunder their jurisdiction. Over a period of time these Sabhas weretransformed into Panchayats, a council of five persons. Until thearrival of the British, the Panchayats were the supreme power centresin India’s villages.
The situations of Panchayats, however changed with the onsetof the colonial rule. The British were not really keen on preserving
Participation of Women in Panchayat Raj Institutions: A Step towards Inclusive GovernanceShruti I.L.

JMSD, July-Sept. 2014 / 8 JMSD, July-Sept. 2014 / 9
the autonomous character of these institutions. They thus treatedPanchayats as a revenue collecting mechanism. In spite of localresistance and the pressure on the colonial government to democratizevillage level institutions, the British were not in a mood to vest theseinstitutions with absolute powers. A power structure based on hierarchythat was the hallmark of colonial political institutions was also imposedon village Panchayats by the British.
It was not until 1870 that the British considered the establishmentof a local self government. Mayo’s Resolution of 1870 and LordRippon’s efforts in 1882 to democratize local institutions are seen asmilestones in the history of local self government in India. By 1907the stage was set for the emergence of rural level local governmentwith the appointment of Royal Commission on Decentralisation. Itwas actually Mahatma Gandhiji who set the tone of the nationalistpoint on the Panchayats when he declared that village Panchayatswould almost enjoy the status of self governments which could takecare of local needs.
The Montague-Chelmsford Reforms made local self governmenta ‘transferred subject’ under the schemes of diarchy. Though therewere constraints in the way of applying this principle in all theprovinces of British India, it was seen that even as early as in 1925 atleast eight provinces had passed the Panchayat acts and in thefollowing year, six native states had also passed the Act. The idea ofPanchayat formed an integral part of the freedom movement. Gandhijiviewed Panchayats as the true representatives of people because theirsupport came from the grassroots. Soon efforts were made to transformlocal bodies as true representatives of the people. However, due tothe outbreak of the Second World War in 1939 not much headwaywas made. In fact the period between 1939-46 did not witness any
positive developments in the development of local self government.
Panchayats in Independent IndiaIt was in the year 1952 that the Government of India launched a
comprehensive programme of community development popularlyknown as CDP. This programme however could not make muchheadway because of limited people’s participation. The Balwant RaiMehta Committee constituted to review the structure and functionsof CDP had suggested that a set of institutional arrangements be putin place for ensuring meaningful people’s participation in localgovernance. This resulted in the creation of a three-tier-system of PRIsto organize and manage rural development activities. In 1959,Raajsthan became the first state in the country to establish PanchayatRaj and soon other states followed. In the true spirit of democraticdecentralization that was advocated by the Balwant Rai MehtaCommittee, all the states had passed the Panchayat Acts and createdthree structures namely Village Panchayats at the base, PanchayatSamitis in the middle and Zilla Parishats at the apex levels.
The constitution of the Ashok Mehta Committee in 1977 pavedthe way for a new thinking on the concepts and practices associatedwith the PRIs. The Committee which recommended far reachingchanges in the functioning of Panchayats with a focus on transformingthe quality of rural life proposed a structure consisting of ZillaParishat, Taluk Samiti and Mandal Panchayat. Other significantdevelopments envisaged by the Ashok Mehta Committee were theinclusion of Panchayat Raj in the Constitution and participation ofpolitical parties in elections. Reports of the GVK Rao Committee(1985) and LM Singhvi Committee (1986) set the stage for makingthe district as the basic unit for planning, holding regular elections to
Participation of Women in Panchayat Raj Institutions: A Step towards Inclusive GovernanceShruti I.L.

JMSD, July-Sept. 2014 / 10 JMSD, July-Sept. 2014 / 11
PRIs and allocating more financial resources to Panchayats.It was the 73rd constitutional amendment that set the stage for
far reaching changes in the Panchayat Raj institutional set up. Thereservation of 33 percent seats for women was a landmark decisionthat led to the inclusion of women who were kept away fromparticipating in the political decision making process for centuries.Women for the first time got an opportunity to direct the course ofevents envisaged for rural development.
Panchayat Raj in KarnatakaKarnataka has been a pioneer in local self governance. Its tryst
with Panchayat Raj dates back to the 19th century. As early as in 1860‘local fund’ and ‘local fund committees’ were constituted in everydistrict. Following the reorganization of states in 1956, the MysoreLocal Boards and Village Panchayats Act came into being. Underthis Act, village Panchayats at the village level, Taluk DevelopmentBoards at the taluk level and District Development Councils for eachdistrict were constituted. While village Panchayats and taluk boardshad elected representatives, councils were mere advisory bodiescomprising of government officials of development departments. Mostof the rural development work and schemes were channelized throughtaluk boards and even village Panchayats were under the control oftaluk boards. This system continued till 1983.
In order to decentralize administration further, a new act knownas the Karnataka Zilla Panchayat, Taluk Panchayat Samiti, MandalPanchayat and Nyaya Panchayat Act came into being in 1983.ThisAct was designed in the light of the Report of the Ashok MehtaCommittee. The new act interlinked Mandal Panchayats (village level)with Taluk Panchayat Samitis (taluk level) and Zilla Parishats (district
level). In the new system, only Mandal Panchayats and Zilla Parishadshad elected bodies. Taluk Panchayat Samitis remained as coordinatinginstitutions between Mandals and Zilla Parishads and worked underthe Zilla Parishads. Also, in the new setup, Zilla Parishads wereentrusted with more powers and functions. They almost functionedlike the governments of the districts. Most of the developmentactivities of the state were executed or carried on through these ZillaParishads. Nearly 80 percent of the total development expenditurewas earmarked for Zilla Parishads. Except major and mediumirrigation works, all other development works were entrusted to theParishads. It was actually this Act which paved the way for women’sreservation and served as the curtain raiser to the 73rd and 74th
constitutional amendments.
73rd and 74th Constitutional Amendments: The Key to Inclusionof Women in Governance
The 73rd and 74th amendments that were incorporated into theConstitution of India heralded the era of a gender inclusive system ofgovernance. In fact both rural and urban local bodies came under PartIX of the Constitution of India, 43 years after India became a republic.The two were passed in 1992 and they formed part of the IndianConstitution in 1993. Besides opening up the governance structure togroups that were hitherto virtually excluded from politics, the 73rd
and 74th amendments created the space for reservation of one-third ofthe total number of seats in rural and urban local bodies for women. Italso laid down that one-third of the seats reserved for SCs and STsand chairpersons at all levels are to be reserved for women.
The 73rd Constitutional Amendment Act, 1992 providesreservations for women in PRIs in two ways. First, it opened up not
Participation of Women in Panchayat Raj Institutions: A Step towards Inclusive GovernanceShruti I.L.
JMSD, July-Sept. 2014 / 12 JMSD, July-Sept. 2014 / 13
less than one-third of the seats for direct election in each of the threetiers to women and second, it reserved one-third of the positions ofchairpersons for women. Besides conferring constitutional status toPanchayats, which they had previously lacked and also reserving one-third of the spaces for women in PRI institutions, the amendmentsalso paved the way for reservation of seats for scheduled castes andscheduled tribes.
It is true that the Constitution of India vide Article 14 confersthe right to equality, and in this sense women have equal access topolitical power. But experience has shown that conferment of equalopportunities does not always translate into equal utilisation of theseopportunities. Women in most places did not come forward to contestelections either because of traditional barriers to their participation inpublic spaces or because they were not allowed to so by their familiesor male aspirants for political power. The use of muscle and moneypower in politics also acted as constraints. Prior to the 73rd and 74th
constitutional amendments the scenario vis-à-vis democratic politicswas that women faced several handicaps in contesting for positionsof power. These include “routine exclusion from effective decisionmaking to physical violence against women representatives. Thereare also structural obstacles relating to the design of Panchayat Rajinstitutions, such as the role of the bureaucracy or the provisions forno-confidence motions or the two child norm. Another type ofstructural limitation is that relating to the local structures ofdominance-including patriarchy, caste and class-issuing in exclusion,tokenism and surrogate representation” (HDRC, 2000:34). It is therealization of these constraints to women’s participation in democraticpolitics that led to the enactment of the 73rd and 74th constitutionalamendments, which finally paved the way for their entry intomainstream politics.
In spite of wide spread doubts being expressed by those whowere opposed to the idea of redistribution of power, which was hitherto concentrated in the hands of men, the 73rd and 74th constitutionalamendments opened the doors of the political decision makingmechanism to women, for the first time in the history of power politics.With the Union Cabinet of the Government of India, on 27 August2009, approving 50 percent reservation for women in PRIs, womengot a share in governance equal to their numbers in the country’spopulation.
Women and Panchayat RajEven before the passage of the 73rd and 74th constitutional
amendments, which laid down that 33 percent of the spaces in ruraland urban local bodies, respectively must be set apart for women,there were a few instances of women who had participated in villagebodies. But this was a privilege enjoyed by women of upper castesand land owing families. Also, only one or two places used to begiven to these women. Neither did they have visibility nor were theirvoices heard.
When the question of giving special representation to womenin the political decision process emerged, opposition to the ideastemmed from two sources. The first was from patriarchal forces thatwere simply not ready to accept women as their co-partners in powerpolitics. They expressed doubts about women’s capacities to handlepolitical responsibilities and justified their stand by stressing onwomen’s lack of experience in the area.
The second reason for opposition came from those quarters,which were already enjoying power and was not ready to give it up.Setting apart one-third of the seats for women in PRIs would mean
Participation of Women in Panchayat Raj Institutions: A Step towards Inclusive GovernanceShruti I.L.
JMSD, July-Sept. 2014 / 14 JMSD, July-Sept. 2014 / 15
that so many men would not be able to lay their claim to these seats.Reservation for women would also mean redistribution of power, asituation for which they were not prepared.
It was also widely felt that if one-third of the seats in PRIs werereserved for women, enough number of women would not comeforward to contest these elections. But “these fears have been foundunfounded and on the whole nearly five million women candidatesfile nominations to contest for one million posts. This means on anaverage there were five women candidates contesting every seat. Whatis even more remarkable is that some women managed to win generalseats defeating rival men or women candidates. In Karnataka forexample, 44 percent women have been elected to the Panchayats.That is, 11 percent unreserved seats have been won by womendefeating rival men and women candidates” (Baviskar and Mathew,2009:13-14).
What Difference do Women make if they are given Special Spacesin Panchayat Raj Institutions?
This question has often been raised both in the political andpublic domain. Giving special representation to women does not meanthat men should not be involved in activities or formulation of policiesmeant for women’s empowerment. It is also not to be interpreted thatmen are insensitive to issues of gender. Affirmative action that bringsmore women into political spaces is simply a matter of social justicethat has long been denied to them. Also, there are areas, where womenwho have personally experienced the pains of violence, deprivationand denial can work with a better sense of involvement, for changingthe lives of other women, in particular and entire communities, ingeneral.
When women come to power, they are more likely than men toaddress such necessities as creation of drinking water sources closeto their homes, repairing community resources such as schoolbuildings or bridges, demanding the functioning of an effective publicdistribution system and provision of health care facilities. Such issuesas girls’ education, safe motherhood, female foeticide, creation ofcommunity infrastructure have also been addressed by womenPanchayat members in different parts of the country.
One of the strongest threats to women’s empowerment has beenthe alcoholic addiction of men. Alcohol has disrupted families, led toviolence against women and affected the health of women. However,the number of liquor shops in India’s villages is increasing and womenhave borne the brunt of alcoholic addiction of men. They are victimsof a double edged sword in the sense that they have to work bothwithin and outside the home to support and sustain their families.Often, they are forced to give up their earnings for supporting thedrinking habits of male members of their families. This problem hasnever been seriously addressed by policy makers either in local bodiesor at state and national level. But women have taken the lead incombating the liquor lobby, which is one of the forces dictating powerpolitics in the country (Indian Express, May 11, 1999).
The inclusion of women in local governance has definitelyengendered governance. Some of the ways “in which women, throughPRIs, are changing governance are evident in the issues they chooseto tackle; water, alcohol abuse, education, health and domesticviolence. Women also express different values. Women valueproximity, whether it be to a drinking water source, a fuel source, acrèche, a health centre, a court of justice or an office of administration.The enormous expansion of women’s representation in decentralized
Participation of Women in Panchayat Raj Institutions: A Step towards Inclusive GovernanceShruti I.L.
JMSD, July-Sept. 2014 / 16 JMSD, July-Sept. 2014 / 17
government structures has highlighted the advantages of proximity,namely the redress of grievance and (most important of all) the abilityto mobilize struggle at a local level where it is most meaningful. Thuswomen are helping to radicalize local government” (Jain, 1996).
When women participate in decision making bodies in localself government, their participation is not just limited to their interestin personal or familial matters. They tend to include in their agendaissues that are important for the development of their respectivevillages. Such decisions tend to enhance the quality of life of entireneighbourhoods. A classic example is that of a Meitei woman sarpanchin Manipur “who does all the work herself and has successfullycompleted several development projects for the Panchayat such asrepairing roads, construction of panchaayt ghar, cleaning the villageponds and renovating the school building” (Baviskar and Mathew,2009:14-15).
Another case is that of 35 year-old Shushma Bhadu one of thoserare progressive women from rural Haryana, “who has chosen herown future by entering public life. Elected in 2010 as the sarpanch ofthe Dhani Miyan Gram Panchayat in Fatehabad district, she is a truerevolutionary, both in her thinking and practice. In a state that is knownto reject the girl child, Bhadu has managed to make her village a‘model’ when it comes to women’s rights and the survival of daughters.This Class Seven dropout has also zeroed in on education in additionto ensuring greater access to water and sustainable livelihood for herpeople. Another community heroine is Nayana Patra, 45, a wardmember from Dhenkenal district’s Baraun Gram Panchayat, Odisha,who, with the support of other women, has devised an innovativeway to reduce liquor consumption in the region. By imposing a fineon those found drunk, she not only managed to discourage suchunsociable behaviour, but also got funds to build toilets in thevillage”(www.wfsnews.org).
FUTURE CHALLENGESSuccess stories of women who have conquered many hurdles in
exercising their power are many. However, we cannot rest on theseachievements. The provision of reservation for women per se doesnot mean that the goal of gender equality is reached. The fear that theentry of a large number of women into mainstream politics wouldupset power equations even today stand as the greatest obstacle totheir entering the portals of decision making bodies. Though politicalparties affirm their commitment to gender justice in their electionmanifestos from time to time, they have failed to translate it into action.Irrational reasons are put forward to deny women their rightful positionin politics.
There is a tendency in the male dominated political set up tobelittle women’s achievements and glorify their failures. One oftenhears about women PRI members being remote controlled by malemembers of their families or political parties, and functioning as meredummies. It is also true that in many Panchayats women have failedto exercise their democratically acquired rights, and have allowedthemselves to be overpowered by male family members or bureaucrats.But this situation cannot go on forever.
Gender discrimination has a history of centuries, but the historyof affirmative action is only a few decades old. To bridge this gap isnot an easy task. But concerted efforts must be made to sensitize themto the nuances of power politics by helping them to overcomeinhibitions and culturally imposed barriers. It is here that media andcivil society can play a meaningful and vital role.
Participation of Women in Panchayat Raj Institutions: A Step towards Inclusive GovernanceShruti I.L.

JMSD, July-Sept. 2014 / 18 JMSD, July-Sept. 2014 / 19
REFERENCES1. Aslam,M. Panchayat Raj in India, New Delhi: Jain Book Depot,
2011.
2. Batliwala, Srilatha, Engaging with Empowerment: An Intellectual andExperiential Journey, Women Unlimited, 2014.
3. Baviskar,BS and George Mathew(eds). Inclusion and Exclusion inLocal Governance: Field Studies from Rural India, New Delhi: SagePublications, 2009.
4. Council for the Development of Social Science Research in Africa.African Governance and Gender: From a Politics of Representationto a Politics of Transformation, UNDP Report, 2012.
5. Daron Acemoglu and James A. Robinson, Why Nations Fail (CrownBusiness, 2012).
6. Jain, Devaki. Panchayat Raj: Women Changing Governance, Genderin Development Monograph Series #5, UNDP. New York, September1996.
7. Making Democracy Real Dialogue. Inclusive Governance-Reachingthe Unreached, September 24, 2013
Usage of Mobile Communication forSustainable AgriculturalDevelopment in Karnataka, India
ONKARGOUDA KAKADETAHMEENA NIGAR SULTANA KOLAR
AbstractThe present study reveals the access of mobile technology for
sustainable agriculture development in Karnataka. In the context ofIndian agriculture, mobile technology has been a vital component inthe recent years. The technology helps farmers to obtain updates onthe market prices; finance and education, making it possible to monitorresources, track products etc. The Kisan Call Center empowersfarmers and people living in rural India with pertinent and high qualityinformation and services through affordable communication networkin a sustainable manner. This paper is based on the research studywhich examined the possibilities and the potential of mobilecommunication, its style of functioning, services, language and needof farmers, with the help of a structured interview schedule. Forcollection of data, multi stage sampling technique was used. The studyincludes four districts in Karnataka state i.e. Koppal, Udupi, Kolarand Bijapur. From each district 45 farmers formed the study samplethus constituting a total sample of 180. The study showed that themaximum number of farmers use mobile phones to get informationregarding seeds and crops, plant protection measures for pest anddisease control etc. The study also identified that mobile technology
Usage of Mobile Communication for Sustainable Agricultural Development in Karnataka, IndiaShruti I.L.
JMSD, July-Sept. 2014 / 20 JMSD, July-Sept. 2014 / 21
is a credible source in disseminating information on sustainableagriculture to farmers.
Key words: Mobile communication technology, farmers, sustainableagriculture, development, information.Authors: Onkargouda Kakade, Associate Professor, Department ofJournalism and Mass Communication, Karnataka State women’sUniversity, Bijapur, Karnataka, India; email:[email protected] & Tahmeena Nigar Sultana Kolar, Department ofJournalism and Mass Communication, Karnataka State women’sUniversity, Bijapur, Karnataka, India; email:[email protected]
INTRODUCTION
In India agriculture has a long history that goes back to tenthousand years. At present, in terms of the agricultural production,the country stands second in the world. Sustainable agriculture refersto a range of strategies for addressing the varied problems that affectagriculture. Such problems include loss of soil productivity fromexcessive soil erosion and associated plant nutrient losses, surfaceand ground water pollution from pesticides, fertilizers and sediments,impending shortages of non- renewable resources, and low farmincome from depressed commodity prices and high production costs.Furthermore, “sustainable” implies a time dimension and the capacityof a farming system to endure indefinitely (V. Rao et al).Mobile phones opened up new opportunities for reaching farmerswith agricultural information. Farmers were seeking informationthrough the SMS and voice messages and it became an easy task forthem to use this medium which was simple. In the context of Indianagriculture, mobile technology has been playing vital role in recent
years in reaching out to farmers, who for a long time had no access totechnology. Technology provides information to farmers about marketprices, weather, finance, and government schemes, making it possiblefor them to scrutinize resources, track products etc. The Kisan CallCenter empowers farmers and people living in rural India with relevantinformation and services through an affordable communicationnetwork, in a manner that makes it possible for them to stay in touchwith the latest development in the field.
To improve farmers’ access to information, the Karnataka StateAgricultural Marketing Board (KSAMB) has also initiated diffusionof market prices free of cost through mobile SMS alerts to farmers.Apart from these, it is also disseminating the same market informationusing other means such as local newspapers, television, radio, KisanCall Centers and websites like www.krishimaratavahini.nic.in andwww.agmarknet.nic.in.
Mobile-based information delivery holds great potential and iseither being considered as or is in use as a major channel for sustainableagricultural advisory services. As mobile phone penetration continuesto increase among the farming community and information servicescontinue to adapt and proliferate, sufficient potential exists for a muchdeeper rural productivity impact in the future, but achieving fullproductivity potential will depend on reducing other constraints whichlimit the use of information that farmers can obtain through theirmobile phones ( Mittal and Tripathi, 2009). The present research aimsto throw light at the various possibilities and potential of mobilecommunication technology, its style of functioning, services, languageand needs of farmers.
Usage of Mobile Communication for Sustainable Agricultural Development in Karnataka, IndiaOnkargouda Kakade, Tahmeena Nigar Sultana Kolar
JMSD, July-Sept. 2014 / 22 JMSD, July-Sept. 2014 / 23
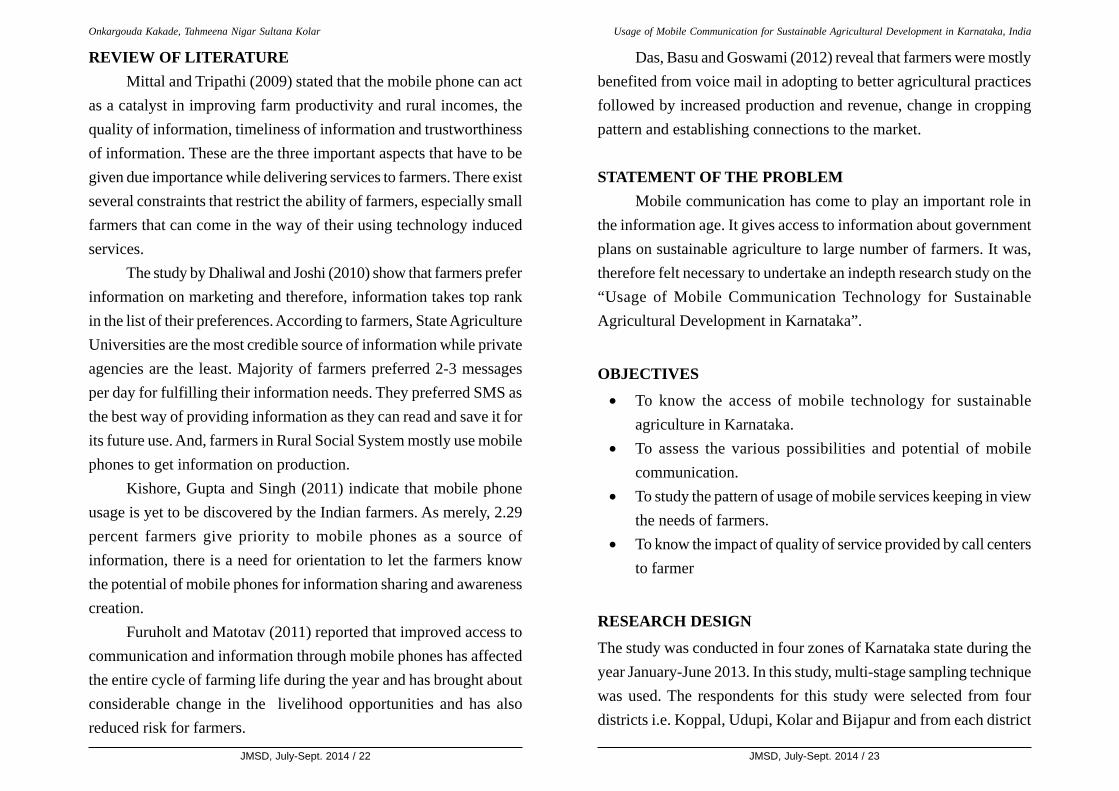
REVIEW OF LITERATUREMittal and Tripathi (2009) stated that the mobile phone can act
as a catalyst in improving farm productivity and rural incomes, thequality of information, timeliness of information and trustworthinessof information. These are the three important aspects that have to begiven due importance while delivering services to farmers. There existseveral constraints that restrict the ability of farmers, especially smallfarmers that can come in the way of their using technology inducedservices.
The study by Dhaliwal and Joshi (2010) show that farmers preferinformation on marketing and therefore, information takes top rankin the list of their preferences. According to farmers, State AgricultureUniversities are the most credible source of information while privateagencies are the least. Majority of farmers preferred 2-3 messagesper day for fulfilling their information needs. They preferred SMS asthe best way of providing information as they can read and save it forits future use. And, farmers in Rural Social System mostly use mobilephones to get information on production.
Kishore, Gupta and Singh (2011) indicate that mobile phoneusage is yet to be discovered by the Indian farmers. As merely, 2.29percent farmers give priority to mobile phones as a source ofinformation, there is a need for orientation to let the farmers knowthe potential of mobile phones for information sharing and awarenesscreation.
Furuholt and Matotav (2011) reported that improved access tocommunication and information through mobile phones has affectedthe entire cycle of farming life during the year and has brought aboutconsiderable change in the livelihood opportunities and has alsoreduced risk for farmers.
Das, Basu and Goswami (2012) reveal that farmers were mostlybenefited from voice mail in adopting to better agricultural practicesfollowed by increased production and revenue, change in croppingpattern and establishing connections to the market.
STATEMENT OF THE PROBLEMMobile communication has come to play an important role in
the information age. It gives access to information about governmentplans on sustainable agriculture to large number of farmers. It was,therefore felt necessary to undertake an indepth research study on the“Usage of Mobile Communication Technology for SustainableAgricultural Development in Karnataka”.
OBJECTIVES
• To know the access of mobile technology for sustainableagriculture in Karnataka.
• To assess the various possibilities and potential of mobilecommunication.
• To study the pattern of usage of mobile services keeping in viewthe needs of farmers.
• To know the impact of quality of service provided by call centersto farmer
RESEARCH DESIGN
The study was conducted in four zones of Karnataka state during theyear January-June 2013. In this study, multi-stage sampling techniquewas used. The respondents for this study were selected from fourdistricts i.e. Koppal, Udupi, Kolar and Bijapur and from each district
Usage of Mobile Communication for Sustainable Agricultural Development in Karnataka, IndiaOnkargouda Kakade, Tahmeena Nigar Sultana Kolar
JMSD, July-Sept. 2014 / 24 JMSD, July-Sept. 2014 / 25
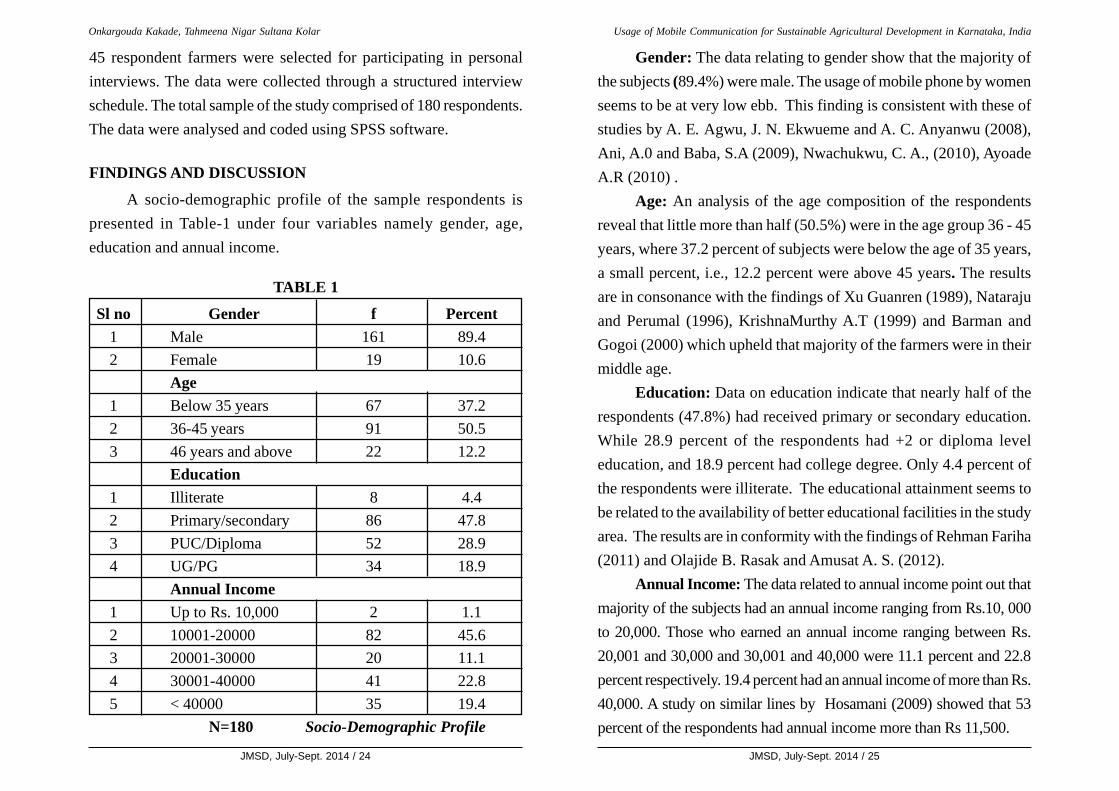
45 respondent farmers were selected for participating in personalinterviews. The data were collected through a structured interviewschedule. The total sample of the study comprised of 180 respondents.The data were analysed and coded using SPSS software.
FINDINGS AND DISCUSSION
A socio-demographic profile of the sample respondents ispresented in Table-1 under four variables namely gender, age,education and annual income.
TABLE 1
Sl no Gender f Percent1 Male 161 89.42 Female 19 10.6
Age1 Below 35 years 67 37.22 36-45 years 91 50.53 46 years and above 22 12.2
Education1 Illiterate 8 4.42 Primary/secondary 86 47.83 PUC/Diploma 52 28.94 UG/PG 34 18.9
Annual Income1 Up to Rs. 10,000 2 1.12 10001-20000 82 45.63 20001-30000 20 11.14 30001-40000 41 22.85 < 40000 35 19.4
N=180 Socio-Demographic Profile
Gender: The data relating to gender show that the majority ofthe subjects (89.4%) were male. The usage of mobile phone by womenseems to be at very low ebb. This finding is consistent with these ofstudies by A. E. Agwu, J. N. Ekwueme and A. C. Anyanwu (2008),Ani, A.0 and Baba, S.A (2009), Nwachukwu, C. A., (2010), AyoadeA.R (2010) .
Age: An analysis of the age composition of the respondentsreveal that little more than half (50.5%) were in the age group 36 - 45years, where 37.2 percent of subjects were below the age of 35 years,a small percent, i.e., 12.2 percent were above 45 years. The resultsare in consonance with the findings of Xu Guanren (1989), Natarajuand Perumal (1996), KrishnaMurthy A.T (1999) and Barman andGogoi (2000) which upheld that majority of the farmers were in theirmiddle age.
Education: Data on education indicate that nearly half of therespondents (47.8%) had received primary or secondary education.While 28.9 percent of the respondents had +2 or diploma leveleducation, and 18.9 percent had college degree. Only 4.4 percent ofthe respondents were illiterate. The educational attainment seems tobe related to the availability of better educational facilities in the studyarea. The results are in conformity with the findings of Rehman Fariha(2011) and Olajide B. Rasak and Amusat A. S. (2012).
Annual Income: The data related to annual income point out thatmajority of the subjects had an annual income ranging from Rs.10, 000to 20,000. Those who earned an annual income ranging between Rs.20,001 and 30,000 and 30,001 and 40,000 were 11.1 percent and 22.8percent respectively. 19.4 percent had an annual income of more than Rs.40,000. A study on similar lines by Hosamani (2009) showed that 53percent of the respondents had annual income more than Rs 11,500.
Usage of Mobile Communication for Sustainable Agricultural Development in Karnataka, IndiaOnkargouda Kakade, Tahmeena Nigar Sultana Kolar

JMSD, July-Sept. 2014 / 26 JMSD, July-Sept. 2014 / 27
From among 180 subjects, it was seen that 68.8 percent used2G mobile phone and the remaining (31.11%) used 3G phone.
The data relating to the time spent on using a mobile phone aregiven in Table 2.
TABLE 2Sl No Duration f Percent
1 1 hour 47 26.1
2 2 hour 70 38.9
3 3 hour 36 20.0
4 More than 3 hour 27 15.0
5 Total 180 100.0
N=180 Time Spent On Using Mobile Phone
Graph-1
The analysis of data pertaining to the time spent on mobile phoneshow that most of the respondents (38.9 %) spend 2 hours a day usingtheir mobile phone, whereas, 26.1 percent spend an hour a day. 20percent and 15 percent spend 3 hours or more than 3 hours a dayrespectively.
Table 3The data in Table 3 show the frequency of usage of mobile
phone for obtaining agriculture related information.
Sl.No. Frequency f Percent
1 Regularly 128 71.1
2 Occasionally 45 22.2
3 Rarely 07 3.8
4 Total 180 100.0
N=180 Frequency of Using Mobile Phone for Agricultural InformationGraph-2
Usage of Mobile Communication for Sustainable Agricultural Development in Karnataka, IndiaOnkargouda Kakade, Tahmeena Nigar Sultana Kolar
JMSD, July-Sept. 2014 / 28 JMSD, July-Sept. 2014 / 29
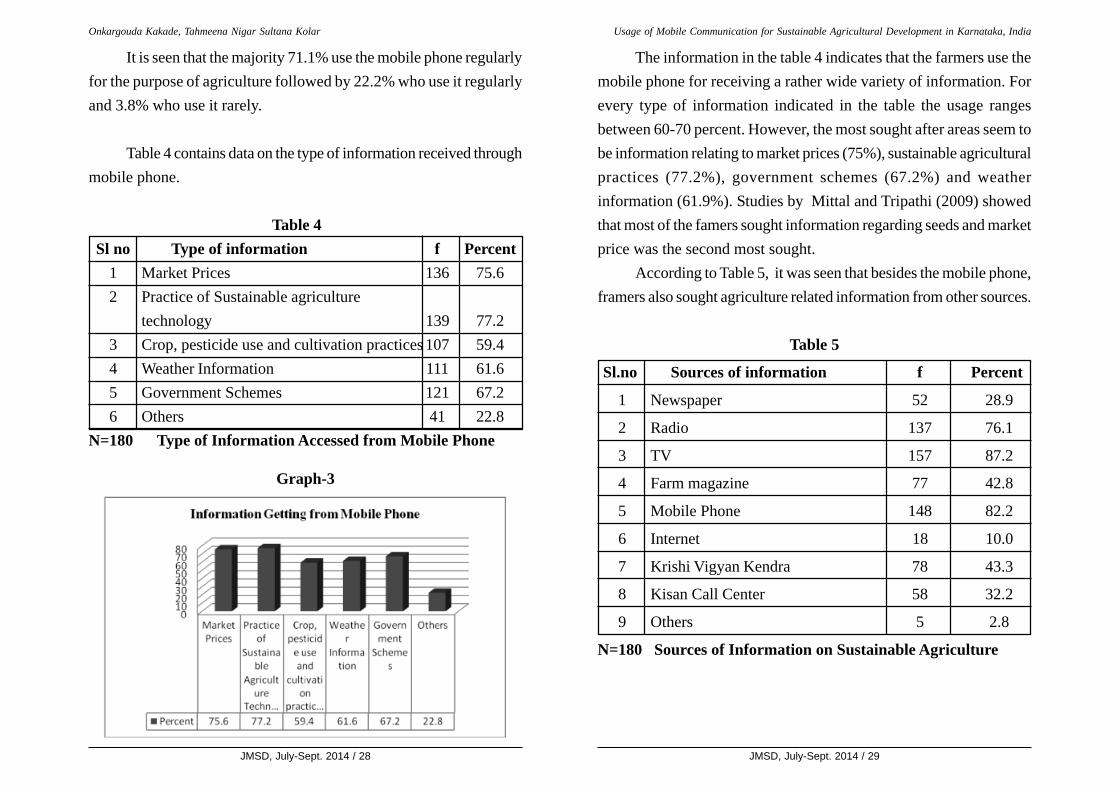
It is seen that the majority 71.1% use the mobile phone regularlyfor the purpose of agriculture followed by 22.2% who use it regularlyand 3.8% who use it rarely.
Table 4 contains data on the type of information received throughmobile phone.
Table 4Sl no Type of information f Percent
1 Market Prices 136 75.62 Practice of Sustainable agriculture
technology 139 77.23 Crop, pesticide use and cultivation practices 107 59.44 Weather Information 111 61.65 Government Schemes 121 67.26 Others 41 22.8
N=180 Type of Information Accessed from Mobile Phone
Graph-3
The information in the table 4 indicates that the farmers use themobile phone for receiving a rather wide variety of information. Forevery type of information indicated in the table the usage rangesbetween 60-70 percent. However, the most sought after areas seem tobe information relating to market prices (75%), sustainable agriculturalpractices (77.2%), government schemes (67.2%) and weatherinformation (61.9%). Studies by Mittal and Tripathi (2009) showedthat most of the famers sought information regarding seeds and marketprice was the second most sought.
According to Table 5, it was seen that besides the mobile phone,framers also sought agriculture related information from other sources.
Table 5
Sl.no Sources of information f Percent
1 Newspaper 52 28.9
2 Radio 137 76.1
3 TV 157 87.2
4 Farm magazine 77 42.8
5 Mobile Phone 148 82.2
6 Internet 18 10.0
7 Krishi Vigyan Kendra 78 43.3
8 Kisan Call Center 58 32.2
9 Others 5 2.8
N=180 Sources of Information on Sustainable Agriculture
Usage of Mobile Communication for Sustainable Agricultural Development in Karnataka, IndiaOnkargouda Kakade, Tahmeena Nigar Sultana Kolar
JMSD, July-Sept. 2014 / 30 JMSD, July-Sept. 2014 / 31
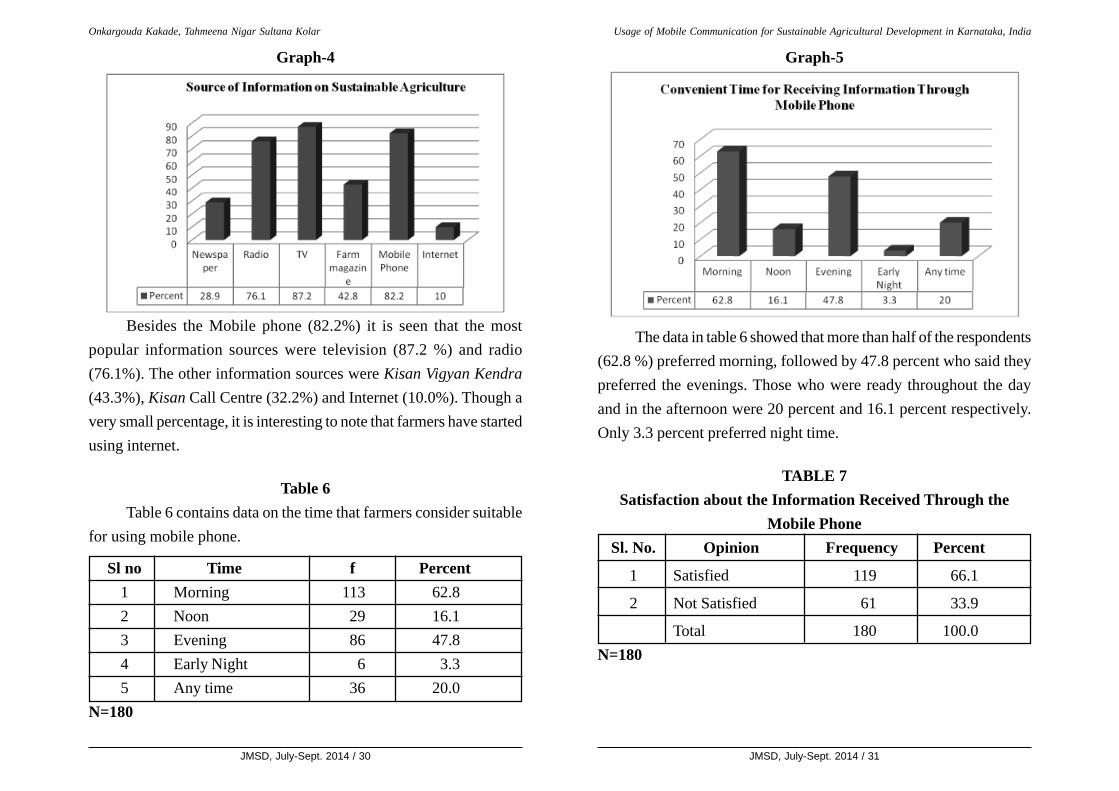
Besides the Mobile phone (82.2%) it is seen that the mostpopular information sources were television (87.2 %) and radio(76.1%). The other information sources were Kisan Vigyan Kendra(43.3%), Kisan Call Centre (32.2%) and Internet (10.0%). Though avery small percentage, it is interesting to note that farmers have startedusing internet.
Table 6Table 6 contains data on the time that farmers consider suitable
for using mobile phone.
Sl no Time f Percent1 Morning 113 62.82 Noon 29 16.13 Evening 86 47.84 Early Night 6 3.35 Any time 36 20.0
N=180
The data in table 6 showed that more than half of the respondents(62.8 %) preferred morning, followed by 47.8 percent who said theypreferred the evenings. Those who were ready throughout the dayand in the afternoon were 20 percent and 16.1 percent respectively.Only 3.3 percent preferred night time.
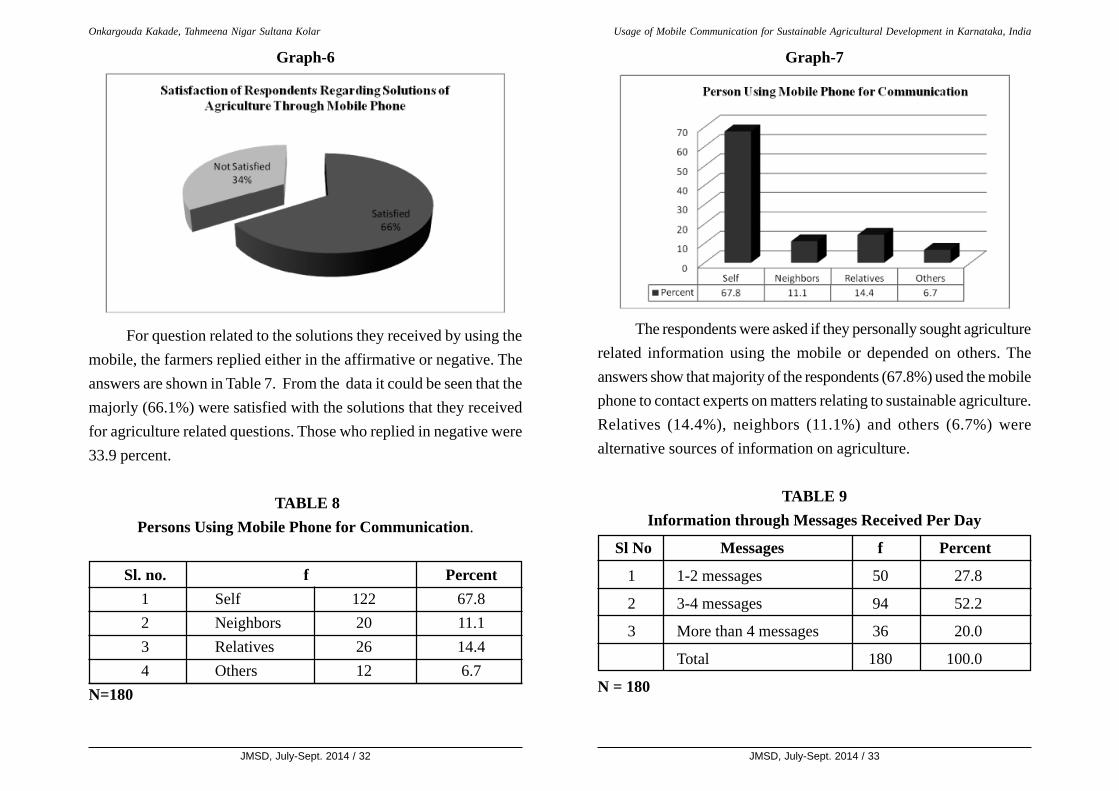
TABLE 7Satisfaction about the Information Received Through the
Mobile PhoneSl. No. Opinion Frequency Percent
1 Satisfied 119 66.1
2 Not Satisfied 61 33.9
Total 180 100.0N=180
Graph-4 Graph-5
Usage of Mobile Communication for Sustainable Agricultural Development in Karnataka, IndiaOnkargouda Kakade, Tahmeena Nigar Sultana Kolar
JMSD, July-Sept. 2014 / 32 JMSD, July-Sept. 2014 / 33
For question related to the solutions they received by using themobile, the farmers replied either in the affirmative or negative. Theanswers are shown in Table 7. From the data it could be seen that themajorly (66.1%) were satisfied with the solutions that they receivedfor agriculture related questions. Those who replied in negative were33.9 percent.
TABLE 8Persons Using Mobile Phone for Communication.
Sl. no. f Percent1 Self 122 67.82 Neighbors 20 11.13 Relatives 26 14.44 Others 12 6.7
N=180
The respondents were asked if they personally sought agriculturerelated information using the mobile or depended on others. Theanswers show that majority of the respondents (67.8%) used the mobilephone to contact experts on matters relating to sustainable agriculture.Relatives (14.4%), neighbors (11.1%) and others (6.7%) werealternative sources of information on agriculture.
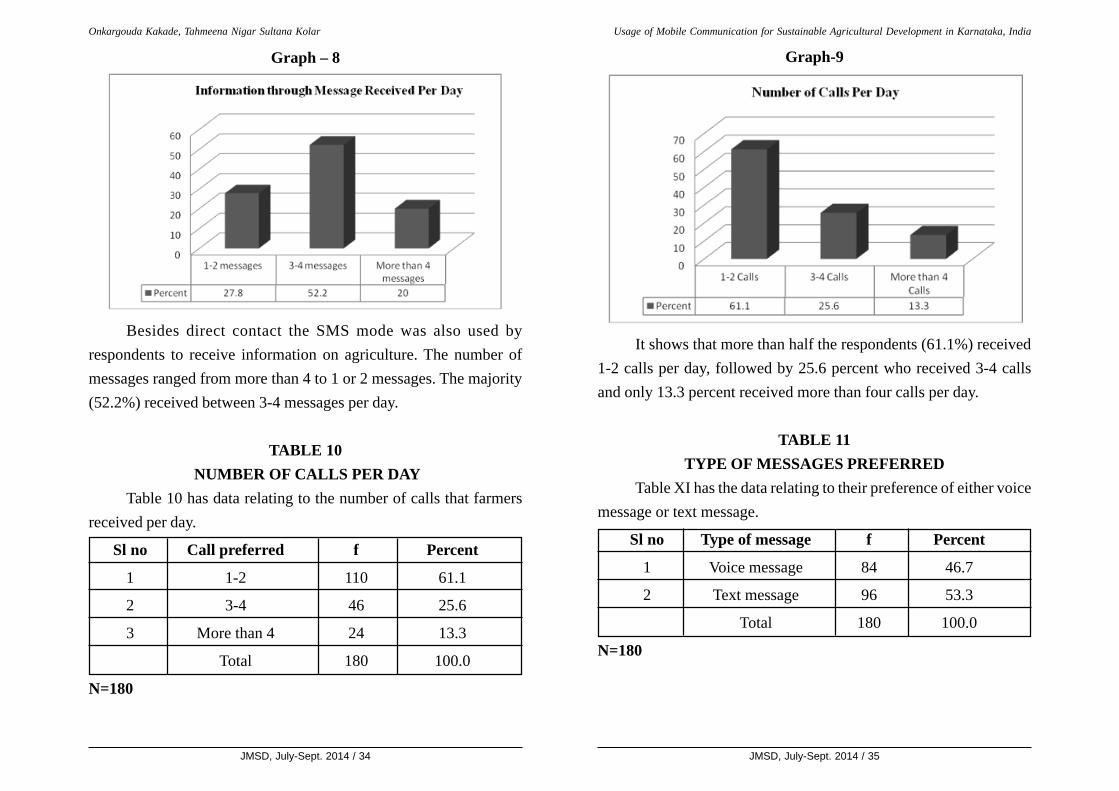
TABLE 9Information through Messages Received Per Day
Sl No Messages f Percent
1 1-2 messages 50 27.8
2 3-4 messages 94 52.2
3 More than 4 messages 36 20.0
Total 180 100.0
N = 180
Graph-6 Graph-7
Usage of Mobile Communication for Sustainable Agricultural Development in Karnataka, IndiaOnkargouda Kakade, Tahmeena Nigar Sultana Kolar
JMSD, July-Sept. 2014 / 34 JMSD, July-Sept. 2014 / 35
Besides direct contact the SMS mode was also used byrespondents to receive information on agriculture. The number ofmessages ranged from more than 4 to 1 or 2 messages. The majority(52.2%) received between 3-4 messages per day.
TABLE 10 NUMBER OF CALLS PER DAY
Table 10 has data relating to the number of calls that farmersreceived per day.
Sl no Call preferred f Percent
1 1-2 110 61.1
2 3-4 46 25.6
3 More than 4 24 13.3
Total 180 100.0
N=180
It shows that more than half the respondents (61.1%) received1-2 calls per day, followed by 25.6 percent who received 3-4 callsand only 13.3 percent received more than four calls per day.
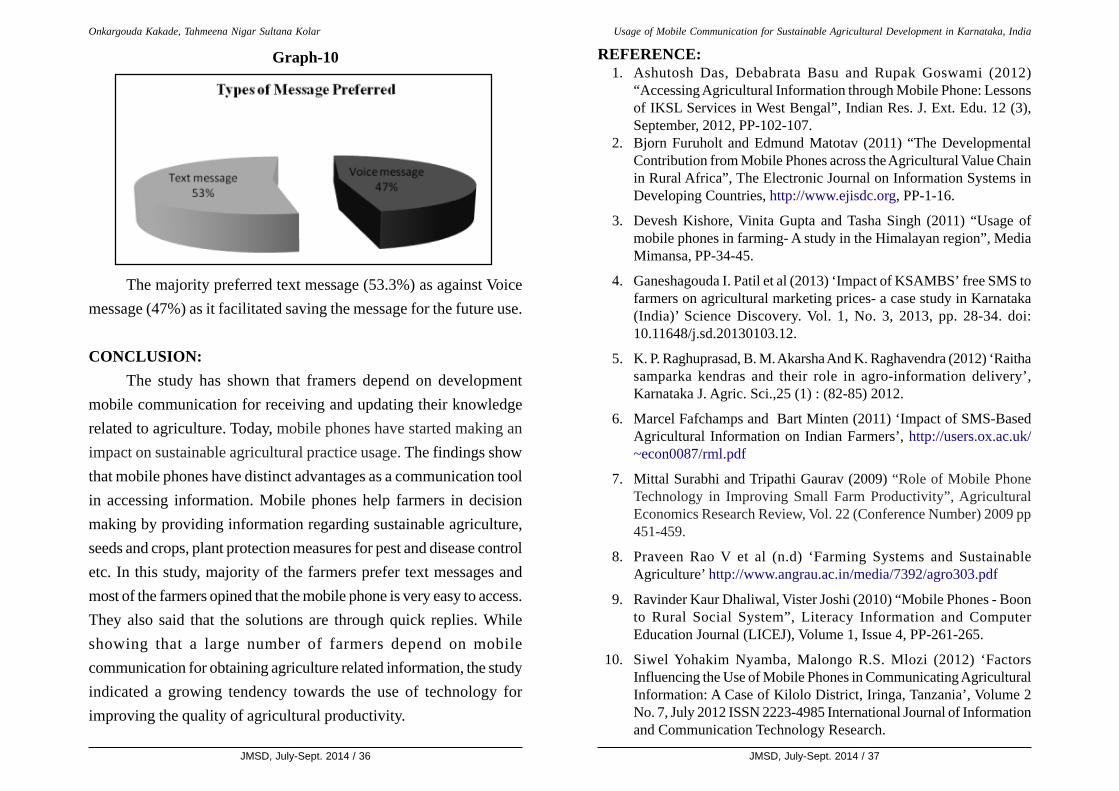
TABLE 11TYPE OF MESSAGES PREFERRED
Table XI has the data relating to their preference of either voicemessage or text message.
Sl no Type of message f Percent
1 Voice message 84 46.7
2 Text message 96 53.3
Total 180 100.0
N=180
Graph – 8 Graph-9
Usage of Mobile Communication for Sustainable Agricultural Development in Karnataka, IndiaOnkargouda Kakade, Tahmeena Nigar Sultana Kolar
JMSD, July-Sept. 2014 / 36 JMSD, July-Sept. 2014 / 37
The majority preferred text message (53.3%) as against Voicemessage (47%) as it facilitated saving the message for the future use.
CONCLUSION:The study has shown that framers depend on development
mobile communication for receiving and updating their knowledgerelated to agriculture. Today, mobile phones have started making animpact on sustainable agricultural practice usage. The findings showthat mobile phones have distinct advantages as a communication toolin accessing information. Mobile phones help farmers in decisionmaking by providing information regarding sustainable agriculture,seeds and crops, plant protection measures for pest and disease controletc. In this study, majority of the farmers prefer text messages andmost of the farmers opined that the mobile phone is very easy to access.They also said that the solutions are through quick replies. Whileshowing that a large number of farmers depend on mobilecommunication for obtaining agriculture related information, the studyindicated a growing tendency towards the use of technology forimproving the quality of agricultural productivity.
Graph-10 REFERENCE:1. Ashutosh Das, Debabrata Basu and Rupak Goswami (2012)
“Accessing Agricultural Information through Mobile Phone: Lessonsof IKSL Services in West Bengal”, Indian Res. J. Ext. Edu. 12 (3),September, 2012, PP-102-107.
2. Bjorn Furuholt and Edmund Matotav (2011) “The DevelopmentalContribution from Mobile Phones across the Agricultural Value Chainin Rural Africa”, The Electronic Journal on Information Systems inDeveloping Countries, http://www.ejisdc.org, PP-1-16.
3. Devesh Kishore, Vinita Gupta and Tasha Singh (2011) “Usage ofmobile phones in farming- A study in the Himalayan region”, MediaMimansa, PP-34-45.
4. Ganeshagouda I. Patil et al (2013) ‘Impact of KSAMBS’ free SMS tofarmers on agricultural marketing prices- a case study in Karnataka(India)’ Science Discovery. Vol. 1, No. 3, 2013, pp. 28-34. doi:10.11648/j.sd.20130103.12.
5. K. P. Raghuprasad, B. M. Akarsha And K. Raghavendra (2012) ‘Raithasamparka kendras and their role in agro-information delivery’,Karnataka J. Agric. Sci.,25 (1) : (82-85) 2012.
6. Marcel Fafchamps and Bart Minten (2011) ‘Impact of SMS-BasedAgricultural Information on Indian Farmers’, http://users.ox.ac.uk/~econ0087/rml.pdf
7. Mittal Surabhi and Tripathi Gaurav (2009) “Role of Mobile PhoneTechnology in Improving Small Farm Productivity”, AgriculturalEconomics Research Review, Vol. 22 (Conference Number) 2009 pp451-459.
8. Praveen Rao V et al (n.d) ‘Farming Systems and SustainableAgriculture’ http://www.angrau.ac.in/media/7392/agro303.pdf
9. Ravinder Kaur Dhaliwal, Vister Joshi (2010) “Mobile Phones - Boonto Rural Social System”, Literacy Information and ComputerEducation Journal (LICEJ), Volume 1, Issue 4, PP-261-265.
10. Siwel Yohakim Nyamba, Malongo R.S. Mlozi (2012) ‘FactorsInfluencing the Use of Mobile Phones in Communicating AgriculturalInformation: A Case of Kilolo District, Iringa, Tanzania’, Volume 2No. 7, July 2012 ISSN 2223-4985 International Journal of Informationand Communication Technology Research.
Usage of Mobile Communication for Sustainable Agricultural Development in Karnataka, IndiaOnkargouda Kakade, Tahmeena Nigar Sultana Kolar
JMSD, July-Sept. 2014 / 38 JMSD, July-Sept. 2014 / 39
INTRODUCTION“The narrative and representational aspects of film make it a
wholly unique form of art. Moreover, the collective experience of filmas art renders it a wholly distinct leisure activity. The unique propertiesof attending the cinema can have decisively positive effects on mentalhealth. Cinema attendance can have independent and robust effectson mental wellbeing because visual stimulation can queue a range ofemotions and the collective experience of these emotions through thecinema provides a safe environment in which to experience roles andemotions we might not otherwise be free to experience. The collectivenature of the narrative and visual stimulation makes the experienceenjoyable and controlled, thereby offering benefits beyond mere visualstimulation. Moreover, cinema is unique in that it is a highly accessiblesocial art form, the participation in which generally cuts acrosseconomic lines. At the same time, attending the cinema allows for theexercise of personal preferences and the human need for distinction.In a nutshell, cinema attendance can be both a personally expressiveexperience, good fun, and therapeutic at the same time (Noah Uhrig,2005)”. In a simple way, the author clearly brings out the cause andimpact of cinema.
Cinema has been continuously striving to document emotions,feelings and experiences. From cave engravings to digital art theintense urge to retain visions and images, has resulted in human beingstrying to preserve these feelings. This concept of ‘Persistence ofvision’- an ability of the human brain to retain images for a briefperiod after they disappear from the field of vision (Kupsc Jarek, 2003),led man to hold on to images physically so that he could visit them asand when he wished.
Roopa K.N.
VIEWPOINTCinema and Construction of Identity:Dr Rajkumar Phenomenon inKarnataka
ROOPA K.N
Abstract Aided by science and technology cinema has become a mediumfor entertainment, business, dialogue, propaganda, education,religion, and culture. The year 1954 becomes extremely importantfor Kannada cinema as there comes a turning point. The movie BedaraKannappa starring S. P. MuthuRaj rechristened as Rajkumar by thefilm’s producer Gubbi Veeranna was released. The movie created boxoffice history gave a much needed boost to the ailing and strugglingKannada cinema. Rajkumar was to set the standards for both actingskills, sustenance and consolidation of the mass adulation thatfollowed him. He was a product of theatre which nurtured and refinedhim. His impeccable voice complimented his acting. Anothersignificant contribution has been introducing the best of Kannadaliterary works and poetry to the Kannada subaltern by their cinematicreproductions. Gradually, one sees the evolution of a least educated,rural, backward caste man becoming the symbol of Kannada, culturalicon and the identity of Kannada cinema.
Key Words: Kannada Cinema, Culture, Rajkumar, Subaltern heroAuthor: Roopa K.N., Assistant Professor, PG Dept of PoliticalScience, Maharani’s College, Mysore 570005; email:[email protected]
Cinema and Construction of Identity: Dr Rajkumar Phenomenon in Karnataka

JMSD, July-Sept. 2014 / 40 JMSD, July-Sept. 2014 / 41
(PuttaSwamy, 2009). Hindi cinema presented its first talkies with ‘Alam Ara’ in 1931, Kannada cinema soon followed it with its firsttalkie in 1934. In the initial years films produced in India were nothingbut extensions of theatre productions which were recorded andpresented. Such productions strove and survived on mythologicalstories.
Interestingly, the first Kannada movie ‘VasanthaSena’ broughttogether noted literary figure T. P. Kailasam , well known cameramanMohan Bavnani of Central Film Divisions, G. K. Nanda, a Professorat University of Mysore, S.S. Narayana Shastri, a social activist,Kamala Devi Chattopadhya, writer Ajjampura Sitaram, Journalist B.S.Rama Rao, D. K. Bharadwaj well known for his English-Kannadadictionary, art critic and painter G. Venkatachala and other intellectuals,artists and technologists. In fact, the synopsis of the movie was writtenby poet-writer James Cousins. It was for the first time that expertsbelonging to various fields of literature, music, education, theatre cametogether.
With such an auspicious beginning Kannada cinema did notlook back. However, it had to wait for another four years for its firsttalkie production ‘Sati Sulochana’. Even this movie was notuneventful. It was a movie produced entirely outside Karnataka inKolhapur and by non - Kannadigas. With such an eventful andfabulous beginning, Kannada cinema had to wait till 1954 to becomean important and profitable industry. Between 1934 and 1954 themovies produced by Kannada film industry were only 40.
The reasons for this shortfall were several. Unlike Hindi,Marathi, Tamil and Telugu film industry Kannada industry wasstruggling with infancy and its attributes, was unable to cope withlarge scale funding requirements and lavishness associated with other
Beginning with Zoetrope, a Grecian visual instrument, Augusteand Louis Lumiere in March 22 1895 who developed an apparatuscalled Cinematographe, which combined the functions of a moviecamera, film printer and film projector no one then would haveimagined the impact of cinema on the modern era. Inventions andinnovations of Eadweard Muybridge, George Eastman, Thomas AlvaEdison, Thomas Armat etc., coupled with entrepreneurial zeal of fewset the ball rolling in the media world which is yet to stop.
Aided by science and technology cinema has become a mediumfor entertainment, business, dialogue, propaganda, education, religion,and culture. By recreating history, representing the present and ideatingabout the future, cinema has led and is leading men and women aliketo a surreal world. Cinema means different things to people, if it isescapism for some; it is an experience of the untold, unheard andunseen visualizations to the uninitiated, uneducated or the ignorant.It has been the cheapest source of entertainment. Hence, it is no wonderwith the world’s second largest population and also with more than33% (The World Bank Report, 2013) living below the poverty linecinema in India becomes a clear favourite to escape from the dailygrind and rigour of a hard and monotonous life. It should be no surprisethat India today is the largest producer of movies.
History of Kannada CinemaThe inception of cinema in India began in 1913 with ‘Raja
Harishchandra’, a silent movie produced by Dada Saheb Phalke.Puttaswamy refers to cinema’s loss of global identity once it embraced‘sound’ as part of its continuous technological evolution. When themovie was silent it belonged to everybody the moment it began talking,the emergence of Talkies, cinema became cinema with varied histories
Roopa K.N. Cinema and Construction of Identity: Dr Rajkumar Phenomenon in Karnataka
JMSD, July-Sept. 2014 / 42 JMSD, July-Sept. 2014 / 43
of devotion and accessibility to salvation. The story of a hunterbelonging to a marginalized section of society, ostracized for no faultof his by a feudal, exploitative, discriminatory structured society,seeking the path to spiritual salvation despite numerous obstaclestouched the raw nerve of the masses and elites alike. The movie as aprotest against institutional religion and the triumph of an underdogset numerous precedents in terms of cinematic history of Kannadacinema. It was the first Kannada movie which ran successfully for365 days. It won the first best regional film award instituted by thecentral government to encourage regional films, in the year 1954. Itincorporated the then latest technology available. Also, it gaveimmense boost to the unification movement of Karnataka. Besides itwas also the launching pad for Rajkumar as a cine star. Though hehad honed his acting skills in Gubbi Veeranna’s theatre troupe andwas one of the main actors in an earlier movie titled ‘Saptharishi’, itwas the role of Bedara Kannappa which set the momentum towardshis eventual stardom. Probably, neither Gubbi Veeranna nor Rajkumarknew that they were creating cinematic history. His growth becameso phenomenal that Rajkumar is identified as Kannada Cinema andvice versa.
Hence, the creation and sustainability of Rajkumar as a superstarbecomes all the more important. As Saibal Chatterjee says, creationof cinematic superstars, “is an ongoing process, even lifelong process,a result of calculated risks and inspired artistic and business moves”(Anil Saari, 2011). Further, he states that the popular clout of amegastar stems as much from the fictional characters that she or heportrays as from their perceived personal attributes. In understandingthe rise and consolidation of Rajkumar not only as an actor parexcellence but also the first mega star of Kannada film industry lies
industries. Besides, Kannada movies lacked innovations, as was thecase with the others. The cinema watchers had to watch the samestories which they already had viewed as plays. They were not willingto see recorded presentations of already viewed theatre works. Addedto that was Second World War and restrictions, both economic andpolitical. Any depiction of Indian mythological or historical heroeswas seen as anti-national. And the biggest cause for concern was thefact that Kannada speaking areas were spread over other provinces,reducing Kannada speaking population to a minority except in thePrincely state of Mysore. This resulted in the distribution problemand also brought a competition from other well established languagemovies.
The Birth of Stardom in Kannada CinemaThe year 1954 becomes extremely important for Kannada
cinema as this became a turning point. The movie Bedara Kannappastarring S. P. MuthuRaj rechristened as Rajkumar by the film’sproducer Gubbi Veeranna was released. It was the movie version of asuccessful drama by the same name produced by one of the pillars ofKannada theatre, Gubbi Veeranna. He produced this movie under thebanner of Karnataka Film Institute. The movie created box officehistory and gave the much needed boost to the ailing and strugglingKannada cinema. For once making movies in Kannada lookedencouraging, profitable and sustainable. It also saw the emergence ofa cine star in the form of Rajkumar, who for the next five decadeswould be the undisputed king of Kannada cinema.
Bedara Kannappa became a benchmark for devotional movies.It wasn’t that there were no devotional movies before, but this moviegave a whole new dimension to the concept of common man’s concept
Roopa K.N. Cinema and Construction of Identity: Dr Rajkumar Phenomenon in Karnataka
JMSD, July-Sept. 2014 / 44 JMSD, July-Sept. 2014 / 45
major parts of Karnataka for nearly two long years. It inspired manyeducated youth to take up agriculture as a profession and contributeto nation building. Anna Thangi, Mannina Maga, MallammanaPavada, Bhoodana, Punarjanma, Doorada Betta, Mayor Muttanna,Bangaradha Panjara, Sampathige Savaal, Rayara Sose and followedby Karuneye Kutumbada Kannu, Kulavadhu, Gaaligopura,Bangaradha Hoovu, Naandi, Uyyale, Kasturi Nivasa, Eradu Kanasuare memorable movies which will assure a successful rerun if releasedeven today. In simple terms, he was to excel in any genre.
He brought in his own method of acting which was subtle yetimpactful unlike the melodramatic styles of the well established stars.He brought in a style which suited the sentiments and culture ofKannadigas. He aroused patriotic passions, espoused family values,stirred emotions, showed many a wayward youth the right path, helpedcorrect mistakes of elders, inspired people to modify their wrongsinto right, wove the magic web of surreal, respected women, wooedand loved women in a dignified way. In all, he has been an epitome ofan ideal son, brother, lover, husband, father, saint, king and citizen inthe roles depicted. He has been a classic example of ‘how one shouldbe’. Different genres meant different sections of society too. Herewas one mass Icon who was generating audience. He was makinginroads into the rural audience, which mattered for numbers andsustenance of hero worship.
Construction of Identity of RajkumarWeren’t MGR and NTR the same? If not what makes Dr.
Rajkumar stand apart? What were the factors behind his allure andendurance which hold sway even today?
“It is not enough if you are a good man, you must create an
the secret behind understanding the same of Indian film industry.Initiated into the world of theatre as a child artist for S. P
Muthuraj, acting as a calling not by choice but a compulsion to saturateand shoulder family responsibilities. But even he would not haveimagined that he would grow into an industry. His father too was awell known professional actor who made his living in Subbaiah Naiduand Gubbi Veeranna’s theatre troupes respectively. His younger brotherand sister too tried their hands at acting but it was he, a fourth standardschool dropout , with a soulful voice and impeccable acting skills,scrubbed, and refined by the world of night long drama enactments,who scaled unprecedented heights of cinematic glory. He was to setthe standards for both acting skills and sustenance and consolidationof the mass adulation that followed him.
Here was a man who appealed to all classes, sections of oursociety irrespective of caste, religion, status, region, skilled, unskilled,gender, young or old. Though one sees the establishment ofVishnuvardhan in 1971 as a star in NagaraHaavu, who went on to actin 220 movies and considered as the second pillar of Kannada cinemaafter Dr Rajkumar, it was the latter whose appeal went beyond the oldMysore region. He showcased his acting talent in a wide variety ofroles , be it devotional- Bedara Kannappa, Bhakta Kanakadasa,Ohileshwara, Hari Bhaktha, Bhakta, Bhakta Chetha, Kabeera, SanthaThukaram, Sarvagna, Kaivara Narayanappa, Mantralaya Mahatme;historical- Ranadheera Kanteerva, Shri KrishnaDevaraya, HuliyaHaalina mevu mythological- Mahishasura Mardini, MohiniBhasmasura, Bookailasa, Bhakta Prahallada, Babhruvahana ormelodrama folk based movies- Katari Veera, Rajadurgadha Rahasya,Veerakesari and others.
Bangaradha Manushya broke box office records by running in
Roopa K.N. Cinema and Construction of Identity: Dr Rajkumar Phenomenon in Karnataka
JMSD, July-Sept. 2014 / 46 JMSD, July-Sept. 2014 / 47
belonging to any strata, religion, or caste. Hence, it was actingalone upon which he had to build his stardom. He was naturalwhen it came to acting, he was fortunate enough to have a mentorand guide in his father, Singanallur Puttaswamiah. He was a productof theatre which nurtured and refined him. His impeccable voicecomplimented his acting. But it was his family, especially his wifeand brother, who created the brand of a conscientious hero bychoosing literary works as stories for his movies and also got toproduce, market and distribute them. His family made sure that hefocused only on acting and singing.
His family’s first film production was his 21st picture Trimurtiunder the banner of Poornima enterprises. This was to counter theallegations that he as a star who interfered in movie making.Parvatamma’s step to protest this resulted in the establishment of oneof the most powerful production houses in the Kannada film industry.Subsequently, the next logical step was to get into distribution to checkthe problems associated with distribution, mainly monopoly, lowerpurchasing rates in old Mysore region and more so in the Hubli area.It was not that Kannada movie industry was chaotic or unorganizedsince its inception, It would be surprising for many to know that oneof the most important theatre companies, Gubbi Veeranna’s, whichheralded the growth of both theatre and cinema had a corporatestructure and approach to its organization and functioning. Forexample whether a lead actor, singer, director or the spot boy,everybody received their salaries on a weekly basis. Sharp businessacumen and an in depth understanding of the working of movieindustry led the Rajkumar family to initiate qualitative changes inproduction and distribution of Kannada movies. These resulted intremendous generation of revenue. For example, A group called
image that you are a good man. Every man must have an image. TakeNagi Reddi or S.S. Vasan or myself. Each of us has a distinct image.The image is what immediately strikes you when you see a person orhear his name. You put forward an image of yourself if you want toget anywhere” so said M.G. Ramchandran (Vaasanthi, 2006).
M.G.R’s appeal with the subaltern classes was based on acarefully created and crafted image both on screen and off screen, ofthat of a marginalized underdog who grows powerful enough todispense justice to the oppressed sections of society. The subalternidentified him with heroes existing in their folklore narratives. Heexploited this very image for his political advantage.
M.G.R, Karunannidhi and later J.Jayalalitha who claimed to bethe heir apparent to M.G.R’s ideology, utilized Dravidian movementand its anti-Brahmin, anti-Hindi manifesto to build their politicallegacy. Similarly, N. T. Rama Rao played to the gallery with hisnumerous successful performances of religious and mythologicalheroes, instantly connecting to the masses that for long had to bearthe brunt of Nizam’s reign, with Urdu being regarded as an elitistlanguage. So, if it was Tamil and Dravidian momentum in Tamil Naducinema and politics, it was Hindu religion and Telugu in AndhraPradesh. As Raghavendra says ‘the ideological hero therefore cameout of a politically polarized milieu in which mass mobilization hadtaken place and adversaries identified’ (M.K.Raghavendra, 2011.)
Rajkumar had no known historical enemies to slay or anexcessively oppressive system to demolish and claim the status of asavior and a hero. Mysore was a princely state known for its benevolentadministration. In fact, it was considered a model state even byMahatma Gandhi. So Rajkumar was to be the ‘ethical hero’, sans anypolitical ideology, someone who could be identified with everybody,
Roopa K.N. Cinema and Construction of Identity: Dr Rajkumar Phenomenon in Karnataka

JMSD, July-Sept. 2014 / 48 JMSD, July-Sept. 2014 / 49
years it reached 370 out of which he had acted in 117, totaling a numberof 121 movies (K. Puttaswamy, 2009).
It is no sheer coincidence that Rajkumar reached out as amobilizing factor for the unification of Karnataka in the 1950s, amovement started by literary and cultural leaders. Cinema was ableto reach out to the widely dispersed Kannada speaking populace. Hebecame the cultural symbol representing the Kannada language. Ifunification movement unified a territory on the basis of language,Kannada movies, especially Rajkumar’s which were largely cinematicversions of culturally accepted mythologies and popular literature,became a platform for Kannada which was non-existent earlier. Asstated earlier, the entry of sound, the language as a medium ofexpression gave a whole new dimension to cinematic narratives,culture and history. In the process of identification with andglorification of shared region, culture, history, Kannada became thecommon, collective factor with cinema infusing visual images forpeople to foster a sense of oneness. His role in seeking funds duringthe severe famine of 1961showed the depth of acceptance andreverence of him by the masses. This was one instance where theartists were looked upon with admiration.
Here was somebody who appealed most to the lesser educatedmiddle class and lower sections of society by the projection of values,ideals, aspirations, desires and dreams in the most commonsensicalway. It was another fact that Kannada and Kannada cinema werelooked down upon much by the then press and the elite. It was notuntil the Gokak movement of 1982 that the intelligentsia realized themass adulation and appeal of the cine star cutting across the populace.The entry of Rajkumar kick started the dormant movement to astatewide protest seeking the enactment of Kannada as the medium
Rajkumar Unity set up by the family, set in the strongly opposed normthat the star’s movies should not be released simultaneously. Thiswas at a time when 10 - 15 movies of Rajkumar would be released ina year. There were numerous instances where in at least three moviesof the star were released in one go. Besides, another important normthat the group followed was that there has to be a gap of minimum 6weeks between the release of one movie and another. Also, theybrought the norm of prioritizing releases on the basis of completion.These significant management changes ushered in an organized systemin a much confused and chaotic industry. The result was not onlybeneficial to Rajkumar but also to the movie industry.
Another significant contribution of this production anddistribution has been the introduction of the best of Kannada literaryworks and poetry to the Kannada subaltern by their cinematicreproductions. Further, a technological innovation ‘known as dubbing’saw its genesis in Kannada industry in 1943, turned out to be bane asit literally squeezed the industry in the 1950s. The Kannada movieswere not able to compete with the flood of dubbed versions of Tamil,Telugu, Marathi, Malayalam and Hindi movies. Protest against it wasweak as there were those who supported it saying that it gaveemployment to technicians, dubbing artists, writers and gave anopportunity to Kannadigas to see lavish and rich movies which couldnot be produced otherwise. It was during these trying times thatRajkumar gave a momentum to the protest movement by voicing hissupport against dubbing and vowed only to act in Kannada movies.
Since 1960s Kannada cinema saw immense growth in terms ofmarket and revenue. There can be no doubt as to who the chiefcontributor to this development was. Between 1934 and 1961 thenumber of movies produced in Kannada was 131 but in the next 10
Roopa K.N. Cinema and Construction of Identity: Dr Rajkumar Phenomenon in Karnataka
JMSD, July-Sept. 2014 / 50 JMSD, July-Sept. 2014 / 51
REFERENCES1. Ganapathi B., Kannadada Muthina Kathe- Rajkumar, Cinema Sahitya
Prakashana, Bangalore, 2006.
2. Kupsc Jarek, The History of Cinema for Beginners, Orient BlackSwan Private Limited, New Delhi, 110002, 2003.
3. PuttaSwamy K., Cinema Yaana- Kannada Chitraranga 75: OnduFlashback, (Kannada Cinema 75- A journey through the pages ofhistory) (1934-2009), Hasiru Prakashana, Bangalore,2009.
4. Raghavendra M.K., Bipolar Identity; Region, Nation, and theKannada Language Film, Oxford University Press, New Delhi, 2011.
5. Uhrig Noah S.C., Cinema is Good for You: The Effects of CinemaAttendance on Self-Reported Anxiety or Depression and ‘Happines,University of Essex, UK, 2005.
6. Vaasanthi, Cut-Outs, Caste and Cine Stars; The world of TamilPolitics, Penguin Books India Pvt Ltd, New Delhi, 2006.
7. World Bank Report, Poverty Reduction and Economic Management,2013
of instruction for education in schools, until then the movement wasconfined to a few protests and petitions to the negligent stategovernment.
Gradually, one sees the evolution of a least educated, rural,backward caste man becoming the symbol of Kannada, the culturalicon, the identity of Kannada cinema and an undisputed people’s leadereven though he shunned politics. He not being politically inclinedwas perhaps one of the major reasons as to why he was held in highesteem by a large number of people. The crest of popularity and iconicstatus intrigued even the star himself, who was supposedly one of thesimplest, humble and down to earth. From wanting a decent educationand grammar to being revered as a symbol of Kannada language musthave humoured the star.
Nevertheless, if cinema created a legend, the legendary statusalso thrust a representative role upon him which he was unable toshed off. Recollecting his kidnapping by Veerappan, the forest brigand,he shared his inner turmoil with Nedumaran, the Tamil journalist andmediator, about him being a family man and how acting was hisvocation, with his world consisting of his children and having leastknowledge of the external world (Ganapathi, 2006).
The impact of his death resulted in large scale shut downs anddisturbances. It was a way for his adulators, fans to vent out theirfrustration and anger on the loss of their Hero, apart from the fact thattrouble mongers made the best of the chaos. It was a clear indicatorthat he was not being identified with cinema industry but was also thesymbol of Kannada and Karnataka.
Roopa K.N. Cinema and Construction of Identity: Dr Rajkumar Phenomenon in Karnataka
JMSD, July-Sept. 2014 / 52 JMSD, July-Sept. 2014 / 53
Authors: N. Usha Rani, Professor, Department of Communicationand Journalism, Manasagangotri, University of Mysore, Mysore-570 006. email: [email protected] Kadanakuppe, Reporter, Prajavani Kannada Daily,Mysore. Email: [email protected] , [email protected]
INTRODUCTIONIndia has 3,393 engineering colleges that can accommodate 1.5
million seats perhaps highest in professional education sector in therecent history with over 65% of colleges situated in South India.Karnataka, one of the four states of South India, is IT bowl of Indiathat has 187 engineering colleges offering 81,432 seats. Karnatakatops in India in the Information technology and bio-technology sectorswith about 40% share of annual software export from India. Theengineering colleges have increased by leaps and bounds withoutadequate planning, resources, infrastructure, trained teachers and basicfacilities. The quality of engineering education imparted in the collegesacross the country has suffered making the graduates unemployable.Chief mentor of Infosys, the global IT giant, Narayana Murthy saidthat ‘quality of the engineering graduates (in India) varied, and only25 per cent of them were employable as per the McKinsey report.This means that 75 per cent of engineering graduates areunemployable, which calls for improving the quality of technicaleducation’ (Murthy, 2006). Faced with significant increase inenrollments, many engineering colleges in India are not adequatelyequipped leading to deterioration in the quality of technical education.The rapid changes in technology have enhanced the needs andexpectations of the students. It is in this perspective India proposed touse EDUSAT, India’s first ever-exclusive satellite dedicated toeducation to facilitate a non-conventional method of teaching and
Communication Technology andDevelopment – A Study of E-learningIntervention in EngineeringEducation in Karnataka, India
N. USHA RANINESARA KADANAKUPPE
AbstractThe present study aims to evaluate the impact of e-learning on
engineering students in the State of Karnataka, the silicon valley ofIndia to understand the intervention of communication technology ineducation. The study selected a random sample of 613 engineeringstudents based on the enrollment registers across 8 engineeringcolleges that are part of the network of colleges hooked on to satellitebased e-learning programs in professional education. On the wholethe study establishes that communication technology has given a newmodel of learning in making the professional education moremeaningful and relevant. The integration of technology withconventional method of teaching has given a new instructional modelbased on the elements of e-learning. The model envisages access,greater degree of participation, student-centric approach,individualized learning and teaching practices. E-learning is a newdependable initiative in teaching-learning process in professionaleducation, says the study.
Key Words: E-learning, conventional teaching, interactivity, prerecorded video
N. Usha Rani, Nesara Kadanakuppe Communication Technology and Development – A Study of E-learning Intervention ....
JMSD, July-Sept. 2014 / 54 JMSD, July-Sept. 2014 / 55
LITERATURE REVIEWThe search for related research studies on e-learning shows that
the topic has been widely researched. All studies endorse thehypothesis that e-learning improves learning outcome provided it issupported by adequate infrastructure, learning materials, goodgovernance, qualified teachers and professionalism. Majority of thestudies support the contention that e-learning has evokedoverwhelming response in educational sector. Research shows that e-learning not only produce promising effects but more ‘technology-rich environment delivers greater impacts’(White paper e-learning,2012). Studies have illustrated that integration of conventional i.e..face to face classroom teaching and e-learning is comparatively moreadvantageous to just teacher based classroom teaching or technologyaided e-learning (U.S.Dept.of Education, 2010, Global). E-learninghas more positive effect due to its learner-centered approach facilitatingindependent learning atmosphere and would make learners moreeffective at reinforcing their knowledge besides increasing learnermotivation. (Golden, McCrone, Walker, Rudd, 2006). Despite theoverwhelming presence of technology, the success of e-learning alsodepends on some of the fundamental issues like providing a host ofnew support requirements and resources by the institutions throwsinsight into the challenges of e-learning (Impact and Challenges of e-learning, 2003). One of the findings says that e-learning will be moreeffective when teachers are adequately trained to develop skills andimprove their confidence in using E-learning ‘with implementationvarying greatly between subjects and departments’ (Harris, Hall,Muirhead, McAteer, Schmoller, Thorpe, 2004). Further the supportof leadership and management are crucial in increasing the level ofimpact on learners (Ibid). There is enough empirical evidence toestablish the positive impact of e-learning in medical education.Medical students believe the role of e-learning to be complementary
learning in professional engineering colleges in India. The pilot projectconceived in the first phase of EDUSAT has established connectivityamong colleges imparting technical education. The networkingthrough satellite has brought in some fundamental changes in theconventional method of teaching in engineering colleges. The presentstudy aims to evaluate the impact of e-learning on engineering studentsin the state of Karnataka, branded as the IT bowl of India, to evaluatethe intervention of communication technology in crucial sector ofprofessional education.
Concept of E-learningApplication of space technology to deal with the problems of
education is not new to India. According to the Department of Space,EDUSAT program was launched to provide a sustainable distanceeducation service in India using advanced space technology and groundtechnology of media convergence. E-learning program under study isa system where Classrooms are linked with teachers via satellite.Initially, in a pilot project e-learning was linked via EDUSAT, India’sfirst exclusive satellite for education, connecting engineering collegesusing INSAT 3A. In Karnataka State, the studio where the teachingoriginates and uplink earth station were located at DSERT, Bangalore,India. The network is interactive consisting of two-way video andtwo-way audio facility and consists of 1.2 meter antenna installed inengineering colleges. The transmission is either live or recorded withlessons originating from studio-based teacher. Two kinds of classroomswere created such as., one interactive and the other non-interactivewith provision for students to use land phone, mobile or e-mail forinteraction.
N. Usha Rani, Nesara Kadanakuppe Communication Technology and Development – A Study of E-learning Intervention ....
JMSD, July-Sept. 2014 / 56 JMSD, July-Sept. 2014 / 57
shifts control from teacher to students (Ibid). Researchers have raisedissues on quality assurance for e-learning as this method has not beendeeply explored and recognized in traditional educational institutions.
METHODOLOGYE-learning is a new technology that is making inroads into higher
education in India. Nevertheless, it is a novel method of teaching andlearning with very low percentage of colleges having access to thisadvanced technology. Given the potentialities of e-learning in creatingeducational opportunities for students, this study speculates its rapidexpansion in colleges in a few years from now. Therefore, this studyintends to evaluate the level of awareness, perception and the state ofadoption of new technology method of learning in professionaleducation.
Objectives of the Study1. To evaluate the uses & gratification of e-learning in professional
education in general & engineering education in particular.2. To measure the level of influence of new technology based e-
learning on the academic performance of the engineering students3. To investigate the preferences of the students regurding the method
of classroom learning.
This is a survey of 8 engineering colleges in the state ofKarnataka. The selection of colleges was based on following criteria:
1. College should be part of EDUSAT e-learning network.2. College must be telecasting e-learning programs regularly to
the students.3. College must have basic minimum infrastructure to access
satellite signals to receive the programs.
to conventional teaching rather than replacing lecture methods withstudents preferring an integration of both to have better learningoutcomes. The e-learning intervention in medical education can‘catalyze the shift towards applying adult learning theory, whereeducators will no longer serve mainly as the distributors of content,but will become more involved as facilitators of learning and assessorsof competency’ (Ruiz, Mintzer, Leipzig, 2006). There is need for astrong e-learning program in engineering education in Algeria says astudy. Nevertheless, the researchers points out that its implementationdepends on the adoption of formal and official strategy, participationby the academic community and the extent of support offered by theuniversity in terms of training, software platform, online resourcedevelopment and impact monitoring and assessment (Benchicou,Aichouni, Nehari, 2010). It calls for fundamental change in the attitudeof management, leaders, teachers and learners and demands hugeinfrastructure and financial support. The new communicationtechnology has influenced change in the model of e-learning improvingthe process, tools and elements. Cloud computing has become thebasis on which a new e-learning model called ‘collaborative learningcloud’ has been developed to obviously balance the teacher-learnerratio in the present e-learning applications especially in China (Liao,Wang, Ran, Yang, 2013). ‘By applying the knowledge modellingtechnique and the economic model of free market in the collaborativelearning cloud, virtual resources can be dispatched in the mostreasonable and effective way’. This model has been created toovercome the major barrier in e-learning, the tension between limitedinstructional resources and too many learning support demands (Ibid).E-learning is a tool of empowering the students as propounded inempowerment model (Harvey and Knight, 1996). In comparison witha conventional system of top down model of lecture method, e-learning
N. Usha Rani, Nesara Kadanakuppe Communication Technology and Development – A Study of E-learning Intervention ....
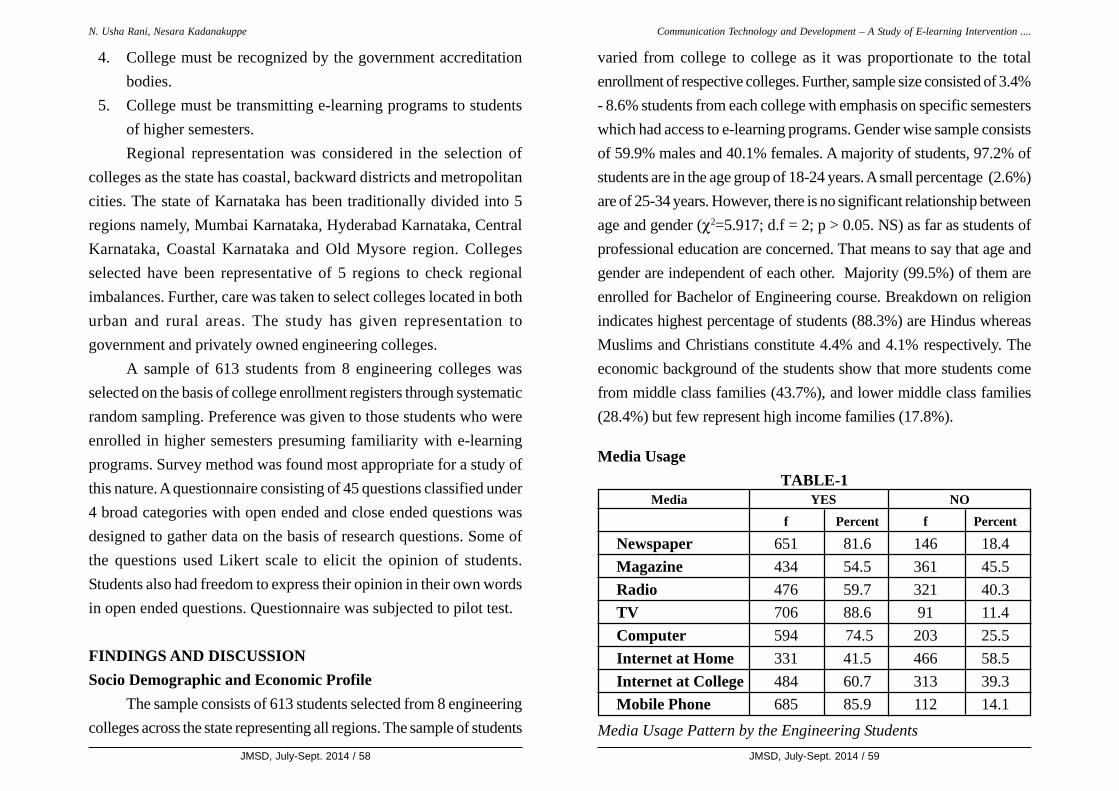
JMSD, July-Sept. 2014 / 58 JMSD, July-Sept. 2014 / 59
varied from college to college as it was proportionate to the totalenrollment of respective colleges. Further, sample size consisted of 3.4%- 8.6% students from each college with emphasis on specific semesterswhich had access to e-learning programs. Gender wise sample consistsof 59.9% males and 40.1% females. A majority of students, 97.2% ofstudents are in the age group of 18-24 years. A small percentage (2.6%)are of 25-34 years. However, there is no significant relationship betweenage and gender (χ2=5.917; d.f = 2; p > 0.05. NS) as far as students ofprofessional education are concerned. That means to say that age andgender are independent of each other. Majority (99.5%) of them areenrolled for Bachelor of Engineering course. Breakdown on religionindicates highest percentage of students (88.3%) are Hindus whereasMuslims and Christians constitute 4.4% and 4.1% respectively. Theeconomic background of the students show that more students comefrom middle class families (43.7%), and lower middle class families(28.4%) but few represent high income families (17.8%).
Media UsageTABLE-1
Media YES NOf Percent f Percent
Newspaper 651 81.6 146 18.4Magazine 434 54.5 361 45.5Radio 476 59.7 321 40.3TV 706 88.6 91 11.4Computer 594 74.5 203 25.5Internet at Home 331 41.5 466 58.5Internet at College 484 60.7 313 39.3Mobile Phone 685 85.9 112 14.1
Media Usage Pattern by the Engineering Students
4. College must be recognized by the government accreditationbodies.
5. College must be transmitting e-learning programs to studentsof higher semesters.Regional representation was considered in the selection of
colleges as the state has coastal, backward districts and metropolitancities. The state of Karnataka has been traditionally divided into 5regions namely, Mumbai Karnataka, Hyderabad Karnataka, CentralKarnataka, Coastal Karnataka and Old Mysore region. Collegesselected have been representative of 5 regions to check regionalimbalances. Further, care was taken to select colleges located in bothurban and rural areas. The study has given representation togovernment and privately owned engineering colleges.
A sample of 613 students from 8 engineering colleges wasselected on the basis of college enrollment registers through systematicrandom sampling. Preference was given to those students who wereenrolled in higher semesters presuming familiarity with e-learningprograms. Survey method was found most appropriate for a study ofthis nature. A questionnaire consisting of 45 questions classified under4 broad categories with open ended and close ended questions wasdesigned to gather data on the basis of research questions. Some ofthe questions used Likert scale to elicit the opinion of students.Students also had freedom to express their opinion in their own wordsin open ended questions. Questionnaire was subjected to pilot test.
FINDINGS AND DISCUSSIONSocio Demographic and Economic Profile
The sample consists of 613 students selected from 8 engineeringcolleges across the state representing all regions. The sample of students
N. Usha Rani, Nesara Kadanakuppe Communication Technology and Development – A Study of E-learning Intervention ....

JMSD, July-Sept. 2014 / 60 JMSD, July-Sept. 2014 / 61
television, listening to radio and using Internet do not depend on one’sage among engineering students. Newspapers, magazines, radio, computer, Internet at home and mobilephone usage pattern is related to family income says the study.Newspapers (χ2 = 38.637; d.f = 4; p < 0.001), magazines (χ2 = 42.533;d.f = 4; p < 0.001), radio (χ2 = 19.018; d.f = 4; p < 0.005), computer(χ2 = 38.242; d.f = 4; p < 0.001), Internet at home (χ2 = 45.681; d.f =4; p < 0.001) and mobile phone (χ2 = 14.244; d.f = 4; p <0.05) usageare significantly related with the family income. However, Television(χ2 = 4.793; d.f = 4; NS; p > 0.05) and Internet at college (χ2 =9.031; d.f = 4; NS p > 0.05.) usage is independent of family incomeof the students. That means, irrespective of family income studentsaccess TV and income has no bearing on the use of Internet at college.The major findings reveal that age is independent of media exposureamong students. There is no relation between age and exposure tonewspaper, radio, TV and Internet. However, the media exposureconsisting of exposure to newspaper, radio and Internet at home, iscorrelated with the family income says the study. Nevertheless, accessto TV and Internet at college is not correlated with the family incomeas there is increase in the penetration of TV among low incomehouseholds in India. TV (63.83%) is the primary source of news amongengineering undergraduates followed by Newspaper (55.82%).Students don’t get all their news from Internet (44.78%) says thefinding reflecting a low penetration of Internet in India. An estimated251.59 million (20%) people including 68 million in rural areas useinternet in India that accounts for 8.33 % of India’s share of worldInternet users. Of the total Internet users in India, almost 90 percentaccess the Internet through mobile phones thus bridging the digitaldivide to a great extent.
The media usage pattern reveals that highest percentage ofengineering students use TV (87.6%) followed by mobile phones(85.5%) and newspapers (80.1%) establishing that engineeringstudents read newspapers despite their equally high exposure to TVand mobile phones. Neither TV nor mobile phones have come in theway of influencing the newspaper reading habits among students.However, access to Internet at home is limited to 41.6% which is lessthan other media as India has low diffusion of Internet. Interestingly,access to Internet in college at 58.9% also shows that there was noaccess to Internet facility in some of the engineering colleges understudy.
There is no significant relationship between age and media usagesays the study. Newspaper (χ2 = 10.25; d.f = 6; p > 0.05; NS), Radio(χ2 = 4.22; d.f = 6; p > 0.05; NS), Television (χ2 = 5.35; d.f = 6; p> 0.05; NS) and Internet (χ2 = 2.15; d.f = 6; p > 0.05; NS) media areindependent of age. Irrespective of age, students show a commonpattern in the use of these media. Reading newspapers, watching
Graph -1
N. Usha Rani, Nesara Kadanakuppe Communication Technology and Development – A Study of E-learning Intervention ....
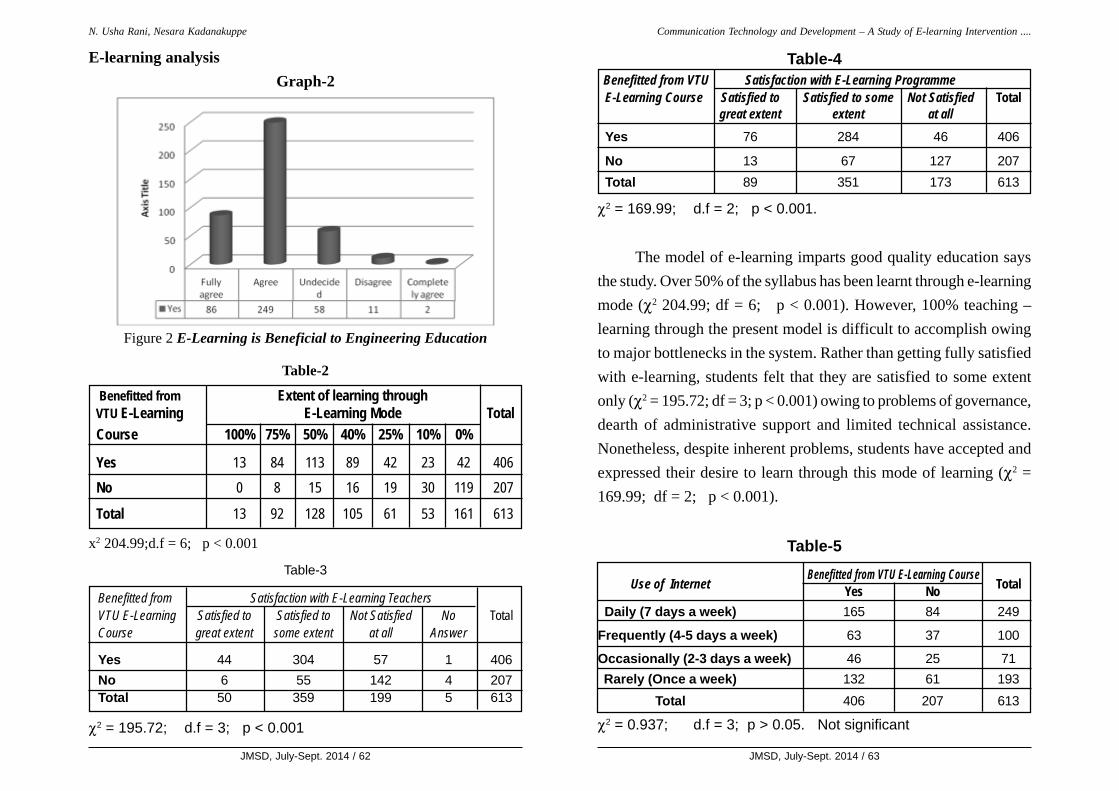
JMSD, July-Sept. 2014 / 62 JMSD, July-Sept. 2014 / 63
Table-4Benefitted from VTU Satisfaction with E-Learning ProgrammeE-Learning Course Satisfied to Satisfied to some Not Satisfied Total
great extent extent at allYes 76 284 46 406
No 13 67 127 207Total 89 351 173 613
χ2 = 169.99; d.f = 2; p < 0.001.
The model of e-learning imparts good quality education saysthe study. Over 50% of the syllabus has been learnt through e-learningmode (χ2 204.99; df = 6; p < 0.001). However, 100% teaching –learning through the present model is difficult to accomplish owingto major bottlenecks in the system. Rather than getting fully satisfiedwith e-learning, students felt that they are satisfied to some extentonly (χ2 = 195.72; df = 3; p < 0.001) owing to problems of governance,dearth of administrative support and limited technical assistance.Nonetheless, despite inherent problems, students have accepted andexpressed their desire to learn through this mode of learning (χ2 =169.99; df = 2; p < 0.001).
Table-5Benefitted from VTU E-Learning Course
Use of Internet Yes No Total
Daily (7 days a week) 165 84 249
Frequently (4-5 days a week) 63 37 100
Occasionally (2-3 days a week) 46 25 71Rarely (Once a week) 132 61 193
Total 406 207 613
χ2 = 0.937; d.f = 3; p > 0.05. Not significant
Figure 2 E-Learning is Beneficial to Engineering Education
Table-2
Benefitted from Extent of learning throughVTU E-Learning E-Learning Mode TotalCourse 100% 75% 50% 40% 25% 10% 0%
Yes 13 84 113 89 42 23 42 406No 0 8 15 16 19 30 119 207
Total 13 92 128 105 61 53 161 613
x2 204.99;d.f = 6; p < 0.001
Table-3
Benefitted from Satisfaction with E-Learning TeachersVTU E-Learning Satisfied to Satisfied to Not Satisfied No TotalCourse great extent some extent at all Answer
Yes 44 304 57 1 406No 6 55 142 4 207Total 50 359 199 5 613
χ2 = 195.72; d.f = 3; p < 0.001
E-learning analysisGraph-2
N. Usha Rani, Nesara Kadanakuppe Communication Technology and Development – A Study of E-learning Intervention ....

JMSD, July-Sept. 2014 / 64 JMSD, July-Sept. 2014 / 65
conventional teaching (χ2 = 96.91; df = 4; p < 0.001) and it cancompensate for the lack of resources in professional education((χ2 =134.35; df = 4; p < 0.001). The networked learning has providedabundant opportunities for solving the problems of the high profileengineering education.
Regarding the mode of e-learning there is consistently goodperformance when students were exposed to live telecast (χ2 = 123.37;df = 1; p < 0.001) of lectures rather than pre-recorded video lectures(χ2 = 5.41; df =1; p > 0.05).
Table-8 Benefitted from VTU Extent of learning through E-LearningE-Learning Course 100% 75% 50% 40% 25% 10% 0% Total
Yes 13 84 113 89 42 23 42 406No 0 8 15 16 19 30 119 207
Total 13 92 128 105 61 53 161 613
χ2 204.99; d.f = 6; p < 0.001.
Graph – 3
Table-6Benefitted from VTU E-Learning as alternativeE-Learning Course to Classroom Teaching Total
Yes NoYes 360 46 406
No 120 87 207
Total 480 133 613
χ2 = 76.052; d.f = 1; p < 0.001.
The study shows that Internet usage has not influenced e-learningby the students. Irrespective of their Internet usage pattern studentshave derived benefits from e-learning programs (χ2 = 0.937; df = 3; p> 0.05. NS). Both Internet and non Internet users have participatedand used e-learning material in their studies. E-learning model couldbe an alternative model of teaching-learning says the study (χ2 =76.052; df = 1; p < 0.001).
Table-7
Alternative to conventional teaching Solves Shortage of TeachersBenefits of Yes No Yes No TotalE-Learning
Yes 360 46 340 66 406
No 120 87 138 69 207
Total 480 133 478 135 613
χ2 = 96.91; df = 4; p < 0.001 χ2 = 23.28; d.f = 1; p < 0.001
Correlation between Benefits of E-Learning and Pattern of Usage
The study establishes that e-learning can overcome shortage ofgood teachers (χ2 = 23.28; df = 1; p < 0.001), it can complement
N. Usha Rani, Nesara Kadanakuppe Communication Technology and Development – A Study of E-learning Intervention ....

JMSD, July-Sept. 2014 / 66 JMSD, July-Sept. 2014 / 67
conventional college system. Students have been more active in thelive telecasts and the degree of interactivity is very high in suchprograms. The study reveals that students have not used mobiles, e-mails and letters to interact with the e-experts. There is no post learningactivity after the e-learning programs which is scientifically requiredin a systematic teaching-learning process. As far as quality ofeducational content is concerned, students have rated it as very good(6.52%), good (40.61%), neutral (26.91%), poor (7.83%) and verypoor (18.1%) where good outscores other levels.
Graph - 4
Students have rated the performance of e-learning programs intheir respective colleges as very good (8.48%), good (41.27%), average(25.61%), very poor (16.8%) and poor (7.83%) with over 50 per centof them recognizing e-learning programs as good in professionaleducation like engineering.
The study opines that the model of e-learning propounded byVTU (Vishveshwariah Technological University) gives expected
Of the different forms of e-learning, Full semester program (χ2
= 131.91; d.f = 8; p < 0.001.) was more productive than supplementary,single lesson program and exam-revision service. It is comparativelymore effective to have e-learning in semester program (χ2 = 79.22;d.f = 4; p < 0.001). Further those who have accessed e-lessons in fullsemester have vouched for the good quality of content rather thanthose who accessed them occasionally (χ2 = 225.76; df = 16; p <0.001).
The study shows that learning even through e-learning modedepends on the level of performance in the studies. There is correlationbetween the use of e-learning process and the level of academicperformance. Students who have consistently used e-learning resourceshave improved their performance. (χ2 = 129.81; df = 2;p < 0.001).There is correlation between student’s method of learning and e-learning (χ2 = 181.54; df = 2; p < 0.001).
There is no consistency in the students’ exposure to e-learningcontent. The highest exposure is in the category of once a month(35.07%) followed by 2 hrs per day (23.81%), 3 hrs per day (18.43%),1 hr per day (9.46%), once a week (6.85%) and 4 hrs per day (6.36%).There is correlation between the duration of the course and the typeof e-learning. Students with Full semester access prefer live lecturesto those with partial exposure to e-resources (χ2 = 306.97; df = 16; p< 0.001 ;) denoting that consistent exposure enables students to choosethe better mode of learning. Further there is significant relationshipbetween the duration of the course and the amount of learning throughe-mode. Students with Full semester exposure have comparativelyperformed extremely well than those who had partial exposure (χ2 =327.17; df = 20; p < 0.01;) establishing that the usage of e-learningmode calls for consistency for recognition and acceptance in the
N. Usha Rani, Nesara Kadanakuppe Communication Technology and Development – A Study of E-learning Intervention ....
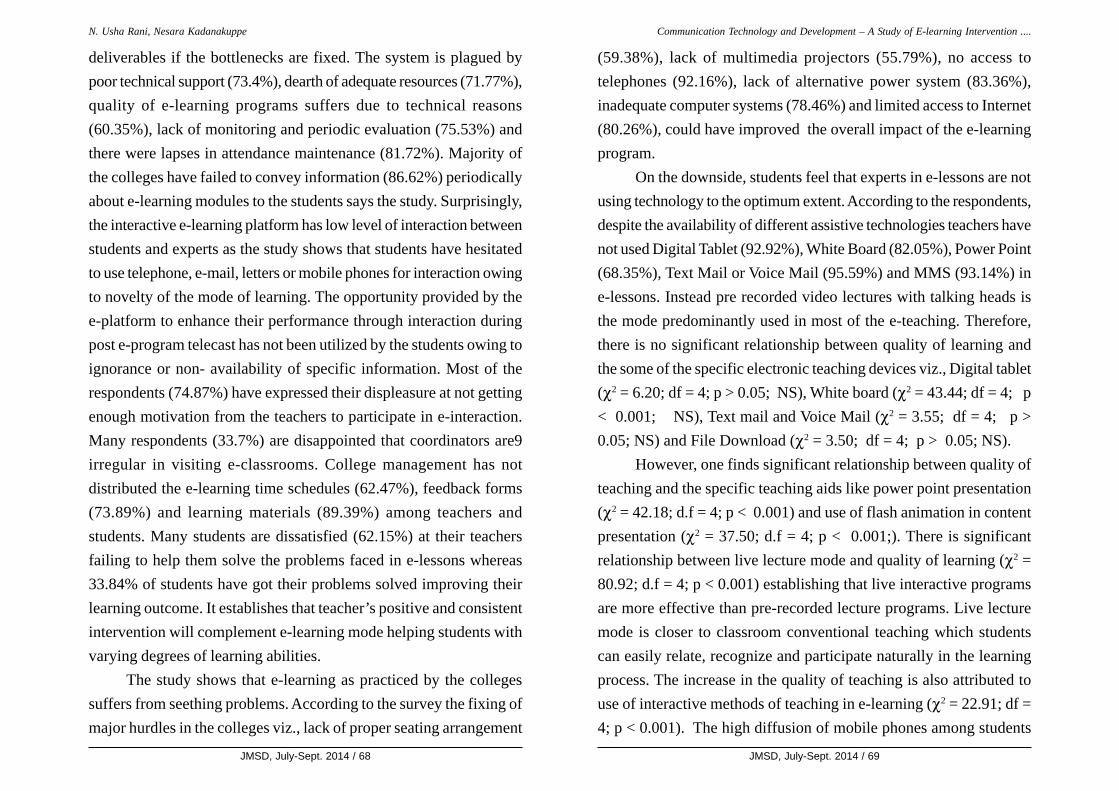
JMSD, July-Sept. 2014 / 68 JMSD, July-Sept. 2014 / 69
(59.38%), lack of multimedia projectors (55.79%), no access totelephones (92.16%), lack of alternative power system (83.36%),inadequate computer systems (78.46%) and limited access to Internet(80.26%), could have improved the overall impact of the e-learningprogram.
On the downside, students feel that experts in e-lessons are notusing technology to the optimum extent. According to the respondents,despite the availability of different assistive technologies teachers havenot used Digital Tablet (92.92%), White Board (82.05%), Power Point(68.35%), Text Mail or Voice Mail (95.59%) and MMS (93.14%) ine-lessons. Instead pre recorded video lectures with talking heads isthe mode predominantly used in most of the e-teaching. Therefore,there is no significant relationship between quality of learning andthe some of the specific electronic teaching devices viz., Digital tablet(χ2 = 6.20; df = 4; p > 0.05; NS), White board (χ2 = 43.44; df = 4; p< 0.001; NS), Text mail and Voice Mail (χ2 = 3.55; df = 4; p >0.05; NS) and File Download (χ2 = 3.50; df = 4; p > 0.05; NS).
However, one finds significant relationship between quality ofteaching and the specific teaching aids like power point presentation(χ2 = 42.18; d.f = 4; p < 0.001) and use of flash animation in contentpresentation (χ2 = 37.50; d.f = 4; p < 0.001;). There is significantrelationship between live lecture mode and quality of learning (χ2 =80.92; d.f = 4; p < 0.001) establishing that live interactive programsare more effective than pre-recorded lecture programs. Live lecturemode is closer to classroom conventional teaching which studentscan easily relate, recognize and participate naturally in the learningprocess. The increase in the quality of teaching is also attributed touse of interactive methods of teaching in e-learning (χ2 = 22.91; df =4; p < 0.001). The high diffusion of mobile phones among students
deliverables if the bottlenecks are fixed. The system is plagued bypoor technical support (73.4%), dearth of adequate resources (71.77%),quality of e-learning programs suffers due to technical reasons(60.35%), lack of monitoring and periodic evaluation (75.53%) andthere were lapses in attendance maintenance (81.72%). Majority ofthe colleges have failed to convey information (86.62%) periodicallyabout e-learning modules to the students says the study. Surprisingly,the interactive e-learning platform has low level of interaction betweenstudents and experts as the study shows that students have hesitatedto use telephone, e-mail, letters or mobile phones for interaction owingto novelty of the mode of learning. The opportunity provided by thee-platform to enhance their performance through interaction duringpost e-program telecast has not been utilized by the students owing toignorance or non- availability of specific information. Most of therespondents (74.87%) have expressed their displeasure at not gettingenough motivation from the teachers to participate in e-interaction.Many respondents (33.7%) are disappointed that coordinators are9irregular in visiting e-classrooms. College management has notdistributed the e-learning time schedules (62.47%), feedback forms(73.89%) and learning materials (89.39%) among teachers andstudents. Many students are dissatisfied (62.15%) at their teachersfailing to help them solve the problems faced in e-lessons whereas33.84% of students have got their problems solved improving theirlearning outcome. It establishes that teacher’s positive and consistentintervention will complement e-learning mode helping students withvarying degrees of learning abilities.
The study shows that e-learning as practiced by the collegessuffers from seething problems. According to the survey the fixing ofmajor hurdles in the colleges viz., lack of proper seating arrangement
N. Usha Rani, Nesara Kadanakuppe Communication Technology and Development – A Study of E-learning Intervention ....

JMSD, July-Sept. 2014 / 70 JMSD, July-Sept. 2014 / 71
ReligionHindu 541 88.3Christian 25 4.1Muslim 27 4.4Sikh 1 0.2Others 19 3.1
Income< Rs.8000 62 10.18001-15000 174 28.415001-25000 125 20.125001-35000 143 23.335001 > 109 17.8
ProfessionDoctor 61 10Engineer 91 14.8Scientist 14 2.3Advocate 14 2.3Teacher 71 11.6Housewife 21 3.4Business 102 16.6Farmer 81 13.2Others 158 25.8
EducationB.E. 610 99.5B.Tech 3 0.5
CollegesAIT Chikmagalur 94 15.3MIT Dakshina Kannada 90 14.7SDM Dakshina Kannada 21 3.4VVIT –Mysore 98 16VVEC- Mysore 79 12.9SDM – Dharwad 114 18.6GEC – Kodagu 81 13.2TEC – Gadag 36 5.9
has not intervened in enhancing learning in e-classrooms despiteprovision for its use in the system. Globally today there are efforts touse Mobile phones as learning tools in open education system. Butthe present finding calls for revisiting and reexamining the process ofcommunication through mobile phones.
CONCLUSIONOn the whole the study establishes that communication technologyhas given a new model of learning in making the professionaleducation more meaningful and relevant. Usage of e-learning modecalls for consistency for recognition and acceptance in the conventionalcollege system. Students have been more active in the live telecastsand the degree of interactivity is very high in such programs. Theintegration of technology with conventional method of teaching hasgiven a new instructional model based on the elements of e-learning.The model envisages access, greater degree of participation, student-centric approach, individualized learning and teaching practices. E-learning is a new dependable initiative in teaching-learning processin professional education, says the study.
Distribution of Sample by Demographic Variables(n- 613)
Variable F %
GenderMale 367 59.9Female 246 40.1
Age18-24 596 97.225-34 16 2.635> 1 0.2
N. Usha Rani, Nesara Kadanakuppe Communication Technology and Development – A Study of E-learning Intervention ....
JMSD, July-Sept. 2014 / 72
REFERENCES1. Benchicou,S., Aichouni,M., and Nehari.,D, (2010) E-learning in
engineering education: a theoretical and empirical study of theAlgerian higher education institution, European Journal ofEngineering Education, Vol.35, No.3, June 2010, pp 325-343.
2. Golden,.S, McCrone,.T., Walker.,M., Rudd.,P,(2006) ‘ Impact of e-learning in Further Education: Survey of Scale and Breadth, NationalFoundation for Educational Research, 2006, UK.
3. Harris,.R., Hall,.J.,Muirhead.,A.,,McAteer.,E., Schmoller.,S.,Thorpe.,G., Impact of e-learning on learner participation, attainment,retention and progression in further education: report of a scopingstudy,RW 15.
4. Harvey, L. & Knight,P. (1996), Transforming Higher Education(Buckingham, SRHE/Open University).
5. Impact and Challenges of E-learning,(2003). Supporting E-Learningin Higher Education,Vol.3, 2003, EDUCAUSE, pp39-47.
6. Liao, J., Wang, M.,, Ran Weijia and Yang Stephen J.H.,(2013)Collaborative cloud: a new model for e-learning, Innovations inEducation and Teaching International,
7. Ruiz.,J., Mintzer.,M., Leipzig.,R., (2006) The Impact of E-learningin Medical Education, Academic Medicine, March-Volume 81-Issue3-pp 207-212.
8. The positive impact of eLearning-2012 update, White Paper, IntelCorporation, USA, 2012.
9. U.S. Department of Education, Office of Planning, Evaluation, andPolicy Development, (2010), Evaluation of Evidence-Based Practicesin Online Learning: A Meta-Analysis and Review of Online LearningStudies, Washington, D.C.
N. Usha Rani, Nesara Kadanakuppe