journal of molecular graphics and modellingmolecules are placed in a cubic lattice (grid) that is...
TRANSCRIPT
Journal of Molecular Graphics and Modelling 28 (2010) 612–625
CoMFA analyses of C-2 position Salvinorin A analogs at the kappa-opioid receptorprovides insights into epimer selectivity
Donna L. McGovern a, Philip D. Mosier a, Bryan L. Roth b, Richard B. Westkaemper a,*a Department of Medicinal Chemistry, P.O. Box 980540, School of Pharmacy, Virginia Commonwealth University, Richmond, VA 23298-0540, United Statesb Department of Pharmacology, University of North Carolina School of Medicine, Chapel Hill, NC 27599, United States
A R T I C L E I N F O
Article history:
Received 23 July 2009
Received in revised form 20 November 2009
Accepted 21 December 2009
Available online 4 January 2010
Keywords:
Salvinorin A
Kappa-opioid (KOP) receptor
G protein-coupled receptor (GPCR)
Structure–affinity relationship (SAFIR)
Quantitative structure–activity relationship
(QSAR)
Comparative Molecular Field Analysis
(CoMFA)
A B S T R A C T
The highly potent and kappa-opioid (KOP) receptor-selective hallucinogen Salvinorin A and selected
analogs have been analyzed using the 3D quantitative structure–affinity relationship technique
Comparative Molecular Field Analysis (CoMFA) in an effort to derive a statistically significant and
predictive model of salvinorin affinity at the KOP receptor and to provide additional statistical support for
the validity of previously proposed structure-based interaction models. Two CoMFA models of Salvinorin A
analogs substituted at the C-2 position are presented. Separate models were developed based on the
radioligand used in the kappa-opioid binding assay, [3H]diprenorphine or [125I]6b-iodo-3,14-dihydroxy-
17-cyclopropylmethyl-4,5a-epoxymorphinan ([125I]IOXY). For each dataset, three methods of alignment
were employed: a receptor-docked alignment derived from the structure-based docking algorithm GOLD,
another from the ligand-based alignment algorithm FlexS, and a rigid realignment of the poses from the
receptor-docked alignment. The receptor-docked alignment produced statistically superior results
compared to either the FlexS alignment or the realignment in both datasets. The [125I]IOXY set (Model 1)
and [3H]diprenorphine set (Model 2) gave q2 values of 0.592 and 0.620, respectively, using the receptor-
docked alignment, and both models produced similar CoMFA contour maps that reflected the
stereoelectronic features of the receptor model from which they were derived. Each model gave
significantly predictive CoMFA statistics (Model 1 PSET r2 = 0.833; Model 2 PSET r2 = 0.813). Based on the
CoMFA contour maps, a binding mode was proposed for amine-containing Salvinorin A analogs that
provides a rationale for the observation that theb-epimers (R-configuration) of protonated amines at the C-
2 position have a higher affinity than the corresponding a-epimers (S-configuration).
� 2010 Published by Elsevier Inc.
Contents lists available at ScienceDirect
Journal of Molecular Graphics and Modelling
journal homepage: www.elsev ier .com/ locate /JMGM
1. Introduction
Salvinorin A (Fig. 1) is a highly potent and selective kappa-opioid (KOP) receptor agonist and the most potent naturallyoccurring hallucinogen known [1]. The terpenoid was first isolatedfrom the plant Salvia divinorum and characterized by Ortega [2] in1982. The same compound was later isolated from S. divinorum byValdes [3] in 1984 who reported its psychoactive properties inmice. S. divinorum has been used for centuries by the MazatecIndians of Mexico for divination and is indigenous to a small area inthe Sierra Mazateca Mountains. The plant was subsequentlypropagated and can now be found growing in widespreadlocations, sold by nurseries, and sold through the Internet for itshallucinogenic properties as both dried leaves and fortified plantextracts. The FDA has yet to schedule Salvinorin A, its extracts, ordried leaves as a controlled substance, although many countries
* Corresponding author. Tel.: +1 804 828 6449; fax: +1 804 828 7625.
E-mail address: [email protected] (R.B. Westkaemper).
1093-3263/$ – see front matter � 2010 Published by Elsevier Inc.
doi:10.1016/j.jmgm.2009.12.008
and several states within the United States have adoptedlegislation banning the use of S. divinorum and related products.
Since the discovery that Salvinorin A is a remarkably potent andselective KOP receptor agonist [1], a large number of analogs havebeen synthesized, especially C-2 position analogs [4–19]. A smallernumber of C-4 position analogs [4,5,7,19–21] and analogs withalterations of the furan ring [15,22,23] have also been reported inthe literature. By inspection, the data suggest that very littlechange is tolerated at the C-4 position or the furan ring. Thus,attention was focused on C-2 modified structures for which a widerange of affinities have been reported.
Salvinorin A is unique among hallucinogens in that its chemicalstructure lacks a basic amine group. This is significant because sucha moiety was previously thought to be required for high ligandaffinity at aminergic and other closely related G Protein-CoupledReceptors (GPCRs). It is generally understood that the receptor-ligand interaction involving the amine is mediated by a conservedaspartate residue (D3.32) on transmembrane helix 3 (TM3) throughformation of a hydrogen-bonded salt bridge, anchoring the ligandin the binding site. Thus it is quite surprising that Salvinorin A’s

Fig. 1. Salvinorin A (1).
D.L. McGovern et al. / Journal of Molecular Graphics and Modelling 28 (2010) 612–625 613
high affinity for the KOP receptor is comparable to that of amine-containing ligands [24].
The molecular mechanisms by which Salvinorin A achieves itsexquisite affinity and selectivity for the KOP receptor is an active andongoing area of research. Our working hypothesis is that by removingthe amine from a ligand, its affinity for the many aminergic andrelated receptorsdecreases dramatically, resultinginhigh selectivity.That is, without the amine ‘‘anchor’’, the receptor becomes moresensitive to changes in the ligand structure, and therefore thestereoelectronic nature of the ligand and its complementarity to thetarget receptor become much more important factors in determiningthe affinity of the ligand for the receptor.
Although the affinity of hundreds of Salvinorin A analogs for theKOP receptor has been reported, there is very little publishedinformation regarding the QSAR of these compounds. In 2006, Singhet al. [25] described a quantitative and predictive structure–affinitymodel derived using a KOP receptor homology model and virtualscreeningtechniqueswithasetof asetof 27SalvinorinAanalogswithmodifications at theC-1, C-2,C-4and C-17 positions. Inthesameyear,Pandit et al. [26] reported a CoMFA model for C-2 position SalvinorinA analogs, though the details of this study have yet to be published.
Comparative Molecular Field Analysis (CoMFA), a three-dimensional quantitative structure–activity relationship (3D-QSAR) methodology, may be used to rationalize and predictligand–receptor interactions when used in conjunction withhomology modeling. In CoMFA, a 3D-QSAR model is constructedby correlating regions of steric and electrostatic fields withexperimentally obtained affinity data for a set of aligned ligands(the training set or TSET). Information contained in the model canthen be used for the design and prediction of binding affinities ofnew ligands (the prediction set or PSET) for the target receptor. Theresulting models are critically dependent on the ligand alignmentmethod used. If receptor structure-based ligand docking is used togenerate the alignment, statistical 3D-QSAR methods like CoMFAmay be used to complement and provide additional statisticalsupport for the proposed ligand binding modes. Salvinorin Aanalogs are well-suited for a CoMFA study because the core of themolecule does not vary and it is conformationally constrained dueto its polycyclic structure, much like the steroid system presentedin the initial description of the method [27].
We report here our successful generation of statisticallysignificant and predictive CoMFA models describing the interac-tion of C-2 Salvinorin A analogs with the KOP receptor and our useof these models to propose a binding mode for C-2 amine-containing Salvinorin A analogs.
2. Experimental methods
2.1. Receptor and ligand structures
CoMFA studies were performed using SYBYL software (version7.3, Tripos Associates, St. Louis, MO) on an HP xw9400 workstation
running Red Hat Enterprise Linux 4. The human KOP receptormodel used here was built based on the coordinates of activatedbovine rhodopsin crystal as previously described [24,28,29].Compounds were constructed using the crystal structure [2] ofSalvinorin A, (Cambridge Structural Database code = BUJJIZ) as thetemplate and then energy-minimized using the Tripos Force Field(Gasteiger-Huckel charges; distance-dependent dielectric con-stant = 4.0; default parameters elsewhere).
2.2. Ligand docking and alignment
To explore the effect of ligand superimposition on the resultingstatistical models, three methods of alignment were employed ineach study. In the first, the automated docking routine GOLD wasused to produce an alignment based on docked solutions of ligandsto a previously described model [24,28,29] of the KOP receptor. Thus,the ligand ensemble is that produced by docking with no explicitligand-ligand atom superposition performed. The second, a ligand-based method, was obtained using FlexS [30]. The third alignmentmethod was a rigid realignment of the receptor-docked alignment.
Docking of salvinorin compounds was performed using GOLD(version 4.0, Cambridge Crystallographic Data Center, Cambridge,UK) as previously described [24,28,29]. Ten docking runs wereperformed for each compound in the dataset. The initial alignmentwas generated by selecting the docked solution in which (a) a furanoxygen-Q1152.60 H-bond was present and (b) the stereochemicalinteractions appeared most reasonable for each ligand. In mostcases the chosen pose was the top-ranked solution. This resulted inan alignment that resembled the previously postulated model ofSalvinorin A in the KOP receptor [24,28,29] (Fig. 2). The secondalignment method (using the same dataset) was performed withFlexS (version 1.20.3, BioSolveIT GmbH, Sankt Augustin, Germany).FlexS aligns the conformation and orientation of a ligand moleculerelative to a reference molecule (template) that is treated as rigid.The molecule to be superimposed is partitioned into fragments. An‘anchor fragment’ is placed first and the remaining fragments areadded iteratively, allowing conformational flexibility at each step[30]. Compound 4 was used as the template for this alignmentbecause it is the longest C-2 chain that still retains high affinity.The third alignment method, a realignment of the docked poses inthe receptor-docked alignment, was performed by aligning allcompounds to Salvinorin A using the SYBYL fit-atoms method.Carbon atoms C-2, C-4 and C-5 of Salvinorin A and the analogousatoms of each analog were selected for the fitting process.
2.3. Dataset generation
The quality and nature of the data used to construct the CoMFAmodel is of prime importance in obtaining an accurate, predictivemodel. Binding affinity data can vary from lab to lab depending onthe assay methods, radioligand and cell lines employed. The choiceof radiolabeled ligand can dramatically affect the values obtained[31,32], as can the level of gene expression that results in differingreceptor densities in cloned cell lines [33]. Therefore pooling ofdata for a CoMFA study is generally discouraged. In this work, twoindependent CoMFA studies were undertaken, one in which[125I]IOXY (6b-iodo-3,14-dihydroxy-17-cyclopropylmethyl-4,5a-epoxymorphinan) was used as the assay radioligand and a secondin which [3H]diprenorphine was the assay radioligand.
Compounds that are protonated at physiological pH (e.g.amines) and compounds with Ki > 1,000 nM were not includedin the dataset. Protonated compounds would, perhaps, form anion-pair interaction with D1383.32 (Ballesteros-Weinstein num-bering system [34,35]) of transmembrane helix 3 (TM3) orE209xl2.49 of the extracellular loop 2 (EL2) that may result in asignificant difference in the binding mode compared to that of

Fig. 2. Stereo view of Salvinorin A docked in the KOP receptor. Salvinorin A is shown in ball and stick and colored according to atom type. Residues are colored magenta.
D.L. McGovern et al. / Journal of Molecular Graphics and Modelling 28 (2010) 612–625614
Salvinorin A. MOPAC charges (AM1) were then applied to eachaligned dataset before initiating the CoMFA analyses. Training setcompounds were chosen randomly with the only criterion beingthat they cover a wide range of Ki values.
2.4. CoMFA model generation
In the 3D-QSAR analysis, all aligned training set (TSET)molecules are placed in a cubic lattice (grid) that is divided intohundreds (or thousands) of points at a regular spacing. In thisCoMFA study, the default grid spacing of 2.0 A was used. Lennard–Jones 6-12 and Coulomb potentials were used to calculate thesteric and electrostatic interaction fields, respectively. An sp3-hybridized carbon atom with a charge of +1 was used as the probeatom. The standard default settings were used, except for the stericand electrostatic cutoff values that were each varied by incrementsof 5 kcal/mol from 10 to 50 kcal/mol in order to obtain the highestvalue of q2 for each dataset alignment. All Ki data were converted topKi (�log Ki). The pKi represents the dependent variable while theCoMFA field potentials at each grid point represent the indepen-dent variables in the partial least squares (PLS) regression analyses.The standard ‘‘leave-one-out’’ (LOO) cross-validation method wasused to obtain the predictive correlation coefficient q2 and theoptimal number of principal components (PCs). In the LOO method,each compound is excluded one at a time. A model is thenconstructed from the remaining compounds to predict the activityof the excluded compound. The optimal number of PCs chosencorresponds to the smallest error of prediction and the highest q2.The PLS analysis was then repeated with no validation using theoptimal number of PCs to generate the CoMFA model. The r2
statistic, which is a measure of the amount of variation in thedependent variable that can be ascribed to variation in theindependent variable, and the standard error of estimate (SEE)were obtained from this model. The r2
pred was obtained from thelinear regression of the experimental vs. predicted pKi values of theprediction set (PSET). A column filter of 3 or 4 kcal/mol was appliedto improve efficiency and reduce noise in the field data. The filterprocedure excludes those columns whose grid point potentialsvary below the set cutoff. In the first model, region focusing [36]was used to improve the model statistics. Region focusing dividesthe lattice grid into multiple grids with smaller lattice spacing and
then performs a CoMFA analysis on each grid. Grids below adetermined q2 cutoff are eliminated and another CoMFA analysis isperformed on the remaining grids as a whole resulting inenhancement of those lattice points and, in some cases, animproved statistical outcome.
3. Results and discussion
3.1. Salvinorin A–KOP receptor interaction model
Salvinorin A consists of a rigid hydrophobic core that containseight hydrogen-bond accepting oxygen atoms. In the postulatedmodel of Salvinorin A docked in the human KOP receptor as recentlydescribed [24] (Fig. 2), the oxygen of the furan ring may form ahydrogen bond with both Q1152.60 and Y3207.43. A hydrogen bondinteraction with these two residues is supported by site-directedmutagenesis studies [24,29,37] in which KOP receptor mutantsQ115A, Y320A and Y320F all showed a substantial decrease in thebinding affinity of Salvinorin A as compared to wild type KOPreceptor. An additional hydrogen bond may possibly exist betweenY3127.35 and the methoxy oxygen of the C-4 position methyl ester,although the KOP receptor mutants Y312A and Y312F showed only amodest decrease [29,37] in the binding affinity of Salvinorin A (4.5-fold decrease for the KOP receptor Y312A mutant [37]). In addition,there is a likely hydrophobic interaction between Y3137.36 and themethyl group of the C-2 position acetoxy moiety of Salvinorin A thatis supported by site-directed mutagenesis studies [29,37] in whichthere are substantial losses of affinity for the KOP receptor Y313Amutant but little or no loss for the Y313F mutant (indicating ahydrophobic interaction rather than a hydrogen bond interaction).Chimeric receptor studies [28,37,38] also highlight the importanceof residues in TM2 and TM7 in the binding of Salvinorin A to the KOPreceptor. In addition, substituted cysteine accessibility method(SCAM) studies [24,28,29] indicate that these residues are accessiblein the binding pocket. Finally, the putative Salvinorin A bindingmode is consistent with recently reported affinity labeling experi-ments that indicate that the C-2 substituent in near TM7 [39].
It is perhaps useful to compare the KOP receptor receptorhomology model employed here with that of the more recentlydetermined b2-adrenoceptor crystal structure. Although the KOPreceptor model was based on activated bovine rhodopsin as a

D.L. McGovern et al. / Journal of Molecular Graphics and Modelling 28 (2010) 612–625 615
template (PDB ID = 2I37) [40], several modifications were appliedduring the course of model refinement. The two most notable ofthese in terms of the conformation of the KOP receptor binding siteare briefly described here. First, extracellular loop 2 (EL2) wasrepositioned using molecular dynamics to a location nearer to theextracellular opening of the receptor [29], enlarging the bindingsite cavity. Although it has been suggested that the EL2 loop beremoved for purposes of ligand docking [41], there is evidence thatEL2 may in fact interact with Salvinorin A [24]. Second, theextracellular portion of TM2 was rotated [28] to bring the model inline with mutagenesis data that suggests that, along with othermutations, Q1152.60 may interact with Salvinorin A [37,38]. As aresult, the conformation of the refined KOP receptor model differsas much compared to the original template as to the b2-adrenoceptor (PDB ID = 2RH1), consistent with the suggestionthat homology models of the opioid receptors would be amongthose that would benefit most from the determination of thestructure of a GPCR not closely related to those currently available[42].
3.2. Alignment methods
One can make the assumption that the salvinorin analogswould bind in the same way as Salvinorin A since the core of themolecule, in most cases, remains identical. If this is the case, thenmethods such as FlexS or an atom-to-atom fit that result in a‘‘tight’’ alignment of molecules (low RMSD values for those atomsin the common core structure) might be expected to result in agood CoMFA model. However, it was found that the receptor-docked alignment, in which many of the molecules’ dockedposition and/or orientation deviated from Salvinorin A (some by as
Table 1Model 1 dataset of 34 compounds using [125I]IOXY as the assay radioligand.
.
Compound R Ki (nM) Ref.
1 1.9 [17]
2 280 [17]
3 1.8 [18]
4 4 [18]
5 15 [18]
much as 4.5 A), was found to be superior to FlexS and therealignment. In fact, in previous work (data not shown), severalalignment methods available in the SYBYL package were evaluatedincluding manual atom fitting, database alignment, GALAHAD andSurflex-Sim that resulted in well-aligned molecules but gave poorCoMFA statistics. Salvinorin A analogs may thus bind in a similar,but non-identical manner to the parent. Accordingly, a receptor-docked alignment may provide a better picture for predictivepurposes, since the noted variability in the position of the rigid corerepresents the receptor’s ability to recognize and accommodate(up to a point) ligand analogs with sidechains of varying size.
A rigid realignment of the docked poses was performed in orderto evaluate which type of alignment is more predictive: thealignment based on the receptor’s perspective (the receptor-docked alignment) or one based on the ligand’s perspective (therealignment) [43]. This realignment resulted in the core of themolecules being very well aligned but exhibited the poorestCoMFA statistics of the three types of alignments: FlexS, receptor-docked or realigned (results not shown).
3.3. CoMFA results for the [125I]IOXY dataset
The [125I]IOXY dataset consisted of 34 Salvinorin A analogs inwhich [125I]IOXY was used as the assay radioligand for thedetermination of affinity (Table 1). This dataset was divided intoa TSET of 23 compounds and a PSET of 11 compounds. The threealignments employed are shown in Fig. S1. Although the use of FlexSresults in a ‘‘tighter’’ alignment of the molecules (i.e. lower RMSD forthe scaffold atoms), this alignment gave statistically poorer results(q2 = 0.311) as compared to the model based on the receptor-dockedalignment (Model 1; region-focused q2 = 0.592) for the identical
pKia
Setb exp. �RF �RF resi. +RF +RF resi.
T 8.72 8.66 0.06 8.71 0.01
T 6.55 6.41 0.14 6.42 0.13
T 8.74 8.58 0.16 8.61 0.14
T 8.40 8.39 0.01 8.39 0.01
P 7.82 7.99 �0.17 8.06 �0.24
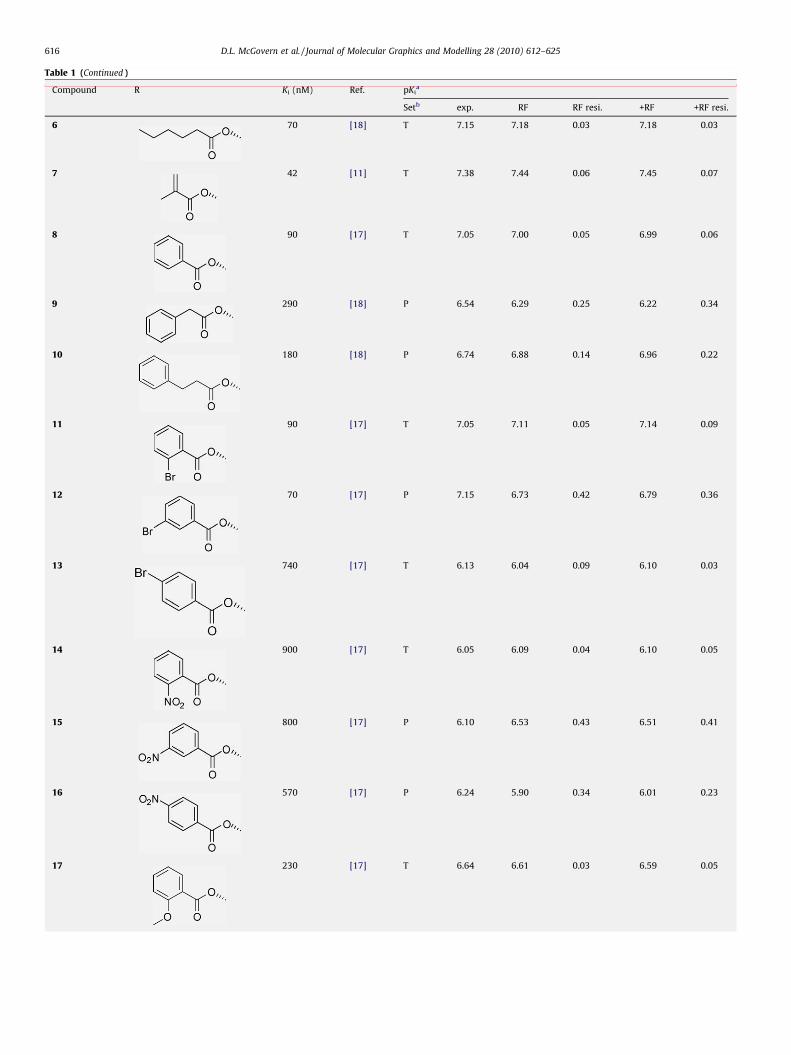
Table 1 (Continued )
Compound R Ki (nM) Ref. pKia
Setb exp. �RF �RF resi. +RF +RF resi.
6 70 [18] T 7.15 7.18 �0.03 7.18 �0.03
7 42 [11] T 7.38 7.44 �0.06 7.45 �0.07
8 90 [17] T 7.05 7.00 0.05 6.99 0.06
9 290 [18] P 6.54 6.29 0.25 6.22 0.34
10 180 [18] P 6.74 6.88 �0.14 6.96 �0.22
11 90 [17] T 7.05 7.11 �0.05 7.14 �0.09
12 70 [17] P 7.15 6.73 0.42 6.79 0.36
13 740 [17] T 6.13 6.04 0.09 6.10 0.03
14 900 [17] T 6.05 6.09 �0.04 6.10 �0.05
15 800 [17] P 6.10 6.53 �0.43 6.51 �0.41
16 570 [17] P 6.24 5.90 0.34 6.01 0.23
17 230 [17] T 6.64 6.61 0.03 6.59 0.05
D.L. McGovern et al. / Journal of Molecular Graphics and Modelling 28 (2010) 612–625616

Table 1 (Continued )
Compound R Ki (nM) Ref. pKia
Setb exp. �RF �RF resi. +RF +RF resi.
18 550 [17] P 6.26 6.31 �0.05 6.24 0.02
19 540 [17] T 6.27 6.26 0.01 6.31 �0.04
20 410 [17] T 6.39 6.42 �0.03 6.37 0.02
21 260 [17] T 6.59 6.63 �0.04 6.58 0.01
22 80 [17] P 7.10 7.18 �0.08 7.34 �0.24
23 70 [17] T 7.15 7.10 0.05 7.13 0.02
24 430 [11] P 6.37 6.34 0.03 6.50 �0.13
25 120 [11] T 6.92 6.95 �0.03 6.95 �0.03
26 93 [11] P 7.03 7.21 �0.18 7.26 �0.23
27 30 [17] T 7.52 7.86 �0.34 7.54 �0.02
28 5.7 [17] P 8.24 7.86 0.38 7.88 0.36
29 64 [11] T 7.19 7.19 0.00 7.21 �0.02
30 2.3 [11] T 8.64 8.74 �0.10 8.73 �0.09
D.L. McGovern et al. / Journal of Molecular Graphics and Modelling 28 (2010) 612–625 617

Table 1 (Continued )
Compound R Ki (nM) Ref. pKia
Setb exp. �RF �RF resi. +RF +RF resi.
31 260 [17] T 6.59 6.69 �0.10 6.62 �0.03
32 60 [18] T 7.22 7.34 �0.12 7.26 �0.04
33 50 [18] T 7.30 7.30 0.00 7.28 0.02
34 38 [11] T 7.42 7.34 0.08 7.37 0.05
a exp.: experimentally determined value; –RF: predicted value without region focusing; –RF resi.: residual (experimental value�predicted value) without region focusing;
+RF: predicted value with region focusing; +RF resi.: residual with region focusing.b T: training set, P: prediction set.
D.L. McGovern et al. / Journal of Molecular Graphics and Modelling 28 (2010) 612–625618
training sets. Region focusing did not improve the FlexS modelstatistics in this case. The realigned set of molecules, exhibiting the‘tightest’ fit, resulted in a q2 = 0.526 after region focusing but a poorr2 = 0.767. Predicted pKi values were also poor for the FlexSalignment and realignment resulting in 6 of the 34 compounds inthe FlexS set and 8 of the 34 compounds in the realigned set having aresidual value (experimental pKi � predicted pKi) greater than thedesired range of �0.50 pKi units (results not shown), whereas allvalues fell within the desired range for the receptor-docked alignment(Table 1). It is hypothesized that the receptor-docked alignment paintsa ‘‘truer’’ picture of how ligands might bind to the receptor site,resulting in a more accurate CoMFA contour map reflecting the residuessurrounding the molecule in its docked position.
Model 1 CoMFA statistics (receptor-docked alignment) areshown in Table 2. A statistically significant (F = 465) and predictive(q2 = 0.592) model was obtained after region focusing, indicatingthe robustness of the model. The model was shown to havepredictive power (PSET r2 = 0.833) and that the slopes of the TSETand PSET regression lines were both close to the ideal value of 1.0.The linear regression plots for Model 1 training and predicteddatasets are shown in Fig. 3. The region-focused CoMFA contourmaps are shown in Fig. 4.
Table 2CoMFA statistics for Models 1 and 2..
Parameter Model 1 Model 2
Initial
value
Region-
focused
value
Initial
value
Number of Compounds (TSET) 23 23 34
Steric cutoff (kcal/mol) 25.0 25.0 35.0
Electrostatic cutoff (kcal/mol) 35.0 35.0 30.0
Column filtering (kcal/mol) 3.0 4.0 3.0
Number of components 6 6 6
Cross-validated r2 (q2) 0.491 0.592 0.620
Correlation coefficient r2 (TSET) 0.991 0.994 0.989
Standard error of the estimate (SEE) 0.090 0.071 0.107
F statistic 283 465 395
Steric contribution (%) 34.3 39.3 35.4
Electrostatic contribution (%) 65.7 60.7 64.6
Number of Compounds (PSET) 11 11 13
Correlation coefficient r2 (PSET) 0.841 0.833 0.813
A region of bulk tolerance (green) can be seen around the C-2position (Fig. 4a) extending approximately three carbons in lengthfrom the carbonyl carbon. The binding affinity data indicates thataffinity decreases sharply for esters with chain lengths larger thanfour carbons in length at the C-2 position. This bulk toleranceregion falls within a hydrophobic pocket formed from Y3127.35,Y3137.36 and I3167.39; this pocket would not be expected toaccommodate long chain lengths of greater than four carbons. Aregion of bulk intolerance (yellow) can be seen behind the C-1position and in the receptor; this is the region occupied byextracellular loop 2 (EL2) near the disulfide bridge linking the EL2with transmembrane helix 3 (TM3). In the electrostatic contourmap (Fig. 4b) several areas where electronegativity enhancesaffinity (red) are positioned around the ester and carbonyl oxygensof the molecule. A small area in which electropositive atoms on the
Fig. 3. Model 1 linear regression plots. Open circles with a solid regression line
indicate the training set and open triangles with a dashed regression line refer to the
prediction set.
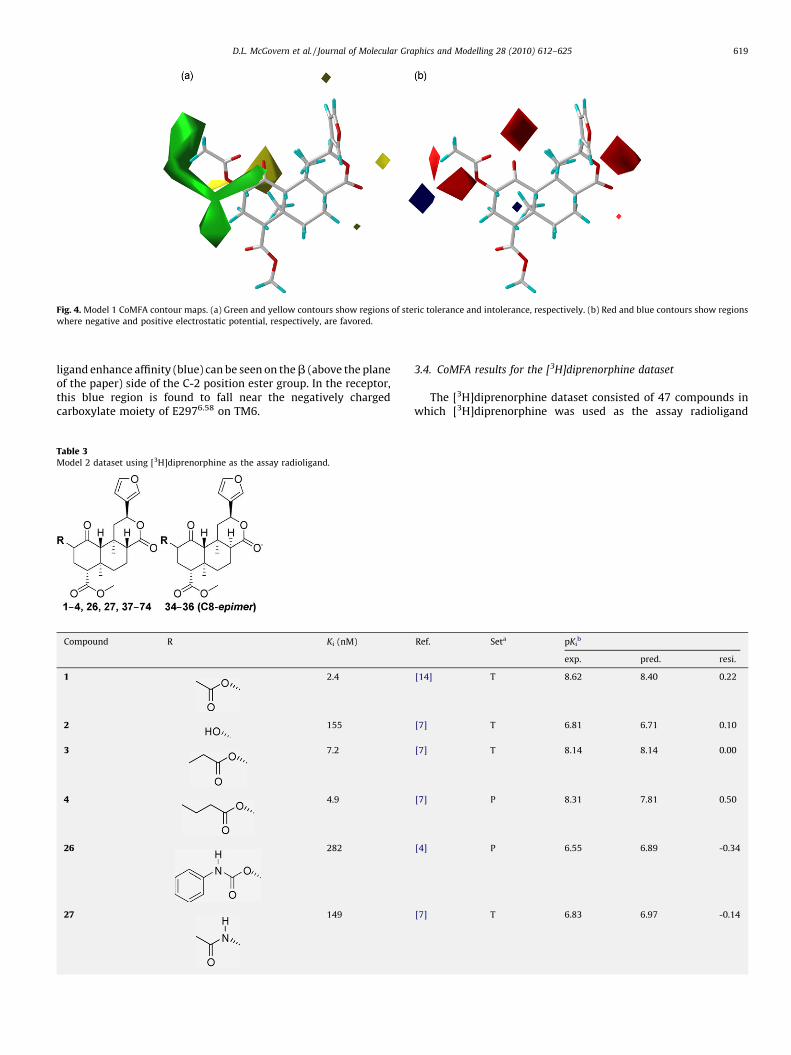
Fig. 4. Model 1 CoMFA contour maps. (a) Green and yellow contours show regions of steric tolerance and intolerance, respectively. (b) Red and blue contours show regions
where negative and positive electrostatic potential, respectively, are favored.
D.L. McGovern et al. / Journal of Molecular Graphics and Modelling 28 (2010) 612–625 619
ligand enhance affinity (blue) can be seen on the b (above the planeof the paper) side of the C-2 position ester group. In the receptor,this blue region is found to fall near the negatively chargedcarboxylate moiety of E2976.58 on TM6.
Table 3Model 2 dataset using [3H]diprenorphine as the assay radioligand.
.
Compound R Ki (nM)
1 2.4
2 155
3 7.2
4 4.9
26 282
27 149
3.4. CoMFA results for the [3H]diprenorphine dataset
The [3H]diprenorphine dataset consisted of 47 compounds inwhich [3H]diprenorphine was used as the assay radioligand
Ref. Seta pKib
exp. pred. resi.
[14] T 8.62 8.40 0.22
[7] T 6.81 6.71 0.10
[7] T 8.14 8.14 0.00
[7] P 8.31 7.81 0.50
[4] P 6.55 6.89 -0.34
[7] T 6.83 6.97 -0.14

Table 3 (Continued )
Compound R Ki (nM) Ref. Seta pKib
exp. pred. resi.
34 77 [4] T 7.11 7.13 -0.02
35 304 [13] T 6.52 6.49 0.03
36 30 [4] P 7.52 7.30 0.22
37 424 [7] T 6.37 6.47 -0.10
38 641 [7] P 6.19 6.11 0.08
39 665 [7] T 6.18 6.14 0.04
40 176 [4] P 6.75 6.50 0.25
41 3.2 [4] T 8.49 8.66 -0.17
42 83 [4] T 7.08 6.98 0.10
43 462 [4] T 6.34 6.32 0.02
44 332 [7] P 6.48 6.89 -0.41
45 3.2 [7] T 8.49 8.41 0.08
46 16.5 [7] T 7.78 7.73 0.05
47 374 [7] T 6.43 6.53 -0.10
48 117 [7] T 6.93 6.94 -0.01
D.L. McGovern et al. / Journal of Molecular Graphics and Modelling 28 (2010) 612–625620

Table 3 (Continued )
Compound R Ki (nM) Ref. Seta pKib
exp. pred. resi.
49 1.6 [7] T 8.80 8.87 -0.07
50 6.9 [7] T 8.16 8.16 -0.00
51 27.6 [7] T 7.56 7.46 0.10
52 240 [7] T 6.62 6.65 -0.03
53 38.1 [7] T 7.42 7.56 -0.14
54 376 [7] P 6.42 6.77 -0.35
55 220 [7] P 6.66 6.99 -0.33
56 7.9 [7] T 8.10 8.16 -0.06
57 28.7 [7] P 7.54 7.71 -0.17
58 35.8 [4] T 7.45 7.35 0.10
59 60.1 [4] P 7.22 7.62 -0.40
60 0.6 [14] T 9.22 9.27 -0.05
61 0.32 [14] T 9.49 9.29 0.20
62 2.2 [14] P 8.66 8.16 0.50
63 5.3 [14] T 8.28 8.23 0.05
64 1.6 [14] T 8.80 8.86 -0.06
65 35 [14] T 7.46 7.48 -0.02
66 1.9 [14] T 8.72 8.86 -0.14
67 31 [14] P 7.51 7.49 0.02
68 141 [14] T 6.85 6.79 0.06
69 147 [14] T 6.83 6.82 0.01
D.L. McGovern et al. / Journal of Molecular Graphics and Modelling 28 (2010) 612–625 621
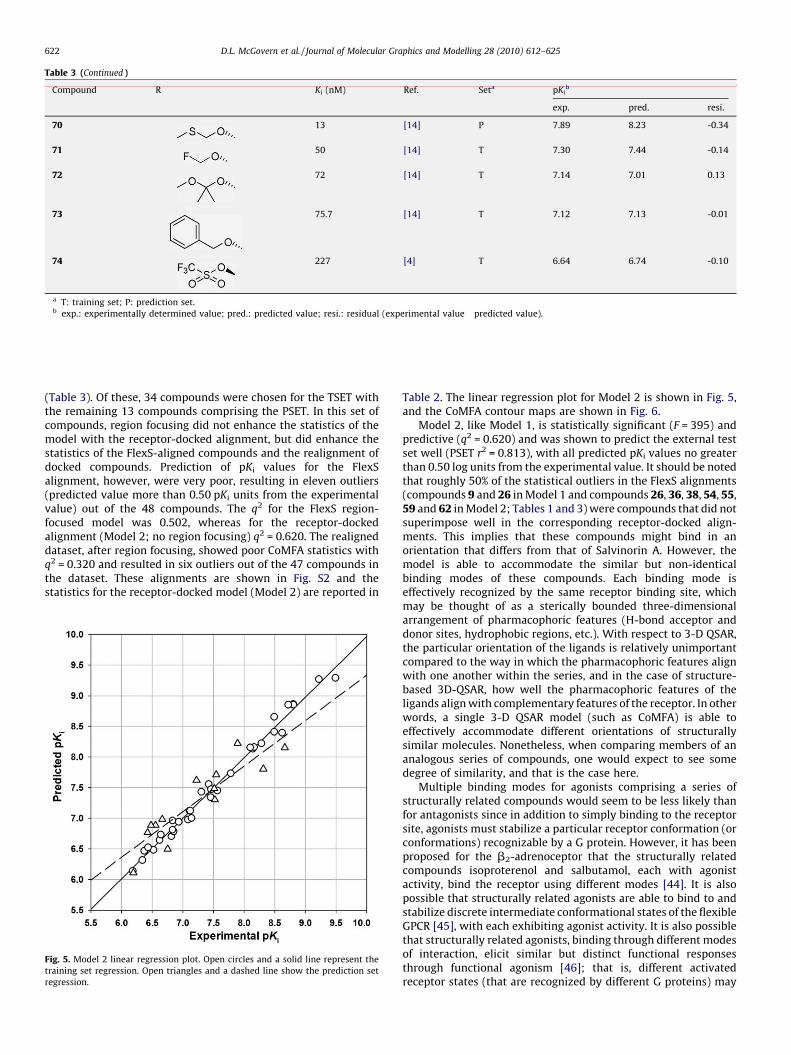
Table 3 (Continued )
Compound R Ki (nM) Ref. Seta pKib
exp. pred. resi.
70 13 [14] P 7.89 8.23 -0.34
71 50 [14] T 7.30 7.44 -0.14
72 72 [14] T 7.14 7.01 0.13
73 75.7 [14] T 7.12 7.13 -0.01
74 227 [4] T 6.64 6.74 -0.10
a T: training set; P: prediction set.b exp.: experimentally determined value; pred.: predicted value; resi.: residual (experimental value�predicted value).
D.L. McGovern et al. / Journal of Molecular Graphics and Modelling 28 (2010) 612–625622
(Table 3). Of these, 34 compounds were chosen for the TSET withthe remaining 13 compounds comprising the PSET. In this set ofcompounds, region focusing did not enhance the statistics of themodel with the receptor-docked alignment, but did enhance thestatistics of the FlexS-aligned compounds and the realignment ofdocked compounds. Prediction of pKi values for the FlexSalignment, however, were very poor, resulting in eleven outliers(predicted value more than 0.50 pKi units from the experimentalvalue) out of the 48 compounds. The q2 for the FlexS region-focused model was 0.502, whereas for the receptor-dockedalignment (Model 2; no region focusing) q2 = 0.620. The realigneddataset, after region focusing, showed poor CoMFA statistics withq2 = 0.320 and resulted in six outliers out of the 47 compounds inthe dataset. These alignments are shown in Fig. S2 and thestatistics for the receptor-docked model (Model 2) are reported in
Fig. 5. Model 2 linear regression plot. Open circles and a solid line represent the
training set regression. Open triangles and a dashed line show the prediction set
regression.
Table 2. The linear regression plot for Model 2 is shown in Fig. 5,and the CoMFA contour maps are shown in Fig. 6.
Model 2, like Model 1, is statistically significant (F = 395) andpredictive (q2 = 0.620) and was shown to predict the external testset well (PSET r2 = 0.813), with all predicted pKi values no greaterthan 0.50 log units from the experimental value. It should be notedthat roughly 50% of the statistical outliers in the FlexS alignments(compounds 9 and 26 in Model 1 and compounds 26, 36, 38, 54, 55,59 and 62 in Model 2; Tables 1 and 3) were compounds that did notsuperimpose well in the corresponding receptor-docked align-ments. This implies that these compounds might bind in anorientation that differs from that of Salvinorin A. However, themodel is able to accommodate the similar but non-identicalbinding modes of these compounds. Each binding mode iseffectively recognized by the same receptor binding site, whichmay be thought of as a sterically bounded three-dimensionalarrangement of pharmacophoric features (H-bond acceptor anddonor sites, hydrophobic regions, etc.). With respect to 3-D QSAR,the particular orientation of the ligands is relatively unimportantcompared to the way in which the pharmacophoric features alignwith one another within the series, and in the case of structure-based 3D-QSAR, how well the pharmacophoric features of theligands align with complementary features of the receptor. In otherwords, a single 3-D QSAR model (such as CoMFA) is able toeffectively accommodate different orientations of structurallysimilar molecules. Nonetheless, when comparing members of ananalogous series of compounds, one would expect to see somedegree of similarity, and that is the case here.
Multiple binding modes for agonists comprising a series ofstructurally related compounds would seem to be less likely thanfor antagonists since in addition to simply binding to the receptorsite, agonists must stabilize a particular receptor conformation (orconformations) recognizable by a G protein. However, it has beenproposed for the b2-adrenoceptor that the structurally relatedcompounds isoproterenol and salbutamol, each with agonistactivity, bind the receptor using different modes [44]. It is alsopossible that structurally related agonists are able to bind to andstabilize discrete intermediate conformational states of the flexibleGPCR [45], with each exhibiting agonist activity. It is also possiblethat structurally related agonists, binding through different modesof interaction, elicit similar but distinct functional responsesthrough functional agonism [46]; that is, different activatedreceptor states (that are recognized by different G proteins) may

Fig. 6. Model 2 CoMFA maps. The color scheme is the same as in Fig. 4.
Fig. 7. b-N-Isopropylamine analog of Salvinorin A (75).
D.L. McGovern et al. / Journal of Molecular Graphics and Modelling 28 (2010) 612–625 623
be stabilized by different agonist binding modes. Despite theconformational variability associated with functional agonism,however, there appears to be common features that are associatedwith an activated rhodopsin-like GPCR. These features include amovement of the intracellular portion of TM6 away from thehelical bundle (i.e. opening of the ‘‘ionic lock’’), with a correspond-ing inward movement of the extracellular part of TM6 into theligand binding cavity, a transition that is regulated to some extentby the rotameric states of key ‘‘toggle switch’’ residues [47]. Theproposed binding modes of the salvinorins described here eachinteract with the extracellular end of TM6 (I2946.55 and E2976.58).These interactions may prevent the movement of the extracellularend of TM6 away from the binding site, preventing the closure ofthe ionic lock and serving to stabilize (not necessarily equivalent)activated forms of the KOP receptor.
The contour maps for Model 2 are qualitatively similar to thosein Model 1. As in Model 1, there is a region of bulk tolerance aroundthe C-2 ester group and a region of bulk intolerance behind it(Fig. 6a). In Fig. 6b, regions of enhanced affinity with electronega-tivity (red) are seen near the oxygens of the C-2 position estergroup and the C-1 carbonyl. The largest area of electronegativityfalls within potential H-bonding distance of H304 near theextracellular region of TM7.
It has been shown that both the methyl and carbonyl moietiesof the C-2 acetoxy group contribute to the affinity of Salvinorin Afor the KOP receptor [14]. Removal of the C-2 position carbonylgroup (resulting in the C-2 ethyl ether) reduced the Ki by 3.4-fold,and our KOP receptor-Salvinorin A interaction model suggests thatthe C-2 acetoxy carbonyl oxygen atom may hydrogen bond withthe un-ionized acid form of E209xl2.49. Removal of the methylgroup (resulting in the C-2 formate ester) also produced a modestdrop in affinity. Mutagenesis studies have suggested that ahydrophobic interaction between the aforementioned methylgroup and Y3137.36 is present [29], and in general it seems to beimportant to have a hydrophobic moiety at a terminal position ofthe C-2 substituent for optimal ligand affinity [14]. At the sametime, it has also been observed that the optimal length of the C-2sidechain corresponds to about five heavy atoms for C-2 ethers [8],alkoxymethyl ethers [14] and esters [18], the maximum size thatcan be easily accommodated in the putative binding pocket.
It has been suggested that the alkoxy-oxygen of the C-2alkoxymethyl ethers contributes to ligand binding through an H-bond interaction on the basis of the substantially reduced affinityof both the methylthiomethoxy and fluoromethoxy analogs 70 and71, since neither sulfur nor fluorine are good H-bond acceptors.However, the reduced affinity of these analogs may also be
explained via an alternative binding mechanism. In the proposedbinding mode for the fluoromethoxy analog (71), the fluorine atomis situated very close to the sidechain carboxylate group ofE209xl2.49; the close proximity of two hard electronegative atomswould thus be expected to adversely affect the ligand binding. Incontrast, many of the docked poses of the alkoxymethyl ethersplace the more distal alkoxy-oxygen away from any potential H-bonding functionality and in a sterically restricted region of thebinding site between Y3127.35 and Y3137.36. Perhaps because ofsteric incompatibility, the KOP receptor is predicted to recognizean alternate conformation of the methylthiomethoxy analog (70)in which the C-2 terminal methyl group maintains the interactionwith Y3137.36, but the remainder of the C-2 sidechain is located in asterically less restricted region near the entrance of the bindingsite. The fused tricyclic salvinorin core is also shifted toward TM5when compared with the putative binding mode of Salvinorin A(1); however, the placement of the furan ring is unchanged. TheKOP receptor-salvinorin interaction model presented here thussuggests that increased affinity is observed with several of thealkoxymethyl ether derivatives because the oxygen atom notdirectly attached to the salvinorin core serves simply as a flexiblelinker that allows the terminal hydrophobic group to effectivelyinteract with Y3137.36.
It has also been observed that while monomethylation at theacetal carbon of the C-2 alkoxymethyl ethers is tolerated,dimethylation at this position can reduce the binding affinity bymore than 100-fold (compare compounds 60 and 72) [14].Examination of the proposed binding mode of the dimethylatedanalog 72 shows that one of the methyl groups intersects theyellow CoMFA contour representing a region where steric bulk

Fig. 8. Stereo view of the b-N-isopropylamine analog of Salvinorin A docked in the KOP receptor.
D.L. McGovern et al. / Journal of Molecular Graphics and Modelling 28 (2010) 612–625624
decreases affinity (see Fig. 6). This yellow region corresponds to thebackbone of the EL2 loop and the E209xl2.49 sidechain.
Finally, it should be noted that all compounds in the analysis arepredicted to have a pKi value within 0.5 log units of theexperimentally determined value. This corresponds to no morethan about a 3-fold difference in the Ki values, which we considerto be a realistic upper bound for the experimental error associatedwith the Ki determination. Roughly this amount of variability hasbeen demonstrated for Salvinorin A under very similar reportedexperimental conditions [14,48].
3.5. Prediction of a C-2 amine binding mode
There is a particularly interesting region where an electroposi-tive moiety enhances affinity (blue) near the C-2 position carbonyloxygen atom on the b-side of the molecule (Fig. 6b). This region ofelectropositivity falls near E209xl2.49, which may explain the highaffinity of some amine containing analogs [7] not included in theTSET or PSET of the models described here. Docking studies of theseamines reveal that the positively charged amine group likelyinteracts with E209xl2.49. An example of the highest-affinity amine75 (Fig. 7), with a reported Ki of 2.3 nM [7], is shown docked in theKOP receptor (Fig. 8).
The docked position of this amine is very similar to Salvinorin Ain our proposed model of the Salvinorin A–KOP receptor complex(Figs. 1 and 2). In addition to the furan oxygen having potentialhydrogen bond interactions with both Q1152.60 and Y3207.43, thehydrogen bonding interaction between Y3127.35 and the C-4position methyl ester oxygen, there is a hydrophobic interaction ofthe methyl groups of the isopropyl substituent with the aromaticrings of both Y3127.35 and Y3137.36 and an ionic interactionbetween the positively charged nitrogen and the negativelycharged sidechain of E209xl2.49. It should also be noted that thisis the b-epimer (i.e. the R-configuration at the C-2 position). Thecorresponding a-epimers (with the S-configuration) do notinteract as well at all points mentioned here due in part to theamine being directed away from E209xl2.49. This may explain thelower affinity of the a-isomers in this series of amine analogs,whereas the trend shown by the esters, ethers and amides is justthe opposite with the a-epimer having the higher affinity. The a-N-isopropylamine analog has a reported Ki of 17.6 nM [7].
4. Conclusions
In this study, two CoMFA models of Salvinorin A analogs boundto the human KOP receptor were presented whose similar contourmaps coincided with the presence of complementary amino acidsidechains in the binding pocket. These models also demonstratedsignificant predictive ability. Model 1 analogs used [125I]IOXY asthe radioligand in the binding affinity assay while Model 2 analogsused [3H]diprenorphine. The alignment that was found to producethe most statistically significant model was a receptor-dockedalignment when compared with FlexS and manual realignmentmethods. Region focusing enhanced Model 1 but not Model 2. Thecontour maps revealed a region of bulk tolerance allowing forapproximately a three-carbon chain from the ester carbonylcarbon. The expected enhancement of affinity with increasingelectronegativity was seen around the C-2 position ester oxygensand the C-1 position carbonyl oxygen. An area of enhanced affinitycorresponding to increased electropositivity on the b-side of themolecule correlated well with our postulated docked position ofamine compounds in the KOP receptor and may explain the trendfor the b-isomer amines to have a higher affinity than thecorresponding a-isomer amines in the series. Further mutagenesisstudies on the key interacting residues could be done to support orrefute the postulated amine-analog binding mode.
Acknowledgment
This work was supported by National Institutes of Health GrantRO1DA017204 (BLR).
Appendix A. Supplementary data
Supplementary data associated with this article can be found, in
the online version, at doi:10.1016/j.jmgm.2009.12.008.
References
[1] B.L. Roth, K. Baner, R.B. Westkaemper, D. Siebert, K.C. Rice, S. Steinberg, P.Ernsberger, R.B. Rothman, Salvinorin A: a potent naturally occurring nonnitroge-

D.L. McGovern et al. / Journal of Molecular Graphics and Modelling 28 (2010) 612–625 625
nous k opioid selective agonist, Proc. Natl. Acad. Sci. U.S.A. 99 (2002) 11934–11939.
[2] A. Ortega, J.F. Blount, P.S. Manchand, Salvinorin, a New trans-NeoclerodaneDiterpene from Salvia divinorum (Labiatae), J. Chem. Soc. Perkins Trans. 1(1982) 2505–2508.
[3] L.J. Valdes III, W.M. Butler, G.M. Hatfield, A.G. Paul, M. Koreeda, Divinorin A, aPsychotropic Terpenoid, and Divinorin B from the Hallucinogenic Mexican MintSalvia Divinorum, J. Org. Chem. 49 (1984) 4716–4720.
[4] C. Beguin, W.A. Carlezon Jr., B.M. Cohen, M. He, D.Y.-W. Lee, M.R. Richards,Salvinorin derivatives and uses thereof, WO 2005/089745, 2005.
[5] C. Beguin, W.A. Carlezon Jr., B.M. Cohen, M. He, D.Y.-W. Lee, M.R. Richards, L.-Y.Liu-Chen, Salvinorin derivatives and uses thereof, US2007/0213394, 2007.
[6] C. Beguin, D.N. Potter, J.A. DiNieri, T.A. Munro, M.R. Richards, T.A. Paine, L. Berry, Z.Zhao, B.L. Roth, W. Xu, L.-Y. Liu-Chen, W.A. Carlezon Jr., B.M. Cohen, N-Methy-lacetamide analog of Salvinorin A: a highly potent and selective k-opioid receptoragonist with oral efficacy, J. Pharmacol. Exp. Ther. 324 (2008) 188–195.
[7] C. Beguin, M.R. Richards, J.-G. Li, Y. Wang, W. Xu, L.-Y. Liu-Chen, W.A. Carlezon Jr.,B.M. Cohen, Synthesis and in vitro evaluation of Salvinorin A analogues: effect ofconfiguration at C(2) and substitution at C(18), Bioorg. Med. Chem. Lett. 16 (2006)4679–4685.
[8] C. Beguin, M.R. Richards, Y. Wang, Y. Chen, L.-Y. Liu-Chen, Z. Ma, D.Y.W. Lee, W.A.Carlezon Jr., B.M. Cohen, Synthesis and in vitro pharmacological evaluation of Salvi-norin A analogues modified at C(2), Bioorg. Med. Chem. Lett. 15 (2005) 2761–2765.
[9] R.V. Bikbulatov, F. Yan, B.L. Roth, J.K. Zjawiony, Convenient synthesis and in vitropharmacological activity of 2-thioanalogs of Salvinorins A and B, Bioorg. Med.Chem. Lett. 17 (2007) 2229–2232.
[10] C. Chavkin, S. Sud, W. Jin, J. Stewart, J.K. Zjawiony, D. Siebert, B.A. Toth, S.J.Hufeisen, B.L. Roth, Salvinorin A, an active component of the hallucinogenic sageSalvia Divinorum is a highly efficacious k-opioid receptor agonist: structural andfunctional considerations, J. Pharmacol. Exp. Ther. 308 (2004) 1197–1203.
[11] W.W. Harding, K. Tidgewell, N. Byrd, H. Cobb, C.M. Dersch, E.R. Butelman, R.B.Rothman, T.E. Prisinzano, Neoclerodane diterpenes as a novel scaffold for m opioidreceptor ligands, J. Med. Chem. 48 (2005) 4765–4771.
[12] D.Y.W. Lee, V.V.R. Karnati, M. He, L.-Y. Liu-Chen, L. Kondaveti, Z. Ma, Y. Wang, Y.Chen, C. Beguin, W.A. Carlezon Jr., B. Cohen, Synthesis and in vitro pharmacologi-cal studies of new C(2) modified Salvinorin A analogues, Bioorg. Med. Chem. Lett.15 (2005) 3744–3747.
[13] T.A. Munro, K.K. Duncan, R.J. Staples, W. Xu, L.-Y. Liu-Chen, C. Beguin, W.A.Carlezon Jr., B.M. Cohen, 8-epi-Salvinorin B: crystal structure and affinity atthe k opioid receptor Beilstein, J. Org. Chem. 3 (2007) 1.
[14] T.A. Munro, K.K. Duncan, W. Xu, Y. Wang, L.-Y. Liu-Chen, W.A. Carlezon Jr., B.M.Cohen, C. Beguin, Standard protecting groups create potent and selective k opioids:Salvinorin B alkoxymethyl ethers, Bioorg. Med. Chem. 16 (2008) 1279–1286.
[15] T. Prisinzano, Opioid Receptor Ligands and Methods for their Preparation,US2006/0058264, 2006.
[16] D.J. Stewart, H. Fahmy, B.L. Roth, F. Yan, J.K. Zjawiony, Bioisosteric modification ofSalvinorin A, a potent and selective kappa-opioid receptor agonist, Arzneimit-telforschung 56 (2006) 269–275.
[17] K Tidgewell, C.E. Groer, W.W. Harding, A. Lozama, M. Schmidt, A. Marquam, J.Heimstra, J.S. Partilla, C.M. Dersch, R.B. Rothman, L.M. Bohn, T.E. Prisinzano,Herkinorin analogues with differential b-arrestin-2 interactions, J. Med. Chem.51 (2008) 2421–2431.
[18] K. Tidgewell, W.W. Harding, A. Lozama, H. Cobb, K. Shah, P. Kannan, C.M. Dersch,D. Parrish, J.R. Deschamps, R.B. Rothman, T.E. Prisinzano, Synthesis of Salvinorin Aanalogs as opioid receptor probes, J. Nat. Prod. 69 (2006) 914–918.
[19] J.K. Zjawiony, H. Fahmy, D.J. Stewart, B.L. Roth, Agents with Selective Kappa-Opioid Receptor Affinity, WO 2006/012643, 2006.
[20] D.Y.W. Lee, M. He, L. Kondaveti, L.-Y. Liu-Chen, Z. Ma, Y. Wang, Y. Chen, J.-G. Li, C.Beguin, W.A. Carlezon Jr., B. Cohen, Synthesis and in vitro pharmacological studies ofC(4) modified Salvinorin A analogues, Bioorg. Med. Chem. Lett. 15 (2005) 4169–4173.
[21] D.Y.W. Lee, M. He, L.-Y. Liu-Chen, Y. Wang, J.-G. Li, W. Xu, Z. Ma, W.A. Carlezon Jr.,B. Cohen, Synthesis and in vitro pharmacological studies of new C(4) modifiedSalvinorin A analogues, Bioorg. Med. Chem. Lett. 16 (2006) 5498–5502.
[22] W.W. Harding, M. Schmidt, K. Tidgewell, P. Kannan, K.G. Holden, C.M. Dersch, R.B.Rothman, T.E. Prisinzano, Synthetic studies of neoclerodane diterpenes fromSalvia divinorum: selective modification of the furan ring, Bioorg. Med. Chem.Lett. 16 (2006) 3170–3174.
[23] D.S. Simpson, P.L. Katavic, A. Lozama, W.W. Harding, D. Parrish, J.R. Deschamps,C.M. Dersch, J.S. Partilla, R.B. Rothman, H. Navarro, T.E. Prisinzano, Syntheticstudies of neoclerodane diterpenes from Salvia divinorum: preparation and opioidreceptor activity of salvinicin analogues, J. Med. Chem. 50 (2007) 3596–3603.
[24] F. Yan, P.D. Mosier, R.B. Westkaemper, B.L. Roth, Ga-subunits differentially alterthe conformation and agonist affinity of k-opioid receptors, Biochemistry 47(2008) 1567–1578.
[25] N. Singh, G. Cheve, D.M. Ferguson, C.R. McCurdy, A combined ligand-based andtarget-based drug design approach for g-protein coupled receptors: application to
Salvinorin A, a selective kappa opioid receptor agonist, J. Comput. Aided Mol. Des.20 (2006) 471–493.
[26] D. Pandit, W.W. Harding, K. Tidgewell, M. Schmidt, A. Lozama, C.M. Dersch, W.J.Skawinski, R.B. Rothman, T.E. Prisinzano, C.A. Venanzi, 233rd ACS NationalMeeting, Chicago, IL, 2006.
[27] R.D. Cramer III, D.E. Patterson, J.D. Bunce, Comparative molecular field analysis(CoMFA). 1: effect of shape on binding of steroids to carrier proteins, J. Am. Chem.Soc. 110 (1988) 5959–5967.
[28] T. Vortherms, P.D. Mosier, R.B. Westkaemper, B.L. Roth, Differential helicalorientations among related G protein-coupled receptors provide a novel mecha-nism for selectivity: studies with Salvinorin A and the k-opioid receptor, J. Biol.Chem. 282 (2007) 3146–3156.
[29] F. Yan, P.D. Mosier, R.B. Westkaemper, J. Stewart, J.K. Zjawiony, T. Vortherms, D.J.Sheffler, B.L. Roth, Identification of the molecular mechanisms by which the diterpe-noid Salvinorin A binds to k-opioid receptors, Biochemistry 44 (2005) 8643–8651.
[30] C. Lemmen, T. Lengauer, G. Klebe, FlexS: A method for fast flexible ligandsuperpositions, J. Med. Chem. 41 (1998) 4502–4520.
[31] S.A. Hjorth, K. Thirstrup, T.W. Schwartz, Radioligand-dependent discrepancy inagonist affinities enhanced by mutations in the k-opioid receptor, Mol. Pharma-col. 50 (1996) 977–984.
[32] M.M. Rosenkilde, M. Cahir, U. Gether, S.A. Hjorth, T.W. Schwartz, Mutations alongTransmembrane Segment II of the NK-1 receptor affect substance P competitionwith non-peptide antagonists but not substance P binding, J. Biol. Chem. 269(1994) 28160–28164.
[33] P.Y. Law, T.M. McGinn, M.J. Wick, L.J. Erikson, C. Evans, H.H. Loh, Analysis of Delta-opioid receptor activities stably expressed in CHO cell lines: function of receptordensity? J. Pharmacol. Exp. Ther. 271 (1994) 1686–1694.
[34] J.A. Ballesteros, H. Weinstein, Integrated methods for the construction of three-dimensional models and computational probing of structure–function relation-ships in G-protein coupled receptors, Methods Neurosci. 25 (1995) 366–428.
[35] H. Xhaard, T. Nyronen, V.-V. Rantanen, J.O. Ruuskanen, J. Laurila, T. Salminen, M.Scheinin, M.S. Johnson, Model structures of a-2 adrenoreceptors in complex withautomatically docked antagonist ligands raise the possibility of interactionsdissimilar from agonist ligands, J. Struct. Biol. 150 (2005) 126–143.
[36] S.J. Cho, A. Tropsha, Cross-validated R2-guided region selection for comparativemolecular field analysis: a simple method to achieve consistent results, J. Med.Chem. 38 (1995) 1060–1066.
[37] B.E. Kane, M.J. Nieto, C.R. McCurdy, D.M. Ferguson, A unique binding epitope forSalvinorin A, a non-nitrogenous kappa opioid receptor agonist, FEBS J. 273 (2006)1966–1974.
[38] B.E. Kane, C.R. McCurdy, D.M. Ferguson, Toward a structure-based model ofSalvinorin A recognition of the k-opioid receptor, J. Med. Chem. 51 (2008)1824–1830.
[39] F. Yan, R.V. Bikbulatov, V. Mocanu, N. Dicheva, C.E. Parker, W.C. Wetsel, P.D.Mosier, R.B. Westkaemper, J.A. Allen, J.K. Zjawiony, B.L. Roth, Structure-baseddesign, synthesis, and biochemical and pharmacological characterization of novelSalvinorin A analogues as active state probes of the k-opioid receptor, Biochem-istry 48 (2009) 6898–6908.
[40] D. Salom, D.T. Lodowski, R.E. Stenkamp, I. Le Trong, M. Golczak, B. Jastrzebska, T.Harris, J.A. Ballesteros, K. Palczewski, Crystal structure of a photoactivateddeprotonated intermediate of rhodopsin, Proc. Natl. Acad. Sci. U. S. A. 103(2006) 16123–16128.
[41] C. de Graaf, N. Foata, O. Engkvist, D. Rognan, Molecular modeling of the secondextracellular loop of G-protein coupled receptors and its implication on structure-based virtual screening, Proteins 71 (2008) 599–620.
[42] J.C. Mobarec, R. Sanchez, M. Filizola, Modern homology modeling of G-proteincoupled receptors: which structural template to use? J. Med. Chem. 52 (2009)5209–5216.
[43] R.D. Clark, A ligand’s-eye view of protein binding, J. Comput. Aided Mol. Des. 22(2008) 507–521.
[44] G. Swaminath, X. Deupi, T.W. Lee, W. Zhu, F.S. Thain, T.S. Kobilka, B.K. Koblika,Probing the b2 adrenoceptor binding site with catechol reveals differences inbinding and activation by agonists and partial agonists, J. Biol. Chem. 280 (2005)22165–22171.
[45] G. Swaminath, Y. Xiang, T.W. Lee, J. Steenhuis, C. Parnot, B. Kobilka, Sequentialbinding of agonists to the b2 adrenoceptor: kinetic evidence for intermediateconformational states, J. Biol. Chem. 279 (2004) 686–691.
[46] T. Kenakin, Functional selectivity through protean and biased agonism: whosteers the ship? Mol. Pharmacol. 72 (2007) 1393–1401.
[47] R. Nygaard, T.M. Frimurer, B. Holst, M.M. Rosenkilde, T.W. Schwartz, Ligandbinding and micro-switches in 7TM receptor structures, Trends Pharmacol. Sci.30 (2009) 249–259.
[48] D.Y.W. Lee, Z. Ma, L.-Y. Liu-Chen, Y. Wang, Y. Chen, W.A. Carlezon Jr., B. Cohen,New neoclerodane diterpenoids isolated from the leaves of Salvia divinorum andtheir binding affinities for human k opioid receptors, Bioorg. Med. Chem. 13(2005) 5635–5639.