journal of petroleum science and engineering · pdf filecomputer simulation program based on...
TRANSCRIPT

Journal of Petroleum Science and Engineering 133 (2015) 507–517
Contents lists available at ScienceDirect
Journal of Petroleum Science and Engineering
http://d0920-41
n CorrE-m
geir.har1 Cu
Stillwat
journal homepage: www.elsevier.com/locate/petrol
Performance, simulation and field application modelingof rollercone bits
Behrad Rashidi n, Geir Hareland 1, Zebing WuDepartment of Chemical & Petroleum Engineering, University of Calgary, Calgary, Alberta, Canada T2N 1N4
a r t i c l e i n f o
Article history:Received 13 January 2015Received in revised form23 May 2015Accepted 2 June 2015Available online 20 June 2015
Keywords:Rollercone bitRate of penetrationRock confined/unconfined compressivestrengthWeight on bitBit revolution per minuteCutter wedge angleRock failure angleBit performance/simulation studiesBit wear coefficient
x.doi.org/10.1016/j.petrol.2015.06.00305/& 2015 Elsevier B.V. All rights reserved.
esponding author.ail addresses: [email protected] ([email protected] (G. Hareland), zbawu@ucarrently: Chemical Engineering Department,er, OK 74075-5020, United States.
a b s t r a c t
Drilling simulation technology has been used extensively to optimize drilling operations so as to mini-mize the associated costs and risks. Optimum bit types and designs with corresponding drilling para-meters can be recommended utilizing a simulator with rate of penetration (ROP) models. There havebeen several attempts to develop ROP models that can deliver the most reliable outputs, required for thepre-planning and post analysis applications, using various sets of drilling parameters. However, due tothe existing modeling complexities, these attempts have not been successful. In this study, a new ROPmodel is developed for the rollercone bits, which properly integrates the effect of main drilling para-meters as well as cutting structure of the bit. The model is mathematically derived based on the me-chanism of single cutter–rock interaction, and calibrated utilizing sets of full scale laboratory data. Also,the bit wear effect for simulating accurate rock strength and ROP values is included in the analysis using apreviously published model. One of the most important features of the newly introduced ROP model isthat it can be easily inverted to generate accurate rock strength values using offset and/or real-time fielddata. This unique characteristic of the ROP model makes it a valuable candidate for drilling simulationstudies to optimize drilling operations in the most cost effective manner. The verification of the in-troduced ROP model is performed through series of simulation analysis and comparing the generatedrock strength logs to the outputs of a commercially available drilling simulator. The comparison of theresults obtained from the simulator and the ROP model as well as field data has been quite encouragingwhich signifies the application of the developed model in determining the best case scenario for plan-ning and/or drilling of future wells with lowest possible expenditures.
& 2015 Elsevier B.V. All rights reserved.
1. Introduction
In oil and gas industry, it has been well recognized that the as-sociated time and cost of drilling wells is a major part of the totalfield development expenses. One of the main objectives of the en-tire well development plans is to minimize the overall well cost incompliance with safe operations and environmental regulations.Drilling rate is one of the key parameters in optimizing the per-formance of the operations through reducing the rotating time ofthe bit. Accordingly, drilling rate models play an important role inimproving drilling performance using available offset well data and/or in real-time drilling.
Rashidi),lgary.ca (Z. Wu).Oklahoma State University,
Extensive studies have been performed to develop comprehensiveROP models for the commonly used rollercone bits considering theeffect of associated drilling and bit design parameters. However, dueto the existing modeling restrictions, as outlined below, previous at-tempts have not been successful and never led to develop a practicalmodel.
�
Mathematically modeling forces applied to the formation by bitcutters.�
Mathematically modeling generated rock volume by each sin-gle cutter as well as estimating cumulative generated cuttingvolume considering bit rotation.�
Taking into account integrated effect of operational and bitdesign parameters.�
Developing invertible ROP models that can be used to estimateformation strength values using any sets of drilling parameters.Therefore, the developed ROP models that integrate the above-mentioned parameters/effects can be utilized as the core engine of

B. Rashidi et al. / Journal of Petroleum Science and Engineering 133 (2015) 507–517508
drilling simulators for conducting drilling optimization studies.Available offset well data can be used as the input to drilling simu-lators in order to generate apparent rock strength logs (ARSL) and/orformation drillability over the well interval. Rock strength logs canalso be generated with a good accuracy using log data. The trendsobtained from log data could be useful in verifying correct rockstrength variations generated by the ROP models specially whensufficient drilling offset information is not accessible.
The main goal of conducting drilling simulation studies is toachieve lowest cost of the well through optimization analysis thatincludes recommending optimum sets of bit types, designs as wellas corresponding operational parameters and bit pull depths whileminimizing drilling problems (Nygaard et al., 2002). Also, real-time transmission and analysis of drilling data, from a remoteserver to an office location, plays an important role in optimizingdrilling operations. Drilling engineers can provide expert opinionsto rig personnel, thus increasing drilling efficiency as well as re-ducing the associated risks (Rashidi et al., 2010).
The primary objective of this study is to develop a new, compre-hensive and practically applicable ROP model for application use in asimulator environment for drilling simulation studies, pre-planning,real-time and post analysis operational mode utilizing rollercone bits.
2. Overview and background
2.1. Single cutter–rock interaction
The cutter–rock interaction is the preliminary area of study inanalyzing drilling performance of rollercone drill bits. There existseveral shortcomings to this area which is mainly due to thecomplexity in rock failure phenomenon as well as modeling thecontact forces during digging action of the bit cutters.
Several models have been introduced to investigate rockbreakage angle of the rock chips using a force balance system. Hillet al. (1947) and Outamans (1960) introduced their rock breakagemodels for ductile materials which could not be applied in brittlematerials with much accuracy. Paul and Sikarskie (1965) proposeda theoretical study for a static wedge penetration model based onMohr-Coulomb failure criterion. Their theory expressed rock fail-ure mechanism through crushing and chipping phases as shown inFig. 1. The positive slope lines represent the elastic deformation orcrushing phases whereas chip formations are characterized by thenegative slope lines in each cycle. Dutta (1972) put forth a theoryexplaining rock breakage phenomenon as a momentarily releaseof strain energy including both crushing and chipping events. Ithas been then shown that the rock breakage phenomenon can be
Fig. 1. Schematic representation of experimental cutter force to rock penetration.
considered as a brittle failure characterized by fractures as a resultof cutter's indentation. Cheatham (1985) conducted a study on theamount of force required for a wedge shaped cutter to penetrateinto the rock. In his model, the rock underneath cutters was as-sumed to be isotropic and homogeneous in a rigid plastic statewhich satisfies yield condition in Mohr–Coulomb theory of failure.The process of rock failure under indentation of cutters includesbuild-up of the stress field, formation of a zone of inelastic de-formation and development of a crater respectively.
2.2. Rollercone bit modeling
Several drilling models have been introduced over the years toexpress rock-bit interaction of rollercone bits as a function of as-sociated drilling and bit design parameters. Primary models werepublished by Galle and Woods (1960) and Morlarn (1961) in softformations introduced ROP models merely as a function of WOBand RPM. Maurer (1962) proposed his model as a function of op-erating parameters and rock strength but it failed to predict ROPresponse to the applied low WOB. Bingham (1965) suggested anew ROP model based on limited laboratory data with the as-sumption of negligible threshold weight on bit (WOB0) and rotaryspeed exponent of one despite the fact that ROP response to in-creasing rotary speed diminishes at high RPM values. Few yearslater, Bourgoyne and Young (1973) suggested a drilling rate modelconsidering the effect of several drilling variables on ROP. Thismodel was derived merely for unsealed roller bearing milled toothbits in vertical wells and the effect of parameters such as WOB,RPM, bit tooth wear and others were assumed to be independentof one another (Ettehadi, 2007). In 1981, Warren introduced a newROP model that integrated the effects of the mechanical and li-thological parameters. The model was developed using dimen-sional analysis and generalized response curves for the best fitusing laboratory data. The results have revealed that generatedrock volume by a single tooth is proportional to the tooth forcesquared and inversely proportional to the rock strength squared.His model was later modified by Rampersad et al. (1994) for takinginto account bit wear and chip hold down effects. Although thepredicted ROP values match field and laboratory data using thismodel, it is not always possible to obtain positive rock strengthvalues utilizing the inverted model. In 1995, Ma developed acomputer simulation program based on rock-bit interaction whichreflected the effect of cutters structure on ROP. This model did notintegrate the effect of rotary speed variations in simulating ROPvalues and is also very complex and time consuming to run, so itcould not be used in drilling simulation studies especially in real-time analysis.
3. Technical approach
3.1. Rollercone bit performance modeling
Development of a new, accurate and applicable drilling ratemodel for rollercone bits is one of the keys to get valuable out-comes from drilling simulation studies. The model should have thecapability of directly estimating ROP as well as approximating rockstrength values utilizing the inverted model with known para-meters. Furthermore, the model should properly reflect the effectof changes in bit design and cutters' geometry for various bit IADCcodes.
In this study, a new comprehensive and practical ROPmodel forrollercone bits is developed based on the approach introduced byEvans and Murrel (1962) and further modified by Ma et al. (1995).A single cutter performance model was first established based onthe experimental data and the ROP model was then introduced by

B. Rashidi et al. / Journal of Petroleum Science and Engineering 133 (2015) 507–517 509
integrating single cutter performance over the bit area. Finally, thenewly developed model was calibrated and verified utilizing la-boratory and field scale data.
3.1.1 Single cutter performance modelingThe indentation of a single insert as well as analysis of forming
rock chips through rock fracturing occurrence are used as thebeginning step in performance modeling of rollercone bits. In thisstudy, mechanical modeling of forces and geometrical modeling ofrock breakage craters are used to analyze cutter–rock interaction.
3.1.1.1. Wedge penetration model. Formation of a chip as a result ofindenting a wedge shape cutter into a rock specimen is a con-tinuous process including crushing and chipping phases. For thecrushing phase, rock is fragmented in the area surrounding thewedge as the wedge advances and causes the elastic stress to buildup. A chip will then form along the fracture surface after a certainlevel of penetration is reached. Fig. 2 represents formation of the(iþ1)th chip after the (i)th chip has been generated.
In this theory, the shear stress along the fracture line is pro-portional to cohesive rock strength, which satisfies the Mohr-Coulomb yield criterion. Moreover, the rock breakage/failure angle(ψ), which is a characteristic property of the formation, can berepresented as a function of rock internal friction angle (Ø) asshown in Fig. 3:
⎜ ⎟⎛⎝
⎞⎠
12 4 2 1
ψ π ϕ= −( )
3.1.2. ROP modeling of rollercone bitsIn this study, a new and comprehensive ROP model is derived
directly based on the rock craters fractured by a single insert. Thework behavior of each insert includes both crushing and shearing,
Fig. 2. Schematic representation of single wedge/tooth penetration model (Pauland Sikarskie, 1965).
Fig. 3. Schematic representation of a chip created by indentation of a single wedgecutter (Dutta, 1972).
which represents the actual movement of inserts on the rollerconebits. The model is initially verified using following information:
�
Fig.crat
Fig.et a
Outputs of an available complex 3D design evaluation program(Ma et al., 1995), for various bit IADC codes.
�
The result of the single-row insert indentation test conductedby Kingdream in China (Z. Wu, Personal communication, June2010). Figs. 4 and 5 show the apparatus as well as the datacollection system used to run the test.The complex 3D model is not practical to be used in drillingsimulation and optimization studies as it is slow, detailed designparameters are required, and missing key functionalities such asfailing to reflect the integrated effect of the associated key para-meters on the rate of penetration. However, it can be used to ac-curately integrate the effect of changes in bit designs and cutters'geometry including static bit wear and cutters structures on theproposed model. The results of the 3D modeling are used to
4. 3D scanning camera system used to capture the geometry of the generateders (Hareland et al., 2010).
5. Single-row insert work piece used to run the indentation test (Harelandl., 2010).
Fig. 6. Schematics of rock craters generated by inserts.
B. Rashidi et al. / Journal of Petroleum Science and Engineering 133 (2015) 507–517510
establish the ROP model for the perfect cleaning condition at thebit indicating that cuttings are removed from underneath the bitas fast as they are generated.
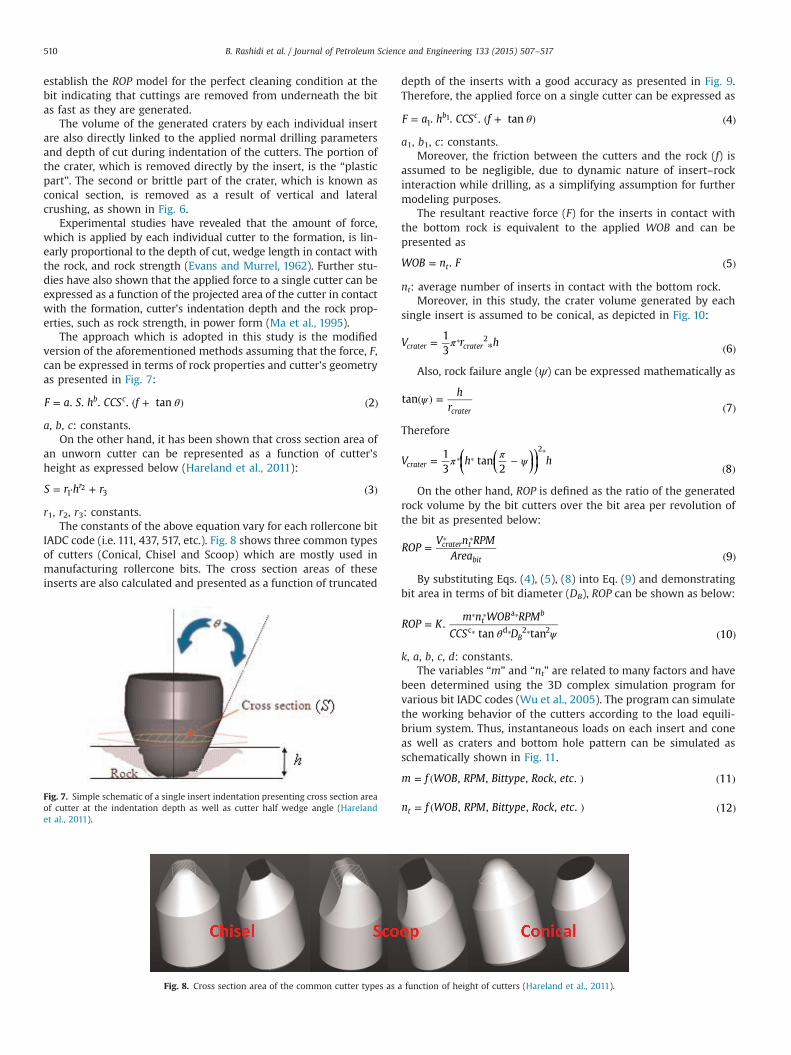
The volume of the generated craters by each individual insertare also directly linked to the applied normal drilling parametersand depth of cut during indentation of the cutters. The portion ofthe crater, which is removed directly by the insert, is the “plasticpart”. The second or brittle part of the crater, which is known asconical section, is removed as a result of vertical and lateralcrushing, as shown in Fig. 6.
Experimental studies have revealed that the amount of force,which is applied by each individual cutter to the formation, is lin-early proportional to the depth of cut, wedge length in contact withthe rock, and rock strength (Evans and Murrel, 1962). Further stu-dies have also shown that the applied force to a single cutter can beexpressed as a function of the projected area of the cutter in contactwith the formation, cutter's indentation depth and the rock prop-erties, such as rock strength, in power form (Ma et al., 1995).
The approach which is adopted in this study is the modifiedversion of the aforementioned methods assuming that the force, F,can be expressed in terms of rock properties and cutter's geometryas presented in Fig. 7:
F a S h CCS f. . . . tan 2b c θ= ( + ) ( )
a, b, c: constants.On the other hand, it has been shown that cross section area of
an unworn cutter can be represented as a function of cutter'sheight as expressed below (Hareland et al., 2011):
S r h r 3r1 3
2= ⋅ + ( )
r1, r2, r3: constants.The constants of the above equation vary for each rollercone bit
IADC code (i.e. 111, 437, 517, etc.). Fig. 8 shows three common typesof cutters (Conical, Chisel and Scoop) which are mostly used inmanufacturing rollercone bits. The cross section areas of theseinserts are also calculated and presented as a function of truncated
Fig. 7. Simple schematic of a single insert indentation presenting cross section areaof cutter at the indentation depth as well as cutter half wedge angle (Harelandet al., 2011).
Fig. 8. Cross section area of the common cutter types as a
depth of the inserts with a good accuracy as presented in Fig. 9.Therefore, the applied force on a single cutter can be expressed as
F a h CCS f. . . tan 4b c1
1 θ= ( + ) ( )
a1, b1, c: constants.Moreover, the friction between the cutters and the rock (f) is
assumed to be negligible, due to dynamic nature of insert–rockinteraction while drilling, as a simplifying assumption for furthermodeling purposes.
The resultant reactive force (F) for the inserts in contact withthe bottom rock is equivalent to the applied WOB and can bepresented as
WOB n F. 5t= ( )
nt: average number of inserts in contact with the bottom rock.Moreover, in this study, the crater volume generated by each
single insert is assumed to be conical, as depicted in Fig. 10:
V r h13 6crater crater
2π= ⁎ ( )⁎
Also, rock failure angle (ψ) can be expressed mathematically as
hr
tan7crater
ψ( ) =( )
Therefore
⎜ ⎟⎛⎝⎜
⎛⎝
⎞⎠⎞⎠⎟V h h
13
tan2 8crater
2
π π ψ= −( )
⁎ ⁎⁎
On the other hand, ROP is defined as the ratio of the generatedrock volume by the bit cutters over the bit area per revolution ofthe bit as presented below:
ROPV n RPM
Area 9crater t
bit=
( )
⁎ ⁎
By substituting Eqs. (4), (5), (8) into Eq. (9) and demonstratingbit area in terms of bit diameter (DB), ROP can be shown as below:
ROP Km n WOB RPM
CCS D.
tan tan 10t
b
B
a
c d 2 2θ ψ=
( )
⁎ ⁎ ⁎
⁎ ⁎ ⁎
k, a, b, c, d: constants.The variables “m” and “nt” are related to many factors and have
been determined using the 3D complex simulation program forvarious bit IADC codes (Wu et al., 2005). The program can simulatethe working behavior of the cutters according to the load equili-brium system. Thus, instantaneous loads on each insert and coneas well as craters and bottom hole pattern can be simulated asschematically shown in Fig. 11.
m f WOB RPM Bittype Rock etc, , , , . 11= ( ) ( )
n f WOB RPM Bittype Rock etc, , , , . 12t = ( ) ( )
function of height of cutters (Hareland et al., 2011).

Fig. 9. Relationship between cross section area and truncated depth of three common insert types (Hareland et al., 2011).
Fig. 10. Simple schematic of a formed conical crater as a result of single insertindentation.
Fig. 11. (a) Load equilibrium of cutters on bottom hole, (b) schematic of generatedcraters by inserts and (c) 3D view of bottom hole pattern (Hareland et al., 2010).
B. Rashidi et al. / Journal of Petroleum Science and Engineering 133 (2015) 507–517 511
3.1.2.1. Rock failure angle analysis. As presented in Eq. (1), rockbreakage angle (ψ) can be expressed solely in terms of rock in-ternal friction angle (Ø). On the other hand, rock failure angle isthe main input of the developed ROP model and must be knownfor performing simulation studies. The required information forindicating rock failure angle is not always available specially forconducting performance analysis using field data. Therefore, Inthis study, the following approach was adopted, with reference toFig. 3, to express the rock breakage angle (ψ) as a function of depthof cut (h) and half-wedge angle of the cutters (θ).
As per Fig. 3, half-wedge angle of the crushed rock mass (β) canbe presented as
rd
tan 13craterβ( ) = ( )
rcrater: radius of the generated crater after rock failure happens (m),d: total rock cutting depth (m).
Moreover,
rh
tan 14craterθ( ) = ( )
d a h 15b1
1= ⁎ ( )
a1, b1: constants.Combining Eqs. (13)–(15) will result in
a htan tan 16b2
2β θ( ) = ( ) ( )⁎ ⁎
a2, b2: constants.Furthermore, depth of cut (h) has been shown that can be ex-
pressed as a function of rate of penetration (ROP) per revolution ofthe bit (RPM). Thus
⎛⎝⎜
⎞⎠⎟a
ROPRPM
tan tan17
b
2
2
β θ( ) = ( )( )
⁎ ⁎
In addition, it can be implied that the rock breakage angle (ψ)can be stated in terms of rock internal friction angle and half-wedge angle of the crushed rock mass (β) as
4 2 18ψ π β ϕ= − +( )
Hence, Eqs. (1) and (18) will imply
2 19β ψ≅ ⁎ ( )
Therefore
⎛⎝⎜
⎞⎠⎟a
ROPRPM
tan 2 tan20
b
2
2
ψ θ( ) = ( )( )
⁎ ⁎
The above equation shows that the rock breakage angle is afunction of half-wedge angle of the cutter (θ) and the depth of cut(h) in the power form. This relationship does not violate the factthat the rock failure angle (ψ) is only a characteristic property ofthe rock and it does not change as a function of operational and

Fig. 12. ROP sensitivity to the hole size (schematic).
Table 2Calculated constants of the ROP model for bit IADC517.
Constants Numerical values
K 0.17a 1.33b 0.64c 0.5d 0.4
Table 3
B. Rashidi et al. / Journal of Petroleum Science and Engineering 133 (2015) 507–517512
design parameters. In fact, any variation in the cutter's wedgeangle will change the depth of cut (indentation) of the cutter andwill not affect the magnitude of the rock failure angle.
In addition, it has been determined that the range at which therock breakage angle may vary can roughly be estimated as follows(Dutta, 1972):
0 22ψ≤ ≤
Thus, one can simply correlate tan(2ψ) versus tan(ψ) as shownbelow:
tan 2 2.3 tan 211.05ψ ψ( ) = ( ) ( )⁎
Therefore, by substituting Eqs. (20) and (21) into Eq. (10), ROPmodel can be presented independent of the rock breakage angle asbelow:
ROP Km n WOB RPM
CCS Dtan 22t
b
B
a
c d 2θ=
( )⁎
⁎ ⁎ ⁎
⁎ ⁎
k, a, b, c, d: constants.
3.1.2.2. Modeling the hole size effect. Hole size or bit diameter (DB)is one of the main inputs of the drilling rate model, which cansignificantly influence the performance of rollercone bits. As in-dicated in above equation, larger bit diameter reduces ROP if otheroperational and bit design parameters are kept constant. However,according to Mensa and Fear (2001), ROP is not always increasingas the bit diameter is reduced. The results, which are also acceptedby the industry as a valid functionality, showed that ROP increaseswith reduction in bit diameter up to the certain bit size and startdecaying afterwards as depicted in Fig. 12. The optimum bit dia-meter to reach maximum bit performance has been reported to beapproximately 8.5″. This has also been confirmed through la-boratory and field results (Warren, 1981).
Therefore, herein, the developed ROP model by Warren (1981) forthe rollercone bits was utilized to generate the following
Table 1Calculated constants of the bit diameter function using multiple regressionanalysis.
Constants of fB(DB) function Numerical value (metric system)
r1 106.4r2 �33.3r3 �34.6r4 14.4r5 �0.4
functionality of ROP for various bit diameters (DB). The model isnormalized to generate a maximum ROP at the 8.5″ bit diameter.The constants of the model are also obtained and tabulated inTable 1 through multiple regression analysis.
f D r D r D r D r D r. . . . 23B B B B B B14
23
32
4 5( ) = + + + + ( )
fB(DB): bit diameter function, DB: bit diameter (m), r1, r2, r3, r4,r5: constants.
Finally, the developed ROP model can be presented as followswith properly taking into account the hole size effect.
ROP Km n WOB RPM
CCSf D
tan 24t
b
d B B
a
c θ= ⁎ ( )
( )⁎
⁎ ⁎ ⁎
⁎
k, a, b, c, d: constants.
3.1.2.3. Calibration of the newly developed ROP model. The newlydeveloped ROP model can be used for predicting rate of penetra-tion or/and apparent rock strength log after it is calibrated usingexperimental data. Each bit IADC code requires specific laboratorydata to calibrate the ROP model so it can be used for performanceanalysis of the same bit through implementing various drillingscenarios. Since the ROP model is developed for the perfectcleaning condition at the bit, only clean ROP values are selectedfrom laboratory data sets which are characterized by the semi-linear functionality of ROP to the applied WOB.
Due to the limited availability of laboratory data for various bitIADC codes, the constants of the model were determined hereinthrough multiple regression analysis for bit IADC 517 in metricunits as tabulated in Tables 2 and 3.
Fig. 13 also shows a good match between the calculated ROPvalues by the model and corresponding measured ROP values inthe laboratory for a different set of experimental data utilizingrollercone bit IADC 517.
3.1.2.4. Rock confinements effect on rock unconfined compressivestrength. Analysis of bit performance based on generated rock
Laboratory data sample used to obtain the constants of the ROP model (IADC 517).
WOB (T) ROP (m/h) RPM CCS (MPa) DB (m)
6.45 3.42 60 58.39 0.2169.60 4.27 60 58.37 0.216
12.66 6.57 60 58.32 0.21615.79 7.76 60 58.29 0.21618.89 8.82 59 58.32 0.2166.37 2.83 122 113.53 0.2169.54 5.19 122 113.53 0.216
12.69 7.10 122 113.51 0.21615.79 8.87 122 113.49 0.21618.82 11.59 122 113.53 0.216

Fig. 13. Comparison between calculated and reported experimental ROP values utilizing the developed ROP model.
Table 4Coefficients for permeable and impermeable rock types to use for converting CCS toUCS.
Coefficients Permeable rocks Impermeable rocks
as 0.24 0.24bs 0.58 0.78
B. Rashidi et al. / Journal of Petroleum Science and Engineering 133 (2015) 507–517 513
strength logs using drilling rate models has become a standardpractice in the oil and gas industry. The rock strength term in ROPmodels represents the confined rock compressive strength. Thisterm cannot be used directly in drilling simulations and optimi-zation studies due to the presence of rock confinements. Basically,confinement pressure increases rock resistance to breakage, whichis evident while testing a sample in the laboratory under the ap-plied loads. Therefore, rock confinement effect must be eliminatedfrom the generated rock strength values using inverted ROPmodels (CCS). Rampersad et al. (1994) proposed the following
Fig. 14. Flow chart showing steps for estimating rock unconfined comp
correlation that relates confined rock compressive strength (CCS)to unconfined rock compressive strength (UCS) as a function ofconfinement pressures.
CCS UCS a P1 25s ebs= ( + ) ( )⁎ ⁎
CCS: confined rock compressive strength (MPa), UCS: un-confined rock compressive strength (MPa), Pe: confinementpressures (MPa), as, bs: coefficients.
The constants of the above equation are varied depending uponthe rock permeability as tabulated in Table 4.
Also, the confinement pressure (Pe) can be defined as the dif-ference between the bottom hole pressure (i.e.: hydrostatic pres-sure of the drilling fluid) and pore pressure. The latter is thepressure of the fluid inside the rock, particularly for permeableformations, as shown below.
P P P 26e BHP p= − ( )
ressive strength utilizing new ROP model including bit wear effect.

Fig. 15. Flow chart showing the development steps of the newly introduced ROP model.
B. Rashidi et al. / Journal of Petroleum Science and Engineering 133 (2015) 507–517514
P TVD MW9.8 10 27Hydrostatic6= ⁎ ( )⁎ − ⁎
PHydrostatic: hydrostatic pressure (MPa), TVD: true vertical depth(m), MW: mud weight (kg/m3).
4. Simulation analysis and technical results
This section illustrates the application of the developed ROPmodel using a newly introduced systematic simulation method.The verification of the model is also discussed utilizing sets of fielddata from wells drilled in Alberta, Canada, provided by NexenEnergy ULC. and British Gas.
4.1. Generation of rock strength logs utilizing the new ROP model
Having known operational and bit design parameters, rockconfined compressive strength (CCS) can be back calculated usingthe newly developed ROP model for rollercone bits. The results areuseful in generating a reference rock strength database usingavailable offset data for future planning and drilling optimizationanalysis.
Bit wear effect is also integrated into the ROP model utilizing apreviously developed wear model (Rampersad et al., 1994) as ex-plained below:
⎛⎝⎜
⎞⎠⎟W
BG1
8 28f = − Δ( )
BG C WOB RPM A CCS29
ci
n
i i r i1
i∑Δ = ⁎ ⁎ ⁎( )=
ΔBG: cumulative bit wear function, Ar: formation abrasivenesscoefficient, CCS: rock confined compressive strength (MPa), Wf:bit wear function, RPM: rotary speed of the bit (revolution/min), WOB: weight on the bit (T), Cc: bit wear coefficient.
Therefore, the ROP model including wear function can beshown as
ROP Km n WOB RPM
CCSf D W
tan 30t
b
d B B f
a
c θ= ⁎ ( )⁎
( )⁎
⁎ ⁎ ⁎
⁎
k, a, b, c, d: constants.The iteration process utilizing wear function is also outlined
below as well as schematically depicted in Fig. 14.
�
Select an arbitrary low initial value for the bit wear constant(Cc). � Calculate rock strength (CCS) value using the inverted ROPmodel for the first point of the drilled section with no bitwear (ΔBG¼0).�
Calculate ΔBG for each point using the calculated CCS valuesfrom previous points for the entire bit run section.�
Check with a tolerance that final bit wear, for the last meterwhere bit was pulled (ΔBGv), matches the reported bit wearout as shown below:BG BGBG
0.00131
out v
out
Δ ΔΔ
| − |<
( )
�
Repeat the iterations with new modified bit wear constantvalue until both calculated and reported bit wear outs matchup.C CBG BGBG BG
.32a a
out in
v inNew
=|Δ − Δ ||Δ − Δ | ( )
The final bit wear constant can then be utilized to obtain
� unconfined rock compressive strength (UCS) for the drilledinterval.In the area where offset well data are available, the apparentrock strength log (ARSL) or UCS can be generated for the entirewell utilizing this method. The apparent rock strength log (ARSL)is the main input for the simulation studies of the upcoming wellsin the same area. It gives the drilling engineers the ability to si-mulate bit performance using operating parameters includingdifferent bit pull depths for different drilling scenarios. Thismethod has already been successfully used in various oil fields inwestern Canada (Fazaelizadeh et al., 2010).
Fig. 15 depicts a schematic representaiton of the developmentsteps of the new ROP model introduced in this study.
4.2. Verification of the newly developed ROP model
The verification of the newly developed ROP model was per-formed utilizing offset well data to:
B. Rashidi et al. / Journal of Petroleum Science and Engineering 133 (2015) 507–517 515
�
Fig.two
Generate UCS meter by meter logs for an specific area andcompare the results as the first verification part.
�
Utilize the generated UCS logs to calculate ROP values for an-other well drilled in the same area and compare the calculatedROP results with the recorded ROP values in the field as thesecond verification part of the model.Moreover, the outputs of a drilling simulator (Drops) (Bratliet al., 1997) as well as the generated rock strength logs utilizing logdata (Andrews et al., 2007), as shown below, were used for furthermodel's verifications.
UCSK f
t
1
130 33N
K1
0.18
2
ϕ=
( − )⁎
(Δ − ) ( )
f1
1 34N ss
N sh
0.18
0.18
ϕ
ϕ=
( − )
( − ) ( )−
−
ØN: neutron porosity (fraction), ØN-ss: neutron porosity of puresandstone formation (fraction), ØN-sh: neutron porosity of pureshale formation (fraction), Δt: sonic travel time (μs/m), K1, K2:constants.
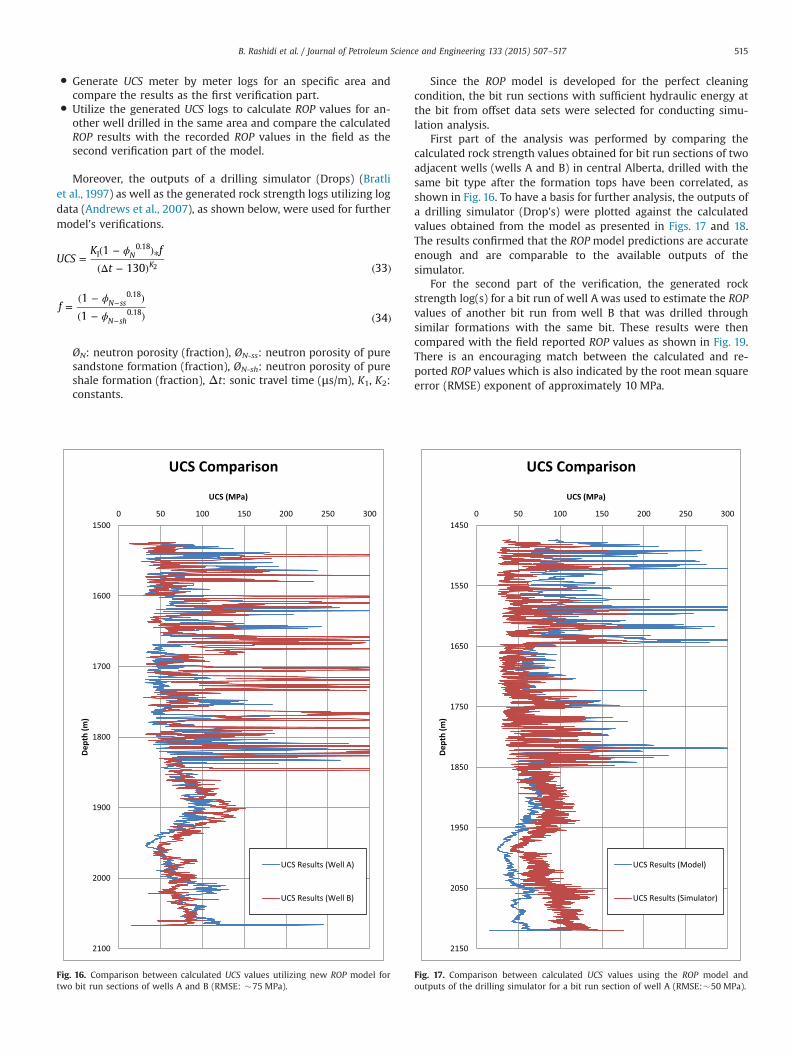
16. Comparison between calculated UCS values utilizing new ROP model forbit run sections of wells A and B (RMSE: �75 MPa).
Since the ROP model is developed for the perfect cleaningcondition, the bit run sections with sufficient hydraulic energy atthe bit from offset data sets were selected for conducting simu-lation analysis.
First part of the analysis was performed by comparing thecalculated rock strength values obtained for bit run sections of twoadjacent wells (wells A and B) in central Alberta, drilled with thesame bit type after the formation tops have been correlated, asshown in Fig. 16. To have a basis for further analysis, the outputs ofa drilling simulator (Drop's) were plotted against the calculatedvalues obtained from the model as presented in Figs. 17 and 18.The results confirmed that the ROP model predictions are accurateenough and are comparable to the available outputs of thesimulator.
For the second part of the verification, the generated rockstrength log(s) for a bit run of well A was used to estimate the ROPvalues of another bit run from well B that was drilled throughsimilar formations with the same bit. These results were thencompared with the field reported ROP values as shown in Fig. 19.There is an encouraging match between the calculated and re-ported ROP values which is also indicated by the root mean squareerror (RMSE) exponent of approximately 10 MPa.
Fig. 17. Comparison between calculated UCS values using the ROP model andoutputs of the drilling simulator for a bit run section of well A (RMSE:�50 MPa).

Fig. 18. Comparison between calculated UCS values using new ROP model andoutputs of the drilling simulator for a bit run section of well B (RMSE: �70 MPa).
Fig. 19. Comparison between calculated ROP values for well B utilizing generatedrock strength values of well A using new ROP model with reported field ROP values(RMSE: �10 MPa).
B. Rashidi et al. / Journal of Petroleum Science and Engineering 133 (2015) 507–517516
To ensure of the accuracy of the model as well as having anadditional verification tool, the rock strength values were alsogenerated utilizing log data for a selected bit run section of well Aand compared with the generated UCS values obtained from thedeveloped ROP model as shown in Fig. 20.
5. Highlights and conclusions
The time spent with bit on bottom is one of the main para-meters in evaluating performance of drilling operations.Proper selection of operational parameters, bit types and designsprior to drilling a well will help reduce on bottom drilling time andoptimize drilling operations accordingly.
The newly and comprehensively developed ROP model in thisstudy is an stepping stone towards analyzing performance ofrollercone drill bits through recommending best parameters re-quired for enhancing drilling performance of a well.
The summary of the conclusions that can be drawn from thisstudy are as follows:
�
The applied force by each single cutter of rollercone bits to therock is a direct and non-linear function of rock strength, depthof cut, horizontal projected area and wedge angle of the cutter.
� Average number of cutters in contact with formation per re-volution of the bit can be represented by depth of cut which isthe ratio of drilling rate (ROP) to rotational speed of the bit(RPM).
�
Rock breakage angle is a function of half wedge angle of the bitcutters (θ) as well as the depth of cut.�
The potential application of the developed ROP model wasshown to be encouraging when comparing simulated rockstrength/ROP values with the outputs of drilling simulator aswell as reported values from the field.�
In this study, a systematic simulation method using the de-veloped ROP model is introduced, verified and tested utilizingfield data. This simulation method can be employed to re-commend optimum drilling operational parameters and bittypes for the upcoming wells in the same area wherein offsetwell data are available.�
The newly developed ROP model and simulation method canalso be utilized in real-time drilling for performance monitor-ing of rollercone bits and providing constructive re-commendations on the fly required for minimize potentiallyoccurring drilling problems and achieving maximum drillingefficiency.
Fig. 20. Comparison between calculated UCS values using new ROP model andgenerated rock strength values utilizing log data for a bit run section of well A(RMSE: �45 MPa)
B. Rashidi et al. / Journal of Petroleum Science and Engineering 133 (2015) 507–517 517
Acknowledgments
I would like to gratefully acknowledge Prof. G. Hareland for hisenthusiastic supervision throughout this work. I also wish to ex-press my sincere appreciation to Dr. Z. Wu for all the technicalsupport he provided during my study.
Special thanks to Nexen Energy ULC., British Gas, TalismanEnergy, Pason, NSERC, and University of Calgary for providingtechnical data, financial support, and great opportunities to makethis work a success.
References
Andrews, R., Hareland, G., Nygaard, R., Engler, T., Munro, H., Verginillo, B. 2007.Method of using logs to quantify drillability. In: Proceedings of the SPE RockyMountain Oil & Gas Technology Symposium. Denver, Colorado, U.S.A., 16–18April 2007.
Bingham, M.G., 1965. A New Approach to Interpreting Rock Drillability. PetroleumPublishing Co, Reprinted from Oil and Gas Journal Series.
Bourgoyne, A.T., Young F.S., 1973. A multiple regression approach to optimal drillingand abnormal pressure detection. Paper in SPE–AIME Sixth Conference onDrilling and Rock Mechanics. Austin, TX, January 22–23.
Bratli, R.K., Hareland, G., Stene, F., Dunsaed, G.W., Gjelstad, G., 1997. Drilling opti-mization software verified in the North Sea. Paper SPE No. 39007, Presented atthe SPE LACPEC Conference. Rio De Janeiro, Brazil, August 30–September 2.
Cheatham, J.B., 1985. An analytical study of rock penetration by a single bit tooth.In: Proceedings of the 8th Drilling and Blasting Symposium. University ofMinnesota, pp. 1A–24A.
Dutta, P.K., 1972. A theory of percussive drill bit penetration. Int. J. Rock Mech. Min.Sci. 9, 543–567.
Ettehadi, R., 2007. Rate of Penetration Estimation Model for Directional and Hor-izontal Wells (M.Sc. thesis). Middle East Technical University.
Evans, I., Murrel, S., 1962. Wedge penetration into coal. Colleiry Eng. 39 (455), 11.Fazaelizadeh, M., Rashidi, B., Hareland, G., 2010. Drilling-derived rock strength can
simulate upcoming well performance. CSUG/SPE 135857, Presented at theUnconventional Resources & International Petroleum Conference. Calgary, Al-berta, Canada, 19–21 October.
Galle, E.M., Woods, H.B., 1960. Variable weight and rotary speed for lowest drillingcost. Paper Presented at the AAODC Annual Meeting. New Orleans, September27.
Hill, R., Lee, E.H., Tupper, S.J., 1947. The theory of wedge indentation on ductilematerials. Proc. R. Soc. A 188, 273–289.
Hareland, G., Wu, A., Rashidi, B., 2010. A new drilling rate model for tri-cone bitsand its application to predict rock compressive strength. ARMA 10-206, Pre-sented at the 44th US Rock Mechanics Symposium. Salt Lake City, UT, June 27–30.
Hareland, G., Wu, A., Rashidi, B., 2011. A new way of considering insert wear in thedrilling rate model for rollercone bits. ARMA 11-208, Presented at the 45th USRock Mechanics/Geomechanics Symposium. San Francisco, CA, June 26–29.
Morlarn, E.A., 1961. Boring large hole mine openings. Paper Presented at the SME–AIME Annual Meeting. St. Louis, February 26.
Maurer, W.C., 1962. The perfect cleaning theory of rotary drilling. J. Pet. Technol.,1270–1274, Trans. AIME, 225.
Ma, D., Zhou, D., Deng, R., 1995. The computer simulation of the interaction be-tween roller bit and rock. In: Proceedings of the International Meeting onPetroleum Engineering. Beijing, November 14–17.
Mensa, G., Fear, M., 2001. The effect of formation hardness, abrasiveness, hetero-geneity and hole size on PDC bit performance. SPE 67698, Presented at SPE/IADC Drilling Conference. Amsterdam, Netherland, February 27–March 1.
Nygaard, R., Hareland, G., Budiningsih, Y., Terjesen, H.E., Stene F., 2002. Eight yearsexperience with a drilling optimization simulator in the north Sea. SPE Paper77247 Presented at the IADC/SPE Asia Pacific Drilling Conference. Jakarta, In-donesia, September 9–11.
Outamans, H.D., 1960. The effect of some drilling variables on the instantaneousrate of penetration. Trans. Am. Inst. Mech. Eng. 232, 372–383.
Paul, B., Sikarskie, D.L., 1965. A preliminary model for wedge penetration in brittlematerials. Trans. Am. Inst. Min. Eng. 232, 373–383.
Rashidi, B., Hareland, G., Tahmeen, M., Anisimov, M., Abdorazakov, S., 2010. Real-time bit wear optimization using the intelligent drilling advisory system. SPEPaper 136006, Presented at the SPE Russian Oil & Gas Technical Conference andExhibition. Moscow, Russia, 26–28 October.
Rampersad, P.R., Hareland, G., Boonyapaluk, P., 1994. Drilling optimization usingdrilling data and available technology. SPE 27034, Presented at SPE LatinAmerica/Caribbean Petroleum Engineering Conference, Buenos Aires, Argenti-na, 27–29 April.
Warren, T., 1981. Drilling Model for Soft-Formation Bits. SPE Paper 8438, September23–26.
Wu, Z., Vince, T., Attia, H., 2005. CAD/CAE system of rollercone bits. In: Proceedingsof the International Conference on Computer Aided Optimal Design. Skiathos,Greece, 23–25 May.