journal of pharmacy and chemistry - jpc.stfindia.comjpc.stfindia.com/images/pdf/jpc 7 (3) - with...
TRANSCRIPT

ISSN 0973 – 9874 J.Pharm.Chem CODEN: JPCOCM
Journal of Pharmacy and Chemistry(An International Research Journal of Pharmaceutical and Chemical Sciences)
Indexed in Chemical Abstract and Index Copernicus
www.stfindia.com
www.jpc.stfindia.com
Editor-in-chief
Prof. K.N. JAYAVEERAJawaharlal Nehru Technological University Anantapur,
Anantapur, Andhra Pradesh -515001.
Executive EditorDr. K. Balaji
Editorial Board
Dr. B.M.Vrushabendra Swamy Dr. Sridhar ChenchugariDr. A. Venkateshwar Reddy Dr. Y. SudhakarProf. Y. Narasimha Reddy Dr. G. S. KumarDr. V. Srinivasulu Dr. K. Yogananda ReddySri. S. Subramanyam Dr. Mohammed Habibuddin
Dr. K. Adinarayana Dr. K. Bhaskar Reddy
Dr. K.V. Madhusudhan Dr. A. Sunil Kumar Reddy
Editorial Advisory Board
Prof. S. Srihari India Prof. G. Krishna Mohan India
Prof. K.V.S.R.G. Prasad India Prof. K. Bharathi India
Prof. K.V. Ramana Murthy India Prof. K. Kannan India
Prof. D.R. Krishna India Prof. K.B.Chandrasekhar India
Prof. S. Kavimani India Prof. A. Ramachandraiah India
Prof. M. Kalilullah India Prof. K. Mukkanti India
Prof. A. Naidu India Prof. P. K. Dubey India
Prof. Jonathan R Dimmock Canada Prof. Ananth. P. Haridas India
Prof. Helton Max M. Santos Portugese Prof. Damaris Silveira Brazil
Prof. Mustafa Iraz Turkey Prof. Abdul Naser B Singab Egypt
Prof. Ali Asgarh hemmati Iran Prof. Mohd Mehedi Maasud Bangladesh
Prof. N. Devanna India Prof. K.R.S. Sambasiva Rao India
Prof. Chandrashekar Sultanpuri India Prof. R. Shyam Sunder India
Dr. Indrajeet D Gonjari India Dr. Nitin Mahukar India
Prof. Sarangapani India Dr.L. Prabakaran India
Prof. Arun Goyal India Prof. Chandrashekhar D. Upasani India
July - September 2013 2 Journal of Pharmacy and Chemistry • Vol.7 • Issue.3
ISSN 0973 – 9874 J.Pharm.Chem CODEN: JPCOCM
Journal of Pharmacy and Chemistry(An International Research Journal of Pharmaceutical and Chemical Sciences)
Volume 7 • Issue 3 • July – September 2013
�
VIEWS
The views and opinions expressed in this journal are those of the contributors; Science-Tech Foundation does notnecessarily concur with the same. All correspondence should be addressed to the Editor-In-Chief (Hon.), Journal ofPharmacy and Chemistry (Science-Tech Foundation), Plot No 22, Vidyut Nagar, Anantapur - 515 001, Andhra Pradesh,India. • e-mail: [email protected]. Send your queries at www.jpc.stfindia.com, www.stfindia.com
Contents
Physicochemical and Phytochemical Evaluation of Different Extracts of Leptadenia Reticulata (Retz.) ..................1
GIRISH C, NARSIMHA REDDY Y, SUBBA REDDY GV AND JAYAVEERA KN
A New Analytical Reagent 2, 6-Diacetylpyridine Bis(4-phenyl- 3-thiosemicarbazone)for the Determination of Ni(II) in Medicinal leaves and Soil Samples ..........................................................................9
RAMACHANDRAIAH C, ADINARAYANA REDDY S, SREEDEVI P, AND VARADA REDDY A
Mycosporine-like Amino Acids: Natural Bioactive Compounds Having Pharmaceutical Potentials .......................16
RICHA AND RAJESHWAR P. SINHA
Solubility enhancement of Gliclazide with Poloxamer188 by lyophilization technique .............................................21
VENKATESHWAR REDDY A, KANHU CHARAN PANDA AND NIRANJAN PANDA
Synthesis and characterization of metal complexes of 4- aminobenzene sulfonamide Schiff base ..........................28
VIJAYA SEKHAR E, JAYAVEERA KN, RAVINDER M AND SRIHARI S
Impact of Calcium and Magnesium Ions in Identification of Second GenerationOffspring Gender in rabbits ...............................................................................................................................................31
CHANDRAJU S, BEIRAMI A AND CHIDAN KUMAR CS ............................................................................................31
Synthesis and Biological Evaluation of Some 1-[(2-methyl-1h-indol-3-yl)Carbonyl]-3-substituted Phenyl-1h-pyrazole-4-carbaldehyde Derivatives ....................................................................36
BHARATH RATHNA KUMAR P, VISHNU VANDANA B, SRAVANI M,
VENU PRIYA R SUBRAMANYAM S AND JAYAVEERA KN
Chitosan: Naturally Occurring Biopolymer for Defluroidation of Water ....................................................................40
KAMESWARA RAO O, RAMACHANDRAIAH C AND VENKATESWARLU P
INSTRUCTION TO AUTHORS.........................................................................................................................................44
July - September 2013 3 Journal of Pharmacy and Chemistry • Vol.7 • Issue.3
nourishes and rejuvenates the body and increases memory,longevity, immunomodulation and adoption. The leaves areuseful in asthma and cough and against ringworms [14].Aqueous extract of the stem demonstrated negative,chronotropic and prolonged hypotensive effect in dogs [15].Aqueous extracts are safely tolerable up to a dose of 3.125g/kg [16].
Previously reported chemical constituents ofLeptadenia reticulata are á-amyrin, â-amyrin, ferulic acid,luteolin, diosmetin, rutin, â-sitosterol, stigmasterol,hentriacontanol [17], a triterpene alcohol simiarenol [18]and api-genin [19]. Pregnane glycosides reticulatin,deniculatin and leptaculatin have also been isolated fromthe aerial parts [20] which on hydrolysis give calogenin,tocopherols. The present investigations includedetermination of physiochemical constants and thephytochemical screening of the different extracts ofLeptadenia reticulata (Retz.) Wight. & Arn.
Materials and MethodsCollection of plant material
The plant material of Leptadenia reticulata (Retz.)
IntroductionLeptadenia reticulata (Retz.) Wight and Arn Synonym:
Cynanchum reticulatum (Retz.) belonging to familyAsclepidaceae is commonly known as Dodi (Hindi, Guj. &Mar.), Jivanti (Sansk.), Palaikkodi (Tamil) [1-5]. It is twiningshrub, distributed in the southern parts of India and growsin sub-himalayan tracts of Punjab, Gujarat, Uttar Pradeshand throughout peninsular India, ascending upto an altitudeof 900m.
The whole plant ameliorates ‘tridoshas’ (Vatta, Pittaand Kapha), and is of great value in general debility,involuntary seminal discharge, as a stimulant and snakebite[6-7], abortifacient, tonic, restorative, bactericidal,antifebrifuge, wound healer and in mouth ulcer [8]. Rootsare used in many ayurvedic and herbal formulations [9] indiseases of the ear and nose, skin infections and generaldebility [10]. The major therapeutic claim is its galactogogueaction, which has been proved in rats, cows [11-12] as wellas humans [13] and to increase the egg laying capacity ofhen in poultry industry. Flowers are good for eyesight. It
ISSN 0973 – 9874
*Address for correspondence
Physicochemical and Phytochemical Evaluation of DifferentExtracts of Leptadenia Reticulata (Retz.)
GIRISH C1, NARSIMHA REDDY Y2, SUBBA REDDY G V3* AND JAYAVEERA K N4
1Department of Pharmacology, S V University, Tirupati, A.P, India.
2Department of Pharmacology, University College of Pharmaceutical Sciences,Kakatiya University, Warangal, A.P, India.
*3Department of Chemistry, JNTUA College of Engineering, Pulivendula,Kadapa. A.P, India. E.Mail: [email protected], Research and development, Adept Pharma andBioscience Excellence Pvt., Ltd, Hyderabad, A.P, India
ABSTRACT
Leptadenia reticulata have different indications in ayurveda and is used for several diseases. Leptadeniareticulata traditionally known as “jivanti”, a jeevana tonic, belongs to family Asclepidaceae. Thepresent study comprises physico-chemical and phytochemical evaluation of different extracts ofLeptadenia reticulata by using standard methods. The physical evaluation was carried out for thedetermination of extractive values, ash values and moisture content. Whereas phytochemical evaluationwas carried out for the presence of carbohydrates, glycosides, flavonoids, tannins, phytosterols andphenolic compounds in different extracts of Leptadenia reticulata. Results revealed the presence ofcarbohydrates, flavonoids, tannins, phytosterols and phenolic compounds. This study will help indetermining the quality and purity of a crude drug and laying down pharmacopoieal standards forLeptadenia reticulata.
Key words: Jivanti, Leptadenia reticulata, Flavonoids, Phytochemical Evaluation.

July - September 2013 4 Journal of Pharmacy and Chemistry • Vol.7 • Issue.3
furnace. The percentage of acid insoluble ash was calculatedwith reference to the shade dried plant powder usingfollowing equation.
Weight of acid insoluble ash% acid insoluble ash value= –––––––––––––––––––––––––– x 100
Weight of the crude drug taken
Determination of water soluble ash
Ash above obtained, was boiled for 5min with 25 mLof distilled water, cooled and the insoluble matter wascollected on an ash less filter paper. Paper was washedwith hot water and ignited for 15min at a temperature notexceeding 450ÚC in a muffle furnace. Difference in weightof ash and weight of water insoluble matter gave the weightof water soluble ash. The percentage of water soluble ashwas calculated with reference to the shade dried plantpowder using formula.
Weight of total ash-Weight of water insoluble ash
% Water soluble ash value = ––––––––––––––––––– x 100 Weight of the crude drug taken
Extractive values [23]
Extractive values of shade-dried powder ofLeptadenia reticulata were determined using followingmethods.
a) Determination of alcohol soluble extractive
An accurately weighed quantity of the shade driedpowder of Leptadenia reticulata (5 g) was maceratedwith 100 mL of alcohol (Ethanol) in a closed flask for 24h, shaking frequently during the first 6 h. It was then allowedto stand for 18 h and filtered rapidly to prevent any lossduring evaporation. Evaporate 25 ml of the filtrate to drynessin a porcelain dish and dried at 105ÚC and weighed. Thepercentage of alcohol (Ethanol) soluble extractive wascalculated with reference to the shade dried plant powder.
b) Determination of water soluble extractive
Weighed quantity of the shade dried powder ofLeptadenia reticulata (5 g) was macerated with 100 mL ofwater in a closed flask, shaking frequently during the first6 hrs and allowed to stand for 18 hrs. Thereafter it wasfiltered taking precaution against loss of water. Evaporate25 mL of filtrate to dryness in a tared flat bottom shallowdish dried at 105°C and weighed. The percentage of watersoluble extractive was calculated with reference to the shadedried plant powder.
c) Determination of petroleum ether soluble extractive
Weighed quantity of the shade dried powder ofLeptadenia reticulata (5 g) was macerated with 100 mLpetroleum ether in a closed flask for 24 h, shaking frequentlyduring the first 6 hrs and allowed to stand for 18 hrs.Thereafter it was filtered rapidly taking precaution against
was collected from Tirumala hills after taxonomicverification and were identified and authenticated inDepartment of Botany, S.V.University, Tirupati. The plantmaterials were coarsely powdered using a rotary grinderand stored in airtight plastic containers. This powder wasused for all phytochemical analysis.
Preparation of extracts
The freshly collected plant material was washed, driedat room temperature for 15-20 days under shade and wastreated with a rotary grinder for size reduction. The finepowder was collected and was used for preparation ofextracts. Dried plant material (100 g) was extracted withSoxhlet apparatus using 400 mL petroleum ether for about48h. After defatting, the marc was dried in hot air oven at50°C, packed in Soxhlet apparatus and further extractedwith 400 mL 95% ethanol until it does not show the presenceof any residue on evaporation. The aqueous extract wasprepared by cold maceration with 3% methanol-water for 7days with occasional shaking. The solvents were removedfrom the extracts under reduced pressure by using rotaryvacuum evaporator.
Physicochemical evaluationsMoisture content
An accurately weighed quantity of the shade driedpowder of Leptadenia reticulata (3 g) was taken in a taredglass bottle and the initial weight was taken. The crudedrug was heated at 105°C in an oven and weighed. Thisprocedure was repeated till a constant weight was obtained.The moisture content of the sample was calculated in thepercentage with reference to shade dried plant powder usingformula [21].
loss in weight of the sample% Moisture content = –––––––––––––––––––––––––x 100
Weight of the sample
Ash values [22]Determination of total ash
An accurately weighed quantity of the shade driedpowder of Leptadenia reticulata (2 g) was incinerated in acrucible at a temperature of 450ÚC in a muffle furnace tillcarbon free ash was obtained. It was then cooled andweighed. The percentage of total ash was calculated withreference to the shade dried plant powder using followingequation.
Weight of total ash% Total ash value = ––––––––––––––––––––––––– x 100
Weight of the crude drug taken
Determination of acid insoluble ashAsh obtained was boiled for 5min with 25 mL of 2
M HCl and filtered using an ash less filter paper. Insolublematter retain on filter paper was washed with hot waterand filter paper was burnt to a constant weight in a muffle
July - September 2013 5 Journal of Pharmacy and Chemistry • Vol.7 • Issue.3
a drop of 7% of copper sulphate was added in the abovesolution. Appearance of violet colour confirms the presenceof proteins.
3. Detection of Glycosides [26]0.5 g of extract was hydrolyzed with 20 mL of dilute
hydrochloric acid (0.1N) and filtered. The filtrate was usedto test the presence of glycosides.
(a) Legal TestOne mL of filtrate, 3 mL of sodium nitropruside in
pyridine and methanolic alkali (KOH) was added in a testtube. A blue colour in the alkaline layer indicates thepresence of glycosides.
(b) Keller-killiani TestOne mL of filtrate was shaken with 1 mL of glacial
acetic acid containing traces of ferric chloride. One mL ofconcentrated sulphuric acid was added carefully by the sideof test tubes. A blue colour in acetic acid layer and redcolour at the junction of the two liquids indicates thepresence of glycosides
(c) Modified Borntrager TestOne mL of filtrate, 2 mL of 1% ferric chloride solution
was added in a test tube and heated for 10 minutes inboiling water bath. The mixture was cooled and shakenwith equal volume of benzene. The benzene layer wasseparated and treated with ammonia solution. Formation ofpink colour in the ammonical layer indicates the presenceof glycosides.
4. Detection of Alkaloids [27]0.5 g. of extract was dissolved in 10 mL of dilute
hydrochloric acid (0.1N) and filtered. The filtrate was usedto test the presence of alkaloids.
(a) Dragendorff’s TestTo the 2 mL of filtrate add 2-3 drops of Dragendorff’s
reagent. Formation of reddish brown colored precipitateindicates the presence of alkaloids.
(b) Hager’s TestTo the 2 mL of filtrate add Hager’s reagent. Formation
of yellow colored precipitate indicates the presence ofalkaloids.
(c) Mayer’s TestTo the 2 mL of filtrate add 2-3 drops of Mayer’s
reagent, formation of cream colored precipitate indicatesthe presence of alkaloids.
(d) Wagner’s TestTo the 1 mL of the extract, add 2 mL of Wagner’s
reagent, formation of reddish brown precipitate indicatesthe presence of alkaloids.
5. Detection of Flavonoids [28]
(a) Shinoda Test
loss of petroleum ether due to its volatility. Evaporate 25mL of filtrate to dryness in a porcelain dish and dried at105°C and weighed. The percentage of petroleum ethersoluble extractive was calculated with reference to the shadedried plant powder.
Phytochemical Evaluation
The freshly prepared petroleum ether, methanolic andaqueous extracts of Leptadenia reticulata were qualitativelyanalyzed for the presence of major phytochemicalconstituents using the standard procedures.
1. Detection of Carbohydrates [24]100 mg of extracts were dissolved in 10 mL of water
and filtered. The filtrate was used to test the presence ofproteins and amino acids.
(a) Molisch’s TestTo the 1mL of filtrate, 2 drops of Molisch’s reagent
was added in a test tube and 2 mL of concentrated sulphuricacid were added carefully down the side of the test tube.Formation of violet color at the interface indicates thepresence of carbohydrates.
(b) Fehling’s TestTo the 1 mL of filtrate, 4 mL of Fehling’s reagent (2
ml Fehling A and 2 ml Fehling B solutions) was added in atest tube and heated for 10 minutes in a water bath.Formation of red precipitate indicates the presence ofreducing sugar.
(c) Barfoed’s Test1 mL of Barfoed’s reagent is heated with 5 drops of
filtrate in a test tube on boiling water bath. Formation of abrick-red precipitate within five minutes indicates thepresence of monosaccharides. Disaccharides generally don’tgive any reaction even for ten minutes
2. Detection of Proteins and Amino acid [25]100 mg of extracts were dissolved in 10 mL of water
and filtered. The filtrate was used to test the presence ofproteins and amino acids.
(a) Millon’s Test
Two mL of filtrate was treated with 2 mL of Millon’sreagent in a test tube and heated in a water bath for 5minutes, cooled and few drops of NaNO2 solution wasadded. Formation of white precipitate, which turns to redupon heating, indicates the presence of proteins and aminoacids.
(b) Ninhydrin TestTo the 2 mL of filtrate, 2-3 drops of Ninhydrin reagent
was added in a test tube and boiled for 2 minutes. Formationof distinct blue colour indicates the presence of amino acids.
(c) Biuret Test2 mL of filtrate was treated with 2 mL of 10% sodium
hydroxide solution in a test tube and heated for 10 minutes,

July - September 2013 6 Journal of Pharmacy and Chemistry • Vol.7 • Issue.3
To the 100 mg of extract, few fragments of magnesiummetal was added in a test tube, followed by drop wiseaddition (3 to 4 drops) of concentrated hydrochloric acid.Formation of magenta colour or light pinkcolour indicatesthe presence of flavonoids.
(b) Alkaline Reagent TestTo the 100 mg of extract, few drops of sodium
hydroxide solution was added in a test tube. Formation ofintense yellow colour that becomes colourless on additionof few drops of dilute hydrochloric acid indicates thepresence of flavonoids.
(c) Fluroscence testTo the 100 mg of extract add 0.3 mL boric acid
solution (3 %w/v) and 1 mL oxalic acid solution (10 %w/v) and evaporated to dryness. The residue was dissolved in10 mL ether; ethereal layer shows greenish fluorescenceunder UV light indicates presence of flavanoids.
6. Detection of Phenolic Compounds and Tannins [29]
100 mg of extract was boiled with 1 mL of distilledwater and filtered. The filtrate was used for the followingtest.
(a) Ferric Chloride TestTo the 2 mL of filtrate in a test tube add 2 mL of 1%
ferric chloride solution. Formation of bluish to black colourindicates the presence of phenolic nucleus.
(b) Lead Acetate TestTo the 2 mL of filtrate, few drops of lead acetate
solution was added in a test tube. Formation of yellowishprecipitate indicates the presence of tannins.
7. Detection of Fats and Oils [30]Oily Spot TestOne drop of extract was placed on filter paper and
solvent was allowed to evaporate. An oily stain on filterpaper indicates the presence of fixed oil.
8. Detection of Saponins [31]Foam TestDilute 1 mL of extract with 20 mL distilled water and
shaken in a graduated cylinder for 15 minutes. 1 cm layerof foam indicates the presence of saponins.
9. Detection of Phytosterols [32]0.5 g of extract was treated with 10 mL of chloroform andfiltered. The filtrate was used to test the presence ofphytosterols and triterpenoids.
(a) Libermann’s TestTo the 2 mL of filtrate in hot alcohol, few drops of
acetic anhydride was added. Formation of brown precipitateindicates the presence of sterols.
(b) Salkowski Test
To the extract solution, few drops of concentrate
sulfuric acid was added, shaken and then allowed to stand,lower layer turns red indicating the presence of sterols.
Statistical Analysis
The values are represented as mean ± S.D. (n=3) andresults were analyzed using ANOVA, followed by Dunnett’stest where P<0.05 was considered statistically significant.
Results and DiscussionLeptadenia reticulata was subjected to systematic
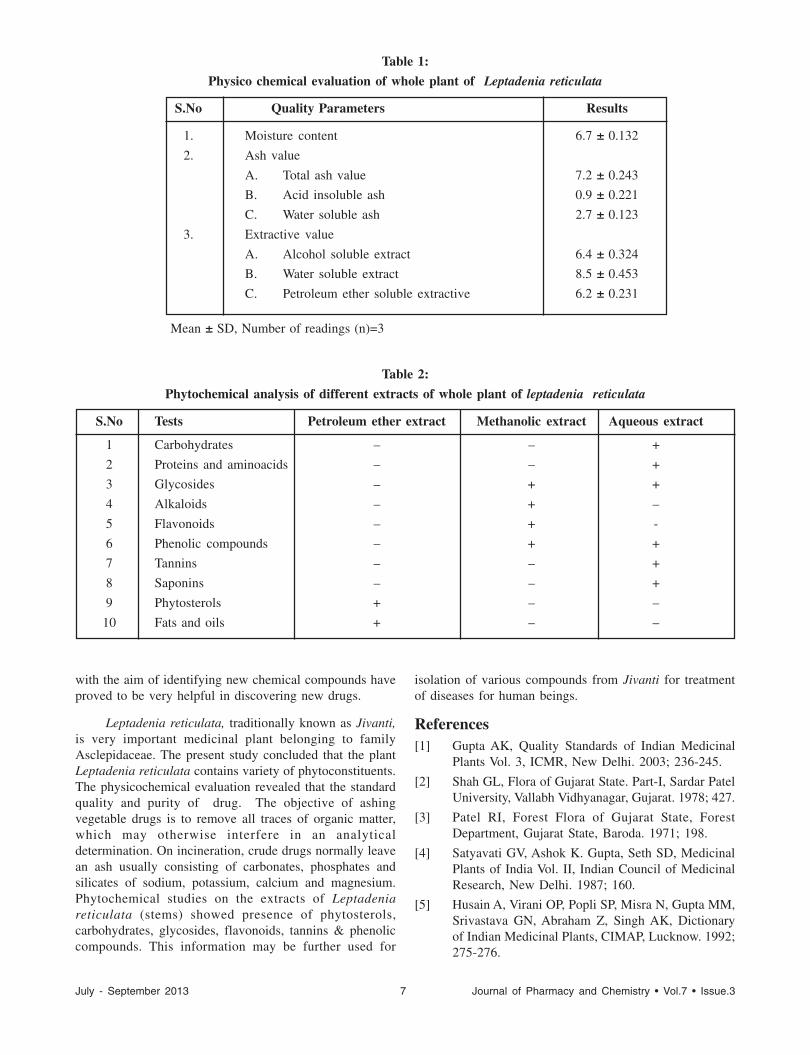
physicochemical and phytochemical screening bysuccessively extracting with various organic solvents ofincreasing polarity to determine the amount of solubleconstituents in a given amount of plant material. The datagenerated is helpful in determining the quality and purityof a crude drug, especially in the powdered form. In thisstudy the parameters used for the evaluation of Leptadeniareticulata were moisture content, extractive values bydifferent solvents (includes petroleum ether, methanol andwater), ash values (total ash, water soluble and acidinsoluble ash) (Table 1). The objective of reducing thevegetable drug to its ash is to remove all traces of organicmatter, which may otherwise interfere in an analyticaldetermination. On incineration, crude drugs leave an ashusually consisting of carbonates, phosphates and silicatesof sodium, potassium, calcium and magnesium. Thedetermination of ash is useful for detecting low-gradeproducts, exhausted drugs and excess of sandy or earthymatter which is more especially applicable to powdereddrugs.
Phytochemical analysis was performed on thepetroleum ether, methanol and aqueous extracts ofLeptadenia reticulata. Petroleum ether extract was foundto contain phytosterols, fats and oils. Methanolic extractcontains flavonoids, phenolic compounds, alkaloids andglycosides. Aqueous extract contains glycosides, proteinsand amino acids, carbohydrates, phenolic compounds,tannins and saponins (Table 2).
ConclusionIn this project, it was planned to present work on
Ayurvedic plant drug as an effort to highlight the potentialof these plants as a valuable resource of biologically activemolecules. Herbal remedies have been common place invarious cultures throughout recorded history, and still serveas the main means of therapeutic medical treatment. Therecent years have witnessed a resurgence of interest innatural medicines world over as people are turning to usemedicinal plants and phyto-chemicals in health care. Indiahas one of the oldest cultural traditions of use of itsmedicinal flora since Vedic period. Ayurveda, Unani, Siddhaand other traditional systems of medicine are one of theoldest systems and utilize large number of medicinal plants.In contrast, other approaches such as phytochemicalscreening massive biological screening of randomlycollected plants and phytochemical examination of plants
July - September 2013 7 Journal of Pharmacy and Chemistry • Vol.7 • Issue.3
isolation of various compounds from Jivanti for treatmentof diseases for human beings.
References[1] Gupta AK, Quality Standards of Indian Medicinal
Plants Vol. 3, ICMR, New Delhi. 2003; 236-245.
[2] Shah GL, Flora of Gujarat State. Part-I, Sardar PatelUniversity, Vallabh Vidhyanagar, Gujarat. 1978; 427.
[3] Patel RI, Forest Flora of Gujarat State, ForestDepartment, Gujarat State, Baroda. 1971; 198.
[4] Satyavati GV, Ashok K. Gupta, Seth SD, MedicinalPlants of India Vol. II, Indian Council of MedicinalResearch, New Delhi. 1987; 160.
[5] Husain A, Virani OP, Popli SP, Misra N, Gupta MM,Srivastava GN, Abraham Z, Singh AK, Dictionaryof Indian Medicinal Plants, CIMAP, Lucknow. 1992;275-276.
Table 1:
Physico chemical evaluation of whole plant of Leptadenia reticulata
S.No Quality Parameters Results
1. Moisture content 6.7 ± 0.132
2. Ash value
A. Total ash value 7.2 ± 0.243
B. Acid insoluble ash 0.9 ± 0.221
C. Water soluble ash 2.7 ± 0.123
3. Extractive value
A. Alcohol soluble extract 6.4 ± 0.324
B. Water soluble extract 8.5 ± 0.453
C. Petroleum ether soluble extractive 6.2 ± 0.231
Mean ± SD, Number of readings (n)=3
Table 2:
Phytochemical analysis of different extracts of whole plant of leptadenia reticulata
S.No Tests Petroleum ether extract Methanolic extract Aqueous extract
1 Carbohydrates – – +
2 Proteins and aminoacids – – +
3 Glycosides – + +
4 Alkaloids – + –
5 Flavonoids – + -
6 Phenolic compounds – + +
7 Tannins – – +
8 Saponins – – +
9 Phytosterols + – –
10 Fats and oils + – –
with the aim of identifying new chemical compounds haveproved to be very helpful in discovering new drugs.
Leptadenia reticulata, traditionally known as Jivanti,is very important medicinal plant belonging to familyAsclepidaceae. The present study concluded that the plantLeptadenia reticulata contains variety of phytoconstituents.The physicochemical evaluation revealed that the standardquality and purity of drug. The objective of ashingvegetable drugs is to remove all traces of organic matter,which may otherwise interfere in an analyticaldetermination. On incineration, crude drugs normally leavean ash usually consisting of carbonates, phosphates andsilicates of sodium, potassium, calcium and magnesium.Phytochemical studies on the extracts of Leptadeniareticulata (stems) showed presence of phytosterols,carbohydrates, glycosides, flavonoids, tannins & phenoliccompounds. This information may be further used for

July - September 2013 8 Journal of Pharmacy and Chemistry • Vol.7 • Issue.3
�
[6] Dandiya PC, Chopra YM. 1970. CNS-active drugsfrom plants indigenous to India. Indian J.Pharm.,2:67–90.
[7] Bhatt T, Jain V, Jayathirtha MG, Banerjee G, MishraSH. 2006. In vitro regeneration of roots of Phylanodiflora and Leptadenia reticulata, and comparisonof roots from cultured and natural plants forsecondary metabolites. Indian J. Exp. Biol., 40:1382–1386.
[8] Vaidya BG, Nighantu A. 1965. Shri Swami AtmanandSaraswati Ayurved Sahakari Pharmacy Ltd, Surat,2: p.1106.
[9] Anon. 1978. Ayurvedic Formulary of India, Govt ofIndia Press, Faridabad, 1978, Part-I, 1st edn, p. 30.
[10] Kirtikar KR, Basu BD. 1998. Indian MedicinalPlants, Bishen Singh Mahendra Pal Singh, Dehradun,2nd Edn, 7:2246–2247.
[11] Anjaria, JV, Gupta I. 1967. Studies on lactogenicproperty of Leptadenia reticulata (Jivanti) andleptaden tablets in goats, sheep, cows and buffaloes.Indian Vet. J., 44: 967–974.
[12] Anjaria JV, Varia MR, Janakiraman K, Gulati OD.1975. Studies on Leptadenia reticulata: Lactogeniceffects on rats. Indian J. Exp. Biol., 13:448–449.
[13] Patel RP, Dantwala AS. Antimicrobial activity ofLepta-denia reticulata. Indian J Pharm ; 1958, 20:241-244.
[14] Raj KPS, Patel MR, Some Medicinal Plants ofCambay and its Immediate Vicinity and their Usesin the Indigenous System of Medicine, Indian Drugs,1978; 15: 145
[15] Agarwal SL, Deshmankar BS, Verma SCL, SaxenaSP. Studies on Leptadenia reticulata. Part I.Pharmacol-ogical actions of aqueous extract. IndianJ Med Res; 1960, 48: 457-464.
[16] Anjaria JV, Gupta I. Preliminary observations ontoxic effects of Leptadenia reticulata (Jivanti) andlepta-den tablets. GUJVET; 1970, 4:16.
[17] Krishna PVG, Venkata Rao E, Venkata Rao D.Crystalline principles from the leaves and twigs ofLeptadenia reticulata. Planta Med; 1975, 27: 395-400.
[18] Subramanian PS, Lakshmanan AJ. On theconstituents of Leptadenia reticulata Wight and Arn:Occurrence of simiarenol. Indian J Chem; 1977, 15B:180.
[19] Sastry BS, Vijayalakshmi T, Venkata R E. Chemicalcon-stituents of the stem bark of Leptadeniareticulata. Indian drugs; 1985, 22: 611-612.
[20] Srivastav S, Deepak D, Khare A. Three novelpregnane glycosides from Leptadenia reticulataWight and Arn. Tetrahedron; 1994, 50: 789-798.
[21] Khandelwal KR. Practical pharmacognosy, NiraliPublications Pune, 1995; 1: 140- 143.
[22] World Health Organization. Quality control methodsfor medicinal plant materials. Geneva 1998; 28-29.
[23] Anonymous, WHO guidelines, 1st Edition, AITBSPublishers and Distributors: NewDelhi. 2002; pp28,30, 41, 46.
[24] Rosenthaler L. The chemical investigations of plants,G. Bellsand Son Ltd, London 1930; 23, 27, 119,155.
[25] Finar IJ. Organic Chemistry, The english languagebook society and longmann green Co. Ltd. London1973; 5: 342, 363, 656.
[26] Sim SK. Medicinal plant glycosides, University ofToronto Press. 1968; 2: 25.
[27] Peach K, Tracy MV. Modern methods of plantanalysis, Springer Verlag, Berlin 1955; 1 (4): 367-374.
[28] Harbourne JB. Phytochemical analysis, Chapman andHall company Ltd, London 1973; 1: 5-6.
[29] Kar Ashutosh. Pharmacognosy andPharmabiotechnology. New age publishers &distributors New Delhi.2004; 2: 147.
[30] Trease GE, Evans WC. Pharmacognosy BalliereTindall Press, London 1983; 56- 57.
[31] Kokate CK, Purohit AP, Gokhale SB, Practicalpharmacognosy, Nirali Prakashan, Pune, 1994; 2:54-60.
[32] Wallis TE. Textbook of pharmacognosy, CBSPublishers & Distributors, New Delhi 1985; 5: 56-57.

July - September 2013 9 Journal of Pharmacy and Chemistry • Vol.7 • Issue.3
*Address for correspondence:[email protected]:+91-9490419750; Fax:+91-8578-231450
IntroductionNickel is an element, which has high industrial
importance, due to its high strength and resistance tocorrosion in many media. Nickel is used in ceramic industry,and also used in batteries. An important use of nickel infood industry is as a catalyst in the hydrogenation of oils.It used in Nickel plating and also in the manufacture ofalloys Nickel can be released into the atmosphere fromseveral industrial processes, including oil and coal burningpower plants, trash incinerators, and metallurgy industry.Moreover, Nickel can enter into aquatic body fromdissolution of oxide and sulphide rocks containing nickelcombined with other elements. The excellent chromophoricproperties of nickel (II) enable it by giving coloruredproducts with many organic reagents.. The highconcentration of the nickel does show serious health hazards.The high incident of respiratory track moplacia and
dermatitis has been observed when exposed by nickelrefineries. In views of this separation and determination ofnickel from associated elements is indispensable. Thus, theexposition of nickel may take place by air, food samples,drinking water and mainly by skin contact withcontaminated soils and alloys containing nickel1. Anothercommon disease caused by skin disorder is known as nickel-eczema. This disease is more pronounced in workers dailyexposed to great amounts of nickel and in those peoplewho are sensitive to nickel2.
For the determination of nickel in trace amount levels,there are several frequently adopted methods usinganalytical techniques, such as AAS, ICP-AES, ICP-MS, X-ray fluorescence spectroscopy, spectrophotometry,spectrofluorometry and so on. Among these, thespectrophotometric method is preferred because it is cheaperand easy to handle, with comparable sensitivity andaccuracy, besides having good precision.
There are many organic complexing reagents [3-7],which can be used for the spectrophoto-metric determination
ISSN 0973 – 9874
A New Analytical Reagent 2, 6-Diacetylpyridine Bis(4-phenyl- 3-thiosemicarbazone) for the Determination of Ni(II) in Medicinal
leaves and Soil Samples
RAMACHANDRAIAH C1*, ADINARAYANA REDDY S2, SREEDEVI P3, AND VARADA REDDY A3
*1Department of Chemistry,Srikalahastheeswara Institute of Technology,(SKIT) Srikalahasti - 517 640, A.P, India.2Department of Material Science and Nano Technology, Yogi Vemana University, Kadapa, 516 003, A.P, India.
3Department of Chemistry, Sri Venkateswara University, Tirupati-517 502, A. P, India
ABSTRACT
A new synthesized reagent 2, 6-diacetylpyridine bis(4-phenyl-3-thiosemicarbazone) [2, 6-DAPBPTSC]is proposed as a sensitive and selective analytical reagent for the extractive spectrophotometricdetermination of Nickel(II). It forms a yellow colored complex with 2, 6-DAPBPTSC at pH 4.0which was extracted into isoamylalcohol, under optimum conditions. The maximum absorption ofthe complex extracted was measured at 400 nm. The Beers law was obeyed in the range of 0.58 to5.87 ppm. The molar absorptivity and Sandells sensitivity of complex were calculated as 1.44 x10⁴
L
mol-1 cm-1 and 4.076 x10⁻³ µgcm-2, respectively. The instability constant of complex was calculatedfrom Asmus method is 6.441x10⁻⁵. The precision and accuracy of method was checked with calculationof relative standard deviation (n= 5) was 0.256 and the detection limit value was 0.0053 µgml-1. Themethod was successfully employed for the determination of Ni (II) in medicinal leaves and soilsamples. The validity of the method was tested by comparing the results with those obtained usingan atomic absorption spectrophotometer.
Keywords: Nickel(II), 2, 6-diacetylpyridine bis(4-phenyl-3-thiosemicarbazone) [2,6-DAPBPTSC],medicinal leaves and soil samples.

July - September 2013 10 Journal of Pharmacy and Chemistry • Vol.7 • Issue.3
of nickel, yet these suffer from disadvantages such as lowsensitivity, incomplete extraction and interference from alarge number of foreign ions (Table 1).
A survey of literature reveals that only a fewphenylthiosemicarbazones are employed for extractivespectrophotometric determination of Ni(II). Hence, theauthors have introduced a new sensitive reagent 2,6-diacetylpyridine bis(4-phenyl-3-thiosemicarbazone) (2,6-DAPBPTSC) for the extractive determination of traceamounts of Ni(II). The proposed method, when comparedwith other spectrophotometric methods, is more sensitiveand selective. It also offers advantages like reliability andreproducibility in addition to its simplicity, instant colordevelopment and less interference. The results obtainedthrough UV–Vis spectrophotometer have been comparedwith those obtained through the atomic absorptionspectrometer.
ApparatusA Shimadzu (UV-2450 model) UV–vis
spectrophotometer with 1.0 cm quartz cell has been usedfor absorbance measurements. An Elico (model Li-10 India)pH-meter has been used for pH adjustments. A Hitachimodel 170-30 atomic absorption spectrophotometer wasused for comparison of results.
ReagentsAll of the chemicals used are of analytical grade;
quartz processed high-purity water has been used throughoutthe experiment.
Synthesis of 2,6-diacetylpyridine bis(4-phenyl-3-thiosemicarbazone) (2,6-DAPBPTSC)
2,6-diacetylpyridine bis-4-phenyl-3-thiosemicarbazone(2,6-DAPBPTSC) is prepared as per the procedure: 1.60 gof 2,6-diacetylpyridine is dissolved in 30 mL of absoluteethanol and mixed in a round-bottomed flask with 2.20 gof 4-phenyl-3-thiosemicarbazide dissolved in 30 mL ethanol.The mixture was heated under reflux for 3 h and thenallowed to cool to room temperature and kept for 12 h. Thecrystals obtained are filtered and washed with cold ethanoland then recrystalized from ethanol. The melting point was152°C. 2,6-DAPBPTSC dissolves in N, N-dimethylformamide (DMF), acetone and dimethyl
sulphoxide. The characterization of 2,6-DAPBPTSC wascarried out by IR and 1H NMR spectroscopy. The IRspectrum of 2,6- DAPBPTSC shows absorption bandsaround 1,485 cme1(C=S), 1,540 cme1 (C=N), and 3,300cme1 (eNH). The 1H NMR (DMSO, ppm) 9.85 (eNH), 2.6(eCH3), and 7.2–7.8 (pH).
Preparation of standard solution of nickel (II).
A total of 6.73 g of ammonium nickel sulfatehexahydrate [(NH
4)
2Ni(SO
4)
26H
2O)] was weighed,
dissolved in double-distilled water containing a few dropsof concentrated sulfuric acid and made up to 1L. The Stocksolution was then standardized gravimetrically usingdimethylglyoxime (Vogel, 1961). The required dilutesolution of nickel (II) was prepared by diluting the stocksolution with double-distilled water. All reagents used wereof analytical reagent grade unless otherwise stated.
Buffer solutions
A total of 1.0 mol L-1 sodium acetate and 1.0 mol L-1
acetic acid solutions were prepared in double-distilled water.Suitable portions of these solutions were mixed to get thedesired pH.
Collection of medicinal leaves, soil samples preparationof solutions and analytical procedure
The environmental matrices (soil and medicinalleaves) to be analyzed were collected in and around Tirupati,Andhra Pradesh, South India. The dried sample waspulverized in a mortar for the purpose of analysis, to aconvenient size. An aliquot of 500 mg of soil/100 mL ofmedicinal leaves was digested with 5mL of HNO
3 (65%)
in a teflon vessel.
Analytical procedure for standard alloy samples
A total of 0.1 g of each oven-dried (110 0C) alloysample was dissolved in 15 mL of aqua regia. The solutionwas heated to near dryness and nitrate was expelled fromthe residue, using 5 mL of concentrated hydrochloric acid.Each residue was extracted into double-distilled water,separately, and made up to 100 mL. The sample wasdigested for 3 h at 80 0C, and again digested at 160 0C for45 min. After treating with double-distilled water thesupernatant liquid was made up to the mark in a 25mLstandard flask.
NC H
3
OO
CH3
NC H
3
NN
CH3
NH
NH
C6H
5
N H
N H
C6H
5
S S
+ 2 C6H
5N H C SN H N H
2
E t O H
2,6-diacetylpyridine 4-phenylthiosemicarbazide 2,6-diacetylpyridine bis-4-phenylthiosemicarbazone

July - September 2013 11 Journal of Pharmacy and Chemistry • Vol.7 • Issue.3
Effect of pH on the extraction of Ni(II)–2,6-DAPBPTSCcomplex
To arrive the optimum pH required for maximum colordevelopment, the influence of pH on the color intensitywas studied by using differs in pH range from 1.0-6.5 (Fig.2). The absorbance of the Ni(II)-2,6-DAPBPTSC complexincreases as the pH increases from 1.0-3.0 and remainsconstant in the pH range 3.5-4.5. However, it has decreasedbeyond 4.5. Hence, pH 4.0 is chosen for further studies,considering this as an optimum pH.
Fig.2 : Effect of PH on the extraction of Ni(II)- 2,6-DAPBPTSCComplex
Effect of reagent concentration on the absorbance ofNi(II)-2,6-DAPBPTSC complex
The effect of reagent concentration on the formationof the Ni(II)-2,6-DAPBPTSC complex has been studied bykeeping the constant concentration of metal ion solution(1.0
× 10-4 mol L-1) with different reagent solution
concentration ranging from 1.0 × 10⁻⁴ to 15.0 × 10⁻⁴ mol L-
1 in order to get the maximum color formation. The coloredsolutions were collected into 25.0 mL standard flasks andmade up to the mark isoamylalcohol. The absorbances ofthe organic phases were measured at 400 nm against theircorresponding reagent blank. It is clearly observed fromthe absorbance values that a maximum thirteen-fold molarexcess of the reagent is sufficient to get a maximum colorformation of the complex.
Effect of solvents on the extraction of Ni(II)–2,6-DAPBPTSC complex
The extraction of Ni(II)-2,6-DAPBPTSC complex intovarious organic solvents are studied, such as chlorobenzene,benzene, carbon tetrachloride, n-butanol, methylisobutylketone, cyclohexanol, n-amylalcohol, isoamylalcohol,chloroform, cyclohexane and 1-propyl acetate. Among allthe solvents tested, isoamylalcohol was found to be themost effective extracting complex. Hence, isoamylalcoholis chosen as a suitable solvent for further investigations.
Effect of salting-out agents on the extraction of Ni(II)-2,6-DAPBPTSC complex
Various salting-out agents, such as magnesium sulfate,magnesium nitrate, lithium acetate, lithium sulfate, lithium
General ProcedureTo an aliquot of a working standard solution
containing 1.0 × 10⁻⁴ to 15.0 × 10⁻⁴ mol L”1 nickel(II) isadded pH 4.0 buffer (2.0 mL), reagent solution (1.0 mL of1.5× 10"3 mol L”1) and a salting-out agent 0.1 mol L”1
magnesium sulfate (1.0 mL). The mixture is shaken withisoamylalcohol (10.0 mL) portions twice each time for 2min and allowed to stand for a few minutes. The organicphases are collected and made up to 25 mL withisoamylalcohol, while its absorbance is measured at 400nm, against the reagent blank.
Results and Discussion2,6-diacetylpyridine-bis-4-phenyl-3-thiosemicarbazone
(2,6-DAPBPTSC) forms a 1:1 (M/L) yellow coloredcomplex with nickel(II), which is extracted intoisoamylalcohol, from sodium acetate -acetic acid (pH 4.0)buffer. The yellow colored Ni(II)–2,6-DAPBPTSC complexhas a maximum absorbance at 400 nm and is stable for 48h. The conditions for effective extraction are establishedafter studying the influence of various factors, such as pH,choice of the solvent, reagent concentration, salting-outagent, and influence of diverse ions, in order to develop aselective and sensitive extractive spectrophotometric methodfor the determination of nickel(II) in trace level.
Absorption spectra of the reagent and Ni (II)–2,6-DAPBPTSC complex
The absorption spectrum of Ni(II)-2,6-DAPBPTSCcomplex was recorded against the reagent blank. Similarlythe absorption spectrum of the reagent (2,6-DAPBPTSC)was recorded against the solvent blank. The absorptionspectra of both the complex and reagent are shown in Fig.1. The obtained spectra reveal that the Ni(II)-2,6-DAPBPTSC complex and the reagent have shown maximumabsorbance at 400 nm and 360 nm, respectively. The reagenthas minimum absorbance at the maximum absorbance ofthe complex and hence the reagent does not interfere withthe determination of nickel(II). Therefore, further all thespectral measurements of the complex have been carriedout at 400 nm.
Fig.1 : A. Absorption spectrum of 2,6-DAPBPTSC Vs isoamylalcohol blank.B. Absorption spectrum of Ni(II)-2,6-DAPBTSC complexVs 2,6-DAPBPTSC blank

July - September 2013 12 Journal of Pharmacy and Chemistry • Vol.7 • Issue.3
nitrate and ammonium sulfate were employed to enhancethe metal complex extraction into organic solvent in a singlestep. After the studies, it was observed that the presence of0.1 mol/l magnesium nitrate solution enhanced theextraction. The presence of nickel (II) in the aqueous phaseafter extraction was tested gravimetrically by usingdimethylglyoxime. It was found that with magnesium nitrateas a salting-out agent, the complex was extractedquantitatively into isoamylalcohol.
Validity of Beer’s law, molar absorptivity, Sandell’ssensitivity and correlation coefficient for Ni(II)-2,6-DAPBPTSC complex
The Ni(II)-2,6-DAPBPTSC complex followed Beer’slaw in the range of 0.587 to 5.87 ppm (Fig. 3). The molarabsorptivity of the complex was calculated to be 1.44 ×10⁴
L mol-1 cm-1 and Sandell’s sensitivity of complex obtainedfrom Beer’s law data for absorbance 0.001, was found tobe 0.0040 µg cm-2. The correlation coefficient value of theNi(II)-2,6-DAPBPTSC complex, with an independentvariable as concentration in µg mL-1 and dependable variableas absorbance, was found to be 0.972. This indicates thelinearity between the two variables.
Fig. 3: Applicability of Beer’s Law for Ni(II)-2,6-DAPBPTSCComplex
Ringbom plot for Ni(II)–2,6-DAPBPTSC complex
Ringbom’s plot is the standard adopted to know theoptimum range of the concentration for a system, whichobeys Beer’s law. A Ringbom’s plot was drawn betweenlogC of nickel(II) and (1-T), where ‘T’ is the transmittance,shown Fig. 4. The plot has a sigmoid shape with linearityat intermediate concentration values of from 2.95 to 3.65ppm, which indicates that nickel(II) is precisely determinedin the optimum concentration range 2.95 to 3.65 ppm. Theslope of the Ringbom’s plot is 0.74. Based on this value,the ratio between the relative error in concentration andphotometric error is 3.112. For a photometric error of onepercent, ΔP=0.001. Hence, the relative error in concentrationis 0.03112.
Fig. 4 :Ringbom’s plot for Ni(II)-2,6-DAPBPTSC Complex
Precision and accuracy
To assess the precision and accuracy of the method,estimations were carried out for a set of five determinations,with different concentrations of nickel(II), under optimumconditions. The obtained results reveal that the standarddeviation of method was not more than 0.00158 and relativestandard deviation was less than 0.256%. It is evident fromthese results that this method is precise, besides beingaccurate. The detection limit was determined as the amountof nickel(II) corresponding to thrice the standard deviationblank value, 0.00536 µg mL-1 was obtained.
Determination of the composition of Ni(II)-2,6-DAPBPTSCcomplex
The composition of the Ni(II)-2,6-DAPBPTSCcomplex was determined by the job’s method. Theabsorbance of Ni(II)-2,6-DAPBPTSC complex wasmeasured at equimolar solutions of Ni(II) and 2,6-DAPBPTSC were used to determine the metal to ligandratio by job’s method of continuous variation. The plot(Fig. 5) was drawn between the absorbance and V
M/V
M+V
L,
where VL and V
M are the volumes of the reagent and metal,
respectively. The obtained curve indicates that the metal toligand ratio of the extracted complex is 1:1. This wasverified by slope ratio, molar ratio and Asmus’methods.The results were discovered to be in good agreement withthe job’s method.
Molar Ratio Method
Different aliquots of mixtures containing 1.0 ml of1.0 x 10-3 M nickel (II) and 2.0 ml of Sodium Acetate –Acetic acid Buffer (pH 4.0) are prepared. To each of thesesolutions varying concentration of the 2,6-DAPBPTSCsolution (0.2 x 10⁻³ M – 2.0 x 10⁻³ M) were added and finalvolumes made upto 10 ml with distilled water. Each ofthese mixtures were shaken with 10.0 ml of isoamylalcoholfor 2 minutes and allowed to settle. The organic phases

July - September 2013 13 Journal of Pharmacy and Chemistry • Vol.7 • Issue.3
were collected in different 25 ml standard flasks and madeupto the mark with isoamylalcohol. The absorbences of theorganic phases obtained were recorded at 400 nm, againsttheir corresponding reagent blanks. A plot drawn betweenthe absorbance and number of moles of the ligand per moleof the metal ion is shown in Fig. 6.
Determination of instability constant Ni(II)-2, 6-DAPBPTSC complex
The instability constant of Ni(II)-2,6-DAPBPTSCcomplex was calculated using Asmus’method. Theabsorbance values of the extract were obtained at 400 nmafter shaking the solutions containing fixed volumes of 1.0× 10⁻³ mol L-1 nickel(II), buffer (pH, 4.0) and differentknown volumes (0.25-2.02 mL of 1.0 × 10⁻³ mol L-1) of the2,6-DAPBPTSC solution with isoamylalcohol. Theinstability constant of nickel(II)-2,6-DAPBPTSC solutionwas calculated and found to be 1.44 × 10⁻⁴, at roomtemperature by Asmus’method.
Effect of foreign ions on the extraction of Ni (II)-2, 6-DAPBPTSC complex
The tolerance limit means that the limit which theforeign ion cannot be interfere for the determination ofNi(II). In order to assess the possible analytical applicationsof this developed method, the effect of some foreign ionsare also examined, by carrying out determinations of 75.0μg of nickel(II) with a known amount of the ion in question,using the recommended general procedure. The criterionfor interference is a variation of more than ± 2 percent inabsorbance from the expected value for nickel(II) alone(Table 1). In respect of some interfering ions, an increasedtolerance limit is achieved by the addition of maskingagents, such as thiosulfate, fluoride, tartrate or thiocyanate.Increasing the amount of masking agents proportionatelycould mask higher amount of interfering ions. In this study,cations like As(III), As(V), Mg(II), Mn(II), Zr(IV), Sb(III),Ca(II), Sr(II), Ba(II), and Tl(III) do not interfere, whenpresent up to 5500 μg and cations like Bi(III), Hg(II), Be(II),Th(VI), U(VI), Al(III), and V(V) are tolerated up to 3000μg, but Co(II), Cu(II), Zn(II), Fe(III), Mo(VI) and Pd(II)do interfere with the determination of nickel(II) whenpresent in more than 2000 μg. The interference of Cu(II)can be eliminated by using 1.0 mL 0.2% oxalate as amasking agent. Fe(II) & Fe(III) are masked with 1.0 mL of3.0% of sodium fluoride. The interference of Zn(II), Co(II)can be eliminated by using 1.0 mL of 0.5% of citratesolution. Anions like fluroride, thiocyanate, thiosulfate andthiourea do not interfere when present up to 3000 μg, withthe determination of Ni(II) in the present developed method.Increasing masking agents proportionately can mask higheramounts of interfering ions.
Applications of the developed methodThe developed extractive spectrophotometric method
for nickel(II) has been successfully applied for itsdetermination in medicinal leaves, soil and standard alloysamples.
Determination of Nickel (II) in soil samples
Soil samples were collected from in around Tirupati,AP, India. Each aliquot was analyzed for nickel (II) by thegeneral procedure which was given in the experimentalsection, using 2, 6 – DAPTSC and the results obtainedwere checked by atomic absorption spectrometry (Table 2)
Determination of Nickel (II) in medicinal leaves
Medicinal leaves were collected from in and aroundTirupati, AP, India. An appropriate amount of aliquot ofeach solution was analyzed for Nickel (II) by therecommended procedure given in the experimental section,using 2, 6 – DAPTSC and the results obtained were checkedby atomic absorption spectrometry (Table 3)
Fig.5 : Job’s method of continuous variation Ni(II)-2,6-DAPBPTSC Complex

July - September 2013 14 Journal of Pharmacy and Chemistry • Vol.7 • Issue.3
Table - 1
Effect of Foreign Ions on the extraction of Ni(II)- 2,6-DAPBPTSC complex
Foreign Ion Tolerance Limit, μμμμμg/ml Foreign Ion Tolerance Limit, μμμμμg/ml
As(III) 5500 V(V) 3000
As(V) 5500 Zn(II) 2000
Mn(II) 5500 Fe(III) 2000
Mg(II) 5500 Cu(II) 2000
Ca(II) 5500 Co(II) 2000
Sb(III) 5500 Thiocyanate 3000
Sr(II) 5500 Thiosulfate 3000
Ba(II) 5500 Thiourea 3000
Zr(IV) 5500 Fluoride 3000
Tl(III) 5500 Citrate 1500
Hg(II) 3000 Borate 1500
Bi(III) 3000
Be(II) 3000
Th(VI) 3000
U(VI) 3000
Al(III) 3000
Table 2
Determination of Nickel (II) in some Soil Samples
Name of the area in Ni(II)a found μμμμμg, g-1Standard Relative Standard
Tirupati Deviation Deviation%AAS Method Proposed method
Tiruchanur 24.5 23.9 0.230 0.962
Thondavada 20.10 19.97 0.170 0.855
Chandragiri 20.89 19.92 0.105 0.527
Renigunta 22.90 21.8 0.541 0.484
S.V. Nagar 22.50 21.95 0.003 0.015
a = average of four determinations
Table 3
Determination of Nickel (II) in medicinal leaves samples
Medicinal LeavesNi(II)a found μμμμμg g-1
Standard Relative standardDeviation Deviation%
AAS Method Proposed method
Yerrajuvvi(Ficus microcarpa. L) 0.250 0.249 0.0010 0.401
Ramapala(Kalanchoe lanceolata) 0.348 0.349 0.0014 0.404
Mullagorinta(Barleria Prionitis. L) 0.401 0.402 0.0093 2.318
Gorinta(Lawsonia inermis. L) 0.211 0.212 0.0081 3.876
Jilledu(Calotropis gigantean. L) 0.278 0.279 0.0012 0.462
Ummetta(Datura stramonium. L) 0.621 0.620 0.0081 1.514
Kalabanda(Aloe vera. L) 0.539 0.540 0.0012 0.462a = average of four determinations

July - September 2013 15 Journal of Pharmacy and Chemistry • Vol.7 • Issue.3
ConclusionsIt is noted from literature that many thio- and
phenylthiosemicarbazones are used in the extractivespectrophotometric determination of nickel(II). In thepresent investigation, the authors introduced a new reagent,2,6-DAPBPTSC to the field of extractive spectrophotometricdetermination of nickel(II). The reagent was found to besensitive when compared to earlier reported reagents. Theselectivity of the reagent was further improved by the useof proper masking agents to suppress the interference ofdiverse metal ions like Pd(II), Mo(IV), Co(II), Cd(II) andCu(II). The results from the present developed methodclearly demonstrate the usefulness 2,6-DAPBPTSC as anextracting agent for the determination of nickel(II) in soiland medicinal leaves samples.
References1. Merian, E., Anke, M., Ihnat, M. and Stoeppler, M,
Elements and Their Compounds in the Environment,2nd ed., John Wiley, 2004.
2. Kristiansen, J., Christensen, J.M., Henriksen, T.,Nielsen, and N.H., Menne, T., Anal. Chim. Acta, 403,265, 2000.
3. Reddy, K.H. and Reddy, D.V., Indian J. Chem., 22,824, 1983.
4. Salim, R., Laila, A.H. and Quamhieh, A., Sepctrosc.Lett., 21, 541, 1988.
5. Martinez, M.P., Valcarcel, M. and Pino, F., Anal. Chim.Acta, 81, 157, 1976.
6. Bautista, R. and Pavon, J.M.C., Talanta, 27, 923, 1980.
7. Sharma, L.S., Kumar, J.R., Reddy, K.J., Thriveni, T.and Reddy, A.V., J. Trace elem.Med. Biol., 22, 285,2008.
�
Comparison of the present method with other reported extractive spectrophotometric methodsfor the determination of Nickel (II) (Table 4.)
Reagent pH λλλλλmax/ ∈∈∈∈∈max, × M:L Beer’s law range References
nm 104/////Lmol-1cm-1 law μμμμμg. mL-1
1,3-Cyclohexanedione 8.5-10.0 430 2.5 1:3 0.23-1.88 3dithiosemicarbazone-monohydrochloride
5,5’Dimethyl-1,2,3-cyclo 9.0 383 - - Up to 9.2 4hexanetrione-1,2dioxime-3-thiosemicarbazone
Di-2-pyridyl ketone 6.0-6.9 395 1.96 1:2 0.5-2.5 5thiosemicarbazone
2-(3-Sulphobenzoyl) 6.0-10.0 400 2.0 1:2 - 6pyridinethiosemicarba-zone
Pyridoxal-4-phenyl- 4.0-6.0 430 1.92 1:1 0.5-5.0 73-thio-semicarbazone
2,6-diacetylpyridine 4.5 400 1.44 1:1 0.587 to 5.87 Presentbis-4-phenyl-3-thiosemi- methodcarbazone

July - September 2013 16 Journal of Pharmacy and Chemistry • Vol.7 • Issue.3
survived from a wide spectrum of environmental stressessuch as heat and cold shock, drought, salinity, nitrogenstarvation, photooxidation, anaerobiosis, osmotic andultraviolet radiation. Cyanobacteria are cosmopolitan indistribution and the colonization of oceans, lakes, rivers,hot springs and soils, and their presence as symbioticorganisms in fungi and plants demand high variability inadapting to diverse environmental factors [2].Cyanobacterial populations hold an important place in bothaquatic as well as terrestrial ecosystems, as the majorbiomass producer. Their inherent capacity to fix atmosphericN
2 with the help of the enzyme nitrogenise makes them
potent natural biofertilizers [4]. They occupy a centralposition in the nutrient cycling and are valuable sources ofvarious natural products of medicinal, pharmaceutical andindustrial importance [5, 6].
Harvesting of solar energy for photosynthesis andnitrogen fixation simultaneously exposes thesecyanobacteria to lethal doses of UV-B (280-315 nm) andUV-A (315-400 nm) radiations in their natural habitats. Itmay cause several harmful effects such as loss in growth,survival, pigmentation, motility, orientation, N
2 metabolism,
DNA and protein etc. [7-11]. Any adverse effects ofradiations on cyanobacteria will ultimately affect theproductivity of the ecosystems. However, certain
ISSN 0973 – 9874
IntroductionSolar influx of highly energetic ultraviolet-B (UV-B,
280-315nm) radiation has increased on the Earth’s surfacedue to continuing destruction of the ozone layer byanthropogenically released chemicals such aschlorofluorocarbons (CFCs), chlorocarbons (CCBs) andorganobromides (OBMs) [1]. Although very smallproportion of solar ultraviolet radiation (UVR) contributeto the total irradiance on the Earth’s surface (UV-C; 0 %,UV-B; <1 % and UV-A; <7 %), this part of the solarspectrum is energetically highly active. These shorterwavelength radiations may have deleterious effects on allsun-exposed organisms, since it can be absorbed by a rangeof biomolecules leading to cellular photodamage.
Cyanobacteria are phylogenetically a primitive groupof Gram-negative prokaryotes being the only bacteria topossess higher plant-type oxygenic photosynthesis [2]. Theyalso have the capacity to metabolize CO
2, O
2, N
2 and H
2.
Fossil evidence dates their appearance to the Precambrianera (around 3.5 x l09 years) [3]. Cyanobacteria are the largestand most widely distributed group of photosyntheticprokaryotes on Earth and as a group are thought to have
Mycosporine-like Amino Acids: Natural Bioactive CompoundsHaving Pharmaceutical Potentials
RICHA AND RAJESHWAR P. SINHA*
Laboratory of Photobiology and Molecular Microbiology, Centre of Advanced Study in Botany,Banaras Hindu University, Varanasi-221005, India
ABSTRACT
Ultraviolet radiation (UVR) has pronounced detrimental effects on all the sun-exposed organisms,including humans, since it is responsible for various types of cellular photodamage. To counteracttheir adverse effects, cyanobacteria has developed the ability to synthesize certain natural bioactivephotoprotective compounds such as mycosporine-like amino acids (MAAs) having pharmaceuticaland biotechnological potentials. The topical application of MAAs formulation containing porphyra-334 (P-334) + mycosporine-glycine (MG) on the skin of hairless mice reduced the clinical signs oferythema and edema following UV-B irradiation. The formulation was also found to be effective inlowering the generation of reactive oxygen species and cytotoxic thymine dimer formation. Thus,these bioactive compounds may be better suited as natural sunscreens that may provide protectionagainst UV-induced photoaging and skin cancer.
Keywords: Antioxidant, cyanobacteria, mycosporine-like amino acids (MAAs), ultraviolet radiation(UVR).
*Address for correspondenceE-mail: [email protected]

July - September 2013 17 Journal of Pharmacy and Chemistry • Vol.7 • Issue.3
cyanobacteria synthesize photoprotective compounds suchas mycosporine-like amino acids (MAAs) and scytoneminto counteract the damaging effects of harmful radiations.
MAAs are small (<400 Da), colorless, water-solublecompounds having strong UV-absorption maxima (310 to362 nm), high molar extinction coefficients (ε = 28100-50000 M-1 cm-1) and photostability against several abioticstressors that provides evidence for their photoprotectiverole [12-14]. These compounds are known to dissipateabsorbed energy as heat into their surroundings, withoutgenerating reactive oxygen species (ROS) [15]. MAAs aresupposed to be synthesized via the first part of the shikimatepathway, where 3-dehydroquinate ((DHQ)) serves as aprecursor [16, 17]. The relative protection against UV-Bdamage provided by MAAs depends on the species andlocation of the pigments therein, significant but limitedprotection has been reported for various cyanobacteriawith MAAs located in the cytoplasm. In these cases, only10-26 % of the photons are absorbed by the pigmentimplying that MAAs prevent 3 out of 10 photons fromhitting cytoplasmic targets [18].
Materials & MethodsIsolation & characterization of the organisms
The test organisms Nostoc sp. HKAR-2 and Scytonemasp. HKAR-3 [19] were isolated from hot springs of Rajgir,India, by using standard microbiological techniques asdescribed by Sinha et al. [20]. Nostoc sp. HKAR-2 (Fig.1A) is a member of the family Nostocaceae characterizedby frothy thallus, gelatinous, circinate trichomes, sheathabsent, cells ellipsoidal and heterocystous. Scytonema sp.HKAR-3 (Fig. 1B) is an autotrophically growingheterocystous, firmly sheathed and filamentouscyanobacterium that has false branching in its filaments, afeature characteristic of the family Scytonemataceae.
Cultures were grown under axenic conditions inautoclaved liquid medium [21] without a nitrogen sourcein an air-conditioned culture room at a temperature 20 ± 2°C and illuminated by cool white fluorescent light at anintensity of 12 ± 2 W/m2. Cultures were hand shaken fivetimes daily. To avoid contamination, cultures were sub-cultured at regular intervals and all the experiments wereconducted from an exponentially growing cells..
Irradiation Source and Treatment Procedure
Exponentially growing suspension cultures weretransferred into sterile 75 mm Petri dishes covered with395 nm (for PAR treatment), 320 nm (for PAR+UV-Atreatment) and/or 295 nm (for PAR+UV-A+UV-B treatment)cut-off filter foils (Ultraphan, UV Opak Digefra, Munich,Germany) to obtain the desired radiation regimes. Thecultures in the Petri dishes were transferred onto a waterbath placed over a slowly rotating shaker to avoid heatingfrom radiation and self-shading, respectively. The wholeset-up was placed inside a UV-chamber and the suspension
were exposed to artificial PAR, UV-A and UV-B producedfrom a PAR, UV-A and UV-B lamp, with the intensity ofwhich extended from 280 - 400 nm of about 20 W/m2, 5.0W/m2 and 2.0 ± 2 W/m2 respectively.
Extraction of MAAs
Cyanobacterial cells were harvested by centrifugationand MAAs were extracted in 2.0 ml of 100 % (v/v) methanol(HPLC-grade) by overnight incubation at 4 °C. Afterextraction, the aliquots were centrifuged (10000 x g for 5min) and supernatants (methanolic extracts) were evaporatedto dryness at 45 °C and redissolved in 1 mL of double-distilled water and absorption spectrum was recorded.Thereafter, the samples were filtered through 0.2 m pore-sized microcentrifuge filters and subsequently subjected toHPLC analysis.
Absorption spectroscopy
Absorption spectra of all samples were measured in adouble beam spectrophotometer (U-2910, UV/VIS, Hitachi,Tokyo, Japan). The raw data were transferred to amicrocomputer and peaks were analysed with softwareprovided by the manufacturer.
High-performance liquid chromatography
Analysis and purification of MAAs were done usinga HPLC system (Waters 2998, Photodiode Array, pump L-7100, USA) equipped with a Licrospher RP 18 column andguard (5 μm packing; 250 mm × 4 mm inside diameter).The samples (50 μL) were injected into the HPLC columnthrough a Waters 717 Plus Autosampler. The wavelengthfor detection was 330 nm, the mobile phase was 0.02 %acetic acid (v/v) in double-distilled water, at a flow rate of1.0 ml min-1. The MAAs were identified by comparing theabsorption spectra and retention times with that of knownMAAs.
Experimental animal
Hairless mice, aged 8–10 weeks housed underpathogen-free conditions, in controlled temperature (22 oC),humidity (60-70 %) and visible light (12 h light/12 h dark)were used. They were supplied with water and commercialmouse diet. The experiments were performed with the
Fig.1 : Photographs showing the filaments of Nostoc sp.HKAR-2 (A) and Scytonema sp. HKAR-3 (B).

July - September 2013 18 Journal of Pharmacy and Chemistry • Vol.7 • Issue.3
approval of the Ethics Committee, Banaras HinduUniversity.
MAAs formulation and UV treatment
A water emulsion of MAAs formulation containingporphyra-334 and mycosporine-glycine was prepared toaccess their photoprotective role on mice-skin cells. Micewere anesthetized by intraperitoneal injection of thecombination of ketamine and medetomidine prior to UV-treatment. The MAAs formulation at a concentration of0.01µg ml-1 was topically applied on the dorsal skin surfaceof mice 20 min before irradiation. Untreated and exposedanimals (NTI), as well as untreated and unexposed animalswere used as controls. UV-B radiation at a dose of 0.75Wm-2 was used for irradiation. Skin samples were collectedafter 0, 4, 8, 12, 24 and 48 h of exposure. The sampleswere subjected for photoprotective and antioxidative activityanalysis in terms of free radical generation.
Histopathological, antioxidative and thymine dimeranalyses
The formation of erythema and edema following UV-B exposure were assessed visually and evaluated by usingthe Draize scoring system [22] ranging from 0 (no erythemaassigned to color of non-treated and non-irradiated skin) to4 (highest redness corresponding to non-treated andirradiated skin). Edema values were 0: no edema, 1: slightedema (well-defined raising), 2: moderate edema (raisedapproximately 1 mm) and 3: severe edema (raised morethan 1 mm). Production of H
2O
2 following UV-B exposure
was accessed by absorption spectroscopy analysis at 260nm. Genomic DNA was extracted from the skin samplesafter 24 h of UV-B exposure and thymine dimers weredetected using the method as described earlier [23].
Results and DiscussionHPLC Chromatograms of partially purified aqueous
solution from Nostoc sp. HKAR-2 revealed the presence ofshinorine (RT - 2.2 min, λ
max - 334 nm), porphyra-334 (RT
- 2.7 min, λmax
- 334 nm) (Fig. 2) and from Scytonema sp.HKAR-3 revealed the presence of mycosporine-glycine (RT- 4.0 min, λ
max - 310 nm) and unknown compound (RT - 8.5
min, λmax
- 334 nm) (Fig. 3).
Exposure to a UV dose of 0.75 Wm-2 inducedsignificant erythema and edema in the non-treated andexposed animals (NTI) just 12 h after irradiation. Animalstreated topically with P-334 + MG formulations showed alower redness level. The initial erythemic response in P-334 + MG treatments decreased after 12 h and more than50 % inhibition was observed after 48 h of treatment (Fig.4). Similar results were observed in case of edema also.Signs of edema appeared in the exposed skin surface ofexperimental animal after 12 h of exposure and remaineduntil the end of experiments. However, after the applicationof the formulation slight edema was observed (Fig. 5).Production of H
2O
2 following UV-B exposure was evaluated
in the skin of mice by measuring its OD at 260 nm. Asignificant increase in the production of H
2O
2 was observed
upto 4 h, but after that a slight decrease in the H2O
2
production was observed. Topical application of theformulation was found to significantly inhibit the H
2O
2
production by almost 50 % after 12 h (Fig. 6). MAAsformulation also reduced the frequency of thymine dimerformation following UV-B exposure (Fig. 7).
A
Fig. 2: Chromatogram and absorption spectrumobtained from the HPLC analysis of partially purifiedaqueous solution from Nostoc sp. HKAR-2. A. HPLCchromatogram of MAAs; B. Absorption spectrum ofporphyra-334 (RT - 2.7 min, λλλλλmax
- 334 nm)
B
A

July - September 2013 19 Journal of Pharmacy and Chemistry • Vol.7 • Issue.3
B
Fig. 3: Chromatogram and absorption spectrumobtained from the HPLC analysis of partially purifiedaqueous solution from Scytonema sp. HKAR-3. A. HPLCchromatogram of MAAs; B. Absorption spectrum ofmycosporine-glycine (RT - 4.0 min, λλλλλmax
- 310 nm)
Fig. 5: Formation of edema in mice skin cells afterexposure to 0.75 Wm-2 UV-B radiation. Edema formationwas assessed using the Draize scoring system. C:Control; NTI: non-treated and irradiated; TI: Treatedand irradiated.
Fig. 4: Formation of erythema in mice skin cells afterexposure to 0.75 Wm-2 UV-B radiation. Erythemaformation was assessed visually and evaluated using theDraize scoring system, which ranges from 0 (noerythema assigned as control: non-treated and non-irradiated) to 4 (non-treated and irradiated skin).C:Control; NTI: non-treated and irradiated; TI: treatedand irradiated.
Fig. 6: MAAs mediated inhibition of UV-B induced H2O
2
production in the skin of hairless albino mice. C:Control; NTI: non-treated and irradiated; TI: treatedwith the P-334 + MG formulation and then irradiated.
Fig. 7: Immunodot-blot assay of MAAs formulation treated and non-treated skin cells of mice. A – Control, B –after MAAs (P-334 + MG) treatment and C – untreated.

July - September 2013 20 Journal of Pharmacy and Chemistry • Vol.7 • Issue.3
The present investigation showed the photoprotectiverole of natural bioactive MAAs combination, P-334 + MGin the skin of hairless mice exposed to UV-B radiation. TheMAAs Porphyra-334 and mycosporine-glycine isolated fromthe cyanobacterial species Nostoc sp. HKAR-2 andScytonema sp. HKAR-3 had an absorption maximum at334 and 310 nm, respectively. The high molar extinctioncoefficients and photostability favours these MAAs as apotent natural sunscreen for photoprotection [24]. The invitro test performed using a combination of MAAs, P-334+MG formulated in water showed to confer a broadspectrum of protection against UV-B radiation. Reactiveoxygen species, such as H
2O
2, superoxide anion and singlet
oxygen are thought to be involved in UV damage [25, 26].Fortunately, the skin possesses a wide range of interlinkedantioxidant defence mechanisms, e.g., catalase and SODenzymes, to protect itself from damage by UV-induced ROS.In the present investigation, we have demonstrated thatMAAs formulations are capable of reducing the generationof H
2O
2. MAAs exhibit a high antioxidant activity
scavenging superoxide anions and inhibiting lipidperoxidation [27, 28] resulting from UV-induced productionof ROS [29]. Recently, the antioxidant activity of P-334and shinorine from Porphyra and other red algae,maintaining the antioxidant defense system of the skin aswell as Hsp70 expression has been worked out by Coba etal. [30]. The antioxidant activities of the MAAs glycineand usujilene have been reported to inhibit lipid peroxidationin aqueous extracts of marine organisms and to scavenge
1O2 generated from certain endogenous photosensitizers [29,
31]. Thus, it can be concluded that the mycosporine-likeamino acids porphyra-334 and mycosporine-glycine can beconsidered as effective natural sunscreen substances,preventing the deleterious effects induced by ultravioletradiation. The results suggest that in future these naturalbioactive compounds may find application in cosmeticindustries as a potent photoprotectant. Future research mustbe focused on the analysis, biosynthesis and mode of actionof these natural UV-absorbing compounds.
AcknowledgementThis research work was partially supported by a
project (No. SR/WOS-A/LS-140/2011) sanctioned to Richaby Department of Science and Technology, Govt. of India,New Delhi.
References[1] Crutzen PJ. Nature 1992; 356:104-105.
[2] Stanier RY, Cohen-Bazire G. Annu Rev Microbiol1977; 31:225-274.
[3] Fischer WF. Nature 2008; 455:1051-1052.
[4] Vaishampayan A, Sinha RP, Häder D-P, Dey T, GuptaAK, Bhan U, Rao AL. Bot Rev 2001; 67:453-516.
[5] Rastogi RP, Sinha RP. Biotech Adv 2009; 27:521-539.
�
[6] Rastogi RP, Singh SP, Häder D-P, Sinha RP. EnvironExp Bot 2011; 74:280-288.
[7] Gao K, Yu H, Brown MT. J Photochem Photobiol BBiol 2007; 89:117-124.
[8] Lesser MP. Hydrobiologia 2008; 598:1-9.
[9] Sinha RP, Kumari S, Rastogi RP. J Sci Res 2008;52:125-142.
[10] Singh SP, Rastogi RP, Sinha RP, Häder D-P.Photosynthetica 2013; 51: 259-266.
[11] Zheng Y. Phycol Res 2013; 61: 89-97.
[12] Singh SP, Kumari S, Rastogi RP, Singh KL, SinhaRP. Ind J Exp Biol 2008; 46:7-17.
[13] Whitehead K, Hedges JI. J Photochem Photobiol BBiol 2005; 80:115-121.
[14] Gröniger A, Häder D-P. Recent Res Devel PhotochemPhotobiol 2000; 4:247-252.
[15] Conde FR, Churio MS, Previtali CM. J PhotochemPhotobiol B Biol 2000; 56:139-144.
[16] Favre-Bonvin J, Bernillon J, Salin N, Arpin N.Phytochemistry 1987; 26:2509-2514.
[17] Singh SP, Häder D-P, Sinha RP. Ageing Res Rev 2010;9:79-90.
[18] Garcia-Pichel F., Castenholz RW. Appl EnvironMicrobiol 1993; 59:163-169.
[19] Rastogi RP, Kumari S, Richa, Han T, Sinha RP. Can JMicrobiol 2012; 58: 719-727.
[20] Sinha RP, Kumar HD, Kumar A, Häder D-P. ActaProtozool 1995; 34:187-192.
[21] Safferman RS, Morris ME. J Bacteriol 1964; 88: 771-775.
[22] Farkas B, Magyarlaki M, Csete B, Nemeth J, et al.Biochem Pharmacol 2002; 5:921-32.
[23] Sinha RP, Dautz M, Hader D-P. Acta Protozool 2001;40:87-195.
[24] Torres A, Enk CD, Hochberg M, Srebnik M. PhotochemPhotobiol Sci 2006; 5:432–5.
[25] De Fabo EC, Noonan FP. J Exp Med 1983;157:84-88.
[26] Sander CS, Chang H, Hamm F, Elsner P, et al. Int JDermatol 2004; 43: 326-335.
[27] De la Coba F, Aguilera J, Figueroa FL (2007 a) IntlPatent WO2007/026038A2.
[28] De la Coba F, Aguilera J, Figueroa FL (2007 b) IntlPatent WO2007/026035 A2.
[29] Suh H, Lee HW, Jung J. Photochem Photobiol 2003;78:109-113.
[30] Coba FDL, Aguilera J, Figueroa FL, de Gálvez MV,Herrera E. J Appl Phycol 2009; 21:161-169.
[31] Oren A, Gunde-Cimerman N. FEMS Microbiol Lett2007; 269:1-10.

July - September 2013 21 Journal of Pharmacy and Chemistry • Vol.7 • Issue.3
IntroductionGliclazide, 1-(1-azabicyclo [3,3,0]oct-3-yl)-3-p-
tolylsulfonyl) urea is a second generation of hypoglycaemicsulfonylurea which is useful in the treatment of non-insulindependent diabetes mellitus (NIDDM)1. Prior reports revealthat the drug shows good tolerability, low incidence ofhypoglycaemia, and a low rate secondary failure2. Gliclazideis a white crystalline powder, relatively insoluble in water.Gliclazide exhibits slow GI absorption rate and interindividual variations of its bioavailability3. The slowabsorption rate of drug usually originates from either poordissolution of drug from the formulation or poorpermeability of drug across GI membrane
The primary objective of the present study is toinvestigate the possibility of improving the release propertiesof gliclazide via lyophilization technique with poloxamer188. The possible interactions between gliclazide andpoloxamer 188 in both solid state and liquid states wereinvestigated. Interaction in the solid state was investigatedby Fourier-transform infrared (FT-IR) spectroscopy anddifferential scanning calorimetry (DSC). Interaction in
solution was studied by phase solubility analysis anddissolution experiments.
Materials and MethodsGliclazide was obtained as a gift sample from
Glenmark Generic Ltd., Mumbai (India) and Poloxamer188 was obtained as a gift sample from B.A.S.F, Mumbai.All other reagents and solvents used were of analyticalgrade.
Preparation of SDs and physical mixtureLyophilization technique:
The SDs of gliclazide in poloxamer 188 containingthree different weight ratios (1:1, 1:2, 1:5) (gliclazide:Poloxamer 188) and denoted as SD1/1, SD1/2 and SD 1/5respectively, were prepared by lyophilization. The modeldrug and the hydrophilic polymer Poloxamer 188 solubilizedin approximately 20 ml of isopropanol in small USP typeglass vial (30ml). Then the vials were kept into the port ofYorco Freeze Dryer, YSL-250 in close condition of valve.After the stabilization lyophilizer the ports were openedslowly and kept in that condition for several hours untilpowder mass was obtained .Then the valves of lyophilizerwere closed and the resultant powder mass pass throughsieve no#60 and kept in the desiccator.
*Address for correspondenceE-Mail Id: [email protected]
Solubility enhancement of Gliclazide with Poloxamer188 bylyophilization technique
VENKATESHWAR REDDY A*1, KANHU CHARAN PANDA1 AND NIRANJAN PANDA1
*1Anwar-ul-Uloom College of Pharmacy, New Mallepally, Hyderabad- 500001. 1Research Scholar, Department of Pharmaceutical Sciences, JNTUA, Anantapur.
ABSTRACT
Gliclazide is an oral hypoglycaemic agent useful in the treatment of non-insulin dependent diabetesmellitus (NIDDM). It is practically insoluble in water and its absorption is dissolution rate limited.The present study was performed to improve the dissolution of Gliclazide, a poorly water solubledrug using solid dispersion technique. Thus, to enhance the dissolution, the hydrophilic carrierPoloxamer 188 in various proportions was prepared using lyophilization technique. Physical mixtureswere also prepared. After comparing the solubility and dissolution profiles, it was observed that thesolid dispersion of Gliclazide prepared by lyophilization technique with (1:5) showed the fastestdissolution. From the FTIR study it was conformed that there were no drug and polymer interactions.DSC studies revealed solid state interactions in solid dispersion as endothermic peak of Gliclazidewas absent in the solid dispersions prepared by lyophilization technique indicating that the drugwas in amorphous form. XRD study revealed presence of less number peaks indicating that thatthe drug was in amorphous form due to reduction in crystallinity.
Key words: solid dispersion (SDS), lyophilization technique, Poloxamer 188, dissolution.
ISSN 0973 – 9874

July - September 2013 22 Journal of Pharmacy and Chemistry • Vol.7 • Issue.3
Physical Mixtures
The PMs having the same weight ratio as SDs wereprepared by thoroughly mixing the required amount ofgliclazide and poloxamer 188 for 10 min in a mortar. Theresulting mixtures were sieved through a 100-mesh sieveand denoted as PM 1/1, PM 1/2 and PM 1/5 respectively.
Characterizations
Solubility determinations were performed in triplicateaccording to the method of Higuchi and Connors.Dissolutionstudies of gliclazide in powder form, SDs, and PMs wereperformed by using the U.S.Pharmacopoeia (USP) modeldigital tablet dissolution test apparatus-II at the paddlerotation speed of 50 rpm in 900 mL 0.1N HCl containing0.25% (w/v) of SLS as a dissolution medium at 37±0.5oCat 276 nm.
Results and DiscussionSolubility Studies
Solubility experiments showed that the concentrationof gliclazide in 0.1N HCl is notably affected by the presenceof poloxamer 188. The phase-solubility diagram investigatedin 0.1N HCl (pH 1.2) was linear up to concentrations of1.5 (w/v) and correspond to A
N-type profiles (Fig 1).The
apparent stability constant (K1:1
) was estimated from theslope of the straight line of the phase-solubility diagram.
The stability constant was found to be 0.0231 ml-1mg. Theseresults are in accordance with the well established formationof soluble complexes between water soluble polymericcarriers and poorly water soluble drugs.
Dissolution Studies
The results of the dissolution studies for individualsamples (gliclazide alone, PMs and SDs) over the periodof 1 hour are shown in Fig 2 and reported values are themean three determinations (CV<10%).Q
10, Q
20 and Q
30
values (percent drug dissolved within 30 minutes) are shownin fig 2. From the fig 2 it is evident that onset of dissolutionof pure gliclazide is very low about 40.44% of drug beingdissolved within 30 minutes. SDs of gliclazide withpoloxamer 188 considerably enhanced dissolution rateswithin 30 minute compared to pure gliclazide and PMs.
The value of %DE10min
for pure gliclazide (9.16%)was enhanced in PMs (36.90%) as well as in SDs (40.02%).The value of % DE
30min for the pure drug was increased to
64.9 % in PMs and up to 67. 39 % in SDs.
The MDT of gliclazide is 12.5 min, then it decreasedto a greater extent 5.24 min after preparing its SDs withpoloxamer 188 at 1:2 (gliclazide: poloxamer 188) ratio.The MDT of gliclazide increases with increasingconcentration of poloxamer 188 in its PMs as well as SD.
Fig.1 : Phase solubility curve
Table.1
Effect of poloxamer 188 concentration and Gibbs free energy on solubility gliclazide
Concentration of Concentration of ΔΔΔΔΔΔΔΔΔΔGtro(J/Mol)
poloxamer 188 (% w/v) gliclazide(mg/ml) at 37 °°°°°C
0 0.81 0
2.0 0.92 -332.98
2.5 0.99 -521.87
3.0 1.4 -1415.15
3.5 1.8 -2063.0
4.0 2.1 -2460.38

July - September 2013 23 Journal of Pharmacy and Chemistry • Vol.7 • Issue.3
Table - 2
In-vitro dissolution profile of gliclazide, physical mixture of gliclazide and solid dispersion of gliclazide withpoloxamer 188 in 0.1NHCl (pH 1.2)
Formulations Dissolution parameters
Q10min
Q20min
Q30min
%DE10min
%DE30min
MDT(min)
Drug 18.46 32.67 40.82 9.16 23.67 12.5
PM 1:1 56.6 65.6 78.0 28.32 53.75 9.32
PM 1:2 61.6 67.2 73.2 33.78 57.96 6.57
PM 1:5 62.3 68.2 74.12 36.90 64.90 5.75
SD 1:1 67.2 69.7 75.2 33.58 58.15 6.80
SD 1:2 75.15 79.77 80.29 37.58 65.03 5.7
SD 1:5 80.0 81.3 81.6 40.02 67.39 5.24
Table-3
Statistical parameters of various formulations of gliclazide with pol-188 after fitting drugrelease data to various release kinetics models
Zero-order First-order H-M Model P-K Model H-C ModelFormu- Model Modellations R K
1R K
2R k
3R K
4, nR K
5
Drug 0.9813 1.4736 0.9939 -0.0184 0.9893 7.1358 0.9952 3.473, 0.724 0.9905 -0.0057
PM 1:1 0.6131 1.8651 0.9001 -0.0397 0.9460 12.8338 0.9830 31.76, 0.254 0.8272 -0.0100
PM 1:2 0.765 1.892 0.3554 -0.0398 0.7990 13.283 0.9909 65.70, 0.060 0.1212 -0.0101
PM 1:5 0.0869 1.7808 0.5998 -0.0344 0.8514 12.4232 0.9613 51.92, 0.107 0.4796 -0.0090
SD 1:1 0.3371 2.0303 0.8856 -0.0531 0.8760 14.096 0.9042 54.46, 0.128 0.7638 -0.0121
SD 1:2 0.3370 2.1160 0.9351 -0.0696 0.8739 14.6880 0.8682 57.53, 0.124 0.8421 -0.0141
SD 1:5 0.3581 2.523 0.9452 -0.0741 0.8842 15.123 0.8785 58.25, 0.131 0.8514 -0.0156
*H-M indicates, Highuchi Matrix; †P-K, Peppas-Korsmeyer; ‡H-C, Hixon-Crowell; §R indicates correlation coefficient;§ K
1- K
5 , Constants of release kinetics; PM: Physical mixture with poloxamer; SD: Solid dispersion of gliclazide with
poloxamer.
Fig.2 : In-vitro dissolution profile of gliclazide, physical mixture of gliclazide and solid dispersion of gliclazide with poloxamer188 in 0.1NHCl (pH 1.2)

July - September 2013 24 Journal of Pharmacy and Chemistry • Vol.7 • Issue.3
FTIR-Spectroscopy
Fourier-transform infrared (FT-IR) spectroscopy wasused to characterize possible interactions between the drugand carrier in the solid state. The IR spectra of SDs andPMs were compared with the standard spectrum ofgliclazide.IR spectrum of gliclazide is characterized by theabsorption of carbonyl (C=O) sulphonyl urea group at 1706cm-1. In spectra of SDs and PMs, this band was shiftedtowards higher frequencies at 1725 cm-1 and 1711 cm-1
respectively. Also the NH group which is located at 3265cm-1 from the IR spectrum of gliclazide shifted to 3365 cm-
1 in SDs. The sulphonyl group bands are located at 1349cm-1 and 1162 cm-1 in pure gliclazide. In SDs, theasymmetrically vibration peak of S=0 band was shifted
from 1349 cm-1 to 1341 cm-1 with decreased frequencies.In SDs, the symmetrically stretching vibration band of S=0was shifted from 1162 cm-1 to 1157 cm-1 with decreasedfrequencies. The shift in the peaks associated withsulfonylurea group of the gliclazide indicate an increase inbond strength possibly due to stabilizing effect of thehydrogen atoms of poloxamer 188 interacting with theoxygen atoms of the sulphonyl group. Mentioned evidencesthus lead to the conclusion that changes seen are as a resultof physical interaction between the gliclazide and poloxamer188. Although it could be expected to have hydrogenbonding between the hydrogen atom of the NH group ofgliclazide and one of the ion pairs of oxygen atom in thepoloxamer 188, that could not be demonstrated.
Fig.3: Infrared spectra of Gliclazide
Fig.4 : Infrared spectra of Poloxamer-188

July - September 2013 25 Journal of Pharmacy and Chemistry • Vol.7 • Issue.3
Differential Scanning Calorimetry
The DSC curve of pure gliclazide exhibited a singleendothermic response corresponding to the melting of drug.Onset of melting was observed at 170.8ÚC, thecorresponding heat of fusion (ΔH
F) was 171.8J/g where as
pure poloxamer 188 showed a melting endotherm at 58.2ÚCcorresponding heat of fusion (ΔH
F) was 259.5J/g.
Thermogram of SDs showed the absence of a gliclazidepeak, suggesting that gliclazide is completely soluble in
Fig.5 : Infrared spectra of Physical mixture of Gliclazide -poloxamer188
Fig.6: Infrared spectra of Solid dispersion of Gliclazide -poloxamer188
the liquid phase of polymer. However, the melting peak ofpoloxamer 188 in SDs was observed at slightly lowertemperature (57.2ÚC) than that of pure poloxamer 188.ThePMs Formulation of gliclazide and poloxamer 188 alsoshowed no endothermic peak of gliclazide, even thoughthe peaks derived from gliclazide were observed in XRD.It is speculated that gliclazide dissolved in melted poloxamer188 during the DSC measurement, only one endothermicpeak at 57ÚC corresponding to melting of poloxamer 188was observed.
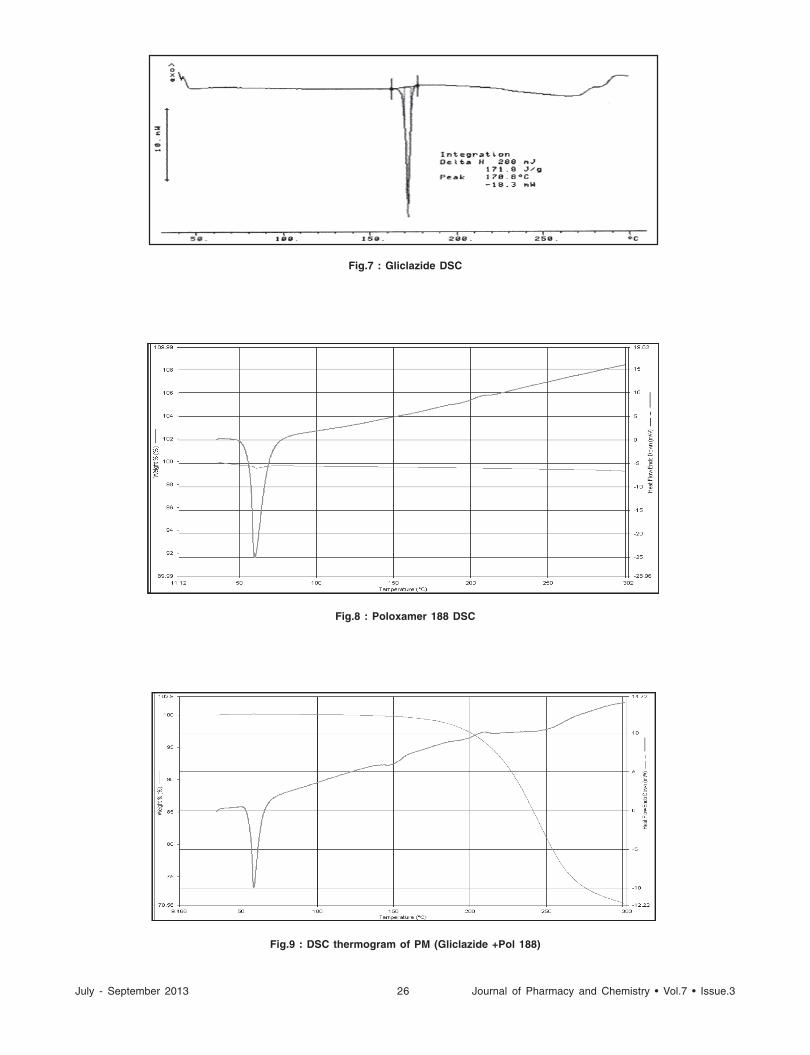
July - September 2013 26 Journal of Pharmacy and Chemistry • Vol.7 • Issue.3
Fig.7 : Gliclazide DSC
Fig.8 : Poloxamer 188 DSC
Fig.9 : DSC thermogram of PM (Gliclazide +Pol 188)

July - September 2013 27 Journal of Pharmacy and Chemistry • Vol.7 • Issue.3
ConclusionThe solubility and dissolution rate of gliclazide can
be enhanced by the use of SDs of gliclazide with poloxamer188 by lyophilization technique. The solubilization effectof poloxamer 188, reduction of particle aggregation of thedrug, absence of crystallinity, increased wettability anddispersibility, and alteration of the surface properties of thedrug particles might be responsible for the enhancedsolubility and dissolution rate of gliclazide from its SD andPMs.
AcknowledgementAuthor wish to thank the management of Anwarul
Uloom College of Pharmacy, New Mallepally, Hyderabadfor providing the facility to carry out research work.
References1. Reynolds J, Martindale: The Extra Pharmacopoeia,
30th ed.The Pharmaceutical Press, London, P-279-280.
2. Harrower A D.Comparison of efficacy, secondaryfailure rate and complications of sulfonylurea DiabetesComplications.1994; 8:201–203.
3. Palmer KJ, Brogden RN. Gliclazide, an update of itspharmacological properties and therapeutic efficacyin NIDDM.Drugs.1993; 46:92-125.
Fig1 Effect of concentrations of poloxamer 188 onsolubility of gliclazide
4. Chiou WL, Riegelman S. Pharmaceutical applicationsof soli dispersion systems. J Pharm Sci. 1971;60:1281Y1302.
5. Babu GV, Kumar NR, Himasankar K, Seshasayana,Murthy KV. Nimesulide-modified gum karaya solidmixture preparation, characterization and formulationdevelopment Drug Dev Ind Pharm. 2003; 29:855Y864.
Fig.10: DSC thermogram of Solid dispersion (Gliclazide +Pol 188)
�
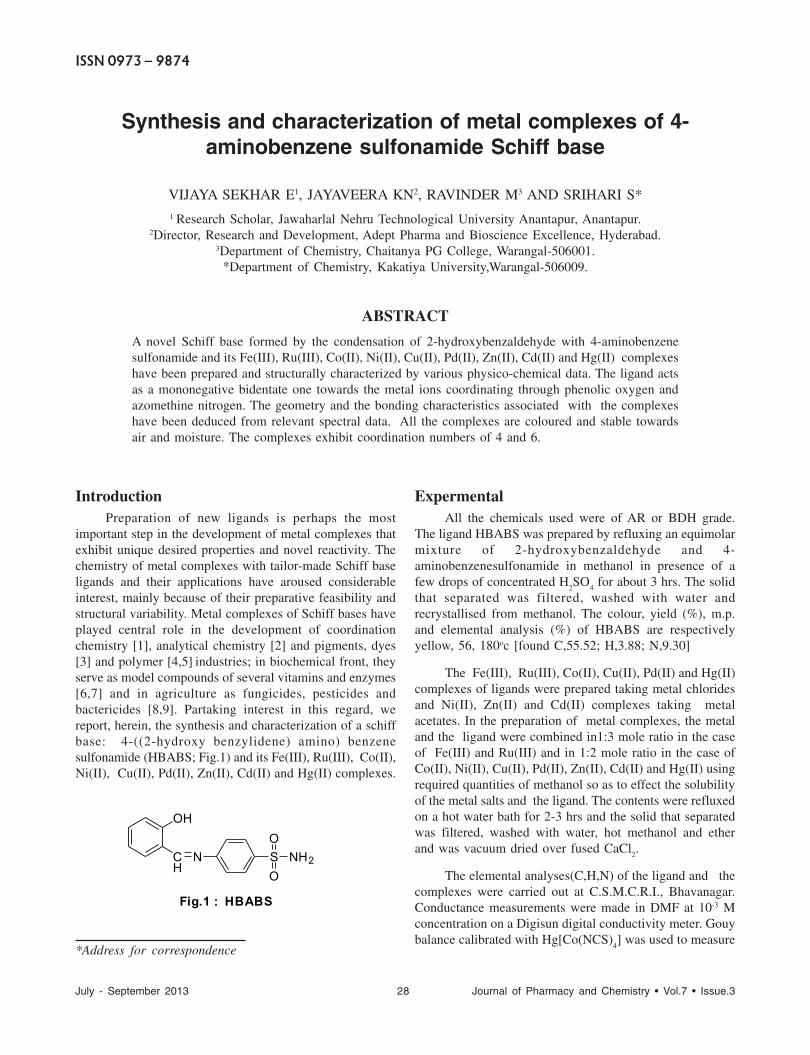
July - September 2013 28 Journal of Pharmacy and Chemistry • Vol.7 • Issue.3
IntroductionPreparation of new ligands is perhaps the most
important step in the development of metal complexes thatexhibit unique desired properties and novel reactivity. Thechemistry of metal complexes with tailor-made Schiff baseligands and their applications have aroused considerableinterest, mainly because of their preparative feasibility andstructural variability. Metal complexes of Schiff bases haveplayed central role in the development of coordinationchemistry [1], analytical chemistry [2] and pigments, dyes[3] and polymer [4,5] industries; in biochemical front, theyserve as model compounds of several vitamins and enzymes[6,7] and in agriculture as fungicides, pesticides andbactericides [8,9]. Partaking interest in this regard, wereport, herein, the synthesis and characterization of a schiffbase: 4-((2-hydroxy benzylidene) amino) benzenesulfonamide (HBABS; Fig.1) and its Fe(III), Ru(III), Co(II),Ni(II), Cu(II), Pd(II), Zn(II), Cd(II) and Hg(II) complexes.
ExpermentalAll the chemicals used were of AR or BDH grade.
The ligand HBABS was prepared by refluxing an equimolarmixture of 2-hydroxybenzaldehyde and 4-aminobenzenesulfonamide in methanol in presence of afew drops of concentrated H
2SO
4 for about 3 hrs. The solid
that separated was filtered, washed with water andrecrystallised from methanol. The colour, yield (%), m.p.and elemental analysis (%) of HBABS are respectivelyyellow, 56, 180oc [found C,55.52; H,3.88; N,9.30]
The Fe(III), Ru(III), Co(II), Cu(II), Pd(II) and Hg(II)complexes of ligands were prepared taking metal chloridesand Ni(II), Zn(II) and Cd(II) complexes taking metalacetates. In the preparation of metal complexes, the metaland the ligand were combined in1:3 mole ratio in the caseof Fe(III) and Ru(III) and in 1:2 mole ratio in the case ofCo(II), Ni(II), Cu(II), Pd(II), Zn(II), Cd(II) and Hg(II) usingrequired quantities of methanol so as to effect the solubilityof the metal salts and the ligand. The contents were refluxedon a hot water bath for 2-3 hrs and the solid that separatedwas filtered, washed with water, hot methanol and etherand was vacuum dried over fused CaCl
2.
The elemental analyses(C,H,N) of the ligand and thecomplexes were carried out at C.S.M.C.R.I., Bhavanagar.Conductance measurements were made in DMF at 10-3 Mconcentration on a Digisun digital conductivity meter. Gouybalance calibrated with Hg[Co(NCS)
4] was used to measure
Synthesis and characterization of metal complexes of 4-aminobenzene sulfonamide Schiff base
VIJAYA SEKHAR E1, JAYAVEERA KN2, RAVINDER M3 AND SRIHARI S*1 Research Scholar, Jawaharlal Nehru Technological University Anantapur, Anantapur.
2Director, Research and Development, Adept Pharma and Bioscience Excellence, Hyderabad.3Department of Chemistry, Chaitanya PG College, Warangal-506001.
*Department of Chemistry, Kakatiya University,Warangal-506009.
ABSTRACT
A novel Schiff base formed by the condensation of 2-hydroxybenzaldehyde with 4-aminobenzenesulfonamide and its Fe(III), Ru(III), Co(II), Ni(II), Cu(II), Pd(II), Zn(II), Cd(II) and Hg(II) complexeshave been prepared and structurally characterized by various physico-chemical data. The ligand actsas a mononegative bidentate one towards the metal ions coordinating through phenolic oxygen andazomethine nitrogen. The geometry and the bonding characteristics associated with the complexeshave been deduced from relevant spectral data. All the complexes are coloured and stable towardsair and moisture. The complexes exhibit coordination numbers of 4 and 6.
*Address for correspondence
OH
CH
N S
O
O
NH2
Fig.1 : HBABS
ISSN 0973 – 9874

July - September 2013 29 Journal of Pharmacy and Chemistry • Vol.7 • Issue.3
the magnetic susceptibility of metal complexes at roomtemperature. The IR spectra of the ligand and its metalcomplexes in KBr were recorded in the range 4000-450cm-1 using Perkin Elmer 100 FT-IR spectrophotometer. Theelectronic spectra of metal complexes were recorded onPerkin Elmer UV-VIS spectrophotometer. WIN-EPR(BRUKER) spectrophotometer operating in the frequency9.5 GHz was employed in recording the ESR spectrum ofCu(II) complex in DMF at LNT.
Results and DiscussionThe Fe(III), Ru(III), Co(II), Ni(II), Cu(II), Pd(II),
Zn(II), Cd(II) and Hg(II) complexes of HBABS are stableat room temperature and are non-hygroscopic. Upon heating,the complexes decompose without melting. The complexesare insoluble in water, slightly soluble in hot methanol andfairly soluble in dimethylformamide anddimethylsulphoxide.
The elemental analyses (Table 1) show that the Fe(III)and Ru(III) complexes have 1:3 and the Co(II), Ni(II),Cu(II), Pd(II), Zn(II), Cd(II) and Hg(II) complexes 1:2metal-ligand stoichiometry. All the complexes are non-electrolytic in nature [10].
IR Spectral DataThe ligand shows, in its IR spectrum, a medium
intensity band at 3345cm-1 that has been assigned to νO-H.This band disappears in the spectra of its complexesindicating that deprotonation of the group has taken place.
A small intensity band at 1239cm-1 in the ligand assignableto νC-O is seen to have undergone a positive shift by 20-40cm-1 in the complexes suggesting coordination throughphenolic oxygen [11]. A band that shows up at 1615cm-1 inthe ligand due to azomethine group has been lower shiftedby 15-20 cm-1 in the complexes indicating that the nitrogenof this group is coordinated to the metals [12]. The presenceof SO
2 group in the ligand is indicated by two bands around
1160 and 1370 cm-1 due to its symmetric and asymmetricstretching vibrations respectively and they remain unshiftedin the complexes indicating that the SO
2 group is not
involved in coordination [13]. These observations suggestthat the ligand acts as a mononegative, bidentate onebonding through phenolic oxygen and nitrogen of C=Ngroup, [14,15].
The coordination through phenolic oxygen andazomethine nitrogen is further substantiated by theappearance, in all the complexes, of non-ligand bands inthe far infrared region around 520 and 460cm-1 assignablerespectively to νM-O and νM-N vibrations[16].
Electronic Spectral DataThe electronic spectral data of the Ru(III), Co(II),
Ni(II), Cu(II) and Pd(II) complexes along with theassignment are furnished in Table-2.
These transitions are characteristic of octahedral (lowspin) for Ru (III), tetrahedral for Co(II) and square planargeometry for Ni(II), Cu(II) and Pd(II) complexes [17-19].
Table-1
Analytical and physical data of the metal complexes
Per centMolar µ
eff
Metal complex Colour Conductance B.M.
C H N Ω-1cm2mol-1
[Fe (C13
H11
N2O
3S)
3] Brown 52.24(53.12) 3.28(3.77) 9.20(9.53) 12 5.58
[Ru (C13
H11
N2O
3S)
3] Brown 54.62(55.53) 3.16(3.59) 8.86(9.07) 14 1.81
[Co (C13
H11
N2O
3S)
2] Brown 50.66(51.23) 3.28(3.64) 8.78(9.19) 12 4.50
[Ni (C13
H11
N2O
3S)
2] Pale green 50.72(51.25) 3.30(3.64) 8.92(9.20) 10 -
[Cu (C13
H11
N2O
3S)
2] Brown 50.04(50.85) 3.18(3.61) 8.78(9.12) 13 1.78
[Pd (C13
H11
N2O
3S)
2] Grey 46.86(47.53) 3.09(3.38) 8.02(8.53) 14 -
[Zn (C13
H11
N2O
3S)
2] Light Yellow 49.80(50.69) 3.22(3.60) 8.90(9.10) 12 -
[Cd (C13
H11
N2O
3S)
2] Yellow 46.68(47.10) 3.08(3.34) 8.02(8.45) 11 -
[Hg (C13
H11
N2O
3S)
2] Yellow 40.76(41.57) 2.81(2.95) 7.00(7.46) 10 -
Values in parentheses are the calculated ones.

July - September 2013 30 Journal of Pharmacy and Chemistry • Vol.7 • Issue.3
are octahedral, Ni(II), Cu(II) and Pd(II) complexes, squareplanar and Co(II), Zn(II), Cd(II) and Hg(II) complexes,tetrahedral in geometry .
References[1]. F.P. Dwyer and D.P. Mellor (Eds.), “Chelating agents
and metal chelates” Academic Press, New York(1964).
[2]. E. Juncreis and S. Thabet, Chelates Analyt. Chem.,2 (1969), 149.
[3]. B.R. Inman and L.A. Macpherson, Chem. Abstr.,74 (1971), 77398.
[4]. C.S. Marvell and N. Tarkoy, J. Am. Chem. Soc., 79(1957), 6000.
[5]. C.S. Marvell and N. Tarkoy, J. Am. Chem. Soc., 80(1958), 832.
[6]. E.M. Hodnett and W.J. Dunn, J. Med. Chem., 13(1970), 768.
[7]. C.V. Deliwala, J.D. Modi and S.S. Sadnis, J. Med.Chem., 14 (1971), 450.
[8]. C.Viel, P.Hampe, R.Dorme and J.Y.Harnette, Chem.Abstr., 70 (1969), 47346.
[9]. H. Pacheco, Chem. Abstr., 72 (1970), 111001,111002.
[10]. W.J. Geary, Coord. Chem. Rev., 7 (1971), 81.
[11]. V.K. Rastogi, A.K. Katiyar, R.C. Saxena and A.K.Kotnak. J. Indian Chem. Soc. 60 (1983), 177.
[12]. P.K. Sharma, A.K. Sen, K. Singh and S.N. Dubey,J. Indian Chem. Soc. 74 (1997) , 446.
[13]. C.N.R. Rao, Chemical applications of infraredspectroscopy, Academic Press, New York (1963).
[14]. A.Syamal, D.Kumar and Ahmed, Indian J. Chem.,21A (1982), 634.
[15]. R.L. Dutta and A.K. Sarkar, J. Inorg. Nucl. Chem.,43 (1981), 57.
[16]. A. Syamal and M .R. Maurya, Indian J. Chem.,24A (1985), 836 .
[17]. A.B.P. Lever, Inorganic electronic spectroscopy,2nd ed., Elsevier, (1984), 455.
[18]. C.K. Jorgenson, J. Inorg. Nucl. Chem., 24 (1962),1577.
[19]. M.R. Gajendragad and U.C. Aggarwala, J. Inorg.Nucl. Chem., 37 (1975), 242.
[20]. C.J. Ballhausen, Introduction to ligand field theory,Mc Graw-Hill, New York , (1962), 134.
[21]. R.L. Dutta and A. Syamal, Elements ofmagnetochemistry, 2nd Ed., Affiliated East-West PressPvt. Ltd., (1993), 223.
�
Table-2Electronic spectral data of the metal complexes.
Complex Frequency Assignment(cm-1)
Ru-HBABS 16650 2T2g → 4T
1g
18410 2T2g → 4T
2g
22600 2T2g → 2A
2g
Co-HBABS 11900 4A2(F) → 4T
1(F)
20000 4A2(F) → 4T
1(P)
Ni-HBABS 17700 1A1g
(D) → 1B1g
(G)
24100 1A1g
(D) → 1Eg(G)
Cu-HBABS 15625 2B1g → 2B
2g
20830 2B1g → 2E
g
Pd-HBABS 15150 1A1g → 1A
2g
19610 1A1g → 1B
1g
25640 1A1g → 1E
g
The Fe(III) complex, owing to transitions in it beingspin-forbidden and the Zn(II), Cd(II) and Hg(II) complexesdue to filled configurations, do not show d-d bands. Basedon the other data obtained, Fe(III) complex has beenassigned octahedral (high spin) and the other threecomplexes, tetrahedral geometry.
ESR Spectral Data
The ESR spectrum of Cu(II) complex is of anisotropicnature in that it shows two peak envelopes, one of smalland the other of large intensities. The g
|| and g⊥
correspondingto these peaks are 2.22 and 2.05 with a g
av = (g
|| + 2g⊥
/3)=2.11.
The anisotropic nature of the spectrum provides anadditional evidence for square planar geometry of thecomplex. In a square planar geometry, the unpaired electronlies in d
x2
-y2 orbital giving 2B
1g as the ground state with g
||
>g⊥>2 [20, 21]. Conforming with this, it may be inferredthat the unpaired electron lies predominantly in the d
x2
-y2
orbital of Cu(II).
ConclusionsBased on the foregoing discussion, it may be
concluded that the ligand acts in a mononegative, bidentatemanner coordinating to the metals through phenolic oxygenand azomethine nitrogen. Fe(III) and Ru(III) complexes

July - September 2013 31 Journal of Pharmacy and Chemistry • Vol.7 • Issue.3
*Address for correspondenceEmail: [email protected]; Mob: =91-9964173700
Introduction
Pregnancy is a state that allows a life form to developwith the support and protection from mother’s body. Thegrowth and development of the fetus in gestation is partiallydetermined by the genome of the fetus, which produces itsown growth factors as well as the majority of its hormones.However, this genetic influence is highly dependent uponinteraction with environmental factors [1]. Oneenvironmental factor vital in the growth and developmentof the fetus is nutrition. A balanced, nutritious diet is animportant aspect of a healthy pregnancy. Eating a healthydiet, balancing carbohydrates, fat, and proteins, and eatinga variety of fruits and vegetables, usually ensures goodnutrition. Those whose diets are affected by health issues,religious requirements, or ethical beliefs may choose toconsult a health professional for specific advice. Adequatepericonceptional folic acid (also called folate or VitaminB
9) intake has been proven to limit fetal neural tube defects,
preventing spina bifida, a very serious birth defect. Theneural tube develops during the first 28 days of pregnancy,explaining the necessity to guarantee adequatepericonceptional folate intake[2,3].Folates are abundant
in spinach (fresh, frozen, or canned), and are found in greenleafy vegetables e.g. salads, beets, broccoli, asparagus, citrusfruits and melons, chickpeas and eggs. In the United Statesand Canada, most wheat products (flour, noodles) arefortified with folic acid [4].
DHA omega-3 is a major structural fatty acid in thebrain and retina, and is naturally found in breast milk. It isimportant for the woman to consume adequate amounts ofDHA during pregnancy and while nursing to support herwell-being and the health of her infant. Developing infantscannot produce DHA efficiently, and must receive this vitalnutrient from the woman through the placenta duringpregnancy and in breast milk after birth [5].
The fetus is solely dependent on the mother to supplyits nutrients. It is also dependent on the placenta, an essentialorgan in pregnancy, to transfer these nutrients from thematernal system to its own. Thus the fetal nutrition is areflection of that of the mother’s. This interaction exists ina sensitive equilibrium; if disturbed, there are fetaldevelopmental consequences1.Preselection of the gender ofoffspring is a subject that has held man’s attention sincethe beginning of recorded history. Although scientific studieson genes have been conducted recently, sex selection andgender preference have been considered since ancient time.
Impact of Calcium and Magnesium Ions in Identification ofSecond Generation Offspring Gender in rabbits
CHANDRAJU S1*, BEIRAMI A1 AND CHIDAN KUMAR CS2
1Department of Studies in Sugar Technology, Sir M.Vshweshwaraya Post-Graduate Center, University of Mysore,2
Tubinakere-571402, Mandya, Karnataka, INDIA2Department of Engineering Chemistry, Alva’s Institute of Engineering & Technology, Shobhavana Campus,
Mijar,Moodbidri-574225,South Canara Dt. Karnataka, India.
ABSTRACT
Impact of calcium and magnesium in diet to determine offspring gender in rabbits has beeninvestigated. Sex chosen from the second generation of the previous experimented rabbits weredivided into two groups in the ratio male to female 1:1. The first group was Ca and Mg, the secondgroup determination has scientific basis for prevention of genetic diseases in addition to socialbackgrounds. 20 healthy rabbits was control unit without Ca and Mg. It was found that the deliveredoffspring male to female ratio were 1.8:1 and 1:1 for the first and second groups respectively. Also,it was found that rabbits fed with (Ca, Mg) food yields maximum numbers of female offspring 45,while rabbits fed with normal food yields lowest numbers of female offspring 35.
Keywords: Calcium, Magnesium, Sex ratio, Rabbits, Offsprings.
ISSN 0973 – 9874
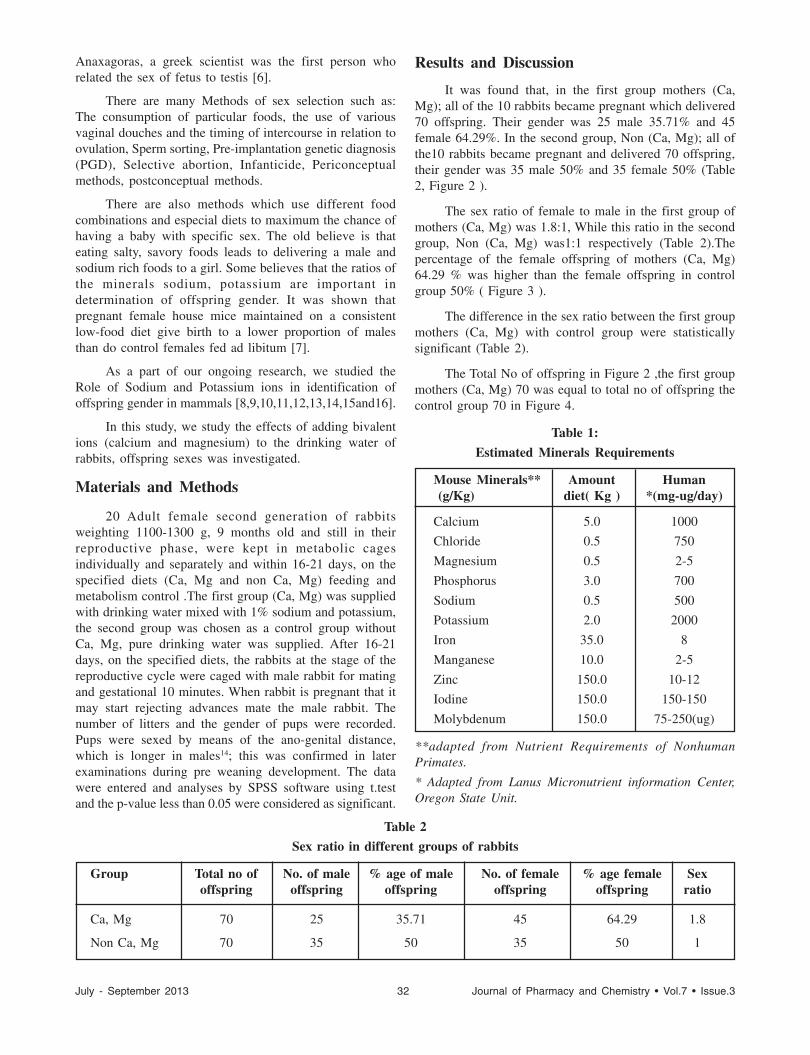
July - September 2013 32 Journal of Pharmacy and Chemistry • Vol.7 • Issue.3
Anaxagoras, a greek scientist was the first person whorelated the sex of fetus to testis [6].
There are many Methods of sex selection such as:The consumption of particular foods, the use of variousvaginal douches and the timing of intercourse in relation toovulation, Sperm sorting, Pre-implantation genetic diagnosis(PGD), Selective abortion, Infanticide, Periconceptualmethods, postconceptual methods.
There are also methods which use different foodcombinations and especial diets to maximum the chance ofhaving a baby with specific sex. The old believe is thateating salty, savory foods leads to delivering a male andsodium rich foods to a girl. Some believes that the ratios ofthe minerals sodium, potassium are important indetermination of offspring gender. It was shown thatpregnant female house mice maintained on a consistentlow-food diet give birth to a lower proportion of malesthan do control females fed ad libitum [7].
As a part of our ongoing research, we studied theRole of Sodium and Potassium ions in identification ofoffspring gender in mammals [8,9,10,11,12,13,14,15and16].
In this study, we study the effects of adding bivalentions (calcium and magnesium) to the drinking water ofrabbits, offspring sexes was investigated.
Materials and Methods
20 Adult female second generation of rabbitsweighting 1100-1300 g, 9 months old and still in theirreproductive phase, were kept in metabolic cagesindividually and separately and within 16-21 days, on thespecified diets (Ca, Mg and non Ca, Mg) feeding andmetabolism control .The first group (Ca, Mg) was suppliedwith drinking water mixed with 1% sodium and potassium,the second group was chosen as a control group withoutCa, Mg, pure drinking water was supplied. After 16-21days, on the specified diets, the rabbits at the stage of thereproductive cycle were caged with male rabbit for matingand gestational 10 minutes. When rabbit is pregnant that itmay start rejecting advances mate the male rabbit. Thenumber of litters and the gender of pups were recorded.Pups were sexed by means of the ano-genital distance,which is longer in males14; this was confirmed in laterexaminations during pre weaning development. The datawere entered and analyses by SPSS software using t.testand the p-value less than 0.05 were considered as significant.
Results and Discussion
It was found that, in the first group mothers (Ca,Mg); all of the 10 rabbits became pregnant which delivered70 offspring. Their gender was 25 male 35.71% and 45female 64.29%. In the second group, Non (Ca, Mg); all ofthe10 rabbits became pregnant and delivered 70 offspring,their gender was 35 male 50% and 35 female 50% (Table2, Figure 2 ).
The sex ratio of female to male in the first group ofmothers (Ca, Mg) was 1.8:1, While this ratio in the secondgroup, Non (Ca, Mg) was1:1 respectively (Table 2).Thepercentage of the female offspring of mothers (Ca, Mg)64.29 % was higher than the female offspring in controlgroup 50% ( Figure 3 ).
The difference in the sex ratio between the first groupmothers (Ca, Mg) with control group were statisticallysignificant (Table 2).
The Total No of offspring in Figure 2 ,the first groupmothers (Ca, Mg) 70 was equal to total no of offspring thecontrol group 70 in Figure 4.
Table 1:
Estimated Minerals Requirements
Mouse Minerals** Amount Human (g/Kg) diet( Kg ) *(mg-ug/day)
Calcium 5.0 1000
Chloride 0.5 750
Magnesium 0.5 2-5
Phosphorus 3.0 700
Sodium 0.5 500
Potassium 2.0 2000
Iron 35.0 8
Manganese 10.0 2-5
Zinc 150.0 10-12
Iodine 150.0 150-150
Molybdenum 150.0 75-250(ug)
**adapted from Nutrient Requirements of NonhumanPrimates.
* Adapted from Lanus Micronutrient information Center,Oregon State Unit.
Table 2
Sex ratio in different groups of rabbits
Group Total no of No. of male % age of male No. of female % age female Sexoffspring offspring offspring offspring offspring ratio
Ca, Mg 70 25 35.71 45 64.29 1.8
Non Ca, Mg 70 35 50 35 50 1
July - September 2013 33 Journal of Pharmacy and Chemistry • Vol.7 • Issue.3
The first medical technique that can be used to selectfor sex is that of pre-natal diagnosis [PND] and abortion.To utilize this method, the pregnant woman must undergosome sort of prenatal testing, such as an amniocentesis,chorionic villus sampling or an ultrasound, which will allowthe doctor to determine the sex of the child, among otherthings. Once the woman has the information about thechild’s sex, she Nan obtains an abortion if the fetus is notof the desired sex. The use of PND and abortion in order toselect for sex sounds extreme, and indeed, as Edgar Dahlpoints out, it is not common for Westerners to utilize sucha technique. For example, a follow-up study of 578 patientshaving prenatal diagnosis at one Melbourne centre foundthat none of the women had a termination because of thesex of the fetus .Going through the traumatizing experienceof an abortion is usually seen as too high a price to pay fora child of a particular sex[18].
The second medical technique that can be used toselect for sex is that of pre-implantation genetic diagnosis[PGD] with in vitro fertilization [IVF]. With this technique,the embryos are screened for sex prior to being implantedinto the woman’s uterus, thereby eliminating the need tolater decide to terminate a pregnancy. PGD and IVF,
however, are very invasive and potentially physicallyharmful, requiring the woman to go through at least oneIVF cycle, which includes taking potent drugs to inducesuper-ovulation, extraction, fertilization and then testingand subsequent implantation of the embryos. Given theexpense of IVF treatment cycles (according to IVF Canadain 2005 it cost $5,500 for one cycle of IVF, not includingdrugs15.and, according to the same source, the drugsthemselves Nan cost approximately $3,000 for onecycle[19], it would be highly unlikely that it would be usedas a technique for sex selection alone. More likely, it couldbe used as a sex selection technique for those who arealready undergoing IVF for other medical reasons.
The last medical technique that can be used to selectfor sex is sperm sorting. New technologies allow sperm tobe sorted into those carrying X or Y chromosomes withvarying degrees of accuracy. To date, the most successfulway in which to sort sperm is flow cytometry, which hasbeen branded as the Micro Sort technique [20]. Sex selectionusing flow cytometry results from distinguishing betweenthe identifiable differences between the X and Ychromosomes, as the X chromosome is larger than the Y.The sorted sperm is then used to artificially inseminate the
Fig. 1 :Sex ratio of male to female in different groups of rabbits Fig. 2: Number of Male and female in different groups rabbits
Fig. 3: Percentage of offspring sex in different groups ofrabbits
Fig. 4: Number of offspring in different groups of rabbits

July - September 2013 34 Journal of Pharmacy and Chemistry • Vol.7 • Issue.3
woman. Studies have shown that the Micro Sort techniqueis more effective in selecting for girls, a success rate of91%, than for boys, with a success rate of only 76%.12Sperm sorting appears, then, to be the least invasive andleast expensive (at about $2,300US per cycle13) method ofselecting for sex.
There are also methods which use different foodcombinations and especial diets to maximum the chance ofhaving a baby with specific sex. The old believe is thateating salty, savory foods leads to delivering a male andsodium rich foods to a female. Some believes that the ratiosof the minerals sodium, potassium are important indetermination of baby gender. It was shown that pregnantfemale house mice maintained on a consistent low-fooddiet give birth to a lower proportion of males than do controlfemales fed ad labium[21].
ConclusionToday one of good known methods on sex constitution
is the preconception diet method. This method claims 80%accuracy and the theory is that by altering your diet toinclude and exclude certain food, the condition in thereproductive tract will be directly affected; increasing theodds of conceiving a particular sex it is also recommendedthat both mother and father go on the diet. This is alsoconsistent with the oriental philosophy that everything hasa yin or yang quality and the foods supplied in the femalediet, female and acid are all yin. The female diet is high insodium but low in salt and potassium, containing acidforming foods. The diets nutritional content is questionableand contains multiple warnings. The diet may influence theconditions within the reproductive tract and the outer barriersurrounding the ovum. Enabling only one of the two typesof sperm to penetrate the depending on which diet is adheredto. Langendon and Proctor first published ‘the preconceptionGender Diet `based on results reported [22]. The theory isthat by altering your diet to include and exclude certainfoods, the conditions in the reproductive tract will be directlyaffected, increasing the odds of conceiving a particular sex.This method under scrutiny claims of 80% accuracy basedon one clinical trial of only 260 women, the results werepublished in the international journal of Gynecology andObstetrics in 1980. The female diet is high in sodium butlow in salt and potassium, aontaining acid forming foods.The diets nutritional content is questionable and containsmultiple warnings.
It is recommended to seek the advice of medicalpractitioner before going on such a restrictive diet, andstay on the diet for no longer than three months. The dietmay influence the condition of the cervical mucus and withinthe reproductive tract and follicular fluid. Enabling onlyone of the two types of sperm to penetrate the egg dependingon which diet is adhered to. The aim of this study was toelevate relationship between minerals and sex ratio inrabbits.
AcknowledgementAuthors are thankful to the Dean, Veterinary college
of Bangalore, Bangalore for providing the necessaryfacilities to carry out the research work.
References1. Arshavskii I. A. 1956 .Dominanta beremennosti i
problema fiziologicheski polnotsennogoontogeneza..Uch. zap. Khar’-kovskogo gosudarstvennogo un-ta, , vol:68.
2. Klusmann A., Heinrich B., Stöpler H., Gärtner J.,Mayatepek E.,Von Kries R .A decreasing rate ofneural tube defects following the recommendationsfor periconceptional folic acid supplementation. ActaPaediatr.2005; 94:11;1538-42.Doi:10.1080/08035250500340396. PMID 16303691. Retrieved .2008. 01-20.
3. Stevenson RE., Allen WP., Pai GS., Best R., SeaverLH., Dean J., Thompson S . 2000.Decline inprevalence of neural tube defects in a high-risk regionof the United States. Pediatrics .106:4:677–83.doi;10.1542/peds.106.4.677. PMID 11015508.
4. Centers for Disease Control and Prevention (CDC).2008 .Use of supplements containing folic acid amongwomen of childbearing age—United States,”.MMWRMorb. Mortal. Wkly. Rep.2008:57: 1: 5–8. PMID 18185493.
5. Salem Jr. 2001. Mechanisms of action of docosahexaenoic acid in the nervous system. Lipids.36:945-59.
6. Mittwoch U.2005.Sex in mythology and history. ArqBras Endocrinol Metab .49:7-13.
7. Meikle D.B., 1995. Thornton M.W. Premating andgestational effects of maternal nutrition on secondarysex ratio in house mice. J. Reprod.Fertil . 105 : 193-196.
8. Chandraju S., Beirami A., Chidan Kumar C.S. 2011.Role of Sodium and Potassium ions in identificationof baby gender in High-sugar mammal’s .InternationalJournal of Pharmacy and Pharmaceutical Sciences. 3:4: 303-306.
9. Chandraju S., Beirami A., Chidan Kumar C.S. 2011.Effect of calcium and magnesium ions in identificationof baby in High-sugar mammals .Research inBiotechnology. 2:3:23-31 .
10. Chandraju S., Beirami A., Chidan Kumar C.S.2012.Effectof Sodium and Potassium ions inidentification of baby in High-sugar hamesters.Research in journal of pharmaceutical and clinicalresearch. 5: 1: 134-136.
11. Chandraju S., Beirami A., Chidan Kumar C.S.2011.Impact of calcium and magnesium ions inidentification of baby gender in High-sugar
July - September 2013 35 Journal of Pharmacy and Chemistry • Vol.7 • Issue.3
hamsters.Research injournal of pharmaceuticalsciences and research. 3:12:1619-1624.
12. Chandraju S., Beirami A., Chidan Kumar C.S.2012.Role of sodium and potassium ions inidentification of offspring gender in rats. Research inIOSR Journal of Pharmacy. 2: 6: 54-59.
13. Chandraju S., Beirami A., Chidan Kumar C.S. 2012.Impact of calcium and magnesium ions inidentification of offspring gender in high-Sugarrabbits. Research in Journal of Chemical andPharmaceutical Research.4 (1):719-725.
14. Chandraju S., Beirami A.,Chidan Kumar C.S.2013.Impact of sodium and potassium ions inidentification of offspring gender in hamsters.,ijpsr.4(4)1529-1533.
15. Chandraju S., Beirami A., Chidan Kumar C.S.2012.Impact of calcium and magnesium ions inidentification of offspring gender in rats,InternationalJournal of Pharmaceutical,chemical and biologicalSciences.3(1):19-24.
�
16. Chandraju S., Beirami A., Chidan Kumar C.S.2013.Impact of Sodium and Potassium ions inidentification of baby gender in High-sugarrabbits,research in biotechnology. 4(1):21-30.
17. In journal of pharmaceutical sciences and research.3(12)1619-1624.
18. Visaria P. 1967. The sex ratio of the population ofIndia and Pakistan and regional variations during 61.In: Bose A, editor Patterns of population change inIndia 61. Allied Publishers. 334–71.
19. Dahl E., Procreative Liberty.2003;The case forPreconception Sex Selection.7ReproductiveBioMedicine. 380.
20. Online: IVF Nanada From http://www.ivfcanada.com/services/fees/general_fee_schedule.cfm.
21. Steinbock., supra note 7 at 24.
22. Meikle D.B., Thornton M.W. 1995. Premating andgestational effects of maternal nutrition on secondarysex ratio in house mice. J. Reprod.Fertil . 105:193-196.

July - September 2013 36 Journal of Pharmacy and Chemistry • Vol.7 • Issue.3
incorporating pyrazole moiety in a single molecular framework with the hope to posses better antimicrobial activity.The required starting compound is ethyl-2-indole-3-carboxylate (III) was prepared by the Fischer- Indolesynthesis. These compounds underwent condensation withhydrazine hydrate in ethanol to furnish the Indole-3-carboxyhydrazide (IV).The reaction of hydrazides with differentacetophenones in methanol in the presence of acetic acid toform (V). These compounds treated with Vilsmeier-Haackreagent (DMF/POCl
3) to form title compounds (VIa-e).
ExperimentalMaterial & Methods
Melting points of all synthesized compounds weredetermined in open capillary tubes on an electro thermalapparatus and are uncorrected. The progress of the reactionand purity of the compounds was checked by TLC on silica
IntroductionThe indole moiety is probably the most widely spread
nitrogen heterocycle in nature. The biological importanceof iodole and pyrazole made them extremely attractive andrewarding research targets and has motivated countlessresearchers to study their synthesis and pharmacologicalproperties. Indole is the most beneficial heterocyclic nucleuswhich has gained prominence in medicinal chemistry dueto its diverse biological activities such as Antimicrobial [1-3], Anti-inflammatory [4-5], anticonvulsant [6], tranquilizer[7], CNS Depressant Activity [8] and pyrazole is also foundto possess pharmacological activities like antimicrobial [9-10], antitumor [11], analgesic [12]. It is therefore thoughtworthwhile to synthesize some new indole derivatives by
Synthesis and Biological Evaluation of Some 1-[(2-methyl-1h-indol-3-yl) Carbonyl]-3-substituted Phenyl-1h-pyrazole-4-
carbaldehyde Derivatives
BHARATH RATHNA KUMAR P1*, VISHNU VANDANA B1, SRAVANI M1, VENU PRIYA R2
SUBRAMANYAM S3 AND JAYAVEERA KN4
*1Department of Pharmaceutical Chemistry, JNTUA-Oil Technological Research Institute-JNTUA, Anantapur, A.P, India.2Department of Pharmaceutics, Balaji College of Pharmacy, Anantapur, A.P, India.
3Department of Pharmaceutical Chemistry, Bharat institute of technology (Pharmacy), Hyderabad, A.P, India.4Director, Research and Development, Adept Pharma and Bioscience Excellence, Hyderabad, A.P, India.
ABSTRACT
The present investigation is concerned with synthesis, characterization and antimicrobial screeningof 1-[(2-methyl-1H-indol-3-yl) carbonyl]-3-substituted phenyl-1H-pyrazole-4-carbaldehyde derivatives.When one biologically active molecule is linked to another, the resultant molecule generally hasincreased potency. Hence two pharmacophores, i.e. pyrazole ring and indole moiety are fused toobtain highly potent, more specific and less toxic agent. In the present study , synthesis of titlecompounds 1-[(2-methyl-1H-indol-3-yl)carbonyl] -3-substituted phenyl-1H-pyrazole-4-carbaldehydederivatives(VIa-e) by using Vilsmeier-Haack reagent (DMF/POCl
3). The facial synthesis of 1-[(2-
methyl-1H-indol-3-yl) carbonyl] -3-substituted phenyl-1H-pyrazole-4-carbaldehyde derivatives (VIa-e) has been achieved by the reaction of phenyl hydrazine (I) with a mixture of ethylacetoacetate(II)and glacial acetic acid to synthesize ethyl-2-indole-3-carboxylate(III) which on reaction with hydrazinehydrate in ethanol to form 2-methyl-1H-indole-3-carbohydrazide (IV) which on condensation withdifferent acetophenones in methanol in the presence of glacial acetic acid affords hydrazones (Va-e).The hydrazones (Va-e) on treatment with Vilsmeier-Haack reagent furnished 1-[(2-methyl -1H-indol-3-yl) carbonyl] -3- substituted phenyl -1H- pyrazole -4- carbaldehyde derivatives (VIa-e).
Key words: Indole, pyrazole, antimicrobial activity, Vilsmeier-Haack reagent.
*Address for correspondence:Email: [email protected]
ISSN 0973 – 9874
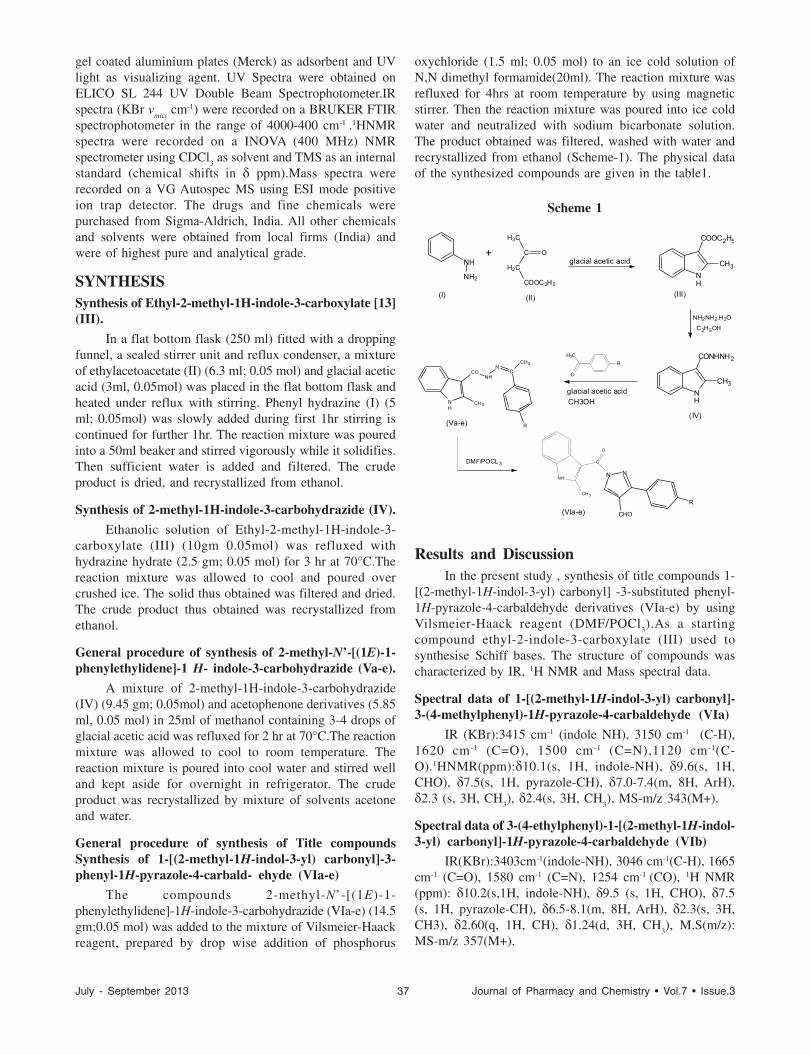
July - September 2013 37 Journal of Pharmacy and Chemistry • Vol.7 • Issue.3
gel coated aluminium plates (Merck) as adsorbent and UVlight as visualizing agent. UV Spectra were obtained onELICO SL 244 UV Double Beam Spectrophotometer.IRspectra (KBr v
max cm-1) were recorded on a BRUKER FTIR
spectrophotometer in the range of 4000-400 cm-1 .1HNMRspectra were recorded on a INOVA (400 MHz) NMRspectrometer using CDCl
3 as solvent and TMS as an internal
standard (chemical shifts in δ ppm).Mass spectra wererecorded on a VG Autospec MS using ESI mode positiveion trap detector. The drugs and fine chemicals werepurchased from Sigma-Aldrich, India. All other chemicalsand solvents were obtained from local firms (India) andwere of highest pure and analytical grade.
SYNTHESISSynthesis of Ethyl-2-methyl-1H-indole-3-carboxylate [13](III).
In a flat bottom flask (250 ml) fitted with a droppingfunnel, a sealed stirrer unit and reflux condenser, a mixtureof ethylacetoacetate (II) (6.3 ml; 0.05 mol) and glacial aceticacid (3ml, 0.05mol) was placed in the flat bottom flask andheated under reflux with stirring. Phenyl hydrazine (I) (5ml; 0.05mol) was slowly added during first 1hr stirring iscontinued for further 1hr. The reaction mixture was pouredinto a 50ml beaker and stirred vigorously while it solidifies.Then sufficient water is added and filtered. The crudeproduct is dried, and recrystallized from ethanol.
Synthesis of 2-methyl-1H-indole-3-carbohydrazide (IV).
Ethanolic solution of Ethyl-2-methyl-1H-indole-3-carboxylate (III) (10gm 0.05mol) was refluxed withhydrazine hydrate (2.5 gm; 0.05 mol) for 3 hr at 70°C.Thereaction mixture was allowed to cool and poured overcrushed ice. The solid thus obtained was filtered and dried.The crude product thus obtained was recrystallized fromethanol.
General procedure of synthesis of 2-methyl-N’-[(1E)-1-phenylethylidene]-1 H- indole-3-carbohydrazide (Va-e).
A mixture of 2-methyl-1H-indole-3-carbohydrazide(IV) (9.45 gm; 0.05mol) and acetophenone derivatives (5.85ml, 0.05 mol) in 25ml of methanol containing 3-4 drops ofglacial acetic acid was refluxed for 2 hr at 70°C.The reactionmixture was allowed to cool to room temperature. Thereaction mixture is poured into cool water and stirred welland kept aside for overnight in refrigerator. The crudeproduct was recrystallized by mixture of solvents acetoneand water.
General procedure of synthesis of Title compoundsSynthesis of 1-[(2-methyl-1H-indol-3-yl) carbonyl]-3-phenyl-1H-pyrazole-4-carbald- ehyde (VIa-e)
The compounds 2-methyl-N’-[(1E)-1-phenylethylidene]-1H-indole-3-carbohydrazide (VIa-e) (14.5gm;0.05 mol) was added to the mixture of Vilsmeier-Haackreagent, prepared by drop wise addition of phosphorus
oxychloride (1.5 ml; 0.05 mol) to an ice cold solution ofN,N dimethyl formamide(20ml). The reaction mixture wasrefluxed for 4hrs at room temperature by using magneticstirrer. Then the reaction mixture was poured into ice coldwater and neutralized with sodium bicarbonate solution.The product obtained was filtered, washed with water andrecrystallized from ethanol (Scheme-1). The physical dataof the synthesized compounds are given in the table1.
Scheme 1
Results and DiscussionIn the present study , synthesis of title compounds 1-
[(2-methyl-1H-indol-3-yl) carbonyl] -3-substituted phenyl-1H-pyrazole-4-carbaldehyde derivatives (VIa-e) by usingVilsmeier-Haack reagent (DMF/POCl
3).As a starting
compound ethyl-2-indole-3-carboxylate (III) used tosynthesise Schiff bases. The structure of compounds wascharacterized by IR, 1H NMR and Mass spectral data.
Spectral data of 1-[(2-methyl-1H-indol-3-yl) carbonyl]-3-(4-methylphenyl)-1H-pyrazole-4-carbaldehyde (VIa)
IR (KBr):3415 cm-1 (indole NH), 3150 cm-1 (C-H),1620 cm-1 (C=O), 1500 cm-1 (C=N),1120 cm-1(C-O).1HNMR(ppm):δ10.1(s, 1H, indole-NH), δ9.6(s, 1H,CHO), δ7.5(s, 1H, pyrazole-CH), δ7.0-7.4(m, 8H, ArH),δ2.3 (s, 3H, CH
3), δ2.4(s, 3H, CH
3), MS-m/z 343(M+).
Spectral data of 3-(4-ethylphenyl)-1-[(2-methyl-1H-indol-3-yl) carbonyl]-1H-pyrazole-4-carbaldehyde (VIb)
IR(KBr):3403cm-1(indole-NH), 3046 cm-1(C-H), 1665cm-1 (C=O), 1580 cm-1 (C=N), 1254 cm-1 (CO), 1H NMR(ppm): δ10.2(s,1H, indole-NH), δ9.5 (s, 1H, CHO), δ7.5(s, 1H, pyrazole-CH), δ6.5-8.1(m, 8H, ArH), δ2.3(s, 3H,CH3), δ2.60(q, 1H, CH), δ1.24(d, 3H, CH
3), M.S(m/z):
MS-m/z 357(M+).
NH
NH2
+glacial acetic acid
(I) (II)
NH
CH3
COOC2H5
NH2NH2.H2O
C2H5OH
NH
CH3
CONHNH2CH3
O
R
N
HCH3
CONH
NC
CH3
R
CH 3
C
N N
CHO
NH
O
R
DMF/POCL 3
CH3
C O
H2C
COOC2H5
glacial acetic acid
CH3OH
(VIa-e)
(III)
(IV)(Va-e)

July - September 2013 38 Journal of Pharmacy and Chemistry • Vol.7 • Issue.3
Spectral data of 3-(4-fluorophenyl)-1-[(2-methyl-1H-indol-3-yl) carbonyl]-1H-pyrazole-4-carbaldehyde (VIc)
IR(KBr):3420 cm-1 (indole-NH), 3040 cm-1 (C-H),1676 cm-1 (C=O), 1599 cm-1 (C=N), 574 cm-1 (C-F),1HNMR(ppm): δ 10.6 (s, 1H, indole-NH), δ 9.2 (s, 1H,CHO), δ7.8 (s, 1H, pyrazole-CH), δ 6.5-7.9(m, 8H, ArH),δ2.5(s, 3H, CH3), MS-m/z 347(M+).
Spectral data of 3-(4-chlorophenyl)-1-[(2-methyl-1H-indol-3-yl) carbonyl]-1H-pyrazole-4-carbaldehyde (VId)
IR (KBr):3405cm-1(indole-NH), 2924 cm-1 (C-H), 1702cm-1 (C=O),1594 cm-1 (C=N),1252 cm-1 (C-O), 1H NMR(ppm): δ10.3(s, 1H, indole-NH), δ9.2(s, 1H, CHO), δ8.3(s,1H, pyrazole-CH), δ6.5-8.8(m, 8H, ArH), δ 2.3(s, 3H, CH3),MS-m/z 364(M+).
Spectral data 3-(4-methoxyphenyl)-1-[(2-methyl-1H-indol-3-yl) carbonyl]-1H-pyrazole-4-carbaldehyde (VIe)
IR(KBr):3408cm-1(indoleNH), 3055cm-1 (C-H),1660cm-1 (C=N), 1273cm-1 (C-O), 1H NMR (ppm):δ11.2(s,1H, indole-NH), δ9.8(s, 1H, CHO), δ8.7(s, 1H, pyrazole-CH), δ 6.7-8.0(m, 8H, ArH), δ 3.8(s, 3H,OCH
3), MS-m/z
359(M+)
Antimicrobial ActivityThe antimicrobial activity of the synthesized
compounds was determined by cup-plate method [14]. Theorganisms selected for antibacterial activity were two gram-positive bacteria viz., B.Substilis, S.aureus and two gram-negative bacteria viz., E.coli, P.aeruginosia. Similarly theantifungal activity was carried out by using viz., Aspergillusniger and Candida albicans. The concentration of samplecompounds was 100µg/mL. Norfloxacin and Ketoconazolewere used as standard drugs for antibacterial and antifungalactivity respectively. Control test with solvents wereperformed for every assay but showed no inhibition of themicrobial growth. All the compounds synthesized haveshown potent to weak antibacterial activity. CompoundsVIc and VId shows good activity against S.aureus and E.coliwhen compared with standard. Compounds VIb and VIaand VIe showed moderate antibacterial activity whencompared to standard. The observed data on theantimicrobial activity of the compounds and control drugsare given in table-2
ConclusionThe two moieties i.e. indole and substituted pyrazole
moieties fused and screened for possible antimicrobial
Table-2
ANTIBACTERIAL AND ANTIFUNGAL ACTIVITY (VIa-e)
CompoundAntibacterial activity Antifungal activity
S.aureus B.subtilis E.coli P.aeruginosa A.niger C.albicans
VI a 18 19 14 17 17 13
VI b 15 16 16 20 16 12
VI c 24 22 21 20 14 17
VI d 20 21 17 14 24 21
VI e 18 18 13 10 11 10
Ciprofloxacin 25 23 29 25 —- —-
Ketconazole —- —- —- —- 29 26
(Zone of inhibition measured in mm)
Table-1
Physical Data of The Synthesized Compounds
Compound R M.F M.W M.P (oC) Yield (%)
VI a -CH3
C21
H17
N3O
2343 83-85 64
VI b -CH3CH
2C
22H
19N
3O
2357 68-70 55
VI c -F C20
H14
FN3O
2347 72-74 52
VI d -Cl C20
H14
ClN3O
2364 64-68 68
VI e -OCH3
C21
H17
N3O
3359 80-82 62

July - September 2013 39 Journal of Pharmacy and Chemistry • Vol.7 • Issue.3
studies, they showed mild to moderate antimicrobial activity,but none of the derivatives showed comparatively goodantimicrobial activity in comparison with the standard drugs.The above results establish the fact that pyrazole substitutedderivatives can be a potential source for exploitation insearch of new generation of antibiotics. It may beworthwhile to explore the possibility in this area by fusingother heterocyclic moieties and increase the potency of thesynthesized compounds.
AcknowledgementThe authors are thankful to Prof.Dr.N.Devanna,
Director, Oil Technological Research Institute, J.N.T.U.A,Anantapur for the encouragement and facilities provided tocarry out this research work.
References[1] Sivosh M, Emerich E, Alfred P, Andreas S, Sigurd E,
Ute M, Euro J Med Chem, 2006,41(2), 176.
[2] Guru S Gadaginamath, Bhovi M G, Megadi V B,Ind.J.of.Het.Chem., 2004,14,07-10 [3]Prem P Y,Prasoon G A K C, Shukla P K, Rakesh M, Bioorg &Med Chemistry, 2005,13(5),1497.
�
[4] Sondhi S M, Jain S, Rani R and Kumar A, Indian JChem, 2007,46 (B), 1848.
[5] Purohit M G, Veeresha Sharma A R, Ind. J.of. Het.Chem, 2007, 13, 275-276.
[6] Guru S Gadaginamath, Shashikant R Pujar,Ind.J.of.Het.Chem.,2002,11,207- 210
[7] Guru S Gadaginamath, Rajesh R. Kavali,Ind.J.of.Het.Chem., 1999,8,217-220.
[8] Gupta R Pathak, Vijay V N, Ind.J.of.Het.Chem.,2001,11,109-110.
[9] Karale B K, Kale S B, Narwade S K, Ind. J.of. Het.Chem, 2007, 16, 275-278.
[10] Ahmad M Farag, Science direct- Bioorganic andmedicinal chemistry letters, 2008, 16, 1863-1865.
[11] Kevin M Foote, Science direct- Bioorganic andmedicinal chemistry letters, 2008, 15, 505-510.
[12] Manohar Kulkarni, Manjunath Ghate, RavirajKusanur,Ind.J.of.Het. Chem., 2004,13,201-204.
[13] Guru S Gadaginamath , Patil S A, Donawade D S,Ind.J.of Het.Chem., 2004,14, 93.
[14] Black J G, Microbiology Principles and Exploration,4th
edition, prentice-Hall, New Delhi,1991,163.

July - September 2013 40 Journal of Pharmacy and Chemistry • Vol.7 • Issue.3
*Address for correspondence:Email: [email protected]
ISSN 0973 – 9874
IntroductionFluoride is an essential constituent for both humans
and animals depending on its concentration in drinkingwater. The presence of fluoride in drinking water, withinpermissible limits is beneficial for the production andmaintenance of healthy bones and teeth, while excessiveintake of fluoride causes dental or skeletal fluorosis [1-2].Higher level of fluoride in groundwater is a world-wideproblem, which includes various countries from Africa andAsia as well as USA [3]. Fluoride is one of the mostabundant constituent occurring in groundwater in India andcreates a major problem in safe drinking water supply. Theconcentration of fluoride in drinking water is as high as 30mg l-1 in some places. Excess fluoride in drinking water isprevalent in 150 districts of 17 States in India [4]. Accordingto the Department of Drinking Water Supply under Ministryof Rural Development, India, rural drinking water supply
is mainly dependent on groundwater (85%). Hence, itbecomes necessary to bring down the fluoride concentrationwithin permissible limit of 1.5 mg l-1 according to IndianStandards. The limit varies among countries and the age ofpeople exposed. World Health Organization (WHO) has seta limit range between 0.5 and 1 mg l-1 [5]. According to USstandard it is between 0.6 and 0.9 mg l-1.
Chitosan is an interesting and abundantpolysaccharide, found in a wide range of organismsincluding bacteria and fungi, but commercially mostcommonly extracted from shellfish processing waste. Thestructure of chitosan is shown in Fig.1a. It is generallyconsidered to be, the most abundant biopolymer in theecosphere after cellulose which it resembles structurally. Anumber of publications have been reported mainly onalumina [4,8-10], calcium [6,11-13], clays [14-19] andbiopolymer [20-22] however, to the best of our knowledgechitosan, has not been studied so far towards its propertiesfor defluoridation of water. The present investigation deals
Chitosan: Naturally Occurring Biopolymer forDefluroidation of Water
KAMESWARA RAO O1*, RAMACHANDRAIAH C2 AND VENKATESWARLU P3
1Department of Chemistry, Gokula Krishna College of Engineering, Sullurpet, SPSR Nellore District, A.P., India, e-mail: [email protected]
2Department of Chemistry, srikalahasteeswara institute of technology (SKIT), Srikalahasti, Chittoor(Dist) , A.P., India , e-mail: [email protected]
3Department of Chemistry, S.V. University, Tirupati, Chittoor (Dist), A.P., India,e-mail: [email protected]
ABSTRACT
Present investigation deals with removal of fluoride from drinking water using low cost naturallyavailable biopolymer adsorbent chitosan. The effects of various physico-chemical parameters such aspH, adsorbent dose, initial fluoride concentration and the presence of interfering co-ions on adsorptionof fluoride were studied. It was observed that the uptake of fluoride was higher at self pH (pH≅5).The equilibrium adsorption data were fitted well for both Langmuir isotherm model and Freundlichisotherm model. It was observed that co-ions such as sodium nitrate, sodium chloride, sodiumsulfate, ferrous sulfate and copper sulfate have positive effect on the uptake of fluoride from drinkingwater while sodium carbonate and bicarbonate has a negative effect on adsorption of fluoride. Thecomparison of uptake of fluoride in distilled water and field water shows slightly higher uptake offluoride in distilled water. This may be because of latter contains different types co-ions and higherpH of the field water.
Keywords: Removal of fluoride; chitosan; biopolymer; defluoridation.
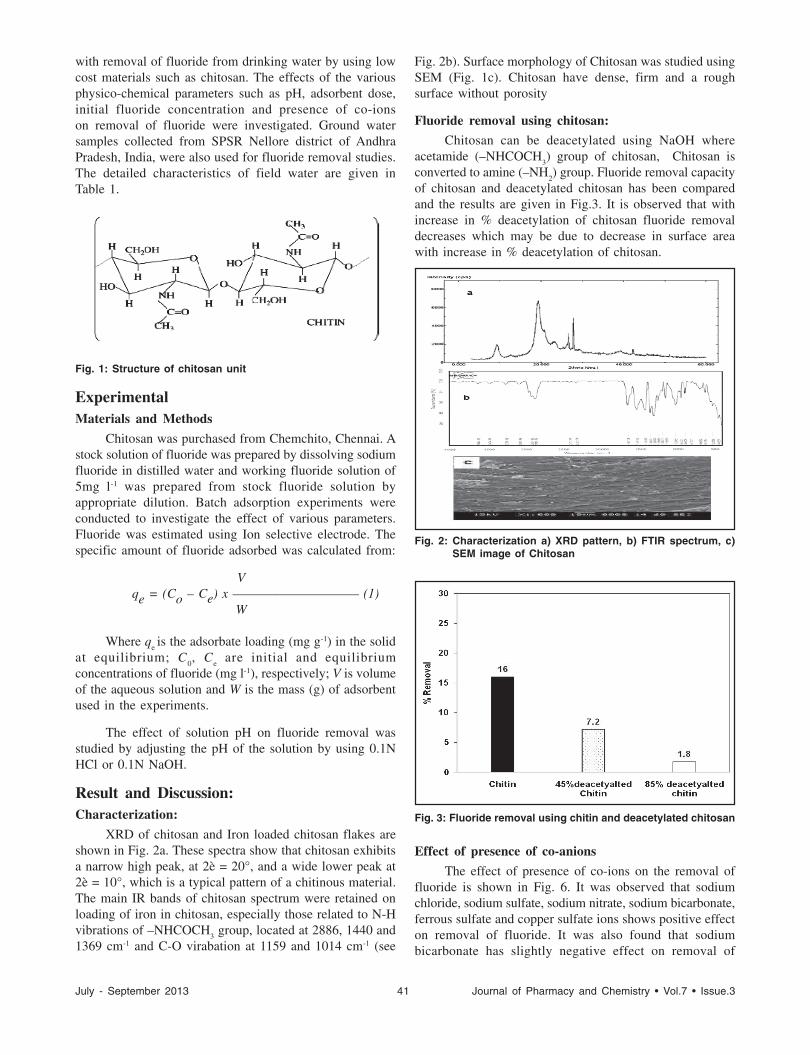
July - September 2013 41 Journal of Pharmacy and Chemistry • Vol.7 • Issue.3
with removal of fluoride from drinking water by using lowcost materials such as chitosan. The effects of the variousphysico-chemical parameters such as pH, adsorbent dose,initial fluoride concentration and presence of co-ionson removal of fluoride were investigated. Ground watersamples collected from SPSR Nellore district of AndhraPradesh, India, were also used for fluoride removal studies.The detailed characteristics of field water are given inTable 1.
Fig. 1: Structure of chitosan unit
ExperimentalMaterials and Methods
Chitosan was purchased from Chemchito, Chennai. Astock solution of fluoride was prepared by dissolving sodiumfluoride in distilled water and working fluoride solution of5mg l-1 was prepared from stock fluoride solution byappropriate dilution. Batch adsorption experiments wereconducted to investigate the effect of various parameters.Fluoride was estimated using Ion selective electrode. Thespecific amount of fluoride adsorbed was calculated from:
Vqe = (Co – Ce) x ––––––––––––––––––– (1)
W
Where qe is the adsorbate loading (mg g-1) in the solid
at equilibrium; C0, C
e are initial and equilibrium
concentrations of fluoride (mg l-1), respectively; V is volumeof the aqueous solution and W is the mass (g) of adsorbentused in the experiments.
The effect of solution pH on fluoride removal wasstudied by adjusting the pH of the solution by using 0.1NHCl or 0.1N NaOH.
Result and Discussion:Characterization:
XRD of chitosan and Iron loaded chitosan flakes areshown in Fig. 2a. These spectra show that chitosan exhibitsa narrow high peak, at 2è = 20°, and a wide lower peak at2è = 10°, which is a typical pattern of a chitinous material.The main IR bands of chitosan spectrum were retained onloading of iron in chitosan, especially those related to N-Hvibrations of –NHCOCH
3 group, located at 2886, 1440 and
1369 cm-1 and C-O virabation at 1159 and 1014 cm-1 (see
Fig. 2b). Surface morphology of Chitosan was studied usingSEM (Fig. 1c). Chitosan have dense, firm and a roughsurface without porosity
Fluoride removal using chitosan:
Chitosan can be deacetylated using NaOH whereacetamide (–NHCOCH
3) group of chitosan, Chitosan is
converted to amine (–NH2) group. Fluoride removal capacity
of chitosan and deacetylated chitosan has been comparedand the results are given in Fig.3. It is observed that withincrease in % deacetylation of chitosan fluoride removaldecreases which may be due to decrease in surface areawith increase in % deacetylation of chitosan.
Fig. 2: Characterization a) XRD pattern, b) FTIR spectrum, c)SEM image of Chitosan
Fig. 3: Fluoride removal using chitin and deacetylated chitosan
Effect of presence of co-anions
The effect of presence of co-ions on the removal offluoride is shown in Fig. 6. It was observed that sodiumchloride, sodium sulfate, sodium nitrate, sodium bicarbonate,ferrous sulfate and copper sulfate ions shows positive effecton removal of fluoride. It was also found that sodiumbicarbonate has slightly negative effect on removal of

July - September 2013 42 Journal of Pharmacy and Chemistry • Vol.7 • Issue.3
fluoride. This may be because of the change in pH as wellas the competing effect of this co-ion. The pH of the fluoridesolution were 7.07, 6.58 7.06, 3.28, 4.17, 9.07, 10.84,respectively for sodium chloride, sodium sulfate, sodiumnitrate, ferrous sulfate, copper sulfate, sodium bicarbonatesodium and sodium carbonate while the pH of the fluoridesolution was 7.29 without addition of co-ions. This indicatesthat addition of some of co-ions resulted in decrease in pHof fluoride solution except sodium carbonate andbicarbonate. From our experiments on effect of pH it wasobserved that the adsorption of fluoride was higher in thepH range of 5-7. Overall it was observed that the presenceof cations and many of the anions enhance the uptake offluoride from aqueous solution indicating fluoride specificsorption behavior.
Fig. 6: Effect of the presence of co-existing ions
Equilibrium isotherm studies
Equilibrium studies were carried out to determine themaximum fluoride removal capacity and equilibriumconstant on chitosan. It was observed that adsorptioncapacity reaches an equilibrium value beyond which therewas negligible change in the residual fluoride concentration.The distribution of fluoride between the liquid phase andthe solid phase is a measure of the position of equilibriumin the adsorption process and can be expressed by the
Freundlich and Langmuir equations [19, 20]. These twomodels are widely used, the former being purely empiricaland the latter assumes that maximum adsorption occurswhen the surface is covered by the adsorbate. The value ofK
F is 0.195 mg g-1 and n is 0.849 for Freundlich isotherm.
The values of Langmuir parameters, qmax
and K are 0.275mg g-1 and 0.107 l mg-1, respectively. Value of r < 1represents favorable adsorption. The r-value for the initialconcentration of 5 mg l 1 was found to be 0.66. The valueobtained shows that the system is favorable for adsorptionof fluoride.
Comparison of fluoride uptake in distilled water andfield water
The uptake of fluoride from field water samples(Marripadu) collected from Andhra Pradesh, India by usingchitosan is shown in Fig. 7. This Figure also illustratesremoval of fluoride from distilled water. It was observedthat the percentage removal of fluoride in distilled water isslightly higher as compared to field water sample. Thedetailed physico-chemical characteristics of field watersamples before treatment are given in Table 1. Table 1show that field water has TDS of = 477 mg l-1 which isindicative of presence of other ions in addition to fluoride.This could be due to two reasons i) pH of the field watersamples is alkaline and ii) it contains different types of co-ions. These ions compete with adsorption of fluoride onchitin and reduce the adsorption of fluoride. In section 3.4it has been discussed that in the alkaline pH uptake offluoride is low as compared to acidic pH. Therefore, overallremoval of fluoride in field water is low as compared todistilled water.
Fig. 7: Comparison of adsorption of fluoride in distilled waterand field water
ConclusionA naturally occurring bio-sorbent such as chitosan is
found to be a suitable adsorbent for removal of fluoridefrom drinking water. The adsorption of fluoride on thesurface of the adsorbent is observed to dependent mainlyon the pH of the solution, initial concentration of fluorideand presence of co-anions. It was observed that in thepresence of cations and most of anions (except sodium
Fig. 4: Effect of pH

July - September 2013 43 Journal of Pharmacy and Chemistry • Vol.7 • Issue.3
carbonate and bicarbonate) have a positive effect on theadsorption of fluoride. The adsorption of fluoride at acidicpH (pH =5) was high as compared to alkaline pH. Thepercentage removal of fluoride in distilled water was higherthan field water; this may be because latter contains differenttypes of ions and is having alkaline pH.
References1. S. Ayoob and A. K. Gupta, Fluoride in drinking water:
a review on the status and stress effects, Crit.Rev. Environ. Sci. Tech., 36(2006), 433–487.
2. S. Meenakshi and R.C. Maheshwari, Fluoride indrinking water and its removal, J. Hazard. Mater.137(2006), 456-463.
3. S. M. Maliyekkal, A. K. Sharma, Ligy Philip,Manganese-oxide-coated alumina: A promising sorbentfor defluoridation of water, Journal of water Research40(2006)3496-3506.
4. WHO, Guidelines for Drinking-Water Quality[Electronic Resource]: Incorporating FirstAddendum, vol. 1, Recommendations, 2006, pp. 375–377.
5. E.J. Reardon, Y.Wang, Limestone reactor for fluorideremoval from wastewater, Environ. Sci. Technol. 34(2000) 3247–3253.
6. M. Sarkar, A. Banerjee, P.P. Pramanick, A.R. Sarkar,Use of laterite for the removal of fluoride fromcontaminated drinking water, J. Colloid Interf. 302(2006) 432–441.
7. H. Lounici, L. Addour, D. Belhocine, H. Grib, S.Nicolas, N. Bariou, N. Mameri, Study of a newtechnique for fluoride removal from water,Desalination 114 (1997) 241–251.
8. S. Ghorai and K. K. Pant, Equilibrium, kinetics andbreakthrough studies for adsorption of fluoride onactivated alumina, Sep. Purif. Technol. 42 (2005) 265–271.
9. N. Das, P. Pattanaik, R. Das, Defluoridation ofdrinking water using activated titanium rich bauxite,J. Colloid Interf. Sci. 292 (2005) 1–10.
10. B.D. Turner, P. Binning, S. L. S. Stipp, Fluorideremoval by calcite: Evidence for fluorite precipitationand surface adsorption, Environ. Sci. Technol. 39(2005) 9561-9568.
11. M. Islam, R.K. Patel Evaluation of removal efficiencyof fluoride from aqueous solution using quick lime,J. Hazard. Mater. 143 (2007) 303–310.
12. R. Adaco, A. Garea, A. Irabien, Fluoride recovery ina fluidized bed: crystallization of calciumfluoride on silica sand, Ind. Eng. Chem. Res. 45 (2006)796-802.
13. C. Zevenbergen, L. P. Van Reeuwijk, G. Frapporti, R.J. Louws and R. D Schuiling, A simple method fordefluoridation of drinking water at village level byadsorption on and soil in Kenya, Sci. Total Environ.188 (1996) 225-232.
14. P.M.H Kau, D. W. Smith, P. Binning, P., Fluorideretention by kaolin clay, J Contamination Hydrol. 28(1997) 267-288.
15. M. Srimurali, A. Pragathi and J. Karthikeyan, A studyon removal of fluorides from drinking water byadsorption onto low-cost materials, Environ. Pollut.99 (1998) 285-289.
16. X. Fan, D. J. Parker, M. D. Smith, Adsorption kineticsof fluoride on low cost aterials, Water Res. 37 (2003)4929–4937.
17. S. Chidambaram, A. L. Ramanathan, S. Vasudevan,Fluoride removal studies in water using naturalmaterials. Water SA. 29 (2003) 339-343.
18. A.K. Yadav, C.P. Kaushik, A. K. Haritash, A. Kansal,R. Neetu, Defluoridation of groundwater using brickpowder as an adsorbent, J. Hazard. Mater. 128 (2006)289-293.
19. W. Ma, Yo. Fie-Qun, M. Han and R. wang,Characteristics of equilibrium, kinetics studies foradsorption of fluoride on magnetic-chitosan particle,J. Hazard. Mater. 143(2007), 296-302.
20. N. Viswanathan, S. Meenakshi, Enhanced fluoridesorption using La(III) incorporated carboxylatedchitosan beads , J. Colloid Interf. Sci. 322 (2008)375–383.
21. N. Viswanathan, S. Meenakshi, Selective sorption offluoride using Fe(III) loaded carboxylated chitosanbeads, J. Fluorine Chem. 129 (2008) 503–509.
22. N. Viswanathan, S. Meenakshi, Enhanced fluoridesorption using La(III) incorporated carboxylatedchitosan beads, J. Colloid Interf. Sci. 322 (2008) 375–383.
�

July - September 2013 44 Journal of Pharmacy and Chemistry • Vol.7 • Issue.3
GENERAL REQUIREMENTS: Journal of Pharmacy andChemistry (ISSN 0973-9874) is a quarterly Journal, Indexingin CAS(Coden:JPCOCM) which publishes original researchwork that contributes significantly to further the scientificknowledge in Pharmaceutical Sciences (PharmaceuticalTechnology, Pharmaceutics, Biopharmaceutics,Pharmacokinetics, Pharmaceutical Chemistry, ComputationalChemistry and Molecular Drug Design, Pharmacognosy andPhytochemistry, Pharmacology, Pharmaceutical Analysis,Pharmacy Practice, Clinical and Hospital Pharmacy, CellBiology, Genomics and Proteomics, Pharmacogenomics, StemCell Research, Vaccines & Cera, Bioinformatics andBiotechnology of Pharmaceutical Interest) and in ChemicalSciences (Inorganic, Soil, Forensic, Analytical, Nano,Environmental, Polymer, Physical, Agricultural, Medicinal,Biochemistry, Organic, Computational, Food, Pesticides etc).Manuscripts are accepted for consideration by Journal ofPharmacy and Chemistry on the condition that they representoriginal material, have not been published previously, are notbeing considered for publication elsewhere, and have beenapproved by each author. Review articles, research papers,short communication and letters to the editor may be submittedfor publication.
SUBMISSION OF MANUSCRIPTS: Typewrittenmanuscripts prepared using MS Word should be submitted intriplicate and RW-CD to Prof. Dr. K.N Jayaveera, Editor-in-Chief of Journal of Pharmacy and Chemistry , Plot No 22,Vidyut Nagar, Ananthapur- 515 001, Andhra Pradesh, India.e-mail: [email protected]
All components of the manuscript must appear within a singleelectronic file: references, figure legends and tables mustappear in the body of the manuscript.
TYPING INSTRUCTION: The following detailedinstructions are necessary to allow direct reproduction of themanuscript for rapid publishing. If instructions are not followed,the manuscript will be returned for retyping. The followingtypefaces, in 12 points size, are preferred: Times Roman.
GENERAL FORMAT: The typing area must be exactly 6 5/8” (168 mm) wide by 9 7/8” (250 mm) long. Justify marginsleft and right (block format). The entire typing area of eachpage must be filled, leaving no wasted space. Text should bedouble-spaced, special care should be taken to insure thatsymbols, superscripts and subscripts are legible and do notoverlap onto lines above or below. Make sure text lines areequidistant.
TITLE: On the first page of the manuscript, start title 1” (25mm) down from top text margin. Type title in all capitalletters, centred on the width of the typing area and single-spaced if more than one line is required. The title should bebrief, descriptive and have all words spelled out. Double-space, then type the author(s) name(s), single-spaced if morethan one line is required. Double-space, than type author(s)
INSTRUCTION TO AUTHORSaddress(es), single-spaced, capitalizing first letters of mainwords. Quadruple-space before Abstract.
ABSTRACT: Centre, type and underline abstract heading,capitalizing the first letter. A double-space should separate theheading from the abstract text. Indent abstract textapproximately 1/2” (13 mm) from both left and right margins.The abstract should be intelligible to the reader withoutreference to the body of the paper and be suitable forreproduction by abstracting services. Introduction to the text(without a heading) should being four spaces below theabstract using full margins.
KEY WORDS: Three or more key words must be providedby authors for indexing of their article. Key words will belisted directly below the Abstract. Abbreviated forms ofchemical compounds are not acceptable. Spell out entirely,using the official nomenclature. Example: L-dihydroxyphenylalanine (L-DOPA)
MAJOR HEADINGS: Papers must include the majorheadings: Introduction, Methods, Results, Discussion,Acknowledgments and References. Capitalize first letter,underline, and centre headings on width of typing area.
TABLES/FIGURES: Incorporate tables and/or figures (B &W) with their legends into the main body of text.
REFERENCES: Referneces should be referred to a number[1] in the text and be listed according to this numbering at theend of the paper. Only papers and books that have beenpublished or in press may be cited; unpublished manuscriptsor manuscripts submitted to a journal but which have not beenaccepted may not be cited.
The references shoulld comprise the following informationand in the given order and with given punctuation as given inthe example below: Author name (s), Initials (s), PublicationTitle, Page Number, Year of Publication.
Standard Journal Article:
[1] Bhattacharyya D, Pandit S, Mukherjee R, Das N, SurTK. Indian J Physiol Pharmacol 2003; 47:435.
[2] Skottova N, Krecman V. Physiol Res 1998; 47:1.
Book:
[1] Ghosh MN. Fundamentals of Experimental Pharmacology,2nd ed. Calcutta Scientific Book Agency, 1984:154.
Proofs will be sent to the corresponding author. These shouldbe returned as quickly as possible.
The facts and view in the article will be of the authors andthey will be totally responsible for authenticity, validityand originality etc. the authors should give an undertakingwhile submitting the paper that the manuscripts submittedto journal have not been published and have not beensimultaneously submitted or published elsewhere andmanuscripts are their original work.
www.jpc.stfindia.comwww.stfindia.com
This Quarterly Journal is Printed, Published, Owned and Edited by Dr. K.N. Jayaveera, Published from Science-Tech Foundation,Plot No.22, Door No. 12/3/925, Vidyut Nagar, Anantapur - 515 001. Send your queries at www.stfindia.com and Printed at Vipla ComputerServices (Designers & Multi Colour Offset Printers) # 2-3-720/1A/22/40, Ganga Nagar, Opp. Govt. Primary School, Zinda Tilismat Road,Golnaka, Amberpet, Hyderabad - 500 013. Ph. 040-27426910, 27427078.