journal of plant development sciencesjpds.co.in/wp-content/uploads/2020/06/vol.-125.pdfsoil organic...
TRANSCRIPT

Journal of Plant Development Sciences (An International Monthly Refereed Research Journal)
Volume 12 Number 5 May 2020
Contents
RESEARCH ARTICLES
Assessment of carbon stock and future potential of carbon sequestration of Soor Sarovar bird Sanctuary,
Keethm-UP
—Ashutosh Kumar Pathak, J.V. Sharma and Priyanka Tiwari--------------------------------------------- 261-268
Preclinical study of healing effect of methanolic extract of Coriandrum sativum in wounds of an animal model
of Diabetes
—Flor Rivera-Barbosa, Reyna Hernández-Ramos, Alejandro Hernández-Herrera, Irais Castillo-
Maldonado, Mario-Alberto Rivera-Guillén, Rubén García-Garza, Dealmy Delgadillo-Guzmán, Agustina
Ramírez-Moreno, María-Del-Carmen Vega-Menchaca, Sergio-Everardo Velázquez-Gauna, Luis-
Benjamín Serrano-Gallardo and David Pedroza-Escobar ---------------------------------------------------- 269-275
Seed germination behaviour of Cannabis sativa L. under different temperature regimes
—Birendra Kumar, S. Zaidi, Vagmi Singh, K.T. Venkatesh, Govind Ram, A.K. Gupta, Narendra Kumar
and A. Samad ---------------------------------------------------------------------------------------------------------- 277-281
Performance of intercrops in hybrid maize under North Central Plateau Zone of Odisha
—T.R. Mohanty, M. Ray, S.K. Sahoo, K.C. Sahoo, N. Mishra and H.K. Patro -------------------------- 283-287
Effect of integrated nutrient management on growth and development of mustard (Brassica juncea L.) in irrigated condition of upper Gangetic plains
—Sauhard Dubey, M.Z. Siddiqui, Saurabh Rana, Gaurav Shukla, Dharmendra Singh and Ashish Nath
Pandey ------------------------------------------------------------------------------------------------------------------- 289-295
Utilization potential of agricultural information sources
—K. Pradhan, Avishek Saha, Biman Maity and Keshav Ram ----------------------------------------------- 297-301
Plant growth promoting activities of indigenous strains of Trichoderma viride and Trichoderma harzianum
used as seed treatment in groundnut
—Shweta Mishra, Arwind Kurre and R.K.S. Tiwari ---------------------------------------------------------- 303-307
Evaluation of soybean cultivars for resistance to Alternaria leaf spot caused by Alternaria alternata
—Raj Kumar Fagodiya, Amit Trivedi, B.L. Fagodia and R.S. Ratnoo ------------------------------------ 309-312
Ethno medicinal knowledge of spices and their uses by tribal community of Rajasthan, India
—Deepa Indoria and S.R. Verma ---------------------------------------------------------------------------------- 313-316
Effect of soaking and placement of seed on germination and seedling emergence in Litchi
—Narayan Lal, E.S. Marboh, A.K. Gupta, Abhay Kumar and Vishal Nath ------------------------------ 317-320
Performance of parents and hybrids for yield and yield attributing traits in tomato (Solanum lycopersicum L.)
—Kiran Kumar, Dhananjay Sharma, Jitendra Singh and S.S. Paikra ------------------------------------ 321-326

*Corresponding Author
________________________________________________ Journal of Plant Development Sciences Vol. 12(5): 261-268. 2020
ASSESSMENT OF CARBON STOCK AND FUTURE POTENTIAL OF CARBON
SEQUESTRATION OF SOOR SAROVAR BIRD SANCTUARY,KEETHM-UP
Ashutosh Kumar Pathak*, J.V.Sharmaa and Priyanka Tiwari
a
*Department of Natural Resources, TERI School of Advanced Studies, Vasant Kunj,
New Delhi, India aForestry & Biodiversity Division, The Energy and Resources Institute (TERI)Habitat Center, -New
Delhi, India
Email: [email protected]
Received-04.05.2020, Revised-25.05.2020
Abstract:Soor Sarovar Bird Sanctuary is a small human-made forest with a lake on the outskirts of Agra, India. The study estimates terrestrial and aquatic carbon. The total carbon stocks estimated at 1.31 million tons bears a social cost of carbon value of `21 million. The aquatic carbon stock density was found to be significantly higher than the terrestrial stocks. The
study outcomes are usable for maximising ecosystem services in the broader context of sustainability. The research method estimating carbon stocks is relevant to national policies and applicable to similar forests. An optimistic scenario suggests that the sanctuary area by 2030 can sequester per unit area carbon which is 12times the target of achieving our ambitious target. An established theoretical and empirical correlation of increased carbon stocks with biodiversity and other ecosystem services are suggestive of such small urban peripheral sanctuaries playing a critical role in mitigating the climate change.
Keywords: Soor Sarovar Bird Sanctuary, Aquatic carbon, Terrestrial carbon, Carbon stocks,Anthropogenic
INTRODUCTION
orests are both source and sink of greenhouse
gases. The impact of Agriculture, Forestry and
Other Land Use (AFOLU) sector to anthropogenic
emission is just close to a quarter of the
anthropogenic total (Smith et al. 2014). Annual
greenhouse gas change from land use and land-use
change activities during the first decade of this
century accounted for approximately 4.3-5.5 GtCo2
eq/yr, amounting to 9-11 per cent of total
anthropocentric gas emissions globally (Smith et al. 2014).
Indian forests stock 7 Gigatons of carbon out of 650
Gigatons estimated globally(ISFR 2017). Contrary to
the declining global trend of forests(FAO 2018),
various Indian proactive conservation policies and
legislation seem to have stalled and reversed the
deforestation(MOEF&CC 2015). The claim,
however, has been contested based on the resolving
potential of remote sensing data(Puyravaud et al.
2010)(Davidar et al. 2010)(Ravindranath et al. 2014).
Loss of forests through diversion, encroachment, and
degradation was a specific problem highlighted in The Forest Commission Report (MOEF 2006). The
issue of forest degradation thus needs to be
addressed.
None the less, the National Forest Policy also
acknowledges and calls for special attention against
forest degradation. (MOEF & Forests 1998). Forest
Survey of India (FSI) since 2011 has published
reports on carbon stock as a separate chapter. The
India State of Forest Report (ISFR) now includes
state and district wise information on carbon stock
and change(ISFR 2017). Sustainability requires that these mesoscale efforts mainly through the satellite
imagery are supplemented and correlated with local site-specific microscale environmental parameters.
Such quantification becomes critical in the context of
our ambitious Nationally Determined Contribution
(NDC) goal of creating additional carbon sink of 2.5
to 3.0 billion tons of CO2 equivalent through
additional forest and tree cover by 2030 (MOEF&CC
2015).
Forest pathways contribute to ten of the seventeen
sustainable development goals (FAO 2018).
Country’s commitment to Sustainable Development
Goals (SDGs) focuses on enhancing the forest ecosystem services through new technological
advancements. It has been recognized that the
tangible benefits like firewood, timber, and non-
timber forest Products only form an abysmally low
proportion of all Ecosystem services(MOEF&CC
2018).
The present study at Soor Sarovar Bird Sanctuary is
set in the context of evaluating the total ecosystem
services for sustainable development.
Study Area
Soor Sarovar Bird Sanctuary (SSBS), Keetham, Agra
is an important protected area in the state of Uttar Pradesh. Unique for scenic beauty, religio-cultural
heritage and abundant fauna and flora, it has been
named after Soordas - the great blind poet of Hindi
literature, whose place of birth is said to be within
the boundary of this sanctuary. SSBS lies between
latitude N27º 14' 4″ and N27º 31' 51″ and longitude
E77º 49' 38″ and E77º 52' 40″. The total area of Soor
Sarovar bird sanctuary is 7.99 km2. It consists of a
core of 3.96 km2, 0.478km2 for tourism and a buffer
zone of 3.55 km2(Uttar Pradesh Forest Department
2010). Figure 1 shows the key plan of the study area.
F
RESEARCH ARTICLE

262 ASHUTOSH KUMAR PATHAK, J.V.SHARMA AND PRIYANKA TIWARI
Fig. 1: Key Pan of Soor Sarovar Bird Sanctuary
The Sanctuary meets the criteria laid out by the
International Bird Association (IBA). Ministry of
Environment, Forest and Climate Change,
Government of India has also identified Soor Sarovar
Bird Sanctuary’s Keetham lake as important Wetland visited by migratory birds (MOEF 2007). The
Sanctuary supports three vulnerable bird species,
namely, Sarus Crane (Antigone Antigone), Lesser
Adjutant (Leptoptilosjavanicus) and Greater Spotted
Eagle (Aquilaclanga) listed in the IUCN Red List
Category. The artificial lake with more than 90 %
reservoir storage capacity has been categorised as
near favourable specifically for the habitat of birds.
The Sanctuary has also been categorised as a high
threat area on account of Biological Resource use
and Residential and commercial development (IBA 2019).
Anthropogenic pressures:The study area is set in
Agra district for which Census 2011 records a human
density population at 1084 inhabitants per square
Km. This places Agra at rank 41st amongst 640
Indian districts(The Registrar General & Census
Commissioner 2011). High-density habitations
surround the Sanctuary except on the east side
through which the river Yamuna flows.
Being upstream of a significant population settlement
of Agra hydrologically and on the way to National
Capital Region, Delhi makes region around Soor Sarovar Bird Sanctuary area an ecological hot spot.
Rapid planned and unplanned development at the
regional level is causing unprecedented
anthropogenic pressures all around.
METHODOLOGY
The study area was acquainted by wandering around
using measuring tools including manual compass,
GPS, clinometer, a tape of various sizes, survey
Chain and flags. Google My Maps mobile application was used as the main tool of site
contextualization. Google Earth Pro application was
used to crosscheck and get details about the
location’s altitude and coordinates.
The methodology of measuring carbon and related
parameters were developed based on subject
knowledgebase for measuring carbon considering the
local condition. The level of precision required was
kept as provided for in the Forest Survey of India’s
publication The Manual of Instructions for Field
Inventory 2002 (FSI 2002) and ensured that the mean
value of carbon stock estimation falls within ± 10% of carbon stock at the 95% confidence interval.
The study area was delimited adopting the boundary
specified for SSB Sanctuary by the Forest
Department. A categorised study area cover map
based on canopy density and forest type was
prepared by integrating information available from
Google Mymaps, archival records, available forest
management plans and ground survey, taking 25 m x
25 m as a unit of observation. The data was plotted
using 3D Map tool of the MS Excel spreadsheet
application. Five terrestrial classes could be mapped: (i) very dense forest (in more protected central areas
near water body with broad leave plantation having
tree canopy density of > 70%) ii) moderately dense
(Other thorny forest areas, with tree canopy density
between 40%-70%) iii) open forest (Tree Canopy
density between 10%-40% iv) scrub and v) barren
(Areas with no or very little vegetation). Carbon
stock in a given stratum was computed from its
carbon density (t/ha) and area (ha). The aquatic areas
within have been classified by water depth as Deep
(>2.5m), mid-deep (1.5m-2.5m), Shallow (<1.5m)
and bank (the silty areas around the waters with seasonal grass or nascent vegetation).
Terrestrial Carbon:The Intergovernmental Panel on
Climate Change(IPCC 2003) specifies five carbon
pools viz., above ground biomass, below-ground
biomass, litter, woody debris and soil organic matter
except that aboveground woody debris component
was assumed to be insignificant because of regular
removals by the people around the study for
fuelwood.
Sampling design:Eighty-four samples distributed
across the study proportionate to the strata areas were selected, all trees with more than 10 mm diameter at
breast height and with a least 2 meters’ height were
marked. The sample geolocation, tree species and
their Diameter at Breast Height (DBH) and heights
were recorded as per the procedure of measuring
detailed in the Measuring Carbon Stock Manual of
the World Agroforestry Center (Hairiah et al. 2010).

JOURNAL OF PLANT DEVELOPMENT SCIENCES VOL. 12(5) 263
The samples were rectangular /circles of a size of
approximately .01 ha area. Above ground tree
biomass was calculated using available volume
equations (Picard, Saint-André & Henry 2012)(FAO
2018), a biomass expansion factor of 3.4 as per the
Good Practice Guidance for Land Use, Land Use Change and Forestry (IPCC 2003) and wood density
databank of FAO’s (FAO 2018) was taken.
The below-ground biomass was calculated based on
the root: shoot factor (RSR) of 0.27 as per IPCC
Good Practice Guidelines (IPCC 2003).
Soil Organic Carbon: Forty-two monoliths (30 cm x
30 cm x 30 cm) representing all five strata were
excavated, soil from three depths (0-10, 10-20 and
20-30 cm) were stored separately. The samples were
mixed to form three composite samples for each
forest stratum which were analysed in the laboratory.
The soil was air-dried and passed through 250-micron sieve after removing gravels. Soil organic
carbon was estimated by Walkley-Black wet
digestion method (IS : 2720 (Part XXII) 1972-
(Reaffirmed 2010)). The soil bulk dry density was
estimated using excavation method which involved
digging out a small hole for taking out soil sample
and measuring the volume of the hole by pouring
water from a calibrated measurement jar into a
hermetically sealed and tested polythene bag filling
the hole. The soil taken out was oven dried (at
105°C) and weighed as per soil lab modules. (https://labmodules.soilweb.ca/soil-compaction-bulk-
density/). Carbon density was calculated using men
carbon percentage for each stratum and their bulk
values (Hairiah et al. 2010).
Aquatic carbon Estimation
Carbon Pools: Aquatic carbon was estimated by
totaling i) Alluvium carbon deposits ii) Lake waters
in the form for both dissolved and particulate carbon
and iii) Carbon contained in Fish and water birds.
Soil/ Alluvium carbon Estimation: Levels for all
segments of and around the lake were worked out
using google earth pro imagery. Data analysis of the segments depths was conducted and plotted on the
3D map to demarcate lake stratum. While sample on
the lake bank and shallow waters could be obtained
using a 4 meter PVC pipe which was vertically
driven and created a space for lowering and working
the SPT hammer for sample collections; two such
pipes were hermetically sealed to obtain samples
from deep and mid-deep water stratum.
For alluvium sampling in waters, the boat, with the
help of google my map mobile geolocation, was
taken to the sample coordinates and fixed to be lake bottom with the help of three ballies. The
hermetically sealed pipe was then used to create a
vertical working space for lowering and working of
the SPT hammer for obtaining the alluvium sample.
The rope for pounding the hammer for sample
collection was marked at 0.5 m, 1.0 m, 1.5 meter and
2.0 m using red cotton ribbons. Water from collected
alluvium from the hammer was drained and about
200 gm of alluvium was collected in the pre-marked
sample bags.
Alluvium soil samples from six locations in each of
the four aquatic strata were collected using a
Standard Penetration Test (SPT) hammer sampler (IS : 9640 1980). The loose alluvium consisting mostly
of silt and fine sand and did not allow undisturbed
sampling.
Three soil samples representing five alluvium depths
of each stratum were prepared. Sixty samples
representing the four strata at five depths were lab
tested. The carbon for the 2.5 m sediment column
was calculated by multiplying the mean carbon
proportion reported for each stratum for the
representative depth segment. Bulk dry density of
sample as calculated in the laboratory was used in
calculations. Carbon Estimation of lake waters: As per the USGS
publication Methods for Assessing Carbon Stocks,
Carbon Sequestration, and Greenhouse-Gas Fluxes
of Aquatic Ecosystems the lake water carbon is
contained as Dissolved Inorganic carbon(DIC),
Dissolved Organic carbon (DOC), and Particulate
Inorganic carbon (POC) (Zhu, et al. 2010).
The estimation for dissolved carbon Dioxide in the
lake was based on the Soor Sarovar’s mean water pH
and alkalinity values collected and analyzed between
September 2014 to July 2015 at The Academy of Environmental Biology, India. (Gopal, Verma &
Tripathi 2015).
Carbon dioxide values were calculated for the given
pH and Alkalinity following method elucidated in the
Southern Regional Aquaculture Center Publication
468 carbon Dioxide in Fish Ponds(John Hargreaves
and Martin Brunson 1996). Charts for various water
alkalinities showing the variation of free Carbon
Dioxide with pond water pH have been provided.
Step 1 involved drawing a straight line up for the
measured pH to the curved line representing the total
alkalinity value of the pond. Another straight line extended (Step 2) to the left-hand axis indicated the
free Carbon Dioxide.
Calculations for dissolved and particulate organic
matter in the lake water was determined based on the
reported values in similar physiochemical parameters
and climate of pond waters at Central Inland
Fisheries Research Institute, Karnal by (Singhal,
Swarn Deep & Davies 1986).
The fish and water birds are also an essential part of
the aquatic system and their biomass estimation has
been based on the archives data of the Uttar Pradesh Forest department and through local information
gathering. Water bird and fish biomass has been
converted to carbon by multiplying the carbon
fraction @ 18% as per the details noted from(Emsley
1988). Due weights for residence at SSBS has been
accounted for migratory birds.

264 ASHUTOSH KUMAR PATHAK, J.V.SHARMA AND PRIYANKA TIWARI
RESULTS AND DISCUSSION
Fig. 2:Visualises the study area coverage categories.
Figure-2: Study Area Land Cover
Strata Areas:Table 1 provides areas for each strata in ha.
Table 1. Stratificationareas at soorsarovar bird sanctuary
Soor Sarovar Bird Sanctuary Area 799 ha
Terrestrial 563 ha Aquatic 236 ha
Barren Scrub Open Mod
Dense
Very
Dense
Bank Shallow Modeep Deep
21 105 169 247 17 26 77 66 67
The figure 3 compares the estimated areas of land categories at Soor Sarovar Bird Sanctuary.
Legend:T1_BAR: Terrestrial Barren areas;T2_Scrub
areas;T3_OF: Terrestrial Open forest areas; T4_MD Terrestrial
moderately dense forest areas; T5_VD:Terrestrial Very Dense
forest areas
W1_Bank: Aquatic lake bank areas; W2_Shallow: Aquatic
shallow depth water areas; W3_MD: Aquatic lake mid-depth
water areas;W4_Deep: Aquatic lake deep depth water areas
Fig. 3:Soorsarovar bird sanctuary area pattern
While the Moderately Dense forest with an area of
247 ha was estimated to form the maximum of the
terrestrial forest, shallow waters (77 ha) were the
largest size of the aquatic areas. The Very Dense
forest (17 ha) and Bank (26 ha) areas respectively
formed the least of the terrestrial and aquatic areas.
Carbon Densities: The respective carbon densities
represented as t/ha were estimated as shown in the
figure 4.
71%29%
AREAS
Terrestrial
Aquatic

JOURNAL OF PLANT DEVELOPMENT SCIENCES VOL. 12(5) 265
Fig. 4: Carbon stock densities in various terrestrial and aquatic categories
The MidDeep and Deep Aquatic strata with more
than 450 t/ha carbon stock were estimated way ahead
of the very dense terrestrial carbon density. The
highest carbon density in the terrestrial forest was
calculated as 110 t/ha. The areas categorised as Barren and Bank had the least density for terrestrial
and aquatic categories. It is worth noting that the
carbon density even in the least of an aquatic
category was 1.3x more than the maximum terrestrial
carbon density of the very dense forest.
The average aquatic carbon density was estimated
more than three times the average terrestrial density. Figure 5 shows the carbon stocks at SSBS.
Fig. 5:Charts showing carbon stocks at Soor Sarovar Bird Sanctuary
The carbon and their values were calculated as per
the social cost of carbon dioxide of $86 per tCo2 as
the social cost of carbon for India [27] in each of the
strata is depicted in the figure 6.
Fig. 6:Social cost of carbon of Soor Sarovar Bird Sanctuary

266 ASHUTOSH KUMAR PATHAK, J.V.SHARMA AND PRIYANKA TIWARI
Comparing results with other similar Forest type in
ISFR 2017: According to Champion and Seth
classification, the SSBS falls under Northern
Tropical Dry Deciduous Forests (subgroups 5 B:
5/E1 and 5/E2) and Northern Tropical Thorn Forest
(sub-group 6B) [28]. The figure 7 compares the
carbon densities at SSBS in comparison with the
carbon Density estimated in the ISFR Report 2017 in
comparative forest type.
Fig. 7:Carbon stock (tonnesC / hectare) as per ISFR 2017in the comparative forest types and as estimated for
SSBS
The average above ground biomass carbon densities
at Soor Sarovar Bird Sanctuary for the Very Dense
Forest were estimated markedly higher as compared
with national figures for Tropical Dry Deciduous
Forests. The statistics for Moderately Dense Forests
were slightly higher. Nevertheless, the above ground
carbon Statistics for this protected bird sanctuary are
much higher than the national average for Tropical
Thorn Forest. The statistics for Soil Organic carbon were estimated
to be lower than both the Tropical Dry deciduous and
Tropical Dry Evergreen Forests. It may be due to
Bird Sanctuary's recent origin and indicate a high
potential for carbon sequestration.
The Above Ground Biomass carbon density for
SSBS's Scrub forest category of 13.72 t/ha is
comparable to the national statistics of Tropical
Thorn Forests Very Dense Forest category which is
13.30 t/ha.
The national statistics for aquatic areas are not published in the ISFR. However, the reported
average carbon density of 110 g of carbon per kg of
soil for tropical aquatic sediments [29] is an order of
magnitude higher than the estimated carbon average
of 4.79 grams of carbon per kilogram of soil for
SSBS.
Limitations and opportunities: The size of grid
25mX25m limits the precision of the demarcation of
strata and study area boundary, but the deviations in
the measurements occur on the either (plus or minus)
side and are thus noncumulative. The innovative
deployment of the commonly used Excel spreadsheet
application, however, liberates the process from the
steep learning curve of deploying an expensive
professional GIS software. It also makes the study
process very transparent which is an essential
requirement of NDC implementation.
The study, synchronous with the national policies integrates new mobile geolocation and simple excel
map and visualisation techniques into a practical
microscale measurement solution. The methodology
evolved is simple enough to be clearly understood
and implemented by the field staff for its replication
in other areas. Geolocation with mobile and
visualisation through spreadsheet technologies are
expected to simplify the process further and
democratise the difficult research process to bring it
within reach of an ordinary forester.
Soil Degradation: Besides a rainfall range of 300 to 600 mm, the human actions and landforms are
considered as critical parameters of predictability of
land desertification [27]. The results showing a vast
range of carbon densities and their dramatic spatial
variation at Soor Sarovar Bird Sanctuary corroborate
this. The temporal process of a barren area creation
due to recent anthropogenic disturbance was also
established through historical imagery as shown in
the figure 8.

JOURNAL OF PLANT DEVELOPMENT SCIENCES VOL. 12(5) 267
Fig. 8: Temporal process of barren area creation at Soor Sarovar Bird Sanctuary
Other important ecosystem services, conflict of
Interests and Synergy: Ecosystem Services are the
various benefits that human beings get from functioning ecosystems [28]. Other essential
ecosystem services (not measured) besides measured
carbon stock at SSBS are enumerated below.
1.Biodiversity (Bird Habitat)
2.Water Provision
3.Weather & Climate Change Mitigation
4.Ecotourism
5.Meaningful Employment
6.Cultural Heritage
7.Erosion and Sedimentation Control
There is strong theoretical and empirical evidence
that these ecosystem services support each other. Globally there is a generally positive relationship
between carbon stocks and biodiversity (Hicks et al.
2014).
Conclusion and further research needs: The
relationships amongst these services are complex.
However, as study visualisation and results at SSBS
indicate, lesser anthropogenic disturbance and better
forest management are likely to enhance all the
services. Forest Management Plan for SSBS,
however, points to a conflict in the provision of
water to Mathura Refinery which requires deeper water for enhancing the reservoir capacity and the
birdlife which thrives on shallower waters. Synergy
in the two can be thought by increasing the lake area
by extending it to the newly emerged barren areas
and appropriate peripheral plantations (which as
indicated by historical imagery is a product of
anthropogenic pressure of forest degradation and
topological disturbances of nearby constructions). It
is likely to enhance the biodiversity and carbon stock
as also all other ecosystem services. The
recommendation, however, would be to go for a test
case first as complex relationships in nature sometimes defy common sense (Lewis Michael,
2003).
A scenario assuming conversion of barren areas into
shallow waters and upgrading of 30% forest types to
the next level up along with an increase of 5% in
aquatic carbon densities up to 2030 would result in
adding up of 22,500 t (15%) of carbon within the
sanctuary area. This is about 12 times the national
average required for meeting a target of 3 billion tons
of additional carbon dioxide equivalent storage.
However, only 5000 t (4%) carbon would be added in a scenario involving the routine approach resulting
in the status quo of the barren areas and modest
growth of 10% upgradation in the forest stratum. A
situation where the random urban growth is not stopped, barren areas are likely to increase further, is
the worst possible scenario.
ACKNOWLEDGEMENT
The authors thank the Chief wildlife warden of U.P.
Forest for granting permission for research and all
Officers and staff of Forest Department at Soor
Sarovar Bird Sanctuary for sharing archival data,
useful suggestions and insights.
REFERENCES
Davidar et al., PSS,PCMPA(2010). 'Assessing the
extent and causes of forest degradation in India:
Where do we stand?', Biological Conservation, pp.
2927-2944.
Emsley, J.(1988).The Elements, 3rd edn, Clarendon
Press, Oxford,
<https://web.archive.org/web/20181218074109/http:/
/web2.airmail.net/uthman/elements_of_body.html>.
FAO(2018).Appendix 1 - List of wood densities for
tree species from tropical America, Africa, and Asia., viewed March March 2018,
<http://www.fao.org/docrep/w4095e/w4095e0c.htm>
.
FAO(2018). ' The State of the World’s Forests 2018
- Forest pathways to sustainable development. ',
FAO, Rome.
FSI(2002).The Manual of Instructions for field
Inventory , Forest Survey of India, Dehradun.
Gopal, K., Verma, H.O.and Tripathi, S.(2015).
'Water Quality Monitoring of Sur Sarovar (Keetham)
Lake, Agra (Uttar Pradesh)', J. Ecophysiol. Occup.
Hlth., vol 15, no. (3 & 4), pp. 95–103.
Hairiah, K., Dewi, S., Agus, F., Velarde, S.,
Ekadinata, A., Rahayu, S.and Noordwijk,
V.(2010).Measuring Carbon Stocks Across land use
Systems: A Manual, The World Agroforestry Centre
(ICRAF), Bogor city, West Java Province ,
Indonesia.
Hicks, C., Woroniecki, S., Fancourt, M., Bieri, M.,
Garcia, R.H., Trumper, K.and Mant,
R.(2014).The relationship between biodiversity,
carbon storage and the provision of other ecosystem
services: Critical Review for the Forestry
268 ASHUTOSH KUMAR PATHAK, J.V.SHARMA AND PRIYANKA TIWARI
Component of the International Climate Fund.,
Cambridge, UK.
IBA(2019). 'Sur Sarovar Bird Sanctuary IN135'.
IPCC(2003). 'Good Practice Guidance for Land Use,
Land Use Change and Forestry', Guidelines, Institute
for Global Environmental Strategies (IGES), Japan, Kanagawa.
IS : 2720 (Part XXII) 1972- (Reaffirmed 2010), IS :
2720 (Part XXII ) - Methods Of Test For Soils -Part
XXII Determination Of Organic Matter, Bureau Of
Indian Standards.
IS : 9640 1980, Indian Standard Specifications For
Split Spoon Sampler, Bureau of Indian Standards,
New Delhi, India, Incorporating Amendment Nos. 1
& 2.
ISFR(2017). 'India State Of Forest Report 2017',
MOEFCC, GOI, New Delhi.
John, Hargreaves and Martin, Brunson(1996). 'Carbon Dioxide in Fish Ponds', Publication No. 468,
Southern Regional Acquaculture Center, Mississippi.
Lok_Sabha(2014). 'Q. No. 4975, Dated:
13/08/2014', New Delhi.
MOEF, GOIMOEAF(2006). 'Forest Commission
Report 2006', Government of India, Ministry of
Environment and Forests, New Delhi.
MOEF(2007). 'Conservation of Wetlands in India: A
Profile (approach and Guidelines)', Conservation
Didision-1, Ministry of Environment & Forests
Government of India, New Delhi. MOEF and CC(2015).India First Biennial Update
Report to the United Nations Framework Convention
on Climate Change.
MOEF and CC(2018).Draft National Forest Policy,
2018, viewed 30 May 2018,
<http://www.moef.nic.in/sites/default/files/Draft%20
National%20Forest%20Policy%2C%202018.pdf>.
MOEF and Forests, MOEA(1998). 'National Forest
Policy 1988', Department of Environment, Forests &
Wildlife), MOEF, New Delhi.
Picard, Saint-André and Henry(2012).Manual for
building tree volume and biomass allometric equations: from field measurement to prediction,
Food and Agricultural Organization of the United
Nations, Rome, and Centre de Coopération
Internationale en Recherche Agronomique pour le
Développement, Montpellier.
Puyravaud et al., J-PD&WFL(2010). 'Cryptic
destruction of India’s native forests', Conservation
Letters, vol 3 (2010), pp. 390–394.
Ravindranath, N.H., Murthy, I.K., Joshi,
Upgupta, Mehra, S.and Srivastava, N.(2014).
'Forest area estimation and reporting:implications for conservation, management and REDD+', CURRENT
SCIENCE, vol 106, no. 9, pp. 1201-1206,
<https://www.currentscience.ac.in/Volumes/106/09/1
201.pdf>.
Singhal, R.N., Swarn Deep and Davies,
R.W.(1986). 'The physico-chemical environment and
the plankton of managed ponds', Proceedings of
Indian Academy Of Science ( Animal Sciences) , Vol.,
95, No.3.
Smith, P., Bustamante, Ahammad, H., Clark, H.,
Dong, H., Haberl, R., Harper, J., House, M.,
Jafari, O., Masera, C., Ravindranath, N.H., Rice,
C.W., Robledo, A., Romanovskaya, F., Sperling,
F.and Tubiello, F.(2014). 'Agriculture, Forestry and
Other Land Use (AFOLU). In: Climate Change
2014: Mitigation of Climate Change. Contribution of
e [Edenhofer, O., R.', Cambridge University Press,
Cambridge, United.
The Registrar General and Census
Commissioner, I.(2011).Census 2011, viewed 16
September 2018, <http://www.census2011.co.in/>.
Uttar Pradesh Forest Department(2010). 'Soor
Sarovar Bird Sanctuary Management Plan (Part- I & II) for 2010-11 to 2019-2020.', Forest Department,
Government of Uttar Pradesh., Agra.
Zhu, Z.E., Bergamaschi, Brian, Bernknopf,
Richard, Clow, David, Dye, Dennis, Faulkner,
Stephen, Forney, William, Gleason, Robert,
Hawbaker, Todd, Liu, Jinxun, Liu, Shuguang,
Prisley, Stephen, Reed, Bradley, Reeves, Matthew,
Rollins, Matthew, Sleeter, Benjamin, Sohl, Terry,
Stackpoole, Sarah, Stehman, Stephen, Striegl,
Robert, Wein, Anne and and Zhiliang, Z.(2010).
'A Method for Assessing Carbon Stocks,Carbon
Sequestration, and Greenhouse-Gas Fluxes in Ecosystems of the United States Under Present
Conditions and Future Scenarios', U.S. Geological
Survey, Reston.

*Corresponding Author
________________________________________________ Journal of Plant Development Sciences Vol. 12(5): 269-275. 2020
PRECLINICAL STUDY OF HEALING EFFECT OF METHANOLIC EXTRACT OF
CORIANDRUM SATIVUM IN WOUNDS OF AN ANIMAL MODEL OF DIABETES
Flor Rivera-Barbosa1, Reyna Hernández-Ramos
1, Alejandro Hernández-Herrera
1, Irais
Castillo-Maldonado1, Mario-Alberto Rivera-Guillén
1, Rubén García-Garza
2, Dealmy
Delgadillo-Guzmán3, Agustina Ramírez-Moreno
4, María-del-Carmen Vega-Menchaca
5, Sergio-
Everardo Velázquez-Gauna6, Luis-Benjamín Serrano-Gallardo
1 and David Pedroza-Escobar
1*
1Department of Biochemistry, Biomedical Research Centre, Faculty of Medicine, Universidad
Autonoma de Coahuila Unidad Torreon, Torreon, Mexico 2Department of Histology, Faculty of Medicine, Universidad Autonoma de Coahuila Unidad Torreon,
Torreon, Mexico 3Department of Pharmacology, Faculty of Medicine, Universidad Autonoma de Coahuila Unidad
Torreon, Torreon, Mexico 4Faculty of Biological Sciences, Universidad Autonoma de Coahuila Unidad Torreon,
Torreon, Mexico 5Faculty of Chemical Sciences, Universidad Juarez del Estado de Durango, Gomez Palacio, Mexico
6Department of Embryology, Faculty of Medicine, Universidad Autonoma de Coahuila Unidad
Torreon, Torreon, Mexico
Email: [email protected],[email protected]
Received-18.05.2020, Revised-31.05.2020
Abstract: People with Diabetes Mellitus often use medicinal plants to treat this metabolic disease that frequently reports complications, such as impaired wound healing. Coriandrum sativum has a wide range of healing properties: antibiotics, antifungals, hypoglycemics and antioxidants to name a few. However, no studies have been conducted on its potential as a wound healing agent. So, the objective of this work was to determine the wound healing effect of the methanolic extract of C. sativum seeds in reducing the closing time of surgical lesions in Long Evans black rats induced to a diabetes model with
alloxane. Material and methods: Toxicity tests were performed using the Artemia salina model and phytochemical test were conducted to determine the composition of the extract. The Diabetes model was induced with alloxane and wound was done with a biopsy punch. During the experiment, 6 groups of 5 rats each were included and the diameter of the wound was measured at days 0, 7, 14 and 21. At the end of the observation period, the animals were sacrificed and histological analysis of the wound skin was performed. Results: The alloxane treated group (diabetes model) had delayed wound healing. The group treated with the extract at a concentration of 2000 µg/mL presented wound closure on day 16 and histological characteristics similar to normal tissue of the control group. Conclusions: C. sativum methanolic extract accelerated wound healing, which was confirmed by histological analysis.
Keywords: Diabetes Mellitus, Coriandrum sativum, Scarring effect, Hyperglycemia, Healing effect, Wound healing
INTRODUCTION
he skin is the outer tissue covering and the largest organ of the body with important
protective and immunological functions (Abbas et
al., 2018). It acts as a protective barrier that isolates
the organism from the external environment,
protecting against pathogens and water loss, and
helping to keep its structures intact, it also works as a
communication system with the environment and is
one of the main sensory organs, it contains nerve
endings that act as touch, pressure, pain and
temperature receptors (Rojas-Espinosa, 2017). The
skin is made up of three layers: 1) epidermis, 2) dermis, and 3) hypodermis. The epidermis varies in
thickness according to its location from 30 μm in the
eyelids to 1.5mm in the palms of the hands with an
average of 0.4mm. The epidermis is divided into 5
strata: corneum, lucidum, granulosum, spinosum, and
basale (Gantwerker & Hom, 2011). The most
abundant cells in the epidermis are the keratinocytes
that reach a proportion of 95% located mainly in the
stratum basale (Regueiro-González et al., 2011). The dermis is the layer underlying the epidermis, it
comprised mainly lymphatic and blood vessels,
follicles, apocrine and eccrine glands. The deeper
layer, the hipodermis contains conjunctive tissue,
lymphatic and blood vessels, adipocytes, and
cutaneous nerves (Zomer & Trentin, 2017). Any
damage to the skin regardless of deepness requires
wound healing to repair the damage (Pazyar, et al.,
2014). Wound healing is a progressive dynamic
process that is divided into four overlapping but
distinct phases: 1) hemostasis, 2) inflammation, 3) proliferation, and 4) remodeling. This process
involves the participation of different molecules and
cells types (Nguyen & Soulika, 2019).
The hemostasis phase occurs in the first moments
after damage to the skin. During this phase clot
forms to prevent further blood loss through an active
T
RESEARCH ARTICLE

270 DAVID PEDROZA-ESCOBAR et al.
participation of platelets, vasoactive substances, and
an infiltration of leukocytes, red blood cells,
keratinocytes, fibroblasts, and plasma proteins
(Ridiandries et al., 2018). The inflammation phase
occurs in the first minutes and until the wound is
resolved. During this phase there is an infiltration of neutrophils, macrophages and lymphocytes to the site
of the damage and they are mainly responsible for
eliminating cellular debris and microorganisms that
may be present (Boniakowski et al., 2017).
The proliferation phase consists mainly of damage
repairing through reepithelization and extracellular
matrix production. Both stages are characterized by
the proliferation and infiltration of keratinocytes and
stem cells to repopulate the stratum basale (Eming et
al., 2014). Angiogenesis, the formation of new blood
vessels from pre-existing blood vessels, is important
during the phases of inflammation and proliferation (Okonkwo & DiPietro, 2017). Finally, the
remodeling phase is characterized by a
reorganization of the collagen matrix. The failure of
these phases promotes pathologic wound healing
such as the development of chronic non-healing
wounds. Multiple intrinsic and extrinsic factors affect
this process, especially those affecting the immune
system such as medication use or disease (Cohen et
al., 2016).
Poor wound healing is associated with the most
common metabolic disease: Diabetes mellitus (Schmidt, 2018). It is not clear to what extent
impaired healing is due to direct effects of
hyperglycemia, insulin deficiency, angiogenesis
alteration or an excess of inflammation (Guthrie,
2004). For instance, inflammation affects the wound
from progressing to the proliferation phase leading to
chronic non-healing wounds (Kautzky-Willer et al.,
2016). On the other hand, the most common clinical
indication of impaired wound healing associated with
diabetes is the diabetic skin ulcer where inadequate
local angiogenesis is considered a very likely
contributor (Eming et al., 2014). Diabetic skin ulcer are painful sores with disintegration of dermal tissue
mainly epidermis and dermis.
Wound closure is greatly delayed in diabetes and it is
associated to impaired angiogenesis and the chronic
presence of inflammation as previously stated. Due
to the fact that diabetes affects a high proportion of
the world population; besides the fact that, poor
wound healing is associated with diabetes; and
considering the fact that, coriander seeds are
attributed medicinal properties against diabetes and
wound healing (Laribi et al., 2015; Muniandy et al., 2019; Silva & Domingues, 2017; Wei et al., 2019).
The aim of this study was to evaluate the healing
effect of methanolic extract of Coriandrum sativum
seeds in wounds of an animal model of diabetes.
MATERIALS AND METHODS
Biological material
All protocols used in this study were approved by the
Bioethics committee of the Faculty of Medicine,
Universidad Autonoma de Coahuila Unidad Torreon
(reference number CB071017).
Thirty Long Evans black male rats with an age of 12
weeks old, weighing 200-250 grams were used. The animals were divided into six groups of five rats
each. The animals were housed in acrylic rat cages
using sawdust as bedding with stainless steel grill
covers. Water and food were offered ad libitum. The
environmental parameters were monitored by means
of a temperature and relative humidity meter. The
photoperiod was 12 hours of light and 12 hours of
dark.
The samples of Coriander (Coriandrum sativum L.)
seeds were obtained from a local market in the city
of Torreon, Mexico. An amount of 100 g was washed
with water and grindered in a manual mill. The extract was prepared with the macerated infusion of
methanol at room temperature (25+ 2 °C) in a 1:4
ratio for 24 h with constant stirring at a speed of 60
rpm. Subsequently the supernatant was filtered on
Whatman No. 40 filter paper and the solvent was
evaporated under reduced pressure on a rotary
evaporator (Buchi R-210) at a temperature below
60°C and the extract was subjected to complete
desiccation in a hot air oven at 40°C. Subsequently, it
was collected with a stainless-steel spatula and stored
in an amber glass bottle at -20 °C; and dilutions at 10, 100 and 1000 µg/mL were prepared.
Biotoxicity assay with the Artemia salina model
To evaluate the biotoxicity of the extract, the in vivo
biotoxicity assay with the Artemia salina model was
used. The Artemia salina was cultivated by placing
0.01 g of Artemia salina eggs in artificial seawater
(40 g of sea salt in one liter of distilled water) with
0.06 g of yeast extract. This mixture was placed in an
artemia chamber at a temperature of 28°C for 48
hours for the eggs to hatch. Once the eggs of Artemia
salina hatched, a standard curve of the extract to be
evaluated at a concentration of 0, 1, 10, 100, 250, 500, 1000, 5000 μg/mL was prepared in enough
seawater for 10 mL. A sample of Artemia salina
(N=10) was added in triplicate in test tubes for each
of the concentrations under study. Potassium
dichromate was used at 1000 μg/mL in seawater as a
positive control. During this assay, the samples were
incubated at 28°C for 24 hours; subsequently, live
and dead Artemia salina larvae were quantified, and
the lethal dose 50% (LD50) was estimated by Probit
regression.
Phytochemical tests These tests were qualitative to identify the main
chemical groups of organic compounds present in
plant extracts. The principle of these tests based on
chemical reactions between the functional chemical
groups of organic compounds present in plant
extracts and chemical reagents that led to the
formation of precipitates or colored substances. For

JOURNAL OF PLANT DEVELOPMENT SCIENCES VOL. 12(5) 271
the following tests, a standard solution of 10 000
μg/mL concentration was used.
Alkaloids (Dragendorff and Mayer’ Reagents)
This test based on the presence of nitrogen in the
alkaloids which reacted with reagents containing
bismuth or mercury and formed insoluble iodides of color bright yellow. For this test, 1 mL of the
solution to be evaluated was placed in three test
tubes, 1 drop of concentrated hydrochloric acid was
added to each tube, the sample was then heated
gently and the test tubes were left to cool. Then one
drop of the Dragendorff reagent [Bi(NO3)3:5H2O 8%;
HNO3 20%; KI 1.6M], Wagner and Mayer [KI 5%;
HgCl 0.05M] was added. The development of a
bright yellow color indicated the presence of
alkaloids. An atropine solution was used as a positive
control (Sigma Aldrich St. Louis, MO) and distilled
water as a negative control.
Aldehydes (Tollens’ Reagent)
This test involved the oxidation of the aldehydes to
the corresponding carboxylic acid, using a 5%
ammoniacal silver nitrate solution. The positive test
consisted of the formation of a silver mirror or a
black silver precipitate. For this test, 5 drops of 5%
silver nitrate, 1 drop of 2N sodium hydroxide and 3
drops of 10% ammonium hydroxide were placed in a
test tube. Until this moment the solution was
transparent, then 1 mL of the standard solution to be
evaluated was added. A glucose solution was used as a positive control (Sigma Aldrich St. Louis, MO) and
distilled water as a negative control.
Carbohydrates (Brady’ Reagent)
This reaction based on Brady’s Reagent (with the
reactant 2,4-dinitrophenylhydrazine) that quickly
formed 2,4 dinitrophenylhydrazones with aldehydes
and ketones, yellow or red pigments. For this test 1
mL of the standard solution was placed in a test tube
and 8 drops of 2,4-dinitrophenylhydrazine 20% were
added in concentrated sulfuric acid, plus 3 drops of
70% ethanol. The formation of a red or yellow color
indicated the presence of aldehydes or ketones. Glucose and fructose solutions were used as positive
controls and distilled water as a negative control.
Flavonoids
This test based on the formation of pigments by the
reaction that occurred between the
gammabenzopirone ring with hydrochloric acid and
Magnesium. For this test, 1 mL of the standard
solution to be evaluated was placed in a test tube, a
piece of Magnesium metal (10 mg) and 2 drops of
concentrated hydrochloric acid were added. The
formation of a red or blue color indicated the presence of flavonoids. A catechin solution was used
as a positive control (Sigma Aldrich St. Louis, MO)
and distilled water as a negative control.
Sterols (Liebermann-Burchard’s Reagent)
This test based on the reaction that occurred between
the steroid rings with acetic anhydride with the
formation of green or blue pigments. For this test, 1
mL of the standard solution to be evaluated was
placed in a water bath of 50 °C until the solvent
evaporated completely, the sample was solubilized in
2 mL of acetic anhydride and cooled in ice, then 3
drops of concentrated sulfuric acid were added. The
formation of a green or blue color indicated the
presence of the steroid ring. Vitamin D was used as a positive control and distilled water as a negative
control.
Tannins
This test based on the tannins property to form
precipitates of urea-soluble proteins which form
pigments with ferric chloride. For this test, 1 mL of
the standard solution to be evaluated was placed in a
test tube, 1 mL of a solution of gelatin 1% in
physiological saline solution was added, and
afterwards the sample was centrifuged at 3500 rpm
for 5 minutes. The precipitate was resuspended in 1
mL of 10M urea, and then 3 drops of 5% ferric trichloride were added. The formation of a blue color
indicated the presence of tannins. A tannic acid
solution was used as a positive control (Sigma
Aldrich St. Louis, MO) and distilled water as a
negative control.
Terpenoids
For this test, 1 mL of the standard solution to be
evaluated was placed in a water bath at 50°C until
the solvent evaporated in its entirety, 1 mL of a
solution of glacial acetic acid and sulfuric acid [1:1]
was added, then 1 mL of chloroform was added. The formation of a red or blue color indicated the
presence of terpenoids. An ursolic acid solution in
DMSO was used as a positive control (Sigma
Aldrich St. Louis, MO) and distilled water as
negative control.
Quantification of total phenolic compounds (Folin
Ciocalteu method)
A sample of 150 μL of standard solution or sample
was mixed with 150 μL of Folin Ciocalteu 0.2 N
reagent (Sigma Aldrich St. Louis, MO). The mixture
incubated at room temperature and left in the dark for
5 minutes, and the reaction was stopped with 300 μL of 0.35 M sodium hydroxide solution. The
absorbance was measured on a UV
spectrophotometer (Spectronic 20 Genesys) at a
wavelength of 760 nm. This result was extrapolated
in a standard curve with concentrations of 0, 2, 4, 8,
10, 15, 20, 30 and 50 μg/mL of gallic acid (Sigma
Aldrich St. Louis, MO).
Experimental procedures
The animal model of diabetes was induced by means
of intraperitoneal administration of alloxane (3
doses) 125 mg per kg-weight until reaching a glucose concentration over 300 mg/dL; blood glucose was
measured, with an Accu-check glucometer, during
the induction period and one week after reaching the
300 mg/dL threshold. The experimental animals
underwent a circular wound on the back with a 1.5
cm2 biopsy punch 2 mm deep. The wound was
measured on days 0, 7, 14 and 21, in which glycemic
record was also kept. The Coriander treatment was
272 DAVID PEDROZA-ESCOBAR et al.
administrated via topical route on days 0, 7 and 14. It
consisted of 500 L of methanolic coriander seeds extract at concentrations of 1000, 2000 or 4000
g/mL prepared in a 1.6% carboxymethyl cellulose (CMC) solution with phosphate-buffered saline
(PBS) as diluent. The healing percentage was
determined using the following formula:
Healing percentage =
Wound areaDay 0 − Wound areaDay N (100)
Wound areaDay 0
The animal groups were as follows: 1) Control group
(without any treatment); 2) Alloxane treatment; 3)
Alloxane and CMC/PBS treatment; 4) Alloxane and
extract (1000 µg/mL) treatment; 5) Alloxane and
extract (2000 µg/mL) treatment; and 6) Alloxane and
extract (4000 µg/mL) treatment.
Histological analysis Animals were sacrificed by cervical dislocation;
subsequently, an elliptical incision was made which
covered the area of the healing process. The samples
were dehydrated and embedded in paraffin to make
microtome cuts 5 µm thick subjected to hematoxylin
and eosin (HE) and Masson's trichrome (MT) stains
for analysis.
Statistical analysis
The variables of the phytochemical tests were
nominal. The rest of the variables were continuous
and they were described with means and standard
deviation. ANOVA and posthoc Dunnet test were
used to evaluate the difference of means among study groups; linear regression and Probit regression
were calculated with IBM SPSS 21 and
GraphPadPrism 6 software.
RESULT AND DISCUSSION
Biotoxicity assay with the Artemia salina model
Based on the results of the biotoxicity assay with the
Artemia salina model, a LD50 of 5424.82 μg/mL
(95%CI 4365.73-6483.90) was calculated. Therefore,
we proceeded to evaluate the coriander seeds extract
at concentrations lower than the LD50 that were 1000, 2000 and 4000μg/mL.
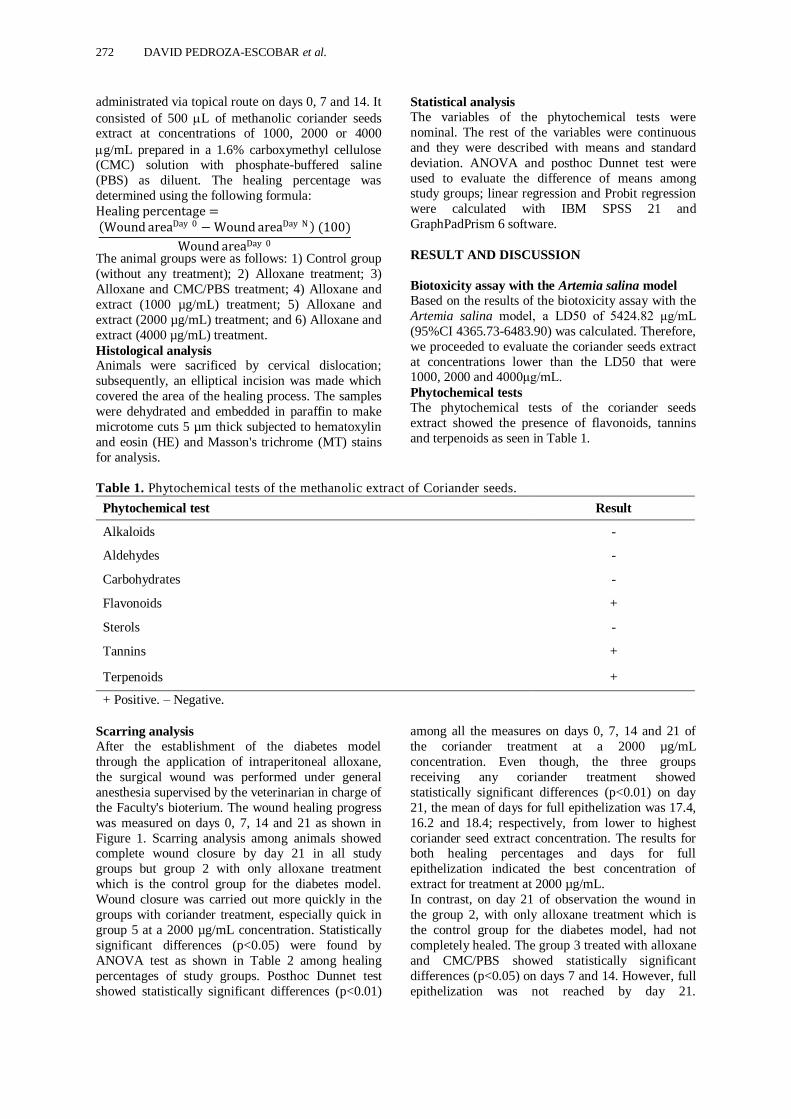
Phytochemical tests
The phytochemical tests of the coriander seeds
extract showed the presence of flavonoids, tannins
and terpenoids as seen in Table 1.
Table 1. Phytochemical tests of the methanolic extract of Coriander seeds.
Phytochemical test Result
Alkaloids -
Aldehydes -
Carbohydrates -
Flavonoids +
Sterols -
Tannins +
Terpenoids +
+ Positive. – Negative.
Scarring analysis
After the establishment of the diabetes model
through the application of intraperitoneal alloxane,
the surgical wound was performed under general
anesthesia supervised by the veterinarian in charge of
the Faculty's bioterium. The wound healing progress
was measured on days 0, 7, 14 and 21 as shown in
Figure 1. Scarring analysis among animals showed complete wound closure by day 21 in all study
groups but group 2 with only alloxane treatment
which is the control group for the diabetes model.
Wound closure was carried out more quickly in the
groups with coriander treatment, especially quick in
group 5 at a 2000 µg/mL concentration. Statistically
significant differences (p<0.05) were found by
ANOVA test as shown in Table 2 among healing
percentages of study groups. Posthoc Dunnet test
showed statistically significant differences (p<0.01)
among all the measures on days 0, 7, 14 and 21 of
the coriander treatment at a 2000 µg/mL
concentration. Even though, the three groups
receiving any coriander treatment showed
statistically significant differences (p<0.01) on day
21, the mean of days for full epithelization was 17.4,
16.2 and 18.4; respectively, from lower to highest
coriander seed extract concentration. The results for both healing percentages and days for full
epithelization indicated the best concentration of
extract for treatment at 2000 µg/mL.
In contrast, on day 21 of observation the wound in
the group 2, with only alloxane treatment which is
the control group for the diabetes model, had not
completely healed. The group 3 treated with alloxane
and CMC/PBS showed statistically significant
differences (p<0.05) on days 7 and 14. However, full
epithelization was not reached by day 21.

JOURNAL OF PLANT DEVELOPMENT SCIENCES VOL. 12(5) 273
Table 2. Healing percentage and mean of days for full epithelization among study groups.
Day 4 (%) Day 7 (%) Day 14 (%) Day 21
(%)
Full epithelization
(Days)
GROUP I 16.13 + 2.46 28.13 + 5.14 80.39 + 1.80 100 + 0 19 + 0.7
GROUP II 10.26 + 7.90 17.99 + 5.33 71.19 + 5.7 97.86 +
1.09
20.8 + 0.44
GROUP III 26.65 + 3.61* 33.99 + 4.34 77.06 + 5.7** 99.86 +
0.29
19.8 + 1.09
GROUP IV 26.65 + 3.87 42. 06 +
2.83**
79.71 + 6.98 100 + 0** 17.4 + 0.54
GROUP V 31.59 +
6.35**
43.06 +
5.13**
94.93 +
1.97**
100 + 0** 16.2 + 0.38
GROUPVI 14.06 +
2.85**
26.19 + 2.76* 79.19 +
5.62*
100 + 0** 18.4 + 1.23
Results are expressed as means and + standard deviation. p values <0.05 and <0.01 were considered
statistically significant. Dunnet Test *.
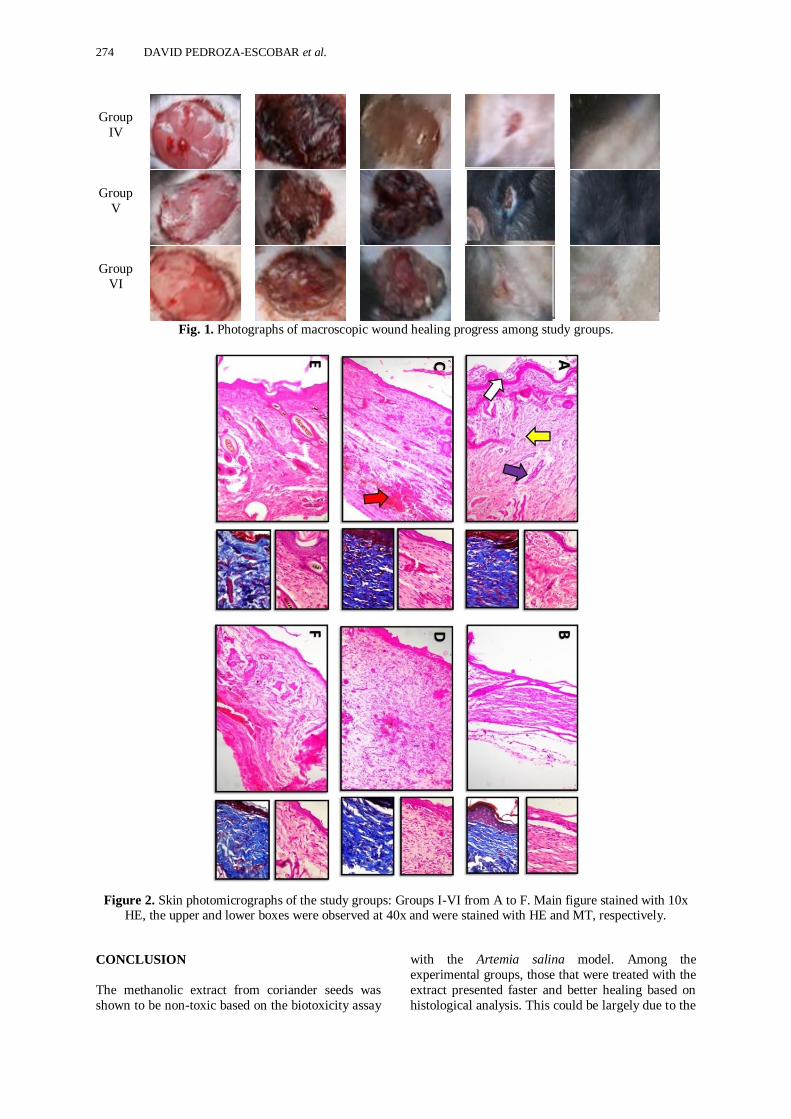
Histological analysis
At the end of the 21-day observation period, the
animals were sacrificed and samples were obtained
from the area of injury for analysis. Two different
stains were performed: Hematoxylin-Eosin and
Masson's Trichrome, which are presented in Figure
2. In general, all groups presented a keratinized
stratified flat epithelium (white arrow). In the case of
Group I (A), the characteristics of the epithelium
were normal, with abundant hair follicles in transverse and longitudinal sections in the dermis
(purple arrow), little inflammatory infiltrate, and
irregular dense connective tissue (yellow arrow and
lower box 40x). With Masson's Trichrome stain, the
irregularly arranged collagen fibers were shown in
blue. Group II (B) presented a thinned epithelium in
the peripheral area of the lesion with the absence of
keratin in the central area. Absence of hair follicles
was observed in the dermis of the injured area with
irregular dense connective tissue and a moderate
inflammatory infiltrate. Irregular dense connective tissue was observed using Masson's Trichrome stain.
Group III (C) showed an epithelium of normal
characteristics at the ends of the lesion area with
thinning in the center and absence of keratin and hair
follicles, as well as abundant vascular congestion
(red arrow) and irregular connective tissue with the
presence of an infiltrate (lower box 40x). Moderate
inflammatory infiltrate was observed. Masson's
Trichrome staining revealed irregular connective
tissue. Group IV (D) presented a decrease in the area
of scarring and moderate fibrosis compared to the
groups described above. Mild inflammatory infiltrate was observed. Using Masson's Trichrome stain, it
was possible to visualize moderate fibrosis. Group V
(E) presented an epithelium with characteristics
similar to non-injured tissue with areas of chronic
infiltrate and mild vascular congestion, along with
some hair follicles and irregular connective tissue.
Masson's Trichrome stain shows connective tissue of
irregular disposition which agrees with the normal
histological description of the dermis. Group VI (F)
shows an epithelium with some areas with no keratin
and few hair follicles, irregular connective tissue, and the inflammatory infiltrate is moderate. Masson's
Trichrome stain shows irregular connective tissue.
Day 0 Day 4 Day 7 Day 14 Day 21
Group
I
Group
II
Group
III
274 DAVID PEDROZA-ESCOBAR et al.
Group
IV
Group
V
Group
VI
Fig. 1. Photographs of macroscopic wound healing progress among study groups.
Figure 2. Skin photomicrographs of the study groups: Groups I-VI from A to F. Main figure stained with 10x HE, the upper and lower boxes were observed at 40x and were stained with HE and MT, respectively.
CONCLUSION
The methanolic extract from coriander seeds was
shown to be non-toxic based on the biotoxicity assay
with the Artemia salina model. Among the
experimental groups, those that were treated with the
extract presented faster and better healing based on
histological analysis. This could be largely due to the

JOURNAL OF PLANT DEVELOPMENT SCIENCES VOL. 12(5) 275
phytochemical compounds in the extract, since their
properties would help decrease the duration of
inflammation, and stimulate the production and
viability of collagen fibers. The phytochemical
compounds flavonoids, tannins and terpenoids seems
to favor the elimination of free radicals and decrease oxidative stress damage leading to an improvement
in wound healing.
ACKNOWLEDGMENT
The authors thank to the Consejo Nacional de
Ciencia y Tecnología (CONACyT) for the
scholarship given to FRB in order to develop his
graduate studies. To the program “Fondo Destinado a
Promover el Desarrollo de la Ciencia y la Tecnologia
en el Estado de Coahuila (FONCYT)” and its
“Convocatoria COAH-2019-C13” for supporting the project COAH-2019-C13-C058 and for the
scholarship given to AHH. The authors thanks to the
veterinarian Alfonso Zambrano Martínez for the
support provided to the care of the animals.
REFERENCES
Abbas, A.K., Lichtman, A.H. and Pillai, S. (2018).
Cellular and molecular immunology, 9th ed.;
Elsevier Science: Madrid.
Boniakowski, A.E., Kimball, A.S., Jacobs, B.N., Kunkel, S.L. and Gallagher, K.A. (2017).
Macrophage-Mediated Inflammation in Normal and
Diabetic Wound Healing. J Immunol. 199(1):17-24.
Cohen, B.E., Geronemus, R.G., McDaniel, D.H.
and Brauer, J.A. (2016). The Role of Elastic Fibers
in Scar Formation and Treatment. Dermatol Surg. 43
Suppl 1:S19-S24.
Eming, S.A., Martin, P. and Tomic-Canic, M.
(2014). Wound repair and regeneration: mechanisms,
signaling, and translation. Sci Transl Med.
6(265):265sr6.
Gantwerker, E.A. and Hom, D.B. (2011). Skin: histology and physiology of wound healing. Facial
Plast Surg Clin North Am. 19(3):441-53.
Guthrie, R.A. and Guthrie, D.W. (2004).
Pathophysiology of diabetes mellitus. Crit Care Nurs
Q. 27(2):113-25.
Kautzky-Willer, A., Harreiter, J. and Pacini, G.
(2016). Sex and Gender Differences in Risk,
Pathophysiology and Complications of Type 2
Diabetes Mellitus. Endocr Rev. 37(3):278-316.
Laribi, B., Kouki, K., M'Hamdi, M. and Bettaieb,
T. (2015). Coriander (Coriandrum sativum L.) and its bioactive constituents. Fitoterapia. 103:9-26.
Muniandy, K., Gothai, S., Arulselvan, P., Kumar,
S.S., Norhaizan, M.E., Umamaheswari, A. and
Fakurazi, S. (2019). Mini Review: Wound healing
potential of edible plants. Pak J Pharm Sci.
32(2):703-707.
Nguyen, A.V. and Soulika, A.M. (2019). The
Dynamics of the Skin's Immune System. Int J Mol
Sci.20(8): E1811.
Okonkwo, U.A. and DiPietro, L.A. (2017).
Diabetes and Wound Angiogenesis. Int J Mol Sci.
18(7):1419.
Pazyar, N., Yaghoobi, R., Rafiee, E., Mehrabian,
A. and Feily, A. (2014). Skin wound healing and
phytomedicine: a review. Pharmacol Physiol.
27(6):303-10.
Regueiro-González, J.R., López-Larrea, C.,
González-Rodríguez, S. and Martínez-Naves, E.
(2011). Inmunología Biología y patología del sistema
inmunitario, 4th ed. Review; Editorial Médica
Panamericana: Mexico city.
Ridiandries, A., Tan, J.T.M., Bursill, C.A. (2018).
The Role of Chemokines in Wound Healing. Int J Mol Sci. 19(10): E3217.
Rojas-Espinosa, O. (2017). Inmunología (de
memoria), 4th ed.; Editorial Médica Panamericana:
Mexico city.
Silva, F. and Domingues, F.C. (2017).
Antimicrobial activity of coriander oil and its
effectiveness as food preservative. Crit Rev Food Sci
Nutr. 57(1):35-47.
Schmidt, A.M. (2018). Highlighting Diabetes
Mellitus: The Epidemic Continues. Arterioscler
Thromb Vasc Biol.38(1):e1-e8.
Wei, J.N., Liu, Z.H., Zhao, Y.P., Zhao, L.L., Xue, T.K. and Lan, Q.K. (2019). Phytochemical and
bioactive profile of Coriandrum sativum L. Food
Chem.286:260-267.
Zomer, H.D. and Trentin, A.G. (2018). Skin
wound healing in humans and mice: Challenges in
translational research. J Dermatol Sci.90(1):3-12.

276 DAVID PEDROZA-ESCOBAR et al.

*Corresponding Author ________________________________________________ Journal of Plant Development Sciences Vol. 12(5): 277-281. 2020
SEED GERMINATION BEHAVIOUR OF CANNABIS SATIVA L. UNDER
DIFFERENT TEMPERATURE REGIMES
Birendra Kumar1*, S. Zaidi
1, Vagmi Singh
1, K.T. Venkatesh
2, Govind Ram
1, A.K. Gupta
3,
Narendra Kumar4 and A. Samad
5
1Seed Quality Lab on MAPs, GPB Division,
2CSIR-CIMAP Resource Centre, Pantnagar, US Nagar,
3GRM Department, GPB Division,
4Botany and Pharmacognosy Department,
5Plant Protection Division,
Council of Scientific and Industrial Research-Central Institute of Medicinal and Aromatic Plants
(CSIR-CIMAP), P.O. CIMAP, Lucknow-226015, India
Email: [email protected]; [email protected]
Received-01.05.2020, Revised-22.05.2020 Abstract: Cannabis sativa L. (Cannabaceae) is one of the earliest cultivated plant, containing many of the valuable natural components useful for health as well as livelihood. Cultivation of Cannabis is done by sowing its seeds in the field provided with favourable physical and chemical parameters for germination. In this study, optimum temperature and time required for germination of Cannabis seeds collected from Kausani, Uttarakhand have been studied at various temperatures under the controlled laboratory conditions. The percentage of germination, germination energy and seedling vigor index I and II was reported maximum at a constant temperature of ‘25˚C’ with having 3rd-4th and 6th day as its first and final count day, respectively. Therefore, it is suggested to the researchers/cultivators to raise the nursery of Cannabis sativa L. seed at ‘25˚C’
to achieve healthy and maximum seedlings of the crop.
Keywords: Hemp, THC, CBD, Germination potential, Seedling vigor
INTRODUCTION
annabis sativa L. (Fam. Cannabaceae), an
annual herb, native to eastern Asia is cultivated
worldwide having medicinal and recreational
properties due to the presence of more than 100
active chemical constituents viz. Cannabidiol (CBD), Tetrahydrocannabinol (THC), Cannabinol (CBN),
Tetrahydrocannabivarin (THCV), THCa, and
cannabidiol terpenes, etc. (Sera et al., 2018). Being a
good source of fibre, it can be used in paper, cotton,
biodegradable plastics, paints and bio-fuel industries
(Keller, 2013; Johnson, 2019; Fortenbery and Mick,
2015). Major cultivated areas for Cannabis
production in the world are Europe, Canada and
China (Huaran et al., 2018). One third to half of the
total Cannabis cultivated area of the world is
occupied by China (Yan, 2014; Salentijn et al.,
2015). Under section 10 of The NDPS Act, 1985 in India, under section 41 of UP Excise Act 1910 (UP
Excise Rule, 2018) and section of 14 of The NDPS
Act for hemp cultivation rule in Uttarakhand
(Uttarakhand Hemp Cultivation Rule, 2016-17) a
proper licence required from state excise department
for the cultivation of Cannabis for medicinal and
scientific purposes (The NDPS Act, 1985; Official
Gazette of UP, 2018). Government of India, UP state
excise department and Uttarakhand state excise
department permits the cultivation of only those
varieties/genotypes of Cannabis which have less than
0.3% THC and higher content of CBD (The NDPS
Act, 1985; Official Gazette of UP, 2018).
Dioecious Cannabis herb can be cultivated through
seeds in the field. Seed germination potential is a
very important aspect for the successful
establishment of seedling in the field and commercial
cultivation of Cannabis crop. Germination of Cannabis seed is tested under the controlled
condition of the laboratory by examining the
emergence and development of seedling where the
condition of its essential structures (root system,
shoot axis, cotyledons, terminal buds) determine its
ability to grow under the favourable condition in the
field (ISTA Rule, 2010). Temperature variation
along with a number of days to counting affected the
germination percentage of Ocimum basilicum
(Kumar et al., 2012), Tagetes minuta (Kumar et al.,
2008), Cymbopogon martinii (Kumar et al., 2010)
and Artimisia annua (Kumar et al., 2013). Change in the temperature and light had also affected the
germination of lettuce seeds (Erwin, 1991.However a
very few and erratic information is present depicting
the optimum temperature and photoperiod required
for the seed germination of Cannabis sativa L. Thus,
the main motive of this study was to determine the
optimal temperature regimes and time required for
maximum seed germination potential. The results of
maximum seed germination percentage obtained in
the seed germinator under controlled laboratory
condition are accepted worldwide by seed trades and
C
RESEARCH ARTICLE

278 BIRENDRA KUMAR, S. ZAIDI, VAGMI SINGH, K.T. VENKATESH, G. RAM, A.K. GUPTA, NARENDRA
KUMAR AND A. SAMAD
its customers as indicators of field germination
(Yaklich and Kulik, 1979).
MATERIALS AND METHODS
Seed collection
The Cannabis sativa L. seeds were collected during
October, 2019 from their naturally growing habitat of
Kausani and Bageshwar regions of Uttarakhand,
India. The seeds were stored in paper bag at
‘25oC±3oC’ until the germination experimentation
was initiated.
Germination potential and seedling vigor index
During December, 2019–January, 2020 experiment
were conducted at constant temperatures of ‘15C’,
‘20C’, ‘25C’, ‘30C’, ‘35C’ and ‘40C’ at 16 h light/8 h dark daily regimes and alternate
temperatures of ‘25oC/15oC’ at 3 photo-regimes viz.16h light/8hr dark, 8h light/16h dark and 12h
light/12h dark with 60-70% relative humidity. Seeds
were placed on top of filter paper (TP) soaked with
sterile distilled water in Petri dishes (15cm diameter
3 cm deep). The experiment was arranged in a complete randomized design with six replications of
50 seeds. Germination was checked daily and
numbers of normal (bearing both root and shoot) and
abnormal (lacking either root or shoot or having
stunted growth) seedlings recorded from the first day
of counting till the day of maximum seed
germination percentage (Kumar et al., 2011).
Numbers of healthy seedlings were used for data analysis. Observation on germination percentage,
germination energy percentage, seedling vigor index
I and seedling vigor index II were recorded and
calculated (Kumar et al., 2011) as follows:
Total number of seed =
Germination percentage
------------------------------------------- x 100
Total number of seeds in all replicates
Germination energy =
¼ of maximum number of seeds germinated in a day
-------------------------------------------------------- x 100
Total number of seeds in all replicates
Seedling vigor index I = Germination (%) x
Average seedling length (cm)
From each replication, ten normal seedlings were
selected randomly at the end of the germination test,
and seedling length (root + shoot length) was
measured. Average seedling length (cm) was
calculated.
Seedling vigor index II = Germination (%) x Average seedling dry weight (g)
The same ten seedlings were placed in a paper
envelope and dried under shade for 16 h. These dried
seedlings were placed in an oven at 75C±5C for 48
h after which they were weighed to determine
average seedling dry mass (g) in each replication.
Statistical analysis
At the end of the experiment, data were subjected to an analysis of variance (ANOVA) and mean
separation. The least significant difference (LSD) at
5% level was used to compare the means of different
test parameters under different temperature
conditions.
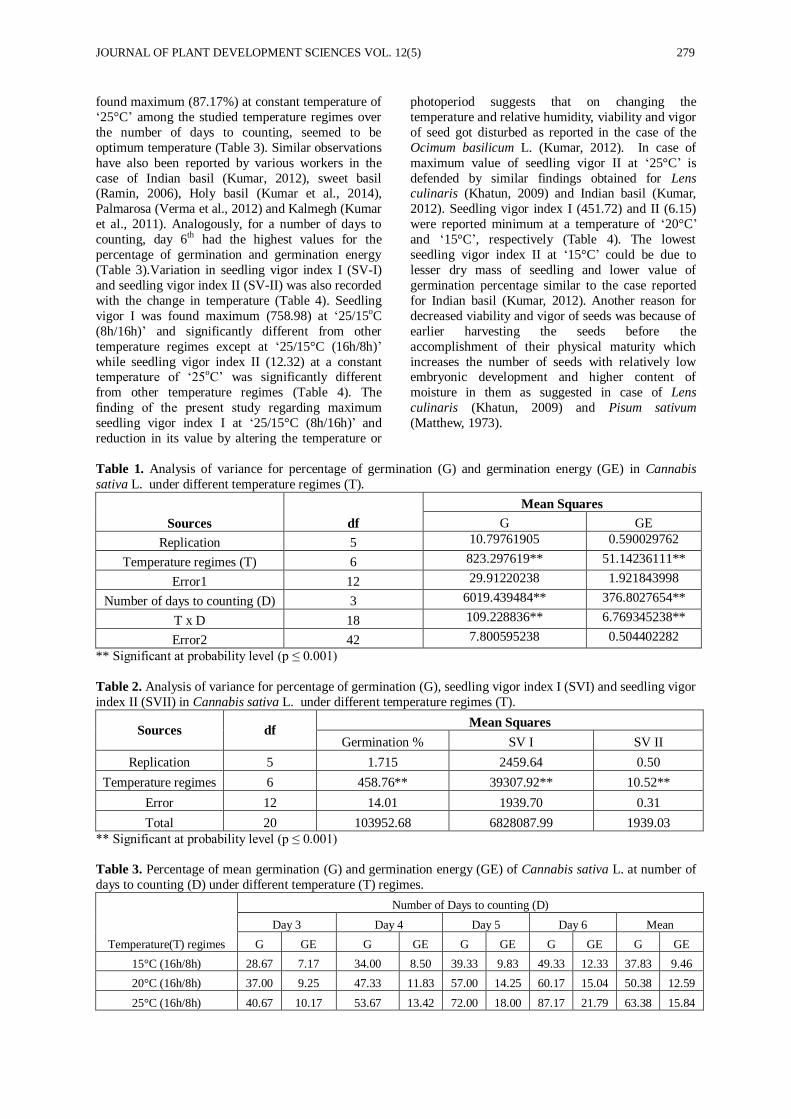
RESULTS AND DISCUSSION
ANOVA of table 1 revealed that temperature regimes
(T), number of days to counting (D) and their
interaction were highly significant for percentage of germination (G) and germination energy (GE) while
table 2 revealed that temperature regimes was highly
significant for percentage of germination (G),
seedling vigor index I (SV-I) and seedling vigor
index II (SV-II) of Cannabis seed. Percentage of
germination (G) along with germination energy (GE)
was analysed to be varying from day to day at
different temperature regimes. At various
temperature regimes, the emergence of the radicle
was recorded during the first two days of the
experiment except at ‘40oC’ where no seed
germination was observed though out the experiment. While at 35°C, radicle and plumule
emerged on 2nd and 3rd day respectively showing
stunted growth (devoid of cotyledon) that later died
on 4th day of experiment. The appearance of both
radicle as well as plumule was firstly observed on
day 3rd at all studied temperature regimes [15oC’,
‘20oC’, ‘25oC’ (16h/8h), ‘25/15oC’ (16h/8h),
‘25/15oC’ (8h/16h) and ‘25/15oC’ (12h/12h)].The
maximum seed germination was found on day 6th at
all studied temperature regimes.
The mean percentage of seed germination and germination energy over the temperature regimes for
number of days to counting varied from 37.83 and
9.46 (‘15oC’) to 62.38 and 15.84 (‘25oC’),
respectively (Table 3). Among the studied
temperature regimes, ‘25oC’ had the highest mean
percentage of germination and germination energy
(63.38 and 15.84) and significantly different from
other temperature regimes while among the number
of days to counting, day 6th has maximum mean
percentage of germination and germination energy
(70.36 and 17.59) and significantly different from rest days of counting. Considering these two factors
simultaneously i.e. a number of days to counting and
temperature regimes, ‘25oC’ was found the best with
the maximum mean percentage of germination and
germination energy (87.17 and 21.79) and was
followed by‘30oC’ (77.33 and 19.33), ‘25/15oC
(8h/16h)’ (76.67 and 19.17), ‘25/15oC (16h/8h)’
(71.00 and 17.75), ‘25/15oC (12h/12h)’ (70.83 and
17.71), ‘20oC’ (60.17 and 15.04), and ‘15oC’ (49.33
and 12.33) at day 6th of temperature regimes (Table
3). Mean of seed germination percentage (G) was
JOURNAL OF PLANT DEVELOPMENT SCIENCES VOL. 12(5) 279
found maximum (87.17%) at constant temperature of
‘25°C’ among the studied temperature regimes over
the number of days to counting, seemed to be
optimum temperature (Table 3). Similar observations
have also been reported by various workers in the
case of Indian basil (Kumar, 2012), sweet basil (Ramin, 2006), Holy basil (Kumar et al., 2014),
Palmarosa (Verma et al., 2012) and Kalmegh (Kumar
et al., 2011). Analogously, for a number of days to
counting, day 6th had the highest values for the
percentage of germination and germination energy
(Table 3).Variation in seedling vigor index I (SV-I)
and seedling vigor index II (SV-II) was also recorded
with the change in temperature (Table 4). Seedling
vigor I was found maximum (758.98) at ‘25/15oC
(8h/16h)’ and significantly different from other
temperature regimes except at ‘25/15°C (16h/8h)’
while seedling vigor index II (12.32) at a constant temperature of ‘25oC’ was significantly different
from other temperature regimes (Table 4). The
finding of the present study regarding maximum
seedling vigor index I at ‘25/15°C (8h/16h)’ and
reduction in its value by altering the temperature or
photoperiod suggests that on changing the
temperature and relative humidity, viability and vigor
of seed got disturbed as reported in the case of the
Ocimum basilicum L. (Kumar, 2012). In case of
maximum value of seedling vigor II at ‘25°C’ is
defended by similar findings obtained for Lens culinaris (Khatun, 2009) and Indian basil (Kumar,
2012). Seedling vigor index I (451.72) and II (6.15)
were reported minimum at a temperature of ‘20°C’
and ‘15°C’, respectively (Table 4). The lowest
seedling vigor index II at ‘15°C’ could be due to
lesser dry mass of seedling and lower value of
germination percentage similar to the case reported
for Indian basil (Kumar, 2012). Another reason for
decreased viability and vigor of seeds was because of
earlier harvesting the seeds before the
accomplishment of their physical maturity which
increases the number of seeds with relatively low embryonic development and higher content of
moisture in them as suggested in case of Lens
culinaris (Khatun, 2009) and Pisum sativum
(Matthew, 1973).
Table 1. Analysis of variance for percentage of germination (G) and germination energy (GE) in Cannabis
sativa L. under different temperature regimes (T).
Sources df
Mean Squares
G GE
Replication 5 10.79761905 0.590029762
Temperature regimes (T) 6 823.297619** 51.14236111**
Error1 12 29.91220238 1.921843998
Number of days to counting (D) 3 6019.439484** 376.8027654**
T x D 18 109.228836** 6.769345238**
Error2 42 7.800595238 0.504402282
** Significant at probability level (p ≤ 0.001)
Table 2. Analysis of variance for percentage of germination (G), seedling vigor index I (SVI) and seedling vigor
index II (SVII) in Cannabis sativa L. under different temperature regimes (T).
Sources df Mean Squares
Germination % SV I SV II
Replication 5 1.715 2459.64 0.50
Temperature regimes 6 458.76** 39307.92** 10.52**
Error 12 14.01 1939.70 0.31
Total 20 103952.68 6828087.99 1939.03
** Significant at probability level (p ≤ 0.001)
Table 3. Percentage of mean germination (G) and germination energy (GE) of Cannabis sativa L. at number of
days to counting (D) under different temperature (T) regimes.
Temperature(T) regimes
Number of Days to counting (D)
Day 3 Day 4 Day 5 Day 6 Mean
G GE G GE G GE G GE G GE
15°C (16h/8h) 28.67 7.17 34.00 8.50 39.33 9.83 49.33 12.33 37.83 9.46
20°C (16h/8h) 37.00 9.25 47.33 11.83 57.00 14.25 60.17 15.04 50.38 12.59
25°C (16h/8h) 40.67 10.17 53.67 13.42 72.00 18.00 87.17 21.79 63.38 15.84

280 BIRENDRA KUMAR, S. ZAIDI, VAGMI SINGH, K.T. VENKATESH, G. RAM, A.K. GUPTA, NARENDRA
KUMAR AND A. SAMAD
30°C (16h/8h) 28.67 7.17 44.67 11.17 67.67 16.92 77.33 19.33 54.58 13.65
25/15°C (16h/8h) 22.33 5.58 34.00 8.50 46.00 11.67 71.00 17.75 43.33 10.88
25/15°C (8h/16h) 30.00 7.50 45.33 11.33 64.00 16.00 76.67 19.17 54.00 13.50
25/15°C (12h/12h) 31.33 7.83 50.33 12.58 59.67 14.92 70.83 17.71 53.04 13.26
Mean 31.24 7.81 44.19 11.05 57.95 14.51 70.36 17.59
CD 5% for T 4.87(G) 1.23(GE)
CD 5% for D 6.52(G) 1.62(GE)
CD 5% for T×D 4.61(G) 1.17(GE)
Table 4. Percentage of mean germination (G), seedling vigor index I (SVI) and seedling vigor index II (SVII) of
Cannabis sativa L. under different temperature (T) regimes.
Temperature (T) regimes Mean germination percentage (G) SV I SV II
15°C (16h/8h) 49.33 480.50 6.15
20°C (16h/8h) 60.17 451.72 9.67
25°C (16h/8h) 87.17 520.05 12.32
30°C (16h/8h) 77.33 507.78 9.74
25/15°C (16h/8h) 71.00 582.58 9.78
25/15°C (8h/16h) 76.67 758.98 10.69
25/15°C (12h/12h) 70.83 689.90 8.93
SEM 3.06 35.96 0.45
CD at 5% 6.37 74.98 0.95
CV 5.32 7.72 5.79
CONCLUSION
Percentage of germination (G) and germination energy (GE) along with seedling vigor index II for
Cannabis sativa of Kausani accession was found
maximum at a constant temperature of ‘25°C’ with
3rd - 4th day and 6th day as its first and final count day,
respectively. Thus, from the above findings it is
suggested that to grow the seeds of Cannabis at
‘25°C’ as its optimum temperature which will be
useful for researchers/cultivators in producing
seedlings for commercial cultivation.
ACKNOWLEDGEMENT
Authors are highly obliged to the Director, CSIR-
CIMAP, Lucknow for providing necessary
infrastructure and facility; also thankful to Dr Rakesh
Kumar for statistical analysis, Revenue Department,
Ministry of Finance, Government of India, UP State
Excise Department and Uttarakhand State Excise
Department for issuing a license to cultivate hemp
for R&D activity. This study was financially
supported by Asheesh Concentrates International
LLP , Mumbai, India.
REFERENCES
Bonini, S. A., Premoli, M., Tambaro, S., Kumar,
A., Maccarinelli, G., Memo, M. and Mastinu, A. (2018). Cannabis sativa: A comprehensive
ethnopharmacological review of a medicinal plant
with a long history. Journal of
Ethnopharmacology 227: 300–315. https://doi.org/10.1016/j.jep.2018.09.004
Fortenbery, T. R. and Mick, T. B. (2015). Industrial
hemp: Opportunities and challenges for Washington.
http://ses.wsu.edu/wp-content/ uploads/ 2015/02/
WP2014-10.pdf.
Huaran, H., Hao, L. and Feihu, L. (2018). Seed
germination of hemp (Cannabis sativa L.) cultivars
responds differently to the stress of salt type and
concentration. Industrial Crops and Products
123:254–261.
ISTA (International Seed Testing Association) Rule (2010). International Rules for Seed Testing,
Zurich, Switzerland, International Seed Testing
Association.
Johnson, R. (2019). Defining Hemp: A Fact
Sheet (PDF). Washington, DC: Congressional
Research Service. Retrieved 29 March 2019.
Keller, N.M. (2013). The Legalization of Industrial
Hemp and What it Could Mean for Indiana's Biofuel
Industry . Indiana International & Comparative Law
Review 23(3): 555. doi:10.18060/17887
Khatun, A., Kabir, G. and Bhuiyan, M. A. H. (2009). Effect of harvesting stages on the seed
quality of lentil (Lens culinaris L.) during storage.
Bangladesh Journal of Agricultural Research
34:565–576.
Kumar, B. (2012). Prediction of germination
potential in seeds of Indian basil (Ocimum basilicum

JOURNAL OF PLANT DEVELOPMENT SCIENCES VOL. 12(5) 281
L.), Journal of Crop Improvement 26:532-539.
http://dx.doi.org/10.1080/15427528.2012.659418
Kumar, B., Gupta, A. K., Verma, A. K., Saini,
R.K. and Khanuja, S.P.S. (2008). Comparative
germination kinetics and efficiency in marigold
(Tagetes erecta L.) accessions over storage. Journal of Medicinal and Aromatic Plant Sciences. 30:142–
145.
Kumar, B., Gupta, E., Mali, H., Singh, H. P. and
Muhanad, A. (2013). Constant and alternating
temperature effects on seed germination potential in
Artemisia annua L. Journal of Crop Improvement
27:636-642.
http://dx.doi.org/10.1080/15427528.2013.832458
Kumar, B., Gupta, E., Yadav, R., Singh, S.C. and
Lal, R.K. (2014). Temperature effects on seed
germination potential of Holy Basil (Ocimum
tenuiflorum). Seed Technology 36:75-79.
Kumar, B., Verma, S.K., Ram, G. and Singh, H.
P. (2012). Temperature relations for seed
germination potential and seedling vigor in
Palmarosa (Cymbopogon martinii). Journal of Crop
Improvement 26: 791-801.
http://dx.doi.org/10.1080/15427528.2012.689799
Kumar, B., Verma, S.K. and Singh, H.P. (2011).
Effect of temperature on seed germination
parameters in Kalmegh (Andrographis paniculata
Wall. Ex. Nees). Industrial Crops and Products 34:
1241–1244. Matthews, S. (1973). The effect of time of harvest
on the viability and pre-emergence mortality in soil
of pea (Pisum sativum L.) seeds. Annals of Applied
Biology 73:211–219.
Official Gazette of Uttar Pradesh (2018). The Uttar
Pradesh Excise (Research Oriented Cultivation of
Hemp to Develop Medicinal and Industrial Grade
Plant of Hemp) Rule, 2018. Office of the Excise
Commissioner, Uttar Pradesh, Pryagraj, Notification
No.: 4607/Two-Pra.D-218/Shodh/Bhang/2018-19
dated November 16, 2018.pp.1-11.
Ramin, A. A. (2006). Effects of salinity and temperature on germination and seedling
establishment of sweet basil (Ocimum basilicum L.).
Journal of Herbs, Spices & Medicinal Plants 11:81–
90.
Salentijn, E. M. J., Zhang, Q. Y., Amaducci, S.,
Yang, M. and Trindade, L. M. (2015). New
developments in fiber hemp (Cannabis sativa L.)
breeding. Industrial Crops and Products 68: 32–41. 10.1016/j.indcrop.2014.08.011
Sera, B., Sery, M., Gavril, B. and Gajdova, I. (2017). Seed germination and early growth responses
to seed pre-treatment by non-thermal plasma in hemp
cultivars (Cannabis sativa L.). Plasma Chemistry
and Plasma Processing 37:207-221. DOI
10.1007/s11090-016-9763-9
The Narcotic Drugs and Psychotropic Substances,
Act (1985). Section 10 (Power of state government
to permit, control and regulate) and section 14
(Special provision relating to cannabis) of Chapter III
(Prohibition, Control and Regulation). Published by Department of Revenue under Ministry of Finance,
Government of India. pp. 1-49.
Uttarakhand Hemp Cultivation Rule (2016-17).
Section 14 of The NDPS Act for cultivation of hemp
in Uttarakhand OM No.:
639/XXIII/2016/04(02)2016 Dehradun dated
December 05, 2016.pp.1-4 and Excise Commissioner
Uttarakhand OM No.: 2641/Chha:Pra.-159/Hemp
Cultivation Rule/2016-18 dated August 17, 2017
pp.1-8.
Verma, S. K., Kumar, B., Ram, G., Singh, H. P. and Lal, R. K. (2010). Varietal effect on
germination parameter at controlled and uncontrolled
temperature in Palmarosa (Cymbopogon martinii).
Industrial Crops and Products 32: 696-699.
Yaklich, R.W. and Kulik, M.M. (1979). Evaluation
of vigor tests in Soybean seeds: Relationship of the
standard germination test, seedling vigor
classification, seedling length, and tetrazolium
staining to field performance 1. Crop Science 19:
247-252.
doi:10.2135/cropsci1979.0011183X001900020019x
Yan, Z.L., Wanga, H., Lau, K.T., Pather, S., Zhang, J.C., Lin, G. and Ding, Y. (2013).
Reinforcement of polypropylene with hemp fibres.
Composites: Part B. 46:221-226.

282 BIRENDRA KUMAR, S. ZAIDI, VAGMI SINGH, K.T. VENKATESH, G. RAM, A.K. GUPTA, NARENDRA
KUMAR AND A. SAMAD

*Corresponding Author ________________________________________________ Journal of Plant Development Sciences Vol. 12(5): 283-287. 2020
PERFORMANCE OF INTERCROPS IN HYBRID MAIZE UNDER NORTH
CENTRAL PLATEAU ZONE OF ODISHA
T.R. Mohanty1 , M. Ray
2*, S.K. Sahoo
3 , K.C. Sahoo
4, N. Mishra
5 and H.K. Patro
6
1,2,3,4,5Regional Research and Technology Transfer Station [RRTTS] (OUAT),
Keonjhar, Odisha - 758002 5DPME, Orissa University of Agriculture and Technology, Bhubaneswar-751003
Email: [email protected]
Received-04.05.2020, Revised-26.05.2020 Abstract: An experiment was conducted at Field Experimental Block, Regional Research and Technology Transfer Station,
Keonjhar, during Kharif season for two consecutive years of 2017 and 2018 under RKVY project to study the performance of maize based intercropping system under North Central Plateau Zone of Odisha. . The experiment was laid out in RBD design. The experiment comprised of thirteen treatments viz. T1- Maize + Cowpea (1:1), T2-Maize + Cowpea (2:2), T3-Maize + Radish (1:1), T4-Maize + Radish (2:2), T5-Maize + Cluster bean (1:1), T6-Maize + Cluster bean (2:2), T7-Maize + Arhar (1:1), T8-Maize + Arhar (2:2),T9-Maize (sole), T10-Cowpea (sole) , T11-Radish (sole), T12- Cluster bean (sole), T13-Arhar (sole). The varieties taken were: Maize-Pioneer 3396(Hybrid), Cowpea-Kasi Kanchan, Cluster bean -Pusa Navbahar, Arhar- Corg 9701 and Radish- Pusa Chetki Long. Results revealed that Maize + cowpea (1:1) proved to be the most profitable system being at par with maize + cowpea (2:2) & maize + radish (1:1 & 2:2) systems in both the years. However,
maize + arhar (1:1) returned the highest amount per rupee invested (1.78) among all the systems when number of days occupied in the field is not taken into account. Therefore for North Central Plateau Zone of Odisha cowpea and radish are the most suitable intercrops with maize in Kharif season in the above row ratios.
Keywords: Kharif, Intercropping, Maize, Cowpea, Profitable
INTRODUCTION
he state of Odisha is located in the eastern part of
India. It has 2.62 Mha of maize with a production
of 6.08 million tonnes (Mt), resulting in an average
productivity of 2,321 kg/ha (Government of
Odisha,2012) annually. Nationally, maize is cultivated on 8.78 Mha, with a production of 21.76
Mt and an average annual yield of 2,478 kg/ha
(Directorate of Economics and Statistics, 2012). In
Odisha maize is cultivated primarily in interior
districts such as Keonjhar (27,580 ha). Maize is a
staple tribal food crop and amounts to 7.4% of the
state's total food consumption .These tribal
communities constitute 23% of the total state
population (Census-2011, www.censusindia.gov.in ).
The predominant upland crop in this region is maize,
grown during the kharif season. Growing of a heavy feeder maize crop year after year mines the soil and
results in decline of fertility of the soil. Farmers
mostly use local varieties of maize crops under low
management conditions which results in low
productivity. So, the production of food grain could
be increased by adopting intercropping system.
Intercropping increases total productivity through
efficient utilization of land, labour and growth
resources (Ahmed et al., 2006). Greater productivity
in intercropping system is commonly achieved by
minimizing inter specific competition and maximizing
complementary use of growth resources (Islam, 2002). Inter-specific competition may be minimized
through judicious choice of crops (Santalla et al.,
2001). Usually plants differing in growth duration,
height, rooting systems and nutrient requirements are
considered to grow together in intercropping systems
(Reddy and Willey, 1981).
Intercropping also increases land equivalent ratio
(LER) to varying degrees (Mehta and De, 1980;
Hashem et al., 1990). Islam et al. (2004) reported that
maize and bush been exhibited similar competitiveness in simultaneous sowing and resulted
in the highest intercrop productivity in maize-bush
bean intercropping system. They suggested that two
rows of bush bean in between maize rows can be
grown by experiment was conducted in different
locations during rabi season 2005-06. Findings from
different locations showed that the highest maize
equivalent yield was obtained from Maize + Bush
bean intercropping systems at Jamalpur, Maize +
Spinach at Jessore, Mymensigh, and Rangpur, Maize
+ coriander (as vegetable) at Pabna. Maize + Red amaranth at Kushtia and Manikganj (OFRD, 2006).
The association of bush bean with maize provides
some N economy (Singh et al., 2000). Generally
legumes in association with non-legumes not only
helps in utilization of the nitrogen being fixed in the
current growing season, but also helps in residual
nutrients build up of the soil (Sharma et al., 1991).
However, the benefit accrued from intercropping may
vary according to the nature and type of intercrops
and their population densities. Therefore, it is
necessary to identify maize-based productive systems
for higher monetary returns in North Central Plateau Zone of Odisha as here there is ample scope for
intercropping with short duration vegetables with
maize in the inter row space without hampering the
T
RESEARCH ARTICLE

284 T.R. MOHANTY , M. RAY, S.K. SAHOO , K.C. SAHOO, N. MISHRA AND H.K. PATRO
main yield of maize. In view of this a study was
conducted to evaluate the performance of maize under
intercropping with different crops viz. Cowpea,
Cluster bean, radish and Arhar for selection of
suitable inter crop with maize and to increase the
cropping intensity, as well as increase the farmers’ income.
MATERIALS AND METHODS
The experiment was conducted at Field Experimental
Block, Regional Research and Technology Transfer
Station, Keonjhar, during Kharif season of two
consecutive years of 2017 and 2018 under RKVY
project. The soil of the experimental field was loamy
sand having pH
8 and N (107 kg/ha) and K (78 kg/ ha)
status was low whereas P (21 kg/ha) status was
medium. The experiment was laid out in a Randomized Complete Block Design with thirteen
treatments combinations and three replications. The
thirteen treatment combinations studied were as
follows: T1- Maize + Cowpea (1:1), T2-Maize +
Cowpea (2:2), T3-Maize + Radish (1:1), T4-Maize +
Radish (2:2), T5-Maize + Cluster bean (1:1), T6-
Maize + Cluster bean (2:2), T7-Maize + Arhar (1:1),
T8-Maize + Arhar (2:2),T9-Maize (sole), T10-
Cowpea (sole) , T11-Radish (sole), T12- Cluster bean
(sole), T13-Arhar (sole). The varieties taken were:
Maize-Pioneer 3396, Cowpea-Kasi Kanchan, Cluster bean -Pusa Navbahar, Arhar- Corg 9701 and Radish-
Pusa Chetki Long. Sowing was done on 24 June and
27 June in 2017 and 2018 respectively. Maize and all
intercrop vegetable seeds were sown at the same time.
All intercrops were sown in lines in between the
maize rows maintaining the standard spacing of the
respective crops. Maize seeds were sown in a planting
configuration of 60 cm x 30 cm spacing in 1:1
planting pattern and vegetable seeds were sown in
between them. A spacing 30 cm x 30 cm was
maintained in 2:2 planting pattern of maize and
vegetable intercropping, The crop was fertilized at the rate of 120-60-60 kg ha-1 of NPK and FYM at the
rate of 5 t ha-1. Full amount of P and K and 1/3rd of N
along with full amount of cow dung were applied at
the time of final and preparation. The rest N was
applied into two equal splits at knee height stage and
at tasselling stage. Intercultural operation was done as
and when necessary. Data on plant height, cobs per
plant, grains/cob , 100 seeds weight and grain yield
per hectare were recorded for data analysis. Grain
yield of maize was determined at 14% moisture
content. Ten cobs were randomly harvested from each plot, which was later converted into ton per
hectare. Maize equivalent yield (MEY) and BCR
were calculated to ascertain the efficiency of
intercropping. Maize equivalent yield was calculated
by converting the yield of intercrops to the yield of
Maize on the basis of prevailing market prices of
individual crops. Economic analysis on the basis of
net monetary return was performed to evaluate the
intercropping system.
Maize Equivalent Yield was calculated after
Bandyopadhyay (1984):
Maize Equivalent Yield (MEY) =
Yield of Intercrop (Kg ha-1) x Price of Intercrop (Rs Kg-1)
----------------------------------------------------------
Price of Maize (Rs Kg-1)
RESULTS AND DISCUSSION
Yield and yield contributing characters of Maize
Plant characters and yield attributes of Pioneer 3396
Hybrid Maize in maize- vegetable intercropping
system are presented in Table 1. The highest plant
height (185.3cm) and Cobs/ plant (1.51), was
recorded from sole maize followed by Maize + cowpea (1:1) (185.3cm and 1.45 respectively). The
lowest plant height (176.4cm) and Cobs/ plant (1.09),
was recorded from Maize + Arhar (2:2) intercropping.
The highest grains/cob (455.0) and 100 grain weight
(33.9g) was achieved from sole maize and it was
almost similar to treatments T1 and T2 i.e. Maize +
cowpea in the ratio 1:1( 32.5g) and 2:2 (31.2g).
Treatments T7 and T8 i.e. Maize + Arhar in the ratio
1:1(420.6 ) and 2:2 (419.5 ) produced the lowest
grains/cob .
Yield of Maize The maximum grain yield (5.35 t ha-1) was recorded
from sole maize and it was statistically identical to all
other treatments (Fig. 1). OFRD (2006) and Bhuiyan
et al., 1999 also reported that sole maize gave the
highest yield among the treatments
Yield of Intercrops
The highest average yield of intercrops (3.59 t ha-1)
was found from the Maize + Radish(2:2)
intercropping system whereas the lowest average
yield (0.48 t ha-1) was found in Maize + Arhar (2:2)
intercropping system.
Maize Equivalent Yield (MEY) Maize equivalent yields in the intercrops were
significantly higher than the sole crops. The pooled
data showed that the highest average Maize
equivalent yield of 7.10 t ha-1 was obtained from
Maize + Arhar (1:1) intercropping systems followed
by maize + cowpea(1:1) and maize + radish(1:1) ,
which was 25.2% higher than the sole crop of
Maize(Fig. 1). The results indicated that cereal
(Maize) – vegetable intercropping could bring more
benefit to farmers over sole maize. The increment of
total production by intercropping than sole cropping was also reported by Rao and Willey (1980); Umrani
et al. (1984); Bandhyopadhyay (1984); Basak et al.
(2006) and Bhowal et al. (2014).
Cost and benefit analysis
Productivity, net return , profitability and BCR of
maize-vegetable intercropping systems were shown in
Table 2. The productivity was highest Maize +
cowpea (1:1) intercropping (68.75 Kg/ha/day)
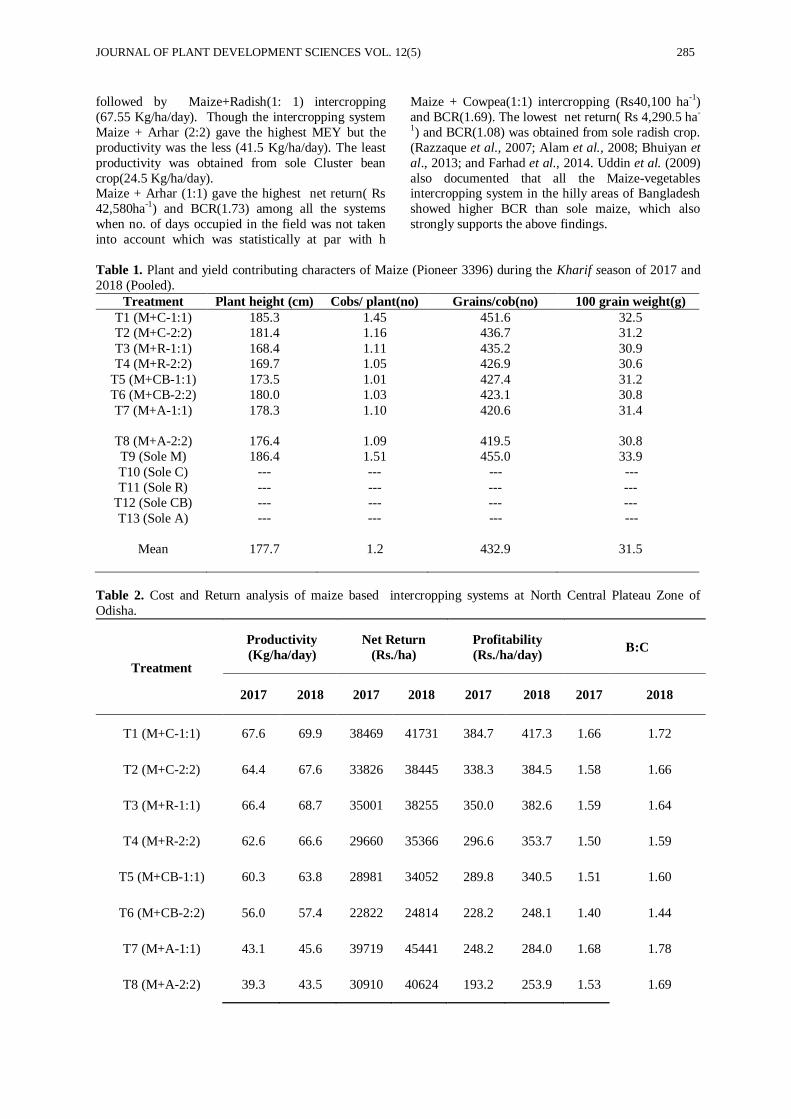
JOURNAL OF PLANT DEVELOPMENT SCIENCES VOL. 12(5) 285
followed by Maize+Radish(1: 1) intercropping
(67.55 Kg/ha/day). Though the intercropping system
Maize + Arhar (2:2) gave the highest MEY but the
productivity was the less (41.5 Kg/ha/day). The least
productivity was obtained from sole Cluster bean
crop(24.5 Kg/ha/day). Maize + Arhar (1:1) gave the highest net return( Rs
42,580ha-1) and BCR(1.73) among all the systems
when no. of days occupied in the field was not taken
into account which was statistically at par with h
Maize + Cowpea(1:1) intercropping (Rs40,100 ha-1)
and BCR(1.69). The lowest net return( Rs 4,290.5 ha-
1) and BCR(1.08) was obtained from sole radish crop.
(Razzaque et al., 2007; Alam et al., 2008; Bhuiyan et
al., 2013; and Farhad et al., 2014. Uddin et al. (2009)
also documented that all the Maize-vegetables intercropping system in the hilly areas of Bangladesh
showed higher BCR than sole maize, which also
strongly supports the above findings.
Table 1. Plant and yield contributing characters of Maize (Pioneer 3396) during the Kharif season of 2017 and
2018 (Pooled).
Treatment Plant height (cm) Cobs/ plant(no) Grains/cob(no) 100 grain weight(g)
T1 (M+C-1:1) 185.3 1.45 451.6 32.5
T2 (M+C-2:2) 181.4 1.16 436.7 31.2
T3 (M+R-1:1) 168.4 1.11 435.2 30.9
T4 (M+R-2:2) 169.7 1.05 426.9 30.6
T5 (M+CB-1:1) 173.5 1.01 427.4 31.2
T6 (M+CB-2:2) 180.0 1.03 423.1 30.8
T7 (M+A-1:1) 178.3 1.10 420.6 31.4
T8 (M+A-2:2) 176.4 1.09 419.5
30.8
T9 (Sole M) 186.4 1.51 455.0 33.9
T10 (Sole C) --- --- --- ---
T11 (Sole R) --- --- --- ---
T12 (Sole CB) --- --- --- ---
T13 (Sole A) --- --- --- ---
Mean 177.7
1.2
432.9
31.5
Table 2. Cost and Return analysis of maize based intercropping systems at North Central Plateau Zone of
Odisha.
Treatment
Productivity
(Kg/ha/day)
Net Return
(Rs./ha)
Profitability
(Rs./ha/day) B:C
2017 2018 2017 2018 2017 2018 2017 2018
T1 (M+C-1:1) 67.6 69.9 38469 41731 384.7 417.3 1.66 1.72
T2 (M+C-2:2) 64.4 67.6 33826 38445 338.3 384.5 1.58 1.66
T3 (M+R-1:1) 66.4 68.7 35001 38255 350.0 382.6 1.59 1.64
T4 (M+R-2:2) 62.6 66.6 29660 35366 296.6 353.7 1.50 1.59
T5 (M+CB-1:1) 60.3 63.8 28981 34052 289.8 340.5 1.51 1.60
T6 (M+CB-2:2) 56.0 57.4 22822 24814 228.2 248.1 1.40 1.44
T7 (M+A-1:1) 43.1 45.6 39719 45441 248.2 284.0 1.68 1.78
T8 (M+A-2:2) 39.3 43.5 30910 40624 193.2 253.9 1.53 1.69

286 T.R. MOHANTY , M. RAY, S.K. SAHOO , K.C. SAHOO, N. MISHRA AND H.K. PATRO
T9 (Sole M) 52.4 54.6 26867 30033 268.7 300.3 1.56 1.63
T10 (Sole C) 37.1 37.4 21185 21661 211.9 216.6 1.67 1.68
T11 (Sole R) 40.6 40.6 3402 5179 34.0 34.0 1.06 1.10
T12 (Sole CB) 26.3 22.7 13268 5189 132.7 81.9 1.55 1.34
T13 (Sole A) 25.8 24.3 23349 19889 145.9 124.3 1.66 1.56
Sem (±) 2 2.1 3560 3202 28.1 29.8 - -
CD (0.05) 5.8 6.1 10390 9343 82.1 87.1 - -
Fig. 1: Comparison of Maize and Intercrop (vegetables) Yield with Maize Equivalent Yield (MEY) in Maize
vegetable intercropping system.
CONCLUSION
Maize + cowpea (1:1) proved to be the most
profitable system being at par with maize + cowpea
(2:2) & maize + radish (1:1 & 2:2) systems in both
the years. However, maize + arhar (1:1) returned the
highest amount per rupee invested (1.78) among all
the systems when no. of days occupied in the field is
not taken into account. Therefore the farmers of North
Central Plateau Zone are advised to take cowpea and
radish as intercrops with maize in Kharif season in the
above row ratios.
REFERENCES
Ahmed, F., Rahman, M. A., Jahan, M. A. H. S.,
Ahmed, M. and Khayer, M. A. (2006). Effect of
different lanting systems in maize/spinach-red
amaranth intercropping. Bangaldesh J. Agric. and
Environ. 2(2): 69-76.
Alam, M.S., Paul, N.K. and Quayyum, M.A. (2008). Performance of hybrid maize (Zea mays L.)
under intercropping systems with mungbean in
different planting methods. SAARC J. Agri. 6: 73-82
Bandyopadhyay, S. K. (1984). Nitrogen and water
relations in grain sorghum legume intercropping systems. Ph. D. Dissertation, Indian Agricultural
Research Institute (IARI), New Delhi- 110012, India.
Basak, N. C., Hossain, S. M. A., Islam, N.,
Bhuiyan, N. I. (2006). Intercropping wheat with
groundnut at variable plant population.Bangladesh J.
Agril. Res. 31(2):207-215.
Bhowal, S. K., Chowdhury, M. M.U., Bhuiyan, M.
S., Faisal, A. H. M. A., Farhad, I. S. M. and
Bhowmik, S. K. (2014). Yield and Yield Attributes
of Lentil (Lens Esculenta) as a Mixed Crop with
Mustard (Brassica Campestris). Sci. Agri. 4 (2), 76-79
Bhuiyan, M. K. A., Haque, M. M., Khaliq, Q. A., Begum, J. A. and Mawlla, A. H. M. R. (1999).
Productivity and economics of grain legumes
intercropped with maize. Bangladesh Agron. J. 9
(1&2): 35-42.
Bhuiyan, M.S., Bhowal, S.K., Farhad, I.S.,
Chowdhury, M.M.U. and Amin, M. (2013).
Intercropping soybean with kaon in varying plant
population in the coastal area of Noakhali
region.Bangladesh Agron. J. 16(1): 81-86.
0.00
1.00
2.00
3.00
4.00
5.00
6.00
7.00
8.00
T1 T2 T3 T4 T5 T6 T7 T8 T9 T10 T11 T12 T13Yie
ld o
f M
aize
an
d In
terc
rop
s an
d M
EY (
t/h
a)
Maize yield Intercrop Yield MEY
JOURNAL OF PLANT DEVELOPMENT SCIENCES VOL. 12(5) 287
Directorate of Economics and Statistics (2012).
Agriculture Statistics at a Glance, 2012. Directorate of
Economics and Statistics, Department of Agriculture
and Cooperation, Ministry of Agriculture,
Government of India.
Farhad, I. S. M., Chowdhury, M. M. U., Bhowal,
S. K., Choudhury, A. K. and Khan, A.S.M.M.R. (2014). Chilli – Garlic Intercropping System In
Coastal Saline Area. App. Sci. Report. PSCI
Publications. 2 (2): 47-50.
Government of Odisha (2012). Odisha Agriculture
Statistics, 2011-12. Directorate of Agriculture and
Food Production. Government of Odisha, India.
Available at: www.agriodisha.nic.in
Hashem, A., Maniruzzaman, A. F. M. and
Akhtaruzzaman, M.A. (1990). Study on the
productivity, profitability of potato intercropped with
vegetables and relayed with onion. Bangladesh Agron. J. 3: 3 9-43.
Isalm, M. N. (2002). Competitive interference and
productivity in maize-bushbean intercropping system.
A PhD. Dissertation, Dept. of Agronomy,
Bangabandhu Sheikh Mujibur Rahman Agricultural
University, Gazipur.
Islam, M. N., Haque, M.M. and Hamid, A. (2004).
Productivity and competitive interference in maize +
bushbean intercropping system in different sowing
dates. Bangladesh Journal of Agricultural Research
29(2): 200. Mehta, N. K. and Dey, R. (1980). Intercropping
maize and sorghum with soybean. J. Agric. Sci.
Camb. 95: 117-122
On-Farm Research Division (OFRD), Bangladesh
Agricultural Research Institute, Joydebpur, Gazipur.
2006. Intercropping maize with short duration
vegetables crop. Annual Research Report. pp 291-
297.
Rao, M. R. and Willey, R. W. (1980). Evaluation of
yield stability in intercropping, sorghum rpigeon pea.
Expt. Agric. 16(2): 105-116.
Razzaque, M.A., Rafiguzzaman, S., Bazzaz,
M.M.M., Ali, A. and Talukdar, M.M.R. (2007).
Study on the intercropping groundnut with chilli at
different plant populations. Bangladesh J. Agril. Res.
32 (1): 37-43.
Reddy, M. S. and Willey, R. W. (1981). Growth and
resource use studies in an intercrop of pearl
millet/groundnut. Field crops res. 4: 13-24.
Santalla, M., Rodino, A. P., Casquero, P. A. and
Ron, A. M. (2001). Interactions of bush bean with
field and sweet maize. European J. Agron. 15 (3):
185-196. Uddin, M. S. and Satter, M. A. (1993). Prospects of
intercropping maize with legumes and vegetables in
hill tracts. Bangladesh J. Agril. Res. 18(2): 227-230.
Sharma et al., (1991).
Singh, D. P., Rana, N. S. and Singh, R. P. (2000).
Growth and yield of winter maize (Zea mays) as
influenced by intercrops and nitrogen application.
Indian J. Agron. 45: 515-519.
Uddin, M. J., Quayyum, M. A. and Salahuddin, K.
M. (2009). Intercropping Of Hybrid Maize With
Short Duration Vegetables At Hill Valleys Of Bandarban. Bangladesh J. Agril. Res. 34(1) :51-57
Umrani, N. N., Shinde, H. S. and Dhonde, P. M. (1984). Studies on intercropping of pulses in Kharif
Sorghum. Indian J. Agron. 29(1):27-30.

288 T.R. MOHANTY , M. RAY, S.K. SAHOO , K.C. SAHOO, N. MISHRA AND H.K. PATRO

*Corresponding Author ________________________________________________ Journal of Plant Development Sciences Vol. 12(5): 289-295. 2020
EFFECT OF INTEGRATED NUTRIENT MANAGEMENT ON GROWTH AND
DEVELOPMENT OF MUSTARD (BRASSICA JUNCEA L.) IN IRRIGATED
CONDITION OF UPPER GANGETIC PLAINS
Sauhard Dubey1*, M.Z. Siddiqui
1, Saurabh Rana
1, Gaurav Shukla
2, Dharmendra Singh
2 and
Ashish Nath Pandey2
1Department of Agronomy, CSAUA&T, Kanpur, Uttar Pradesh-208002, India
2Department of Agronomy, SVPUA&T, Meerut, Uttar Pradesh-250110, India
Email: [email protected]
Received-09.05.2020, Revised-29.05.2020
Abstract: A field experiment was conducted to study the effect of integrated nutrient management on growth and development of mustard (Brassica Juncea L.) under timely sown irrigated conditions on sandy loam soil at Students’ Instructional Farm (SIF) of C.S. Azad University of Agriculture and Technology, Kanpur. The experiment was laid out in Randomized Block Design replicated thrice. The treatments comprises of either 100% RDF (N:P:K:S) @ 120:60:40:40 kg ha-1 or 75 % RDF @ 90:45:30:30 kg ha-1 or 50 % RDF @ 60:30:20:20 kg ha-1 along with combinations of vermicompost @ 1.25 t ha-1 or 0.62 t ha-1, FYM @ 5 t ha-1 or 2.5 t ha-1 with bio-fertilizers (azotobacter + PSB) @ 7.5 Kg ha-1 + ZnSO4 @ 10 Kg ha-1. The results of the present investigation revealed that the growth and yield traits viz., plant height at maturity
(201.41cm), number of branches at maturity (7.59 primary, 9.37 secondary and 3.97 tertiary branches), LAI at 90 DAS (4.46), dry matter accumulated at maturity (44.23 g/plant) and grains yield (23.25 q ha-1) were recorded significantly highest with application of 50% RDF + FYM @ 2.5 t ha-1 + vermicompost @ 0.62 t ha-1 + bio-fertilizers @ 7.5 kg ha-1 + ZnSO4 @ 10 kg ha-1. Hence, it may be recommended for farmers for higher yield in the area of Upper Gangetic Plains.
Keywords: Development, Fertilizers, FYM, Growth, Mustard, Vermicompost
INTRODUCTION
ilseeds, the second largest agricultural
commodity after cereals in India, play a
significant role in India’s agrarian economy, sharing
14% of the gross cropped area and accounting for
nearly 1.5% of the gross national production and 8%
of the value of all agricultural products. The gap in
supply is being met through huge imports costing more than Rs. 26000 crores during 2009-10.
Rapeseed and mustard are the major Rabi oilseed
crops of India and stand next to groundnut in the
oilseed economy. It is an important oilseed crops of
the family cruciferae and occupy a prominent place
among the leading oilseed crops being next to
groundnut both in area and production, meeting the
fat requirement of about 50 per cent population in the
state of Uttar Pradesh, Punjab, Rajasthan and Assam.
India is second in rapeseed and mustard production
to China and first in area. A range of oilseed crops viz. groundnut, rapeseed and mustard, soybean,
sesame, sunflower, safflower and niger (edible) and
linseed and caster (non edible) are also cultivated in
the country. In India, the overall area under rape
mustard has increased to 6.64 million hectares in
2018-19, up from 6.39 million hectares a year ago
while the production is jumped 19 per cent from a
year earlier to a record 8.5 million tonnes.
Vermicompost is a good organic source of plant
nutrient supply. It is a rich source of nitrogen (3%),
phosphorus (1%), potassium (1.50%), calcium
(0.44%), magnesium (0.15%), sulphur (0.45%), zinc (24.43ppm), iron (175.2ppm), vitamins and growth
hormones which enhance plant height, dry matter per
plant and seed yield. Rajiv (2019) stated that the
organic amendments like FYM, vermicompost and
bio-fertilizers might play a major role in
supplementing the crop nutrients through their direct
addition, improvement in soil condition, nitrogen
fixation and solubilisation of fixed forms of
phosphorus in soil. Rajiv (2014) reported that the
application of vermicompost integration with inorganic fertilizers might have improved the
availability of nutrients for crop use thus yielded
higher to sole inorganic fertilizers. In contrary to
synthetic fertilizers, vermicomposting reduce soil
toxicity by buffering action, prevent soil degradation
and enhance soil fertility status. Nitrogen is an
important constituent of growth. Effect of N level on
Indian mustard shows that all the growth characters
except number of branches increases with the
increasing nitrogen levels. Rajiv (2014a) reported
good impact of dissemination and diffusion of conservation agronomical practices on area
expansion (389.6 ha) as well as volume (623.36 t)
and value of produce (199.47 lac) of mustard in
Hamirpur district of Uttar Pradesh. Rajiv (2014b)
also stated that the improved techniques increased in
yield of vegetables by the margins of 44.35 to
58.23% over conventional system.
Therefore, in view of above facts, the field
experiment was conducted to study the effect of
integrated nutrient management on growth and
development parameters (plant height, No. of
branches, LAI and dry matter accumulation) of
O
RESEARCH ARTICLE

290 SAUHARD DUBEY, M.Z. SIDDIQUI, SAURABH RANA, GAURAV SHUKLA, DHARMENDRA SINGH
AND ASHISH NATH PANDEY
mustard (Brassica Juncea L.) in irrigated condition
of Upper Gangetic Plains.
MATERIALS AND METHODS
The experiment was conducted at Students’
Instruction Farm (SIF) of Chandra Shekhar Azad
University of Agriculture & Technology, Kanpur
(U.P) during Rabi season 2017-18. The field was
well levelled and irrigated by tube well. Soil of the
experimental field was sandy loam in texture
with 7.9 pH and electrical conductivity was
0.33 dSm-1. Nine different treatments viz., 100%
RDF (N:P:K:S @ 120:60:40:40 kg ha-1), 100% RDF + bio-fertilizers (azotobacter + PSB) @ 7.5 kg ha-1,
75% RDF + FYM @ 2.5 t ha-1 + ZnSO4 @ 10 kg ha-
1, 75% RDF + vermicompost @ 0.62 t ha-1 + ZnSO4
@ 10 kg ha-1, 75% RDF + FYM @ 2.5 t ha-1 + bio-
fertilizers @ 7.5 kg ha-1, 75% RDF + vermicompost
@ 0.62 t ha-1 + bio-fertilizers @ 7.5 kg ha-1, 50%
RDF + vermicompost @ 1.25 t ha-1 + ZnSO4 @ 10
kg ha-1, 50% RDF + FYM @ 5 t ha-1 + ZnSO4 @ 10
kg ha-1 and 50% RDF + FYM @ 2.5 t ha-1 +
vermicompost @ 0.62 t ha-1 + bio-fertilizers @ 7.5
kg ha-1 + ZnSO4 @ 10 kg ha-1 were tested against control in randomized block design (RBD). The
treatments were replicated thrice to avoid any effect
of heterogeneity as per standard procedure. Land
preparation was started after harvesting of kharif
crop, for proper germination of seeds. Seeds were
sown in rows at a distance of 45 cm by using seeds
rate of 5 kg ha-1. The recommended dose of
fertilizers were applied at the rate of 120 kg N, 60 kg
P2O5, 40 kg K2O and 40 kg S (elemental sulphur) per
hectare. Full amount of phosphorus, potash, sulphur
and 75% nitrogen was applied as basal dose while
the remaining amount of nitrogen was applied after first irrigation as top dressing. The crop was further
fertilized with FYM, vermicompost, bio-fertilizer,
sulphur and zinc according to treatments. Three
phases thinning was done during the crop period in
which first thinning was done at seedling stage
at 10 days after sowing to maintain optimum plant to
plant distance by 15 cm followed by 15-20 DAS and
40 DAS. Crop variety Pusa Mustard-30 was used under study, which is a low erucic acid variety of
Indian mustard [Brassica Juncea (L.) Czern & Coss]
developed by Division of Genetics, Indian
Agricultural Research Institute, New Delhi. The new
released variety along with integrated nutrient
management increased significantly number of
leaves per plant and dry matter accumulation and
number of branches per plant leading to better plant
floral growth thus leads to increase in yield. The crop
was harvested at physiological maturity on 18th
March, 2018. The data regarding growth characters and yield were analysed with statistical analysis and
significance of treatments were tested with the help
of ‘F’ test.
RESULT AND DISCUSSION
Growth parameters The data regarding growth characters viz., plant
height, number of branches, LAI (leaf area index)
and dry matter accumulation are depicted in Table 1,
Table 2, Table 3 and Table 4, respectively.
Plant height
The maximum plant height of 12.77, 121.13, 193.46
and 201.41 cm were obtained at 30 DAS, 60 DAS,
90 DAS and at maturity respectively, with the
application of 50% RDF + FYM @ 2.5 t ha-1 +
vermicompost @ 0.62 t ha-1 + bio-fertilizers @ 7.5
kg ha-1 + ZnSO4 @ 10 kg ha-1 (T10) followed by 75%
RDF + vermicompost @ 0.62 t ha-1 + bio-fertilizers
@ 7.5 kg ha-1 (T7) and 50% RDF + vermicompost @
1.25 t ha-1 + ZnSO4 @ 10 kg ha-1 (T8) (Table 1).
However, these three treatments were statistically at
par with each other. Treatment T10 (50% RDF + FYM @ 2.5 t ha-1 + vermicompost @ 0.62 t ha-1 +
bio-fertilizers @ 7.5 kg ha-1 + ZnSO4 @ 10 kg ha-1)
significantly superior over 100% RDF (N:P:K:S @
120:60:40:40 kg ha-1
) (T2) as well as control (T1).
Jaiswal et al. (2017) also reported similar results.
Table 1. Plant height of mustard as influenced by different treatments
Treatments
Plant height (cm)
30
DAS
60
DAS
90
DAS
At
maturity
T1 Control 11.28 78.93 125.83 128.65
T2 100% RDF (N:P:K:S @ 120:60:40:40 kg ha-1) 11.46 103.03 164.25 168.55
T3 100% RDF + bio-fertilizers (azotobacter + PSB) @ 7.5 kg
ha-1 11.49 106.03 169.10 176.18
T4 75% RDF + FYM @ 2.5 t ha-1 + ZnSO4 @ 10 kg ha-1 11.68 107.83 171.93 175.74
T5 75% RDF + vermicompost @ 0.62 t ha-1 + ZnSO4 @ 10 kg
ha-1 12.14 112.13 178.75 182.71
T6 75% RDF + FYM @ 2.5 t ha-1 + bio-fertilizers @ 7.5 kg
ha-1 12.55 115.83 184.72 189.15
T7 75% RDF + vermicompost @ 0.62 t ha-1 + bio-fertilizers
@ 7.5 kg ha-1 12.57 119.23 190.07 194.28

JOURNAL OF PLANT DEVELOPMENT SCIENCES VOL. 12(5) 291
T8 50% RDF + vermicompost @ 1.25 t ha-1 + ZnSO4 @ 10 kg
ha-1 12.45 118.23 188.56 192.74
T9 50% RDF + FYM @ 5 t ha-1 + ZnSO4 @ 10 kg ha-1 12.07 117.53 187.45 191.60
T10 50% RDF + FYM @ 2.5 t ha-1 + vermicompost @ 0.62 t
ha-1
+ bio-fertilizers @ 7.5 kg ha-1
+ ZnSO4 @ 10 kg ha-1
12.77 121.13 193.46 201.41
S.E. (d) ± 1.079 4.605 10.095 13.487
C.D. at 5% N. S 9.670 21.216 28.346
Number of branches/plant
In case of number of branches/plant, application of
50% RDF + FYM @ 2.5 t ha-1 + vermicompost @
0.62 t ha-1 + bio-fertilizers @ 7.5 kg ha-1 + ZnSO4 @
10 kg ha-1 (T10) recorded highest number of primary
branches of 6.64, 7.35 and 7.59 at 60 DAS, 90 DAS
and at maturity respectively (Table 2). It was
followed by 75% RDF + vermicompost @ 0.62 t ha-1
+ bio-fertilizers @ 7.5 kg ha-1 (T7) and 50% RDF +
vermicompost @ 1.25 t ha-1
+ ZnSO4 @ 10 kg ha-1
(T8). However, excluding the treatment of control
(T1) and 100% RDF (T2), all the treatments from T3
to T10 were statistically at par with each other in
terms of number of primary branches. The minimum
values of number of primary branches of 4.33, 4.79
and 4.95 at 60 DAS, 90 DAS and at maturity
respectively, were found in control.
Similar trend was also observed in case of number of
secondary branches/plant and application of 50% RDF + FYM @ 2.5 t ha-1 + vermicompost @ 0.62 t
ha-1 + bio-fertilizers @ 7.5 kg ha-1 + ZnSO4 @ 10 kg
ha-1 (T10) recorded highest number of secondary
branches of 9.17, 9.31 and 9.37 at 60 DAS, 90 DAS
and at maturity respectively, followed by 75% RDF
+ vermicompost @ 0.62 t ha-1 + bio-fertilizers @ 7.5
kg ha-1 (T7) and 50% RDF + vermicompost @ 1.25 t
ha-1 + ZnSO4 @ 10 kg ha-1 (T8) at maturity stage
whereas, at the stage of 60 DAS and 90 DAS, the
trend is different and treatment T7 was followed by
50% RDF + FYM @ 5 t ha-1 + ZnSO4 @ 10 kg ha-1
(T9) in terms of secondary branches.
Similarly to number of primary and secondary branches/plant, the significant role of different
sources of nutrient was observed and application of
50% RDF + FYM @ 2.5 t ha-1 + vermicompost @
0.62 t ha-1 + bio-fertilizers @ 7.5 kg ha-1 + ZnSO4 @
10 kg ha-1 (T10) recorded significantly highest
number of tertiary branches of 3.14, 3.73 and 3.97
followed by 75% RDF + vermicompost @ 0.62 t ha-1
+ bio-fertilizers @ 7.5 kg ha-1 (T7) and 50% RDF +
vermicompost @ 1.25 t ha-1 + ZnSO4 @ 10 kg ha-1
(T8) which were significantly superior over other
treatments. This may be due to the better establishment of plants under these treatments
compared to other remaining treatments and it might
be also due to improvement in nutrient availability
for crop use. Mukherjee (2016) and Yadav et al.
(2018) also reported similar results.
Table 2. Effect of different treatments on number of branches of mustard crop
Treatments
Primary branches Secondary branches Tertiary branches
60
DAS
90
DAS
At
maturity
60
DAS
90
DAS
at
maturity
60
DAS
90
DAS
At
maturity
T1 Control 4.33 4.79 4.95 5.98 6.01 6.10 2.05 2.43 2.59
T2
100% RDF
(N:P:K:S @ 120:60:40:40 kg ha-
1)
5.65 6.25 6.46 7.81 7.91 7.97 2.68 3.17 3.38
T3
100% RDF + bio-
fertilizers
(azotobacter + PSB)
@ 7.5 kg ha-1
5.91 6.53 6.75 8.16 8.08 8.34 2.80 3.31 3.53
T4
75% RDF + FYM
@ 2.5 t ha-1 +
ZnSO4 @ 10 kg ha-1
5.92 6.55 6.77 8.18 8.22 8.35 2.81 3.32 3.54
T5
75% RDF +
vermicompost @
0.62 t ha-1 + ZnSO4
@ 10 kg ha-1
6.15 6.80 7.03 8.49 8.59 8.68 2.91 3.45 3.68
T6
75% RDF + FYM
@ 2.5 t ha-1 + bio-fertilizers @ 7.5 kg
ha-1
6.36 7.03 7.26 8.77 8.86 8.97 3.01 3.56 3.79
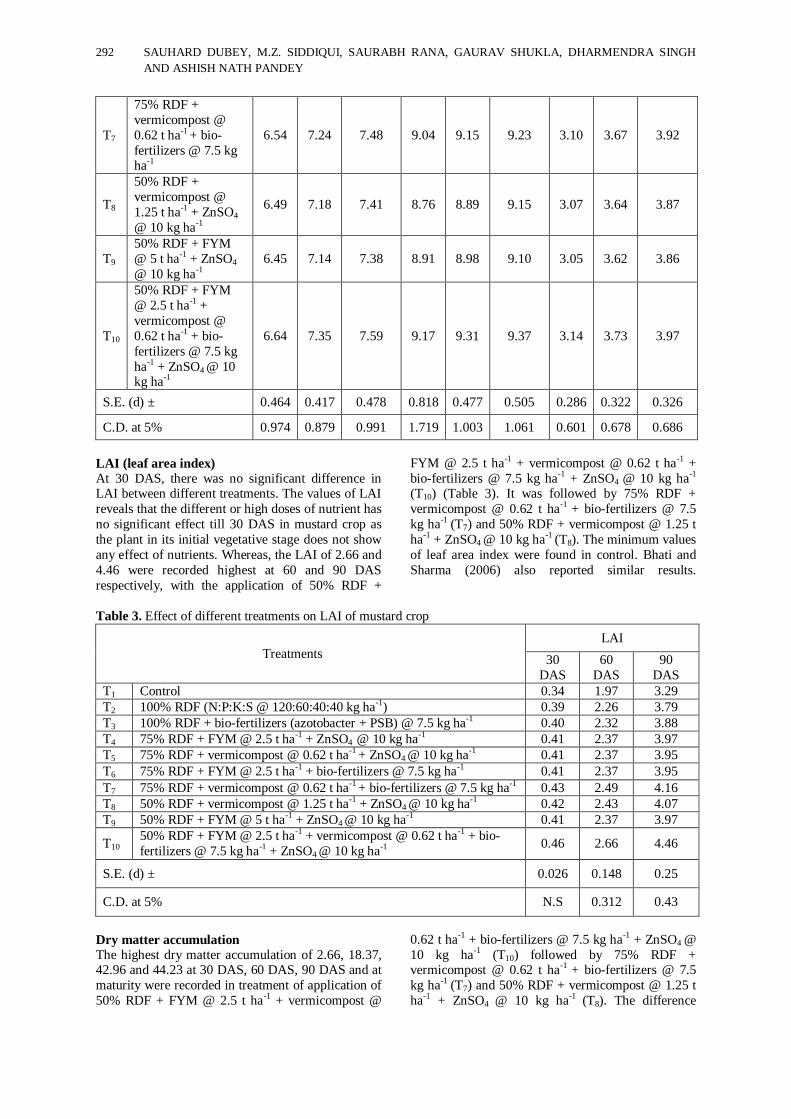
292 SAUHARD DUBEY, M.Z. SIDDIQUI, SAURABH RANA, GAURAV SHUKLA, DHARMENDRA SINGH
AND ASHISH NATH PANDEY
T7
75% RDF +
vermicompost @
0.62 t ha-1 + bio-
fertilizers @ 7.5 kg ha
-1
6.54 7.24 7.48 9.04 9.15 9.23 3.10 3.67 3.92
T8
50% RDF +
vermicompost @
1.25 t ha-1 + ZnSO4
@ 10 kg ha-1
6.49 7.18 7.41 8.76 8.89 9.15 3.07 3.64 3.87
T9
50% RDF + FYM
@ 5 t ha-1 + ZnSO4
@ 10 kg ha-1
6.45 7.14 7.38 8.91 8.98 9.10 3.05 3.62 3.86
T10
50% RDF + FYM
@ 2.5 t ha-1 +
vermicompost @
0.62 t ha-1 + bio-
fertilizers @ 7.5 kg
ha-1 + ZnSO4 @ 10 kg ha-1
6.64 7.35 7.59 9.17 9.31 9.37 3.14 3.73 3.97
S.E. (d) ± 0.464 0.417 0.478 0.818 0.477 0.505 0.286 0.322 0.326
C.D. at 5% 0.974 0.879 0.991 1.719 1.003 1.061 0.601 0.678 0.686
LAI (leaf area index)
At 30 DAS, there was no significant difference in LAI between different treatments. The values of LAI
reveals that the different or high doses of nutrient has
no significant effect till 30 DAS in mustard crop as
the plant in its initial vegetative stage does not show
any effect of nutrients. Whereas, the LAI of 2.66 and
4.46 were recorded highest at 60 and 90 DAS
respectively, with the application of 50% RDF +
FYM @ 2.5 t ha-1 + vermicompost @ 0.62 t ha-1 +
bio-fertilizers @ 7.5 kg ha-1 + ZnSO4 @ 10 kg ha-1 (T10) (Table 3). It was followed by 75% RDF +
vermicompost @ 0.62 t ha-1 + bio-fertilizers @ 7.5
kg ha-1 (T7) and 50% RDF + vermicompost @ 1.25 t
ha-1 + ZnSO4 @ 10 kg ha-1 (T8). The minimum values
of leaf area index were found in control. Bhati and
Sharma (2006) also reported similar results.
Table 3. Effect of different treatments on LAI of mustard crop
Treatments
LAI
30
DAS
60
DAS
90
DAS
T1 Control 0.34 1.97 3.29
T2 100% RDF (N:P:K:S @ 120:60:40:40 kg ha-1) 0.39 2.26 3.79
T3 100% RDF + bio-fertilizers (azotobacter + PSB) @ 7.5 kg ha-1 0.40 2.32 3.88
T4 75% RDF + FYM @ 2.5 t ha-1 + ZnSO4 @ 10 kg ha-1 0.41 2.37 3.97
T5 75% RDF + vermicompost @ 0.62 t ha-1 + ZnSO4 @ 10 kg ha-1 0.41 2.37 3.95
T6 75% RDF + FYM @ 2.5 t ha-1 + bio-fertilizers @ 7.5 kg ha-1 0.41 2.37 3.95
T7 75% RDF + vermicompost @ 0.62 t ha-1 + bio-fertilizers @ 7.5 kg ha-1 0.43 2.49 4.16
T8 50% RDF + vermicompost @ 1.25 t ha-1 + ZnSO4 @ 10 kg ha-1 0.42 2.43 4.07
T9 50% RDF + FYM @ 5 t ha-1 + ZnSO4 @ 10 kg ha-1 0.41 2.37 3.97
T10 50% RDF + FYM @ 2.5 t ha-1 + vermicompost @ 0.62 t ha-1 + bio-
fertilizers @ 7.5 kg ha-1 + ZnSO4 @ 10 kg ha-1 0.46 2.66 4.46
S.E. (d) ± 0.026 0.148 0.25
C.D. at 5% N.S 0.312 0.43
Dry matter accumulation
The highest dry matter accumulation of 2.66, 18.37, 42.96 and 44.23 at 30 DAS, 60 DAS, 90 DAS and at
maturity were recorded in treatment of application of
50% RDF + FYM @ 2.5 t ha-1 + vermicompost @
0.62 t ha-1
+ bio-fertilizers @ 7.5 kg ha-1
+ ZnSO4 @
10 kg ha-1 (T10) followed by 75% RDF + vermicompost @ 0.62 t ha-1 + bio-fertilizers @ 7.5
kg ha-1 (T7) and 50% RDF + vermicompost @ 1.25 t
ha-1 + ZnSO4 @ 10 kg ha-1 (T8). The difference

JOURNAL OF PLANT DEVELOPMENT SCIENCES VOL. 12(5) 293
between treatments was significant at the stages of
60 DAS, 90 DAS and at maturity but at 30 DAS,
there is no significant difference between treatments.
The reason behind more dry matter in integrated
nutrient supply may be the proper establishment of
crop plants, increased height and larger vegetative growth. These results are in close conformity of
Jakhar and Singh (2004), Mandal and Sinha (2004),
Singh et al. (2015) and Tomar et al. (2017). Rajiv et
al. (2012) also reported that the sulphur application
increased plant height, branches/plant and dry
matter/plant significantly over no sulphur application
in sesame and it might be because sulphur is
involved in photosynthetic process of plant, which has a direct bearing on development and plant
growth.
Table 4. Effect of different treatments on dry matter accumulation of mustard
Treatments
Dry matter accumulation
30
DAS
60
DAS
90
DAS
At
maturity
T1 Control 2.35 12.19 27.95 31.58
T2 100% RDF (N:P:K:S @ 120:60:40:40 kg ha-1) 2.39 15.91 36.47 37.01
T3 100% RDF + bio-fertilizers (azotobacter + PSB) @ 7.5 kg ha-1 2.39 16.38 37.55 37.95
T4 75% RDF + FYM @ 2.5 t ha-1 + ZnSO4 @ 10 kg ha-1 2.43 16.65 38.18 38.59
T5 75% RDF + vermicompost @ 0.62 t ha-1 + ZnSO4 @ 10 kg ha-1 2.53 17.31 39.69 40.12
T6 75% RDF + FYM @ 2.5 t ha-1 + bio-fertilizers @ 7.5 kg ha-1 2.61 17.89 41.02 41.53
T7 75% RDF + vermicompost @ 0.62 t ha-1 + bio-fertilizers @ 7.5
kg ha-1 2.62 18.47 42.21 42.66
T8 50% RDF + vermicompost @ 1.25 t ha-1 + ZnSO4 @ 10 kg ha-1 2.59 18.26 41.87 42.32
T9 50% RDF + FYM @ 5 t ha-1 + ZnSO4 @ 10 kg ha-1 2.51 18.16 41.62 42.07
T10 50% RDF + FYM @ 2.5 t ha-1 + vermicompost @ 0.62 t ha-1 +
bio-fertilizers @ 7.5 kg ha-1 + ZnSO4 @ 10 kg ha-1 2.66 18.37 42.96 44.23
S.E. (d) ± 0.37 1.050 2.093 2.506
C.D. at 5% N.S 2.207 4.399 5.266
Grains yield
The grains yield of mustard influenced significantly
by different treatment (Table 5). The significantly
highest grains yield of 23.25 q ha1 was produced
with the application of 50% RDF + FYM @ 2.5 t ha-1 + vermicompost @ 0.62 t ha-1 + bio-fertilizers @ 7.5
kg ha-1 + ZnSO4 @ 10 kg ha-1 (T10). It was followed
by 75% RDF + vermicompost @ 0.62 t ha-1 + bio-
fertilizers @ 7.5 kg ha-1 (T7) and 50% RDF +
vermicompost @ 1.25 t ha-1 + ZnSO4 @ 10 kg ha-1
(T8). The most probable reason for this phenomenon
may be taller plant and higher dry matter, more
vegetative growth under proper organic and
inorganic nutrient supply (INM). This might had
resulted to increase grains yield. These findings are
in accordance with the findings of Giri et al. (2005),
Tripathi et al. (2011), Baranwal et al. (2017), Singh
et al. (2018) and Yadav et al. (2018). Rajiv (2014) also reported that the application of vermicompost
integration with inorganic fertilizers might have
improved the availability of nutrients for crop use
thus yielded higher to NPK fertilizers treatment. A
poor grains yield was produced as a result of
reflection of poor fertility as reported by Tomar et al.
(2016) and Tomar et al. (2019) in different crops.
Table 5. Effect of treatments on grains yield of mustard
Treatments Grains yield
(q ha1)
T1 Control 14.75
T2 100% RDF (N:P:K:S @ 120:60:40:40 kg ha-1) 19.23

294 SAUHARD DUBEY, M.Z. SIDDIQUI, SAURABH RANA, GAURAV SHUKLA, DHARMENDRA SINGH
AND ASHISH NATH PANDEY
T3 100% RDF + bio-fertilizers (azotobacter + PSB) @ 7.5 kg ha-1 19.82
T4 75% RDF + FYM @ 2.5 t ha-1 + ZnSO4 @ 10 kg ha-1 20.15
T5 75% RDF + vermicompost @ 0.62 t ha-1 + ZnSO4 @ 10 kg ha-1 20.95
T6 75% RDF + FYM @ 2.5 t ha-1 + bio-fertilizers @ 7.5 kg ha-1 21.65
T7 75% RDF + vermicompost @ 0.62 t ha-1 + bio-fertilizers @ 7.5 kg ha-1 22.90
T8 50% RDF + vermicompost @ 1.25 t ha-1 + ZnSO4 @ 10 kg ha-1 22.10
T9 50% RDF + FYM @ 5 t ha-1 + ZnSO4 @ 10 kg ha-1 21.97
T10 50% RDF + FYM @ 2.5 t ha-1 + vermicompost @ 0.62 t ha-1 + bio-fertilizers @
7.5 kg ha-1 + ZnSO4 @ 10 kg ha-1 23.25
S.E. (d) ± 1.400
C.D. at 5% 2.942
CONCLUSION
On the basis of above findings, it can be concluded
that the application of 50% RDF + FYM @ 2.5 t ha-1
+ vermicompost @ 0.62 t ha-1 + bio-fertilizers @ 7.5
kg ha-1 + ZnSO4 @ 10 kg ha-1 (T10) shows the
outstanding results in terms of significant growth and
development parameters (plant height, number of
branches, leaf area index and dry matter
accumulation) and grains yield. Therefore, it may be
recommended for cultivation of mustard under Upper Gangetic Plains.
REFERENCES
Bhati, A.S. and Sharma, S.K. (2006). Influence of
potassium and time of application and leaf area index
and chlorophyll content of mustard. Environment and
Ecology, 245(3): 724-725.
Baranwal, Dewanshu, Tomar, Saurabh, Singh,
Jagendra Pratap and Maurya, Jayant Kumar (2017). Effect of Foliar Application of Zinc and Boron on Fruit Growth, Yield and Quality of
Winter Season Guava (Psidium guajava L.).
Int.J.Curr.Microbiol App. Sci, 6(9): 1525-1529.
Giri, P.R., Khawale, V.S., Pawar, W.S. and
Sonawale, A.B. (2005). Effect of phosphorus and
sulphur application on growth and yield of (Brassica
juncea L.). Journal of Soils and Crops, 15(2): 448-
451.
Jakhar, S.R. and Singh, M. (2004). Residual effect
of FYM, phosphorus and zinc levels on growth, yield
and quality of mustard. Journal of Eco-physiology,
7(3/4): 129-136.
Jaiswal, Ambesh Kumar, Singh, Jagendra Pratap,
Tomar, Saurabh, Abhishek and Thakur, Nidhika (2017). Effect of Seedlings Age on Growth, Yield
Attributes and Yield of Tomato (Lycopersicon
esculentum Mill.). Int. J. Curr.Microbiol.App.Sci,
6(9): 1521 -1524.
Mandal, K.G. and Sinha, A.C. (2004). Nutrient
management effect on light interception, photosynthesis,
growth, dry matter production and yield of Indian
mustard (Brassica juncea). Journal of Agronomy and
Crop Science, 190 (2): 119-129.
Mukherjee, D. (2016). Effect of Various Sources of
Nutrients on Growth and Productivity of Indian
Mustard (BrassicaJuncea) under Terraced
Cultivation. Journal of Agricultural Engineering and
Food Technology, 3: 167-171.
Rajiv (2014). On-farm evaluation of integrated nutrient management in potato (Solanum tuberosum
L.) under south-western semi-arid zone of U.P.
Agriculture Update, 9(1): 76-78.
Rajiv (2014a). Impact of dissemination and diffusion
of conservation agronomical practices on area
expansion in Hamirpur district of Bundelkhand.
International Journal of Agricultural Sciences,
10(1): 221-224.
Rajiv (2014b). Impact of improved technologies on
productivity and profitability of vegetables on
farmers fields in Hamirpur district, Bundelkhand tract of Uttar Pradesh. Indian Journal of Applied
Research, 4(7): 393-395.
Rajiv (2019). Productivity and economics of potato
grown with organics fertilization in comparison to
inorganic fertilizers. International Journal of
Agricultural Sciences, 15 (1): 32-36.
Rajiv, Singh, D.P. and Prakash, H.G. (2012).
Response of sesame (Sesamum indicum L.) varieties
to sulphur and potassium application under rainfed
condition. International Journal of Agricultural
Sciences, 8(2): 476-478.
Singh, H., Singh, R.P., Meena, B.P., Lal, B.,
Dotaniya, M.L., Shirale, A.O. and Kumar, K. (2018). Effect of integrated nutrient management
(INM) modules on late sown Indian mustard [B.
juncea(L.) Cernj.&Cosson] and soil properties.
Journal of Cereals and Oilseeds, 9(4): 37-44.

JOURNAL OF PLANT DEVELOPMENT SCIENCES VOL. 12(5) 295
Singh, D.K., Singh, T. and Prakash, C. (2015).
Effect of Organic sources of Nutrients on growth of
Indian mustard (Brassica junceaL.) cultivars under
late sown condition. Environment & Ecology, 33(2):
791-794.
Thipathi, M.K., Chaturvedi, S., Shukla, K. and Saini, K. (2011). Influence of integrated nutrient
management on growth, yield and quality of Indian
mustard (Brassica junceaL.) in tarairegion of
northern India. Journal of Crop and Weed 7(2): 104-
107.
Tomar, Saurabh, Dubey, A.K, Singh, Sanjiv and
Ujjwal, Vivek (2016). ffect of different levels of
NAA, GA3 and 2, 4-d on growth and Yield of tomato
(lycopersicon esculentum mill). Annals of
Horticulture, 9(1): 97-100.
Tomar, Saurabh, Singh, Sanjive Kr., Dubey, A.K.,
Singh, Jagendra Pratap and Abhishek (2017).
Role of Plant Hormones on Vegetative Growth of
Tomato (Lycopersicon esculentum Mill.).
Int.J.Curr.Microbiol.App.Sci, 6(9): 3319-3323.
Tomar, Saurabh, Rajiv, Beniwal, Deepa and Sourabh (2019 ). Effect of transplanting dates and
mulching on growth and yield of tomato (Solanum
lycopersicum L.). Vegetable Science, 46 (1&2): 39-
43.
Yadav, K.M., Chaudary, S., Kumar, H., Singh, R.
and Yadav, R. (2018). Effect of integrated nutrient
management on growth and yield in mustard
(Brassica juncea(L.) Czern & Cosson). International
Journal of Chemical Studies, 6(2): 3571-3573.

296 SAUHARD DUBEY, M.Z. SIDDIQUI, SAURABH RANA, GAURAV SHUKLA, DHARMENDRA SINGH
AND ASHISH NATH PANDEY

*Corresponding Author
________________________________________________ Journal of Plant Development Sciences Vol. 12(5): 297-301. 2020
UTILIZATION POTENTIAL OF AGRICULTURAL INFORMATION SOURCES
K. Pradhan1, Avishek Saha
2, Biman Maity
2* and Keshav Ram
3
Department of Agricultural Extension, Uttar BangaKrishiViswavidyalaya, Pundibari, Coochbehar
Email: [email protected]
Received-11.05.2020, Revised-30.05.2020
Abstract: We are now living in the age of information where accessing and utilizing appropriate information source play crucial role in determining the success of any human activity. Agriculture of today has also become very time-critical and information-intense. Hence, the utilization potential of any information source to cater to the information needs of the farmers in various aspects would determine its usefulness to the farming community. With this background, the present
research work has been conducted in order to assess the utilization potential of the existing information sources in the study area and thereby identify the factors influencing the utilization potential of the information sources. In the present study, utilization potential of the information sources has been conceptualized as the predicted variable and the nineteen other attributes associated with the farmers has been considered as the predictor variables. The study has been carried out in three villages of Coochbehar-I and two villages of Coochbehar-II block of Coochbehar district in West Bengal. Purposive as well as multistage sampling and random sampling procedures were followed in selecting hundred numbers of respondents. The data were collected with the help of structured questionnaire through personal interview method. The major statistical tools like correlation co-efficient and multiple regression analysis were used to analyse the data. The important findings of the study are that the timeliness of the information sources has positive association with the utilization potential whereas the
usefulness of the multiple sources of agricultural information ultimately reduces the utilization potential of individual information source. Farmers have also admitted that the agricultural information sources available in the study area have medium level of potential to cater to their information needs. Therefore, there is a scope to further improvement of those information sources for effective and efficient dissemination of appropriate information for sustainable agricultural development.
Keywords: Information source, Information-intense, Utilization potential, Sustainable agricultural development
INTRODUCTION
he successful use of information as a resource
for development of agriculture depends to a
large extent on timely availability of existing sources
of information, pattern of different sources and
channels of agriculture as well as the attitude of
farmers towards information and information
sources. Information is the driving force behind any
development strategy. In India SAU, colleges,
research institutes, NGO’s, KrishiVigyan Kendra,
private agencies have been playing an important role
to disseminate the agricultural information to the farmers. Mainly agricultural information is diffused
through training programme, demonstration,
campaigns and mass media etc.Rural farmers need
various type of information regarding agriculture
such as availability of agricultural support
services,Government regulations, crop production
and managements, disease outbreaks, adaptation of
technologies by other farmers, wage rates, and so
on.Farmers receive agricultural information from a
multitude of sources, such as extension
agencies,mass media, fellow farmers, input dealers etc. (P. Adhigurua et al., 2009). There are also
several portals and SMS system which give the
actual information like market value of the
commodity, weather report, online buyer or seller of
the commodity, pest and insect management
procedure, disease management procedure etc. An
effective and efficient information delivery system plays a critical role to provide reliable and useful
information to the farmers (Demiryureket al., 2008).
In India, Farmers are being provided with knowledge
based information through various toll free numbers,
internet sites, mobile apps, and other means. For
example, Farmers’ Portal (www.farmer.gov.in), m-
Kisan Portal (www.mkisan.gov.in) and Kisan Call
Centers (KCC) are some of the platforms which are
currently active in India (KitturNazhatet al.,
2016).But, sometimes, due to poor information
network connectivity, farmers can not harness the
benefits of the internet related facilities provided by the Government or any other organization. Here,
extension services can play a major role in changing
the scenario of the village through providing
appropriate information to the farmers which are
need-based and demand-driven.Consequently,
agricultural extension, in the current scenario of a
rapidly changing world, has been recognized as an
essential mechanism for delivering knowledge
(information) and advice as an input for modern
farming (Jones, 1997).
Now days, private extension services are also involved in proving information related to agriculture
and allied activities, sometimes through paid services
which is gaining its popularity among the farming
community day by day. In India, though it is
generally claimed that public extension system is the
predominant source of farm information
T
RESEARCH ARTICLE

298 K. PRADHAN, AVISHEK SAHA, BIMAN MAITY AND KESHAV RAM
dissemination (Nirmala et al., 1995), it was
disappointing to note that it was accessed only by a
small proportion of farm households. Therefore, both
public and private extension systems are innovating
approaches for the transfer of technology and
information to farmers so as to empower them to face the challenges of market liberalization and
globalization (P. Adhiguru et al., 2009).
But, before formulating any strategic intervention to
address the information needs of the farmers, it is
very much essential to explore the existing
information sources available to the farmers and their
usefulness in the context of the farmers’ real life
situation. The content of the information services
needs to reflect their diverse circumstances and
livelihoods. Understanding of the communication
network in a specific farming system may provide
the recognition of basic structures, components, weakness and gap of the system and the different
sources of information used by these different
components (Demiryurek, 2000).Therefore, selecting
an appropriate source of information at the right time
in agriculture is the basic requisite for sustainability.
Under this research niche, the present study has been
conceptualized and conceived to assess the
usefulness of the existing agricultural information
sources and thereby identify the attributes associated
with the farmers which significantly influence the
perceived utility of the information sources.
METHODOLOGY
The study is conducted in the villages of Charakpara, Katamari, Elajanerkuthi of Cooch Behar-I block and
Gopalpur, DhangDhingguri of Cooch Behar-II block
under Cooch Behar district in West Bengal.
Purposive as well as multistage and random sampling
procedures were followed for selection of the final
respondents. The district and block were selected
purposively. A total number of hundred (100)
respondents were selected from an exhaustive list of
farmers who have continuous contact with existing
information sources in the locality identified with the
help of the local people, local administrators etc. The
perception of the farmers regarding the utilization potential of the information source has been
conceptualized as the predicted variable and the
nineteen other attributes associated with the farmers
were delineated as the predictor variables in the
present research work. The data were collected with
the help of a structured interview schedule through
personal interview method. The statistical tools like
co-efficient of correlation and multiple regressions
were the key analysers for drawing a definite
conclusion from the collected data.
RESULTS AND DISCUSSION
Table 1. Distribution of respondents according to their utilization potential of information sources
Category Score Frequency Percentage Statistics
Low 18-21.3 11 11 Range=18-28
Mean=24.18
SD=2.00
CV=8.27%
Medium 21.4-24.6 45 45
High 25.7-28 44 44
Table-1 presents the distribution of the farmers
according to utilization potential of information
sources. The results show that majority of the
respondents have agreed upon medium level of
utilization potential of information sources with score 21.4-24.6 (45%) followed by high level with
score25.7-28 (44%) and low level of utilization
potential with score18-21.3(11%). The mean score of
total distribution is 24.18 and standard deviation is 2.
The coefficient of variation value within the
distribution is 8.27% which signifies very high level
of the distribution for the variable ‘utilization
potential of information sources’. The result implies
that most of the farmers in the study area have admitted that existing information sources have the
potential to satisfy their information needs related to
their farming activity.
Table 2. Correlation Coefficient of utilization potential of information source (Y2) with 19 independent
variables
Variables Coefficient of correlation (r)
Age(X1) -.162
Education (X2) .136
Family Education Status (X3) -.018
Major occupation(X4) .161
House Type (X5) -.115
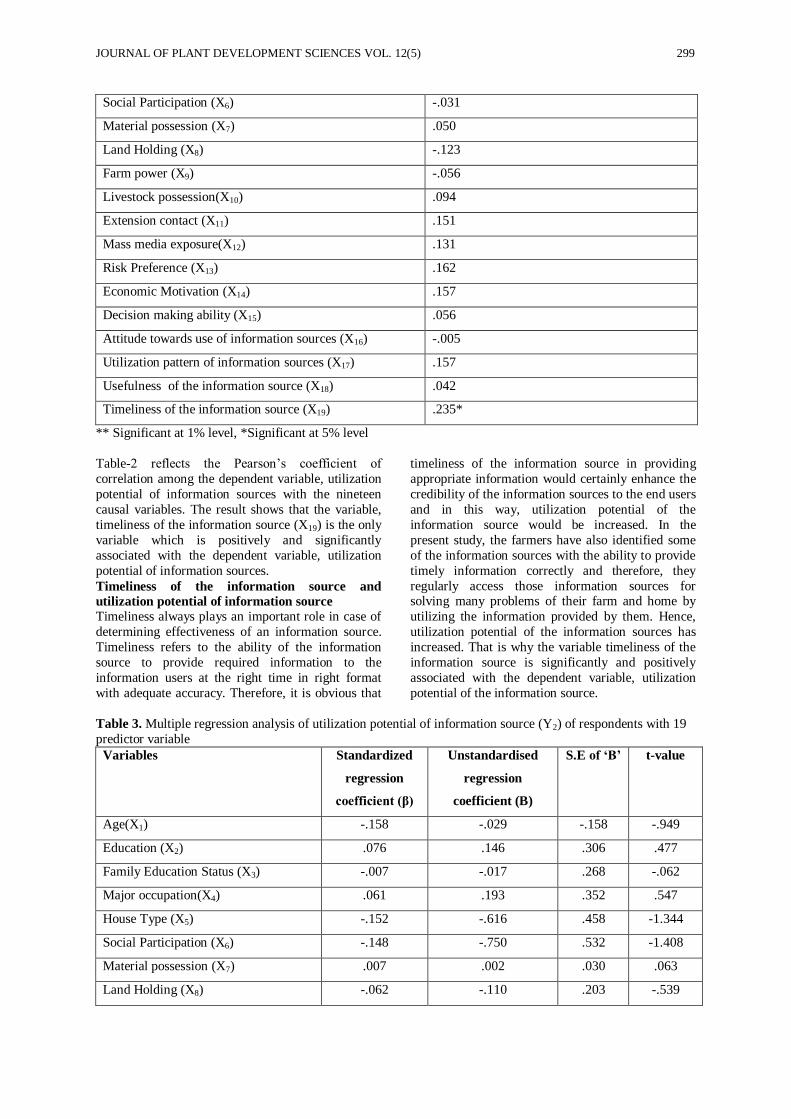
JOURNAL OF PLANT DEVELOPMENT SCIENCES VOL. 12(5) 299
Social Participation (X6) -.031
Material possession (X7) .050
Land Holding (X8) -.123
Farm power (X9) -.056
Livestock possession(X10) .094
Extension contact (X11) .151
Mass media exposure(X12) .131
Risk Preference (X13) .162
Economic Motivation (X14) .157
Decision making ability (X15) .056
Attitude towards use of information sources (X16) -.005
Utilization pattern of information sources (X17) .157
Usefulness of the information source (X18) .042
Timeliness of the information source (X19) .235*
** Significant at 1% level, *Significant at 5% level
Table-2 reflects the Pearson’s coefficient of
correlation among the dependent variable, utilization
potential of information sources with the nineteen
causal variables. The result shows that the variable,
timeliness of the information source (X19) is the only
variable which is positively and significantly
associated with the dependent variable, utilization
potential of information sources.
Timeliness of the information source and
utilization potential of information source
Timeliness always plays an important role in case of
determining effectiveness of an information source.
Timeliness refers to the ability of the information
source to provide required information to the
information users at the right time in right format
with adequate accuracy. Therefore, it is obvious that
timeliness of the information source in providing
appropriate information would certainly enhance the
credibility of the information sources to the end users
and in this way, utilization potential of the
information source would be increased. In the
present study, the farmers have also identified some
of the information sources with the ability to provide
timely information correctly and therefore, they
regularly access those information sources for solving many problems of their farm and home by
utilizing the information provided by them. Hence,
utilization potential of the information sources has
increased. That is why the variable timeliness of the
information source is significantly and positively
associated with the dependent variable, utilization
potential of the information source.
Table 3. Multiple regression analysis of utilization potential of information source (Y2) of respondents with 19
predictor variable
Variables Standardized
regression
coefficient (β)
Unstandardised
regression
coefficient (B)
S.E of ‘B’ t-value
Age(X1) -.158 -.029 -.158 -.949
Education (X2) .076 .146 .306 .477
Family Education Status (X3) -.007 -.017 .268 -.062
Major occupation(X4) .061 .193 .352 .547
House Type (X5) -.152 -.616 .458 -1.344
Social Participation (X6) -.148 -.750 .532 -1.408
Material possession (X7) .007 .002 .030 .063
Land Holding (X8) -.062 -.110 .203 -.539
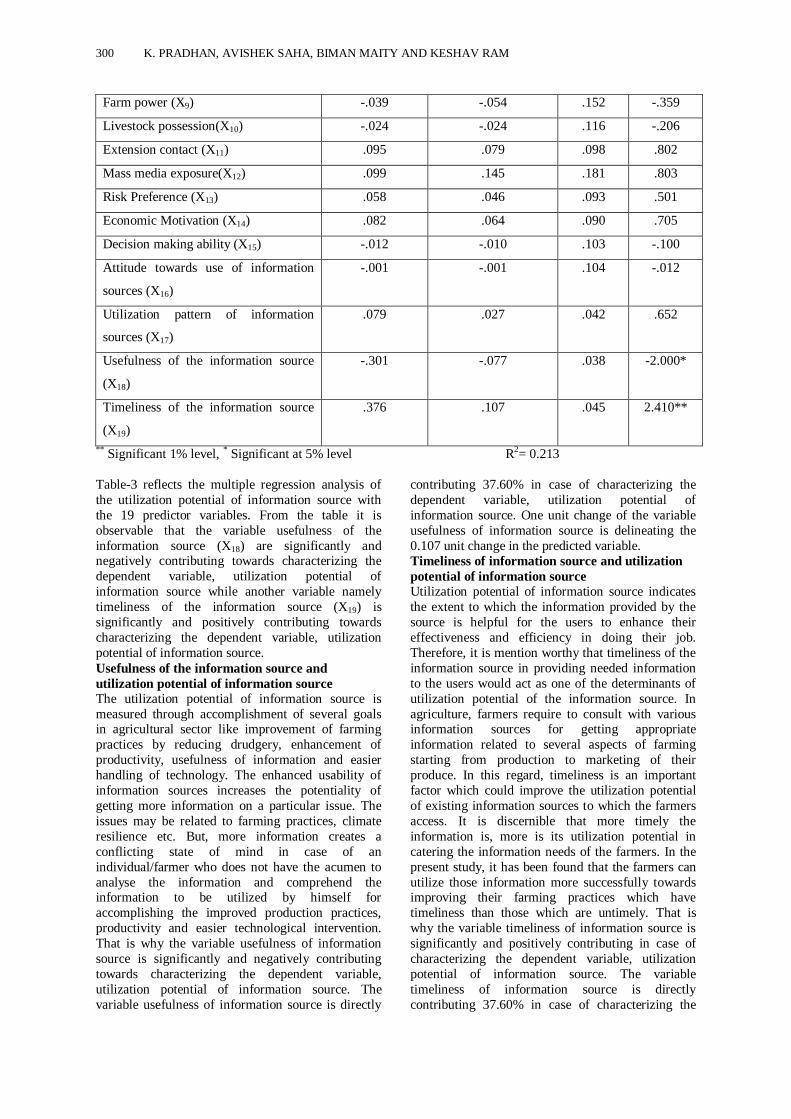
300 K. PRADHAN, AVISHEK SAHA, BIMAN MAITY AND KESHAV RAM
Farm power (X9) -.039 -.054 .152 -.359
Livestock possession(X10) -.024 -.024 .116 -.206
Extension contact (X11) .095 .079 .098 .802
Mass media exposure(X12) .099 .145 .181 .803
Risk Preference (X13) .058 .046 .093 .501
Economic Motivation (X14) .082 .064 .090 .705
Decision making ability (X15) -.012 -.010 .103 -.100
Attitude towards use of information
sources (X16)
-.001 -.001 .104 -.012
Utilization pattern of information
sources (X17)
.079 .027 .042 .652
Usefulness of the information source
(X18)
-.301 -.077 .038 -2.000*
Timeliness of the information source
(X19)
.376 .107 .045 2.410**
** Significant 1% level, * Significant at 5% level R2= 0.213
Table-3 reflects the multiple regression analysis of
the utilization potential of information source with
the 19 predictor variables. From the table it is
observable that the variable usefulness of the
information source (X18) are significantly and negatively contributing towards characterizing the
dependent variable, utilization potential of
information source while another variable namely
timeliness of the information source (X19) is
significantly and positively contributing towards
characterizing the dependent variable, utilization
potential of information source.
Usefulness of the information source and
utilization potential of information source
The utilization potential of information source is
measured through accomplishment of several goals in agricultural sector like improvement of farming
practices by reducing drudgery, enhancement of
productivity, usefulness of information and easier
handling of technology. The enhanced usability of
information sources increases the potentiality of
getting more information on a particular issue. The
issues may be related to farming practices, climate
resilience etc. But, more information creates a
conflicting state of mind in case of an
individual/farmer who does not have the acumen to
analyse the information and comprehend the information to be utilized by himself for
accomplishing the improved production practices,
productivity and easier technological intervention.
That is why the variable usefulness of information
source is significantly and negatively contributing
towards characterizing the dependent variable,
utilization potential of information source. The
variable usefulness of information source is directly
contributing 37.60% in case of characterizing the
dependent variable, utilization potential of
information source. One unit change of the variable
usefulness of information source is delineating the
0.107 unit change in the predicted variable.
Timeliness of information source and utilization
potential of information source
Utilization potential of information source indicates
the extent to which the information provided by the
source is helpful for the users to enhance their
effectiveness and efficiency in doing their job.
Therefore, it is mention worthy that timeliness of the
information source in providing needed information
to the users would act as one of the determinants of
utilization potential of the information source. In
agriculture, farmers require to consult with various information sources for getting appropriate
information related to several aspects of farming
starting from production to marketing of their
produce. In this regard, timeliness is an important
factor which could improve the utilization potential
of existing information sources to which the farmers
access. It is discernible that more timely the
information is, more is its utilization potential in
catering the information needs of the farmers. In the
present study, it has been found that the farmers can
utilize those information more successfully towards improving their farming practices which have
timeliness than those which are untimely. That is
why the variable timeliness of information source is
significantly and positively contributing in case of
characterizing the dependent variable, utilization
potential of information source. The variable
timeliness of information source is directly
contributing 37.60% in case of characterizing the

JOURNAL OF PLANT DEVELOPMENT SCIENCES VOL. 12(5) 301
dependent variable, utilization potential of
information source. One unit change of the variable
timeliness of information source is delineating the
0.107 unit change in the predicted variable.
The R2
value being 0.213, it is to infer that the
nineteen predictor variables put together have explained 21.30% variation embedded with the
predicted variable, utilization potential of
information source. Still 78.70% variable embedded
within predicted one remains unexplained. Thus it
would be suggested that inclusion of some more
contextual variables possessing direct bearing on
utilization potential of information source could have
increased the level of explicability.
CONCLUSION
In this present age of information, every human activity relies largely upon a host of information
sources and the quality of information they provide.
In this regard, the reliability and credibility of the
information also contribute a lot to the usefulness of
the information in the farming situation of the
farmers. The capacity of the information source to
satisfy the information needs of the rural folk in
different aspects of cultivation determines its
usefulness to the farming community. In this context,
utilization potential of the information source is a
very relevant concept through which one can measure the usefulness of information source.
Similarly, in the present study, farmers’ perception
about the utilization potential of the agricultural
information sources available in the study area has
been analysed and the important socio-economic,
socio-personal and socio-psychological attributes of
the farmers have been identified which have a
determining role in case of characterizing the
utilization potential of the information sources. What
have been found in the study area is that most of the
farmers consider the existing information sources as
moderately useful for their farming profession but at the same time, they also locate some areas where
there is ample scope of further improvement in case
of disseminating appropriate information at the right
time to the farmers. Another important finding of the
present study is that the timeliness of the information
source improves its utilization potential in case of
using the information for betterment of the farming
enterprise. On the other hand, presence of so many
useful information sources often put the farmers in a
confusing state of mind regarding selection of the appropriate information source which ultimately
affect the utilization potential of the information
sources. Hence, in totality, a holistic approach needs
to be adopted considering all the elements of the
agricultural information network existing in a local
rural setting to tap maximum utilization potential of
the information sources towards catering the
information needs of the farming community in a
sustainable way.
REFERENCES
Jones, G.E. (1997). ‘The history, development and
the future of agricultural extension’ in B.E. Swanson,
R.P. Bentz and A.J. Sofranko (1997). Improving
agricultural extension – a reference manual. Rome:
FAO.
Demiryurek, K. (2000). The analysis of information
systems for organic and conventional hazelnut
producers in three villages of the Black Sea Region,
Turkey, Doctoral dissertation (Unpublished), The
University of Reading, Reading, UK.
Demiryurek, K. (2008). The use of social network analysis (SNA) to identify opinion leaders: the case
of organic hazelnut producers in Turkey. J. of Ext.
Systems, 24. pp. 17–30.
Nazhat, Kittur, Jain, Rajendra and Kittur,
Parveen (2016). Potential of M-Commerce of
Agricultural Inputs in Kolar, Karnataka, India.
Research Journal of Recent Sciences, 5(7). pp. 1-10.
Nirmala, L., Ravichandran, V. and
Rathakrishnan, T. (1995). Information sources
utilization influencing knowledge and adoption of
biofertilizers, Journal of Extension Education, 6(1).
pp. 1071-1074.
Adhigurua, P., Birthal, P. S. and Ganesh Kumar,
B. (2009). Strengthening Pluralistic Agricultural
Information Delivery Systems in India. Agricultural
Economics Research Review, Vol. 22. pp. 71-79.

302 K. PRADHAN, AVISHEK SAHA, BIMAN MAITY AND KESHAV RAM

*Corresponding Author ________________________________________________ Journal of Plant Development Sciences Vol. 12(5): 303-307. 2020
PLANT GROWTH PROMOTING ACTIVITIES OF INDIGENOUS STRAINS OF
TRICHODERMA VIRIDE AND TRICHODERMA HARZIANUM USED AS SEED
TREATMENT IN GROUNDNUT
Shweta Mishra*1, Arwind Kurre
2 and R.K.S. Tiwari
3
1,2
Departmant of Plant Pathology, IGKV Raipur 3Dean BTC CARS, Bilaspur
Received-05.05.2020, Revised-26.05.2020 Abstract: Experiment was conducted in vivo to study the plant growth promoting activities of strains of Trichoderma harzianum and Trichoderma viride used as seed treatment@ 10 g /kg seed in groundnut. Various observations of growth
parameters and yield components i.e. plant height (cm), no. of branches, no. of pods / plant, unfilled pods/ plant, filled pods/plant and pod yield/ plant (g) were recorded maximum in Trichoderma strains T2 respectively, followed by T3, T4 and minimum unfilled pod was recorded in strain T4(18) superior over control.
Keywords: Groundnut, Trichoderma harzianum, Trichoderma viride growth parameters, Yield components, Seed
INTRODUCTION
roundnut (Arachis hypogaea L.) is a major
legume and an important oil seed crop in India,
covering nearly half of the area under oilseeds.
It is grown in over 100 countries with a total
estimated area of 21.8 million ha and with production
of 28.5 million tons. In India, it is grown over an area
of 4 lakh ha, with an annual production of 5.5 million
tons and productivity of 1007 kg ha in the year 2009-
10 (Economic Survey, 2010-11). Several factors are
responsible for low productivity among which
diseases like leaf spot, collar rot, stem rot, bud
necrosis, etc., are very important. Stem rot, collar rot
and afla root are the major soil borne diseases of
groundnut causing extensive damage to the crop. S.
rolfsii attacks the crop at all the stages causing seed
rot, seedling blight, stem rot and pod rot, the most
common being stem rot (Deepthi and Eswara reddy,
2013). On the contrary, both A. niger and A. flavus
primarily attack the seedling stage causing collar rot
and aflaroot. Out of the only economical
management measure recommended for these
diseases is to treat seed with fungicides, but it can not
protect the crop for longer period (T.benitez ,2004).
The chemical method developed control too has its
own limitations such as high capital investment, non
remunerative, poor availability, selectivity,
temporary effect, efficacy affected by physio
chemicals and biological factors, development of
pest resistance, pollution of food and feeds, health
hazards, environmental pollution, etc. Considering
these limitations, biological control is an important
approach in this direction. (N.B. bagwan, 2011).
Reduction of amount of inoculum or disease
producing activity of a pathogen accomplished by
through one or more organisms other than man"
(Cook and Baker, 1983).
MATERIALS AND METHODS
Experiment was conducted under direct sown
conditions taking groundnut cultivar J-11 in upland
field having clay loam soil. The land was well
prepared by ploughing two three times. Isolaton of
Biological control agents from soil by serial dilution method: Different strains of Trichoderma were
isolated from rhizosphere soil of healthy groundnut
plants by serial dilution technique on Trichoderma
specific medium (Elad, 1980).. Talc powder based
formulations of different strains of Trichoderma spp.
were developed and used as seed treatment. Seeds of
chickpea were treated with Different strains of
Trichoderma spp. @ 10 g /kg seed. Hexaconazole
+Zineb was used @ 3 g kg/seed. Untreated control
was kept for making comparison. Seeds @ 120 kg/ha
were sown in each plot under randomized block
design with three replications. Fertilizers i.e. NPK @ 20:60:0 / ha were applied as basal dose. Plant growth
parameters i.e. plant height cm, number of branches
/plant and yield parameters i.e. No. of pods / plant
and pod yield / plant were recorded from each
treatment.
Whenever required, the glasswares of Borosil make,
plastic plates of Tarson make, blotter paper of
standard grade and chemicals of standard grade
(Merck, Qualigens, S.D. fine etc.) were used during
the course of investigation. All the glasswares,
polythene bags, ethyl alcohol, formalin, chemicals and other materials were procured from the Thakur
Chhedilal Barrister College of Agriculture and
Research Station, Bilaspur (C.G.).
The following equipments or materials used in
present investigation were-
1. Autoclave for media sterilization
2. BOD incubator for incubation
3. Binocular research microscope
4. Compound microscope
5. Hot air oven for glassware sterilization
G
RESEARCH ARTICLE
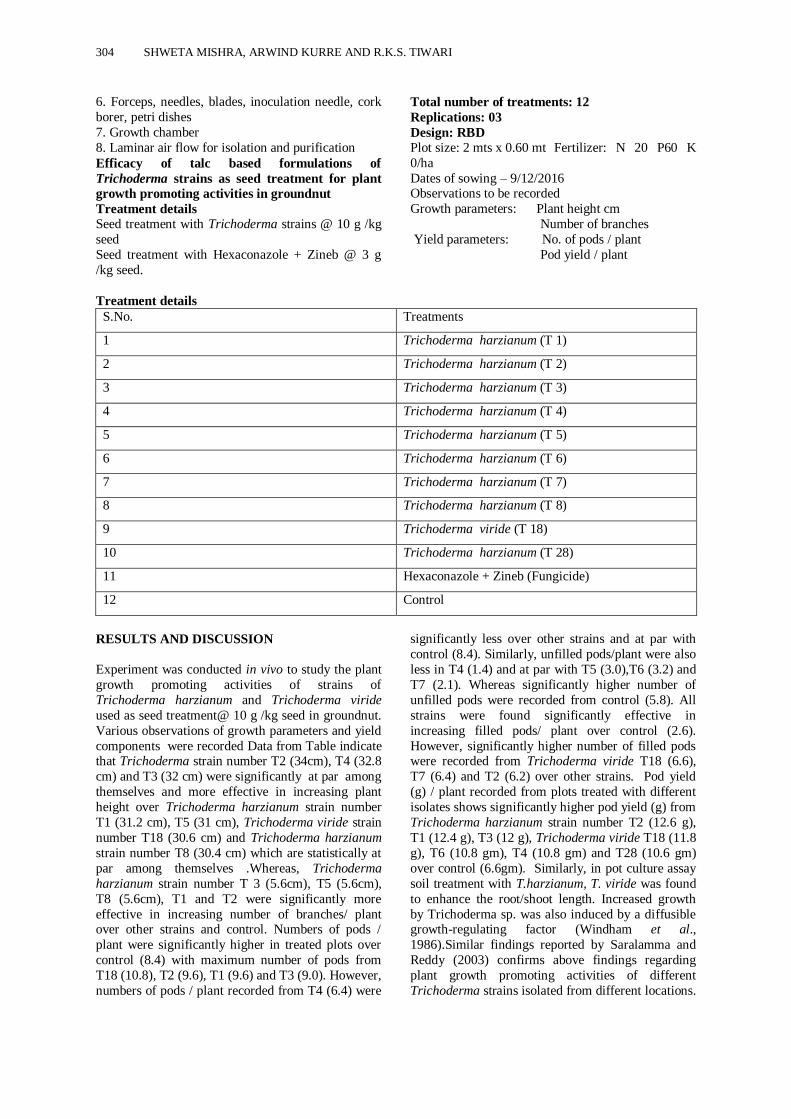
304 SHWETA MISHRA, ARWIND KURRE AND R.K.S. TIWARI
6. Forceps, needles, blades, inoculation needle, cork
borer, petri dishes
7. Growth chamber
8. Laminar air flow for isolation and purification
Efficacy of talc based formulations of
Trichoderma strains as seed treatment for plant
growth promoting activities in groundnut
Treatment details
Seed treatment with Trichoderma strains @ 10 g /kg
seed
Seed treatment with Hexaconazole + Zineb @ 3 g
/kg seed.
Total number of treatments: 12
Replications: 03
Design: RBD
Plot size: 2 mts x 0.60 mt Fertilizer: N 20 P60 K
0/ha
Dates of sowing – 9/12/2016 Observations to be recorded
Growth parameters: Plant height cm
Number of branches
Yield parameters: No. of pods / plant
Pod yield / plant
Treatment details
S.No. Treatments
1 Trichoderma harzianum (T 1)
2 Trichoderma harzianum (T 2)
3 Trichoderma harzianum (T 3)
4 Trichoderma harzianum (T 4)
5 Trichoderma harzianum (T 5)
6 Trichoderma harzianum (T 6)
7 Trichoderma harzianum (T 7)
8 Trichoderma harzianum (T 8)
9 Trichoderma viride (T 18)
10 Trichoderma harzianum (T 28)
11 Hexaconazole + Zineb (Fungicide)
12 Control
RESULTS AND DISCUSSION
Experiment was conducted in vivo to study the plant
growth promoting activities of strains of
Trichoderma harzianum and Trichoderma viride
used as seed treatment@ 10 g /kg seed in groundnut.
Various observations of growth parameters and yield
components were recorded Data from Table indicate that Trichoderma strain number T2 (34cm), T4 (32.8
cm) and T3 (32 cm) were significantly at par among
themselves and more effective in increasing plant
height over Trichoderma harzianum strain number
T1 (31.2 cm), T5 (31 cm), Trichoderma viride strain
number T18 (30.6 cm) and Trichoderma harzianum
strain number T8 (30.4 cm) which are statistically at
par among themselves .Whereas, Trichoderma
harzianum strain number T 3 (5.6cm), T5 (5.6cm),
T8 (5.6cm), T1 and T2 were significantly more
effective in increasing number of branches/ plant over other strains and control. Numbers of pods /
plant were significantly higher in treated plots over
control (8.4) with maximum number of pods from
T18 (10.8), T2 (9.6), T1 (9.6) and T3 (9.0). However,
numbers of pods / plant recorded from T4 (6.4) were
significantly less over other strains and at par with
control (8.4). Similarly, unfilled pods/plant were also
less in T4 (1.4) and at par with T5 (3.0),T6 (3.2) and
T7 (2.1). Whereas significantly higher number of
unfilled pods were recorded from control (5.8). All
strains were found significantly effective in
increasing filled pods/ plant over control (2.6).
However, significantly higher number of filled pods were recorded from Trichoderma viride T18 (6.6),
T7 (6.4) and T2 (6.2) over other strains. Pod yield
(g) / plant recorded from plots treated with different
isolates shows significantly higher pod yield (g) from
Trichoderma harzianum strain number T2 (12.6 g),
T1 (12.4 g), T3 (12 g), Trichoderma viride T18 (11.8
g), T6 (10.8 gm), T4 (10.8 gm) and T28 (10.6 gm)
over control (6.6gm). Similarly, in pot culture assay
soil treatment with T.harzianum, T. viride was found
to enhance the root/shoot length. Increased growth
by Trichoderma sp. was also induced by a diffusible growth-regulating factor (Windham et al.,
1986).Similar findings reported by Saralamma and
Reddy (2003) confirms above findings regarding
plant growth promoting activities of different
Trichoderma strains isolated from different locations.

JOURNAL OF PLANT DEVELOPMENT SCIENCES VOL. 12(5) 305
Table 1. Plant growth promoting activity of indigenous strains of Trichoderma harzianum / Trichoderma
viride as seed treatment in groundnut.
Fig. 1: Plant growth promoting activity of indigenous strains of Trichoderma harzianum / Trichoderma viride
as seed treatment in groundnut.
0
10
20
30
40
50
60
70
80
1 2 3 4 5 6 7 8 9 10 11
Pod yield/ plant ( g)
Filled pods/ Plant
Unfilled pods/ plant
No. of pods / plant
No. of branches
Plant height ( cm)
Strains Designation Plant
height
( cm)
No. of
branches
No. of
pods /
plant
Unfilled
pods/
plant
Filled
pods/
Plant
Pod
yield/
plant
( g)
Trichoderma harzianum T 1 31.2 4.8 9.6 4.6 5.0 12.4
Trichoderma harzianum T 2 34.0 4.8 9.6 3.4 6.2 12.6
Trichoderma harzianum T 3 32.0 5.6 9.0 3.4 5.6 12.0
Trichoderma harzianum T 4 32.8 4.6 6.4 1.8 5.2 10.8
Trichoderma harzianum T 5 31.0 5.6 8.6 3.0 5.6 9.4
Trichoderma harzianum T 6 29.0 3.8 9.0 3.2 5.8 10.8
Trichoderma harzianum T 7 27.4 4.0 8.6 2.1 6.4 12.4
Trichoderma harzianum T 8 30.4 5.6 8.8 4.8 4.0 10.4
Trichoderma viride T 18 30.6 5.4 10.8 4.2 6.6 11.8
Trichoderma harzianum T 28 28.4 4.2 10.0 4.2 5.8 10.6
Control 24.6 3.8 8.4 5.8 2.6 6.6
S E m (±) 0.70 0.28 0.95 0.48 0.25 0.65
CD 5% 2.08 0.83 2.79 1.42 0.74 1.91

306 SHWETA MISHRA, ARWIND KURRE AND R.K.S. TIWARI
Plate 1. Plant growth promoting activity of indigenous strains of Trichoderma harzianum / Trichoderma viride as
seed treatment in groundnut.

JOURNAL OF PLANT DEVELOPMENT SCIENCES VOL. 12(5) 307
REFERENCES
Benitez, T. (2004). Biocontrol mechanisms of
Trichoderma strains. International microbiology. 7:
249-260.
Bagwan, N.B. (April, 2011). Evaluation of
biocontrol potential of Trichoderma species against
Sclerotium rolfsii, Aspergillus niger and Aspergillus
flavus, International Journal of Plant Protection, Vol.
4 No. 1 :pp 107-111
Cook, R.T. and Baker, K.F. (1983). The nature and
practices of biological control of plant pathogens. In: APS Books, St. Paul. Minn.539 pp
Deepthi, K.C. and Reddy Eswara, N.P. (2013).
Stem rot of groundnut(ARACHIS HYPOGAEA L.)
induced by Sclerotium Rolfsii and its management,
International Journal of Life Science Biotechnology
and Pharma Research ,Vol.2,No.3.
Elad, Y. Chet, I. and Katan, Y. (1980).
Trichoderma harzianum a biocontrol agent effective
against Sclerotium rolfsii and Rhizoctonia solani.
Phyto path.70: 119-121.
Saralamrna, S. and Vithal Reddy, T. (2003).
“Integrated Management of Sclerotial Root Rot in
Groundnut”, National Seminar on Stress
Management in Oilseeds For Attaining Self Reliance
in Vegetable Oil Indian Society of Oilseeds
Research, Directorate of Oilseeds Research, Hyderabad January 28 - 30, pp. 20 - 21. 71.
Windham, M. T., Elad, Y. and Baker, R. (1986). A
mechanism for increased plant growth induced by
Trichoderma spp. Phytopathology 26: 518-521.

308 SHWETA MISHRA, ARWIND KURRE AND R.K.S. TIWARI

*Corresponding Author ________________________________________________ Journal of Plant Development Sciences Vol. 12(5): 309-312. 2020
EVALUATION OF SOYBEAN CULTIVARS FOR RESISTANCE TO ALTERNARIA
LEAF SPOT CAUSED BY ALTERNARIA ALTERNATA
Raj Kumar Fagodiya*, Amit Trivedi, B.L. Fagodia and R.S. Ratnoo
Department of Plant Pathology, Rajasthan College of Agriculture (MPUAT) Udaipur
(Rajasthan) 313 001
Email: [email protected]
Received-02.05.2020, Revised-24.05.2020
Abstract: The present study was undertaken to study Biology and Management of Alternaria leaf spot of soybean caused by Alternaria alternata, as the disease is quite destructive in all the soybean growing areas. The field experiment was conducted two consecutive years Kharif season 2018 and 2019 at Department of Plant Pathology, Rajasthan College of Agriculture, Udaipur. Ten cultivars of soybean were screened for these diseases under artificial inoculated field conditions and results revealed that 3 cultivars namely (JS-9305, JS-9752 and RVS 2002-04) exhibited moderately resistant (MR) reaction, while 5 cultivars viz. JS-2029, RKS-18, RKS-113, JS-9560 and RKS-45 exhibited moderately susceptible (MR) reaction. Rest of cultivars viz. RKS-24 and JS-335 showed susceptible (S) reaction.
Keywords: Alternaria leaf spot, Cultivars, Resistance, Soybean
INTRODUCTION
oybean (Glycine max L.) is a member to family
Leguminosae and sub-family Papilionaceae. It is
an important oil seed crop grown in several
developed countries like USA, China, Brazil,
Mexico, Russian federation and India. Soybean has
originated from China during 2800 BC, containing
about 43.2 per cent protein, 20.9 per cent oil, 19.5
per cent fat, 3.7 per cent fibre and small amount of
vitamin B complex and vitamin E (Singh, 2010). In
India, it ranks third after groundnut and rapeseed-mustard in vegetable oil economy and is cultivated
on 10.47 million hectares with total production of
1.07 million tonnes and average yield 1207 kg/hac.
In Rajasthan it is mainly grown in Jhalawar,
Chittorgarh, Kota, Bundi, Baran, Banswara,
Pratapgarh, Udaipur and Bhilwara districts, covering
an area of 0.89 million hectares with production of
1.07 million tonnes and average yield 1049 kg/hac.
(Anonymous, 2017-18).
The area under soybean is consistently increasing
every year in Rajasthan. However due to continuous
monocropping, same variety use, seed material exchanges becoming routine and found contributing
for increasing severity of foliar diseases of soybean
and yield losses year after year. Among the foliar
diseases of soybean, Alternaria leaf spot is
distributed throughout the soybean growing areas of
India but it is of special significance in Madhya
Pradesh, Maharashtra, Rajasthan and Delhi (Gupta
and Chauhan, 2005). Members of genus Alternaria
are cosmopolitan in nature and important fungal
pathogen which mostly cause diseases on aerial parts
of many plants worldwide. The members of this genus like A. alternata, A. solani, A. porri, A.
helianthi, A. duaci, A. carthami, A. tenuissima and A.
macrospora causes different diseases in their
respective hosts (Rostem, 1994). All the aerial parts
of the soybean plant are susceptible to Alternaria spp. which reduces the quality and quantity of seed
yield. In present situation cultivated soybean
varieties by the farmers are susceptible to the
diseases. The diseases can be managed successfully
by using chemical sprays but to avoid ecological
pollution and to reduce the input cost use of resistant
varieties against these diseases is of prime
importance to overcome these losses. Use of resistant
cultivar of crop plays an important role in combating
the losses caused by diseases as it is eco-friendly,
easy and cost-effective disease management strategy. A genotype with disease resistance and high yield
potential offered scope in breeding programme to
evolve multiple tolerance genotypes combined with
good yield. Keeping in view the importance of crop,
disease and considering scope of resistant varieties in
IDM technology, the present study was conducted to
screen the soybean advance lines against Alternaria
leaf spot diseases with high yield superiority for the
identification of resistant sources in available
cultivars.
MATERIALS AND METHODS
Soybean cultivar seed- The ten cultivars/varieties of
soybean received from All India Coordinated
Research Project on Soybean, Agriculture Research
Station, Kota (Agriculture University, Kota) were
screened against the most virulent isolate A.
alternata (1 x 10³ conidia ml-1.) found in pathogenic
potential studies were used.
Screening of cultivars/varieties- Under artificial
inoculated field conditions, 10 cultivars/varieties
were evaluated at the field of Department of Plant Pathology, Rajasthan College of Agriculture,
Udaipur. Seeds were sown in rows each of 3 m
length and maintaining row to row and plant to plant
distance as 30 x 5 cm, with three replications in
S
RESEARCH ARTICLE

310 RAJ KUMAR FAGODIYA, AMIT TRIVEDI, B.L. FAGODIA AND R.S. RATNOO
Randomized Block Design (RBD). Observations on
disease rating were recorded two times first at pre-
flowering stage and second at maturity stage, when
the crop was 45 days old and the expression of
disease was clear, using a standard (0-5 disease
rating scale). Observations for percent disease index
were recorded by visual scoring as per the standard
disease rating 0-5 scale (Sangeetha and
Siddaramaiah, 2007).
Standard disease rating scale
Scale Description of the symptom
1.
2.
3.
4.
5.
Small irregular spots covering <5% leaf area.
Small irregular brown spots with concentric rings covering 5.1-10% leaf area.
Lesions enlarge, irregular brown with concentric rings covering 10.1-25% leaf area.
Lesions coalease to form irregular and appears as a typical leaf spotting symptoms covering
25.1-50% leaf area.
Lesions coalease to form irregular and appears as a typical leaf spotting symptoms covering
>50% leaf area.
The above rating scales or grades are utilized for the
calculation of PDI using the following formula - The
average intensity of each plot was worked out by
using formula
Per cent disease index (PDI) =
Sum of all individual disease rating
------------------------------------------------- x 100
Total no. of plants ass. x maximum rating
The disease reaction was qualitatively expressed as
resistant (score 1), moderately resistant (score 2), moderately susceptible (score 3), susceptible (score
4) and highly susceptible (score 5).
RESULTS AND DISCUSSION
Host plant Resistance is one of the best effective
tools to get rid of the diseases. Utilization and proper
screening of resistant sources is most important. To
find out the stable sources of resistance against
Alternaria leaf spot in soybean ten released varieties
(RKS-113, RKS-18, JS-9752, JS-9560, JS-9305, RKS-24, JS-2029, JS-335, RVS-2002-04 and RKS-
45) were screened under artificial epiphytotic
conditions during both the years i.e. Kharif 2018 and
2019. The experiments were conducted in single row
plot 3 m row length with plant to plant distance 5 cm,
three replications using RBD (Table-1).
Data shows that, including 10 varieties of soybean,
JS-9305 exhibited lowest disease in both the
observation i.e. at pre flowering and maturity stage
with PDI 14.2 and 16.7%, respectively. This was
followed by JS-9752, which showed PDI 15.6 and 18.4% respectively at both the stages. RVS 2002-04
and JS-2029 showed PDI 16.8 and 30.0%,
respectively at pre flowering and 17.9 & 32.2 per
cent disease index at maturity stage. Rest of the
entries viz. RKS-18, RKS-113, JS-9560, RKS-45, JS-
335 and RKS-24 showed the disease intensity in the
range of PDI 33.1 to 61.6, at pre flowering and in the
range of 35.2 to 63.4 per cent disease index, at
maturity stage in the year 2018 (Table 1 and Fig 1).
The similar results were also reported by Mahesha et
al. (2009) evaluated 204 genotypes under natural and
laboratory conditions against major disease and
reported several genotypes having multiple resistance
sources.
In the year 2019, Data shows that JS-9305 exhibited
lowest disease in both the observation i.e. at pre flowering and maturity stage with PDI 16.3 and
19.6%, respectively. This was followed by JS-9752,
which showed PDI 18.2 and 21.7% respectively at
both the stage. RVS 2002-04 and JS-2029 showed
PDI 18.7 and 32.6%, respectively at pre flowering
and 20.8 & 34.8 per cent disease index at maturity
stage. Rest of the entries viz. RKS-18, RKS-113, JS-
9560, RKS-45, JS-335 and RKS-24 showed the
disease intensity in the range of PDI 35.5 to 63.3, at
pre flowering and in the range of 38.5 to 65.8 per
cent disease index, at maturity stage (Table 1 and Fig 1). The similar results were also reported by
Dhurwey (2015) screened 30 soybean varieties
against Alternaria leaf spot and reported that the
incidence of Alternaria leaf spot ranged from 3.0 to
18.0 per cent in cultivar Bragg and Shivalik, higher
incidence of Alternaria leaf spot was recorded in
cultivars NRC 12, NRC 37, MAUS 61, MAUS 71,
VLS 47 from 13.0 to 17.0%.
None of the tested varieties showed immune
reaction, however three varieties namely (JS-9305,
JS-9752 and RVS 2002-04) exhibited moderately resistant (MR) while five varieties (JS-2029, RKS-
18, RKS-113, JS-9560 and RKS-45) showed
moderately susceptible. Rest others were categorized
as susceptible to highly susceptible.

JOURNAL OF PLANT DEVELOPMENT SCIENCES VOL. 12(5) 311
S. No. Category based on PDI variety
1. Absolutely Resistant NIL
2. Resistant NIL
3. Moderately resistant JS-9305, JS-9752 and RVS 2002-04
4. Moderately susceptible JS-2029, RKS-18, RKS-113, JS-9560 and RKS-45
5. Susceptible RKS-24 and JS-335
6. Highly susceptible NIL
Table 1. Screening of soybean cultivars against Alternaria leaf spot under inoculation of A. alternata Kharif 2018 and 2019
S.
No.
Germplasm/Variety
Pre- flowering stage Per cent
Disease Index (PDI)
Maturity stage Percent
Disease Index (PDI)
Disease
Reaction 2018 2019 Pooled 2018 2019 Pooled
1. RKS-113 34.2
(35.7)
37.4
(37.6)
35.8
(36.7)
37.5
(37.7)
40.2
(39.3)
38.8
(38.5)
MS
2. RKS-18
33.1
(35.1)
35.5
(36.5)
34.3
(35.8)
35.2
(36.3)
38.5
(38.3)
36.8
(37.3)
MS
3. JS-9752 15.6
(23.2)
18.2
(25.2)
16.9
(24.2)
18.4
(25.4)
21.7
(27.7)
20.0
(26.5)
MR
4. JS-9560 40.8
(39.7)
42.4
(40.6)
41.6
(40.1)
41.3
(39.9)
43.9
(41.5)
42.6
(40.7)
MS
5. JS-9305 14.2
(22.1)
16.3
(23.8)
15.2
(22.9)
16.7
(24.1)
19.6
(26.2)
18.1
(25.2)
MR
6. RKS-24 61.6
(51.7)
63.3
(52.7)
62.4
(52.2)
63.4
(52.7)
65.8
(54.2)
64.6
(53.5)
S
7. JS-2029 30.0
(33.2)
32.6
(34.8)
31.3
(34.0)
32.2
(34.5)
34.8
(36.1)
33.5
(35.3)
MS
8. JS-335 58.4
(49.8)
59.6
(50.8)
59.0
(50.1)
60.7
(51.8)
62.5
(52.2)
61.6
(51.7)
S
9. RVS 2002-04
16.8
(24.2)
18.7
(25.6)
17.7
(24.9)
17.9
(25.0)
20.8
(27.1)
19.3
(26.08)
MR
10. RKS-45 44.2
(41.6)
46.3
(42.8)
45.2
(42.2)
47.2
(43.3)
50.0
(45.0)
48.6
(44.2)
MS
SEm±
CD at 5%
CV%
1.42
4.22
7.06
1.49
4.43
6.98
0.89
2.55
7.02
1.77
5.27
8.30
1.62
4.97
7.29
1.05
3.03
7.78
Category based on PDI:- 0 = Free from disease (I= Immune), 1 = 1 to 10 PDI (R= Resistant), 2 = 10.1 to 25
PDI (MR=Moderately resistant),
3 = 25.1 to 50 PDI (MS= moderately susceptible), 4 = 50.1 to 75 PDI (S = Susceptible), 5 = >75 PDI (HS=
Highly susceptible)

312 RAJ KUMAR FAGODIYA, AMIT TRIVEDI, B.L. FAGODIA AND R.S. RATNOO
Fig. 1. Screening of soybean cultivars against Alternaria leaf spot under inoculation of A. alternata during
Kharif 2018 and 2019 (Pooled)
The work on identification of multiple disease
resistance sources in cultivable and wild soybean has
been undertaken many workers like Anonymous
(2016), Ingle et al. (2016). In current investigation,
entries showed varied reaction ranging from HR to S.
This might be due to the availability of inoculums or
differential interactions of host genotypes with
different varieties. Zade et al. (2018) evaluated 33
advance lines under natural field conditions against
Alternaria leaf spot and reported 12 genotype
exhibited Highly Resistant (HR) reaction, While 14 genotype shown Moderately Resistant (MR) reaction
and 4 genotype exhibited Moderately Susceptible
(MS) reaction. Rest of genotype showed Susceptible
(S) reaction.
In the present study, varieties viz., JS-9305, JS-9752
and RVS 2002-04 which have shown maximum
resistance against the Alternaria leaf spot. Thus,
these resistant sources of soybean varieties may have
scope in future for breeding in development of
varieties or in integrated disease management
programme.
ACKNOWLEDGEMENT
Authors are thankful to Department of Plant
Pathology, Rajasthan College of Agriculture
(MPUAT), Udaipur, Rajasthan for providing
opportunity and assistance during research work.
REFERENCES
Annonymus (2016). Annual Report of Indian
institute of Soybean Research. Indore (MP)
Anonymous (2017-18). Directorate of Economics &
Statistics. Department of Agriculture Cooperation &
Farmers Welfare. Government of India.
Dhurwey, D.S. (2015). Studies on diseases of
soybean with reference to Colletotrichum dematium
causing seed rot and pod blight and its management.
Ph.D. (Ag.) Thesis, Jawaharlal Nehru Krishi Vishwa
Vidyalaya, Jabalpur pp- 47.
Gupta, G.K. and Chauhan, G.S. (2005).
Symptoms, Identification and Management of
Soybean Diseases. Technical Bulletin no. 10. Pub. IISR, Indore.
Ingle, Y.V., Chandankar, G.D., Patil, P.V. and
Patil, C.U. (2016). Evalution of advance lines of
soybean for resistance to major diseases under
natural field condition. Indian Journal of Agricultural
Research 50(1): 84-87.
Mahesha, B, Patil, P.V. and Nandini, P. (2009).
Identification of multiple disease resistance sources
in soybean. Crop Research 37: 213-216.
Rotem, J. (1994). The Genus Alternaria, Biology,
Epidemiology and Pathogenicity. The American
Phytopathological society. USA. 325 pp. Sangeetha, C.G. and Siddaramaiah A. L. (2007).
Epidemiological studies of white rust, downy mildew
and Alternaria blight of Indian mustard (Brassica
juncea (Linn.) Czern. And Coss.). African Journal
of Agricultural Research 2:305-308.
Singh, S.S. (2010). Crop management under
irrigated and rainfed conditions. Kalyani publishers
New Delhi pp-574.
Zade, S.B., Ingle, Y.V., Ghuge, A. S. and Wasule,
D. L. (2018). Screening of soybean genotypes for
resistance against Alternaria leaf spot disease. Journal in Science, Agriculture & Engineering
8(27):198-199.

*Corresponding Author ________________________________________________ Journal of Plant Development Sciences Vol. 12(5): 313-316. 2020
ETHNO MEDICINAL KNOWLEDGE OF SPICES AND THEIR USES BY TRIBAL
COMMUNITY OF RAJASTHAN, INDIA
Deepa Indoria*1 and S.R. Verma
2
1Krishi Vigyan Kendra, Chittorgarh, MPUAT, Udaipur Rajasthan
2Institute of Extention Education, CCSAU, Hisar, Hariyana
Email: [email protected]
Received-03.05.2020, Revised-27.05.2020 Abstract: A spice is a dried seed, fruit, root, bark or vegetative material used in nutritionally insignificant amount as a food supplement for the reason of flavouring and imparting taste. Spices are defined as "a strongly flavoured or aromatic substance of vegetable origin, obtained from tropical plants, commonly used as a condiment". In ancient times, spices were as valuable as metal gold; and as noteworthy as medicines and perfumes. No country in the world cultivates as a lot of kinds of spices as India with quality spices come from Kerala, an Indian state. Because of the varying climates in India-from tropical to sub-tropical, temperate-almost all spices are grown in this country. In almost all of the 28 states and seven union territories of India, at least one spice is grown in profusion. Spices used by tribe as herbal ethno medicine to treat several common diseases such as fever, indigestion, diarrhoea, dysentery, vomiting, asthma, heart diseases, headache,
boils, leucoderma, bold disorders, piles and insect bites etc. were documented. High level of commercial use as ethno medicinal practices adversely affect the physical, social and economic welfare of the tribal community of Chittorgarh ,Rajasthan . A survey (December 2012 to December 2013) reported data on four-teen spices belonging to twelve families identified from this region. Brief information about the scientific names with family, common names (English), plant part used, way of application of plant parts and their uses against diseases have been presented. Present study reveals that some species are important in primary healthcare sys-tem of tribal communities. This paper deals with the biodiversity of spices and their ethno medicinal uses by the tribal communality for conservation and utilisation in Chittorgarh ,Rajasthan.
Keywords: Spices, Ethno medicinal uses, TSP (Tribal specific place) Antimicrobial activity
INTRODUCTION
hittorgarh is located at 24.88°N 74.63°E. It has
an average elevation of 394 metres
(1292 ft).Chittorgarh is located in the southern part
of the state of Rajasthan, in the north western part of
India.It is located beside a high hill near the
Gambheri River.Chittorgarh is located between 23°
32' and 25° 13' north latitudes and between 74° 12'
and 75° 49' east longitudes in the south eastern part
of Rajasthan state.The three panchayat samitee
encompasses 10,856 square km (3.17 per cent of the
Rajasthan State) area of land. In chittorgarh contained various tribes like bheel
,Rawat meena ,Gameti . In four P.S.of Chittorgarh,
the tribal population was highest in south side three
panchayat samitee. Thus, the tribal community was
typically concentrated in the rural areas. The tribe
live mostly on hill- tops and on slopes forming small
and isolated villages. Most of these villages were
located at remote and far away from the towns
and therefore, the people mostly depend on the
natural resources from the nearby forests for their
livelihood including medicinal herbs for
treatments of different diseases and ailments. Generally, the traditional knowledge of medicinal
herb was confined to local medicine men. How-
ever, some secret of medicinal virtues could be
obtained from them through close contact. The medicine men have practiced and developed this
knowledge of the use of medicinal herbs through
their age long trial and error methods and
passed on orally from generation by generation.
It is important to save this traditional knowledge of
biological heritage and explore new resources.
Traditional and ethnic knowledge has played a
significant role in the discovery of novel ideas
about conservation of natural resources. Spices
have good anti-oxidant and preservative proper-ties
as well as anti-microbial and antibiotic properties, and therefore, are also used for medicinal purposes.
Some of the spices are rich in iron, vitamins, trace
metals and potassium. About 60 varieties of
spices are grown in India (Babu et al. 2013)
which is a well known land of spices from the
ancient period onwards (Mathew 2013). Luxuriant
forest, abound in all parts of state and variety of
medicinal plants, herbs, shrubs, bamboo and trees
growing in the state are rich. There are number of
plants whose medicinal values have been
recognized but very little effort has been made to
develop the ethno medicinal plants in the past. It is essential for the tribal communities to understand
the need for sustainable utilization of these plants.
C
RESEARCH ARTICLE

314 DEEPA INDORIA AND S.R. VERMA
Plate 1. With Farmer: Ginger and Turmeric field
MATERIALS AND METHODS
Study was conducted in Three panchayat
samitee(Bari sadri ,Bhadesar ,Dungla ) of three
panchayat samitee chittorgarh Rajasthan during
December 2018-19 to December 2019-20 The survey
was done in spring and monsoon seasons when
plants bloom and show extensive growth with the
view of study their natural habitat and distribution.
The tribal community and the area were selected
purposely due to maximum biodiversity of ethno
medicinal plants in the area. The information and
data was collected from three panchayat samitees
of Chittorgarh. Five tribal places were selected from each three panchayat samitee and ten tribal
from each three panchayat samitee were selected.
group between 25 to 75 years. They were local
herbalists, healers, farmers, village headman,
elders and students of both the sexes. Standard
ethno medicinal investigations procedures were
followed (Jain 1995, Martin 1995). The data
collected during the fieldwork have been entered
and analyzed in a database generated with Mi
tract wise . A three panchayat samitee wise list of
tribal people was prepared and fifty tribal of each
three panchayat samitee were selected randomly.
Fig. 1: Map showing the study area of Rajasthan
Thus, the total sampling consisted of 200 tribal
peoples spread over three Panchayat samitee . People
to people contract in the form of personal interview
were conducted. Thus the primary data were
collected with the help of interview schedule
through a questionnaire. Secondary data were
obtained from published journals. Our respondents
were in a range of age corset Excel 2007 software.
Data collected about spices biodiversity, their
ethno medicinal uses and related information
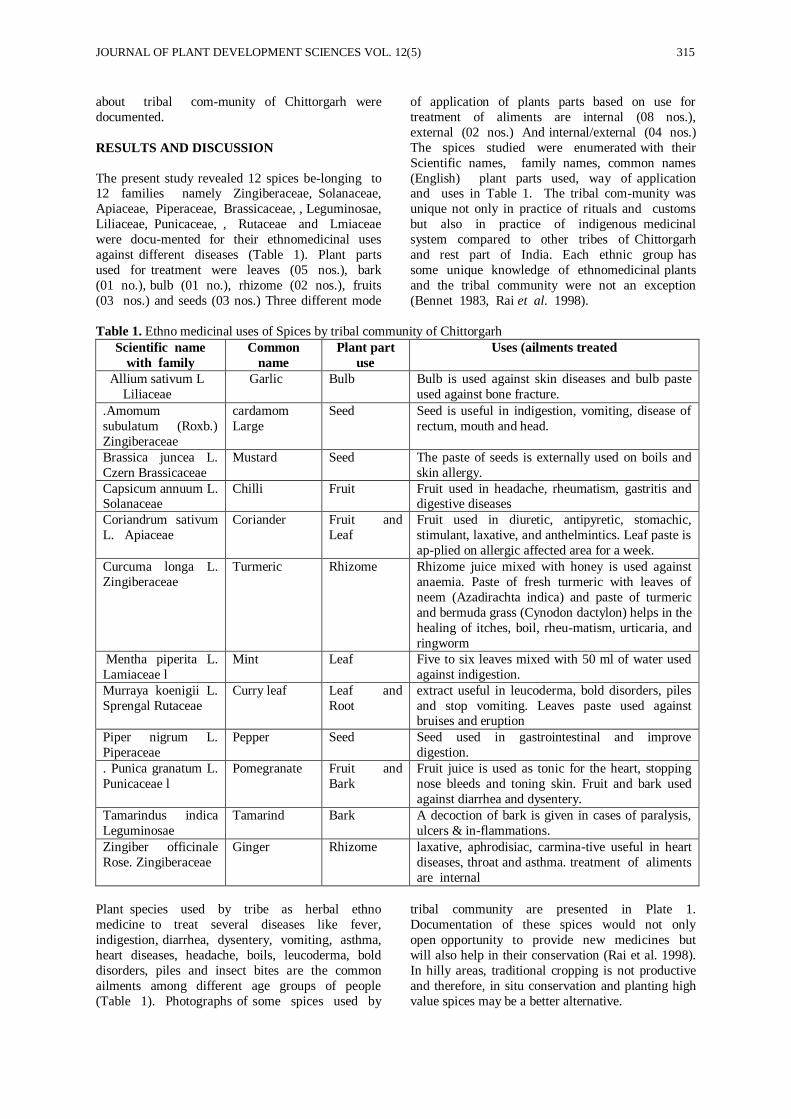
JOURNAL OF PLANT DEVELOPMENT SCIENCES VOL. 12(5) 315
about tribal com-munity of Chittorgarh were
documented.
RESULTS AND DISCUSSION
The present study revealed 12 spices be-longing to 12 families namely Zingiberaceae, Solanaceae,
Apiaceae, Piperaceae, Brassicaceae, , Leguminosae,
Liliaceae, Punicaceae, , Rutaceae and Lmiaceae
were docu-mented for their ethnomedicinal uses
against different diseases (Table 1). Plant parts
used for treatment were leaves (05 nos.), bark
(01 no.), bulb (01 no.), rhizome (02 nos.), fruits
(03 nos.) and seeds (03 nos.) Three different mode
of application of plants parts based on use for
treatment of aliments are internal (08 nos.),
external (02 nos.) And internal/external (04 nos.)
The spices studied were enumerated with their
Scientific names, family names, common names
(English) plant parts used, way of application and uses in Table 1. The tribal com-munity was
unique not only in practice of rituals and customs
but also in practice of indigenous medicinal
system compared to other tribes of Chittorgarh
and rest part of India. Each ethnic group has
some unique knowledge of ethnomedicinal plants
and the tribal community were not an exception
(Bennet 1983, Rai et al. 1998).
Table 1. Ethno medicinal uses of Spices by tribal community of Chittorgarh
Scientific name
with family
Common
name
Plant part
use
Uses (ailments treated
Allium sativum L
Liliaceae
Garlic Bulb Bulb is used against skin diseases and bulb paste
used against bone fracture.
.Amomum
subulatum (Roxb.)
Zingiberaceae
cardamom
Large
Seed Seed is useful in indigestion, vomiting, disease of
rectum, mouth and head.
Brassica juncea L.
Czern Brassicaceae
Mustard Seed The paste of seeds is externally used on boils and
skin allergy.
Capsicum annuum L. Solanaceae
Chilli Fruit Fruit used in headache, rheumatism, gastritis and digestive diseases
Coriandrum sativum
L. Apiaceae
Coriander Fruit and
Leaf
Fruit used in diuretic, antipyretic, stomachic,
stimulant, laxative, and anthelmintics. Leaf paste is
ap-plied on allergic affected area for a week.
Curcuma longa L.
Zingiberaceae
Turmeric Rhizome Rhizome juice mixed with honey is used against
anaemia. Paste of fresh turmeric with leaves of
neem (Azadirachta indica) and paste of turmeric
and bermuda grass (Cynodon dactylon) helps in the
healing of itches, boil, rheu-matism, urticaria, and
ringworm
Mentha piperita L.
Lamiaceae l
Mint Leaf Five to six leaves mixed with 50 ml of water used
against indigestion.
Murraya koenigii L.
Sprengal Rutaceae
Curry leaf Leaf and
Root
extract useful in leucoderma, bold disorders, piles
and stop vomiting. Leaves paste used against bruises and eruption
Piper nigrum L.
Piperaceae
Pepper Seed Seed used in gastrointestinal and improve
digestion.
. Punica granatum L.
Punicaceae l
Pomegranate Fruit and
Bark
Fruit juice is used as tonic for the heart, stopping
nose bleeds and toning skin. Fruit and bark used
against diarrhea and dysentery.
Tamarindus indica
Leguminosae
Tamarind Bark A decoction of bark is given in cases of paralysis,
ulcers & in-flammations.
Zingiber officinale
Rose. Zingiberaceae
Ginger Rhizome laxative, aphrodisiac, carmina-tive useful in heart
diseases, throat and asthma. treatment of aliments
are internal
Plant species used by tribe as herbal ethno
medicine to treat several diseases like fever,
indigestion, diarrhea, dysentery, vomiting, asthma,
heart diseases, headache, boils, leucoderma, bold
disorders, piles and insect bites are the common
ailments among different age groups of people
(Table 1). Photographs of some spices used by
tribal community are presented in Plate 1.
Documentation of these spices would not only
open opportunity to provide new medicines but
will also help in their conservation (Rai et al. 1998).
In hilly areas, traditional cropping is not productive
and therefore, in situ conservation and planting high
value spices may be a better alternative.

316 DEEPA INDORIA AND S.R. VERMA
REFERENCES
Al-Zuhair, H., el-Sayeh, B., Ameen, H.A. and al-
Shoora, H. (1996). Pharmacological studies of
cardamom oil in animals. Pharmacol. Res. 34(1-2):
79-82.
Acharya, S.N., Thomas, J.E. and Basu, S.K. (2008). Fenugreek, an alternative crop for semiarid
regions of North America. Crop Sci. 48: 841-53.
Bhat, K.S. and Vivek, K. (2009). Biocidal potential
of clove oils against Aede albopictus – A
comparative study. African Journal of
Biotechnology. 8 (24):6933-6937, 15.
Basu, S.K., Acharya, S.N. and Thomas, J.E. (2008). Appilcation of phosphate fertilizer and
harvest management forimportant fenugreek
(Trigonella foenum-graecum L.) seed and forage
yield in a dark brown soil zone ofCanada. KMITL Sci Tech J; 8(1): 1 –7.
Ballabh, B., Chaurasia, O.P., Ahmed, Z. and
Singh, S.B. (2003). Traditional medicinal plants of
cold desert Ladakh-used against kidney and urinary
disorders. J Ethnopharmacol British pharmacopoeia,
Introduction General Notices Monographs, medicinal
and Pharmaceutical, British pharmacopeia
commission, London, Volume-1 (AI); 542-543.
Daniel, A.N., Sartoretto, S.M., Schmidt, G.,
Caparroz-Assef, S.M., Bersani-Amado, C.A.,
Cuman, R.K.N. (2009). Antiinflammatory and antinociceptive activities A of eugenol essential oil in
experimental animalmodels. Revista Brasileira de
Farmacognosia. 19: 212- 217.
Delaquis, P.J., Stanich, K., Girard, B. and Mazza,
G. (2002). Antimicrobial activity of individual and
mixed fractions of dill, cilantro, coriander and
eucalyptus essential oils. International Journal of
Food Microbiology. 74(1- 2):101-109.
Duke, J.A., Bogenschutz-Godwin, M.J., deCellier,
J. and Duke, P.K. (2003). Elettaria cardamomum
Maton (Zingiberaceae) Cardamon, Malabar or
Mysore cardamon, in CRC Handbook of Medicinal Spices, 120-138.
Debjit, B., Kumar, K.P. Sampath, Yadav, A,
Srivastava. S., Paswan, S. and Dutta, A.S. Recent
Trends in Indian Traditional Herbs Syzygium
aromaticum and its Health Benefits. ~ 121 ~ Journal
of Medicinal Plants Studies Journal of
Pharmacognosy and Phytochemistry Vol. 1 No. 1
2012; 5(1): 6-9.
Dhanapakiam, P., Joseph, J., Mini, Ramaswamy,
V.K., Moorthi, M. and Senthil Kumar, A. (2008). The cholesterol lowering property of coriander seeds
(Coriandrum sativum): Mechanism of action. Journal
of Environmental Biology; 29(1):53-56
Hardman, R. and Fazli, F.R.Y. (1972). Methods of
screening the genus Trigonella for steroidal
sapogenins. Planta Medica; 21: 131–138.
Jafri, M.A., Farah, Javed, K. and Singh, S. (2001).
Evaluation of the gastric antiulcerogenic effect of
large cardamom (fruits of Amomum subulatum
Roxb). J. Ethnopharmacol. 75(2-3):89-94.
Kapoor, L.D. (1990). Handbook of Ayurvedic
medicinal plants. CRC Press, Boca Raton, 172. Gilani, A.H., Bashir, S. and Khan, A.U. (2007).
Pharmacological basis for the use of Borago
officinalis in gastrointestinal,respiratory and
cardiovascular disorders. J Ethnopharmacol;
114:393- 99.
Singh, Karan, Jakhar, Mohan Lal and Singh,
Dhirendra. (2007). Multitherapeutic medicinal and
special plants. 1st edition, Avishkar publishers,
Jaipur, India. 32.
Sachan, A.K., Rao, Ch., V. and Sachan, N.K. (2016). Ethnobotanical survey of indigenous medicines practiced in Chamba valley of Uttar
Pradesh. Bharatiya Vaigyanik Evam Audyogik
Anusandhan Patrika (CSIR-NISCAIR); 23(2) 132-
135.
Sagdıc, O. and Ozcan, M. (2003). “Antibacterial
activity of Turkish spice hydrosols”. Food Control,
14, pp. 141–143.
Sandra, G., Gomes de, Saravia and Christine, C.
and Gaylarde (1998). “The antimicrobial activity of
an aqueous extract of Brassica negra”. International
bio deterioration and biodegradation, vol 41(2), pp.
145-148.
Sema, Agaoglu, Nursel, Dostbil and Süleyman,
Alemdar (2005). “Antimicrobial Effect of Seed
Extract of Cardamom (Elettarıa cardamomum
Maton)”. Yyu Vet Fak Derg, vol 16 (2): pp. 99- 101.

*Corresponding Author
________________________________________________ Journal of Plant Development Sciences Vol. 12(5): 317-320. 2020
EFFECT OF SOAKING AND PLACEMENT OF SEED ON GERMINATION AND
SEEDLING EMERGENCE IN LITCHI
Narayan Lal1, E.S. Marboh
2*, A.K. Gupta
2, Abhay Kumar
2 and Vishal Nath
2
1ICAR-Indian Institute of Soil Science, Bhopal, MP
2ICAR-National Research Centre on Litchi, Muzaffarpur, Bihar
Email: [email protected] Received-06.05.2020, Revised-25.05.2020
Abstract:An experiment was conducted at ICAR-NRC on Litchi, Muzaffarpur during 2018 to assess the effect of soaking of seed, orientation and depth of seed sowing on germination and seedling emergence in litchi. Result indicated that soaking of seed in water before sowing had improved seed germination in litchi. The maximum germination was found in GandakiLalima with 92.58% as compared to without soaking (62.75%).There was a significant reduction in seedling emergence with an increase in burial depth. Seeds sown at 1 cm depth showed the highest seedling emergence with an average percentage of 79.81.The highest seed germination was found in lay flat orientation when seeds were sown at the
depth of 1 cm.Litchi seedlingemergence was greatest and most rapid when seeds were sown 1 cm deep and positioned flat, on their sides. Keywords: Effect, Germination, Litchi, Seed
INTRODUCTION
itchi (Litchi chinensisSonn.) is an evergreen
subtropical fruit tree and important member of
family Sapindaceae, which has strong mycorrhizal
association (Lal and Nath, 2020). The litchi is one of the most environmentally sensitive (Lal et al., 2017a)
fruit tree restricted to few a countries in the world
and in few states in India. Recently, it has been
reported that litchi is performing well in Southern
parts of India where difference of temperature was
less than 4 °C and humidity difference of about 6.5%
during June-August (Nath et al., 2015) but major
litchi producing states in India are Bihar,
Uttarakhand, West Bengal, Punjab, Uttar Pradesh,
Jharkhand and Tripura. Litchi commenced flowering
during February-March in Bihar condition and intensity of flowering depends on previous years
fruiting, temperature during floral bud
differentiation, phenol content (Lal et al., 2019a) and
age of plants (Lal and Nath, 2020). A single panicle
produced hundreds to thousands of flowers (M1
flowers, Female flowers and M2 flowers) and
success of fruit set depend on the pollen grain
received from male parents (Lal et al., 2019 c and
d).Heavy fruit drop has been reported in litchi (Lal et
al., 2017b) and heavy fruit load affect fruit weight
and quality in litchi (Nagraj et al., 2019).
Litchi is commercially propagated through marcottage but multiplication by seed is very
important to create variability due to highly cross
pollinated nature (Lal et al., 2019b). Seedling
population gives enormous opportunity to select
improved and desired traits specific new genetic
stock or cultivars (Lal et al., 2019b). These all efforts
depend on seed germinability. The germination
performance of seeds and the seed placement in
sowing are important to achieve seedlings (Aou-ouad
et al., 2014; de Andrade et al., 2004). Litchi seeds are
‘‘recalcitrant’’ due to their high sensitivity to
desiccation. They quickly lose their viability after
extraction from the fruits. Litchi seeds completely
lost viability when they were kept outdoors for 2 d or
indoors for 6 d (Ray and Sharma, 1987). Xia et al.
(1990) found that litchi seeds germinated fully when harvested at 10 d before fruit maturity or at fruit
ripening time, but entirely lost seed viability after 6 d
of natural drying. Ray and Sharma (1987) pointed
out that seed germinability was positively correlated
with seed moisture content above the critical limit of
20% moisture content. Therefore, the seed moisture
content must be retained to ensure high seed
germination rates.Seed imbibition is an important
treatment for successful germination in any crops
because sufficient water is necessary for loosening
seed coat, rehydrating enzymes and their substrates, and provides energy to boost radicle. Especially, the
first phase of imbibition characterized by the rapid
water uptake plays a crucial role in seed germination
success (Harb, 2013). Slow imbibe water from soil or
unable to uptake sufficient water results early death
of seed. Soaking before sowing enables a more rapid
imbibition than is usually the case in a nursery bed,
resulting in more rapid seed germination (Schmidt,
2000).
Seed orientation and sowing depth both play
important roles in seed germination and seedling
emergence (Aou-ouad et al., 2014; Huang et al., 2007). Recalcitrant seeds of coconut sown in
horizontal orientation exhibited much quicker
germination and better growth of seedlings (Thomas,
1978). Planting seeds of Balanitesaegyptiaca
horizontally or vertically with stalk end down-ward
showed better germination (Elfeel, 2012). The
seedling emergence was slower when seeds were
sown at deeper depth in Rhamnusalaternus and R.
ludovici-salvatoris (Aou-ouad et al., 2014). Since
2013, we have started crossing technique in litchi and
L
RESEARCH ARTICLE

318 NARAYAN LAL, E.S. MARBOH, A.K. GUPTA, ABHAY KUMAR AND VISHAL NATH
developed hundreds of hybrid seeds each year but
could not get sufficient seed germination. We have
observed good germination percentage near shade of
nursery bed, good germination in some pockets of
bed and wide variation due to bedding materials. We
realized the importance of sowing of litchi seed. Therefore, studies are needed to get good seed
germination in litchi. Therefore, an experiment was
formulated with pre sowing soaking of seed,
orientation and depth of seed sowing. The objectives
of this experiment wereto find the best ways to
improve seed germination and seedling emergence,
which are important for raising sufficient variability.
MATERIALS AND METHODS
Fruit of different cultivars were collected from
National Active Germplasm Site (NAGS), ICAR-National Research Centre on Litchi, Muzaffarpur,
Bihar, at fully ripe stage and seed were extracted
from fruits. Two hundred seeds of each cultivar were
soaked in water and same quantities were sown
immediately after extraction from fruits in prepared
nursery bed. Seeds were soaked for 48 h in a plastic
drum filled with water. Seeds were sown in three
orientations (seed laid flat, seed laid vertically with
the radicle upward, and seed laid vertically with the
radicle downward). Seeds sown in each of the three
orientations were placed in soil at five different depths of 1, 2, 3, 4 & 5 cm. Three replicates were
used for each treatment and 20 seeds were sown in
each replicate. A randomized block design was used
in the experiment. Some seedlings began to emerge
at the surface of soil on day 7, and the final percent-
age of seedling emergence was determined two
weeks after sowing.The data of seed germination and
seedling emergence were statistically analyzedusing SPSS version 16.0 Statistical Software. Pearson
correlation tests were used to determine the
correlations of soaking time with germination.
ANOVA was used to test the differences in seedling
emergence.
RESULTS AND DISCUSSION
Seed germination varied from 24.56 to 62.75 % with
maximum in GandakiLalima and lowest in Bedana
without soaking in water but varied from 43.56 to
92.58 % with maximum in GandakiLalima and lowest in Bedana when seed soaked in water (Fig 1).
Soaking of seed in water before sowing had great
impact on germination. Water soaking improved
germination in litchi.Soaking of seeds in water
helped to reduce the time required for germination
and improved germination percentage. Zhang et al.,
(2015) reported that seeds of ‘Yeshengli’ litchi
soaked in water showed a slightly higher germination
percentage than seeds without the soaking treatment.
The imbibition process occurred when seeds were
submersed in water and soaking enabled a quicker imbibition and might be of benefit for rapid seed
germination (Schmidt, 2000).
Fig. 1: Germination of seed (mean ± SD) in different cultivars of litchi.
The orientation and burial depth both significantly
influenced germination and seedling growth in litchi.
There was a significant reduction in seedling
emergence with an increase in burial depth (Fig
2).Seeds sown at 1 cm depth showed the highest
seedling emergence with an average percentage of 79.81. The highest seed germination was found in lay
flat orientation when seeds were sown at the depth of
1 cm. The seedling emergence was lower and slower
when seeds were sown radicle upward at the sowing
depth of 1 cm (Fig. 2).The burial depth of seeds
significantly influenced the seedling recruitment in
litchi. There was a significant reduction in seedling
emergence of litchi with depths below 2 cm. Planting seeds at deeper depths probably resulted in more
consumption of the carbohydrate reserves during the

JOURNAL OF PLANT DEVELOPMENT SCIENCES VOL. 12(5) 319
process of germination and seedling emergence
(Huang et al., 2007).The seedling emergence was
higher and quicker when seeds were placed flat, on
their sides and radicle downward than those planted
radicle upward at the burial depth of 1 cm. Therefore,
growers should ensure seed placement avoids a
vertical seed orientation with the radicle upward.In
the present study, soaking increased seed
germination percentage.Placing seeds flat and on
their sides, orienting the radicle downward, and
covering with 1 cm of medium exhibited the best
seedling emergence.
Fig. 2.Percentage of seedlings emergence (mean ± SD) at different seed orientations and burial depths in litchi.
CONCLUSION
It can be concluded that GandakiLalimahad good
ability for germination with 92.58%. The seedling
emergence reduced with an increase in burial depth.
Seeds sown at 1 cm depth showed the highest
seedling emergence with an average percentage of 79.81 in lay flat orientation.
REFERENCES
Aou-ouad, H.E., Medrano, H.,Lamarti, A. and
Gulias,J. (2014).Seed germination at different
temperatures and seedling emergence at different
depths of Rhamnus spp. Cent. Eur. J. Biol. 9:569–
578.
de Andrade, R.A., Martins, A.B.G. and Oliveira,
I.V.M. (2004). Influence of the substrate in
germination of lychee seeds.Rev. Bras. Frutic. 26:375–376.
Elfeel, A.A.(2012). Effect of seed pre-treatment and
sowing orientation on germination of
Balanitesaegyptiaca (L.) Del. seeds. Am-Euras. J.
Agr. and Environ. Sci. 12:897–900.
Harb, A.M.(2013). Reserve mobilization, total
sugars and proteins in germinating seeds of durum
wheat (Triticum durumDesf.) under water deficit
after short period of imbibition.Jordan J. Biol. Sci.
6:67–72.
Huang, S.Q., Liu, G.X. and Han, J.G.(2007).Effect
of seed mass and sowing depth on seedling
establishment.Pratacultural Sci. 24:44–49. (In
Chinese).
Lal, N., Gupta, A.K., Kushwah, N.S. and Nath, V.(2017a).Sapindaceous Fruits: In Horticultural
Crops of High Nutritive Values, pp 339-370, edited
by KV Peter. Brillion Publishing, New Delhi.
Lal, N., Gupta, A.K. and Nath, V.(2017b).Fruit
retention in different litchi germplasm influenced by
temperature.International Journal of Current
Microbiology and Applied Science. 6(12):1189-1194.
Lal, N., Singh, A., Gupta, A.K.,Marboh, E.S.,
Kumar, A. and Nath, V.(2019b).Precocious
Flowering and Dwarf NRCL-29-A New Genetic
Stock of Litchi (Litchi chinensisSonn.).Chem. Sci.
Rev. Lett.8 (32): 206-210. Lal, N. and Vishal,Nath.(2020). Effect of plant age
and stress on flowering in litchi (Litchi
chinensis).Current Horticulture. 8 (1): 24-27.
Lal, N., Gupta, A.K., Marboh, E.S.,Kumar, A.
and Nath, V.(2019c). Effect of pollen grain sources
on fruit set and retention in ‘Shahi’ litchi. Multilogic
in Science. 9(29): 152-156.
Lal, N., Gupta, A.K.,Marboh, E.S., Kumar, A.
and Nath, V. (2019d).Effect of Pollen Grain Sources

320 NARAYAN LAL, E.S. MARBOH, A.K. GUPTA, ABHAY KUMAR AND VISHAL NATH
on Success of hybrids in ‘Bedana’
Litchi.International Journal of Bio-resource and
Stress Management.10(3):241-245.
Lal, N., Marboh, E.S.,Gupta, A.K.,Kumar, A.,
Dubedi Anal, A.K. and Nath, V. (2019a).Variation
in leaf phenol content during flowering in litchi (Litchi chinensisSonn.).Journal of Experimental
Biology and Agricultural Sciences.7(6): 569 – 573.
Nath, V., Kumar,A.,Pandey,S.D. and
Tripathi,P.C.(2015).Litchi in winter season- a way
forward.Indian Horticulture.59: 26-27.
Nagraj, K.,Diwan, G. and Lal, N. (2019).Effect of
fruit load on yield and quality of litchi (Litchi
chinensisSonn.).Journal of Pharmacognosy and
Phytochemistry. 8(6): 1929-1931.
Ray, P.K. and Sharma,S.B. (1987).Growth,
maturity, germination and storage of litchi seeds.Sci.
Hort. 33:213–221.
Schmidt, L.H.(2000). Guide to handling of tropical
and subtropical forest seed. Danida For. Seed Ctr.,
Humlebaek, DK.
Thomas, K.M.(1978). Influence of seed size and
planting orientation on the germination and growth
of coconut seedlings in the nursery.Indian J. Agr. Sci. 48:63–67.
Xia, Q.H., Chen, R.Z. and Fu,
J.R.(1990).Physiologicalchangesoflitchiseedsbefore1
0daysof maturity.Plant Physiol. Commun. 3:37–38.
Zhang, C., Wu, J., Fu, D., Wang, L., Chen, J., Cai,
C. and Ou, L.(2015). Soaking, Temperature, and
Seed Placement Affect Seed Germination and
Seedling Emergence of Litchi chinensis.Hortscience.
50(4):628–632.

*Corresponding Author
________________________________________________ Journal of Plant Development Sciences Vol. 12(5): 321-326. 2020
PERFORMANCE OF PARENTS AND HYBRIDS FOR YIELD AND YIELD
ATTRIBUTING TRAITS IN TOMATO (SOLANUM LYCOPERSICUM L.)
Kiran Kumar1*, Dhananjay Sharma
2, Jitendra Singh
3 and S.S. Paikra
4
1Department of Vegetable Science, College of Agriculture Raipur
2Department of Vegetable Science, College of Agriculture Raipur
3Floriculture and Landscape Architecture, College of Agriculture, IGKV, Raipur
4College of Agriculture and Research Station, Janjgir-Champa IGKV, Raipur (C.G.) India
Email: [email protected]
Received-04.05.2020, Revised-28.05.2020
Abstract: A field experiment was conducted during rabi season 2017-18 in Randomized Block Design with three replications at Horticultural Research cum Instructional Farm, Department of Vegetable Science, IGKV, Raipur (C.G.). Six diverse and horticulturally superior lines of tomato were crossed with four testers in line x tester mating design. The resultant 24 hybrids (F1'S) along with their parents (six lines and four testers) were evaluated for eighteen yield and yield attributing traits in tomato. The experiment results revealed that parents 2014/TOLCVRES-3 performed best for characters viz., number
of flowers per cluster (6.38), number of fruits per cluster (4.84), pericarp thickness (mm) 6.18 mm and total soluble solid (°Brix) 4.49 °Brix. Fruit diameter (cm), average fruit wt. (g) and fruit length (cm) were observed in parents 2015/TOLCVRES-2 and 2015/TOLCVRES-4.Whereas fruit yield per plant (3.78 kg), days to first fruit harvest (70.99) and dry matter % of fruit (6.21%) recorded in parent H-86. Among all parents, H-86 and 2014/TOLCVRES-3 with the yield of 659.72 q/ha and 611.04 q/ha respectively were found to be better yielders. Among all hybrids PR X 14/TLCV-3, PC X 15/TLCV-2, KA X 15/TLCV-2, KA X 14/TLCV-3 and AV X 14/TLCV-1 were best performing in maximum number of quality and yield attributing traits like days to 50% flowering (27.00), maximum number of fruit cluster per plant (12.42), ascorbic acid (25.01 mg/100g), number of flowers per cluster (7.12), fruit diameter 7.00 cm, average fruit wt. (144.50 g),
fruit yield per plant (3.52kg), total soluble solid (5.71 ºBrix), and number of locules per fruit (5.24). Fruit yield per hectare was observed in the cross H–86 X 14/TLCV-3 (727.58 q), followed by KA X 14/TLCV-3 (724.13 q) and H–86 X 15/TLCV-4 (705.76 q). Therefore, recommended for generation advancement and selection of desirable progeny lines useful for Chhattisgarh plains.
Keywords: Tomato, Fruit yield, Genotypes, Parents, Hybrids
INTRODUCTION
omato (Solannum lycopersicum L.) is one of the
most important and popular vegetable crops in
the world. Tomato is popular due to its nutritive and
medicinal values. Nuez et al. 2004 identified it as the
horticultural crop with the highest commercial value.
In India; tomato is grown across all agro-ecological zones and occupies an area of about 801 thousand
hectares with an annual production of 22.33 million
tonnes, respectively (Anon., 2017). Tomato is
universally treated as ‘Protective Food’ since it is
very rich in minerals, vitamins, antioxidants,
essential amino acids, sugars and dietary fibers
which are important ingredients for culinary and
table purpose, chutney, pickles, ketchup, soup, juice,
puree etc. (Sekhar et al., 2010). Fresh fruit of tomato
are in great demand round the year throughout the
country. Generally, both determinate and indeterminate
varieties are considered suitable for growing and for
commercial production; high yielding superior F1
hybrids are preferred. Hence, there is continuous
need to strengthen the crop improvement
programmes in tomato and ultimately developing
new varieties/hybrids satisfying to the present day
needs of farmers and consumers as well.
The information about mean performance of
genotypes is of basic importance for crop
improvement. The range of mean values could
present a rough estimate about the variation in
magnitude of variability present among the
genotypes. The characters showing wide range of
variation have more scope for improvement.
Evaluation of hybrids and its parents helps to identify best combination of parents which are resulting in
best hybrid with desirable yield attributing traits.
And it also helps us to understand the combining
ability of parents.
MATERIALS AND METHODS
The experiment was conducted at AICRP on
Vegetable Crops, Department of Vegetable Science,
Horticultural Research and Instructional Farm,
IGKV, Raipur (C.G.) during rabi season 2017-18. The experimental material (Table 1) consists of six
lines (viz., Pusa Ruby, Punjab Chhuhara, Arka Vikas,
Kashi Anupam, H–86 and H–24) and four testers
namely 2015/TOLCVRES-4, 2015/TOLCVRES-2,
2014/TOLCVRES-3, 2014/TOLCVRES-1) using
Line x Tester mating design was followed in this
study. Thus a total of 24 hybrids were synthesized by
making crosses between lines and the testers during
March – April 2017 in crossing block. The twenty
T
RESEARCH ARTICLE

322 KIRAN KUMAR, DHANANJAY SHARMA, JITENDRA SINGH AND S.S. PAIKRA
four crosses (F1’s along with their parents (six lines
and four testers) were grown in Randomized Block
Design with three replications during rabi 2017-18.
The recommended package of practices was
followed to raise a successful crop and necessary
prophylactic plant protection measures were carried
out to safeguard the crop from pests and diseases.The
observations for eighteen characters were recorded
on five plant basis in each replication. These
observations were subjected to statistical analysis.
Table 1. Details of the parents (lines and testers), F1 hybrids developed through L x T mating design used in the
study S. No. Parents Code No. Source
Lines
1 Pusa Ruby PR IARI, New Delhi
2 Punjab Chhuhara PC PAU, Ludhiana
3 Arka Vikas AV IIHR, Bengaluru
4 Kashi Anupam KA IIVR, Varanasi
5 H–86 H-86 IIVR, Varanasi
6 H–24 H-24 HAU, Hisar
Testers
1 2015/TOLCVRES-4 15/TLCV-4 AICRP on Vegetable Crops, Raipur
2 2015/TOLCVRES-2 15/TLCV-2 AICRP on Vegetable Crops, Raipur
3 2014/TOLCVRES-3 14/TLCV-1 AICRP on Vegetable Crops, Raipur
4 2014/TOLCVRES-1 14/TLCV-3 AICRP on Vegetable Crops, Raipur
List of F1 hybrids developed through Line x Tester mating design
S. No. Crosses (F1s ) Code No. S.
No.
Crosses (F1s ) Code No.
1 Pusa Ruby X 2015/TOLCVRES-4 PR X 15/TLCV-4 13 Kashi Anupam X 2015/TOLCVRES-4 KA X 15/TLCV-4
2 Pusa Ruby X 2015/TOLCVRES-2 PR X 15/TLCV-2
14 Kashi Anupam X 2015/TOLCVRES-
2
KA X 15/TLCV-2
3 Pusa Ruby X 2014/TOLCVRES-3 PR X 14/TLCV-3 15 Kashi Anupam X 2014/TOLCVRES-3 KA X 14/TLCV-3
4 Pusa Ruby X 2014/TOLCVRES-1 PR X 14/TLCV-1 16 Kashi Anupam X 2014/TOLCVRES-1 KA X 14/TLCV-1
5 Punjab Chhuhara X 2015/TOLCVRES-4 PC X 15/TLCV-
4 17
H–86 X 2015/TOLCVRES-4 H–86 X 15/TLCV-4
6 Punjab Chhuhara X 2015/TOLCVRES-2 PC X 15/TLCV-2 18 H–86 X 2015/TOLCVRES-2 H–86 X 15/TLCV-2
7 Punjab Chhuhara X 2014/TOLCVRES-3 PC X 14/TLCV-3 19 H–86 X 2014/TOLCVRES-3 H–86 X 14/TLCV-3
8 Punjab Chhuhara X 2014/TOLCVRES-1 PC X 14/TLCV-1 20 H–86 X 2014/TOLCVRES-1 H–86 X 14/TLCV-1
9 Arka Vikas X 2015/TOLCVRES-4 AV X 15/TLCV-4 21 H–24 X 2015/TOLCVRES-4 H–24 X 15/TLCV-4
10 Arka Vikas X 2015/TOLCVRES-2 AV X 15/TLCV-2 22 H–24 X 2015/TOLCVRES-2 H–24 X 15/TLCV-2
11 Arka Vikas X 2014/TOLCVRES-3 AV X 14/TLCV-3 23 H–24 X 2014/TOLCVRES-3 H–24 X 14/TLCV-3
12 Arka Vikas X 2014/TOLCVRES-1 AV X 14/TLCV-1 24 H–24 X 2014/TOLCVRES-1 H–24 X 14/TLCV-1
Table 2. Mean performance of parents (Lines and Testers) in tomato during rabi, 2017-18 Parents Characters
1 2 3 4 5 6 7 8 9 10 11 12 13 14 15 16 17 18
Lines
Pusa Ruby 26.67 11.65 78.13 10.07 5.38 4.44 27.46 71.10 1.58 3.51 4.52 77.23 4.81 4.92 4.44 19.87 3.69 295.98
Punjab Chhuhara 28.67 11.19 61.09 8.39 5.04 4.24 26.16 73.92 1.11 4.46 4.04 40.73 2.47 5.58 4.47 22.15 3.63 313.53
Arka Vikash 27.67 10.85 85.70 10.99 4.51 3.91 31.06 71.99 1.45 3.92 3.84 60.86 4.12 4.78 3.60 21.56 4.23 454.26
Kashi Anupam 27.67 10.23 56.63 8.65 5.04 4.18 19.97 70.99 1.68 5.58 6.05 81.46 5.11 4.94 3.79 21.25 5.03 406.46
H-86 29.00 8.66 48.65 10.01 5.11 3.98 29.99 70.99 3.78 6.14 5.98 107.06 3.27 5.38 3.78 20.76 6.21 659.72
H-24 29.33 9.69 56.27 9.38 5.71 4.38 28.58 73.05 1.57 3.97 5.66 69.39 3.84 4.26 3.01 19.96 5.00 381.41
Mean of lines 28.17 10.38 64.41 9.58 5.13 4.19 27.20 72.01 1.86 4.60 5.01 72.79 3.94 4.98 3.85 20.92 4.63 418.56

JOURNAL OF PLANT DEVELOPMENT SCIENCES VOL. 12(5) 323
Testers
2015/TOLCVRES-4 30.67 8.57 39.14 8.63 5.31 4.64 26.11 72.66 2.68 6.17 6.12 97.79 3.81 5.31 3.97 22.64 3.65 524.07
2015/TOLCVRES-2 28.67 10.95 56.22 11.32 5.11 4.58 25.16 71.69 2.67 4.72 6.44 107.06 5.88 5.12 3.83 18.98 3.48 567.40
2014/TOLCVRES-3 28.33 10.16 66.60 9.43 6.38 4.84 26.86 71.75 2.64 5.87 6.26 96.78 4.02 6.18 4.49 24.31 4.28 611.04
2014/TOLCVRES-1 31.33 11.75 57.58 11.43 5.64 4.78 29.11 72.11 1.82 4.93 5.37 66.23 4.95 4.10 3.89 23.64 4.33 440.40
Mean of testers 29.75 10.36 54.88 10.20 5.61 4.71 26.81 72.05 2.45 5.42 6.05 91.97 4.67 5.18 4.05 22.39 3.93 535.73
Mean of parents 28.80 10.37 60.60 9.83 5.32 4.40 27.04 72.02 2.10 4.93 5.43 80.46 4.23 5.06 3.93 21.51 4.35 465.43
CD at 5% 1.40 1.28 6.10 0.95 0.51 0.42 2.54 - 0.19 0.48 0.54 8.17 0.44 0.49 0.38 2.07 0.41 45.88
C.V. 2.81 7.14 5.82 5.62 5.60 5.60 5.43 1.93 5.40 5.72 5.78 5.87 6.10 5.66 5.67 5.59 5.55 5.70
1. Days to 50% flowering 2. No. of branches per plant 3. Plant height (cm)
4. Number of fruit cluster per plant 5. Number of flowers per cluster 6. Number of fruits per cluster
7. Number of fruits per plant 8. Days to first fruit harvest 9. Fruit yield per plant (kg)
10. Fruit length (cm) 11. Fruit diameter (cm) 12. Average fruit weight (g)
13. Number of locules per fruit 14. Pericarp thickness (mm) 15. Total soluble solids (ºBrix)
16. Ascorbic acid content (mg/100g) 17. Dry matter % of fruit 18. Fruit yield per hectare (q)
Table 3. Mean performance of F1 hybrids of tomato during rabi, 2017-18
Hybrids Characters
1 2 3 4 5 6 7 8 9 10 11 12 13 14 15 16 17 18
PR X 15/TLCV-4 27.33 11.28 53.73 11.47 6.52 4.92 27.84 70.76 2.36 4.84 5.57 83.31 2.69 6.45 4.333 24.34 5.28 486.30
PR X 15/TLCV-2 29.68 8.32 49.40 7.64 5.72 4.32 33.15 73.26 1.72 4.25 4.85 68.33 3.56 4.92 5.64 20.30 4.33 331.15
PR X 14/TLCV-3 27.00 12.62 54.07 12.42 6.92 5.32 32.40 69.35 3.12 4.89 5.96 101.03 4.02 6.49 4.74 25.01 4.48 671.35
PR X 14/TLCV-1 31.00 11.62 54.43 9.80 6.12 5.32 25.15 72.60 2.21 4.27 5.47 75.52 4.69 6.18 4.34 19.32 4.83 449.94
PC X 15/TLCV-4 30.33 8.95 49.40 9.13 6.92 5.52 27.97 71.0 1.99 4.77 5.39 84.29 3.35 6.31 3.72 20.10 5.08 398.22
PC X 15/TLCV-2 29.33 10.38 52.40 10.13 7.12 6.32 28.87 71.39 2.54 4.58 5.85 96.53 3.68 4.63 4.49 17.47 4.91 531.55
PC X 14/TLCV-3 27.33 9.27 61.47 8.80 5.72 5.12 33.01 71.93 1.67 3.98 4.37 59.11 4.07 4.57 3.79 21.34 5.01 319.03
PC X 14/TLCV-1 29.00 9.95 51.40 9.13 5.92 4.52 28.82 73.51 2.48 4.86 5.39 98.33 4.69 5.81 3.22 19.47 4.93 516.20
AV X 15/TLCV-4 29.33 9.62 55.40 9.80 5.72 5.32 30.48 74.55 2.55 4.98 5.62 92.06 4.23 6.66 4.34 21.34 4.36 533.17
AV X 15/TLCV-2 27.33 10.62 56.33 9.64 6.12 5.12 27.21 71.77 2.22 4.61 5.84 93.74 3.34 5.59 4.87 21.46 4.83 453.98
AV X 14/TLCV-3 30.67 10.62 58.73 9.52 6.52 6.12 27.35 70.45 2.59 5.12 5.94 101.47 3.32 6.62 4.20 19.63 3.74 542.87
AV X 14/TLCV-1 31.00 10.28 57.40 10.14 5.92 4.72 34.74 72.54 1.55 6.38 5.15 69.96 4.34 5.63 4.06 19.88 4.28 289.94
KA X 15/TLCV-4 30.00 11.36 50.73 11.80 6.12 5.52 27.82 73.81 2.38 5.06 5.92 103.93 5.24 5.49 4.15 20.95 5.08 492.77
KA X 15/TLCV-2 29.67 10.95 62.40 9.80 5.92 5.32 24.83 71.45 3.43 5.41 7.00 144.50 5.02 6.81 4.78 23.46 3.68 702.31
KA X 14/TLCV-3 27.67 11.92 53.69 11.44 5.72 4.92 28.82 70.48 3.52 5.72 6.62 132.83 5.21 6.33 5.71 22.59 5.05 724.13
KA X 14/TLCV-1 31.00 7.27 63.10 7.68 4.32 3.72 33.92 75.22 1.31 4.23 4.70 56.57 3.34 4.27 3.26 19.45 3.51 291.76
H–86 X 15/TLCV-4 27.67 9.95 54.07 8.74 6.72 5.12 27.26 72.30 3.37 5.94 6.08 131.37 4.32 4.45 4.42 23.32 4.05 705.76
H–86 X 15/TLCV-2 30.67 12.62 58.40 11.37 6.72 5.92 20.39 73.66 2.62 5.41 6.74 139.52 4.27 6.87 4.02 21.35 4.53 522.33
H–86 X 14/TLCV-3 27.33 13.95 57.72 12.32 6.32 5.72 33.62 71.84 3.46 6.24 6.04 117.94 3.42 6.68 3.99 21.47 5.00 727.58
H–86 X 14/TLCV-1 30.67 7.48 47.40 7.64 5.32 4.72 31.60 73.48 2.71 5.87 5.12 93.21 3.62 6.23 3.77 19.64 4.54 544.96
H–24 X 15/TLCV-4 29.33 10.95 58.07 10.13 6.32 5.72 25.58 72.87 1.65 5.32 5.83 91.69 3.20 6.34 4.17 19.88 4.24 374.93
H–24 X 15/TLCV-2 30.33 12.31 59.38 11.14 6.72 6.32 26.27 73.97 1.94 4.74 5.57 92.37 3.66 5.34 4.14 20.95 4.86 445.24
H–24 X 14/TLCV-3 27.67 10.28 50.73 9.47 6.32 5.32 25.36 73.22 1.49 5.34 5.46 94.50 3.34 5.41 4.20 23.46 5.11 336.96
H–24 X 14/TLCV-1 30.00 11.33 61.64 11.49 5.52 4.92 26.46 71.38 2.74 5.58 6.30 113.01 4.33 7.24 4.51 22.59 4.94 639.98
Mean of hybrids 29.22 10.62 55.36 10.03 6.14 5.25 28.70 72.37 2.40 5.10 5.70 97.30 3.96 5.89 4.29 21.16 4.61 501.35
CD at 5% 1.23 0.97 5.07 0.91 0.57 0.48 2.49 2.11 0.21 0.97 0.67 4.12 0.37 0.57 0.46 1.93 0.42 47.67
C.V. 2.57 5.58 5.55 5.54 5.62 5.63 5.27 1.77 5.52 11.53 7.22 2.57 5.67 5.91 6.51 5.55 5.54 5.76
1. Days to 50% flowering 2. No. of branches per plant 3. Plant height (cm)
4. Number of fruit cluster per plant 5. Number of flowers per cluster 6. Number of fruits per cluster
7. Number of fruits per plant 8. Days to first fruit harvest 9. Fruit yield per plant (kg)
10. Fruit length (cm) 11. Fruit diameter (cm) 12. Average fruit weight (g)
13. Number of locules per fruit 14. Pericarp thickness (mm) 15. Total soluble solids (ºBrix)
16. Ascorbic acid content (mg/100g) 17. Dry matter % of fruit 18. Fruit yield per hectare (q)

324 KIRAN KUMAR, DHANANJAY SHARMA, JITENDRA SINGH AND S.S. PAIKRA
RESULTS AND DISCUSSION
The performance of parents and F1 hybrids for yield
and yield related traits were computed and have been
given in table 2 & 3.
Mean values for days to 50 % flowering ranged between 26.67 to 31.33 days with an average value
28.80 days. Among the parents, Pusa Ruby (26.67)
and Arka Vikas & Kashi Anupam (27.67) were
recorded the minimum days 50 % flowering and
among the crosses, minimum days to 50 % flowering
was observed in PR X 14/TLCV-3 (27.00 days) PR
X 15/TLCV-4, PC X 14/TLCV-3, AV X 15/TLCV-2
& H–86 X 14/TLCV-3 (27.33 days). The number of
branches per plant in parents ranged from 8.57 (Pusa
Ruby) to 11.75 (2015/TOLCVRES-4). Among the
crosses, it ranged from 7.27 (KA X 14/TLCV-1) to
13.95 (H–86 X 14/TLCV-3) with an overall average of 10.62. The present result getting support from the
findings of Shankar et al., (2014) and Sujeetkumar
and Ramanjinigowda (2016).
Plant height exhibited variation among 34 treatments
which ranged from 39.14cm to 85.70cm with a mean
value 57.98cm. Among the parents, maximum mean
values for plant height were recorded in Arka Vikas
(85.70cm) and Pusa Ruby (78.13cm) whereas,
among 24 F1s, KA X 14/TLCV-1 (63.10 cm), KA X
15/TLCV-2 (62.40cm) and H–24 X 14/TLCV-1
(61.64 cm) have maximum values for plant height. Results are confirmed with earlier reports of
Ravindra Kumar et al., (2012) and Sunil et al.,
(2013). The mean values of parents for number of
fruit cluster per plant varied from 8.39 (Punjab
Chhuhara) to 11.43 (2014/TOLCVRES-1) with a
grand mean of 9.83. Among hybrids, this character
was ranged from 4.32 (KA X 14/TLCV-1) to 7.12
(PC X 15/TLCV-2) with an overall average of 6.14. .
Maximum mean number of flowers per cluster
among crosses was noted in PC X 15/TLCV-2
(7.12), which is followed by PR X 14/TLCV-3 & PC
X 15/TLCV-4 (6.92). Among the parents, number of flowers per cluster
ranged from 4.51 (Arka Vikas) to 6.38
(2014/TOLCVRES-3). Among the hybrids number
of flowers per cluster were ranged from 4.32 (KA X
14/TLCV-1) to 7.12 (PC X 15/TLCV-2) with an
overall average of 6.14. The results are in close
conformity with the findings of Shankar et al.,
(2014) and Vilas et al., (2015). Among the parents,
number of fruits per cluster ranged from 3.91 (Arka
Vikas) to 4.84 (2014/TOLCVRES-3) with parental
average of 4.40. Among the F1s, maximum values for number of fruits per cluster were recorded in PC X
15/TLCV-2 & H–24 X 15/TLCV-2 (6.32) followed
by AV X 14/TLCV-3 (6.12) and H–86 X 15/TLCV-2
(5.92). The trait number of fruits per plant is very
important as it plays an important role in deciding the
yield. The maximum number of fruits per plant
among parents were recorded in Arka Vikas (31.06)
followed by H-86 (29.99). Among hybrids maximum
number of fruits per plant was observed for AV X
14/TLCV-1 (34.74) which is followed by KA X
14/TLCV-1 (33.92), H–86 X 14/TLCV-3 (33.62) and
PR X 15/TLCV-2 (33.15).
Mean values for days to first fruit harvest in parent
ranged from 70.99 (Kashi Anupam & H-86) to 73.93 (Punjab Chhuhara) days with a parental mean of
72.02. Among the hybrids, minimum days to first
fruit harvest were recorded in PR X 14/TLCV-3
(69.35 days) which was followed by AV X
14/TLCV-3 (70.45 days), KA X 14/TLCV-3 (70.48
days) and PR X 15/TLCV-4 (70.76 days). Mean
values for fruit yield per plant (kg) was ranged
between 1.11 to 3.78 kg and the average value was
2.25kg. Among the parents, maximum values for the
same trait were observed in H-86 (3.78 kg) and
2015/TOLCVRES-4 (2.68kg) whereas, among the 24
cross combinations, KA X 14/TLCV-3 (3.52kg) followed by H–86 X 14/TLCV-3 (3.46 kg) and KA
X 15/TLCV-2 (3.43 kg) showed maximum values for
fruit yield per plant. Same finding for fruit yield per
plant was also reported by Sunil et al., (2013) and
Kumar et al., (2016).
Fruit length (cm) varied from 3.51(Pusa Ruby) to
6.17 cm (2015/TOLCVRES-4) with an overall mean
of 4.93 cm in parents. Although among the 24 cross
combinations, maximum values for fruit length were
recorded in AV X 14/TLCV-1 (6.38 cm) followed by
H–86 X 14/TLCV-3 (6.24 cm) and H–86 X 15/TLCV-4 (5.94 cm). The results are in close
conformity with the findings of Gul et al., (2010) and
Sunil et al., (2013). Among the parents, maximum
values for fruit diameter were recorded in
2015/TOLCVRES-2 (6.44cm), 2014/TOLCVRES-3
(6.26cm) and 2015/TOLCVRES-4 (6.12cm). Among
the crosses, this trait varied from 4.37cm to 7.00 cm
with overall mean 5.70 cm. Maximum fruit diameter
was observed in crosses KA X 15/TLCV-2 (7.00
cm), which was followed by H–86 X 15/TLCV-2
(6.74 cm) and KA X 14/TLCV-3 (6.62 cm). Average
fruit weight contributes to total fruit yield as well as consumer preference for specific fruit size is
considered as one of the major objectives of breeding
programs in tomato. The maximum average fruit
weight was recorded among parents in H-86 &
2015/TOLCVRES-2 (107.06g) and
2015/TOLCVRES-4 (97.79g). Among the crosses,
maximum average fruit weight was recorded in KA
X 15/TLCV-2 (144.50 g) which was followed by H–
86 X 15/TLCV-2 (139.52 g), KA X 14/TLCV-3
(132.83g) and H–86 X 15/TLCV-4 (131.37g) with an
overall cross mean of 97.30 g. The earlier reports also suggested an increase in average fruit weight of
tomato hybrids Padmini and Vadivel (1997) Singh et
al., (2012) and Chauhan et al., (2014).
Among all the parents, number of locules per fruit
ranged from 2.47 (Punjab Chhuhara) to 5.88
(2015/TOLCVRES-2) with an overall parental mean
of 4.23. Among 24 crosses this trait ranged from 2.69
to 5.24 with overall mean 3.96. Highest mean value

JOURNAL OF PLANT DEVELOPMENT SCIENCES VOL. 12(5) 325
for number of locules per fruit was recorded in
crosses KA X 15/TLCV-4 (5.24) which was
followed by KA X 14/TLCV-3 (5.21) and KA X
15/TLCV-2 (5.02). Pericarp thickness of fruits
ranges from 4.10 (2014/TOLCVRES-1) to 6.18 mm
(2014/TOLCVRES-3) with an overall parental mean of 5.06 mm. The cross performance ranged from 4.27
(KA X 14/TLCV-1) to 7.24 mm (H–24 X 14/TLCV-
1) followed by H–86 X 15/TLCV-2 (6.87 mm), KA
X 15/TLCV-2 (6.81mm) and H–86 X 14/TLCV-3
(6.68 mm) with an overall mean 5.89 mm.
High total soluble solids (TSS) and low acidity are
the major factors well thought-out for manufacture of
processed products. Among the parents, highest TSS
was recorded in 2014/TOLCVRES-3 (4.49°Brix),
Punjab Chhuhara (4.47°Brix) and Pusa Ruby
(4.44°Brix). Among the crosses, this trait ranged
from 3.22 (PC X 14/TLCV-1) to 5.71 ºBrix (KA X 14/TLCV-3) which is followed by PR X 15/TLCV-2
(5.64 ºBrix), AV X 15/TLCV-2 (4.87 ºBrix), KA X
15/TLCV-2 (4.78 ºBrix) and PR X 14/TLCV-3 (4.74
ºBrix) with an overall cross mean of 4.29 ºBrix.
Present findings are in accordance with the reports of
Shankar et al., (2014) and Basavaraj et al., (2016).
Ascorbic acid content is nutritionally an important
constituent. Small fruited genotypes are generally
richer in ascorbic acid content. Among all the
parents, ascorbic acid content ranged from 18.98 to
24.31 mg/100g with an overall parental average of 21.51 mg/100g. Maximum content was recorded by
2014/TOLCVRES-3 (24.31 mg/100g) and Punjab
Chhuhara (22.15 mg/100g). Among hybrids, this
character was varied from 25.01 mg/100g (PR X
14/TLCV-3), which is followed by PR X 15/TLCV-4
(24.34 mg/100g) and KA X 15/TLCV-2 (23.46
mg/100g) with an overall average of 21.16 mg/100g.
Among all the parents, dry matter % of fruit ranged
from 3.48 to 6.21% with an overall parental average
of 4.35%. The highest dry matter % of fruit was
recorded by H-86 (6.21%), Kashi Anupam (5.03%)
and H-24 (5.00%). Among the crosses, dry matter % of fruit ranged from 3.51% (KA X 14/TLCV-1) to
5.28 % (PR X 15/TLCV-4) with overall mean 4.61
%. Maximum dry matter % of fruit was recorded in
crosses PR X 15/TLCV-4 (5.28%), which was
followed by H–24 X 14/TLCV-3 (5.11%).
Mean values for fruit yield per hectare ranged from
295.98 to 659.72q with an overall parental average of
465.43q. The highest mean value for fruit yield per
hectare H-86 (659.72 q), 2014/TOLCVRES-3
(611.04q). Among the crosses this trait ranged from
289.94 to 727.58 q with an overall mean 501.35 q. Maximum fruit yield per hectare was observed in the
cross H–86 X 14/TLCV-3 (727.58 q), followed by
KA X 14/TLCV-3 (724.13 q), H–86 X 15/TLCV-4
(705.76 q), KA X 15/TLCV-2 (702.31 q) and PR X
14/TLCV-3 (671.35 q). From the present findings, it
can be summarized that based on mean worth, top
two parents H-86 and 2014/TOLCVRES-3 and top
five crosses for fruit yield and other traits were H–86
X 14/TLCV-3, KA X 14/TLCV-3, H–86 X
15/TLCV-4, KA X 15/TLCV-2 and PR X 14/TLCV-
3. Hence, these should be utilized for future breeding
programmes for desirable trait improvement.
REFERENCES
Anonymous (2017). Horticultural statistics at a
glance 2017, Horticulture statistics division
department of agriculture, cooperation & farmers
welfare ministry of agriculture & farmers welfare,
government of India, p: 250.
Anonymous (2017). Horticulture crops estimates for
the year 2017-18 (First advance estimates). National
Horticulture Board, Gurugram (Haryana).
Basavaraj, L. B., Vilas, D. G., Shivappa, M. K.,
Vijayakumar, D. R., Nagesh, G. C. and Reshmika,
P. K. (2016). Combining ability analysis for yield and quality traits in tomato (Solanum lycopersicum
L.). Green Farming, 7(1): 26-30.
Chauhan, V. B. S., Kumar, Raj, Behera, T. K. and
Yadav, R. K. (2014). Studies on heterosis for yield
and its attributing traits in tomato (Solanum
lycopersicum L.). Int. J. Agri. Env. & Biot., 7(1): 95-
100.
Gul, R., Rahman, H. U., Khalil, I. H., Shah, S. M.
A. and Ghafoor, A. (2010). Heterosis for flower and
fruit traits in tomato (Lycopersicon esculentum M.).
Afri. J. Biotech., 9(27): 4144-4151.
Kumar, P. A., Reddy, K. R., Reddy, R. V. S. K.,
Pandravada S. R. and Saidaiah, P. (2016). Per se
performance of dual purpose tomato genotypesfor
growth, yield and quality attributes. Plant Archives,
16(2): 695-699.
Nuez, F., Prohens, J. and Blanca, J. M. (2004).
Relationships, origin, and diversity of galapagos
tomatoes: implications for the conservation of natural
populations. Ame. J. Bot., 91: 86-99.
Padmini, K. and Vadivel, E. (1997). Studies on
genetic variability and heritability in F2 generation of
tomato (Lycopersicon esculentum Mill.). South Ind. Horti., 45(1- 2): 1-4.
Kumar, Ravindra, Srivastava, K., Somappa, J.,
Kumar, Sunil and Singh, R.K. (2012). Heterosis
for yield and yield components in tomato
(Lycopersicon esculentum Mill). Ele. J. Plant Breed.,
3(2): 800-805.
Sekhar, L., Prakash, B. G., Salimath, P. M.,
Hiremath, C. P., Sridevi, O. and Patil, A.
A. (2010). Implications of heterosis and combining
ability among productive single cross hybrids in
tomato. Electro. J. Plant Breed., 1(4): 706-711.
Shankar, A., Reddy, R.V.S.K., Sujatha, M. and
Pratap, M. (2014). Development of superior F₁ hybrids for commercial exploitation in tomato
(Solanum lycopersicon L). Int. J. Farm Sci., 4(2): 58-
69.
Singh, N. B., Wani, S. H., Haribhushan, A. and
Nongthombam, R. (2012). Heterosis studies for
yield and its components in tomato (Solanum

326 KIRAN KUMAR, DHANANJAY SHARMA, JITENDRA SINGH AND S.S. PAIKRA
lycopersicum L.) under valley conditions of Manipur.
Vegetos, 25(2): 257-265.
Sujeet, Kumar and Ramanjini Gowda, P.H. (2016). Estimation of heterosis and combining ability
in tomato for fruit shelf life and yield component
traits using line x tester method. Int. J. Agri. Envi. Res., 2(3):445-470.
Sunil, K., Singh, Y., Baranwal, B. K., D. K and
Solankey, S. S. (2013). Genetic study of heterosis
for yield and quality components in tomato (Solanum
lycopersicum) Afri. J. Agri. Res. 8(44): 5585-5591.
Vilas, C. A., Rana, M. K., Dhankar, S. K., Kumar,
Vikash and Yadav, N. (2015). Studies on
combining ability analysis for yield and yield related
traits in tomato (Solanum lycopersicum L.). Enzy. Engi., 4(2): 1-5.