journal of production engineering, vol.12, no.1, 2009 of production engineering15_2.pdf · dr....
TRANSCRIPT

Novi Sad, 2012
9 7 7 1 8 2 1 4 9 3 0 0 5
ISSN 1821-4932
J O U R N A L O F
PRODUCTION ENGINEERING
Volume 15 No.2
JO
UR
NA
L O
F P
RO
DU
CT
ION
EN
GIN
EE
RIN
G,
Vo
l.1
2,
No
.1,
20
09
JO
UR
NA
L O
F P
RO
DU
CT
ION
EN
GIN
EE
RIN
G,
Vo
l.1
2,
No
.1,
20
09
UNIVERSITY OF NOVI SADFaculty of Technical Sciences
Department of Production EngineeringNOVI SAD, SERBIA
UDK 621 ISSN 1821-4932

University of Novi Sad FACULTY OF TECHNICAL SCIENCES
DEPARTMENT OF PRODUCTION ENGINEERING 21000 NOVI SAD, Trg Dositeja Obradovica 6, SERBIA
UDK 621 ISSN 1821-4932
JJJOOOUUURRRNNNAAALLL OOOFFF
PPPRRROOODDDUUUCCCTTTIIIOOONNN EEENNNGGGIIINNNEEEEEERRRIIINNNGGG
Volume 15 Number 2
Novi Sad, October 2012

Journal of Production Engineering, Vol.15 (2012), Number 2 Publisher: FACULTY OF TECHNICAL SCIENCES DEPARTMENT OF PRODUCTION ENGINEERING 21000 NOVI SAD, Trg Dositeja Obradovica 6 SERBIA Editor-in-chief: Dr. Pavel Kovač, Professor, Serbia
Reviewers: Dr Miroslav BADIDA, Prof. Ing. Slovak Republic Dr. Janko HODOLIČ, Professor, Serbia Dr. Marin GOSTIMIROVIĆ, Professor, Serbia Dr. Frantisek HOLESOVSKY, Professor, Czech Republic Dr. Pavel KOVAČ, Professor, Serbia Dr. Mikolaj KUZINOVSKI, Professor, Macedonia Dr. Stanislav LEGUTKO, Professor, Poland Dr. Ildiko MANKOVA, Professor, Slovak Republic Dr. Krzysztof ROKOSZ, Professor, Poland Dr. Branko ŠKORIĆ, Professor, Serbia Dr. Ljubomir ŠOOŠ, Professor., Slovak Republic Dr. Miodrag HADŽISTEVIC, Assoc. Professor, Serbia Dr. Zoran JURKOVIĆ, Assist. Professor, Croatia Dr. Mijodrag MILOŠEVIĆ, Assist. Professor, Serbia Dr. Đorđe VUKELIĆ, Assist. Professor, Serbia
Technical treatment and design: M.Sc. Borislav Savković, Assistant
Dr. Mijodrag Milošević, Assist. Professor Manuscript submitted for publication: October 10, 2012. Printing: 1st Circulation: 300 copies CIP classification: Printing by: FTN, Graphic Center GRID, Novi Sad
ISSN: 1821-4932
CIP – Катаголизација у публикацији Библиотека Матице српске, Нови Сад 621 ЈOURNAL of Production Engineering / editor in chief Pavel Kovač. – Vol. 12, No. 1 (2009)- . – Novi Sad : Faculty of Technical Sciences, Department for Production Engineering, 2009-. – 30 cm Dva puta godišnje (2012-). Je nastavak: Časopis proizvodno mašinstvo = ISSN 0354-6446 ISSN 1821-4932

INTERNATIONAL EDITORIAL BOARD __________________________________________________________________________________ Dr. Joze BALIĆ, Professor, Slovenia Dr. Konstantin BOUZAKIS, Professor, Greece Dr. Miran BREZOČNIK, Professor, Slovenia Dr. Ilija ĆOSIĆ, Professor, Serbia Dr. Pantelija DAKIĆ, Professor, Bosnia and Herzegovina Dr. Numan DURAKBASA, Professor, Austria Dr. Katarina GERIĆ, Professor, Serbia Dr. Marin GOSTIMIROVIĆ, Professor, Serbia Dr. Janko HODOLIČ, Professor, Serbia Dr. František HOLEŠOVSKY, Professor, Czech Republic Dr. Amaia IGARTUA, Professor, Spain Dr. Juliana JAVOROVA, Professor, Bulgaria Dr. Vid JOVIŠEVIĆ, Professor, Bosnia and Herzegovina Dr. Janez KOPAČ, Professor, Slovenia Dr. Mikolaj KUZINOVSKI, Professor, Macedonia Dr. Miodrag LAZIĆ, Professor, Serbia Dr. Stanislav LEGUTKO, Professor, Poland Dr. Chusak LIMSAKUL, Professor, Thailand Dr. Vidosav MAJSTOROVIĆ, Professor, Serbia Dr. Miroslav PLANČAK, Professor, Serbia Dr. Mirko SOKOVIĆ, Professor, Slovenia Dr. Bogdan SOVILJ, Professor, Serbia Dr. Antun STOIĆ, Professor, Croatia Dr. Peter SUGAR, Professor, Slovak Republic Dr. Branko ŠKORIĆ, Professor, Serbia Dr. Ljubomir ŠOOŠ, Professor, Slovak Republic Dr. Ljubodrag TANOVIĆ, Professor, Serbia Dr. Wiktor TARANENKO, Professor, Ukraine Dr. Velimir TODIĆ, Professor, Serbia Dr. Marian TOLNAY, Professor, Slovak Republic Dr. Andrei TUDOR, Professor, Romania Dr. Gyula VARGA, Professor, Hungary Dr. Milan ZELJKOVIĆ, Professor, Serbia Dr. Miodrag HADŽISTEVIĆ, Assoc. Professor, Serbia Dr. Borut KOSEC, Assoc. Professor, Slovenia Dr. Milenko SEKULIĆ, Assoc. Professor, Serbia Dr. Katica ŠIMUNOVIĆ, Assoc. Professor, Croatia Dr. Aco ANTIĆ, Assist. Professor, Serbia Dr. Sebastian BALOŠ, Assist. Professor, Serbia Dr. Igor BUDAK, Assist. Professor, Serbia Dr. Ognjan LUŽANIN, Assist. Professor, Serbia Dr. Slobodan TABAKOVIĆ, Assist. Professor, Serbia Dr. Đorđe VUKELIĆ, Assist. Professor, Serbia

Editorial
The Journal of Production Engineering dates back to 1984, when the first issue of the Proceedings of the Institute of Production Engineering was published in order to present its accomplishments. In 1994, after a decade of successful publication, the Proceedings changed the name into Production Engineering, with a basic idea of becoming a Yugoslav journal which publishes original scientific papers in this area.
In 2009 year, our Journal finally acquires its present title - Journal of Production Engineering. To meet the Ministry requirements for becoming an international journal, a new international editorial board was formed of renowned domestic and foreign scientists, refereeing is now international, while the papers are published exclusively in English. From the year 2011 Journal is in the data base COBISS and KoBSON presented.
The Journal is distributed to a large number of recipients home and abroad, and is also open to foreign authors. In this way we wanted to heighten the quality of papers and at the same time alleviate the lack of reputable international and domestic journals in this area.
In this journal number are published, reviewed papers from 11rd Conference MMA 2012 Advanced Production Technologiesin Novi Sad (Serbia) and from "3rd International Conference of Sustainable Life In Manufacturing (SLIM 2012)", which was at the Istanbul in Turkey and. new papers as well.
Editor in Chief Professor Pavel Kovač, PhD,

I
Contents REVIEW PAPER Yasa, E., Pilatin, S., Çolak, O. OVERVIEW OF CRYOGENIC COOLING IN MACHINING OF TI ALLOYS AND A CASE STUDY ............................................................................................................................................................ 1 ORIGINAL SCIENTIFIC PAPER Cerce, L., Pusavec, F., Kopac, J.
SPATIAL CUTTING TOOL WEAR EVALUATION .............................................................................................. 10 Gostimirović, M., Pucovsky, V., Kovač, P., Rodić, D., Savković, B. MODELING OF DISCHARGE ENERGY IN ELECTRICAL DISCHARGE MACHINING BY THE USE OF GENETIC PROGRAMMING ............................................................................. 15 Kopac, J., Cus, F., Stoic, A., Zabkar, B. SOME IDEAS ABOUT SUSTAINABLE MANUFACTURING CONCEPT .......................................................... 19 Kramar, D., Sekulić, M., Kovač, P., Gostimirović, M., Kopač, J. THE IMPLEMENTATION OF TAGUCHI METHOD FOR QUALITY IMPROVEMENT IN HIGH-PRESSURE JET ASSISTED TURNING PROCESS .............................................................................. 23 Kramar, D., Sredanović, B., Globočki - Lakić, G., Kopač, J. CONTRIBUTION TO UNIVERSAL MACHINABILITY DEFINITION .............................................................. 27 Vasilko, K. THE CAUSES OF TOOL WEAR IN INTERUPTED CUT ..................................................................................... 33 Čiča, Đ., Zeljković, M., Lakić-Globočki, G., Sredanović, B., Borojević, S. IDENTIFICATION OF CONTACT PARAMETERS OF SPINDLE–HOLDER–TOOL ASSEMBLY USING ARTIFICIAL NEURAL NETWORKS ................................................................................. 37 Milutinovic, M., Slavkovic, N., Milutinovic, D. KINEMATIC MODELING OF THE TRICEPT BASED 5-AXIS MACHINE TOOL ............................................ 41 Šooš, Ľ., Križan, P., Matúš, M. OPTIMIZATION OF THE SPINDLE-BEARING SYSTEM .................................................................................. 47 Bouzakis, K.-D., Skordaris, G., Gerardis, S., Bouzakis, E. ADVANCED ANLAYTICAL-EXPERIMENTAL PROCEDURES FACILITATING THE EFFECTIVE APPLICATION OF MICRO-BLASTING ON COATED TOOLS CONSIDERING AMONG OTHERS THE FILM BRITTLENESS ......................................................................... 53 Jakovljevic, Z. POINT CLOUD REDUCTION USING SUPPORT VECTOR MACHINES .......................................................... 59
II
Tsiafis, I., Bouzakis, K.-D., Xanthopoulou, M., Tsolis, G., Xenos, Th. ANALYSIS OF ROLLER BEARINGS’ VIBRATION SIGNALS BY HILBERT – HUANG TRANSFORM AS DIAGNOSTIC TOOL ............................................................................................................... 63 Milojević, Z., Navalušić, S., Zeljković, M., Vićević, M., Beju, L. EXTENSION OF THE PROGRAM SYSTEM FOR NC MACHINING PROGRAM VERIFICATION WITH HAPTIC DEVICE ............................................................................................................ 67 Milutinovic, D., Slavkovic, N., Kokotovic, B., Milutinovic, M., Zivanovic, S., Dimic, Z. KINEMATIC MODELING OF RECONFIGURABLE PARALLEL ROBOTS BASED ON DELTA CONCEPT .................................................................................................................................................. 71 Petelj, A., Hadžistević, M., Antić, A., Hodolič, J. DETERMINATION OF ABSORPTION COEFFICIENT OF SAMPLE UNDER NONLABORATORY CONDITIONS .......................................................................................................................................................... 75 Kuzman, K., Kacmarcik, I., Pepelnjak, T., Plancak, M., Vilotic, D. EXPERIMENTAL CONSOLIDATION OF ALUMINIUM CHIPS BY COLD COMPRESSION......................................................................................................................................................... 79 Vilotić, M., Lainović, T., Kakaš, D., Blažić, L., Marković, D., Ivanišević, A. ROUGHNESS ANALYSIS OF DENTAL RESIN-BASED NANOCOMPOSITES ................................................. 83 Vitković, N., Veselinović, M., Mišić, D., Manić, M., Trajanović, M., Mitković, M. GEOMETRICAL MODELS OF HUMAN BONES AND IMPLANTS, AND THEIR USAGE IN APPLICATION FOR PREOPERATIVE PLANNING IN ORTHOPEDICS ......................................... 87 Williams, R.J., Eggbeer, D., Lapcevic, A., Trifkovic, B., Puskar, T., Budak, I., Jevremovic, D. RE-CAD/CAM APPROACH IN DESIGN AND MANUFACTURING OF DENTAL CERAMIC CROWNS IN COMBINATION WITH MANUAL INDIVIDUALIZATION........................................ 91 PRELIMINARY NOTE
Todić, V.V., Suzić, N. SYSTEMATIZATION OF PREVENTIVE MAINTENANCE PROCEDURES OF BRAKING SYSTEMS FOR RAIL VEHICLES AND CRITERIA FOR BRAKE INSERTS REPLACEMENT ....................................................................................................................................................... 95 Milanković, D., Milanović, B., Agarski, B., Crnobrnja, B., Ilić, M., Kosec, B., Budak, I. LIFE CYCLE ASSESSMENT OF AN INTERMODAL STEEL BUILDING UNIT IN SERBIA ...................................................................................................................................................................... 99 Novak-Marcincin, J., Novakova-Marcincinova, L. PRODUCTION OF PARTS REALIZED BY FDM RAPID PROTOTYPING TECHNOLOGY AND THEIR TESTING ............................................................................................................... 103 Hronec, O., Vilček, J., Adamišin, P., Andrejovský, P., Huttmanová, E. USE OF PHRAGMITES AUSTRALIS (CAV.) TRIN AND ITS REPRODUCTION IN THE REVITALIZATION OF CONTAMINATED SOILS...................................................................................... 107 INSTRUCTION FOR CONTRIBUTORS ............................................................................................. 113

1
Review Paper
Yasa, E., Pilatin, S., Çolak, O.
OVERVIEW OF CRYOGENIC COOLING IN MACHINING OF TI ALLOYS AND A CASE STUDY
Received: 01 June 2012 / Accepted: 07 July 2012
Abstract: Metal cutting, e.g. turning, milling, etc., is a form of subtractive manufacturing whereby a sharp tool is used to physically remove material to achieve a desired geometry. While machining,heat is generated which limits the cutting tool life and influences the part quality and cutting forces. Many researchers have studied the mechanism behind the generated heat during metal cutting in order to optimize the machining process with a good part quality and a long tool life. This paper gives an overview of cryogenic cooling as a remedy in the field of machining Ti alloys followed by a case study: turning of Ti-6Al-4V with cryogenic cooling in TUSAS Engine Industries, Inc. Although slightly improved results were obtained, it is decided to abandon the cooling strategy due to other limitations. Key words: cryogenic cooling, machining, Ti alloys Pregled slučaja kriogenog hlađenja pri obradi Ti legura. Rezanje metala, na primer struganjem, glodanjem itd., su oblici postupaka obrade kojima se oblikovanje radnih predmeta ostvaruje skidanjem materijala oštrim alatom. Pri obradi, generiše se temperatura koja utiče kako na postojanost alata tako i na obradak i snagu rezanja. Mnogi naučnici su istraživali toplotne pojave tokom obrade rezanjem u cilju optimizacije procesa s’obzirom na kvalitet obradka i postojanost alata. Ovaj rad daje pregled kriogenog hlađenja kao preporuka pri obradi Ti legura u ovom slučaju kao: struganje Ti-6Al-4V sa kriogenim hlađenjem u TUSAS industriji motora. Iako su znatno poboljšani dobijeni rezultati, ova strategija hlađenja nije dobra zbog drugih ograničenja. Ključne reči: kriogeno hlađenje, obrada, TI legure 1. INTRODUCTION
Titanium alloys have always received interest due to their wide range of applications in aerospace, automotive, chemical and medical industries [1]. This is mainly due to their high strength-to-weight ratio and maintaining their high strength at elevated temperatures as well as their exceptional corrosion resistance. For instance, in aero-engines, titanium alloys are used both in low and high pressure compressors; and for components subjected to high centrifugal loads such as disks and blades; and for components which operate under severe fatigue conditions. On the other hand, titanium alloys are considered as difficult-to-machine materials due to high cutting temperatures and rapid tool wear. Poor machinability of titanium and its alloys are due to their inherent material properties such as low thermal conductivity increasing the tool temperature at tool/workpiece interface which affects the tool life adversely; high hot hardness and strength with low modulus of elasticity causing deformation / wear of the cutting tool during machining; high dynamic shear strength during cutting resulting in localization of shear stress and the production of abrasive saw-tooth edges; and chemical reactivity with most tool materials at elevated temperatures resulting in accelerated tool wear [2]. Advances in tooling like coated cemented carbides, ceramic tools, cubic boron nitride and solid lubricant coating as well as cooling and lubrication techniques (i.e. cryogenic systems, high pressure cooling and minimal quantity lubrication techniques) have led to
cutting Ti alloys with high thermal and chemical stability with increased machinability.
This paper mainly aims to give a review of cryogenic cooling strategies aiming at improved machinability of Ti alloys. Following the review, a case study of cryogenic cooling employed during turning of Ti-6Al-4V at TUSAŞ Engine Industries, Inc. (TEI) is presented.
2. CRYOGENIC COOLING OF TI ALLOYS
Cryogenic cooling, which is an environmentally safe
alternative to conventional emulsion cooling, is an efficient way of maintaining the temperature at the cutting interface well below the softening temperature of the cutting tool material. Liquid nitrogen is commonly used in cryogenic cooling applications because of its low cost and being environmentally friendly among other cryogenic fluids like helium, hydrogen, neon, air and oxygen [3]. Some potential benefits of cryogenic cooling mentiond in the literature are
sustainable manufacturing (cleaner, safer and environmentally friendly),
increased material removal rate, increased tool life and improved machined part surface
quality/integrity [4]. The main disadvantage of this technology, besides
additional equipment needed, is relatively high price of liquid nitrogen that is not reusable unlike conventional

2
cutting fluids circulated in the machine tools usually for weeks. Therefore, it is very crucial to select the appropriate cryogenic cooling strategy to minimize the use and maximize the efficiency.
Many aspects of machining may be affected when cryogenic cooling is integrated like workpiece material properties, cutting temperature, cutting forces, tool wear and tool life, workpiece surface roughness and dimensions as well as tool/workpiece friction and cutting forces according to Yildiz and Nalbant [5]. To be able understand the effect of cryogenic machining, many researchers have studied different aspects using different cryogenic cooling approaches. These may include pre-cooling the workpiece, indirect cryogenic cooling, cryogenic spraying with jet and direct cryogenic cooling. Hong and Ding has studied the effect of different approaches in cryogenic cooling during turning of Ti-6Al-4V [6]. As shown in Fig. 1, different cooling approaches lead to different cutting tool temperatures (measured and predicted). Cooling approaches in the order of effectiveness (worst to best) are dry cutting, cryogenic tool back cooling, emulsion cooling, pre-cooling the workpiece, cryogenic flank cooling, cryogenic rake cooling and simultaneous rake and flank cooling. The cooling efficiency trends are same even at different cutting speeds as depicted in Fig. 2.
Fig. 1. Measured and predicted tool temperature for different cooling approaches [6]
Fig. 2. Tool temperatures versus cutting speed predicted by FEM study [6]
In another study, Hong et al. also modified tools in order to increase the cryogenic cooling efficiency to gain the maximum benefit [7]. Instead of flooding the general cutting area, a liquid nitrogen delivery nozzle system is used spraying the nitrogen only to a localized zone of the tool rake and/or tool flank in well-controlled jets (see Fig. 3). As observed in Fig. 4, all cryogenic machining approaches resulted in higher main cutting force compared to dry cutting. The more nitrogen is used, the lower the cutting temperature. Hong et al. also concludes that cryogenic cooling tends to increase the cutting force because the work material becomes harder and stronger at lower temperature while the lower temperature makes the material less sticky, reducing the frictional force inherent in the cutting process [7]. The findings are consistent with the temperatures measured and calculated as shown in Table 1.
Fig. 3. Two nozzle liquid nitrogen delivery system [7]
Table 1: Temperatures encountered in dry and cryogenic machining [7]
Cutting Forces vs Cryogenic Cooling Approach
1268 1290 1308 1361
560 547 507 516476 494 520 543
0
500
1000
1500
2000
Dry cutting Flank cooling Rake cooling Both rake andflank cooling
Cooling approach
Fo
rce
(N
)
Main Cutting Force Fc Feed Force Ff Thrust Force Ft
Fig. 4. Cutting forces obtained for different cryogenic cooling approaches and dry cutting for 1.5 m/s speed, 0.254 mm feed and 1.27 mm depth of cut for Ti-6Al-4V [7]
Dhananchezian and Kumar has also used a modified
c
3
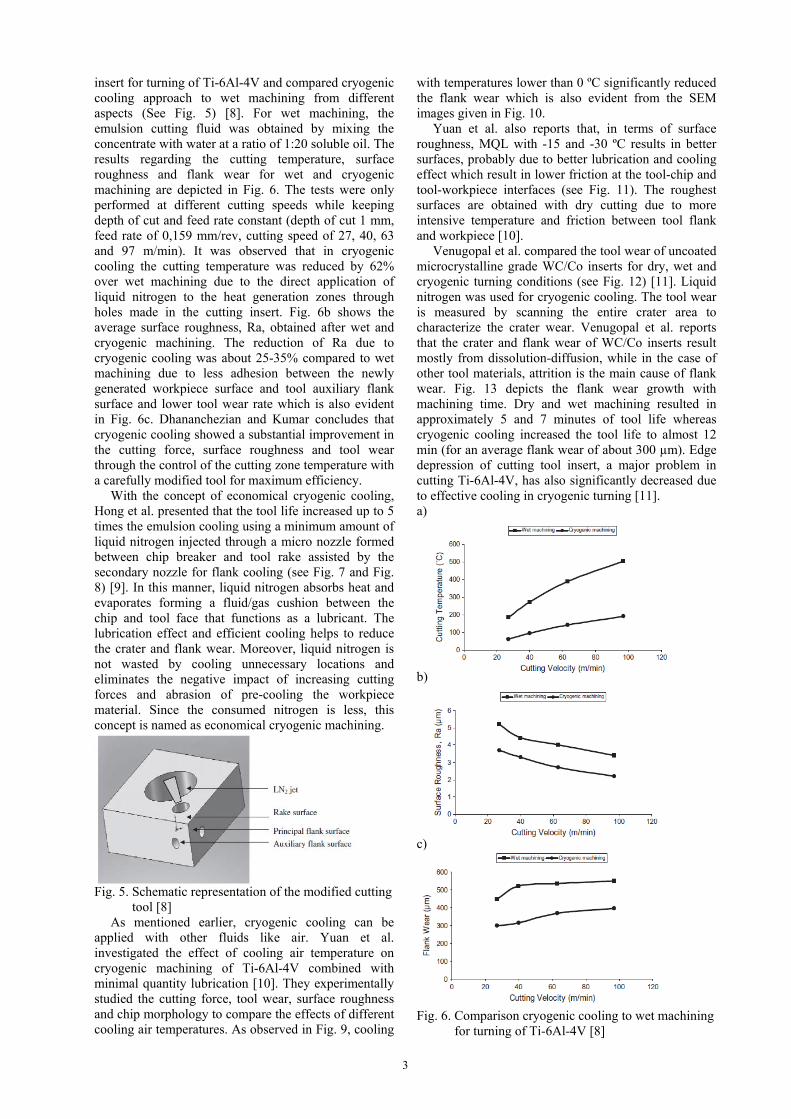
insert for turning of Ti-6Al-4V and compared cryogenic cooling approach to wet machining from different aspects (See Fig. 5) [8]. For wet machining, the emulsion cutting fluid was obtained by mixing the concentrate with water at a ratio of 1:20 soluble oil. The results regarding the cutting temperature, surface roughness and flank wear for wet and cryogenic machining are depicted in Fig. 6. The tests were only performed at different cutting speeds while keeping depth of cut and feed rate constant (depth of cut 1 mm, feed rate of 0,159 mm/rev, cutting speed of 27, 40, 63 and 97 m/min). It was observed that in cryogenic cooling the cutting temperature was reduced by 62% over wet machining due to the direct application of liquid nitrogen to the heat generation zones through holes made in the cutting insert. Fig. 6b shows the average surface roughness, Ra, obtained after wet and cryogenic machining. The reduction of Ra due to cryogenic cooling was about 25-35% compared to wet machining due to less adhesion between the newly generated workpiece surface and tool auxiliary flank surface and lower tool wear rate which is also evident in Fig. 6c. Dhananchezian and Kumar concludes that cryogenic cooling showed a substantial improvement in the cutting force, surface roughness and tool wear through the control of the cutting zone temperature with a carefully modified tool for maximum efficiency.
With the concept of economical cryogenic cooling, Hong et al. presented that the tool life increased up to 5 times the emulsion cooling using a minimum amount of liquid nitrogen injected through a micro nozzle formed between chip breaker and tool rake assisted by the secondary nozzle for flank cooling (see Fig. 7 and Fig. 8) [9]. In this manner, liquid nitrogen absorbs heat and evaporates forming a fluid/gas cushion between the chip and tool face that functions as a lubricant. The lubrication effect and efficient cooling helps to reduce the crater and flank wear. Moreover, liquid nitrogen is not wasted by cooling unnecessary locations and eliminates the negative impact of increasing cutting forces and abrasion of pre-cooling the workpiece material. Since the consumed nitrogen is less, this concept is named as economical cryogenic machining.
Fig. 5. Schematic representation of the modified cutting tool [8]
As mentioned earlier, cryogenic cooling can be applied with other fluids like air. Yuan et al. investigated the effect of cooling air temperature on cryogenic machining of Ti-6Al-4V combined with minimal quantity lubrication [10]. They experimentally studied the cutting force, tool wear, surface roughness and chip morphology to compare the effects of different cooling air temperatures. As observed in Fig. 9, cooling
with temperatures lower than 0 ºC significantly reduced the flank wear which is also evident from the SEM images given in Fig. 10.
Yuan et al. also reports that, in terms of surface roughness, MQL with -15 and -30 ºC results in better surfaces, probably due to better lubrication and cooling effect which result in lower friction at the tool-chip and tool-workpiece interfaces (see Fig. 11). The roughest surfaces are obtained with dry cutting due to more intensive temperature and friction between tool flank and workpiece [10].
Venugopal et al. compared the tool wear of uncoated microcrystalline grade WC/Co inserts for dry, wet and cryogenic turning conditions (see Fig. 12) [11]. Liquid nitrogen was used for cryogenic cooling. The tool wear is measured by scanning the entire crater area to characterize the crater wear. Venugopal et al. reports that the crater and flank wear of WC/Co inserts result mostly from dissolution-diffusion, while in the case of other tool materials, attrition is the main cause of flank wear. Fig. 13 depicts the flank wear growth with machining time. Dry and wet machining resulted in approximately 5 and 7 minutes of tool life whereas cryogenic cooling increased the tool life to almost 12 min (for an average flank wear of about 300 µm). Edge depression of cutting tool insert, a major problem in cutting Ti-6Al-4V, has also significantly decreased due to effective cooling in cryogenic turning [11]. a)
b)
c)
Fig. 6. Comparison cryogenic cooling to wet machining for turning of Ti-6Al-4V [8]

4
Fig. 7. A schematic of the economical cryogenic machining approach [9]
Fig. 8. Expanded tool life testing results in terms of total volume removal at different cutting speeds [9]
Fig. 9. Flank wear with cutting time under dry, wet and cryogenic machining at 0, -15,-30 and -45ºC [10]
Fig. 10. SEM views of the insert after machining 8 min under a) dry b) wet c) MQL d)MQL with cooling air at 0ºC e) MQL with cooling air at - 15ºC f) MQL with cooling air at -30ºC g) MQL with cooling air at -45ºC [10]
Fig. 11. Effect of cutting environments on roughness
[10]
Fig. 12. Tool wear after 5 min machining at a) 70 m/min b) 85 m/min and c) 100 m/min and feed 0.20 mm/rev for all cases [11]

5
Fig. 13. Growth of average flank wear with machining time at 85 m/min and 0.2 mm/rev
To understand the effect of cryogenic cooling on friction, Hong performed idealized disk-flat contact tests for different applications of liquid nitrogen as illustrated in Fig. 14 [12]. It was originally assumed that the liquid nitrogen lubrication mechanism was due to a reduction in friction due to a change in material properties on cooling. However, the tests revealed that that is not always the case and the effect is significantly dependent on material pairs. The second assumption before the tests were conducted was that the liquid nitrogen injection into contact zone created a lubricating film and the tests confirmed that liquid nitrogen jet was very effective in reducing friction. Other important results of the tests were that coating layer as a solid lubricant gives good results when dry machining but it may cause adverse lubrication effects at low temperatures and that liquid nitrogen cooling gives effective lubrication with uncoated inserts [12]. Fig. 15 summarizes the results obtained with Ti-6Al-4V against coated insert at 0.3 m/s.
a b
c d
e Fig. 14. Five cases of liquid nitrogen application between two materials a) bath cooling, b) disk cooling, c) jet cooling, d) jet and bath cooling and e) disk and bath cooling [12]
Fig. 15. Coefficient of friction for Ti-6Al-4V against coated insert under various cryogenic approaches at 0.3 m/s [12]
An alternative to cryogenic machining to efficiently remove heat from the cutting zone is high pressure cooling. Nandy and Paul have compared cryogenic cooling, dry and flood cooling cutting to high pressure cooling with neat oil for turning Ti-6Al-4V with micro-crystalline uncoated straight carbide inserts [13]. For the same combinations of work material, cutting tool and process parameters, their presented high pressure cooling technique provided tool lives almost 5 times that of dry, 3.5 times that of conventional flood and even two times that of cryogenic cooling which was applied at rake and flank surfaces by liquid nitrogen jets.
a)
b)
6
c)
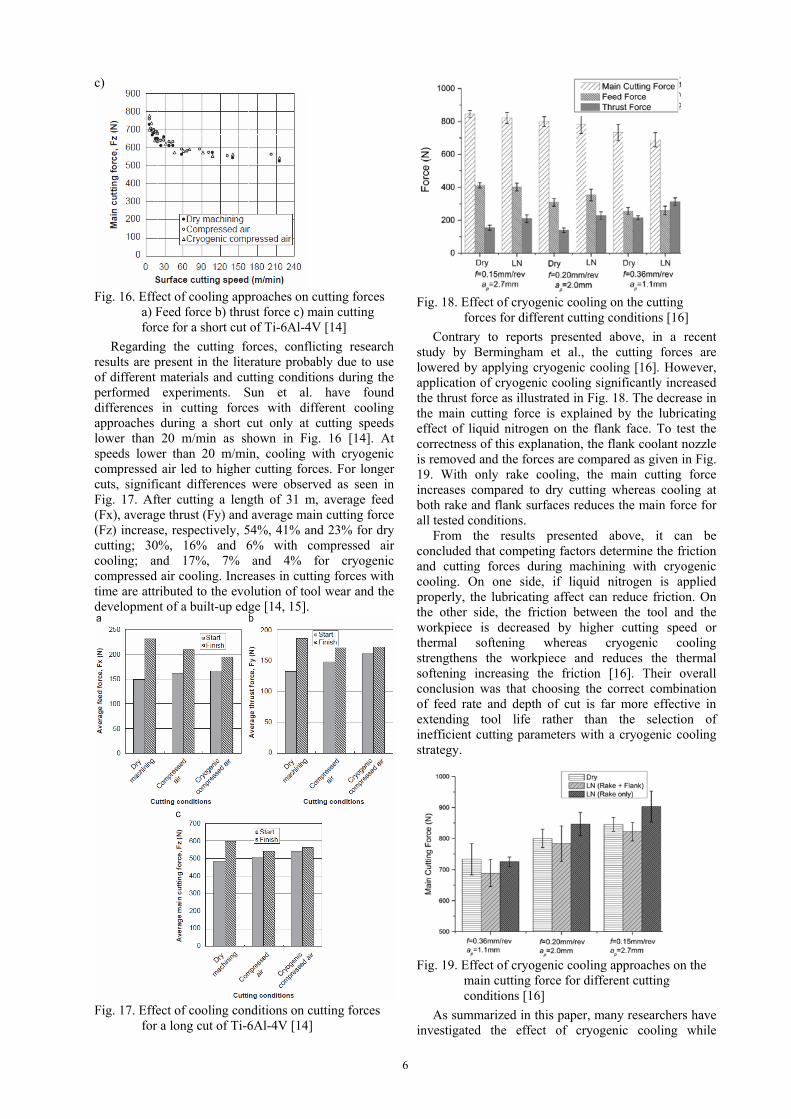
Fig. 16. Effect of cooling approaches on cutting forces a) Feed force b) thrust force c) main cutting force for a short cut of Ti-6Al-4V [14]
Regarding the cutting forces, conflicting research results are present in the literature probably due to use of different materials and cutting conditions during the performed experiments. Sun et al. have found differences in cutting forces with different cooling approaches during a short cut only at cutting speeds lower than 20 m/min as shown in Fig. 16 [14]. At speeds lower than 20 m/min, cooling with cryogenic compressed air led to higher cutting forces. For longer cuts, significant differences were observed as seen in Fig. 17. After cutting a length of 31 m, average feed (Fx), average thrust (Fy) and average main cutting force (Fz) increase, respectively, 54%, 41% and 23% for dry cutting; 30%, 16% and 6% with compressed air cooling; and 17%, 7% and 4% for cryogenic compressed air cooling. Increases in cutting forces with time are attributed to the evolution of tool wear and the development of a built-up edge [14, 15].
Fig. 17. Effect of cooling conditions on cutting forces for a long cut of Ti-6Al-4V [14]
Fig. 18. Effect of cryogenic cooling on the cutting forces for different cutting conditions [16]
Contrary to reports presented above, in a recent study by Bermingham et al., the cutting forces are lowered by applying cryogenic cooling [16]. However, application of cryogenic cooling significantly increased the thrust force as illustrated in Fig. 18. The decrease in the main cutting force is explained by the lubricating effect of liquid nitrogen on the flank face. To test the correctness of this explanation, the flank coolant nozzle is removed and the forces are compared as given in Fig. 19. With only rake cooling, the main cutting force increases compared to dry cutting whereas cooling at both rake and flank surfaces reduces the main force for all tested conditions.
From the results presented above, it can be concluded that competing factors determine the friction and cutting forces during machining with cryogenic cooling. On one side, if liquid nitrogen is applied properly, the lubricating affect can reduce friction. On the other side, the friction between the tool and the workpiece is decreased by higher cutting speed or thermal softening whereas cryogenic cooling strengthens the workpiece and reduces the thermal softening increasing the friction [16]. Their overall conclusion was that choosing the correct combination of feed rate and depth of cut is far more effective in extending tool life rather than the selection of inefficient cutting parameters with a cryogenic cooling strategy.
Fig. 19. Effect of cryogenic cooling approaches on the main cutting force for different cutting conditions [16]
As summarized in this paper, many researchers have investigated the effect of cryogenic cooling while

7
machining Ti-6Al-4V, mainly for turning. Additional equipment and high cost of liquid nitrogen are the main disadvantages of cryogenic cooling, while, compared to conventional cooling, better results are obtained with modified tool inserts to optimize the frictional and thermal properties, regarding the tool wear. This brings an additional limitation for the implementation of the technology in real industrial environment.
3. A CASE STUDY
In TUSAS Engine Industries, Inc. (TEI), cryogenic cooling strategy was tested for the application of turning of Ti-6Al-4V workpieces. The cooling was applied as flood cooling; no special or modified tooling was involved. The utilized cryogenic set-up, consisting of a liquid nitrogen tank, a control system for cryogenic cooling, a vacuum tube and a phase separator, is illustrated in Fig. 20. The liquid nitrogen from the tank travels along the vacuum tube connected to the phase separator and finally onto the insert as illustrated in Fig. 21. A Kistler multi-component force dynamometer was used during tests to capture generated cutting forces. The tool holder with the cutting insert is mounted on top of the dynamometer to be able to measure cutting forces during cryogenic (with liquid nitrogen), dry and wet cutting conditions. Increases in cutting forces are used to predict the tool wear and tool life. The workpiece geometry on which the cutting tests were performed is depicted in Fig. 22.
Fig. 20. Cryogenic cooling set-up on a VTN10 CNC vertical lathe in TEI [17]
Fig. 21. Application of cryogenic cooling on an insert while the cutting forces are measured by a Kistler dynamometer [17]
Fig. 22. Turning of Ti-6Al-4V with a coated carbide insert with cryogenic cooling [17]
The cutting tests were performed with different combinations of depth of cut and cutting speed as shown in Table 2. Two cutting speeds (90 and 135 m/min) and three depths of cut (0.50, 1 and 1.27 mm) in the range of generally used cutting conditions were tested. Test 1 Test 2 Test 3 Test 4
Cutting speed (m/min) 90 90 90 135
Feed rate (mm/rev) 0,15 0,15 0,15 0,15
Depth of cut (mm) 0,50 1,00 1,27 0,50 Table 2: Tested cutting parameters
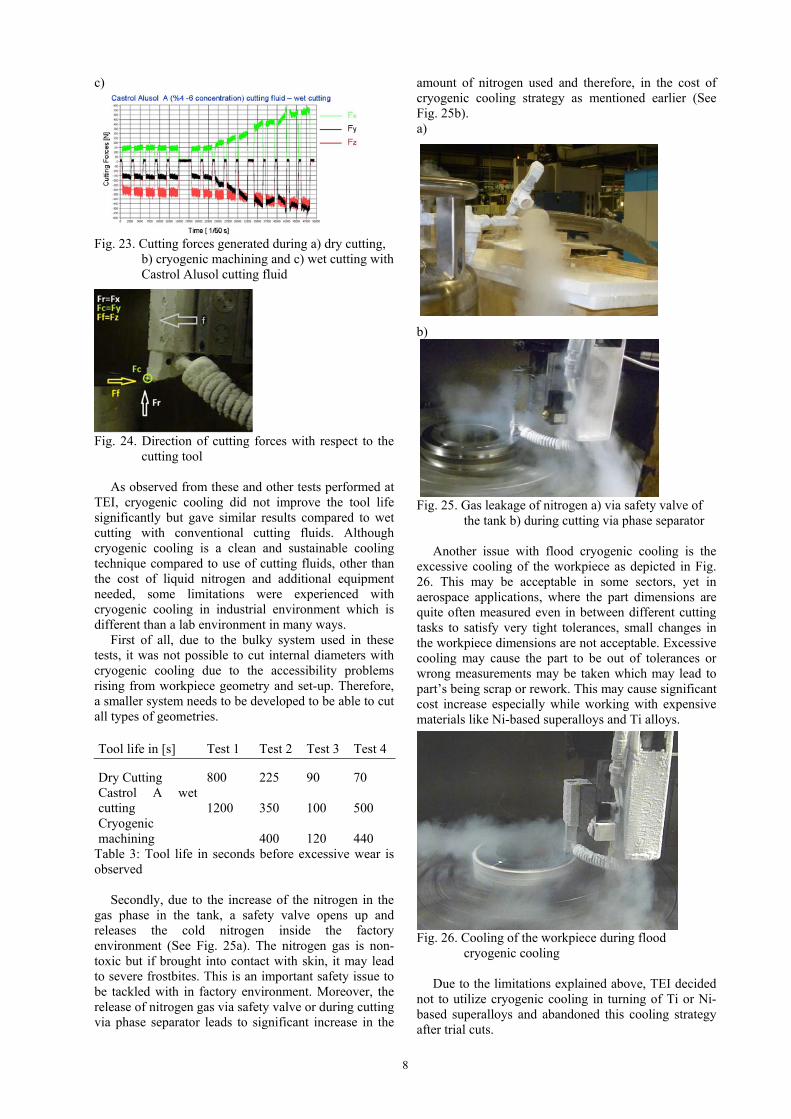
The cutting forces obtained with different cooling strategies are shown in Fig. 23 (See Fig. 24 for cutting force directions). Fig. 23a depicts the case for dry machining where a significant amount of wear was observed after 225 seconds. Cryogenic cooling increases the tool life to 400 seconds while wet cutting with Castrol Alusol A (4-6% concentration) cutting fluid exhibits a very close tool life of about 350 seconds. For all test cases, the trend is similar: dry cutting gives the highest rate of tool wear whereas cryogenic machining and wet cutting gives similar results as shown in Table 3. a)
b)
8
c)
Fig. 23. Cutting forces generated during a) dry cutting, b) cryogenic machining and c) wet cutting with Castrol Alusol cutting fluid
Fig. 24. Direction of cutting forces with respect to the cutting tool
As observed from these and other tests performed at TEI, cryogenic cooling did not improve the tool life significantly but gave similar results compared to wet cutting with conventional cutting fluids. Although cryogenic cooling is a clean and sustainable cooling technique compared to use of cutting fluids, other than the cost of liquid nitrogen and additional equipment needed, some limitations were experienced with cryogenic cooling in industrial environment which is different than a lab environment in many ways.
First of all, due to the bulky system used in these tests, it was not possible to cut internal diameters with cryogenic cooling due to the accessibility problems rising from workpiece geometry and set-up. Therefore, a smaller system needs to be developed to be able to cut all types of geometries. Tool life in [s] Test 1 Test 2 Test 3 Test 4
Dry Cutting 800 225 90 70 Castrol A wet cutting 1200 350 100 500 Cryogenic machining 400 120 440
Table 3: Tool life in seconds before excessive wear is observed
Secondly, due to the increase of the nitrogen in the gas phase in the tank, a safety valve opens up and releases the cold nitrogen inside the factory environment (See Fig. 25a). The nitrogen gas is non-toxic but if brought into contact with skin, it may lead to severe frostbites. This is an important safety issue to be tackled with in factory environment. Moreover, the release of nitrogen gas via safety valve or during cutting via phase separator leads to significant increase in the
amount of nitrogen used and therefore, in the cost of cryogenic cooling strategy as mentioned earlier (See Fig. 25b). a)
b)
Fig. 25. Gas leakage of nitrogen a) via safety valve of the tank b) during cutting via phase separator
Another issue with flood cryogenic cooling is the excessive cooling of the workpiece as depicted in Fig. 26. This may be acceptable in some sectors, yet in aerospace applications, where the part dimensions are quite often measured even in between different cutting tasks to satisfy very tight tolerances, small changes in the workpiece dimensions are not acceptable. Excessive cooling may cause the part to be out of tolerances or wrong measurements may be taken which may lead to part’s being scrap or rework. This may cause significant cost increase especially while working with expensive materials like Ni-based superalloys and Ti alloys.
Fig. 26. Cooling of the workpiece during flood cryogenic cooling
Due to the limitations explained above, TEI decided not to utilize cryogenic cooling in turning of Ti or Ni-based superalloys and abandoned this cooling strategy after trial cuts.

9
4. CONCLUSIONS Cryogenic cooling, an environmentally safe
alternative to conventional emulsion cooling, is an efficient way of maintaining the temperature at the cutting interface well below the softening temperature of the cutting tool material. Theoretically, this would increase the machinability of difficult-to-cut aerospace materials like Ti and Ni-based superalloys. Additional equipment and high cost of liquid nitrogen are the main disadvantages of cryogenic cooling. However, as many researchers point out, compared to conventional cooling, with cryogenic cooling better tool lives are obtained with modified tool inserts that optimize the frictional and thermal properties. Some aspects of the technology, yet, limit its use in real industrial applications other than lab machines, such as safety issues regarding handling liquid and gas nitrogen, workpiece cooling leading to unsatisfied tolerances for in-cutting measurements and size of the cryogenic set-up to be able to access internal diameters. As mentioned earlier, it may be a preferred technology in the sectors where these limitations are invalid or less significant. 5. REFERENCES 1. P.J. Arrazola, A. Garay, L.-M. Iriarte, M.
Armendia, S. Marya, F. Le Maitre, Machinability of titanium alloys (Ti6Al4V and Ti555.3”, Journal of Materials Processing Technology, 209, pp.2223-2230, 2009.
2. E.O. Ezugwu, J.Bonney, Y.Yamane, An overview of the machinability of aeroengine alloys, Journal of Materials Processing Technology, 134, pp. 233-253, 2003.
3. A. Ahmad-Yazid, Z. Taha, I.P. Almanar, A review of cryogenic cooling in high speed machining (HSM) of mold and die steels, Scientific Research and Essays, 5/5, pp. 412-427, 2010.
4. J. Kopac, Achievements of sustainable manufacturing by machining, Journal of Achievements in Materials and Manufacturing Engineering, 34/2, pp.180-187, 2009.
5. Y. Yildiz, M. Nalbant, A review of cryogenic cooling in machining processes, International Journal of Machine Tools and Manufacture, 48, pp.947-964, 2008.
6. S.Y. Hong, Y. Ding, Cooling approaches and cutting temperatures in cryogenic machining of Ti-6Al-4V, International Journal of Machine Tools and Manufacture, 41, pp. 1417-1437, 2001.
7. S.Y. Hong, Y. Ding, W-C. Jeong, Friction and cutting forces in cryogenic machining of Ti-6Al-4V, International Journal of Machine Tools and Manufacture, 41, pp. 2271-2285, 2001.
8. M. Dhananchezian, M.P. Kumar, Cryogenic turning of the Ti-6Al-4V alloy with modified cutting tool inserts, Cryogenics, 51, pp. 34-40, 2011.
9. S.Y. Hong, I. Markus, W-C. Jeong, New cooling approach and tool life improvement in cryogenic machining of titanium alloy Ti-6Al-4V, International Journal of Machine Tools and Manufacture, 41, pp.2245-2260, 2001.
10. S.M. Yuan, L.T. Yan, W.D. Liu, Q. Liu, Effects of cooling air temperature on cryogenic machining of Ti-6Al-4V alloy, Journal of Materials Processing Technology, 211/3, pp.353-362, 2010.
11. K.A. Venugopal, S. Paul, A.B. Chattopadhyay, Tool wear in cryogenic turning of Ti-6Al-4V alloy, Cryogenics, 47, p.12-18, 2007.
12. S.Y. Hong, Lubrication mechanisms of LN2 in ecological cryogenic machining, Machining Science and Technology, 10, pp.133-155, 2006.
13. A.K. Nandy, S. Paul, Effect of coolant pressure, nozzle diameter, impingement angle and spot distance in high pressure cooling with neat oil in turning of Ti-6Al-4V, Machining Science and Technology, 12/4, pp.445-473, 2008.
14. S.Sun, M. Brandt, M.S. Dargusch, Machining Ti-6Al-4V alloy with cryogenic compressed air cooling, International Journal of Machine Tools and Manuactıre, 50, pp. 933-942, 2010.
15. Y.Su, N. He, L. Li, X. L. Li, An experimental investigation of effects of cooling/lubrication conditions on tool wear in high-speed end milling of Ti-6Al-4V, Wear, 261, pp.760-766, 2006.
16. M.J.Bermingham, J.Kirsch, S.Sun, S.Palanisamy, M.S. Dargusch, New observations on tool life, cutting forces and chip morphology in cryogenic machining of Ti-6Al-4V, International Journal of Machine Tools and Manufacture, 51, pp. 500-511, 2011.
17. Z.Y. Wang, K.P. Rajurkar, Cryogenic machining of hard-to-cut materials, Wear, 239, pp.168-175, 2000.
6. ACKNOWLEDGEMENT The authors would like to thank TUBITAK, The Scientific and Technological Research Council of Turkey, for their contribution to this study with funding of the project “TEYDEB 9100011: Sürdürülebilir ve Yenilikçi Kreyojenik İşleme Teknolojilerinin Geliştirilmesi”.
Authors: Prof.dr.Everen Yasa, Division PMA, Dept. Mech. Eng., K.U.Leuven Celestijnenlaan 300B, 3001 Heverlee, Belgium. Prof.dr. Pilatin Semih, Prof.dr. Oguz Colak, Suleyman Demirel University, Faculty of Technology, Department of Manufacturing Engineerings. Phone:+90.246.211 1674 Fax:+90.246.211 1673 E-mail: [email protected] [email protected] [email protected]
10
Original Scientific Paper
Cerce, L., Pusavec, F., Kopac, J.
SPATIAL CUTTING TOOL WEAR EVALUATION Received: 01 April 2012 / Accepted: 17 July 2012
Abstract: The tool wear evaluation has a very strong impact on the product quality as well as efficiency of the manufacturing process. This paper presents an innovative and reliable direct measuring procedure for measuring spatial cutting tool wear. The technique is specially characterized by its determination of profile deepness, so it has advantage comparing with currently used techniques. Key words: Spatial cutting tool wear, Wear diagnostic, Optical triangulation Evaluacija volumskog habanja alata. Evaluacija habanja alata ima veoma jak uticaj na kvalitet proizvoda, kao i na efikasnost proizvodnog procesa. Ovaj rad predstavlja inovativan i pouzdan direktan merni postupak za merenje volumskog habanja alata. Tehnika se posebno odlikuje po određivanju dubine profila, tako da ima prednost u odnosu na trenutno korištene tehnike. Ključne reči: Volumsko habanje alata, Dijagnosticiranje habanja, Optička triangulacija 1. INTRODUCTION Machining performance of material is very important in terms of material processing and quality of final product. Based on the machining performance optimal machining parameters are determinate. The term machining performance refers to the ease with which a metal can be machined to an acceptable surface finish, and is hardly measured/evaluated. It is defined by the following criteria: cutting tool wear, cutting tool life, cutting forces, power consumption, chip formation, machined surface integrity and geometrical accuracy of the machined surface. Criteria, such as cutting force, roughness, energy consumption, integrity and geometrical accuracy of the machined surface can be objectively determined by exact measurements, while cutting tool wear is in practice measured manually and on a subjective level. Most frequently, cutting tool wear is measured with the use of toolmakers microscopes to help determine the range of wear (flank face). In addition to poor precision of this method, the problem is in three-dimensional nature of wear, which cannot be fully analyzed with 2D based measurements/measurement principles. It can be concluded that research on defining and analyzing tool wear in three dimensions is still of great significance. Therefore, the developing of new wear evaluation methods on the field of computer vision and laser systems, are under the scope. More in detail the spatial tool wear measurement system is presented and upgraded with the case study experiments and result analyzes. 2. TOOL WEAR The damages of a cutting tool are influenced by the stress state and thermal load on the tool surfaces, which
in turn depend on the cutting mode, i.e. turning, milling or drilling, cutting parameters and the cooling/lubrication conditions. In machining, the cutting tool wear mechanisms and the rate of it are very sensitive to changes in the cutting operation and the cutting conditions. To minimize machining cost, it is not necessary only to find the most suitable cutting tool and work material combination, for a given machining operation, but also to reliably predict the tool life. Tool wear mainly occurs at rake and flank face. Flank wear is caused by friction between the flank face of the cutting tool and the machined workpiece surface and leads to loss of the cutting edge. Therefore, flank wear affects the dimensional accuracy and surface finish quality of the product. In practice, flank wear is generally used as the cutting tool wear criterion. When critical value of tool wear criterion has been reached, cutting tool fails due to excessive stresses and thermal alterations. To avoid this, the cutting tool must be replaced before reaching its critical limit. The preferred cutting tool life criteria is the tool flank wear upper limit, because the wear progresses gradually and can be easily monitored for tool-changing protocol in NC (numeric control) programs [1]. In practice, some directly measured dimensional characteristics and criteria of typical wear patterns, i.e. crater, flank wear, and depth-of-cut notch wear at the extremities, for HSS (high speed steels), carbide and ceramics tools, are standardized in ISO 3685, as shown in figure 1. The process of cutting tool wear consists of three characteristic parts: the initial (running-in) period (I), the longest uniform (progressive) wear period (II) and accelerated wear period (III) leading often to catastrophic failure (figure 2).

11
Fig.1. Typical wear pattern according to ISO 3685 [1].
The machining process needs to be stopped at the right time to prevent undesired consequences of the tool wear such as: increase of cutting forces, vibrations, noise, temperature in the cutting zone and deviation of part dimensions and surface quality from the view of respective tolerance values.
Fig. 2. Typical tool wear curve [1]. In reality several wear mechanisms occur simultaneously, whereby one of them may dominate the process. They can be qualitatively identified as mechanical, thermal and adhesive. Mechanical types of wear, which include abrasion, chipping, early gross fracture and mechanical fatigue, are basically independent of temperature. Thermal loads appear with plastic deformation, thermal diffusion and oxygen corrosion as their typical forms, increase drastically at high temperatures and can accelerate the tool failure by easier tool material removal (by abrasion or attrition) [1]. Figure 3 presents the dependence of the individual wear mechanisms and relative amounts of wear on the cutting temperature. Adhesive and abrasive wear are the most significant types of wear at lower cutting speeds. At high cutting speed, temperature-activated wear mechanisms including diffusion (solution wear), chemical wear (oxidation and corrosion wear), and thermal wear
(superficial plastic deformation due to thermal softening effect) occur.
Fig. 3. Wear mechanism as a function of temperature in
the cutting zone [1]. Tool wear can be measured using direct measuring techniques or estimated by indirect measuring techniques. In indirect measuring techniques, tool wear is estimated using other easily measurable cutting process variables such as cutting force, acoustic emission, accelerations, energy consumption, etc. A survey of the literature indicates that many different approaches have been applied for tool wear prediction [2-6], countrary direct measuring techniques make an assesment of tool wear by either evaluating the worn surface by optical methods (microscop), or measuring the tool material loss by radiometric techniques. Direct methods require to periodically interrupted the cutting process. Optical methods use optical equipment like the toolmaker's microscope, optical miscroscope, scanning electrical microscope, charged coupled devices (CCD cameras), white light interferometry etc [7-11]. Kurada et al. [7] have designed a system consisting of a fiber-optic light source to illuminate the tool and a CCD camera, which is used in combination with a high resolution of video zoom microscope. Identification of the tool wear area is based on the reflection from the

12
wear area of the light introduced via fiber optics, whereas the measuments are derived from this area. The main disadvantages of mentioned methods are the inability of measuring crater depth KT (spatia geometry) and needs to preform them off line of the machining process. To perform the measurement with this methods the cutting insert should be removed from the machine tool. This cause time-loss and possible problems with the accuracy of subsequent processing. The proposed novel method, which is described hereafter, belongs to direct methods of cutting tool wear measurements. The added value and advantage of this method is the measurement of spatial tool wear directly on the machine tool. 3. MEASURING SYSTEM The measuring system consists of a high-accuracy 2D profile laser displacement sensor Keyence LJ-G015, controller Keyence LJ-G5001 and clamping device, as is seen on figure 4.
Clamping device
2D laser displacement
sensor
Measurand
Fig. 4. Measuring system With movement of profile sensor across the cutting tool and the support of developed software (Labview application), the data are grabbed and prepared in a matrix form for further evaluation/analyzes.
Controller KeyenceLJ-G5001
Keyence measurement screen
Labview application for data transfer
Fig. 5. Measuring interface and controller
Laser displacement sensor measure the distance to the points projected on the measured object (figure 6). In this way we measure Z-coordinate of point cloud. X-coordinate is defined by the specification of the laser displacement sensor [12], while Y-coordinate represents machine tool feed direction.
Measurand
Measuredprofile
Fig. 6. Axis orientation and measured process The measurement procedure is carried out in the following order: 1. Machine tool moves the cutting insert to the
measuring area. 2. Laser displacement sensor captures the first
profile. 3. The machine tool moves the cutting insert for
predefined ΔY. 4. By repeating steps 2 and 3 gradually the system
captured a large number of 2D profiles and stores it in internal memory of Keyence LJ-G5001 controller.
5. The system transfer data from the Keyence LJ-G5001 controller to PC.
The measurements on case study are presented and analyzed in next chapter. 4. EXPERIMENTAL PROCEDURE The presented measurement system was tested on longitudinal turning of Inconel 718. The initial workpiece diameter was 76 mm and length 237 mm. Experiment was performed on CNC lathe Mori Seiki SL-153 with the use of Sandvik CNMG 120408 SRM-1115 cutting insert. The experiment was performed with the use of flood cooling/lubrication fluids. The cutting parameters have been defined according to the producer recommendations and were ap = 1 mm, vc = 70 m/min and f = 0.15 mm/rev. These parameters were defined based on maximizing the material removal rate with an industry acceptable tool life of 10-15 min.
(a) (b)
Fig. 7. Experimental measurement of tool wear (a-conventional, b-new)

13
(a) (b) Fig. 8. Spatial measurements of new (a) and worn (b) cutting inserts
We machined the workpiece longitudinally at intervals over a length of 50 mm. After each operation, we measured the cutting insert wear in the following way (figure 7): a) Conventional measurement of flank wear using
toolmakers microscope. b) New measurement of spatial wear with previously
presented measurement system. 5. RESULTS AND DISCUSSION Measurements of tool wear were performed with toolmakers microscope. The results are presented on figure 9. On the ordinate axis is flank wear VB while on abscise axis is cutting length. Cutting length is defined as spiral length that was made with cutting edge. In the picture is represented the state of cutting inserts after each experiment. After 5th experiment (cutting length was 250 mm) flank wear VB was 0.43 mm which is the criterion to replace the cutting insert.
0
0,05
0,1
0,15
0,2
0,25
0,3
0,35
0,4
0,45
0,5
0 50 100 150 200 250 300
VB [m
m]
Dolžina l [mm]
l=0 mm, VB=0 mm l=150 mm, VB=0,14 mm
l=250 mm, VB=0,43 mm
l=50 mm, VB=0,06 mm
Cutting length l [mm]
Fig. 9. Tool wear curve In parallel, measurements of spatial wear were carried out with the use of developed measurement system. The measured values on a cutting length of 250 mm were compared and are showed in figure 8.
Spatial measurement of the worn cutting insert (figure 8b) was compared by measuring the new cutting inserts (figure 8a), which served as a reference. On the measurement of worn cutting inserts (figure 8b), it is clearly visible signs of wear on flank and rake face. BUE (build up edge) is also evident on rake face. Based on spatial measurements of new and worn cutting inserts spatial wear was calculated (figure 10). The deviations of measured points were calculated perpendicular to the surface of the reference model.
2D profile ofcutting edge
Fig. 10. Spatial wear of cutting insert (rake face with
crater ware and BUE) The picture (figure 10) is showing the wear on flank and rake face, BUE and chipping of cutting edge. Crater wear depth KT is evident and is in a range between 0.041 mm and 0.136 mm. Maximum height of BUE on rake face is 0.199 mm. Additionally figure 11a represent measurement of flank wear with spatial measurement system. From these measurements it is evident that after 250 mm length of cut VB is 0.410 mm. With the use of toolmakers microscope (figure 11b) VB was 0.43 mm. Variations in measurements may be attributed to the subjective nature of measuring with toolmakers microscope. This error may also occur due to the precision of determining the lower limit of the wear formation, since the microscope image does not reveal the depth of flank wear.

14
a b Fig.11.Comparison of flank wear measured with
spatial measurement system (a) and the toolmakers microscope (b)
Whit the use of spatial measurement system, the limit of the wear formation can be accurately determined. Depth of flank wear can be seen from the comparison of cutting inserts cross-sections, 0.5 mm from the secondary cutting edge (figure 12). This represents half of the cutting depth, where the cutting edge is in contact. From the figure becomes clear that the depth of flank wear is in the area from 0 to 0.1 mm. This means that the work pieces produced with such cutting tool would have 0.2 mm bigger diameters.
Fig. 12. 2D comparison of cutting edges cross section.
6. CONCLUSIONS In this work newly developed spatial tool wear evalvation is presented. The proposed spatial tool wear measurement system offers high resolution and accuracy 3D dimensional deviation measurement. It outperforms traditional 1D deviation methods both in accuracy, efficiency and reliability. Another huge benefit of the developed method is the fact that the measurement can be performed very qickly, without removing the cutting tool from the machine tool. Future work will be focused on developing computational procedures for the analysis of 3D deviation data provided. The objective is automatic diagnostics and early alert pointing to possible tool damage, excessive local tool wear, tool misalignment and other possible causes for tool breakage and stop of the process. 7. REFERENCES [1] Grzesik, W.: Advanced Machining Processes of
Metallic Materials, Elsevier B.V., 2008. [2] Kopač, J.: Odrezavanje; Teoretične osnove in
tehnološki napotki, Ljubljana, 2008.
[3] Ee, K.C., Balaji, A.K., Jawahir, I.S.: Progressive tool-wear mechanisms and their effects on chip-curl~chip-form in machining with grooved tools: an extended application of the equivalent toolface (ET) model, Wear, vol. 255, 2003, p. 1404-1413.
[4] Byrne, G., Dornfeld, D., Inasaki, I., Ketteler, G., Konig, W., Teti, R.: Tool Condition Monitoring (TCM) - The Status of Research and Industrial Application, CIRP Annals - Manufacturing Technology, vol. 44, Issue 2, 1995, p. 541-567.
[5] Govekar, E., Gradišek, J., Grabec, I.: Analysis of acoustic emission signals and monitoring of machining processes, Ultrasonics 38, vol. 1–8, 2000, p. 598–603.
[6] Dimla, E.: Sensor signals for tool-wear monitoring in metal cutting operations--a review of methods, International Journal of Machine Tools and Manufacture, vol. 40, Issue 8, 2000, p. 1073-1098.
[7] Kurada, S., Bradley, C.: A review of machine vision sensor for tool condition monitoring, Comput. Ind., vol 34, 1997, p. 52-72.
[8] Jurkovič, J., Korošec, M., Kopač, J.: New approach in tool wear measuring technique using CCD vision system, International journal of machine tools & manufacture, vol. 45, 2005, p. 1023-1030.
[9] Dawson, T. G., Kurfess, T. R.: Quantification of tool wear using white light interferometry and three-dimensional computational metrology, International Journal of Machine Tools and Manufacture, vol. 45, Issues 4-5, April 2005, p. 591-596.
[10] Wang, W.H., Wong, Y.S., Hong, G.S.: 3D measurement of crater wear by phase shifting method, Wear, vol. 261, Issue 2, 31 Julij 2006, p. 164-171.
[11] Weckenmann, A., Nalbantic, K.: Precision Measurement of Cutting Tools with two Matched Optical 3D-Sensors, CIRP Annals - Manufacturing Technology, vol. 52, Issue 1, 2003, p. 443-446.
[12] Keyence: High-accuracy 2D Laser Displacement Sensor, LJ-G Series, User`s manual, 2010
Authors: MS.c Luka Cerce, Assist. Prof. Dr. Franci Pusavec, Prof. Dr. Janez Kopac, University of Ljubljana, Faculty of Mechanical Engineering, Laboratory for Machining, Askerceva 6, 1000 Ljubljana, Slovenia, Phone.: +386 1 4771-712, Fax: +386 1 4771-768. E-mail: [email protected] [email protected] [email protected]

15
Original Scientific Paper
Gostimirović, M., Pucovsky, V., Kovač, P., Rodić, D., Savković, B.
MODELING OF DISCHARGE ENERGY IN ELECTRICAL DISCHARGE MACHINING BY THE USE OF GENETIC PROGRAMMING
Received: 09 October 2012 / Accepted: 15 November 2012
Abstract: Being able to model machining process can save enormous funds and time, which will result in cheaper and more efficient production. In this paper discharge energy, which is in EDM directly transformed into thermal energy, is used as a primary machining process and because of that it presents a main point of interest in modeling procedure. Link between discharge energy and output results of machining process is found using genetic programming as a type of artificial intelligence. Key words: EDM, discharge energy, machining parameters, genetic programming Modelovanje energije pražnjenja u elektroerozivnoj obradi pomoću genetskog programiranja. Mogućnost modelovanja procesa obrade može uštedeti velika sredstva i vreme a krajnji rezultat je jeftinija i efikasnija proizvodnja. U ovom radu je energija pražnjenja, koja se u elektroerozivnom procesu direktno pretvara u toplotnu energiju, korišćena kao primarni parametar obrade i zbog toga predstavlja žižu interesa u procesima modelovanja. Veza između energije pražnjenja i izlaznih parametara procesa obrade je formirana koristeći genetsko programiranje kao vrste veštačke inteligencije. Ključne reči: EDM, energija pražnjenja, parametri obrade, genetsko programiranje 1. INTRODUCTION Everybody who worked with EDM knows that the only requirement for machining to take place is that both the tool and the workpiece have to be electro conductive. By meeting this requirement, arcing between the tool and the workpiece can take place. This will result in ionization of small volume of dielectric around arcing zone, reaching a temperature up to 40.000 °C, consequentially heating workpiece surface to 10.000 °C. Small area on workpiece surface, under the influence of this high temperature, is melted and when electric arc is cut off a strong pressure wave is generated. Melted material is then washed off from workpiece surface and flushed away with dielectric fluid. Described process is repeated until desirable results are met. Machining ability of workpiece depends on its thermal properties and not its hardness like in conventional machining processes. Because of this EDM is preferable choice in processes like machining hard materials, mould making, precision machining or individual production. As can be noted from above mentioned, EDM is rarely used in mass production. Machining each part with different demands is very challenging and in order to keep minimum cost it requires a profound knowledge of process parameters and their influence on final result. This would mean that one should spend large amount of funds and time on becoming familiar with process of EDM to exploit it properly. In order to make EDM more accessible, various forms of simulations are created. Many of these simulations are based on artificial intelligence, which is gaining ever more popularity among scientific and technical circles. Following trends, this article presents modeling of EDM process and finding
relationships between process parameters and process outputs based on experimentally obtained results. Genetic programming, a type of artificial intelligence, is used as a tool for finding those relationships. Parameters used to describe quality of EDM process are: productivity, which is expressed through material removal rate, accuracy represented by dimension tolerances and type of shape of workpiece, and finally surface integrity expressed through machined surface roughness. In this article all three of these parameters will be modeled, and at the end an extensive conclusion about effectiveness of this method will be presented. 2. DISCHARGE ENERGY In EDM discharge energy is directly transformed into thermal energy and it becomes an instrument for machining. Discharge energy Ee is calculated as the mean value of electrical energy per one impulse which is transformed into heat, and can be expressed by the following equation:
eee
t
eee tIUdttituEe
0
)()(
(1)
where Ue is discharge voltage, Ie is discharge current and te is discharge duration.
In proper machining conditions, electrical discharge occurs instantaneously and is independent from other electric values. With this fact in mind ignition delay time can be neglected, td0, meaning that the discharge duration is equal to pulse duration, teti. By this simplification the final expression for discharge energy

16
has more practical form:
ieee tIUE
(2)
As can be seen from Eq. (2), the discharge energy is influenced by the discharge voltage, discharge current, and pulse duration. Their influences are interconnected and depend on the rest of the machining parameters [1]. The discharge voltage depends only on materials of workpiece and electrode. For every combination of workpiece and electrode there is a specific value of discharge voltage. This value can range from 15 to 30 V [2,3] and cannot be influenced under the given machining conditions. Parameter which directly impacts the discharge energy is discharge current. But this impact is limited
by the current density at the electrode. Stability of impulse discharge will be threatened in case when the current density oversteps the limit for the given machining conditions (approximately 1025 A/cm2) [4,5]. By exceeding this threshold, the continuous current flow will be established, and arcing or short circuiting will take place. This event will lengthen the time of deionization of the discharge channel, and consequentially reduce the efficiency of EDM. Direct control of discharge energy can be achieved by varying the pulse duration. However, arbitrarily regulation of process parameters is limited. Experience has taught us that pulse duration must be limited for a particular discharge current. Otherwise, an electric arcing occurs which damages both tool and workpiece [6].
Experiment number
Discharge current
Ie
(A)
Pulse duration
ti
(µs)
Current density
(A/cm2)
Discharge energy
Ee
(µJ)
Material removal
rate Vw
(mm3/min)
Gap distance
a (mm)
Surface roughness
Ra
(µm)
1 1 1 0.5 20 0.86 0.055 1.8
2 1 2 0.5 40 1.28 0.055 1.9
3 1 5 0.5 100 2.35 0.06 2.1
4 1 7 0.5 140 1.97 0.06 2.3
5 5 1 2.5 100 3.22 0.09 3.9
6 5 2 2.5 200 4.16 0.095 4.2
7 5 5 2.5 500 6.47 0.10 5.1
8 5 7 2.5 700 4.31 0.105 5.1
9 9 2 4.5 360 7.71 0.13 8.2
10 9 5 4.5 900 14.89 0.14 8.8
11 9 7 4.5 1260 9.49 0.155 9.0
12 9 10 4.5 1800 5.24 0.155 9.8
13 13 2 6.5 520 6.13 0.165 9.2
14 13 5 6.5 1300 18.71 0.18 9.4
15 13 7 6.5 1820 10.71 0.20 9.7
16 13 10 6.5 2600 6.62 0.21 10.3
17 20 5 10 2000 24.49 0.20 10.2
18 20 7 10 2800 31.82 0.22 10.4
19 20 10 10 4000 26.70 0.23 10.8
20 20 20 10 8000 17.11 0.24 11.2
21 30 7 15 4200 39.92 0.23 10.8
22 30 10 15 6000 53.30 0.24 11.3
23 30 20 15 12000 56.82 0.25 11.8
24 30 50 15 30000 40.48 0.26 12.5
25 50 10 25 10000 46.36 0.28 11.8
26 50 20 25 20000 66.83 0.30 12.5
27 50 50 25 50000 72.92 0.31 13.2
28 50 100 25 100000 60.60 0.33 13.4
Table 1. Experimental data used in modeling procedure
17
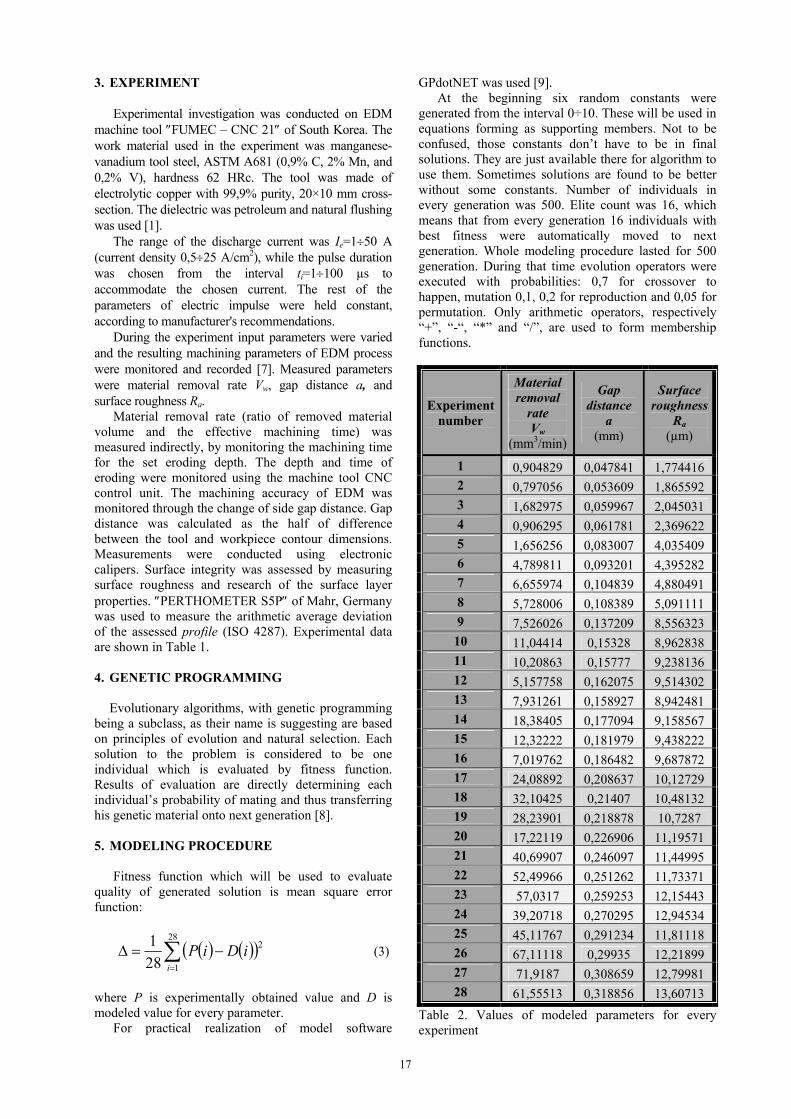
3. EXPERIMENT Experimental investigation was conducted on EDM machine tool FUMEC – CNC 21 of South Korea. The work material used in the experiment was manganese-vanadium tool steel, ASTM A681 (0,9% C, 2% Mn, and 0,2% V), hardness 62 HRc. The tool was made of electrolytic copper with 99,9% purity, 20×10 mm cross-section. The dielectric was petroleum and natural flushing was used [1]. The range of the discharge current was Ie=150 A (current density 0,525 A/cm2), while the pulse duration was chosen from the interval ti=1100 µs to accommodate the chosen current. The rest of the parameters of electric impulse were held constant, according to manufacturer's recommendations. During the experiment input parameters were varied and the resulting machining parameters of EDM process were monitored and recorded [7]. Measured parameters were material removal rate Vw, gap distance a, and surface roughness Ra. Material removal rate (ratio of removed material volume and the effective machining time) was measured indirectly, by monitoring the machining time for the set eroding depth. The depth and time of eroding were monitored using the machine tool CNC control unit. The machining accuracy of EDM was monitored through the change of side gap distance. Gap distance was calculated as the half of difference between the tool and workpiece contour dimensions. Measurements were conducted using electronic calipers. Surface integrity was assessed by measuring surface roughness and research of the surface layer properties. PERTHOMETER S5P of Mahr, Germany was used to measure the arithmetic average deviation of the assessed profile (ISO 4287). Experimental data are shown in Table 1. 4. GENETIC PROGRAMMING Evolutionary algorithms, with genetic programming being a subclass, as their name is suggesting are based on principles of evolution and natural selection. Each solution to the problem is considered to be one individual which is evaluated by fitness function. Results of evaluation are directly determining each individual’s probability of mating and thus transferring his genetic material onto next generation [8]. 5. MODELING PROCEDURE Fitness function which will be used to evaluate quality of generated solution is mean square error function:
28
1
2
28
1
i
iDiP (3)
where P is experimentally obtained value and D is modeled value for every parameter. For practical realization of model software
GPdotNET was used [9]. At the beginning six random constants were generated from the interval 0÷10. These will be used in equations forming as supporting members. Not to be confused, those constants don’t have to be in final solutions. They are just available there for algorithm to use them. Sometimes solutions are found to be better without some constants. Number of individuals in every generation was 500. Elite count was 16, which means that from every generation 16 individuals with best fitness were automatically moved to next generation. Whole modeling procedure lasted for 500 generation. During that time evolution operators were executed with probabilities: 0,7 for crossover to happen, mutation 0,1, 0,2 for reproduction and 0,05 for permutation. Only arithmetic operators, respectively “+”, “-“, “*” and “/”, are used to form membership functions.
Experiment number
Material removal
rate Vw
(mm3/min)
Gap distance
a (mm)
Surface roughness
Ra
(µm)
1 0,904829 0,047841 1,774416 2 0,797056 0,053609 1,865592 3 1,682975 0,059967 2,045031 4 0,906295 0,061781 2,369622 5 1,656256 0,083007 4,035409 6 4,789811 0,093201 4,395282 7 6,655974 0,104839 4,880491 8 5,728006 0,108389 5,091111 9 7,526026 0,137209 8,556323
10 11,04414 0,15328 8,962838 11 10,20863 0,15777 9,238136 12 5,157758 0,162075 9,514302 13 7,931261 0,158927 8,942481 14 18,38405 0,177094 9,158567 15 12,32222 0,181979 9,438222 16 7,019762 0,186482 9,687872 17 24,08892 0,208637 10,12729 18 32,10425 0,21407 10,48132 19 28,23901 0,218878 10,7287 20 17,22119 0,226906 11,19571 21 40,69907 0,246097 11,44995 22 52,49966 0,251262 11,73371 23 57,0317 0,259253 12,15443 24 39,20718 0,270295 12,94534 25 45,11767 0,291234 11,81118 26 67,11118 0,29935 12,21899 27 71,9187 0,308659 12,79981 28 61,55513 0,318856 13,60713
Table 2. Values of modeled parameters for every experiment

18
6. RESULTS Dependence between experimental results and results obtained by genetic programming modeling for material removal rate, gap distance and surface roughness, are shown in Fig 1-3.
Vw (%)
a (%)
Ra
(%)
12,0 4,6 2,6
Table 3. Values of average percent deviation of results
Fig. 1. Dependence between material removal rate
(MRR) values
Fig. 2. Dependence between gap distance values
Fig. 3. Dependence between roughness surface values Specific values of parameters obtained with genetic programming model are shown in Table 2. And numerical values of average percent deviation (), for modeled results from experimentally obtained results, are shown in Table 3. 7. CONCLUSION According to Fig. 1-3 it is clearly visible that modeling ability of genetic programming is on very high level of precision. One of the most important
advantages of this type of modeling is that specific equations are obtained and models can be used independently. Because of the scarcity of space and slight complexity of generated membership functions, they are not shown within this paper. They are although available on request from corresponding author. For later research more experiments are suggested. It is speculated that this would enable to yield more accurate results without drastically prolonging computational time. Also more workpiece materials could be investigated to crosscheck model validity. 8. REFERENCES [1] Gostimirovic , M., Kovac, P., Sekulic, M., Skoric,
B.,: Influence of discharge energy on machining characteristics in EDM machining, Journal of Mechanical Science and Technology, 26 (1), pp. 173-179, 2012
[2] Liu, K., Reynaerts, D., Lauwers, B.: Influence of the pulse shape on the EDM performance of Si3N4–TiN ceramic composite, CIRP Ann-Manuf Techn, 58, pp. 217-220, 2009.
[3] Ferreira, J. C.: A study of die helical thread cavity surface finish made by Cu-W electrodes with planetary EDM, Int J Adv Manuf Techn, 34, pp. 1120-1132, 2007.
[4] Tsai, Y. Y., Lu, C. T.: Influence of current impulse on machining characteristics in EDM, J Mech Sci Technol, 21(10), pp. 1617-1621, 2007.
[5] Rebelo, J. C., Dias, A. M., Kremer, D., Lebrun, J. L.: Influence of EDM pulse energy on the surface integrity of martensitic steels, J Mater Process Technol, 84, pp. 90-96, 1998.
[6] M Gostimirovic, P Kovac, B Skoric, M Sekulic: Effect of electrical pulse parameters on the machining performance in EDM, Indian Journal of Engineering & Materials Sciences, Vol. 18(2011) 411-415
[7] Radovanović, M.: Some possibilities for determining cutting data when using laser cutting, Strojniski Vestnik/Journal of Mechanical Engineering, 52 (10), pp. 645-652, 2006.
[8] Kovac, P., Rodic, D., Pucovski, V., Mankova, I., Savkovic, B., Gostimirovic, M.: A review of artificial intelligence approaches applied in intelligent processes, Journal of Production Engineering, 15(1), pp. 1-6, 2012.
[9] GPdotNET, bhrnjica.net/gpdotnet. Authors: Prof. Dr. Marin Gostimirović, M.Sc. Vladimir Pucovsky, Prof. Dr. Pavel Kovač, M.Sc. Dragan Rodić, M.Sc. Borislav Savković, University of Novi Sad, Faculty of Technical Sciences, Institute for Production Engineering, Trg Dositeja Obradovića 6, 21000 Novi Sad, Serbia. E-mail: [email protected] [email protected] [email protected] [email protected] [email protected] Note: This paper presents a part of researching at the project N° 660-00-140/2012-09/04.
19
Original Scientific Paper
Kopac, J., Cus, F., Stoic, A., Zabkar, B.
SOME IDEAS ABOUT SUSTAINABLE MANUFACTURING CONCEPT
Received: 09 February 2012 / Accepted: 25 March 2012
Abstract: Crises are not necessary in productions and in selling market. Reasons are mostly in wrong state policy. Some solutions are brought by engineers with their deep knowledge in prediction technique. Paper presents some ideas how to save energy by prediction and ways of sustainable manufacturing. Key words: Sustainable manufacturing, reducing costs, MQL, HP jet cooling, cryogenic machining. Ideje koncepta održive proizvodnje. Krize nisu neophodne u produkcijama i prodaji na tržištu. Razlozi su uglavnom u pogrešnoj državnoj politici. Neka rešenja su donešena od strane inženjera uz njihovo duboko znanje iz tehnike intuitivnog predvidjanja. Članak predstavlja neke ideje kako da se uštedi energija predviđajući i puteve održive proizvodnje. Ključne reči: Održiva proizvodnja, smanjenje troškova, MQL, HP mlazno hlađenje, kriogene obrade. 1. INTRODUCTION The crises have been going up and down for the last hundred years after technical revolution. The reasons were mainly gap between production and policy of governments. To spend more as country can produce firstly means inflation, then restriction, the demonstrations of workers and citizen… If government prepares solution on base, how to save money on workers in public administration, they go to strike. More countries all over the world produce less than their citizens consume. Reason is a gap between production sector and group of people employed in public administration so called workers, which are not connected directly or indirectly with productions or service activity. Many of them have jobs and salaries without the beneficial work. Technical sector, engineers and manufacturers can help partly with solutions in manufacturing areas with their high education of modern production. To produce better, it is necessary to know more than 50 different concepts. From classical machining, CNC machine tools to the adaptive processes as MQL, LN cryo assisting, HP jet cooling, HSC, RP, etc. Big specter of information and knowledge allows engineers that they can find the appropriate procedure from the beginning of the process. Till now, engineers were forced in system of mass production with motto: faster/cheaper with minimal respect to nature/ecology.
Fig. 1: Fluctuations in production. [1]
To care only about ecology is not enough. It is something partly connected with nature, but not including workers and other population properly. Sustainable concept is something more, including people properly and their social needs. To define what means recession for people, we can show in my old and well known diagram. 2. INFLUENCE OF FLUCTATIONS ON
PRODUCTION Hatched areas [1] “so called negative work” are also quantity measurement for workers – they are stressed. What are people doing under stress we know! If we know this up and down phenomena, stress by people and short period of satisfaction, we don’t need to hurry too much. After few years we will be on the same quantity level of product with bigger satisfaction, we can say with sustainable approach. Work represents a big part of employee life time. Why is he working? In order he needs money to make a living for himself and his family. It is only new concept, new way for surviving. For thousands years people have lived in many different ways that they came to food. Today money is food, so he is looking as first on money. Main part of work and production should stay to him. But it isn`t so. The money is shared on too many different things just for case. Today workers are too much taxed. It is one of the reasons how and where money disappears. Next reason is owner of the factory. He can divide money/benefit properly or unfairly. There are many cases when money disappeared from factory account before salaries were given to workers. Okay, we know more or less all this story of dirty management. From this philosophy we continue to our area – production. Where and how can we save money with technology.
20
3. THEORETICAL BACKGROUNDS TO ELEMENT WHICH ACHIEVE ON SUSTAINABLE EFFECTS
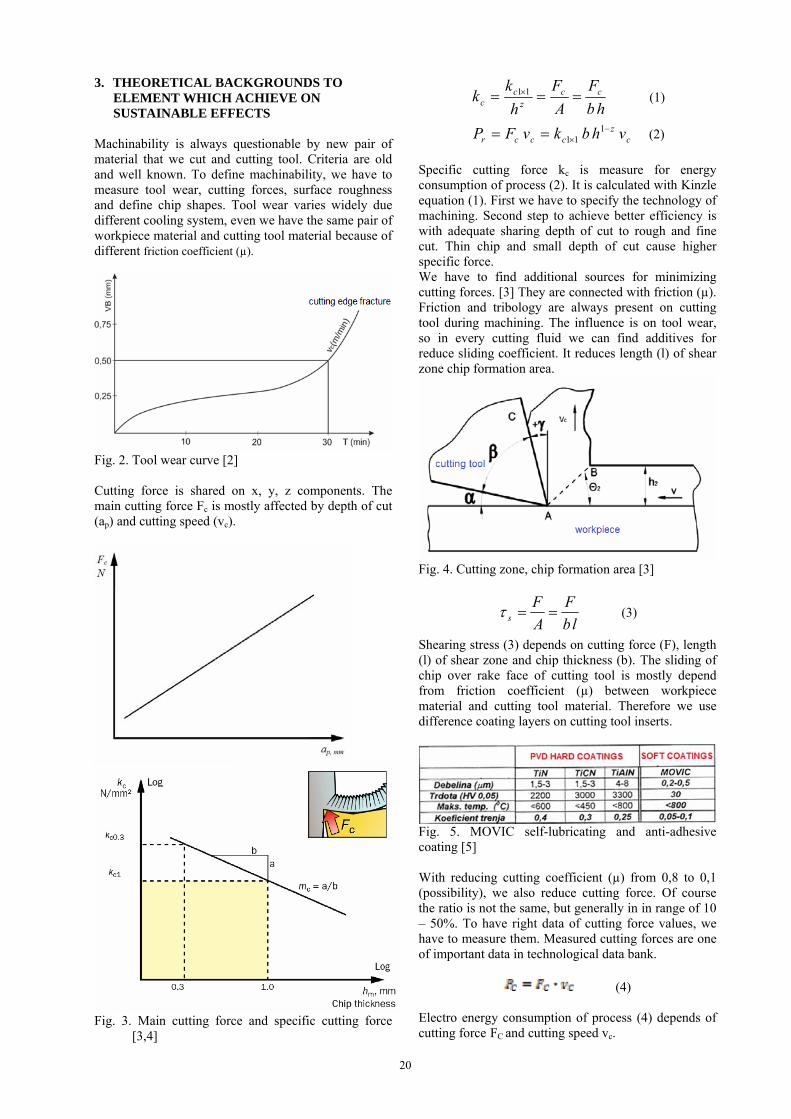
Machinability is always questionable by new pair of material that we cut and cutting tool. Criteria are old and well known. To define machinability, we have to measure tool wear, cutting forces, surface roughness and define chip shapes. Tool wear varies widely due different cooling system, even we have the same pair of workpiece material and cutting tool material because of different friction coefficient (µ).
Fig. 2. Tool wear curve [2] Cutting force is shared on x, y, z components. The main cutting force Fc is mostly affected by depth of cut (ap) and cutting speed (vc).
Fig. 3. Main cutting force and specific cutting force
[3,4]
hb
F
A
F
h
kk cc
zc
c 11 (1)
cz
cccr vhbkvFP 111
(2)
Specific cutting force kc is measure for energy consumption of process (2). It is calculated with Kinzle equation (1). First we have to specify the technology of machining. Second step to achieve better efficiency is with adequate sharing depth of cut to rough and fine cut. Thin chip and small depth of cut cause higher specific force. We have to find additional sources for minimizing cutting forces. [3] They are connected with friction (µ). Friction and tribology are always present on cutting tool during machining. The influence is on tool wear, so in every cutting fluid we can find additives for reduce sliding coefficient. It reduces length (l) of shear zone chip formation area.
Fig. 4. Cutting zone, chip formation area [3]
lb
F
A
Fs (3)
Shearing stress (3) depends on cutting force (F), length (l) of shear zone and chip thickness (b). The sliding of chip over rake face of cutting tool is mostly depend from friction coefficient (µ) between workpiece material and cutting tool material. Therefore we use difference coating layers on cutting tool inserts.
Fig. 5. MOVIC self-lubricating and anti-adhesive coating [5] With reducing cutting coefficient (µ) from 0,8 to 0,1 (possibility), we also reduce cutting force. Of course the ratio is not the same, but generally in in range of 10 – 50%. To have right data of cutting force values, we have to measure them. Measured cutting forces are one of important data in technological data bank.
(4)
Electro energy consumption of process (4) depends of cutting force FC and cutting speed vc.

21
As case, we can discuss relationship to minimizing power consumption for 30%. More than thousands machine tools which are operating day and night in money factories in many countries. We can reduce electricity production for more than 10%. This is something. We can close on this way some electro power plants that cause environmental pollution with their operating state. This represents important part of sustainable manufacturing. 4. ADAPTED MODERN CUTTING PROCESSES Engineering challenges of sustainable production are going forward. We have modern adaptive processes for machining as MQL, HP jet cooling, LN Cryogenic machining.
Fig. 6. MQL [6]
Minimum quantity lubricant can save money, improve tool life and improve the part finish. But it may involve changes to both the equipment and the processing strategy. The cost of coolant is approximately 15 percent of the life-cycle operational cost of a machining process. This cost continues to rise. It includes the costs associated with procurement, filtration, separation and disposal. Already the costs for disposal of coolant are higher than the initial cost of the coolant, and they are still rising. Even stricter regulations are under consideration for coolant usage, disposal and worker protection. As a result of all of this, coolant in wet machining operations is a crucial economic issue. An alternative, machining with “minimum quantity lubricant,” or MQL, is gaining acceptance as a cost-saving and environmentally friendly option in place of some wet machining processes. MQL (Fig. 6) permits dramatic cuts in coolant costs, while protecting workers and the environment. It also delivers improved tool life and surface finish, even though tool life is often the reason why wet machining is applied. MQL can deliver better life for two reasons: the optimum concentration of lubrication can be specified for a given operation, and silicon particle contamination suspended in the cutting fluid is eliminated [7]. Removing coolant from machining presents challenges related to heat, tool life and chip removal, but certain systems and strategies can address these challenges. Heat dissipation without coolant requires a different approach to processing the part. Special tooling using lubricant ducts (as well as high-performance coatings and heat-resistant materials) is also required. Chip evacuation systems must be used as well [7].
Fig. 7. HP jet cooling [8]
In high – pressure coolant condition (Fig. 7) the average cutting temperature reduced by 16% than dry condition. As the temperature at the chip-tool interface is one of the most important factor influencing the machining process, so high – pressure jet cooling is complimentary for machining process. High-pressure jet – assisted machining has become a powerful technique for increasing production efficiency. The main advantages of HP jet cooling cutting process are: • Increasing of cutting speed and federate up to 35 percent for pair of cutting material and workpiece. • Improved chip control. • Increased tool life. • Drastically reduced cutting edge temperature compared to conventional flooded cooling. • Better surface integrity. • Reduction of cutting forces.
Fig. 8. Cryogenic machining [9] It is known that oil-based cooling lubricating fluids (CLF) are one of the most unsustainable elements of machining processes. Most CLFs are formulated from mineral oils, which are extracted from crude oil, primarily for economic reasons. In cryogenic machining a cryogenic CLF (non-oil-based) is delivered to the cutting region of the cutting tool, shown in Fig. 7, which is exposed to the highest temperature during the machining process, or to the part in order to change the material characteristics and improve machining performance. The CLF is nitrogen fluid, which is liquefied by cooling to -196 °C (liquid nitrogen – LN). Nitrogen is a safe, non – combustible, and noncorrosive gas. The LN in cryogenic machining systems quickly evaporates and returns to the atmosphere, leaving no residue to contaminate the part,

22
chips, machine tool, or operator, thus eliminating disposal costs. Additionally, cryogenic machining could help to machine parts faster, with higher quality, increased machining performance, and a reduced overall cost [10-12]. Some potential benefits of cryogenic machining are: • Considerably reduced friction coefficient on the tool – chip interface. • LN applied locally to the cutting edge is superior to emulsion in lowering the cutting temperature. • Increased tool-life due to lower abrasion and chemical wear, increased material removal rate with no increase in tool-wear and with reduced cutting tool changeover cost, resulting in higher productivity. • Improved machined part surface quality with the absence of mechanical and chemical degradation of the machined surface. In the machining of high-temperature alloys, conventional oil-based CLFs are not always effective enough in terms of decreasing the high cutting temperature, increasing tool life, reducing machining costs and improving environmental/social sustainability. The problem is that conventional CLFs do not access the toolpart and tool-chip interfaces, which are under high contact pressure, as they vaporize at a high temperature generated close to the cutting tool edge. Taking this into account, it becomes clear that technologies employing conventional CLFs are ineffective and unsustainable when machining materials with high shear strength and low thermal conductivity. In this case, the avoidance of conventional CLFs, would yield an enormous gain from the sustainability point of view. 5. CONCLUSION Study to be engineer and working on average level is not enough. Engineer has to be innovative, full of ideas and always looking for new, better and more ecological manufacturing concept. It must be visible also by cost of production. With adapted modern cutting processes we can achieve higher productivity with lower environmental pollution. Choice of adaptive process depends on the machining application. In general all of mentioned processes have many advantages in view of sustainable machining, and this is a key to increasing productivity.
Fig. 9. Costs in production Difference of costs and better benefit should be shared also to workers in production. This is a guaranty for more intensive work. All advanced ideas should be
taken in to consideration and tested, because we will never know everything, and in many cases some solutions reveals beneficial results. 6. REFERENCES [1] F. Pušavec, J. Kopač (2011). Sustainable
production - a goal or just words? MIT SLIM conference.
[2] J. Kopac, M. Sokovic, S. Dolinsek (2001). Tribology of coated tools in conventional and HSC machining. Journal of Materials Processing Technology, vol 118, Issues 1–3, 3 p. 377–384.
[3] Kopač J. (2008). Odrezavanje: teoretične osnove in tehnološki napotki. Ljubljana, Littera picta.
[4] Online catalogue, http://www.sandvik.coromant.com, accessed on 2012.
[5] Coatings for tools, http://www.sts-group.it/eng/movic.html, accessed on 2012.
[6] F. Čuš, M. Soković, J. Kopač, J., Balič (1998). Model of complex optimization of cutting conditions. Journal of Materials Processing Technology, vol. 64, Issues 1–3, p. 41–52.
[7] Understanding MQL. http://www.mmsonline.com/articles/understanding-mql, accessed on 2012.
[8] D. Kramar, P. Krajnik, J. Kopac (2009). Capability of high pressure cooling in the turning of surface hardened piston rods. Journal of Materials Processing Technology, vol 210, Issue 2, p. 212–218.
[9] F. Pušavec, J. Kopač (2011). SusCryMac kot čista tehnologija obdelave - inovacija, ki prepolovi stroške. IRT 3000 : inovacije, razvoj, tehnologije - tri smernice, en cilj, p. 24-27.
[10] F. Pusavec, D. Kramar, P. Krajnik, J. Kopac (2010). Transitioning to sustainable production – part II: evaluation of sustainable machining technologies. Journal of Cleaner Production, vol. 18, Issue 12, p. 1211–1221.
[11] A. Stoić, J. Kopač, G. Cukor (2005). Testing of machinability of mould steel 40CrMnMo7 using genetic algorithm. Journal of Materials Processing Technology, vol. 164–165, p. 1624–1630.
[12] F. Pušavec, E. Govekar, J. Kopač, I.S. Jawahih (2011). The influence of cryogenic cooling on process stability in turning operations. CIRP Annals - Manufacturing Technology, vol. 60, Issue 1, p. 101–104.
Authors: J. Kopac, B. Zabkar Faculty of Mechanical Engineering, University of Ljubljana, Askrceva 6, 1000 Ljubljana, Slovenia F. Cus University of Maribor, Faculty of Mechanical Engineering, Smetanova 17, 2000 Maribor, Slovenia A. Stoic
Machine Tools and Technologies Department, ME Faculty, University of Osijek,Trg I. B. Mazuranic 18, HR-35000 Slavonski Brod, Croatia

23
Original Scientific Paper
Kramar, D., Sekulić, M., Kovač, P., Gostimirović, M., Kopač, J. THE IMPLEMENTATION OF TAGUCHI METHOD FOR QUALITY IMPROVEMENT
IN HIGH-PRESSURE JET ASSISTED TURNING PROCESS Received: 04 May 2012 / Accepted: 21 July 2012
Abstract: In this paper, the cutting of Inconel 718 using high-pressure jet assisted turning proces has been reported. The Taguchi method, with orthogonal arrays and signal-to-noise ratio, has been used to analyse impact of various process parameters on surface roughness and to find optimal levels of the process parameters. An attempt was made to minimase the number of experimental runs and increase the reliability of experimental results. The study shows that the Taguchi method is suitable to solve the stated problem with minimum number of trials. Key words: Taguchi method, High-pressure jet assisted turning Primena Taguchi metode za unapredjenje kvaliteta pri obradi struganjem potpomognim mlazom visokog pritiska. U ovom radu kao materijal za rezanje korišćem je Inconel 718, koji je obrđen pri procesu struganja potpomognutim mlazom visokog pritiska. Taguchi metod, sa ortogonalnim nizovima i odnos signal-šum, korišćen je za analizu uticaja različitih parametara procesa na površinsku hrapavost, kao i da se pronađe optimalan nivo procesnih parametara.Učinjen je pokušaj da se minimalizuje broj eksperimentalnih tačaka i poveća pouzdanost eksperimentalnih rezultata Istraživanje je pokazalo da je Taguchi metod pogodan za rešavanje navedenih problem sa minimalnim brojem ispitivanja.. Ključne reči: Taguchi metod, struganje potpomognuto mlazom visokog pritiska 1. INTRODUCTION Determination of optimal machining parameters is continuous engineering task which goals are to reduce the production costs and to achieve the desired product quality. With the more precise demands of modern engineering products, the control of surface texture with dimensional accuracy has become more important. Surface roughness is the characteristic of surface which describes the surface quality, with regard to machining. This is a widely used index of product quality and in most cases a technical requirement for mechanical products. Achieving the desired surface quality is of great importance for the functional behaviour of a part. Following modern production requests and technologic-economic analysis of processing operations, during the designing process, it is necessary to determine optimal cutting parameters in order to achieve minimal expenses or minimal production time [1, 2]. High pressure jet assisted turning (HPJA) presents an innovative method of lubricating and/or cooling the cutting zone during machining. This machining process is able to cutting of nickel-based alloys. Nickel-based alloys are well known to yield a very poor machining performance. The subject of this study is to analyse dependence of surface roughness on the following five HPJA parameters: the diameter of the nozzle Dn, the pressure of the jet P, the cutting speed Vc, the feed rate and distance between the impact point of the jet and the cutting edge d. The Taguchi method of experimental design is one of the widely accepted techniques for off line quality assurance of products and processes. This method is a
traditional approach for robust experimental design that seeks to obtain a best combination set of factors/levels with lowest cost societal solution to achieve customer requirements. In this research work the roughness parameter Ra is measured experimentally during high pressure jet assisted turning of Inconel 718. Taguchi method and ANOVA analysis are used to analyze the effect of cutting parameters on surface roughness. 2. TAGUCHI METHOD AND EXPERIMENTAL
DETAILS 2.1 Taguchi method Robust Design method, also called the Taguchi method, pioneered by Dr. Genichi Taguchi, greatly improves engineering productivity. Taguchi parameter design is based on the concept of fractional factorial design. The main objective of parameter design is to minimize the process or product variation and to design robust and flexible processes or products that are adaptable to environmental conditions [3, 4]. Taguchi’s approach to design of experiments is easy to adopt and apply for users with limited knowledge of statistics; hence it has gained a wide popularity in the engineering and scientific community. Many companies around the world have saved hundreds of milions of dollars by using the method in diverse industries: automobiles, xerography, telecommunications, electronics, software, etc. Taguchi method uses orthogonal array to execute experiments and for analyzing. Signal to noise ratio and orthogonal array are two major tools used in robust design. The S/N ratio characteristics can be divided into three categories when the characteristic is

24
continuous: nominal is the best, smaller the better and larger is better characteristics. For the minimal roughness, the solution is „smaller is better“, and S/N ratio is determined according to the following equation:
n
iiy
nNS
1
21log10 (1)
Where n is the number of replication and yi is the measured value of output variable. The minimal Ra is achieved using the cutting parameters where S/N ratio is maximal. The influence of each control factor can be more clearly presented with response graphs [5]. Optimal cutting conditions of control factors can be very easily determined from S/N response graphs, too. Parameters design is the key step in Taguchi method to achieve reliable results without increasing the experimental costs. The experimental layout for the machining parameters using L27(3
13) orthogonal array was used in this study. The experimental results were analyzed with Analysis of Variance (ANOVA), which is used for identifying the factors significantly affecting the performance measures. 2.2 Experimental details High pressure jet assisted turning (HPJA) is a process where cooling lubrication fluid (CLF) is delivered into the cutting zone region under extremely high pressure of up to P=300 MPa and at a lower volume flow rate than in the conventional case, providing improved lubrication, cooling and chip breaking effects, Fig. 1. This is innovative method of lubricating and/or cooling the cutting zone during machining.
Fig. 1. HPJA CLF delivery jet direction sketch [6] Some potential benefits of this machining are [6] : more sustainable machining through lower flow rates of CLF in comparison to conventional machining, decreasing the cutting tool-chip contact length, resulting in lower cutting forces and longer tool life, drastic improvement in chip breakability etc. The experimental work was carried out at the Laboratory for Machining, the Faculty of Mechanical Engineering in Ljubljana. The experiments were conducted in longitudinal turning process on conventional lathe, fitted with a Hammelmann high-pressure plunger pump of 150 MPa pressure and 8 l/min capacity. The fluid used was the Vasco 5000 cooling lubricant from Blaser Swisslube Inc., a 5,5% emulsion without chlorine on the basis of vegetable oil
mixed with water (pH 8,5-9,2). Machining performance was investigated according to the following HPJA parameters: the diameter of the nozzle Dn (0.25, 0.3 and 0.4 mm), the pressure of the jet P (50, 90 and 130 MPa), the cutting speed Vc (46, 57 and 74 m/min), the feed rate f (0.2, 0.224 and 0.25 mm/rev) and the distance between the impact point of the jet and the cutting edge d (0, 1.5 and 3 mm). All experiments were carried out using the nickel-based alloy Inconel 718 supplied as bars (145 mm diameter x 300 mm long) with hardness between 36 and 38 HRC by orthogonal arrays with three levels (coded by: 1, 2 and 3), Table 1. A PVD TiAlN-coated carbide tool (grade P25) SNMG 12 04 08-23 has been chosen. Surface roughness was measured with a stylus-type instrument Mitutoyo-Surftest SJ-301, Fig. 2. The surface roughness response is the average reading of three consecutive measurements.
Levels Symbol Parameters
1 2 3
A Diameter of the nozzle, Dn (mm)
0,25 0,3 0,4
B
Dist. between the impact point of the jet and the cutting edge, d (mm)
0 1,5 3,0
C Pressure of the jet, P (MPa)
50 90 130
D Cutting speed, Vc (m/min)
46 57 74
E Feed, f (mm/rev) 0,2 0,224 0,25 Table 1. Machining parameters and their levels Fig. 2. Measurement of 2D roughness parameters [7] 3. RESULTS AND DISCUSSIONS Experimental results, together with their transformations into signal-to-noise ratios are given in Table 2. In this study all the analysis based on Taguchi method is done by Minitab14 and Qualitek-4 software to determine the main effects of the cutting parameters, to perform the analysis of variance (ANOVA) and establish the optimum conditions. From Table 3. it can be determined which control factors have strong influence on roughness parameter Ra in high-pressure jet assistance turning (HPJA). Optimal cutting conditions of these control factors can
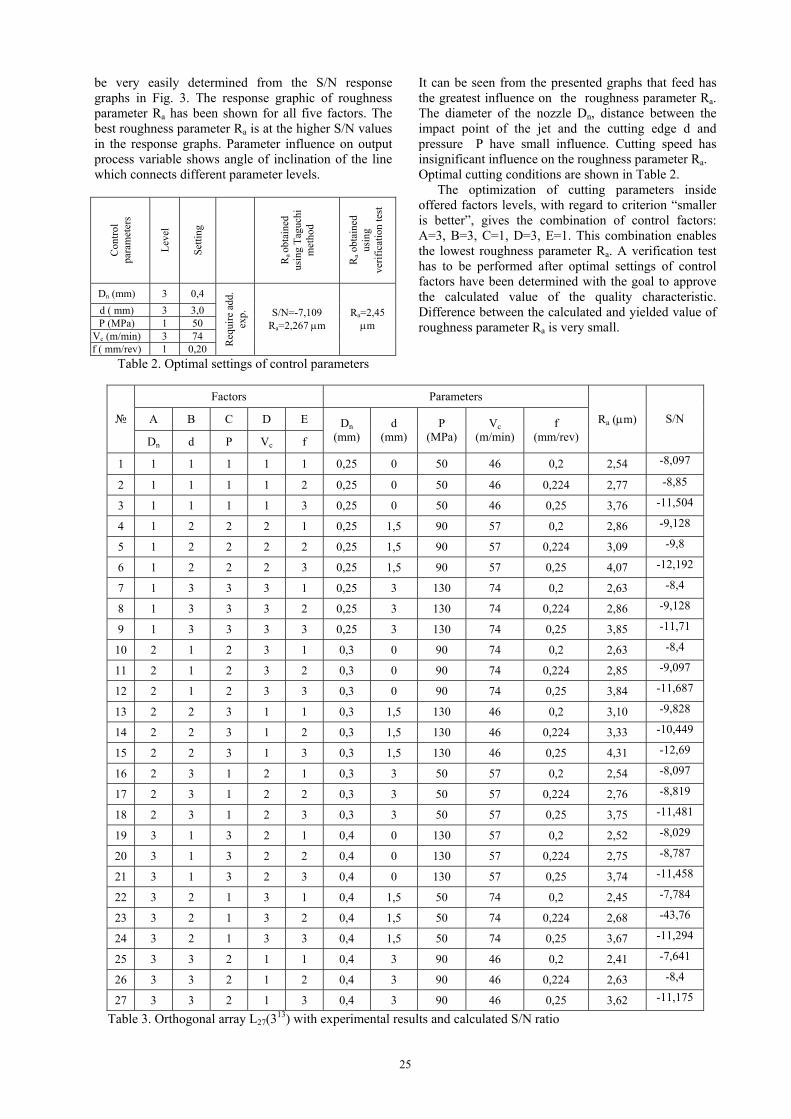
25
be very easily determined from the S/N response graphs in Fig. 3. The response graphic of roughness parameter Ra has been shown for all five factors. The best roughness parameter Ra is at the higher S/N values in the response graphs. Parameter influence on output process variable shows angle of inclination of the line which connects different parameter levels.
Con
trol
pa
ram
eter
s
Lev
el
Set
ting
Ra ob
tain
ed
usin
g T
aguc
hi
met
hod
Ra o
btai
ned
usin
g ve
rifi
cati
on te
st
Dn (mm) 3 0,4
d ( mm) 3 3,0 P (MPa) 1 50
Vc (m/min) 3 74 f ( mm/rev) 1 0,20
Req
uire
add
. ex
p. S/N=-7,109
Ra=2,267 m Ra=2,45 m
Table 2. Optimal settings of control parameters
It can be seen from the presented graphs that feed has the greatest influence on the roughness parameter Ra. The diameter of the nozzle Dn, distance between the impact point of the jet and the cutting edge d and pressure P have small influence. Cutting speed has insignificant influence on the roughness parameter Ra. Optimal cutting conditions are shown in Table 2. The optimization of cutting parameters inside offered factors levels, with regard to criterion “smaller is better”, gives the combination of control factors: A=3, B=3, C=1, D=3, E=1. This combination enables the lowest roughness parameter Ra. A verification test has to be performed after optimal settings of control factors have been determined with the goal to approve the calculated value of the quality characteristic. Difference between the calculated and yielded value of roughness parameter Ra is very small.
Factors Parameters
A B C D E №
Dn d P Vc f
Dn (mm)
d (mm)
P (MPa)
Vc (m/min)
f (mm/rev)
Ra (m) S/N
1 1 1 1 1 1 0,25 0 50 46 0,2 2,54 -8,097
2 1 1 1 1 2 0,25 0 50 46 0,224 2,77 -8,85
3 1 1 1 1 3 0,25 0 50 46 0,25 3,76 -11,504
4 1 2 2 2 1 0,25 1,5 90 57 0,2 2,86 -9,128
5 1 2 2 2 2 0,25 1,5 90 57 0,224 3,09 -9,8
6 1 2 2 2 3 0,25 1,5 90 57 0,25 4,07 -12,192
7 1 3 3 3 1 0,25 3 130 74 0,2 2,63 -8,4
8 1 3 3 3 2 0,25 3 130 74 0,224 2,86 -9,128
9 1 3 3 3 3 0,25 3 130 74 0,25 3,85 -11,71
10 2 1 2 3 1 0,3 0 90 74 0,2 2,63 -8,4
11 2 1 2 3 2 0,3 0 90 74 0,224 2,85 -9,097
12 2 1 2 3 3 0,3 0 90 74 0,25 3,84 -11,687
13 2 2 3 1 1 0,3 1,5 130 46 0,2 3,10 -9,828
14 2 2 3 1 2 0,3 1,5 130 46 0,224 3,33 -10,449
15 2 2 3 1 3 0,3 1,5 130 46 0,25 4,31 -12,69
16 2 3 1 2 1 0,3 3 50 57 0,2 2,54 -8,097
17 2 3 1 2 2 0,3 3 50 57 0,224 2,76 -8,819
18 2 3 1 2 3 0,3 3 50 57 0,25 3,75 -11,481
19 3 1 3 2 1 0,4 0 130 57 0,2 2,52 -8,029
20 3 1 3 2 2 0,4 0 130 57 0,224 2,75 -8,787
21 3 1 3 2 3 0,4 0 130 57 0,25 3,74 -11,458
22 3 2 1 3 1 0,4 1,5 50 74 0,2 2,45 -7,784
23 3 2 1 3 2 0,4 1,5 50 74 0,224 2,68 -43,76
24 3 2 1 3 3 0,4 1,5 50 74 0,25 3,67 -11,294
25 3 3 2 1 1 0,4 3 90 46 0,2 2,41 -7,641
26 3 3 2 1 2 0,4 3 90 46 0,224 2,63 -8,4
27 3 3 2 1 3 0,4 3 90 46 0,25 3,62 -11,175
Table 3. Orthogonal array L27(313) with experimental results and calculated S/N ratio

26
The experimental results were analyzed with Analysis of Variance (ANOVA), which is used for identifying the factors significantly affecting the performance measures are shown in Table 4.
Percentage contribution of parameter is obtained by dividing the sum of squares for each parameter with total sum squares.
Table 4. ANOVA table
4. CONCLUSIONS This paper has discussed dependence of roughness parameter Ra of the five high-pressure jet assistance turning (HPJA) parameters. Taguchi method has been used to determine the main effects, significant factors and optimum machining conditions to the value of the roughness parameter Ra. From analysis using Taguchi’s method, results indicate that among the all-significant parameters, feed is the most significant. Results obtained from Taguchi method closely matches with ANOVA. 5. REFERENCES [1] Bajić, D., Jozić, S., Podrug S.: Design of
experiment’s application in the optimization of milling process, Metalurgija, Vol 49, pp. 123-126, 2010.
[2] Kovac, P., Mankova, I., Gostimirovic, M., Sekulic, M., Savkovic, B.: A review of machining monitoring systems, Journal of Production Engineering, 14, pp. 1-6, 2011.
[3] Lazarevic, D., Madic, M., Jankovic, P., Lazarevic, A.: Surface roughness minimization of Polyamide PA-6 turning by Taguchi method, Journal of Production Engineering, 15(1), pp. 29-32, 2012
[4] Roy, R. K.: Design of experiments using the Taguchi approach:16 steps to product and process improvement, John Wiley& Sons, Inc., 2001.
[5] Sekulić, M., Hadžistević, M., Jurković, Z., Kovač, P., Gostimirović, M..: Application of Taguchi method in optimization of face milling parameters, 34th International Conference on Production Engineering, p.p. 57-60., Niš, Serbia, 2011.
[6] Pušavec, F., Kramar, D., Krajnik, P., Kopač, J.: Transitioning to sustainable production-part II: evaluation of sustainable machining technologies, Journal of Cleaner Production, Volume 18(2010), p.p. 174-184, 2010.
[7] Kramar, D.: High-pressure cooling assistance in machining of hard-to-machine materials, PhD
Thesis, Faculty of Mechanical Engineering, Ljubljana, 2009.
Authors: Assist. Prof. Dr. Davorin Kramar, Prof. Dr. Janez Kopač, University of Ljubljana, Faculty of Mechanical Engineering, Aškerčeva 6, 1000 Ljubljana, Slovenia, Phone: +386 1 47 71 737 Assist. Prof. Dr. Milenko Sekulić, Prof. Dr. Pavel Kovač, Prof. Dr. Marin Gostimirović, University of Novi Sad, Faculty of Technical Sciences, Department for Production Engineering, Trg Dositeja Obradovića 6, 21000 Novi Sad, Serbia, Phone.: +381 21 450-366, Fax: +381 21 454-495. E-mail: [email protected] [email protected] [email protected] [email protected] [email protected]

27
Original Scientific Paper
Kramar, D., Sredanović, B., Globočki - Lakić, G., Kopač, J.
CONTRIBUTION TO UNIVERSAL MACHINABILITY DEFINITION Received: 05 April 2012 / Accepted: 13 July 2012
Abstract: Researches that are presented in the paper are related to the definition of complex machinability. Analysis of machinability was performed using standard and special type of turning and dosing of lubrication in cutting process zone. Technological parameters were adjusted to the semi – machining, with the use of higher cutting speeds. During research, monitoring of the cutting force, chip shape, tool wear and surface roughness was performed. Relations between the above mentioned parameters and machinability of material were analyzed. Key words: machinability, vector, high pressure jet asssited machining Prilog definisanju univerzalne obradivosti materijala. Istraživanja predstavljena u ovom radu odnose se na definiciju kompleksne obradivosti. Izvršena je analiza obradivosti uz korišćenje standardne i specijalne tehnike doziranja SHP-a u zonu obrade. Tehnološki parametri su prilagođeni parametrima srednje obrde na strugu, uz korišćenje povišenih brzina rezanja. Tokom istraživanja, praćene su sile rezanja, oblik strugotine, habanje alata i hrapavost obrađene površine. Analiziran je odnos između pomenutih parametara i obradivosti materijala. Ključne reči: obradivost, vektor, obrada podpomognuta mlazom visokog pritiska 1. INTRODUCTION Global and rapid development of products and industry encourage development of new types of processes, new work materials, new cutting tools, new machine tools and cutting cooling and lubrication fluids, and principles of its delivery to the cutting zone [1]. Improvement of existing and development of new technologies trough experimental research are permanent tasks for research centers. Investigations and experimental research in the area of metal cutting technologies are crucial tasks in development of production engineering. Often, research of cutting processes is based on defining of machinability of materials. The goal of testing of machinability is finding the optimal technological and geometrical conditions of processing, and effective management of cutting process. Also, with knowledge about the machinability of materials, base for designing of machining systems is created. 2. MACHINABILITY IN METAL CUTTING
TECHNOLOGIES Machinability is a very complex category and also consider with several aspects of the different cutting conditions [2]. Machinability depends on a number of influential factors such as mechanical, structural and thermal properties of workpiece material, tool material and geometry, properties of cooling and lubrication, dynamic characteristics of system, processing conditions and etc. The goal of testing of machinability is finding the optimal technological and geometrical conditions of processing, and effective management of cutting process. Study and analyze of the phenomenon of
machinability is complicated because a large number of influential factors. Influential factors on the machinability of materials in cutting are the parameters which change significantly affects the ease of processing, as follows [2]:
material of work piece, material and geometry of tool, machining system and type of processing, cooling and lubricant properties and delivery, machining condition and etc.
Machinability is defining with basic set of functions, which includes: tool life and tribological characteristics of the process, cutting force, the quality of surface, chip shape and cutting temperature. Additional function is productivity of processing which expressed through the volume of removed chip per time unit. This function is directly related to the cutting condition (feed rate, cutting speed and depth of cut). As a general definition of machinability the following statement can be taking: the greatest values of machinability have material, which processing occur the smalest cutting forces, tool wear and surface roughness. 2.1 Influence of Cooling and Lubrication
Techniques on Machinability The basic functions of cooling and lubrication fluid is reduction of the friction between the tool and the workpiece (the contact point of the tool and chip and tool and workpiece surface), removal of heat generated during processing and improve chip removal from the treatment zone [2]. The positive effects are reflected in the increase of tool life, reduce of energy consumption, reducing of the surface roughness, etc. The effect of cooling and lubricating depends on the values of fluid flow parameters, fluid caracteristics and nozzle

28
geometry (type, quantity, pressure, nozzle position).
Fig. 1. High pressure jet cooling and lubrication Productivity increased by using the processing technique which the cooling and lubrication fluid brings as high pressure jet [3, 4, 5]. When using equal flow rate, high pressure cooling and lubricating allowed a better efficient cooling and lubrication that conventional technique of dosing. When using the high pressure jet (p > 50 MPa), in addition to the usual effects, there is the effect of chip breaking, separation and evacuation [3, 4]. High-pressure jet assisted (HPJA) machining is special technique of the cooling and lubrication condition, where fluids are dosed as a high- pressure jet into the cutting zone. It is high productive technology which is used in semi-machining and roughing. In this method, high pressure jet of emulsion is brought in zone between rake face on cutting tool and chip which contributes to effective cooling and lubrication of cutting zone and effective removal of chips. The advantage of this method is reduction of tool wear and reducing of cutting zone temperature [3, 4, 5]. Using of this technique reduces the cost of machining and fields of technological parameters are expanded. 3. UNIVERSAL MACHINABILITY OF
MATERIALS In the literature, the machinability index is estimated by the mean values of the parameters of machinability. Enache is developed a global model of relative machinability which containing more functions of machinability [6, 7, 8]. Rao and Gandhi used the principles of the matrix and graph mathematics into developing models for defining the machinability of materials according to various criteria of machinability [6, 7, 8]. This model is well know as Graph-matrix method. Boulger used machinability test of constant pressure of tool at the workpiece, it is proposed that the machinability is expressed through economy of process and based on Taylor formula [8]. Lee and Shaffer have suggested that the machinability of the material can be defined by the thermodynamic number [8]. 3.1 Developed model of univeral machinability The following statement can be taken as a general
definition of machinability: the greatest value of machinability has a material which processing occurs with the smallest cutting forces, tool wear and surface roughness [6]. Based on analyses of previous approaches of machinability definition it can be concluded that machinability is defined only by one criterion. Some material may have a good machinability according to one criterion, but very low machinability to the other criteria. Properly and complete definition of machinability, i.e. universal machinability, is based on the consideration of many criteria simultaneously [2].
Fig. 2. Vector of machinability The definition of machinability vector requires rectangular coordinate system, where three axes represent parameter of selected criteria, which form a universal machinability. For each general aspect in definition of machinability there are criteria which describe it and which have their rank of importance. On the axis of coordinate system the values of parameters which describe that criteria (value of cutting forces, friction forces, tool wear trace width, temperature, etc.) are set. Each axis has a corresponding unit vector which length corresponds to the unit value of parameter. Taking into consideration these criteria, based on the obtained scalar values (measured or analytically specified) and the corresponding unit vectors is formed a vector of criteria which lies in the appropriate coordinate axis:
iKOi
KOi KkK (1)
where KiKO is vector of i-th criteria, KO symbol of
criteria, kiko is unit vector of i-th criteria, Ki is scalar
value of parameter of i-th criteria. Machinability vector is sum of all individual criteria vectors, given with the following relation:
n
i
KOij KM
1
(2)
Material which machinability vector has less intensity and closing smaller angle with a control vector has better machinability [8]. The control vector has direction that determines the best uniformity of machinability indicators. The size which shows the intensity of machinability vector and its uniformity with the direction of control vector is area of the parallelogram formed by these two vectors. Defined

29
area of the parallelogram can be related to machinability of materials.
Fig. 3. Different parallelograms of vectors related to
machinability of material However, if the size of the observed intensity machinability vector of materials is smaller and if the angle that it closes with the control vector is smaller, machinability of the observed material is better than the other materials. Material with a small area defined by the parallelogram has better machinability compared to the material with a larger surface area of the parallelogram. The established relationship can be expressed through the product of machinability vector and control vector:
jjjj MCMCMCP ,sin (3)
Universal machinability (Muniv) is inversely proportional to the area of the parallelogram formed by machinability vector and control vector, and after mathematical operation, can be written in final form:
222
2222 1
a
aauniv RWF
RWFRWFM (4)
where F (N) is result cutting force, W (mm/min) is tool wear intensity and Ra (µm) is surface roughness. Analyzing the previous formula, one can observed two parts of the equation. The first part presents the influence of parameters on machinability. The second part of formula presents the influence of direct and mutual effects of certain parameters on machinability. 4. EXPERIMENTAL RESEARCH In experimental research different types of cooling lubrication conditions in turning were used. As a standard technology, flooding conditions were applied. As special delivery technique the HPJA turning were used. Experimental research was performed on universal lathe BOEHRINGER PRVOMAJSKA. Properties of tool machine are: power P = 8 kW, maximum spindle speed nmax = 2240 rev/min, and maximum feed fmax = 1.6 mm/rev. Carbide cutting tool for semi-machining is recommended tool by Japanese manufactures SUMITOMO. Cutting tool mark is SNMG 1204 08 NMX – AC 3000; square insert with clearance angle
10° and rake angle 0°, radius of tool tip is 0.8 mm, and without chip breakers geometry. Tool holder is PSDN2525M12, with inclination angle 45°.
Fig. 4. Experimental setup As a workpiece material used in experimental research the construction carbon steel Ck45E was selected. This medium tensile steel is applied for high loaded parts on machines and engineering structures (spindles, shaft, gears, and etc.). Experimental research was performed on workpiece with dimensions 150 x 250 mm. Tensile straight of this material is σ = 820 N/mm2, module of elasticy E = 2•103 MPa, and hardness of steel is 45 HRc.
Fig. 5. Initial jet of cooling and lubrication fluid Cooling and lubrication fluid is 3% emulsion of vegetable oil and technical water without chlor. With this mixture the organic emulsion with low price and good tribological characteristic is obtained. During experimental research with different techniques of cooling and lubrication the following pressures and fluid flows was applied:
In conventional turning with flood: pressure p = 0.35 MPa and flow rate Q = 2.0 l/min,
In HPJA turning: pressure p = 50 MPa and flow rate Q = 2.0 l/min.
HPJA nozzle was installed on the distance of Hnozzle = 30 mm from tool cutting edge. Direction of high pressure jet was in zone between clearance face of cutting tool and chip. Jet was hit on the tip of cutting edge at the angle of νnozzle = 90°. Nozzle diameter was dnozzle = 0.4 mm. Technological parameters were adapted to semi-machining. In experiment cutting speed was higher

30
than recommended one with goal to obtain effective material removal process. Technological parameters in experimental research were:
Cutting depth a (mm): 1.5, 2.0, 2.5. Feed f (mm/rev): 0.224, 0.280, 0.355, 0.400. Cutting speed v (m/min): 210, 320, 400.
During experimental research process output parameters that describe cutting processes were monitored (on and off-line). These parameters are crucial for defining of material machinability. Output parameters were as follows:
Cutting forces - main forces (Fc), feed forces (Ff) and penetration force (Fp),
Tool wear - trace width on primary (VB) and secondary tool rake face and width crater on tool clearance face,
Surface roughness: arithmetic average roughness (Ra) and maximum height of roughness (Ry) and
Chip shape.
Fig. 6. Set-up for cutting force measurment 5. RESULTS AND DISSCUSION Fig. 7, 8 and 9 shows the comparative values of the tree cutting force components for turning in conventional and HPJA cooling and lubrication conditions.
Fig. 7. Values of main cutting forces for different
cooling lubrication conditions and depth of cut
Fig. 8. Values of feed cutting forces for different
cooling lubrication conditions and depth of cut
Fig. 9. Values of penetration cutting forces for different
cooling lubrication conditions and depth of cut From the figures above it can be concluded that the values of cutting forces are smaller when machining with HPJA cooling and lubrication technique. The biggest difference was in values of feed cutting forces. The differences are greater for smaller depths of cut.
Fig. 10. Tool wears for different cooling and
lubrication techniques The measured values of flank face tool wear for different cooling and lubrication techniques are shown in Fig. 10. It can be concluded that the tool life is increased up to four times in case of HPJA turning. In Fig. 11. the values of surface roughness parameters are shown. During the HPJA turning technique higher
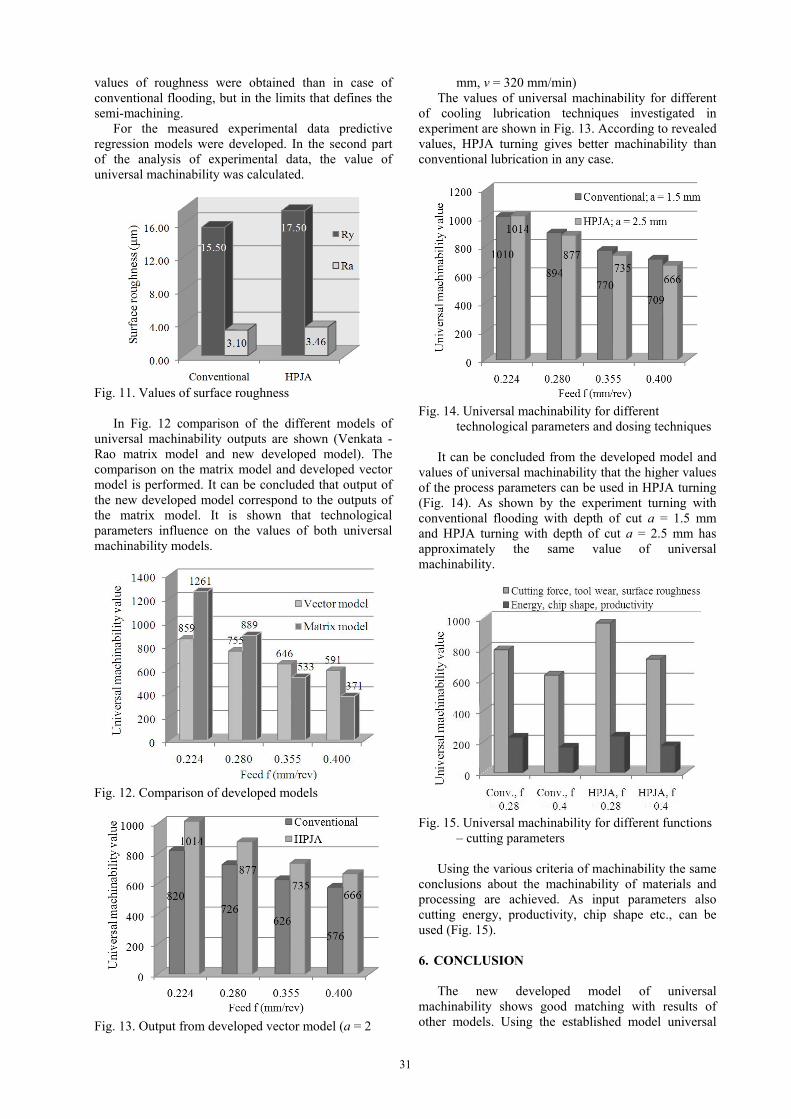
31
values of roughness were obtained than in case of conventional flooding, but in the limits that defines the semi-machining. For the measured experimental data predictive regression models were developed. In the second part of the analysis of experimental data, the value of universal machinability was calculated.
Fig. 11. Values of surface roughness In Fig. 12 comparison of the different models of universal machinability outputs are shown (Venkata - Rao matrix model and new developed model). The comparison on the matrix model and developed vector model is performed. It can be concluded that output of the new developed model correspond to the outputs of the matrix model. It is shown that technological parameters influence on the values of both universal machinability models.
Fig. 12. Comparison of developed models
Fig. 13. Output from developed vector model (a = 2
mm, v = 320 mm/min) The values of universal machinability for different of cooling lubrication techniques investigated in experiment are shown in Fig. 13. According to revealed values, HPJA turning gives better machinability than conventional lubrication in any case.
Fig. 14. Universal machinability for different
technological parameters and dosing techniques It can be concluded from the developed model and values of universal machinability that the higher values of the process parameters can be used in HPJA turning (Fig. 14). As shown by the experiment turning with conventional flooding with depth of cut a = 1.5 mm and HPJA turning with depth of cut a = 2.5 mm has approximately the same value of universal machinability.
Fig. 15. Universal machinability for different functions
– cutting parameters Using the various criteria of machinability the same conclusions about the machinability of materials and processing are achieved. As input parameters also cutting energy, productivity, chip shape etc., can be used (Fig. 15). 6. CONCLUSION The new developed model of universal machinability shows good matching with results of other models. Using the established model universal

32
machinability of different cooling lubrication techniques, which were investigated in experimental research, can be calculated. Calculation and analysis shows that turning with HPJA technique provides the best universal machinability. It should be noted that as the machinability criteria in calculation cutting force, intensity of tool wear and surface roughness were used. In the future research developed model in terms of using greater number of functions machinability will be investigated. 7. ACKNOWLEDGE This paper is the result of a bilateral project signed between Laboratory for Cutting in Ljubljana (Slovenia) and Laboratory for cutting technologies and machining systems in Banja Luka (Bosnia and Herzegovina). 7. REFERENCES [1] Grzesik, W.: Advanced machining processes of
metallic materials: theory, modeling and application, Elsevier B. V., Netherland, 2008.
[2] Globočki - Lakić, G.: Obrada rezanjem – teorija, modeliranje, simulacija, Univerzitet u Banjoj Luci, Mašinski fakultet Banja Luka, BiH, 2010.
[3] Kramar, D.: High-pressure cooling assistance in machining of hard-to-machine materials, PhD thesis, University of Ljubljana, 2009.
[4] Kramar, D., Kopac, J.: High pressure cooling in the machining of hard-to machine materials, Journal of Mechanical Engineering, Volume no. 55-11, p.p. 685-694, 2009.
[5] Kramar, D., Krajnik P., Kopac J.: Capability of high pressure cooling in the turning of surface hardened piston rods, Journal of Materials Processing Technology, Volume no. 210, p.p. 212–218, 2010.
[6] Globocki – Lakic, G., Sredanovic B., and et.: Vector based approach in defining of universal machinability, Proccedings of IN-TECH 2010 International Conference on Innovative Technology in Design, Manufacturing and Production, p.p. 326 - 329, Prague, Czech, 2010.
[7] Rao, R. V., Gandhi, O. P.: Diagraph and matrix methods for machinability evaluation of works materia”, Inter. Journal of Machine Tools & Manufacture, Volume no. 42, p.p. 321 – 330, 2002.
[8] Sredanović, B.: Razvoj modela za definisanje univerzalne obradivosti na osnovu parametara procesa rezanja, Master of Science thesis, Univerzitet u Banjoj Luci, Mašinski fakultet, 2012.
Authors: Assistant Professor Dr. Davorin Kramar1, Asistant MSc Branislav Sredanović2, Associate Professor Dr. Gordana Globočki - Lakić2, Prof. Dr Janez Kopač1. 1University of Ljubljana, Faculty of Mechanical Engineering, Aškerčeva 6, 1000 Ljubljana, Slovenia, Phone.: +386 1 477-14-38, Fax: +386 1 251-85-67. 2University of Banjaluka, Faculty of Mechanical Engineering, Vojvode Stepe Stepanovića 75, 78000 Banja Luka, Bosna and Herzegovina,
Phone.: +387 51 433-000, Fax: +387 51 465-085. E-mail: [email protected] [email protected] [email protected] [email protected]
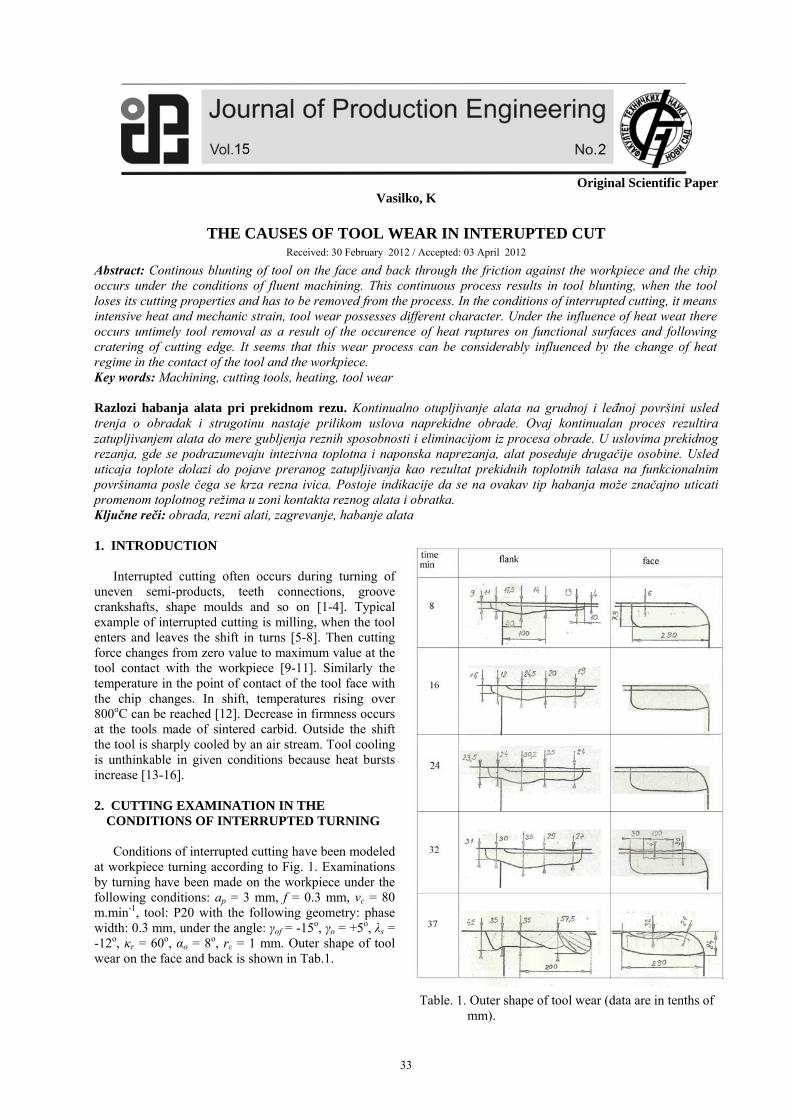
33
Original Scientific Paper
Vasilko, K
THE CAUSES OF TOOL WEAR IN INTERUPTED CUT Received: 30 February 2012 / Accepted: 03 April 2012
Abstract: Continous blunting of tool on the face and back through the friction against the workpiece and the chip occurs under the conditions of fluent machining. This continuous process results in tool blunting, when the tool loses its cutting properties and has to be removed from the process. In the conditions of interrupted cutting, it means intensive heat and mechanic strain, tool wear possesses different character. Under the influence of heat weat there occurs untimely tool removal as a result of the occurence of heat ruptures on functional surfaces and following cratering of cutting edge. It seems that this wear process can be considerably influenced by the change of heat regime in the contact of the tool and the workpiece. Key words: Machining, cutting tools, heating, tool wear Razlozi habanja alata pri prekidnom rezu. Kontinualno otupljivanje alata na grudnoj i leđnoj površini usled trenja o obradak i strugotinu nastaje prilikom uslova naprekidne obrade. Ovaj kontinualan proces rezultira zatupljivanjem alata do mere gubljenja reznih sposobnosti i eliminacijom iz procesa obrade. U uslovima prekidnog rezanja, gde se podrazumevaju intezivna toplotna i naponska naprezanja, alat poseduje drugačije osobine. Usled uticaja toplote dolazi do pojave preranog zatupljivanja kao rezultat prekidnih toplotnih talasa na funkcionalnim površinama posle čega se krza rezna ivica. Postoje indikacije da se na ovakav tip habanja može značajno uticati promenom toplotnog režima u zoni kontakta reznog alata i obratka. Ključne reči: obrada, rezni alati, zagrevanje, habanje alata 1. INTRODUCTION
Interrupted cutting often occurs during turning of uneven semi-products, teeth connections, groove crankshafts, shape moulds and so on [1-4]. Typical example of interrupted cutting is milling, when the tool enters and leaves the shift in turns [5-8]. Then cutting force changes from zero value to maximum value at the tool contact with the workpiece [9-11]. Similarly the temperature in the point of contact of the tool face with the chip changes. In shift, temperatures rising over 800oC can be reached [12]. Decrease in firmness occurs at the tools made of sintered carbid. Outside the shift the tool is sharply cooled by an air stream. Tool cooling is unthinkable in given conditions because heat bursts increase [13-16]. 2. CUTTING EXAMINATION IN THE
CONDITIONS OF INTERRUPTED TURNING
Conditions of interrupted cutting have been modeled at workpiece turning according to Fig. 1. Examinations by turning have been made on the workpiece under the following conditions: ap = 3 mm, f = 0.3 mm, vc = 80 m.min-1, tool: P20 with the following geometry: phase width: 0.3 mm, under the angle: γof = -15o, γo = +5o, λs = -12o, κr = 60o, αo = 8o, rε = 1 mm. Outer shape of tool wear on the face and back is shown in Tab.1.
Table. 1. Outer shape of tool wear (data are in tenths of
mm).
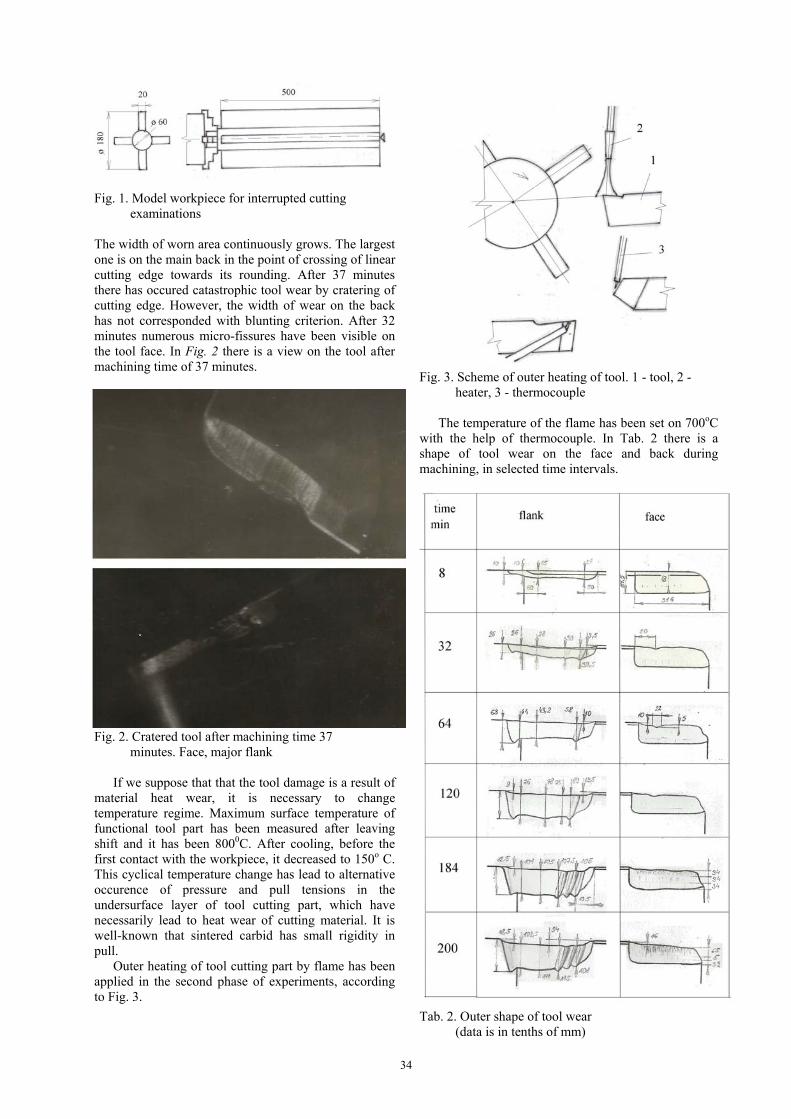
34
Fig. 1. Model workpiece for interrupted cutting
examinations The width of worn area continuously grows. The largest one is on the main back in the point of crossing of linear cutting edge towards its rounding. After 37 minutes there has occured catastrophic tool wear by cratering of cutting edge. However, the width of wear on the back has not corresponded with blunting criterion. After 32 minutes numerous micro-fissures have been visible on the tool face. In Fig. 2 there is a view on the tool after machining time of 37 minutes.
Fig. 2. Cratered tool after machining time 37
minutes. Face, major flank
If we suppose that that the tool damage is a result of material heat wear, it is necessary to change temperature regime. Maximum surface temperature of functional tool part has been measured after leaving shift and it has been 8000C. After cooling, before the first contact with the workpiece, it decreased to 150o C. This cyclical temperature change has lead to alternative occurence of pressure and pull tensions in the undersurface layer of tool cutting part, which have necessarily lead to heat wear of cutting material. It is well-known that sintered carbid has small rigidity in pull.
Outer heating of tool cutting part by flame has been applied in the second phase of experiments, according to Fig. 3.
Fig. 3. Scheme of outer heating of tool. 1 - tool, 2 -
heater, 3 - thermocouple
The temperature of the flame has been set on 700oC with the help of thermocouple. In Tab. 2 there is a shape of tool wear on the face and back during machining, in selected time intervals.
Tab. 2. Outer shape of tool wear
(data is in tenths of mm)
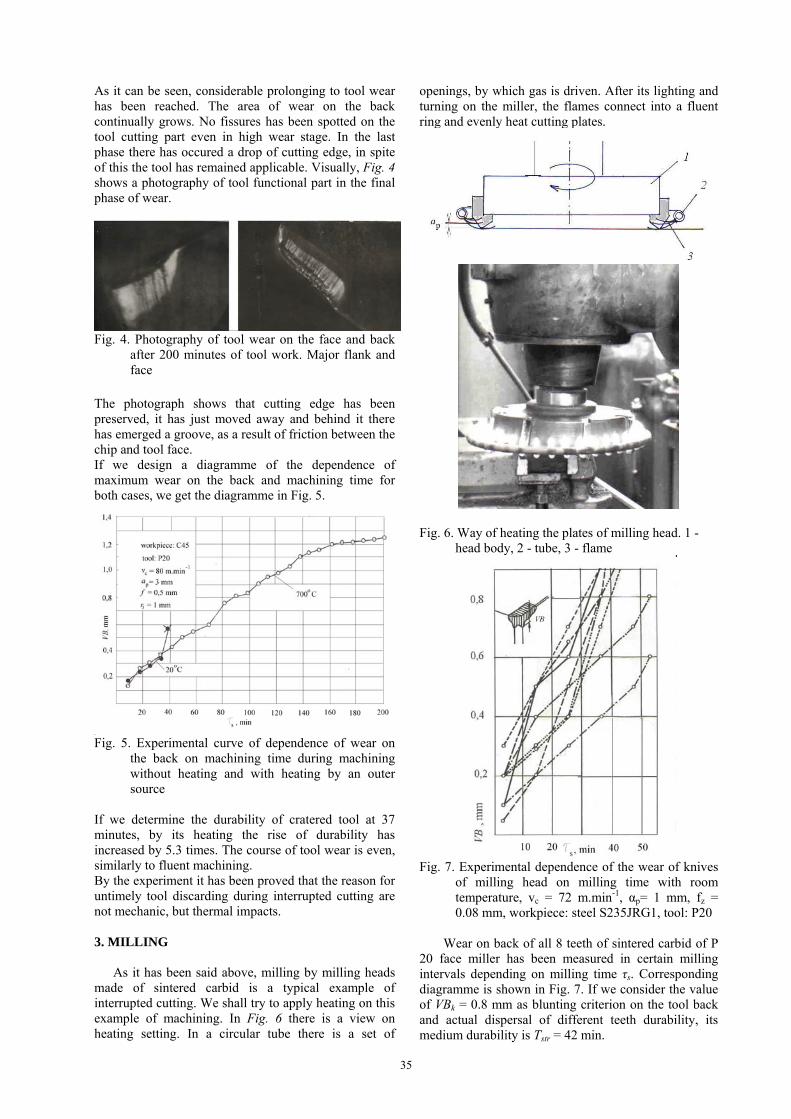
35
As it can be seen, considerable prolonging to tool wear has been reached. The area of wear on the back continually grows. No fissures has been spotted on the tool cutting part even in high wear stage. In the last phase there has occured a drop of cutting edge, in spite of this the tool has remained applicable. Visually, Fig. 4 shows a photography of tool functional part in the final phase of wear.
Fig. 4. Photography of tool wear on the face and back
after 200 minutes of tool work. Major flank and face
The photograph shows that cutting edge has been preserved, it has just moved away and behind it there has emerged a groove, as a result of friction between the chip and tool face. If we design a diagramme of the dependence of maximum wear on the back and machining time for both cases, we get the diagramme in Fig. 5.
Fig. 5. Experimental curve of dependence of wear on
the back on machining time during machining without heating and with heating by an outer source
If we determine the durability of cratered tool at 37 minutes, by its heating the rise of durability has increased by 5.3 times. The course of tool wear is even, similarly to fluent machining. By the experiment it has been proved that the reason for untimely tool discarding during interrupted cutting are not mechanic, but thermal impacts. 3. MILLING
As it has been said above, milling by milling heads made of sintered carbid is a typical example of interrupted cutting. We shall try to apply heating on this example of machining. In Fig. 6 there is a view on heating setting. In a circular tube there is a set of
openings, by which gas is driven. After its lighting and turning on the miller, the flames connect into a fluent ring and evenly heat cutting plates.
Fig. 6. Way of heating the plates of milling head. 1 -
head body, 2 - tube, 3 - flame
Fig. 7. Experimental dependence of the wear of knives
of milling head on milling time with room temperature, vc = 72 m.min-1, αp= 1 mm, fz = 0.08 mm, workpiece: steel S235JRG1, tool: P20
Wear on back of all 8 teeth of sintered carbid of P
20 face miller has been measured in certain milling intervals depending on milling time τs. Corresponding diagramme is shown in Fig. 7. If we consider the value of VBk = 0.8 mm as blunting criterion on the tool back and actual dispersal of different teeth durability, its medium durability is Tstr = 42 min.

36
Fig. 8. Experimental dependence of wear of teeth of
milling head on machining time with tool heating. Labelling of different teeth (line type) and cutting conditions are equivalent to Fig. 7
Consequently, milling tests with heating by a flame to 700oC has been performed. Corresponding diagramme is shown in Fig. 8. The diagramme shows that the miller has medium durability (at VBk = 0.8 mm) 120 minutes, which is cca three times increase of durability in comparison with milling without heating. It is a proof again, that heat impact has decisive influence on milling tools with sintered carbid, which evoke higher tension in cutting tool than mechanic impact. It is obvious that with tool cooling the heat impact would become more intensive, therefore cooling of milling heads with tools made of sintered carbid is not recommended. 4. CONCLUSIONS
Friction and wear of tools made of sintered carbid is very intensive in the conditions of interrupted dry cutting. The wear intensity depends mainly on alternating heating and cooling of tool cutting part, it means on heat impact, which lead to alternating pull and pressure tensions under the surface of tool cutting part. The result is the occurence of micro-frissures, which lead to untimely tool discard. By the adjustment of heat regime, the mechanism of tool wear can be considerably influenced. At the experiments in model situation we have used open flame, which can be problematic in operational conditions. Heated air can be used, obviously only in the case when the effect of durability increase overweighs the costs of tool heating. 5. REFERENCES [1] AHN, A. H et all.: Investigation of cutting
characteristics in side-milling a multi-thread shat on automatic lathe. Annals of the CIRP Vol. 55/1/2006, pp.63-66
[2] BALLHAUSEN, C., VIERREGE, G.:Spannungen und Risbildung in gelöteten Hardmetallplätchen. Werkstatt und Betrieb č. 12, 1952
[3] BUDA, J., BÉKÉS, J.: Teoretické základy obrábania kovov. Bratislava: ALFA, 1967, 698 s.
[4] GRANOVSKIJ, G. I., GRANOVSKIJ, V. G.: Rezanije metallov. Moskva: vyššaja škola 1985, 304 s.
[5] HOLEŠOVSKÝ, F. et all.: Materiály a technologie obrábění. Ústí n. Labem, UJEP, 1991, 250 s.
[6] KALPAKJIAN, S.: Manufacturing engineering and technology. New York: Addison Wesley Publishing Company, 1989, pp.1999,
ISBN 0-201-12849-7 [7] KOVAČ, P., MILIKIĆ D.: Rezanje metala, Novi
Sad: Univerzitet u Novom Sadu, 240 s., ISBN 86.899-0015-1
[8] LOLADZE, T. N.: Pročnosť i iznosostojkosť režuščego instrumenta. Moskva: Mašinostrojenije, 1982
[9] LOLADZE, T. N.: Stružkoobrazovanije pri rezanii metallov. Moskva, Mašgiz, 1952
[10]LOLADZE, T.N.: Základy optimalizácie strojárskej technológie. Bratislava: ALFA, 1989, 216 s., ISBN 80-05-00083-9
[11] MÁDL, J., KVASNIČKA, J.: Optimalizace obráběcího procesu. Praha: Vydavatelství ČVUT, 1998, 168 s.
[12] MASUDA, K.: Compressive strenght of the cutting edges of the WC-Co cemented carbides. Bulletin ASME, 13, č. 56, 1970
[13] Kovac, P., Savkovic, B., Mijic, A., Sekulic, M.,: Analitical and experimental study of cutting force components in face milling, Journal of Production Engineering, 14, pp. 15-18, 2011.
[14] REZNIKOV, A. N.: Teplofizika processov mechaničeskoj obrabotki materialov. Moskva, Mašinostrojenije, 1891. 330 s.
[15] SMART, E. F – TRENT, E. M.: Distribution des temperatures dans les outils de couple utilizes pour l´ usinage du far, du titane et du nickel. Bull. Cerlce étud. Métaux, 1985, num. spac., 443-447. Discuss., 478-479.
[16] WRIGHT, P. K.: Applications of the Experimental Methods Used to Determine Temperature Gradients. In: Cutting Tools. Austrial Conference Manufacturing Engineering., Adelaide, 1977. Barton, 1977, pp. 145-149.
Author: Dr.h.c.,Prof. Ing. Karol Vasilko, DrSc. Technical University of Košice., Facilty of Manufacturing Technologies, 080 01 Prešov, Bayerova 1, E-mail: [email protected]

37
Original Scientific Paper
Čiča, Đ., Zeljković, M., Lakić-Globočki, G., Sredanović, B., Borojević, S.
IDENTIFICATION OF CONTACT PARAMETERS OF SPINDLE–HOLDER–TOOL ASSEMBLY USING ARTIFICIAL NEURAL NETWORKS
Received: 15 July 2012 / Accepted: 28 August 2012
Abstract: The most important requirements of spindle assembly exploitation are parameters of dynamic behavior. This paper explores the use of artificial neural networks in predicting the contact parameters of machine tool spindle – holder – tool assembly. Based on error analysis it was concluded that artificial neural networks, if they used in a systematic way, which includes detailed data preparation and application of optimization techniques to train the network, can be successfully applied in predicting different mechanical properties of the mechanical system , such as the contact parameters spindle–holder–tool assembly. Key words: neural networks, prediction, contact parameters Identifikacija kontakt parametara sklopa vreteno – sedište – alat primenom veštačkih neuronskih mreža. Najvažniji zahtevi eksploatacije sklopa vretena su parametri dinamičkog ponašanja. Ovaj rad istražuje primenu veštačkih neuronskih mreža za predviđanje kontakt parametara sklopa vreteno–sedište–alat mašina alatki. Na osnovu analize greške zaključeno je da veštačke neuronske mreže, ako se koriste na sistematičan način, koji obuhvata detaljne podatke pripreme i primene optimizacione tehnike za obuku mreže, može se uspešno primeniti u predviđanju različitih mehaničkih osobina mehaničkih sistema, kao što su kontakt parametri sklopa vreteno–sedište–alat. Ključne reči: neuronske mreže, predviđanje, kontakt parametri 1. INTRODUCTION Most of the research of machine tools, are related to spindle-holder-tool assembly, since its characteristics, such as static and dynamic behavior, power, speed, the types of bearings, among many others, have a decisive impact on machine tools performance. Dynamic instability is one of the major disturbance factors, which influences the quality and productivity of machine tools. In order to avoid self-excited vibration of machine tools during the cutting process, Tlusty [1] proposed a stability lobe diagram, obtained on the basis of the tool point frequency response function (FRF) of the assembly. Common way of obtaining tool point FRF is performing experimental modal analysis. However, any change in the spindle–holder–tool assembly, such as tool and/or tool holder changes, requires a new test, since the system dynamic is change. Therefore, the use of experimental modal analysis is not always very practical, since it requires a lot of time, because the measurements must be performed for each combination of the spindle–holder–tool assembly. In order to minimize experimentation, the receptance coupling theory of structural dynamics can be used for modelling the spindle–holder–tool dynamics [2-5]. On the other hand, in order to obtain the tool point FRF of an assembly with analytical methods, contact parameters should be known accurately. Therefore, fast and accurate identification of contact parameters in spindle–holder–tool assembly is crucial. Since neural networks are a burgeoning area of artificial intelligence and are applied in many engineering applications, the aim of the present study is
to investigate the possibility of their application in prediction of the contact parameters of spindle–holder–tool assembly. 2. IDENTIFICATION OF CONTACT PARAMETERS Components of the spindle–holder–tool assembly should be coupled elastically due to flexibility and damping introduced by contacts at spindle–holder and holder–tool interfaces. Furthermore, we have applied the approach [2, 3], where part of the holder inside the spindle is considered as integrated to the spindle, because this approach provides a more realistic model, because only the dynamics due to the masses of these subsystems will be included into the model or it will be required to include their stiffness effects with distributed springs. Similarly, the part of the tool inside the holder is considered rigidly joined to the holder, so the receptance matrix of the tool can be coupled with the rest of the system, as depicted in Figure 1. Assuming that response matrices of the subsystem S (spindle with bearings) and subsystem H (holder) are known, then it is possible by using a method of receptive coupling, to obtain the global system response matrix SH (spindle–holder) at the holder tip:
11ii ii ic cc cc SH ci
SH H H H S K H (1)
Complex stiffness matrix, which representing the spindle–holder interface dynamics has the following form:
0
0SH t SH t
SHSH r SH r
k i c
k i c
K (2)

38
where: SHkt – translational stiffness, SHct – translational damping, SHkr – rotational stiffness and SHcr – rotational damping at the spindle – holder interface. Receptance matrix of the global system SHT (spindle–holder–tool) at the tool tip has the following form:
11ii ii ic cc cc HT ci
SHT T T T SH K T (3)
In the equation above, T is a subsystem of a tool and HTK is the complex stiffness of holder–tool interface dynamics:
0
0HT t HT t
HTHT r HT r
k i c
k i c
K (4)
where: HTkt – translational stiffness, HTct – translational damping, HTkr – rotational stiffness and HTcr – rotational damping at the holder – tool interface.
Fig. 1. Elastic coupling of the spindle–holder system
(a) and elastic coupling of the spindle–holder–tool system (b)
In order to be able to use equation (3) to predict the frequency response function of the tool tip, we need to know translational and rotational dynamic response for each of the components of the spindle - holder – tool assembly. Response matrix of the tool and holder can be obtained by an analytical method, using some of the beam theories or through the FEM analysis. Defining spindle response poses a problem because data regarding dimensions, material, the manner of bearing, the number, and type of bearings are unknown so their modeling is critical and therefore we use experimental method to obtain spindle FRF. The spindle–holder–tool assembly shown in Figure 2 is suspended to obtain free-free end conditions for performing an impact test.
Fig. 2. Measuring chain for the identification of
dynamic behavior of the spindle–tool holder–tool system
In order to provide sufficient data for learning neural networks 178 measurements was made with different combinations of spindle–holder–tool assembly. Since contact parameters depend on tool diameter (D) and overhang length of the tool (L), in experimental tests theese two parameters are varied (D = 9 ÷ 30 mm and L = 16 ÷ 83 mm). After that, the contact parameters of spindle–holder–tool assembly are identified using the methodology presented in [5]. The results are used to train neural network which can be used for prediction of contact parameters of spindle–holder–tool assembly for different cases. 3. THE DESIGN OF NEURAL NETWORK AND RESULTS The Matlab's Neural Network Toolbox was used as a tool for the design, implementation, and simulation of neural networks. Backpropagation method of teaching artificial neural networks was used. It is supervised learning technique which is most useful for feed-forward networks. In order to avoid overfitting or for improving generalization, early stopping technique was applied. Levenberg-Marquardt algorithm was used to train the networks faster, where: initial value of the Marquardts parameter is 0.001, reduction factor of the Marquardts parameter is 0.1 and increase factor of the Marquardts parameter is 10. Neural network learning is stopped when the value of the Marquardts parameter rises above the threshold that is set to 1010. Bipolar sigmoidal function in hidden layer and linear function in output layer are selected as activation functions. Limit level of the learning accuracy is set with normalized root mean square error NRMSE = 0.05. The identified data, relating to the translational and rotational stiffness of spindle–holder–tool assembly for different combinations of tools, are divided into three sets: the learning set, the validation set and the test set. In the present case a feedforward neural network model was used, consisting of three layers: the input layer, the hidden layer and the output layer. In order to test how

39
well neural network adapt to the input-output pairs of data, or how well the network based on the given input values provides output parameters, in all three data sets errors were analyzed using the following parameters: correlation coefficient, normalized root mean square error and mean relative error. Network optimization is performed over the number of neurons in the hidden layer, while the number of neurons in the input and output layers correspond to the number of input and output variable, respectively, and can not be changed. The most favorable number of neurons in the hidden layer was determined by monitoring of errors in the validation set and the test set. The initial values of weights are determined by the Nguyen-Widrow algorithm. Whenever the number of neurons and the slope of activation function in hidden layer are changed, the same initial values of weights are set, whereas before each learning of neural network these values ere reloaded. According to the above described procedure, first is established neural network for prediction of translational stiffness of the spindle–holder–tool assembly. The input variables for neural network are tool diameters and overhang length of the tools, while the output variable is the translational stiffness at the holder–tool interface. As the best combination, which gives a minimum value of the normalized root mean square error of 0.0585, mean relative error of 3.45%, the highest correlation coefficient value of 0.99828 and determination coefficient value of 0.99656, was chosen network structure with 20 neurons in the hidden layer and with slope of activation function σ = 2. Figure 3 shows the correlation between predicted and measured values of translational stiffness at the holder–tool interface in the test set, with its direction of regression, linear correlation coefficient, and drawn towards full correlation (R = 1). The correlation coefficient of test set is R > 0.9, so it can be concluded that is obtained very good correlation between measured an predicted values.
Fig. 3. The correlation between predicted and measured
translational stiffness of the test set By comparison of measured and predicted values of translational stiffness at the holder–tool interface from the test set, it was observed that the maximum relative error of 7.81% is obtained for the tool with a
diameter D = 13 mm and overhang length L = 39 mm. Furthermore, the mean relative error in the test set, which consist twenty different combinations of the spindle–holder–tool assembly, is 3.45%, while the standard deviation is 2.05. Figure 4 simultaneously shows measured and predicted values of translational stiffness at the holder–tool interface from the test set.
Fig. 4. The measured and predicted values of
translational stiffness at the holder–tool interface in the test set
Similarly, there was perform a prediction of rotational stiffness at the holder–tool interface. The results are shown in Figure 5. In this case, the maximum relative error of 2.21% is obtained for the tool with a diameter D = 25 mm and overhang length L = 43 mm, while the mean relative error in the test set is 0.38% and a standard deviation is 0.47. Significantly fewer errors in the prediction of the rotational stiffness are result of much smaller spread values of input variables.
Fig. 5. The measured and predicted values of rotational
stiffness at the holder–tool interface in the test set

40
In order to investigate the accuracy of neural network in prediction of translational and rotational stiffness, combination of the spindle–holder–tool assembly for which network generate the greatest error of 7.81% for the translational and 0.61% for the rotational stiffness is selected. Then, with predicted parameters of translational and rotational stiffness (HTkt = 1,421 · 107 N/m, HTkr = 1,489 · 106 Nm/rad) at the holder–tool interface, receptance matrix of 13 mm diamater tool with 39 mm overhang length is coupled with rest of system. The tool point frequency response function on the same assembly obtained with contact parameters from experimental results and with contact parameters identified with neural network are shown in Figure 6. It can be concluded that neural network prediction of contact parameters is quite satisfactory, especially if one considers that instead of the mean error of 3.45%, is taken into account the maximum error of translational stiffness of 7.81%.
Fig. 6. Tool point obtained with contact parameters
from experimental results and with contact parameters identified with neural network
4. FINAL REMARKS Artificial intelligence is one of the areas of science which is the fastest growing in recent decades. Parallel with these development growth and expectations of the discipline. Artificial intelligence systems are designed to address problems that can not be solved by conventional computer systems. The important type of artificial intelligence are artificial neural networks. The main areas of concentration neural networks that have been used in mechanical engineering problems are control, identication and damage detection. The main advantages of ANN are its adaptivity, fault tolerant, noise resistant and its ability to approximate an arbitrary nonlinear function with a predefined accuracy. The aim of this study is develop a methodology using artificial neural networks to train and predict the conntact parameters of the spindle–holder–tool assembly. The artificial neural network was trained using a feed-forward network with back-propagation that has proven to be successful in many engineering applications. Analisys results show that artifical neural networks, if they are used in a systematic way, which includes detailed data preparation and application of optimization techniques to train the network, has the
ability to predict contact parameters of the spindle–holder–tool assembly. Furthermore, artifical neural networks can also effectively deal with uncertain and incomplete information, thereby making them highly promising tool for identifying systems that are typically encountered in structural dynamics. 5. REFERENCES [1] Tlusty, J., Polacek, M.: The stability of machine
tools aginst self-excited vibrations in machining, Proceedings of the ASME International Research in Production Engineering, p.p. 465 – 474, Pittsburgh, 1963.
[2] Erturk, A., Ozguven, H.N., Budak, E.: Analytical modeling of spindle-tool dynamics on machine tools using Timoshenko beam model and receptance coupling for the prediction of tool point FRF, International Journal of Machine Tools & Manufacture, vol. 46, p.p. 1901-1912, 2006.
[3] Erturk, A., Ozguven, H.: Effect analysis of bearing and interface dynamics on tool point FRF for chatter stability in machine tools by using a new analytical model for spindle–tool assemblies, International Journal of Machine Tools & Manufacture, vol. 47, p.p. 23-32, 2007.
[4] Schmitz, T.L., Davies, M.A., Kennedy, M.D.: Tool Point Frequency Response Prediction for High-Speed Machining by RCSA, Journal of Manufacturing Science and Engineering, vol. 123, 2001.
[5] Čiča, Đ., Zeljković, M., Lakić-Globočki, G., Sredanović: Modeling of dynamical behavior of a spindle-holder-tool assembly, Strojarstvo, in review
Authors: PhD Assistant Professor Đorđe Čiča, PhD Full Professor Milan Zeljković, PhD Associate Professor Gordana Lakić-Globočki, BSc Branislav Sredanović, MSc Stevo Borojević, University of Banja Luka, Faculty of Mechanical Engineering, Vojvode Stepe Stepanovića 75, 78 000 Banja Luka, Republic of Srpska, BiH, Phone.: +387 51 462-400, Fax: +387 51 465-085. E-mail: [email protected] [email protected] [email protected] [email protected] [email protected]

41
Original Scientific Paper
Milutinovic, M., Slavkovic, N., Milutinovic, D.
KINEMATIC MODELING OF THE TRICEPT BASED 5-AXIS MACHINE TOOL Received: 01 July 2012 / Accepted: 17 August 2012
Abstract: This paper is aimed in presenting a study on the kinematic modeling of the Tricept based five-axis vertical machine tool. Since the machine comprises 3-DOF parallel structure and 2-DOF serial wrist kinematic modeling also comprises serial and parallel part. As solution of direct and inverse kinematics of 2-DOF serial wrist is well known the study in this paper will focus on the parallel structure only. Key words: hybrid mechanism, kinematic modeling, machine tool Kinematsko modelovanje Tricept osnove 5-osne mašine alatke. Cilj ovog rada je da predstavi kinematsko modelovanje Tricept osnove peto-osne vertikalne mašine alatke. Pošto mašina obuhvata paralelnu strukturu (3 stepena slobode kretanja) i serijski zglob (2 stepena slobode kretanja), kinematsko modelovanje takođe obuhvata serijski i paralelni deo. Kao direktno rešenje i inverzna kinematika serijskog zgloba je dobro poznata pa će se ovoj rad fokusirati samo na paralelne strukture. Ključne reči: hibridni mehanizam, kinematsko modelovanje, mašina alatka 1. INTRODUCTION Compared with serial stru ctured machine tools and robots, pa rallel ki nematic machine t ools and r obots have many advantages. Basic knowledge about diverse aspects of parallel kinematic machines has already been published. M any di fferent t opologies of pa rallel mechanisms with 3 -6 D OF has been used [ 1-3]. Considering that some limitations are indeed due to the use of paral lel mechanisms, it is a ppealing to investigate architectures based on hybrid arrangements where serial and parallel concept are combined [3]. The Tricept robot o r Tricep t machine too l is b ased on parallel tr ipod co mbined with passive ch ain, and equipped with serial 3- or 2- DOF wrist. The inventor of th is st ructure is K.-E. Neu man [4 ] wh ile th e mechanics has been constructed by Neos [5]. The primary ap plication o f co mmercially a vailable Tricept robots was area of assem bly w here large insertion forces are requ ired, e.g. as in t he automobile industry. Conceptual model of the Tricept based vertical five-axis m achine to ol con sidered in th is p aper, Fig . 1, i s planed for HSC-mill ing of alu minium, steel as well as large model making, plastic and foam machining. This paper is aimed in presen ting a stud y on th e kinematic modeling o f t he Tri cept based fi ve-axis vertical machine tool. Sin ce the machine comprises 3-DOF parallel structu re an d 2-DOF serial wrist kinematic modeling al so c omprises serial a nd pa rallel part. As solution of direct and inverse kinematics of 2-DOF serial wrist is well k nown the study in this paper will focus on the parallel structure only. 2. KINEMATIC MODELING
Figure 2 represents a ge ometric model o f t he Tricept base d vertical fi ve-axis m achine tool , Fi g. 1 ,
which co mprises 3-DOF p arallel stru cture and 2-DOF serial wrist. Parallel structure consists of four kinematic chains, i ncluding t hree va riable l ength legs wi th identical t opology a nd one p assive l eg c onnecting t he fixed base B and the moving platform P. Three variable length leg s with actu ated prismatic j oints
321 ,,, iid are c onnected to t he base B by Carda n joints and to movable platform P by spherical joints.
Fig. 1. Conceptual model of the Tricept based five-axis
machine tool The fourth chain (central leg) connecting the centre of the base B to the platform P i s passive constraining leg. It c onsist of C ardan joint, a m oving l ink, a prismatic joint and the second moving link fixed to the

42
platform P. Th is fo urth leg is u sed t o co nstrain th e motion of t he platform t o on ly 3-D OF. T hese 3 -DOF are described by spherical coordinates i .e. by the axial translation Op
MOpp p along the central leg and by
two rotations and about two axes orthogonal to the central leg itself. Two-DOF serial wris t execute s rotational m otions i.e. t ool orientation with actu ated rotational joints 21 and . To a dequately cont rol t he p osition a nd o rientation of t he t ool during m achining processes, ki nematic model is req uired to establish mathematics description for t he m achine t ool. Kinematic modeling of parallel structure involv es so lving o f i nverse k inematics, Jacobian matrix as t he basis fo r numerical solution of direct ki nematics, and direct ki nematics. Based o n machine inve rse kinem atics the works pace has bee n analyzed in order to select machine prot otype design parameters. 2.1 Machine joint and world coordinates As can be c oncluded from Fig. 1 i .e. Fig 2, Tricept based five-axis machine tool will be considered below as a specific configuration of t he fi ve-axis vertical milling machine (X, Y, Z, B, C) spindle-tilting type [6]. The m achine refere nce fra me {M} has bee n adopted according to the standard for this machine type [7]. Frame {P} is attached to the moving platform in a way that Pz axis coincides with the axis of the central leg and with the axis of joint 1 . The tool frame {T} is attached to the milling tool at the tool tip T, so that the
axis Tz coincides with tool axis, and the frame {W} is attached to t he work piece. Vectors v refe renced in frames {M}, { W}, {P} a nd {T} are de noted by vM ,
vW , vP and vT . To sol ve di rect and i nverse ki nematics, joi nt an d world coordinates will be defined first. Joint coo rdinates v ector for th is 5-axis Tricept based machine tool is represented as
Tθθddd 21321q (1)
where 3 ,2 ,1 , idi and 2 ,1 , ii are scalar joint variables controlled by actuators. The description of w orld c oordinates i s b ased on tool path calculated by CAD/CAM systems defined by the set of succ essive tool positions and orientations in the work piece frame {W}, Fig. 2. T he thus calculated tool pat h i s m achine i ndependent an d i s kn own as a cutter location file (CLF). A tool pose is defined by the position vector of the tool tip T in the work piece frame {W} a s TTWTWTWT
W zyxp an d t ool orientation is defined by unit vector of the tool axis as
TTWzTWyTWxTW kkkk . In t he general case, the tool tip po sition vector and tool axis vector in machine reference frame {M} can be expressed as
TWM
WOwMT
MMMTM RZYX ppp
TWM
WT
TzTyTxTM Rkkk kk
(2)
Fig. 2. Geometric model of the Tricept based vertical five-axis machine tool
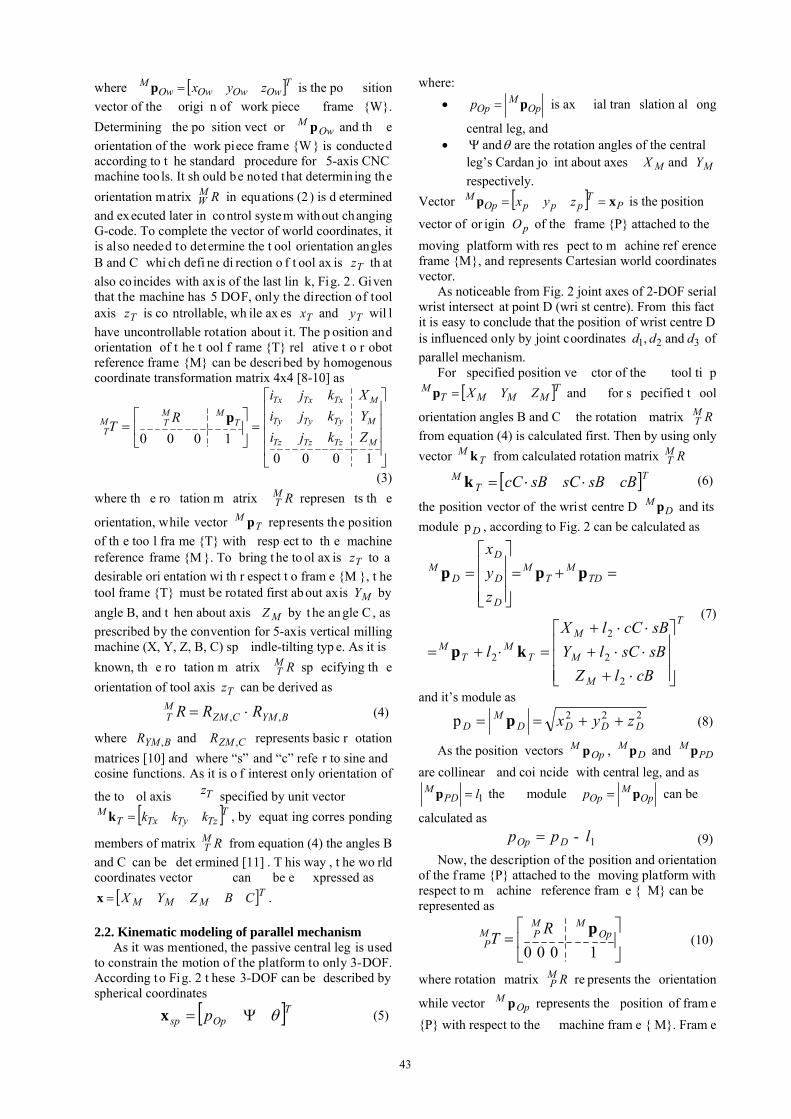
43
where TOwOwOwOwM zyxp is the po sition
vector of the origi n of work piece frame {W}. Determining the po sition vect or Ow
M p and th e orientation of the work piece frame {W} is conducted according to t he standard procedure for 5-axis CNC machine tools. It sh ould be noted that determining the orientation matrix RM
W in equations (2 ) is d etermined and executed later in control system without changing G-code. To complete the vector of world coordinates, it is also needed to determine the t ool orientation angles B and C whi ch defi ne di rection o f t ool ax is Tz th at also co incides with ax is of the last lin k, Fig. 2 . Given that the machine has 5 DOF, only the direction of tool axis Tz is co ntrollable, wh ile ax es Tx and Ty wil l have uncontrollable rotation about it. The p osition and orientation of t he t ool f rame {T} rel ative t o r obot reference frame {M} can be described by homogenous coordinate transformation matrix 4x4 [8-10] as
10001000 MTzTzTz
MTyTyTy
MTxTxTx
TMM
TMT Zkji
Ykji
Xkji
RT
p
(3) where th e ro tation m atrix RM
T represen ts th e
orientation, while vector TM p represents the position
of th e too l fra me {T} with resp ect to th e machine reference frame {M }. To bring t he to ol ax is Tz to a desirable ori entation wi th r espect t o fram e {M }, t he tool frame {T} must be rotated first ab out axis MY by angle B, and t hen about axis MZ by t he an gle C , as prescribed by the convention for 5-axis vertical milling machine (X, Y, Z, B, C) sp indle-tilting typ e. As it is known, th e ro tation m atrix RM
T sp ecifying th e orientation of tool axis Tz can be derived as
BYMCZMMT RRR ,, (4)
where BYMR , and CZMR , represents basic r otation matrices [10] and where “s” and “c” refe r to sine and cosine functions. As it is o f interest only orientation of
the to ol axis Tz specified by unit vector TTzTyTxT
M kkkk , by equat ing corres ponding
members of matrix RMT from equation (4) the angles B
and C can be det ermined [11] . T his way , t he wo rld coordinates vector can be e xpressed as
TMMM CBZYXx . 2.2. Kinematic modeling of parallel mechanism As it was mentioned, the passive central leg is used to constrain the motion of the platform to only 3-DOF. According to Fig. 2 t hese 3-DOF can be described by spherical coordinates
TOpsp p x (5)
where: Op
MOpp p is ax ial tran slation al ong
central leg, and and are the rotation angles of the central
leg’s Cardan jo int about axes MX and MY respectively.
Vector PT
pppOpM zyx xp is the position
vector of or igin pO of the frame {P} attached to the moving platform with res pect to m achine ref erence frame {M}, and represents Cartesian world coordinates vector. As noticeable from Fig. 2 joint axes of 2-DOF serial wrist intersect at point D (wri st centre). From this fact it is easy to conclude that the position of wrist centre D is influenced only by joint coordinates 321 and , ddd of parallel mechanism. For specified position ve ctor of the tool ti p
TMMMTM ZYXp and for s pecified t ool
orientation angles B and C the rotation matrix RMT
from equation (4) is calculated first. Then by using only vector T
M k from calculated rotation matrix RMT
TTM cBsBsCsBcC k (6)
the position vector of the wrist centre D DM p and its
module Dp , according to Fig. 2 can be calculated as
T
M
M
M
TM
TM
TDM
TM
D
D
D
DM
cBlZ
sBsClY
sBcClX
l
z
y
x
2
2
2
2 kp
ppp
(7)
and it’s module as 222p DDDD
MD zyx p (8)
As the position vectors OpM p , D
M p and PDM p
are collinear and coi ncide with central leg, and as
1lPDM p the module Op
MOpp p can be
calculated as
1 l-pp DOp (9) Now, the description of the position and orientation of the f rame {P} attached to the moving platform with respect to m achine reference fram e { M} can be represented as
1000
RT Op
MMPM
Pp
(10)
where rotation matrix RMP re presents the orientation
while vector OpM p represents the position of fram e
{P} with respect to the machine fram e { M}. Fram e
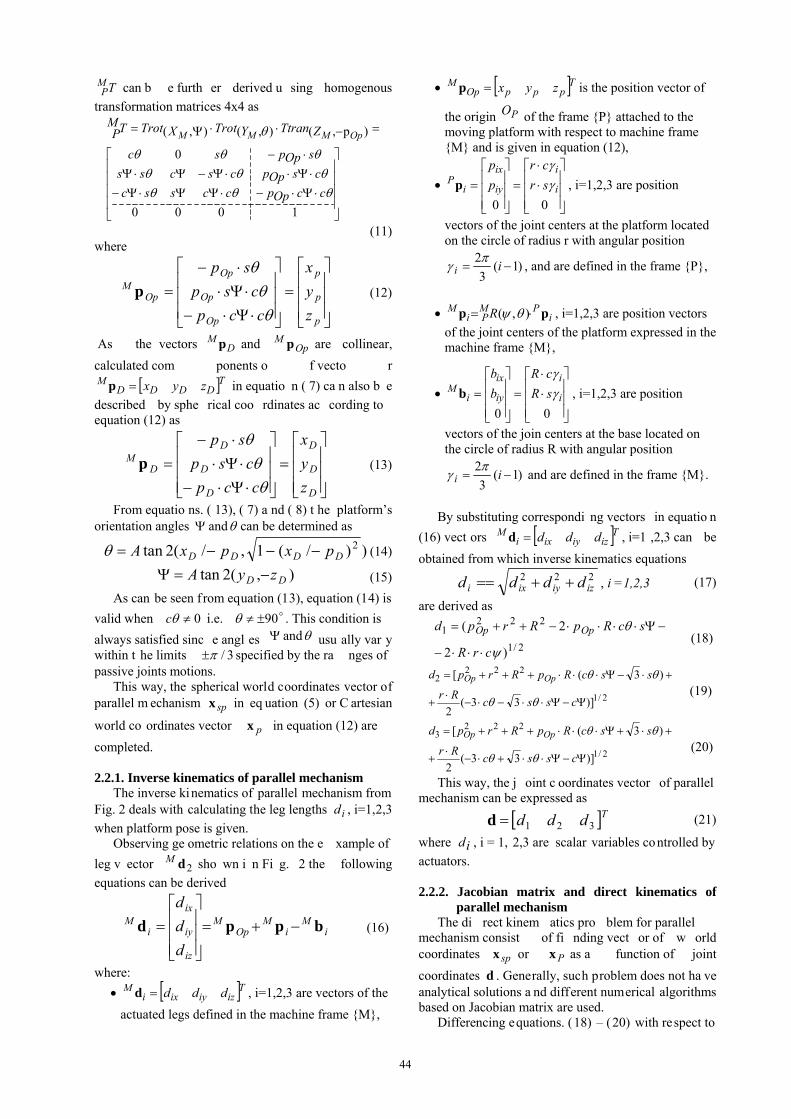
44
TMP can b e furth er derived u sing homogenous
transformation matrices 4x4 as
1000
0
)p,(),(),(
ccOppccssc
csOppcscss
sOppsc
ZTtranYTrotXTrotTMP OpMMM
(11) where
p
p
p
Op
Op
Op
OpM
z
y
x
ccp
csp
sp
p (12)
As the vectors DM p and Op
M p are collinear, calculated com ponents o f vecto r
TDDDDM zyxp in equatio n ( 7) ca n also b e described by sphe rical coo rdinates ac cording to equation (12) as
D
D
D
D
D
D
DM
z
y
x
ccp
csp
sp
p (13)
From equatio ns. ( 13), ( 7) a nd ( 8) t he platform’s orientation angles and can be determined as
))/(1,/(2tan 2DDDD pxpxA (14)
),(2tan DD zyA (15) As can be seen f rom equation (13), equation (14) is valid when 0c i.e. 90 . This condition is always satisfied sinc e angl es and usu ally var y within t he limits 3/ specified by the ra nges of passive joints motions. This way, the spherical world coordinates vector of parallel m echanism spx in eq uation (5) or C artesian
world co ordinates vector px in equation (12) are completed. 2.2.1. Inverse kinematics of parallel mechanism The inverse kinematics of parallel mechanism from Fig. 2 deals with calculating the leg lengths id , i=1,2,3 when platform pose is given. Observing ge ometric relations on the e xample of leg v ector 2dM sho wn i n Fi g. 2 the following equations can be derived
iM
iM
OpM
iz
iy
ix
iM
d
d
d
bppd
(16)
where: Tiziyixi
M dddd , i=1,2,3 are vectors of the actuated legs defined in the machine frame {M},
TpppOpM zyxp is the position vector of
the origin PO of the frame {P} attached to the moving platform with respect to machine frame {M} and is given in equation (12),
00i
i
iy
ix
iP sr
cr
p
p
p , i=1,2,3 are position
vectors of the joint centers at the platform located on the circle of radius r with angular position
)1(3
2 ii
, and are defined in the frame {P},
i
PMPi
M R pp ),( , i=1,2,3 are position vectors of the joint centers of the platform expressed in the machine frame {M},
00i
i
iy
ix
iM sR
cR
b
b
b , i=1,2,3 are position
vectors of the join centers at the base located on the circle of radius R with angular position
)1(3
2 ii
and are defined in the frame {M}.
By substituting correspondi ng vectors in equatio n (16) vect ors Tiziyixi
M dddd , i=1 ,2,3 can be obtained from which inverse kinematics equations
222iziyixi dddd , i =1,2,3 (17)
are derived as
2/1
2221
)2
2(
crR
scRpRrpd OpOp
(18)
2/1
2222
)]33(2
)3([
csscRr
sscRpRrpd OpOp
(19)
2/1
2223
)]33(2
)3([
csscRr
sscRpRrpd OpOp
(20)
This way, the j oint c oordinates vector of parallel mechanism can be expressed as
Tddd 321d (21)
where id , i = 1, 2,3 are scalar variables controlled by actuators. 2.2.2. Jacobian matrix and direct kinematics of
parallel mechanism The di rect kinem atics pro blem for parallel mechanism consist of fi nding vect or of w orld coordinates spx or Px as a function of joint coordinates d . Generally, such problem does not ha ve analytical solutions a nd different numerical algorithms based on Jacobian matrix are used. Differencing equations. (18) – (20) with respect to

45
the time the Jacobian matrix is obtained as
333231
232221
131211
333
222
111
JJJ
JJJ
JJJ
dd
p
d
dd
p
d
dd
p
d
J
Op
Op
Op
(22)
where: 111 /)( dscRpJ Op
221 2/)]3(2[ dsscRpJ Op
331 2/)]3(2[ dsscRpJ Op
112 /)( dsRrccRpJ Op
222 2/]2/)3([ dcssRrccRpJ Op
332 2/]2/)3([ dcssRrccRpJ Op
113 / dssRpJ Op
2
23
2/]2/)33(
)3([
dscsRr
cssRpJ Op
3
33
2/]2/)33(
)3([
dscsRr
cssRpJ Op
This so called analytical Jacobian m atrix [12] relates the spherical velocity vector spx to the j oint
velocity vector d and is use d in this pa per as a basis for sim ple numerical algorithm to solve direct kinematics for the purpose of simulation. The algorithm is based on constant Jacobian matrix calculated for the centre of workspace i.e. for the initial position [13]. At step (n+1), the estimated position of the platform is given by
)(),( 001
1 nspspnspn J dddxxx (23)
where: TnnOpnspn p 1111 x is the estimated
position of the platform at the step n+1, TnnOpnspn p x is the estimated position
of the platform at the step n, T
nnnn ddd ][ 321d joint position (leg lengths) corresponding to the estimated platform position at the step n, result of the inverse kinematics of point
spnx ,
),( 001 dx spJ is the inverse Jacobian matrix for
the initial platform position 0spx and joint position
0d as the result of inverse kinematics of point
0spx . For the p urpose of sim ulation, t his al gorithm converge in 1 to 5 steps dep ending on th e distance
between the initial position and actual position. This comes from the large workspace at the parallel mechanism on one hand a nd the othe r ha nd f rom the high accuracy provided by position sensors. The direct kinematics model takes almost twice as m uch time as the inverse model. 3. WORKSPACE ANALYSIS Beside the selection appropriate kinematic topology the most important step i n the parallel m achine design is to select the right geometric dimensions [12]. Based on i nverse ki nematics, it is possible to determine the position and orientation workspace of the Tricept base d five-axis m illing m achine. The applied approach proved to be very useful and is b ased on the definition of position and orientation workspace for parallel kinematic chains [14]. In the case of the Tricep t based five axis machine tool co nsidered in this paper, t he p osition a nd orientation workspace are given by
}1,0{),,,,( CBZYXW MMMS (24) which re presents a B oolean fu nction w hose value is equal to 1 if the tool pose-defined b y the quintet
),,,,( CBZYX MMM is reachable w ithout exce eding the limited motion range of the joints. Starting from the selected point in the work space volume, the esti mation is made by specific step-by- step strategy that locates tool in a given pose in the wor kspace and that determines whether the pose is reacha ble or not by taking into account a li mited motion range of the joints [6]. Based on selected design parameters: R = 350mm, r=100mm, l 1=300mm, l 2=150mm, d min=934mm, dmax=1520mm the determined workspace for three -axis machining ( 0,0 CB , i.e., spindle axis i s perpendicular to the MMYX plane) is shown in Fig. 3.
Fig. 3. Workspace in the case of three-axis machining
(B=0, C=0) For programmers and operators familiar with CNC machine tools, the determ ined workspac e can be reduced to the parallelepiped “a” as indicated in Fig. 4. As it is kn own from practice, ado pted po rtion of workspace in the form of parallelepiped “ a” can be
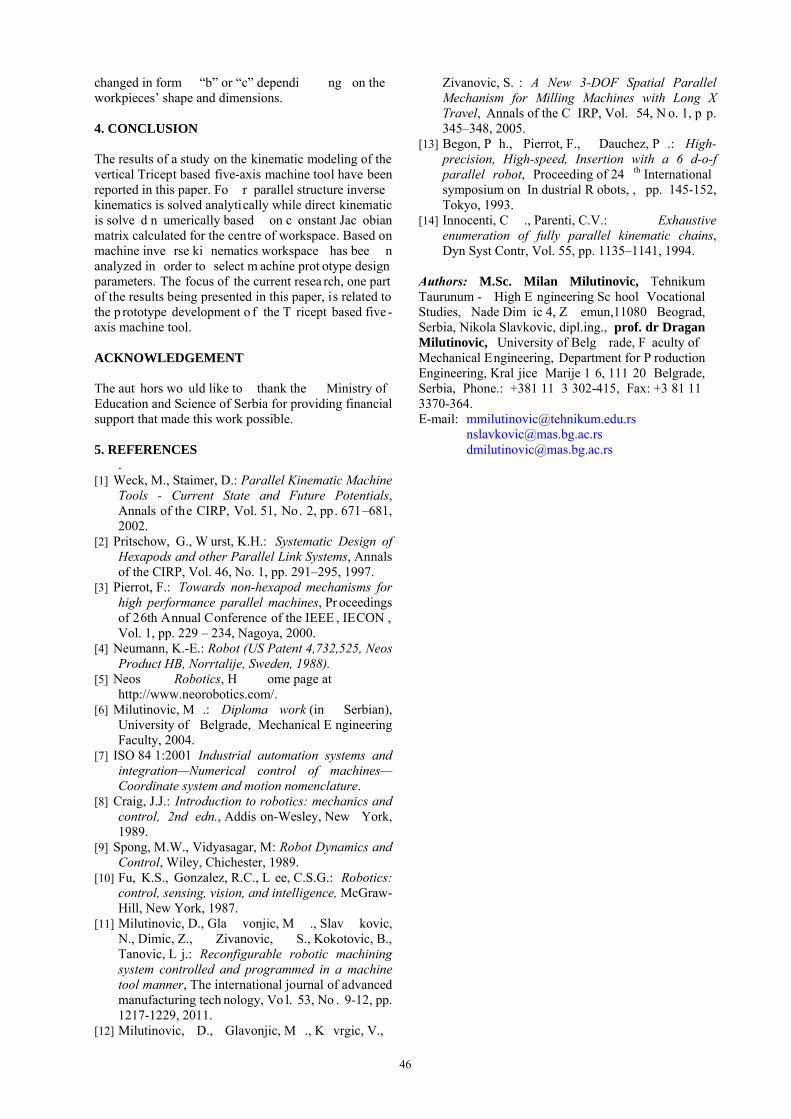
46
changed in form “b” or “c” dependi ng on the workpieces’ shape and dimensions. 4. CONCLUSION The results of a study on the kinematic modeling of the vertical Tricept based five-axis machine tool have been reported in this paper. Fo r parallel structure inverse kinematics is solved analytically while direct kinematic is solve d n umerically based on c onstant Jac obian matrix calculated for the centre of workspace. Based on machine inve rse ki nematics workspace has bee n analyzed in order to select m achine prot otype design parameters. The focus of the current resea rch, one part of the results being presented in this paper, is related to the p rototype development o f the T ricept based five -axis machine tool. ACKNOWLEDGEMENT The aut hors wo uld like to thank the Ministry of Education and Science of Serbia for providing financial support that made this work possible. 5. REFERENCES
. [1] Weck, M., Staimer, D.: Parallel Kinematic Machine
Tools - Current State and Future Potentials, Annals of the CIRP, Vol. 51, No. 2, pp. 671–681, 2002.
[2] Pritschow, G., W urst, K.H.: Systematic Design of Hexapods and other Parallel Link Systems, Annals of the CIRP, Vol. 46, No. 1, pp. 291–295, 1997.
[3] Pierrot, F.: Towards non-hexapod mechanisms for high performance parallel machines, Pr oceedings of 26th Annual Conference of the IEEE , IECON , Vol. 1, pp. 229 – 234, Nagoya, 2000.
[4] Neumann, K.-E.: Robot (US Patent 4,732,525, Neos Product HB, Norrtalije, Sweden, 1988).
[5] Neos Robotics, H ome page at http://www.neorobotics.com/.
[6] Milutinovic, M .: Diploma work (in Serbian), University of Belgrade, Mechanical E ngineering Faculty, 2004.
[7] ISO 84 1:2001 Industrial automation systems and integration—Numerical control of machines—Coordinate system and motion nomenclature.
[8] Craig, J.J.: Introduction to robotics: mechanics and control, 2nd edn., Addis on-Wesley, New York, 1989.
[9] Spong, M.W., Vidyasagar, M: Robot Dynamics and Control, Wiley, Chichester, 1989.
[10] Fu, K.S., Gonzalez, R.C., L ee, C.S.G.: Robotics: control, sensing, vision, and intelligence, McGraw-Hill, New York, 1987.
[11] Milutinovic, D., Gla vonjic, M ., Slav kovic, N., Dimic, Z., Zivanovic, S., Kokotovic, B., Tanovic, L j.: Reconfigurable robotic machining system controlled and programmed in a machine tool manner, The international journal of advanced manufacturing tech nology, Vo l. 53, No . 9-12, pp. 1217-1229, 2011.
[12] Milutinovic, D., Glavonjic, M ., K vrgic, V.,
Zivanovic, S. : A New 3-DOF Spatial Parallel Mechanism for Milling Machines with Long X Travel, Annals of the C IRP, Vol. 54, N o. 1, p p. 345–348, 2005.
[13] Begon, P h., Pierrot, F., Dauchez, P .: High-precision, High-speed, Insertion with a 6 d-o-f parallel robot, Proceeding of 24 th International symposium on In dustrial R obots, , pp. 145-152, Tokyo, 1993.
[14] Innocenti, C ., Parenti, C.V.: Exhaustive enumeration of fully parallel kinematic chains, Dyn Syst Contr, Vol. 55, pp. 1135–1141, 1994.
Authors: M.Sc. Milan Milutinovic, Tehnikum Taurunum - High E ngineering Sc hool Vocational Studies, Nade Dim ic 4, Z emun,11080 Beograd, Serbia, Nikola Slavkovic, dipl.ing., prof. dr Dragan Milutinovic, University of Belg rade, F aculty of Mechanical Engineering, Department for P roduction Engineering, Kral jice Marije 1 6, 111 20 Belgrade, Serbia, Phone.: +381 11 3 302-415, Fax: +3 81 11 3370-364. E-mail: [email protected] [email protected] [email protected]
47
Original Scientific Paper
Šooš, Ľ., Križan, P., Matúš, M.
OPTIMIZATION OF THE SPINDLE-BEARING SYSTEM Received: 02 May 2012 / Accepted: 28 June 2012
Abstract: The quality of machine tools is critical in determining their productivity and the accuracy of the finished work piece. The headstock of the machine tool has the greatest impact on these parameters. The tool or work-piece holder must meet specific demands for maximum speed and rigidity. These two parameters are variable, but always in contradiction, and depend mainly on the Spindle-Bearings System (SBS). In this context, SBS are increasingly being produced in combination with roller bearings, and with various combinations of radial ball bearings with angular contact. This is mainly because the radial ball bearings allow groupings of different combinations to achieve the optimal compromise between the required maximum speed and the desired stiffness of the SBS. Stiffness, especially in ball bearings, is not constant but dependent on the magnitude of the load. The SBS is a statically indeterminate system, and an accurate calculation of the bearings and its nodes, as well as the whole system, is only possible using iterative methods. Maximal speed and rigidity depend of maximal temperature and of stiffness SBS. Selection of the optimal configuration is achieved by analyzing a number of potential, alternative SBS solutions. Depend on arrangement radial ball bearings with angular contact in bearings nodes is changing preload in bearings and temperature. It has very big influence to maximal speed and rigidity bearings nodes. The paper presents original procedures for simplified bearing node calculations in relation to temperature. Keywords: ball bearings with angular contact, bearing nodes, spindle bearing system (SBS) machine tool spindle, stiffness, high speed, temperature optimization of SBS. Optimizacija sistema ležajeva glavnog vretena. Kvalitet mašina alatki je ključan faktor u određivanju njihove proizvodnosti i tačnosti obrađenog predmeta. Nosač glavnog vretena ima najveći uticaj na ove parametre. Alat ili nosač radnog predmeta mora ispunjavati određene zahteve za maksimalnu brzinu i krutost. Ova dva parametra su promenljiva ali uvek u protivrečnosti i zavise prevashodno od Sistema Ležajeva Glavnog Vretena (SBS). Zbog ove činjenice SBS se sve više proizvode kao kombinacija valjčastih ležajeva i kugličnih ležajeva sa kosim dodirom. Ovo se radi prevashodno zbog činjenice da kuglični ležajevi dozvoljavaju grupisanje u raznim varijantama sa ciljem postizanja optimalnog kompromisa između zahtevane maksimalne brzine i krutosti SBS. Krutost, pogotovo kod kugličnih ležajeva, nije konstanta već zavisi od veličine opterećenja. SBS je statistički neodređen sistem a tačni proračuni ležajeva i njihovih čvorova, kao i celog sistema, je moguće samo uz pomoć iterativnih metoda. Maksimalna brzina i krutost zavise od maksimalne temperature i krutosti SBS. Izbor optimalne izvedbe se postiže analizom raznih potencijalnih, alternativnih mogućih rešenja. U zavisnosti od izvedbe kugličnih ležajeva sa kosim dodirom u čvorovima menja se i prednaprezanje u ležajevima kao i temperatura. Ovo ima veliki uticaj na maksimalnu brzinu i krutost čvorova ležajeva. Ovaj rad predstavlja originalnu proceduru za pojednostavljenje proračun čvorova u zavsinosti od temperature. Ključne reči:kuglični ležajevi sa kosim dodirom, ležajni čvorovi, Sistem Ležajeva Glavnog Vretena (SBS), vreteno mašina alatki, krutost, visoka brzina, temperaturska optimizacija SBS 1. INTRODUCTION The number of headstocks supported on ball bearings with angular contact is increasing proportionally with the increasing demands on the quality of the machine tool [1]. This is because these bearings can be arranged in various combinations to create bearing arrangements which can enable the reduction of both radial and axial loads. The possibility of varying the number of bearings, their preload value, dimensions and the contact angle of bearings used in the bearing nodes, creates a broad spectrum of combinations which enable us to achieve the adequate stiffness and high speed capabilities of the Spindle-Bearings System (SBS) [2], [3]. Adequate revolving speed and stiffness of the headstock are necessary conditions for meeting the manufacturing precision
quality and machine tool productivity required by industry. 1.1 Stiffness The total static stiffness of machine tools is create as a serial spring arrangement all parts of machine tools and it is evident that the resulting stiffness machine tool is limited by the stiffness of the weakest part - Spindle-Bearings System. Amongst all the elements, the Spindle-Bearings System of the machine tool plays the most important role [4].
From results of structural analyses, the headstock can be considered as the heart of the whole machine tool. The design and quality of the machine tool must respect the quality of the drives and their features. The headstock (as tool, or work-piece carrier), has a direct influence on the static and dynamic properties of the
48
cutting process. The Spindle-Bearing System‘s stiffness also influences the final surface quality, profile, and dimensional accuracy of the work-piece. The headstock stiffness must be calculated according to the deflection at the front end of the spindle, because the deflection at this point directly affects the precision of the finished product [5]. The deflection at the spindle front end is the accumulation of various other, more or less important, partial distortions. The radial headstock stiffness can be calculated as follows:
rc
rrc y
FK (1)
Resulting static distortion of the front-end spindle equals yrc = y0 + yl + yt + ya + yv+ ysb + yh (2) and depend from:
y0 - deflection of the spindle from bending moments yl - bearing compliance yt - spindle deflection by transversal forces ya - axial forces yv - deflection of the headstock box ysb - stiffening effect of bearings yh - drive forces
Our experience has shown that whatever mathematical method and software is used, the spindle distortion caused by bending moments y0 and by bearing compliances yl have the greatest influence on the resulting front end spindle distortion, [6]. Then yrc = y0 + yl (3) where the distortion caused by bending moments is as follows:
La
ro J
L
J
a
E
aFy
3
2 (4)
and the deflection caused by bearing compliance is as follows:
AB
rl K
aL
K
a
L
Fy
22
2 (5)
The resulting static distortion of the spindle front-end can be explicitly described by a multi-parametrical equation in the form of: yF = f [E, Fr, a, L, Ja,, (Da, da) JL (DL, dL), KA, KB, ρ] (6) and depend from: - spindle material and dimensions (E, Da, da, DL, dL) - loading forces position, orientation and magnitude
(Fr, N, rF, b)
- bearing arrangement configuration and stiffness (KA, KB,)
- spindle and bearing arrangement space configuration (L, a)
- spindle box construction (k, ρ)
1.2 Speed The productivity of a machine tool can be increased in at least two different ways:
a. Externally - by shortening working time - within a working cycle b. Internally - by reducing machining times (increasing the cutting width) - technological issues
The philosophy of intelligent manufacturing systems applied to production processes minimise lost time [7]. Further reducing lost time is expensive and has limited effectiveness at current levels of technological development. It has been shown that increased productivity can be achieved for example by changing the cutting speed. However this has a direct effect on tool life and on the dynamic stability of the cutting process. The cutting speeds in machining processes depend on the technology applied, the cutting tool, and the work-piece material [8]. The cutting speed also relates directly to the high-speed capability, and average diameter, of the bearings, the so-called factor N = nmax.dmid. (7) Thus, from the point of view of the required cutting speed, the most important factor is the revolving frequency capacity of a spindle which is supported on a bearing system. The calculation of the headstock’s maximum revolving speed is relatively simple. The highest revolving speed of a bearing node is calculated on the basis of the highest revolving speed of one bearing, multiplied by various coefficients reflecting the influence on the bearings, the bearing arrangement, bearing precision, their preloaded value, and lubrication and cooling conditions. 2. ARRANGEMENTS OF NODAL POINTS
The number of spindle bearing systems supported on ball bearings with angular contact increases proportionally with increasing demand on the machine tool. Usually, radial ball bearings with angular contact arrangements in their nodal points contain 2, 3 or more bearings [9]. By varying the bearings and their arrangement in the bearing nodes (DB, DF, DT, TBT,TTF, QBC, ..), the value of the contact angle, magnitude of preload, and type of flanges can be optimized to suit the required, resulting stiffness and speed-capability of the spindle-bearing system.
2.1 Criteria for selecting the arrangement of bearings
Spindle mountings using only radial bevelled bearings, (table 1), [10] can be divided into 2 basic types: spindles mounted on bearing nodes with
“directionally” arranged bearings, with equal orientation of contact angles in each nodal point, “1”, “2”, “3”, and “7” scheme in table 1.
spindles mounted on nodal points with bearings arranged according to shape “4”, “5”, “6” scheme in table 1. Bearings are arranged in “O” or (X) shape, in combination with “T”.
A typical feature of the nodes of spindle bearings is the application of pre-load, which provides the stiffness of the nodal point and reduces any skidding of the rollers at high revolutions. Pre-load can be achieved through three flange design principles:

49
a) Sprung flange: thermal expansion (dilatation) is eliminated by changing the length of the elastic materials positioned between the flange and the bearings, which ensures minimum change in the pre-stress value.
b) Stiff (Rigid) flange: provided by a fixing nut or casing. This design provides better stiffness characteristics. The pre-load value is changed due to the influence of thermal dilatation.
c) Controllable flange: axially adjustable (by means of hydraulics), which ensures the required pre-load for different operational conditions.
The highest values of the coefficient “N” can be achieved by using spindles mounted on nodes with a “directional” arrangement of bearings, “1”, “2” and “3”. When used in conjunction with the controllable flange, the correct types of lubrication and cooling, speeds which are comparable with the maximum revolutions of the bearings themselves can be achieved. Thus they can be applied in high-speed machining [10]. These mounting types, in combination with the sprung support, are mostly used for grinding. For difficult technological operations requiring considerably higher stiffness in the radial and axial directions, nodal points with bearings arranged
according to shape “4” and “6”, together with fixed supports are typical. There is negligible use of hybrids of the basic types of mounting (mounting “5”), as shown in table 1. In such cases one nodal point has bearings arranged according to shape, while the other has directionally arranged bearings. The pre-stressing in the front nodal point is ensured by a stiff flange and in the rear nodal point by a sprung flange.
3. OPTIMIZATION OF THE SPINDLE-BEARING SYSTEM IN RELATION TO TEMPERATURE
In addition to the bearing arrangements, the temperature properties of the bearing supporting node have an increasingly greater significance on the high-speed capability of the bearing [11]. The main goal of this section is to show the SBS design under real operating conditions, taking into consideration the temperature-related behaviour of the spindle and bearing nodes. The value of the changes in SBS temperature depends on the temperature gradient, the type of bearing arrangement (DB, DF, DT, …), the contact angle of the bearing, and the distance between the bearings arranged in the node.
CONFIGURATION Seq. No. Rear bearing
node Forward bearing
node
N= nmax.dmid. 106
[mm.min-1] Characteristic Use
1.
T1=1, t2=0 t1=0, t2=1
1,2 -2,5 - single direction of rotation - light axial and radial loads
- grinding internal holes
2.
T1=1, t2=0 t1=0, t2=2
0,8 – 1,6 - suitable for extremely short spindles - medium axial loads
- finishing machines - drilling of deep holes
3.
T1=2, t2=0 t1=0, t2=2
0,8 -1,4 - medium radial loads - very common method of use
- grinding internal holes - milling - drilling
4.
T1=1, t2=1 t1=1, t2=1
0,6 – 1 - machining light metals - medium radial loads
- grinding - precision drilling - turning/ lathe
5.
T1=1, t2=0 t1=1, t2=2
0,5 – 0,9 - medium axial loads - drilling of deep holes - milling
6.
T1=1, t2=1 t1=1, t2=2
0,4 – 0,9 - medium axial loads - very common method of use
- turning/ lathe - drilling
7.
T1=2, t2=0 t1=0, t2=3
0,3 – 0,6 - high axial loads medium radial loads
- milling - boring
Table 1. Type of SBS using radial ball bearings with angular contact [10]

50
The analysis identified the optimal stiffness, which was then applied to the headstock of the DB 24 fy. Ex-Cell-O GmbH., Eislinger precision boring machine, Fig. 1, [8]. The stiffness of the given example was analysed using the application software “Spindle Headstock” [3], developed in our department.
Fig. 1. The Headstock of the precision boring machine
DB 24 fy. Ex-Cell-O GmbH., Eislinger, [8] 3.1 The optimisation of shs with regard to
temperature The temperature dilatation of the spindle can be described by the equation:
L L tt . . (8)
If the distance between the bearings in the DB arrangement is short (Figure 3a), the dilatations in radial direction is greater, [8]. The temperature gradient causes the dilatation of the inner bearing rings to be greater than that of the outer rings. Consequently, the original preload increase in temperature will be higher in the bearing node. The elevated temperature will influence the temperature gradient, and the preload value could cause bearing node failure. The optimal bearing separation distance from the point of view of temperature can be deduced from:
sin
1.
.2.
sin
cos. 00
AI
AImmopt tt
tttlDB
(9)
Figure 2 shows the change of optimal bearing distance at various values of the temperature gradient for the analysed SBS, Figure 1. 3.2 Recommendations for improvements in
construction The recommendations from the point of view of temperature optimisation for the DB 24 SHS boring machine are based on the results of the analysis undertaken. From the perspective of temperature, it can be seen that a change in bearing node arrangement to individual spindle supports from DB to DT would be advantageous, Fig. 3. 4. OPTIMIZATION SBS
The application software is used for calculating the
SBS of machine tools supported on rolling bearings. The programme enables us to determine all elements and calculate the properties of the spindles and shafts which are supported on rolling bearings. The application software enables very fast and user-friendly calculation of the radial spindle stiffness in the bearing arrangement in a bearing unit.
The architecture of the programme contains a
number of mathematical formulae which have been experimentally verified. These models respect the conditions of the spindle working accuracy in terms of the external load cutting forces, driving forces, and also spindle rotation speed. The basic interactive programme offers: 1. the ability to input user-determined conditions for
the calculation and optimisation of the spindle fitting system;
2. the ability to select the most appropriate bearing or bearing node arrangements (Figure 4). Data about selected bearings can be ganed from extensive databases according to the users requirements within the bearing inner diameter range:
3. the identification and selection of the standardized spindle nose for turning, milling, grinding and boring;
4. the choice of the design parameters and spindle suitability for different working conditions (working accuracy, preloading, flange type, lubrication system, cooling), Figure 5;
5. the calculation and optimisation of the cutting parameters for the required material to be machined (cutting force, torque, feed , power), Figure 6;
6. Calculation and optimization of the design and fitment with regard to the applied conditions (revolving speed, radial stiffness, axial stiffness, rating life ) for the bearing units and the fitting as a whole, for all of the identified bearing types.
Results for spindle with arrangement DT - B - DT. Rear support Front support Bearings - type. 2pc.[B7016CTB] 2pc.[B7016CTB] - arrangement: << >> - grade: P4 P4 Preload: Light Light Flange: Fixed flange Fixed flange
Max. speed (min-1): Znmax=5 256 Pnmax=5 256 Pre-load (N): ZFp = 404 PFp = 402 N Reactions (N): RA = 205 RB = 1 205
Radial stiffness (Nmm-1): KrA = 530 630 KrB = 483 969
Axial stiffness(Nmm-1): KaA = 141 436 KaA = 141 436 Durability (hours): TrvZ = 2 753 228 TrvP = 829 951 Bearings distance (mm): L = 297 Total displacement at the end (mm): yr(L+a) = 0.00436617
Total stiffness (Nmm-1): Krc = 229 033 Optimal values Optimal bearings length (mm): Lopt = 317.2 Optimal displacement at the end LOpt (mm): yrmin = 0.00436088
Optimal stiffness(Nmm-1): Krcopt = 229 311

51
0
50
100
150
200
250
300
350
400
2 3 4 5 6 7 8 9 10 11 12 13 14 15 16 17 18 19 20
5
10
15
20
25
30
35
40
0
Bm (mm) Fp (N)
t ( st C)
t )Bm =f (
Fp =f ( t), Bm =27mm
tI = 70 stC, to= 20 stC
tA = tI -
Bearings B 7016 CTB
t
Bearings arrang.: O
Fig. 2. The inter - dependence of bearing preload change, ideal distance between bearings and change of temperature in the bearings arrangement system.
Fig. 3. Model of the spindle
Fig. 4. Changing data of the bearings mounting
Fig. 5. Entering preliminary data for the bearings conditions
0
0,001
0,002
0,003
0,004
0,005
0,006
0,007
0 50 100 150 200 250 300 350
L (mm)
y (m
m)
yC
yL
yO
yF
Fig. 6. Graphical output of the dependence of partial deflection on bearing node distance

52
In comparison with the original bearing node arrangement, the radial stiffness of the rearranged spindle-bearing system will drop slightly, but its axial stiffness will increase. The advantage of the reconfigured SBS is that at real mean values of temperature gradient, the SBS stiffness will be almost fixed. NOMENCLATURE N - high-speed ability E - modulus of elasticity of the material J – quadratic moments of inertia i – number of bearings α – contact angle D, d – diameter n – high spindle revolutions L- distance between bearings nodes a- spindle front-end K - stiffness R- reactions y - deflection INDEXES a- axial direction r – radial direction 5. REFERENCES
[1] Weck, M., - Hennes, N. - Krell, M.: Spindlel and
Toolsystems with High Damping. In: Cirp Annals-manufacturing Technology - CIRP ANN-MANUF. TECHNOL , vol. 48, no. 1, pp. 297-302, 1999.
[2] Marek, J a kol.: Konstrukce CNC obráběcích strojú. MM Publisching, s.r.o., Praha 2010, ISBN 978-80_254-7980-3, 419 s p.
[3] Lee, D. - Sin, H. - Sun, N.: Manufacturing of a Graphite Epoxy Composite Spindle for a Machine Tool. CIRP, , 34, number 1, pp. 365 -369.
[4] Šooš, Ľ.: Quality of design engineering: Case of machine tools headstock.In: Quality Festival 2008 : 2nd International quality conference. - Kragujevac, May 13-15, 2008. Kragujevac: University in Kragujevac, ISBN 978-86-86663-25-2.
[5] Šooš, Ľ. : Contribution to the research of static and dynamic properties of CNC turning machine In: Strojnícky časopis = Journal of Mechanical engineering. ISSN 0039-2472. - Roč. 59, č. 5-6 (2008), pp. 231-239
[6] Šooš, Ľ. : Approximate methodology calculations of stiffness nodal points. In: World Academy of Science, Engineering and Technology. - ISSN 2010-376X. - Year 7, Issue 80, pp. 1390-1395.
[7] Šooš, Ľ.: Radial stiffness of nodal points of a spindle. In: MATAR Praha 2008. Part 2: Testing, technology: Proceedings of international congresss. - Prague 16th-17th September, Brno 18th September 2008. - Praha: České vysoké učení technické v Praze - ISBN 978-80-904077-0-1. - pp. 43-47.
[8] Kovac, P., Mankova, I., Gostimirovic, M., Sekulic, M., Savkovic, B.: A review of machining
monitoring systems, Journal of Production Engineering, 14, pp. 1-6, 2011.
[9] Šooš, Ľ.: Spindle - housing system SBL 500 CNC. In: Eksploatacja i Niezawodnošč = Maintenance and reliability. - ISSN 1507-2711. - Č. 2 (2008), pp. 53-56.
[10] Šooš, Ľ. New methodology calculations of radial stiffness nodal points spindle machine tool. In: International symposium on Advanced Engineering & Applied Management - 40th Anniversary in Higher Education : Romania /Hunedoara/ 4-5 November, 2010. - Hunedoara: Faculty of Engineering Hunedoara, 2010. - ISBN 978-973-0-09340-7. - III-99 - III-104.
[11] Balmont, V.B. - Russkich,S.P.: Rasčet radialnoj žestkosti radialno - upornogo podšipnika. Trudy instituta. M., Specinformcentr VNIPPa, 69, 1978, č.1, s..pp. 93 - 107.
6. ACKNOWLEDGMENT As shown calculation maximal speed and rigidity bearings depend on arrangement radial ball bearings with angular contact in bearings nodes. Depend arrangement radial bearing in nodes change preload and temperature in bearings. It has very big influence to maximal speed and rigidity for all SBS. The applied software technology has been used in the industry to improve the working accuracy of the machine tools made by TOS Trenčín-Slovakia, for SN and SPSI type lathes, (2), and to design the boring headstocks for the modular single-purpose machine tools made by TOS Kuřim-Czechoslovakia, (5) TOS Lipník, SKF, GMN and INA Skalica. The programme is very effective and reliable and t comparison of the results between experiments and calculations show good correlation, never exceeding 10 %. Authors: Prof. Ľubomír Šooš, PhD. MSc. Peter Križan, PhD., MSc. Miloš Matúš, Slovak University of Technology in Bratislava, Faculty of Mechanical Engineering, ÚSETM, Nám. Slobody 17, 81231 Bratislava, Slovakia, Phone.: +421 2 572 96 537, Fax: +421 2 524 97 809. E-mail: [email protected]
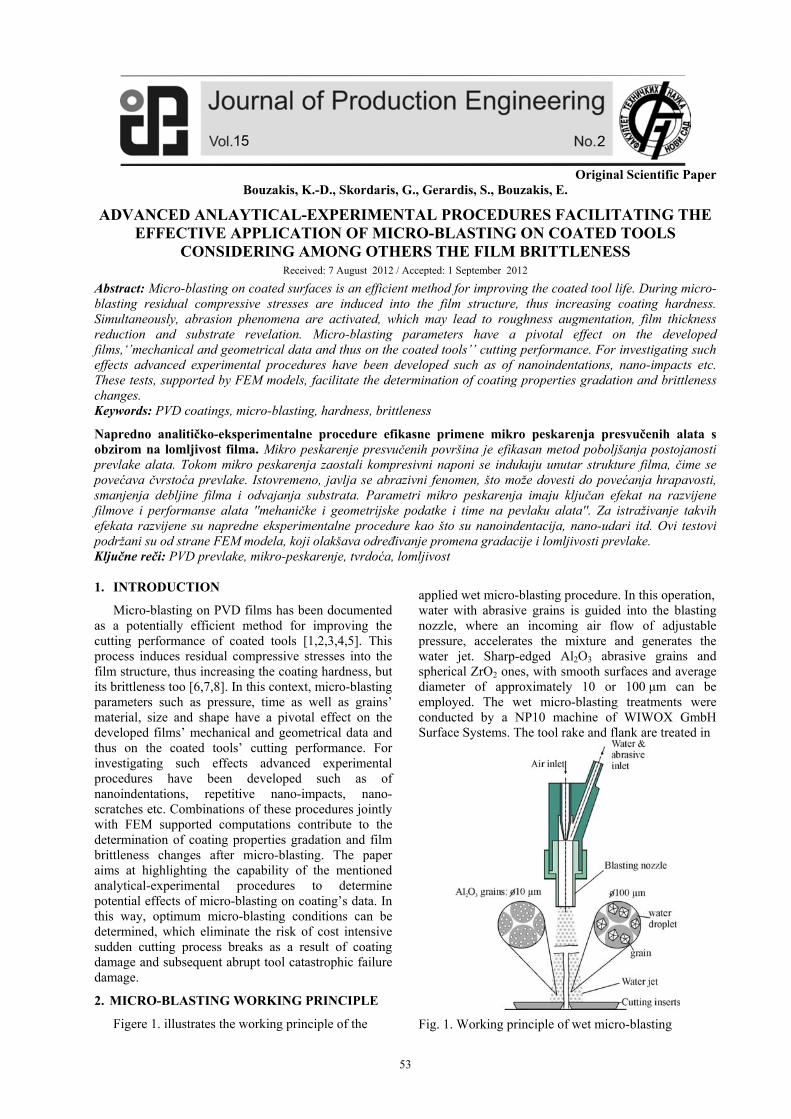
53
Original Scientific Paper
Bouzakis, K.-D., Skordaris, G., Gerardis, S., Bouzakis, E.
ADVANCED ANLAYTICAL-EXPERIMENTAL PROCEDURES FACILITATING THE EFFECTIVE APPLICATION OF MICRO-BLASTING ON COATED TOOLS
CONSIDERING AMONG OTHERS THE FILM BRITTLENESS Received: 7 August 2012 / Accepted: 1 September 2012
Abstract: Micro-blasting on coated surfaces is an efficient method for improving the coated tool life. During micro-blasting residual compressive stresses are induced into the film structure, thus increasing coating hardness. Simultaneously, abrasion phenomena are activated, which may lead to roughness augmentation, film thickness reduction and substrate revelation. Micro-blasting parameters have a pivotal effect on the developed films,‘’mechanical and geometrical data and thus on the coated tools’’ cutting performance. For investigating such effects advanced experimental procedures have been developed such as of nanoindentations, nano-impacts etc. These tests, supported by FEM models, facilitate the determination of coating properties gradation and brittleness changes. Keywords: PVD coatings, micro-blasting, hardness, brittleness
Napredno analitičko-eksperimentalne procedure efikasne primene mikro peskarenja presvučenih alata s obzirom na lomljivost filma. Mikro peskarenje presvučenih površina je efikasan metod poboljšanja postojanosti prevlake alata. Tokom mikro peskarenja zaostali kompresivni naponi se indukuju unutar strukture filma, čime se povećava čvrstoća prevlake. Istovremeno, javlja se abrazivni fenomen, što može dovesti do povećanja hrapavosti, smanjenja debljine filma i odvajanja substrata. Parametri mikro peskarenja imaju ključan efekat na razvijene filmove i performanse alata ''mehaničke i geometrijske podatke i time na pevlaku alata''. Za istraživanje takvih efekata razvijene su napredne eksperimentalne procedure kao što su nanoindentacija, nano-udari itd. Ovi testovi podržani su od strane FEM modela, koji olakšava određivanje promena gradacije i lomljivosti prevlake. Ključne reči: PVD prevlake, mikro-peskarenje, tvrdoća, lomljivost 1. INTRODUCTION
Micro-blasting on PVD films has been documented as a potentially efficient method for improving the cutting performance of coated tools [1,2,3,4,5]. This process induces residual compressive stresses into the film structure, thus increasing the coating hardness, but its brittleness too [6,7,8]. In this context, micro-blasting parameters such as pressure, time as well as grains’ material, size and shape have a pivotal effect on the developed films’ mechanical and geometrical data and thus on the coated tools’ cutting performance. For investigating such effects advanced experimental procedures have been developed such as of nanoindentations, repetitive nano-impacts, nano-scratches etc. Combinations of these procedures jointly with FEM supported computations contribute to the determination of coating properties gradation and film brittleness changes after micro-blasting. The paper aims at highlighting the capability of the mentioned analytical-experimental procedures to determine potential effects of micro-blasting on coating’s data. In this way, optimum micro-blasting conditions can be determined, which eliminate the risk of cost intensive sudden cutting process breaks as a result of coating damage and subsequent abrupt tool catastrophic failure damage.
2. MICRO-BLASTING WORKING PRINCIPLE
Figere 1. illustrates the working principle of the
applied wet micro-blasting procedure. In this operation, water with abrasive grains is guided into the blasting nozzle, where an incoming air flow of adjustable pressure, accelerates the mixture and generates the water jet. Sharp-edged Al2O3 abrasive grains and spherical ZrO2 ones, with smooth surfaces and average diameter of approximately 10 or 100 μm can be employed. The wet micro-blasting treatments were conducted by a NP10 machine of WIWOX GmbH Surface Systems. The tool rake and flank are treated in
Fig. 1. Working principle of wet micro-blasting
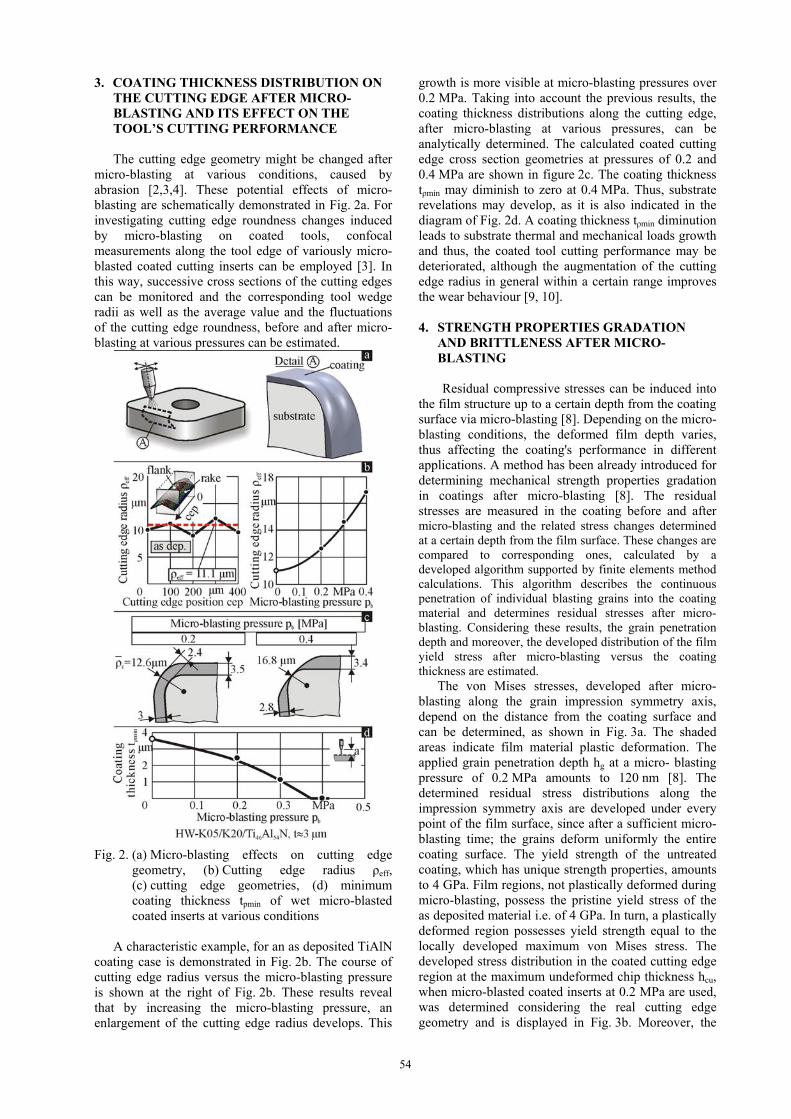
54
3. COATING THICKNESS DISTRIBUTION ON THE CUTTING EDGE AFTER MICRO-BLASTING AND ITS EFFECT ON THE TOOL’S CUTTING PERFORMANCE
The cutting edge geometry might be changed after micro-blasting at various conditions, caused by abrasion [2,3,4]. These potential effects of micro-blasting are schematically demonstrated in Fig. 2a. For investigating cutting edge roundness changes induced by micro-blasting on coated tools, confocal measurements along the tool edge of variously micro- blasted coated cutting inserts can be employed [3]. In this way, successive cross sections of the cutting edges can be monitored and the corresponding tool wedge radii as well as the average value and the fluctuations of the cutting edge roundness, before and after micro-blasting at various pressures can be estimated.
Fig. 2. (a) Micro-blasting effects on cutting edge geometry, (b) Cutting edge radius ρeff, (c) cutting edge geometries, (d) minimum coating thickness tpmin of wet micro-blasted coated inserts at various conditions
A characteristic example, for an as deposited TiAlN coating case is demonstrated in Fig. 2b. The course of cutting edge radius versus the micro-blasting pressure is shown at the right of Fig. 2b. These results reveal that by increasing the micro-blasting pressure, an enlargement of the cutting edge radius develops. This
growth is more visible at micro-blasting pressures over 0.2 MPa. Taking into account the previous results, the coating thickness distributions along the cutting edge, after micro-blasting at various pressures, can be analytically determined. The calculated coated cutting edge cross section geometries at pressures of 0.2 and 0.4 MPa are shown in figure 2c. The coating thickness tρmin may diminish to zero at 0.4 MPa. Thus, substrate revelations may develop, as it is also indicated in the diagram of Fig. 2d. A coating thickness tρmin diminution leads to substrate thermal and mechanical loads growth and thus, the coated tool cutting performance may be deteriorated, although the augmentation of the cutting edge radius in general within a certain range improves the wear behaviour [9, 10]. 4. STRENGTH PROPERTIES GRADATION
AND BRITTLENESS AFTER MICRO-BLASTING
Residual compressive stresses can be induced into
the film structure up to a certain depth from the coating surface via micro-blasting [8]. Depending on the micro-blasting conditions, the deformed film depth varies, thus affecting the coating's performance in different applications. A method has been already introduced for determining mechanical strength properties gradation in coatings after micro-blasting [8]. The residual stresses are measured in the coating before and after micro-blasting and the related stress changes determined at a certain depth from the film surface. These changes are compared to corresponding ones, calculated by a developed algorithm supported by finite elements method calculations. This algorithm describes the continuous penetration of individual blasting grains into the coating material and determines residual stresses after micro-blasting. Considering these results, the grain penetration depth and moreover, the developed distribution of the film yield stress after micro-blasting versus the coating thickness are estimated. The von Mises stresses, developed after micro-blasting along the grain impression symmetry axis, depend on the distance from the coating surface and can be determined, as shown in Fig. 3a. The shaded areas indicate film material plastic deformation. The applied grain penetration depth hg at a micro- blasting pressure of 0.2 MPa amounts to 120 nm [8]. The determined residual stress distributions along the impression symmetry axis are developed under every point of the film surface, since after a sufficient micro-blasting time; the grains deform uniformly the entire coating surface. The yield strength of the untreated coating, which has unique strength properties, amounts to 4 GPa. Film regions, not plastically deformed during micro-blasting, possess the pristine yield stress of the as deposited material i.e. of 4 GPa. In turn, a plastically deformed region possesses yield strength equal to the locally developed maximum von Mises stress. The developed stress distribution in the coated cutting edge region at the maximum undeformed chip thickness hcu, when micro-blasted coated inserts at 0.2 MPa are used, was determined considering the real cutting edge geometry and is displayed in Fig. 3b. Moreover, the

55
mechanical properties gradations versus the coating thickness, which are shown in Fig. 3a, were taken into account. The equivalent peak stress develops on the film surface at the cutting edge roundness, close to the flank. This maximum stress is higher than the film yield strength in the “as deposited” untreated film case (see Fig. 3c), thus leading to a comparable more intense wear evolution at this cutting edge position.
Fig. 3. (a) Calculated von Mises plastic stress distributions in a TiAlN coating after micro-blasting, (b) Stress distributions in the coated cutting edge region after micro-blasting at a pressure of 0.2 MPa, (c) Achieved number of cuts up to a flank wear of ca. 0.2 mm in the as deposited case and after micro-blasting at 0.2 MPa.
The conduct of micro-blasting at 0.2 MPa, provides sufficient strength to the film for withstanding the cutting loads. Thus, it contributes to a significant increase of the achieved number of cuts up to the same width of flank wear land compared to the corresponding ones of the as deposited coated tool. The induced coating residual stresses after micro-blasting may increase simultaneously the film brittleness. Characteristic cases are presented in Fig. 4. PVD coated tools were subjected to wet micro-blasting
by sharp-edged Al2O3 abrasive grains and spherical ZrO2 ones, with smooth surfaces and
Fig. 4. (a) Yield stresses and (b) SY/SM ratioof post-treated coatings by wet micro-blasting with Al2O3 and ZrO2 grains.
average diameter of approximately 100 μm [4]. In generally, a gradation of the yield stress versus the film thickness develops after micro-blasting [8]. For simplifying the related calculations, it was assumed that an evenly distributed yield stress versus the coating thickness, up to a depth of 1.5 μm from the film surface occurs. Due to the larger coating material deformation, induced by the Al2O3 grains, the yield stress increase versus the pressure is higher compared to the corresponding one, when ZrO2 grains at the same process conditions are applied (see Fig. 4a). The determined yield stresses in both grain material cases remain practically unaffected over a pressure of 0.4 MPa. Moreover, Fig. 4b exhibits the yield to rupture stress ratio (SY/SM) course versus the micro-blasting pressure. An increase of this ratio indicates a simultaneous film brittleness growth i.e. fracture at less plastic deformation. 5. NANO-IMPACT TEST AND ITS FEM
SIMULATION FOR ASSESSING FILM BRITTLENESS
The coatings’ brittleness and toughness can be assessed by nano-impact tests [2,3,4,11,12]. In this test, a solenoid is used to pull the indenter off the coated specimen surface and to re-accelerate it from a distance against the film. An appropriate automation enables repetitive impacts at the same position on the sample surface at a set frequency. The evolution of the indentation depth, due to the progressing film damage during the repetitive impacts, is continuously monitored. Fig. 5a displays related test results at various impact loads on coating subjected to micro-small basting by spherical ZrO2 grains at a pressure of 0.4 MPa. The impact load increase up to 30 mN is associated with a continuous depth growth. At the impact load of 40 mN, a comparable steeper depth augmentation occurs, caused by the coating overloading and brittleness increase at high pressures. The courses of the maximum attained nano-impact depths at various impact loads versus the micro-blasting pressure, when coarse Al2O3 blasting grains are employed, are displayed in Fig. 5b.

56
Fig. 5. (a) Nano-impact results on wet micro-blasted coatings by ZrO2 grains at 0.4 MPa, (b) Impact depths at different impact forces on micro-blasted coatings by Al2O3 grains at various pressures, (c) Achieved number of cuts up to a flank wear of ca. 0.2 mm of micro-blasted coated inserts at various pressures.
Although up to a repetitive impact load of 20 mN, the higher micro-blasting pressure of 0.3 MPa seems to improve the film strength, at 30 mN, the increased coating brittleness leads to a larger film failure. This effect has to be considered for explaining the cutting performance of micro-blasted coated tools (see Fig. 5c). The wear resistance of coated tools subjected to wet micro-blasting at various pressures by Al2O3 grains of an average diameter of ca. 100 μm was
checked in milling. The applied tool-workpiece system and the main characteristics of the undeformed chip geometry are illustrated in the same figure. Micro-blasted tools at a pressure of 0.2 MPa exhibited the best cutting performance, reaching a tool life of approximately 130,000 cuts. A slight tool life reduction at 120,000 cuts up to the same flank wear of 0.2 mm was encountered at a pressure of 0.3 MPa. Hence, over this critical micro-blasting pressure, which depends on the micro-blasting conditions, the higher micro-basting pressure increases the film brittleness. In this way, the coated tool wear resistance is also deteriorated. At the higher micro-blasting pressure of 0.4 MPa, the cutting performance is additionally restricted by substrate revelation effects [2,3,4]. A 3D-FEM model was developed for simulating the nano-impact procedure, considering a piecewise linear plasticity material law (see Fig. 6). In a previous published FEM model, the strength properties of the film material were uniformly distributed versus the coating thickness [13]. By micro-blasting at various pressures, the attained maximum yield stress varies depending on the depth from the coating. In order to overcome this problem, a new 3D-FEM model was created, in which, the coating thickness was described by several material layers, with own elasto-plastic properties, developed after micro-blasting. The employed software was the LS-DYNA package. In these calculations, the simulation of the applied cube corner indenter geometry is in accordance to the manufacturer specifications. The boundary conditions and the finite elements discretization network are exhibited in this figure. The material properties and the coating thickness are variable and changeable parameters. The coating thickness was described by 20 material layers.
Fig. 6. The developed FEM model for simulating nano-impact test on micro-blasted tools

57
Fig. 7. 3D-depiction of the crack propagation during nano-impact test on micro-blasted coatings
During the indenter penetration into the film, it is assumed that the coating at the FEM model node regions can withstand the applied load up to a maximum value, which corresponds to the coating layer rupture stress and the associated maximum plastic strain limit. Over these limits, the related nodes are disconnected from the neighbouring finite elements. If all nodes of an element are disconnected, the element is released for simulating a crack formation and becomes an inactive separate entity. For minimizing the FEM
Fig. 8. Von Mises stress distribution and imprint geometry on micro-blasted coatings during loading and after indenter removal at various impact loads.
calculations solving time, the nodes’ ability to be disconnected is restricted to those nodes, which are located on the perpendicular to the coating surface section levels OA1, OA2, OA3. The edges of the cube corner indenter lie on these levels during the indenter penetration into the film material. In this way, the stress fields developed in the coating and its fracture evolution in terms of imprint depth versus the repetitive impacts can be analytically described. A characteristic example, indicating the crack propagation and thus the impact depth versus the number of impacts is shown in Fig. 7. Characteristic results attained by the developed FEM model during loading and after indenter removal are illustrated in figure 8. A comparison between measured and FEM calculated imprint depths on as deposited and micro-blasted coatings at impact load of 10 mN and 30 mN during the first 100 impacts is displayed in Fig. 9. The course of the FEM calculated imprint depths versus the number of impacts converges sufficiently with the measured results at all impact loads. In this way, micro-blasting conditions on films can be analytically optimized, for avoiding an undesired level of film brittleness. 6. CONCLUSIONS In the paper, innovative experimental- analytical procedures for determining coating strength properties gradation, film brittleness as well as coating thickness distribution after micro-blasting are presented. These processes render possible a targeted optimization of micro-blasting conditions, leading to improved coated tool life.

58
Fig. 9. Comparison between experimental and FEM-
calculated imprint depths versus the number of impacts
7. REFERENCES [1] Klocke, F., Schroeder, T., Bouzakis, E., Klein,
A., Manipulation of coating and subsurface properties in reconditioning of WC–Co carbide cutting tools, Surface and Coatings Technology, 202, p.p. 1194-1198,2007.
[2] Bouzakis, K.-D., Klocke, F., Skordaris, G., Bouzakis, E., Gerardis, S., Katirtzoglou, G., Makrimallakis, S., Influence of dry micro-blasting grain quality on wear behaviour of TiAlN coated tools, Wear, 271, p.p. 783-791, 2011.
[3] Bouzakis, K.-D., Bouzakis, E., Skordaris, G., Makrimallakis, S., Tsouknidas, A., Katirtzoglou, G., Gerardis, S., Effect of PVD films wet micro-blasting by various Al2O3 grain sizes on the wear behaviour of coated tools, Surface and Coatings Technology, 205, p.p. S128-S132, 2011.
[4] Bouzakis, K.-D., Skordaris, G., Bouzakis, E., Tsouknidas, A., Makrimallakis, S., Gerardis, S., Katirtzoglou, G., Optimization of wet micro-blasting on PVD films with various grain materials for improving the coated tools' cutting performance, CIRP Annals - Manufacturing Technology 60 (1) , p.p. 587-590, 2011.
[5] Kennedy, D. M., Vahey, J., Hanney, D., Micro shot blasting of machine tools for improving surface finish and reducing cutting forces in
manufacturing, Materials and Design, 26, p.p. 203-208, 2005.
[6] Barbatti, C., Garcia, J., Pitonak, R., Pinto, H., Kostka, A., Di Prinzio, A., Staia, M.H., Pyzalla, A.R., Influence of micro-blasting on the microstructure and residual stresses of CVD-Al2O3 coatings, Surface and Coatings Technology 203, p.p.3708–3717, 2009.
[7] Klaus, M., Genzel, Ch., Holzschuh, H., Residual stress depth profiling in complex hard coating systems by X-ray diffraction, Thin Solid Films, 517, p.p. 1172-1176, 2008.
[8] Bouzakis, K.-D., Skordaris, Klocke, F., Bouzakis, E., A FEM-based analytical–experimental method for determining strength properties gradation in coatings after micro-blasting, Surface and Coatings Technology, 203, p.p. 2946-2953, 2009.
[9] Rech, J., Influence of cutting edge preparation on the wear resistance in high speed dry gear hobbing, Wear, 261, p.p. 505-512, 2006.
[10] Bouzakis, K.-D., Michailidis, N., Skordaris, G., Kombogiannis, S., Hadjiyiannis, S., Efstathiou, K., Erkens, G., Rambadt, S., Wirth I., Effect of the cutting edge radius and its manufacturing procedure, on the milling performance of PVD coated cemented carbide inserts, CIRP Annals - Manufacturing Technology 51, p.p. 61-64, 2002.
[11] Beake, B.D., Vishnyakov, V.M., Colligon, J.S., Nano-impact testing of TiFeN and TiFeMoN films for dynamic toughness evaluation, Journal of Physics D: Applied Physics, 44/8, art. no. 085301, 2011.
[12] Beake, B.D., Smith, J.F., Nano-impact testing - An effective tool for assessing the resistance of advanced wear-resistant coatings to fatigue failure and delamination, Surface and Coatings Technology, 188-189, p.p. 594-598, 2004.
[13] Bouzakis, K.-D., Gerardis, S., Skordaris, G., Bouzakis, E., Nano-impact test on a TiAlN PVD coating and correlation between experimental and FEM results, Surface and Coatings Technology, 206, p.p. 1936-1940, 2011.
Authors: Prof. Dr.-Ing. habil., Dr.-Ing. E.h., Dr.h.c. Konstantinos-Dionysios Bouzakis, Assist. Prof Dr.-eng. Georgios Skordaris, Dr.-Eng. Stefanos Gerardis, Dr.-Ing. Emmanouil Bouzakis, Laboratory for Machine Tools and Manufacturing Engineering, Mechanical Engineering Department, Aristoteles University of Thessaloniki, GR-54124, Greece, and Fraunhofer Project Center Coatings in Manufacturing, Centre for Research and Technology Hellas (CERTH) GR-57001 Thessaloniki, Greece, and Fraunhofer Institute for Production Technology (IPT) D-52074 Aachen, Germany Phone: +30 2310 996079, 996021, Fax: +30 2310 996059. E-mail: [email protected] [email protected] [email protected] [email protected]

59
Original Scientific Paper
Jakovljevic, Z.
POINT CLOUD REDUCTION USING SUPPORT VECTOR MACHINES Received: 08 April 2012 / Accepted: 27 June 2012
Abstract: This paper explores the possibilities of point cloud reduction using insensitive support vector regression (-SVR). -SVR is a technique that can carry out the regression using different kernel functions (sigmoid, radial basis function, B-spline, spline, etc.) and it is suitable for detection of flat regions and regions with high curvature in scanned data. Using -SVR the density of preserved points is adaptive – preserved points are denser at highly curved region and rare at flat regions. Adjusting the error cost in the regression, the number of preserved points can be fine tuned. Key words: reverse engineering, point cloud reduction, support vector machines
Redukcija oblaka tačaka primenom SVM metode. Ovaj rad istražuje mogućnosti smanjenja oblaka tačaka pomoću regresivne metode potporna vektorima (-SVR). -SVR je tehnika koja može da sprovede regresiju koristeći različite kernel funkcije (sigmoid, radial basis function, B-spline, spline, itd.) i pogodna je za detekcije ravnih regiona i regiona sa visokim neravninama. Korišćenjem -SVR gustina sačuvanih tačaka je prilagodljiva – sačuvane tačke su gušće u zakrivljenom a retke u ravnim regionima skeniranih podataka. Podešavanje regresivne greške, broj sačuvanih tačaka se mogu podešavati. Ključne reči: reverzibilno inženjerstvo, redukcija oblaka tačaka, SVM metoda 1. INTRODUCTION
The application of reverse engineering (RE) of the freeform shaped parts is rapidly dispersing over the years. Besides the reproduction of parts when original drawings are not available, RE is applied in the design of new products (e.g., in automotive industry where the sheet metal forming tools for car bodies are created based on wooden or clay models; in consumer products industry where aesthetic design is important; in generation of custom made accessories and prostheses for human) [1]. During the first step of RE, the surface of the physical object is digitalized and 3D point cloud is obtained. Contemporary measurement devices [2] and especially ones based on lasers have high measurement speed and resolution, giving large and dense point clouds at output. Although the sampling rate of measurement device can be adjusted according to the character of digitalized surface, the operator usually acquires as many points as possible because he is not sure about the needed density of points for adequate reconstruction of certain parts of scanned surface. Generally, a significantly larger amount of point cloud data is acquired than one that is sufficient and that can be efficiently handled during surface reconstruction. In order to operate with reconstructed surfaces at reasonable computational cost, the amount of point data should be reduced. The easiest solution for data reduction is uniform downsampling. Nevertheless, in order to preserve the shape of original surface points, highly curved regions in point cloud should have high density, while for relatively flatter areas lover point density is acceptable. In order to address given issues a number of data point reduction techniques have been proposed.
The simplest way to create a surface model from point cloud is to generate a polygonal mesh over it. Consequently, the first methods for data point reduction were based on simplification of polygonal meshes [3] (the research has origins in image processing), while recent methods are based on direct cloud point data reduction. The most of the methods for direct cloud point data reduction are based on the estimation of the importance of each point in the cloud. For the importance evaluation different measures are used e.g., deviation of normal vectors in the vicinity of the point [4, 5], Hausdoff distance [6], and maximum deviation distance [7]. In order to improve decision making fuzzy logic has been employed [7]. Support vector machines are an emerging technique for data regression and classification. In this paper a possibility of insensitive support vector regression (-SVR) application in data point reduction is explored, and a method for point cloud reduction is proposed.
2. SUPPORT VECTOR REGRESSION
Given is the training data set {(x1, y1), (x2, y2) ... (xl, yl)} where xi represent independent, and yi dependant variables. The goal of -SVR is to find a function f(x) that is as flat as possible and that has maximum deviation from yi. The errors lower than are insignificant. In other words, all the yi should lie in the -tube around f(x). In the case of linear dependence, the function f(x) is in the form:
b,f ixwx (1)
f(x) is flat if w is small. In order to ensure the flatness:
2
2
1w (2)

60
should be minimized, subject to:
b,yi ixw (3)
Nevertheless, in reality the scenarios in which all of the data lie within tube are extremely rare and optimization of the problem (2, 3) is infeasible. In order to create f(x), anyway, the violation of the condition that all yi are within tube is allowed. To formalize this approach, slack variables i, i
* are introduced and optimization problem (2, 3) is reformulated [8]:
*ii
ii
l
i
*ii
yb,
b,yto subject
Cminimize
i
i
xw
xw
w1
2
2
1
(4)
Constant C introduces the tradeoff between function flatness and number of points out of tube. Optimization problem (4) can be represented in dual form [9]:
C,, and to subject
y
,
maximize
*ii
l
i
*ii
l
i
l
i
*iii
*ii
l
j,ij
*jj
*ii
00
2
1
1
1 1
1
xxi
(5)
where i, i* represent Lagrange multipliers. Only for
|f(xi)-yi| ≥ Lagrange multipliers are nonzero, while for vectors (points) inside tube i, i
* vanish. The vectors with nonzero i, i
* are called support vectors. The solution of the problem (5) is given by:
ixw ns
*ii (6)
where ns is the number of support vectors, leading to:
b,xfns
*ii xxi (7)
The presented methodology can be applied for nonlinear regression by mapping data from the input space into a high-dimensional space where the regression is linear. It is worth noting that for optimization problem (5), it is enough to know only the inner product in the high-dimensional space i.e. it is not necessary to define the high-dimensional space in explicit form. Rather opposite, it can be defined using kernel K(x, xi), which represents inner product in the space of higher dimension. Introducing K(x, xi), problem (5) becomes:
C,, and to subject
y
,K
maximize
*ii
l
i
*ii
l
i
l
i
*iii
*ii
l
j,ij
*jj
*ii
00
2
1
1
1 1
1
xxi
(8)
while the function f(x) is defined by:
b,Kxfns
*ii xxi (9)
and it is a hyperplane in the high-dimensional space. The kernel can be any function that satisfies the conditions of Mercer’s theorem [8]. For example, these are polynomial kernels, Gauss kernel, sigmoid kernel, some wavelets. New kernels can be defined by summing or multiplication of simpler kernels. For the application at hand, two kernels are of the significance. The first is the B-spline of order 2n + 1, defined by 2n + 1 convolution of unit interval:
2
1
2
11 ,
k
ik
12n
B with
B ,K
1
xxxx ii
(10)
where 1X denotes indicator function on the set X and is the convolution. The second is the spline kernel of order k having N knots located at ts, which is defined by:
N
s
ks
ks
k
r
rr tt ,K10
jji xxxxxx
3. APPLICATION OF -SVR IN DATA POINT
REDUCTION Point data cloud is usually, due to the nature of scanning process, structured into cross sectional curves. Otherwise, it can be restructured using projections on cross section planes. -SVR can be applied to each cross section and the function f(x) can be obtained. The fact that function f(x) is as flat as possible in high dimensional space, i.e. it conforms as much as possible to selected kernel in initial space, can be used for determination of regions where the scanned line is not highly curved. In these regions the number of support vectors will be very small. In order to preserve the curvature, the points can be uniformly downsampled with predefined step. On the other hand, in regions with high curvature, -SVR will not be able to fit all the points inside the tube and the number of support vectors will be higher. In these areas support vectors can be preserved points. Due to the unknown curvature, the best kernels for -SVR of freeform surface scans are B-spline and spline. In this paper B-spline is opted to use. The other two parameters that should be set in order to carry out -SVR are error margin and error cost C. The value of is related to the accuracy of scanning device and surface characteristics’ tolerance and can be easily defined. The parameter C introduces the tradeoff between flatness and number of support vectors, i.e. preserved points, and it can be used for tuning the number of points that will be preserved in highly curved areas. The lower C will lead to higher number of preserved points, and vice versa. Fig. 1. shows an example of the -SVR carried out with different values of C on a curve synthesized in Matlab. In order to get closer to the reality the curve is noised with 20dB of white noise. It can be observed that with the decrease of C the curvature of regression line is lower and the number of preserved points (support vectors) in highly curved regions is higher.

61
Fig. 1. Identified support vectors on synthesized signals
for different values of parameter C (=0.3)
4. TURBINE BLADE EXAMPLE
This Section considers a real world example of the gas turbine blade (Fig. 2b). The pressure side of the blade represents smooth freeform surface, while its root has high curvature. The surface on the pressure side is scanned using set-up shown in Fig. 2a. The scanning device – laser OptoNCDT1700-100 is put on the 2d Cartesian manipulator. Laser measuring range is 100mm with 14 bit resolution. Measurement error due to the tilt angles is 0.5% at ±30. The accuracy of manipulator is significantly lower: ±0.1mm. The surface is scanned along y axis in successive cross sections with the step of 0.2mm. Scanning speed was 100mm/s, and sampling rate 625Hz, which gives resolution of 0.16mm. The obtained point cloud has 417,500 points and it is presented in Fig. 2c. Points are structured into cross sections along which the scanning is performed. Each of the obtained curves is subjected to -SVR as previously described. Parameter is set to 0.1mm, in accordance with scanning device accuracy. Parameter C, on the other hand is varied (Table 1). -SVR gives support vectors that represent the points that should be preserved. Nevertheless in smooth areas support vectors are infrequent. Thus, in regions where the distance between two subsequent support vectors along abscissa was
lower than 8mm the original signal was uniformly downsampled by 8mm (50 samples). In highly curved regions support vectors are dense and only they are preserved.
a)
b)
c)
Fig. 2. a) Scanning device; b) A photo of scanned gas turbine blade; c) Obtained point cloud
Point data scanned in one typical cross section at x=28mm are shown in Fig. 3a. Applying -SVR together with uniform downsampling where needed, the number of points is adaptively reduced. The points on the pressure side surface are reduced by higher rate, while at highly curved area at blade root the number of preserved points is higher. Reduced point data for C=10,000, C=100,000 and C=1,000,000 are shown in Fig. 3b, 3c and 3d, respectively. The points in x direction are downsampled uniformly by 10 – the cross sections with the step of 2mm are taken. The number and percentage of preserved points for different values of the cost parameter C are shown in Table 1, while reduced point clouds together with polynomial meshes created in Catia are shown in Fig. 4.
Table 1. Number and percentage of preserved points * Initial number of points in cloud: a = 417500 ** Number of points after downsampling along x and excluding points with z=0: b=22491
C # of preserved points
% of preserved points - a*
% of preserved points - b**
10,000 5185 1.24 23.05100,000 3351 0.80 14.9
1,000,000 3020 0.72 13.43
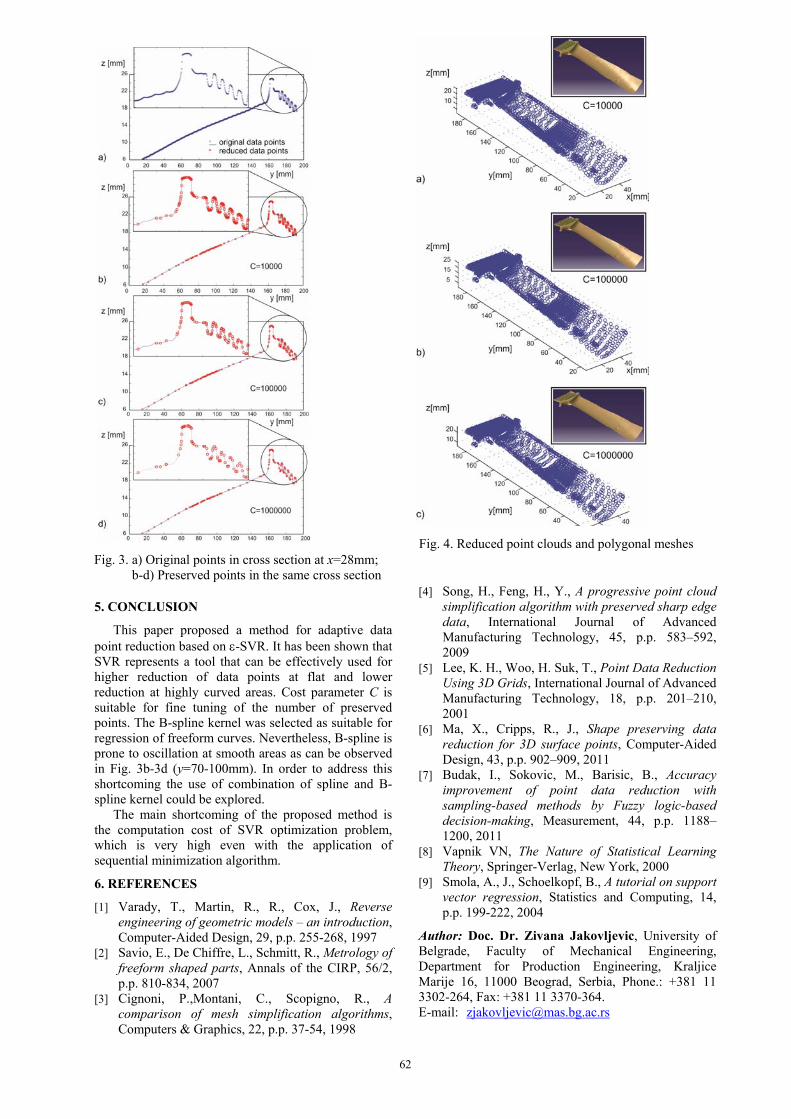
62
5. CONCLUSION
This paper proposed a method for adaptive data point reduction based on -SVR. It has been shown that SVR represents a tool that can be effectively used for higher reduction of data points at flat and lower reduction at highly curved areas. Cost parameter C is suitable for fine tuning of the number of preserved points. The B-spline kernel was selected as suitable for regression of freeform curves. Nevertheless, B-spline is prone to oscillation at smooth areas as can be observed in Fig. 3b-3d (y=70-100mm). In order to address this shortcoming the use of combination of spline and B-spline kernel could be explored. The main shortcoming of the proposed method is the computation cost of SVR optimization problem, which is very high even with the application of sequential minimization algorithm.
6. REFERENCES
[1] Varady, T., Martin, R., R., Cox, J., Reverse engineering of geometric models – an introduction, Computer-Aided Design, 29, p.p. 255-268, 1997
[2] Savio, E., De Chiffre, L., Schmitt, R., Metrology of freeform shaped parts, Annals of the CIRP, 56/2, p.p. 810-834, 2007
[3] Cignoni, P.,Montani, C., Scopigno, R., A comparison of mesh simplification algorithms, Computers & Graphics, 22, p.p. 37-54, 1998
[4] Song, H., Feng, H., Y., A progressive point cloud simplification algorithm with preserved sharp edge data, International Journal of Advanced Manufacturing Technology, 45, p.p. 583–592, 2009
[5] Lee, K. H., Woo, H. Suk, T., Point Data Reduction Using 3D Grids, International Journal of Advanced Manufacturing Technology, 18, p.p. 201–210, 2001
[6] Ma, X., Cripps, R., J., Shape preserving data reduction for 3D surface points, Computer-Aided Design, 43, p.p. 902–909, 2011
[7] Budak, I., Sokovic, M., Barisic, B., Accuracy improvement of point data reduction with sampling-based methods by Fuzzy logic-based decision-making, Measurement, 44, p.p. 1188–1200, 2011
[8] Vapnik VN, The Nature of Statistical Learning Theory, Springer-Verlag, New York, 2000
[9] Smola, A., J., Schoelkopf, B., A tutorial on support vector regression, Statistics and Computing, 14, p.p. 199-222, 2004
Author: Doc. Dr. Zivana Jakovljevic, University of Belgrade, Faculty of Mechanical Engineering, Department for Production Engineering, Kraljice Marije 16, 11000 Beograd, Serbia, Phone.: +381 11 3302-264, Fax: +381 11 3370-364. E-mail: [email protected]
Fig. 4. Reduced point clouds and polygonal meshes Fig. 3. a) Original points in cross section at x=28mm;
b-d) Preserved points in the same cross section

63
Original Scientific Paper
Tsiafis, I., Bouzakis, K.-D., Xanthopoulou, M., Tsolis, G., Xenos, Th.
ANALYSIS OF ROLLER BEARINGS’ VIBRATION SIGNALS BY HILBERT – HUANG TRANSFORM AS DIAGNOSTIC TOOL
Received: 11 June 2012 / Accepted: 17 July 2012
Abstract: Roller bearings are important elements of high performance mechanical systems, as they support the rotating parts and they reduce the contact friction. Therefore, it is necessary to continuously monitor their performance using non-destructive diagnostic methods. These methods interrogate data signals acquired during the machines operation. In this paper, the method of Hilbert – Huang transform was applied on non-stationary and non-linear vibration signals obtained via accelerometers from a mechanical system which contains a shaft rotating on Roller bearings. Two series of signals were used. The first series obtained from healthy bearings. The second series, obtained from bearings with seeded defects. The experimental study and its results are presented, as well as the conclusions drawn from the results. Key words: Roller bearings, Hilbert Huang transform, vibration signal Analiza valjčastih ležajeva preko vibracionih signala Hilbert–Huang transformacijom kao dijagnostičkim alatom. Valjčasti ležajevi su značajni elementi mehaničkih sistema visokih performansi, kao što su podrška rotirajućim delovima i oni smanjuju trenje u kontaktu. Stoga je neophodno da se kontinuirano prate performanse koristeći ne-destruktivne dijagnostičke metode. Pomoću ovih metoda su ispitivani podaci dobijenih signala tokom rada mašine. U ovom radu, metod Hilbert-Huang transformacija je primenjena na nestacionarne i nelinearne vibracione signale dobijene preko akcelerometara od mehaničkog sistema koji sadrži rotirajuće vratilo na valjkastim ležajevima.Korišćene su dve serije signala.Prva serija dobijena je od zdravih ležajeva. Druga serija, dobijena je od ležajeva sa defekatnim nošenjem. Eksperimentalna istraživanja i njeni rezultati su prezentovani, kao i zaključci iz rezultata. Ključne reči: Valjčasti ležajevi, Hilbert Huang transformacija, vibracioni signal 1. INTRODUCTION Non-destructive testing computational techniques are widely used nowadays, since they are accurate, cost and time efficient and usually easy to apply. Roller bearings are important elements of high performance mechanical systems, as they support the rotating parts and they reduce the contact friction. Therefore, it is necessary to continuously monitoring their performance using non-destructive diagnostic methods. It is obvious, that the method employed for time-frequency analysis must be computationally efficient and accurate in both time and frequency domains. The Wavelet transform, a method widely used for time-frequency analysis, is not suitable for the detection of failures of Roller bearings, since the computational time required for long data series is large, together with the inherent restrictions of the method in non-periodic, non-stationary signals [1-2]. Therefore, a modern method, the Hilbert-Huang transform, was introduced in this kind of problems with very promising performance, providing computational versatility and efficiency [18-19]. Consequently, it seems that the HHT can prove a perfect tool for Roller bearing failure detection. The present paper, presents the application of the HHT as a diagnostic tool method in the analysis of Roller bearings’ vibration signals from sound and defective samples [3-5]. The results prove the
suitability of HHT for the detection of the changes occurring in dynamic systems such the evolution of structural defects in a Roller bearing [15-16]. By implementing the EMD method and the Hilbert transform to the envelope of the signal, the Hilbert spectrum can be obtained. Thus, the defects on a Roller bearing can be identified and failure patterns can be detected [9-11]. Using the proposed method in real time test bench analysis of vibration signals, together with a library of standards of sound and defect Roller bearings, can prove a versatile, economic and efficient non-destructive technique. The results to be presented show the superiority of the proposed method over the traditional methods. 2. HILBERT HUANG TRANSFORM During the operation of a Roller bearing with local failures, a high-frequency impulse oscillation is produced the range of which is evaluated by the strength of the sampled pulses. The method of the envelope analysis provides an important and effective approach to failure analysis of high frequency impulse signals. Therefore, it has been successfully applied to fault diagnosis regarding Roller bearings [6-8]. In order to achieve better implementation of the Hilbert Transform, a combination of the envelope analysis method with the Empirical Mode Decomposition (EMD) into Intrinsic Mode Functions (IMF) and

64
Hilbert spectrum was created. The EMD method is based on local characteristic time scales of a signal and could decompose the complicated signal function in a number of intrinsic mode functions (IMF) [7]. The frequency components of each IMF depend both on sampling frequency and on the signal itself. Moreover, the corresponding Hilbert spectrum does not lead to dissipation and leakage of energy. Therefore, the EMD is a self-adaptive signal processing method that can be seamlessly applied to non-linear and non-stationary processes [12]. To extract the failure characteristics of the vibration signal of defect Roller bearings, the proposed method uses the following procedure: i) the failure vibration signal of a bearing is decomposed through wavelet packet transform in order to reduce the influence of low frequency noise; ii) a signal envelope is obtained by analyzing the wavelet coefficients of the high frequency band using the Hilbert Transform; iii) the IMFs are obtained applying the EMD in the signal envelope; iv) some special IMF are chosen to obtain the Hilbert spectrum from which the faults in a Roller bearing are diagnosed and failure patterns are identified. The results from the analysis of vibration signals obtained from a Roller bearing with a defect on the inner or outer raceway show that the proposed method is an excellent tool to define the failure characteristics of Roller bearings. 2.1 Empirical Mode Decomposition The EMD method is developed from the simple assumption that any signal consists of different simple intrinsic oscillation conditions [7]. Each linear or nonlinear condition will have the same number of extremes and zeros. There is only one extreme between two successive zeros. Each situation should be independent of the others. In this way, each signal could be decomposed to a number of IMFs and each of them must satisfy the following requirements: (1) In the entire data set, the number of extremes and
zeros must be equal or differ at most by one (2) At each point, the mean value of the envelope
defined by local maxima and the mean value of the envelope defined by local minima is zero.
(3) If the signal does not have extremes but it has points of inflection, then it can be integrated one or more times in order to show the extremes.
So, one can achieve the decomposition of the signal into n empirical statements and a residue rn, which is the average trend of x(t). The IMFs c1, c2, ..., cn contain different frequency bands ranging from high to low. The frequency components contained in each frequency band are different and change with the variation of the signal x(t); while rn represents the central tendency of signal x(t). 2.2 Hilbert Spectral Analysis The HHT represents the analysed signal on a time – frequency plane by combining Empirical Mode Decomposition (EMD) with Hilbert transform [11-17]. In contrast, the Fourier spectral analysis in which a series of sine and cosine functions of constant amplitude are used to represent each elementary
frequency component of the signal, the technique of HHT is based on calculating the instantaneous frequency derived from the Hilbert transform of the signal. In general, the Hilbert Huang transform HHT[x(t)] for each signal x (t) is defined as
1 1
, ( , ) ( , )
n n
i i ii i
HHT t ω HHT t ω a t ω (1)
where, HHTi(t,ω) represents the time - frequency distribution obtained from the i-th IMF signal. The symbol ≡ denotes the "default", and αi(t,ωi) compares the values of range αi(t) and the values of the instantaneous frequency ωi(t) along the signal simultaneously. 3. EXPERIMENTAL SETUP
The test-rig shown in figures 1a and 1b consisted of a shaft rotating on two Roller bearings (NU 202) driven by an electric motor controlled by an inverter for rotational speeds adjustment. An accelerometer, mounted close to the bearings, was measuring the developed accelerations. The data acquisition and the subsequent signal processing were performed using software developed on Matlab.
Fig. 1a. Experimental setup
Fig. 1b. Diagram of the experimental setup
4. RESULTS Each measurement made for each of the 17 Roller bearings, lasted 180 sec. The sampling frequency was chosen very high, 65536 Hz, so that very high frequencies corresponding to transient phenomena, as those investigated, could be identified; this sampling rate gave a data set of 11796480 samples for each measurement. Due to the large amount of samples obtained in each case and in order to achieve continuity, each initial data series was split into 120, 50% overlapping parts, each of 200000 samples, where the HHT was implemented. Figures 2a and 2b illustrate the time series of

65
measurements obtained from a sound and a defective Roller bearing respectively.
Fig. 2a. Time series of the healthy bearing
Fig. 2b. Time series of the defective bearing
The time series analysis by means of the HHT revealed strong differences between sound and defective Roller bearings, both in the IMFs (figs 3a, 4a and figs 3b, 4b, respectively) and in the corresponding Hilbert spectra (figs 5a and 5b) [14]. In fact, a comparative study between the relevant IMFs 1 to 5 of the sound and defective bearings (these IMFs correspond to the higher frequencies) reveals very strong differences; these differences tend to fade as the order of the IMF is getting higher i.e. as the frequency is decreasing, something to expected, since defective Roller bearings tend to produce higher frequency signals compared to sound ones.
Fig. 3a. ΙΜF 1-4 of sound bearing
Fig. 3b. ΙΜF 1-4 of the defective bearing
Fig. 4a. ΙΜF 5-8 of the sound bearing
Fig. 4b. ΙΜF 5-8 of the defective bearing
Fig. 5a. Spectrum Hilbert of the soundbearing

66
Fig. 5b. Spectrum Hilbert of the defective bearing 5. CONCLUSION As a time-frequency signal decomposition technique, the HHT provides an effective tool for the analysis of transient vibration signals. Experimental studies on a custom test bench have shown that the deterioration of a test Roller bearing can be effectively detected through time-dependent amplitudes and instantaneous frequencies resulting from the HHT. 6. REFERENCES [1] G.A. Radcliff, Condition monitoring of roller
element bearings using the enveloping technique. Machine Condition Monitoring. Mechanical Engineering Publication Ltd., London, 1990, pp. 55–67.
[2] R.B. Randall, Hilbert transform techniques in machine diagnostics. IFToMM International Conference on Rotordynamics, Tokyo, 1986.
[3] E. Bedrosian, A product theorem for Hilbert transforms, Proceedings of IEEE 51 (1963) 868–869.
[4] D.E. Vakman, L.A. Vainshtein, Amplitude, phase, frequency — fundamental concepts of oscillation theory, Soviet Physics-Uspekhi 20(12)(1977) 1002–1016
[5] C. Therrien, The Lee–Wiener Legacy. A history of the statistical theory of communication, November 2002, pp. 33–44.
[6] S.L. Hahn, Hilbert Transforms in Signal Processing, Artech House, s.l., 1996, p. 305.
[7] N.E. Huang, et al., The empirical mode decomposition and the Hilbert spectrum for nonlinear and non-stationary time series analysis, Procedings of the Royal Society Series A: Mathematical, Physical and Engineering Sciences 454 (1971) (1998) 903–995.
[8] K. Shin, J. Hammond., Fundamentals of Signal Processing for Sound and Vibration Engineers, John Wiley & Sons, Ltd, s.l., 2008.
[9] Jaideva C. Goswami, Albert E. Hoefel, Algorithms for estimating instantaneous frequency, Signal Processing 84 (2004) 1423–1427.
[10] Richard G. Lyons, Understanding Digital Signal Processing, Prentice Hall, s.l., 2004, p. 688.
[11] Daji Huang, Practical implementation of the Hilbert–Huang transform algorithm, Acta Oceanologia Sinica 25 (1) (2003) 1–11.
[12] Dennis Goge, et al., Detection and description of non-linear phenomena in experimental modal analysis via linearity plots, International Journal of Non-Linear Mechanics 40 (2005) 27–48.
[13] Gabor D.: “Theory of communications”, Proc IEE, v. 93(III), pp. 429-457, 1946
[14] M.Feldman, Non-linear system vibration analysis using Hilbert transform - Free vibration analysis method ‘‘FREEVIB’’, Mechanical Systems and Signal Processing 8 (2) (1994) 119–127.
[15] D.J. Pines, L.W. Salvino, Structural damage detection using empirical mode decomposition and HHT, Journal of Sound and Vibration 294 (2006) 97–124.
[16] Anders Brandt, Noise and Vibration Analysis: Signal Analysis and Experimental Procedures © 2010 John Wiley & Sons.
[17] N.E. Huang, M. C.Wu, S. R. Shen, W. Qu, P. Gloersen, and K. L. Fan, “A confidence limit for the Empirical Mode Decomposition and the Hilbert Spectral Analysis”, in Proc. Royal. Soc. London. A, 2003, vol. 459, pp. 2317–2345.
[18] Ioannis Tsiafis, K.-D. Bouzakis, Antonios Kaplanis, Athanasios Karamanidis, Thomas Xenos , “Fault Diagnosis of Roller Bearings Using the Wavelet Transform”, Romanian Review Precision Mechanics, Optics & Mechatronics, 2011, No. 39 pp. 21-24.
[19] Ioannis Tsiafis, K.-D. Bouzakis, Georgios Tsolis, Thomas Xenos, “Pectral Methods Assessment in Journal Bearing Fault Detection Applications”, The 3rd International Conference on Diagnosis and Prediction in Mechanical Engineering Systems, May 31 – June 1, 2012, Galati, Romania.
Authors: Assoc. Prof. Dr. I.Tsiafis1, Prof. Dr.-Ing. habil. K.-D. Bouzakis1, Dipl. Eng. M. Xanthopoulou1, Dr. G. Tsolis2, Prof. Dr. Th. Xenos2 1 Laboratory for Machine Tools and Manufacturing
Engineering, Department of Mechanical Engineering, Aristotle University of Thessaloniki, Greece. Phone: +302310996034, +302310996079, Fax: +302310996059
2 Department of Electrical & Computer Engineering, Aristotle University of Thessaloniki, Thessaloniki, Greece.
E-mail: [email protected], [email protected], [email protected], [email protected].

67
Original Scientific Paper
Milojević, Z., Navalušić, S., Zeljković, M., Vićević, M., Beju, L.
EXTENSION OF THE PROGRAM SYSTEM FOR NC MACHINING PROGRAM VERIFICATION WITH HAPTIC DEVICE
Received: 21 July 2012 / Accepted: 27 August 2012 Abstract: In the paper benefits of the haptic interaction in virtual environments and architecture of haptic application are presented. For results, presented in this paper, Sensable PHANToM Omni device is used, because of that, we presented OpenHaptic developing library for Sensable devices. Earlier developed program system for NC machining program verification is now extended with haptic device support. Because of fact that program system operates in real time and OpenGL graphic library is used for display, OpenHaptics HLAPI is used for haptic device programming which allows significant reuse of OpenGL code. User can stop NC verification in any time, and by haptic device can inspect workpiece coordinates. Key words: haptic interaction, virtual reality, 3-axis milling, virtual manufacturing Nadogradnja programskog sistema za NC programske mašine verifikovane Haptičkim uređajem. U radu su predstavljene prednosti haptičke interakcije u virtuelnim okruženjima i arhitektura haptičke aplikacije. Za rezultate, predstavljene u ovom radu, korišćen je Senzibilni PHANToM Omni uređaj , zbog toga je predstavljen razvoj OpenHaptic biblioteke za Senziblne uređaje. Ranije razvijen programski sistem za NC obradu verifikaciju programa je sada proširio uz podrškom haptičkog uređaja. Zbog činjenice da je programski sistem funkcioniše u realnom vremenu i OpenGL grafička biblioteka se koristi za prikazivanje, OpenHaptics HLAPI se koristi za programiranje haptičkog uređaja koji omogućava ponovno korišćenje OpenGL koda. Korisnik može zaustaviti NC verifikaciju u bilo kom trenutku, a haptički uređaj može pregledati koordinate obratka. Ključne reči: haptička interakcija, virtuelna stvarnost, 3-osno glodanje, virtuelna proizvodnja 1. INTRODUCTION
Virtual reality (VR) technology is often defined as the use of real-time digital computers and other special hardware and software to generate a simulation of an alternate world or environment, which is believable as real or true by the users. In other words, it creates an environment in which the human brain and sensory functions are coupled so tightly with the computer that the user seems to be moving around inside the computer-created virtual world in the same way people move around the natural environment [1].
Haptic interaction with computers implies the ability to use our natural sense of touch to feel and manipulate computed quantities [2]. This ability can make VR space „more real“.
The term “haptics” arises from the Greek root haptikos, meaning “able to grasp or perceive”. There are many fields where haptic devices have their application such as medicine, industry, education, arts and entertainment.
In Medicine haptic devices are used for: surgical simulators for training, manipulating robots for minimally invasive surgery, telemedicine, remote diagnosis, etc. In education, for feel phenomena at a variety of spatial and temporal scales, studying complex data sets, etc. In industry in CAD systems, virtual prototyping where assembly and disassembly can guide to the final design, shape sculpting, free-form shape generation and modification.
Avatar is virtual representation of haptic interface in virtual world and user physically interacts with virtually environment by it. If there is a contact between avatar and virtually environment, action and reaction forces are computed and user can feel it by haptic device. Architecture of haptic application is shown on Fig. 1.
Fig 1. Architecture of haptic application [3]
On Fig. 1, is shown that haptic application is splitted into tree blocks: simulation, visual rendering and haptic rendering. Visual rendering block is responsible for displaying our virtual world. Commonly it is realized by standard graphic libraries like OpenGL. Simulation block consists of simulation engine, which is responsible to compute our virtual word reactions if there are contact between avatar and it. For example contact occurred - move objects, or if we simulate material removing, contact occurred – remove material from virtual object, etc. Haptic rendering block consists of tree modules: collision

68
detection, force response and control algorithms modules. Collision detection module detects collision (contact S) between objects and avatar with its position X in the virtual environment. It can be very simple and check 3DOF point contact of avatar with virtual environments or computationally expensive to check 6DOF contact if avatar presents real 3D object (e.g. virtual tool can be treated as volumetric object). Force response module computes interaction force Fd, between avatar and virtual objects when a collision S is detected. It is based on avatar position X, positions of objects in virtual environment and collision state S. Because haptic device has a limitations to apply an exact force Fd, computed by force response module, control algorithms module calculate Fr force which is applicable to haptic device. Haptic rendering module in common repeats at kHz frequency for more realistic feel of virtual environment.
There are few companies on the market that offer haptic devices some of them are: SensAble Technologies, Force Dimension, Novint, Haption, etc. In this paper SensAble PHANToM Omni haptic device is used .
2. PHANTOM HAPTIC DEVICE
The first PHANToM (Personal HAptic iNTerface Mechanism), which allows one in the human world to interact with objects in virtual reality through touch, was developed by Thomas Massie, while a student of Ken Salisbury at M.I.T. It is relatively low cost force feedback device like a robot arm that is attached to a computer and used as a pointer in three dimensions, like a mouse is used as a pointer in two dimensions. The PHANToM interface's novelty lies in its small size, relatively low cost and its simplification of tactile information. Rather than displaying information from many different points, this haptic device provides high-fidelity feedback to simulate touching at a single point.
Fig. 2. PHANToM devices, a) Omni, b) Desktop and c)
Premium 1.5/6DOF
Device is introduced in 1995, and was the breakthrough to the growth of haptics. Different PHANToM devices meet varying needs. The Premium models are high-precision instruments and, within the PHANToM product line, provide the largest workspaces and highest forces, and some offer 6DOF (6 degrees of freedom) output capabilities. The PHANToM Desktop and PHANToM Omni devices offer affordable desktop solutions. Of the two devices, the PHANTOM Desktop delivers higher fidelity, stronger forces, and lower friction, while the PHANToM Omni is most affordable
haptic device at the market [4]. At the Fig. 2, PHANToM devices are shown.
3. OPENHAPTICS LIBRARY
For haptic application development purpose, there are few libraries on the market, mostly written in C++ programming language some of them are: CHAI3D, H3DAPI and OpenHaptics Toolkit. CHAI 3D is an open source set of C++ libraries for computer haptics, visualization and interactive real-time simulation. CHAI 3D supports several commercially-available haptic devices, and makes it simple to support new custom force feedback devices[chai]. H3DAPI is an open source haptics software development platform that uses the open standards OpenGL and X3D with haptics in one unified scene graph to handle both graphics and haptics. H3DAPI is cross platform and haptic device independent. In this paper a OpenHaptics Toolkit is used so, it is presented with more details below.
OpenHaptics Toolkit [5] is a commercial software development toolkit specially designed for SensAble devices written in the C++ programming language. Academics Edition for eligible educational institutions can be downloaded for no charge. The OpenHaptics toolkit is divided into these layers: QuickHaptics micro API, Haptic Library API (HLAPI), Haptic Device API (HDAPI), PHANTOM Device Driver (PDD) (Fig. 3).
Fig. 3. Open Haptic Toolkit library layers
QuickHaptics micro API, enables any professional with even passing familiarity with C++ to quickly and easily add the kinesthetic feel of what users see and/or hear on a computer screen.
HDAPI (haptic device API) is a low-level foundational layer for haptics rendering and enabling to send force and position manually. HDAPI is a low-level API that handles supported SensAble devices. As every low-level API, it manages the initialization of the device, servo loop, position, rotation and force update
The HLAPI (Haptic Library API) provides high-level haptic rendering and is designed to be familiar to OpenGL API programmers. It allows significant reuse of existing OpenGL code and greatly simplifies synchronization of the haptics and graphics threads. HLAPI is a high-level API with the main aim of easier

69
integration of haptics into existing graphics application. It provides mapping of haptic workspace, shape rendering or surface and force effects. A feedback buffer or depth buffer of OpenGL can be used to capture graphics primitives.
4. RESULTS
In this paper we will present developed program system where haptic interaction is included. It is earlier developed program system for NC machining program verification based on approximate dexel approach [6]. NC verification software graphically simulates the material removal process by continuously updating the solid stock shape as the cuter moves along the tool path to produce the final part. NC verification enables following benefits [7]:
-Detect NC program errors and bad or rapid cuts
-Machine parts correctly the first time
-Eliminate expensive and time consuming dry runs and proofing
-Reduce material scrap and overall cost
Developed system enables the real-time simulation for the 3-axis milling and this simulation is not view-depended. Workpiece and tool are approximated by dexels, which are connected by triangular mesh. Depends on the computer hardware, workpiece and tool resolution may vary. This approach enables that tool and workpiece could be arbitrary shape. System is developed in C++ program language by use of 3D graphics library OpenGL.
Fig. 4. Model of the developed software solution for
NC machining program verification extended with haptic interaction and stereo display
The main idea of including haptic interaction in this system is that the user can stop simulation in any time, and touch workpiece in virtual environment. By touch, user can inspect coordinates of workpice and can detect errors in NC machining program. Also system is extended with stereo display which simulation process makes „more real“. Model of the developed software solution extended with haptic interaction and stereo display is shown on the Fig. 4.
As shown on Fig. 4, the core of original system responsible for NC program reading, dexel models forming, computing instances of tool motion, etc is not changed. System is extended in display module with active stereo support by use of Nvidia Quadro FX-3700 graphic board and CrystalEyes shutter glasses. Also system checks if user selects “stop simulation” option than it includes haptic device interaction and allow user to inspect workpice dimensions. Haptic interaction module is shown on Fig. 5 [5].
Fig. 5. Haptic interaction module
We use an OpenHaptics HLAPI, because our system is developed by use of OpenGL library and as mentioned earlier in this paper, HLAPI allows significant reuse of OpenGL code.
First, it initializes the HLAPI by creating a haptics rendering context and tying it to a haptic device. Then the program specifies how the physical coordinates of the haptic device should be mapped into the coordinate space used by the graphics. This mapping is used by the HLAPI to map geometry specified in the graphics space to the physical workspace of the haptic device.
Fig. 6. NC machining program verification display a)
cutting process, b) final machined workpice
Next, the application renders the scene graphics
using OpenGL. Then the program processes any events

70
generated by the haptics rendering engine such as contact with a shape or a click of the stylus button. If contact with workpiece exists obtained coordinates are displayed in dialog. Then the haptics are rendered by executing the same code as for rendering the graphics, but capturing the geometry as feedback buffer shape.
We used feedback buffer shape, because second option is a back buffer shape which gives less accurate results than feedback buffer. In addition to rendering scene geometry, a 3D cursor is rendered at the proxy position reported by the HLAPI. Finally, the rendering loop continues by rendering the graphics again. On the Fig. 6, display of our program system is shown.
5. CONCLUDING REMARKS
In the introductory part of paper, we present importance of the haptic interaction in virtual reality environment.
In addition a benefits of haptic interaction in virtual environments and architecture of haptic application are presented. For results presented in this paper Sensable PHANToM Omni device is used, because of that, we presented OpenHaptic developing library for Sensable devices.
As a results, developed program system where haptic interaction is included is presented. It is earlier developed program system for NC machining program verification based on approximate dexel approach. Now we extended this system with haptic interaction and stereo display support. User can stop machining simulation and by haptic device check a workpieces coordinates.
6. REFERENCES:
[1] Rheingold, H.: "The Virtual Community - Homesteading on the Electronic Frontier", Addison-Wesley, 1993.
[2] Bainbridge,W.:“Berkshire Encyclopedia of Human-Computer Interaction“ Ed., Berkshire Publishing Group, 2004., pp. 311-316.
[3] Salisbury, K., Conti, F.,Barbagli, F. (2004) :”Haptic Rendering: Introductory Concepts”. IEEE Computer Graphics and Applications, vol. 24, 2004., pp. 24-32,
[4] http://www.sensable.com/, Accessed 10.08.2012. [5] SensAble Technologies, Inc. (2008): OpenHaptics
Toolkit version 3.0 Programmer’s Guide, 2008. [6] Milojević, Z., Navalušić, S., Zeljković, M. (2007)
:”NC Verification as Component of Virtual Manufacturing”, Academic Journal of Manufacturing Engineering (AJME), Vol.5, No.2, 2007., pp:48-54
[7] Mujber, T. S., Szecsi, T., Hashmi, M.S.J.:" Virtual reality applications in manufacturing process simulation", Journal of Materials Processing Technology 155-156, 2004., pp: 1834-1838
ACKNOWLEDGEMENT
In this paper some results of the project: CONTEMPORARY APPROACHES TO THE DEVELOPMENT OF SPECIAL SOLUTIONS RELATED TO BEARING SUPPORTS IN MECHANICAL ENGINEERING AND MEDICAL PROSTHETICS – ТR 35025, carried out by the Faculty of Technical Sciences, University of Novi Sad, Serbia, are presented. The project is supported by Ministry of the science and technological development of the Republic of Serbia.
Authors: Dr. Zoran Milojević Assistant Professor, Dr. Slobodan Navalušić Full Professor, Dr. Milan Zeljković Full Professor, Dr. Marija Vićević Assistant Professor, University of Novi Sad, Faculty of Technical Sciences, Trg Dositeja Obradovica 6, 21000 Novi Sad, Serbia, Phone.: +381 21 450-366, Fax: +381 21 454-495. E-mail: [email protected] [email protected] [email protected] [email protected] Dr. Livia Beju Full Professor, “Lucian Blaga” University of Sibiu, “Herman Oberth” Engineering Faculty, Emil Cioran 4, 550025 Sibiu, Romania.

71
Original Scientific Paper
Milutinovic, D., Slavkovic, N., Kokotovic, B., Milutinovic, M., Zivanovic, S., Dimic, Z. KINEMATIC MODELING OF RECONFIGURABLE PARALLEL ROBOTS BASED ON
DELTA CONCEPT Received: 01 July 2012 / Accepted: 17 August 2012
Abstract: In order to develop reconfigurable DELTA robot with rotary and translatory actuated joints the generalized modeling approach is discussed. The results of a study on generalization of modeling approach without any use of non-actuated variables has been reported in this paper. Key words: Delta robot, reconfigurability, kinematic modeling Kinematsko modelovanje rekonfigurabilnog paralelnog robota baziranog na DELTA konceptu. U cilju razvoja rekonfigurabilnog DELTA robota sa rotaciono i translatorno pomeranim zglobovima, razmatran je generalizovan pristup modelovanju. U ovom radu je prikazan rezultat studije generalizacije modelovanja bez korišćenja neaktivacione promenljive. Ključne reči: Delta robot, rekonfigurabilnost, kinematsko modelovanje 1. INTRODUCTION The 3-DOF DELTA structure [1,2] is one of the most famous parallel mechanisms, Fig. 1a. The 4-DOF DELTA robots based on this structure, Figs. 1b and 1c, have been the first real commercial success for pa rallel robots. The 4- DOF D ELTA r obot comprise 3- DOF DELTA parallel mechanism and 1-DOF serial wrist for end-effector orientation. Parallel mechanism consist of three kinematic chains with identical to pology so th at the platform in its motion through the space retains constant orientation. T he m otors of pa rallel part of DELTA robot are mounted on fixed base while motor for end-effector orientation may also be on fixed base, Fig. 1b or on the movable platform, Fig. 1c. The techno logical stru cture and cap acities of DELTA robot (velocity up to 10 m/s, accele ration over 10g) m ake it ideal for h andling tasks in mu ltitude of sectors s uch a s i n f ood a nd agri culture, t he hygiene sector, bea uty care, health care or electronic components. It i s al so i mportant t o m ention t hat DELTA “linear” version is now the base of the fastest machine tools ever produced by industry (acceleration 3.5 - 5g) [ 4]. The c oncept o f rec onfigurable DELT A
robots and small machine to ols with ro tary or translatory actu ated jo ints, Fig . 2, is planed [5,6] with the id ea to enab le static and dy namic reconfi guration [7].
Fig. 1. DELTA robot with rotary actuated joints [3]
Fig. 2. Concept of reconfigurable DELTA robots and small machine tools with rotary or translatory actuated joints
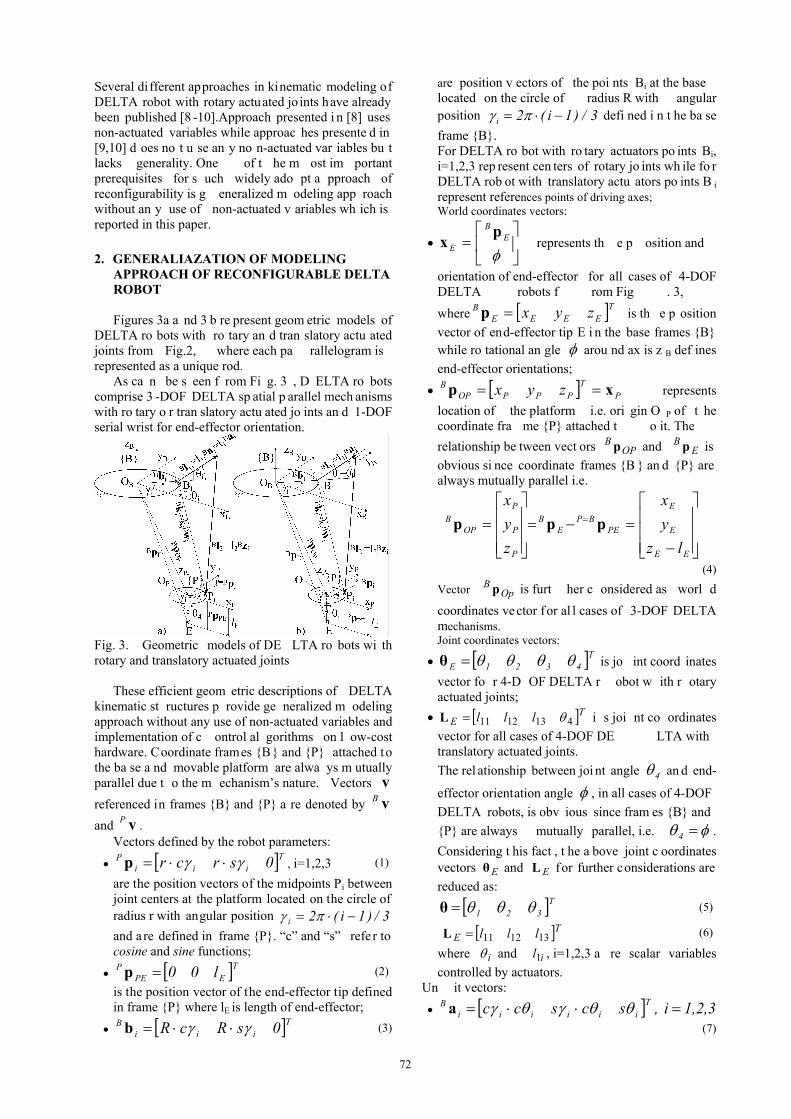
72
Several different approaches in kinematic modeling of DELTA robot with rotary actuated jo ints have already been published [8 -10].Approach presented i n [8] uses non-actuated variables while approac hes presente d in [9,10] d oes no t u se an y no n-actuated var iables bu t lacks generality. One of t he m ost im portant prerequisites for s uch widely ado pt a pproach of reconfigurability is g eneralized m odeling app roach without an y use of non-actuated v ariables wh ich is reported in this paper. 2. GENERALIAZATION OF MODELING
APPROACH OF RECONFIGURABLE DELTA ROBOT
Figures 3a a nd 3 b re present geom etric models of DELTA ro bots with ro tary an d tran slatory actu ated joints from Fig.2, where each pa rallelogram is represented as a unique rod. As ca n be s een f rom Fi g. 3 , D ELTA ro bots comprise 3 -DOF DELTA sp atial p arallel mech anisms with ro tary o r tran slatory actu ated jo ints an d 1-DOF serial wrist for end-effector orientation.
Fig. 3. Geometric models of DE LTA ro bots wi th rotary and translatory actuated joints These efficient geom etric descriptions of DELTA kinematic st ructures p rovide ge neralized m odeling approach without any use of non-actuated variables and implementation of c ontrol al gorithms on l ow-cost hardware. Coordinate frames {B} and {P} attached to the ba se a nd movable platform are alwa ys m utually parallel due t o the m echanism’s nature. Vectors v referenced in frames {B} and {P} a re denoted by vB and vP . Vectors defined by the robot parameters: Tiii
P 0srcr p , i=1,2,3 (1)
are the position vectors of the midpoints Pi between joint centers at the platform located on the circle of radius r with angular position 3/)1i(2i and a re defined in frame {P}. “c” and “s” refe r to cosine and sine functions;
TEPEP l00p (2)
is the position vector of the end-effector tip defined in frame {P} where lE is length of end-effector;
TiiiB 0sRcR b (3)
are position v ectors of the poi nts Bi at the base located on the circle of radius R with angular position 3/)1i(2i defi ned i n t he ba se frame {B}. For DELTA ro bot with ro tary actuators po ints Bi, i=1,2,3 rep resent cen ters of rotary jo ints wh ile fo r DELTA rob ot with translatory actu ators po ints B i represent references points of driving axes;
World coordinates vectors:
E
B
E
px represents th e p osition and
orientation of end-effector for all cases of 4-DOF DELTA robots f rom Fig . 3, where zyx T
EEEEB p is th e p osition
vector of end-effector tip E i n the base frames {B} while ro tational an gle arou nd ax is z B def ines end-effector orientations;
PT
PPPOPB zyx xp represents location of the platform i.e. ori gin O P of t he coordinate fra me {P} attached t o it. The relationship be tween vect ors OP
B p and EB p is
obvious si nce coordinate frames {B } an d {P} are always mutually parallel i.e.
EE
E
E
PEBP
EB
P
P
P
OPB
lz
y
x
z
y
x
ppp
(4)
Vector OpB p is furt her c onsidered as worl d
coordinates vector for al l cases of 3-DOF DELTA mechanisms.
Joint coordinates vectors:
T4321E θ is jo int coord inates vector fo r 4-D OF DELTA r obot w ith r otary actuated joints;
TE lll 4131211 L i s joi nt co ordinates vector for all cases of 4-DOF DE LTA with translatory actuated joints. The rel ationship between joi nt angle 4 an d end-
effector orientation angle , in all cases of 4-DOF DELTA robots, is obv ious since fram es {B} and {P} are always mutually parallel, i.e. 4 . Considering t his fact , t he a bove joint c oordinates vectors Eθ and EL for further considerations are reduced as:
T321 θ (5)
TE lll 131211L (6)
where i and il1 , i=1,2,3 a re scalar variables controlled by actuators.
Un it vectors: 1,2,3i ,scscc T
iiiiiiB a
(7)

73
unit vectors iB a define vectors i1
B l as
iB
i1i1B l al .
For rotary j oints, u nit v ectors iB a contain joint
coordinates i wh ile 1i1 ll , i =1,2,3 where l 1 is fixed arm length. For translato ry j oints, un it v ectors i
B a de fine
directions of t ranslatory jo ints i1l wh ile i , i=1,2,3 is fi xed in clination an gle of tran slatory joints. In these cases i
B a is expressed as
1,2,3i ,scscc Tiii
B a
(8) Other vectors and parameters are defi ned as shown in Fig. 3, where i
B w and iB z are uni t vectors while
2l is fixed length of joint parallelograms. Based on geometric relations shown in Figs. 3a and 3b t he f ollowing ge neralized eq uations fo r b oth geometric models are derived:
iB
iBP
OpB
iB
ik bppw (9)
iB
2iB
i1iB
i llk zaw (10)
Vectors iB
ik w in eq. (9) are c ommon for all cases of DELTA robots and u sing eqs. (1), (3) and (4) can be obtained as
P
iP
iP
wzi
wyi
wxi
iB
i
z
s)Rr(x
c)Rr(x
k
k
k
k
w (11)
By taking square of both sides in eq. (10) the following relation is derived
2i1i
Bii
Bi1
2i
22 l)k(l2kl wa (12)
where 2zi
2yi
2xi
2i kwkwkwk .
From this equation inverse and direct kinematics for all cases of DELTA robots can be solved. 2.1 Inverse and direct kinematics for DELTA robot
with rotary actuators
Taking into the accoun t that for this case 1i1 ll and sub stituting eq s. (7) an d (11), eq . (12) can be reduced to the well k nown typ e of tri gonometric equation as
1
2i
22
21
ziiyiixiii
l2
kll
kws)kwskwc(c
(13)
from which joint coordinates i , i=1,2,3 can be solved. Equation ( 13) gives 2 sol utions of inverse kinematics, Fi g. 4a. I n order t o av oid one of t he DELTA structure singularities solution i from Fig. 4a has to be chosen.
Fig. 4. Two solutions for inverse and direct kinematics It is im portant to mention that calculations of each chain i n eq. (13) are inde pendent a nd t he al gorithm may be implemented on a parallel architecture. According to eq. ( 11), e q. (13) in case of direct kinemnatics represe nts t he s ystem of t hree equat ions from which world coordinates Px , Py and Pz can be obtained. Among two solutions of direct kinematics only one is physically possible, Fig. 4b. 2.2 Inverse and direct kinematics for DELTA robot
with translatory actuators In case of i nverse ki nematics, eq uation (12) i s a second o rder polynomial i n t erms of i1l an d jo int coordinates fo r all cases of DELTA robots with translatory actuated joints are obtained as
22
221 )()( lkkkl ii
Bii
Bi
Bii
Bi wawa
(14) Equation (14) gives two solutions of inverse kinematics but on ly so lution with positive sq uare ro ot can be chosen. It is also important to mention that calculations of each c hain in eq. (14) are inde pendent and the algorithm may be implemented in parallel architecture. According to eq. (11), eq . (14) in case of direct kinematics, represe nts t he s ystem of t hree equat ions from which world coordinates Px , Py and Pz can be obtained. Among t wo sol utions o f di rect ki nematics only solution when 0zP , is physically possible. 3. DELTA ROBOT FIRST PROTOTYPE On t he basis o f adop ted con cept and d esign parameters the first DELTA robot prototype with rotary actuators co mpletely h as been d esigned, b uilt an d tested in our laboratory, Fig. 5. Parallel m echanism provides thre e degrees of freedom of end-effector po sitioning. At t his stage, actuators are composed of step motors and timing bolts are located on the stationary base. The fourth degree of freedom provides orientation of end-effector and is also actuated by st ep m otor l ocated o f t he m oving plate. End-effector i s equipped with standard vacuum cup with pneumatically powered vacuum generator (venturi tube). Among several proposed OAC (Open Architecture Control), so lution th e first l ow-cost con trol syste m is based on PC real -time Linu x pl atform with EM C2 software for computer control of machine tools, robots, parallel kinematics machine.

74
Fig. 5. DELTA robot first prototype Figure 6 represents a simplified structure of control and programming system.
Fig. 6. The structure of control and programming
system EMC2 was initially created by the NIST and is free software released under the terms of the General Public License (http://linuxc nc.org). Based on e quation (13) kinematics modul is programmed in C language and is integrate in EMC2 software system. In t his st age, t he pr ogramming sy stem is very conventional with t he use o f G co de. D uring G -code loading, EM C2 s oftware performs path verification. When t he p rogram st arts running, G -code i nstructions are executed in real time and generated control signals are directe d to real and/ or virtual DEL TA robot. The virtual DELTA robot makes possible simulation of t he real DELTA robot for the user, i.e., verification of the program in robot workspace. 4. CONCLUSION In order t o de velop r econfigurable D ELTA r obot with ro tary o r translato ry actu ated j oints, the generalized mo delling app roach is d iscussed. Th e results of stu dy on g eneralization of modelling approach wi thout any use of n on-actuated vari ables have been det ailed rep orted i n t his pa per. B ased on analytically s olved inv erse an d direct kinematics, control al gorithms are implem ented on low-c ost hardware with EM C2 com puter c ontrol s oftware. T he developed a nd i nvestigated pr ototype i ndicates t hat proposed rec onfigurable concept wi th generalized modelling appro ach will b e su perior to comparable
approaches, whic h justify fu rther rese arch in thi s direction. Acknowledgements. The authors would like t o thank th e Ministry of Education and Scien ce of the R epublic of Serbia for providing financial support that made this work possible. 5. REFERENCES [1] Clavel, R.: Device for the Movement and
Positioning of an Element in Space, United States Patent #4,976,582, Dec. 11 1990.
[2] Demaurex, M .O.: The Delta Robot within the Industry, i n: Boer, C.R., Molinari-Tosatti, L., Smith, K.S. (Ed ): Parallel Kin ematic Machines, Springer Verlag, London, pp. 395-400, 1999.
[3] Rey, L., Clavel, R.,.: The Delta Parallel Robot, in: Boer, C.R., Molinari-Tosatti, L., Smith, K.S. (Ed ): Parallel Kin ematic Mach ines, Sp ringer Verlag, London, pp. 401-417, 1999.
[4] Pierrot, F.: Towards non-hexapod mechanisms for high performance parallel machines, Pr oceedings of 26t h Annual Conference of the IEEE IECON, Vol. 1, pp. 229 – 234, Nagoya, 2000.
[5] Milutinovic, D., Sl avkovic, N. , Kokotovic, B ., Dimic, Z., Glavonjic, M ., Zi vanovic, S.: Development of the Domestic Delta Robot Based on a New Kinematic Modeling Approach (in Serbian), pp. 3.104-3.111, Proceedings of 38 th JUPITER Confe rence, Uni versity o f Belg rade, Mechanical Engineering Faculty, Belgrade, 2012.
[6] Tanovic, L j., Boja nic, P., Gla vonjic, M. , Milutinovic, D., M ajstorovic, V., at al.: The development of a new generation of domestic machining systems (in Serbian), Annual rep ort (TR-35022), , U niversity of Belgrade, Mechanical Engineering Faculty, Belgrade, 2011.
[7] Schmitt, J., Inkermann, D., Stechert, C., Raatz, A., Vietor, T.: Requirement Oriented Reconfiguration of Parallel Robotic System, in : Du tta, A. (Ed): Robotic System s – Ap plications, Con trol an d Programming, InTech, Rijeka, pp. 387-410, 2012.
[8] Strenheim, F.: Computation of the direct and inverse geometric models of the Delta 4 parallel robot, Robotersystem, Vol. 3, pp. 199-203, 1987.
[9] Pierrot, F ., R eynaud, C ., F ournier, A .: DELTA: a simple and efficient parallel robot, Robotica, Vol. 8, pp. 105-109, 1990.
[10] Pierrot, F., Dauchez, P., Fournier, A.: Fast Parallel Robots, Journal of Robotic Systems, Vol. 8, No. 6, pp. 829-840, 1991.
Authors: Prof. Dr. Dragan Milutinovic, Nikola Slavkovic, dipl.ing., M.Sc. Branko Kokotovic, Doc. dr Sasa Zivanovic, University of Belgrade, Faculty of Mechanical Engineeri ng, Pr oduction En gineering Department,, Kt aljice M arije 16, 1 1120 B elgrade, Serbia, P hone.: +3 81 1 1 3302-415, M.Sc. Milan Milutinovic, Tehnikum Taurunum Hi gh Engineering School V ocational St udies, Na de Dimic 4, Zemun,11080 Beograd, Serbia, Dimic Zoran, dipl.ing, Research and Dev elopment In stitute LOLA, L.T.D., Kneza Viseslava 70A, 11030, Belgrade, Serbia E-mail: [email protected], [email protected], [email protected]
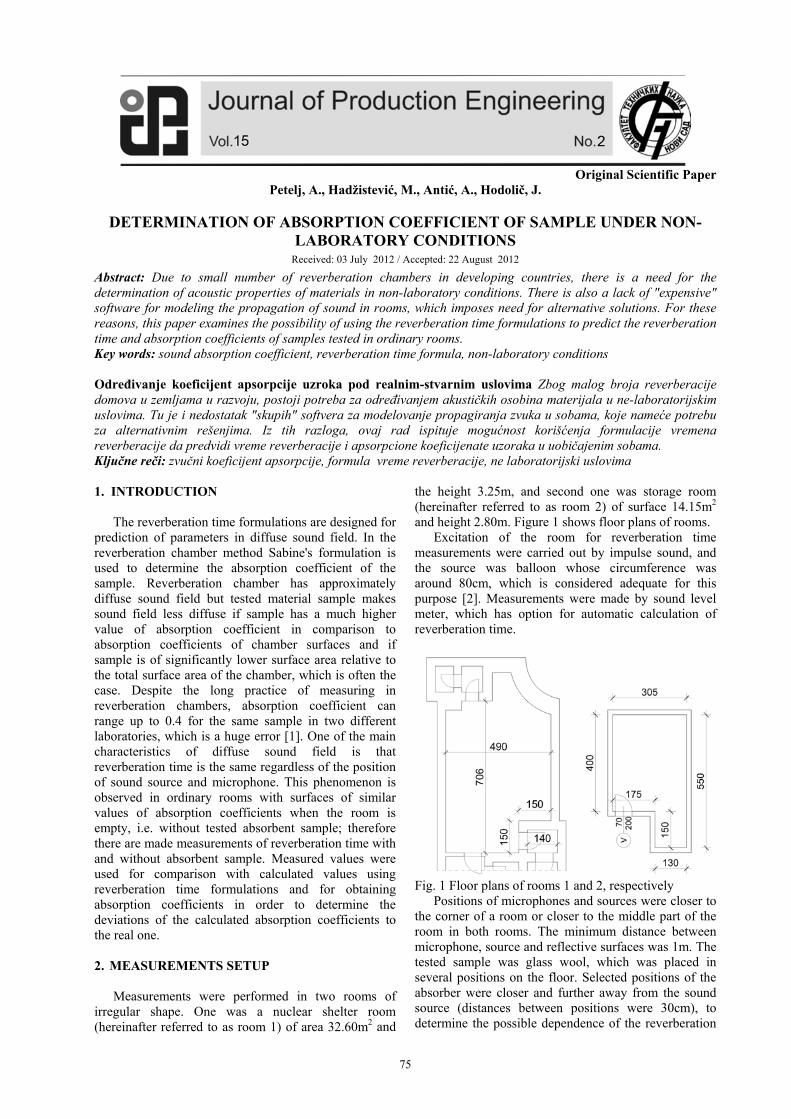
75
Original Scientific Paper
Petelj, A., Hadžistević, M., Antić, A., Hodolič, J.
DETERMINATION OF ABSORPTION COEFFICIENT OF SAMPLE UNDER NON-LABORATORY CONDITIONS
Received: 03 July 2012 / Accepted: 22 August 2012
Abstract: Due to small number of reverberation chambers in developing countries, there is a need for the determination of acoustic properties of materials in non-laboratory conditions. There is also a lack of "expensive" software for modeling the propagation of sound in rooms, which imposes need for alternative solutions. For these reasons, this paper examines the possibility of using the reverberation time formulations to predict the reverberation time and absorption coefficients of samples tested in ordinary rooms. Key words: sound absorption coefficient, reverberation time formula, non-laboratory conditions Određivanje koeficijent apsorpcije uzroka pod realnim-stvarnim uslovima Zbog malog broja reverberacije domova u zemljama u razvoju, postoji potreba za određivanjem akustičkih osobina materijala u ne-laboratorijskim uslovima. Tu je i nedostatak "skupih" softvera za modelovanje propagiranja zvuka u sobama, koje nameće potrebu za alternativnim rešenjima. Iz tih razloga, ovaj rad ispituje mogućnost korišćenja formulacije vremena reverberacije da predvidi vreme reverberacije i apsorpcione koeficijenate uzoraka u uobičajenim sobama. Ključne reči: zvučni koeficijent apsorpcije, formula vreme reverberacije, ne laboratorijski uslovima 1. INTRODUCTION
The reverberation time formulations are designed for prediction of parameters in diffuse sound field. In the reverberation chamber method Sabine's formulation is used to determine the absorption coefficient of the sample. Reverberation chamber has approximately diffuse sound field but tested material sample makes sound field less diffuse if sample has a much higher value of absorption coefficient in comparison to absorption coefficients of chamber surfaces and if sample is of significantly lower surface area relative to the total surface area of the chamber, which is often the case. Despite the long practice of measuring in reverberation chambers, absorption coefficient can range up to 0.4 for the same sample in two different laboratories, which is a huge error [1]. One of the main characteristics of diffuse sound field is that reverberation time is the same regardless of the position of sound source and microphone. This phenomenon is observed in ordinary rooms with surfaces of similar values of absorption coefficients when the room is empty, i.e. without tested absorbent sample; therefore there are made measurements of reverberation time with and without absorbent sample. Measured values were used for comparison with calculated values using reverberation time formulations and for obtaining absorption coefficients in order to determine the deviations of the calculated absorption coefficients to the real one. 2. MEASUREMENTS SETUP Measurements were performed in two rooms of irregular shape. One was a nuclear shelter room (hereinafter referred to as room 1) of area 32.60m2 and
the height 3.25m, and second one was storage room (hereinafter referred to as room 2) of surface 14.15m2 and height 2.80m. Figure 1 shows floor plans of rooms. Excitation of the room for reverberation time measurements were carried out by impulse sound, and the source was balloon whose circumference was around 80cm, which is considered adequate for this purpose [2]. Measurements were made by sound level meter, which has option for automatic calculation of reverberation time.
Fig. 1 Floor plans of rooms 1 and 2, respectively Positions of microphones and sources were closer to the corner of a room or closer to the middle part of the room in both rooms. The minimum distance between microphone, source and reflective surfaces was 1m. The tested sample was glass wool, which was placed in several positions on the floor. Selected positions of the absorber were closer and further away from the sound source (distances between positions were 30cm), to determine the possible dependence of the reverberation

76
time on the distance of absorber from the sound source. Different surfaces and thicknesses of samples were selected to determine how they affect the deviation of the calculated absorption coefficients from adopted ones from literature sources. In the room 1 measurements were performed with absorber samples of 10 cm layer thickness and of area 0.5, 1.0 and 1.5m2, and in the room 2 measurements were performed with absorber samples of 5 and 10 cm thicknesses and 1.2m2 area.
3. ADOPTED REVERBERATION TIME FORMULATIONS
Three formulas for reverberation time are chosen. The first one is Sabine's, which is still widely used and is part of the current standards regardless of the well-known deficiencies. In the case of samples with high absorption it may give coefficient values greater than 1, which are not realistic. Formula used to less extent and recommended by some authors is the Millington's, which does not give values greater than 1 if Millington's coefficients are used. Dance and Shield [3] enabled easy transformation of Sabine's coefficients, which are available in various literatures, to Millington's coefficients, which are available to a much lesser extent, thus facilitating their implementation. The third formula used is Zhang's, for which the autor [4] claims that is the better version of Millington's formula. It also uses Millington's coefficients. Sabine's, Millington's and Zhang's formulas are given below:
iis
Sc
VT
3.55
(1)
)1ln(
3.55
iim
Sc
VT
(2)
)1ln(
3.55
S
ScS
VT
ii
z
(3)
where: Ts - reverberation time according to Sabine Tm - reverberation time according to Millington Tz - reverberation time according to Zhang V - volume of room c - sound velocity αi - absorption coefficient of room element Si - surface area of room element
4. ADOPTED ABSORPTION COEFFICIENTS
Tables 1 and 2 show the materials of which rooms parts were made, adopted Sabine's coefficients for a given material, as well as the values when they are converted to Millington's coefficients via formula [1]:
00509902416030710 .... sssm (4)
Material Sabine's α Millington's
α Door, steel 0.073333[5] 0.075391
Floor, ceramic tiles 0.013333[6] 0.018126 Walls and ceiling,
concrete 0.018333[1] 0.023011
Person 0.435417[7] 0.363055 Glass wool (10cm) 0.85[1] 0.589543
Table 1. Absorption coefficients for room 1
Material Sabine's α Millington's
α Walls, plastered concrete blocks
0.046667[8] 0.05030126
Floor, concrete 0.0275 [1] 0.031911877 Door, wood 0.06666667[1] 0.052836073
Ceiling, wood 0.03833333[1] 0.045532914 Person 0.435417[7] 0.363055052
Glass wool (10cm) 0.85[1] 0.589542875 Glass wool (5cm) 0.668333[1] 0.502030721
Table 2. Absorption coefficients for room 2
The selected coefficients are mean values of the coefficients for the individual octave bands from 125Hz to 4kHz, since the values for these octaves are available in the literature [5-8]. 5. RESULTS AND ANALYSIS
5.1 Predictions of absorption coefficients Calculated Millington's coefficients were significantly deviated from the adopted coefficients and in the way that decreasing sample surface results in increasing deviation. However when the side surfaces of the samples were included in calculations, the deviations were minor. When it comes to Sabine's formula, the deviations are reduced by including surfaces of edges in the calculations, but they were still non-negligible. Zhang' formula resulted in better results than Sabine's, but worse than Millington's. Table 3 shows the adopted and calculated absorption coefficients for the room 1.
Sabine's α Millington's α without side surface of
sample with side surfaces of
sample Sample surface
(m2) Adopted
without side surfaces of
sample
with side surfaces of
sample Adopted
Millington f.
Zhang f.
Millington f.
Zhang f.
0.5 0.85 2.90 1.81 0.59 0.74 1.60 0.57 1.00 1.0 0.85 1.97 1.41 0.59 0.70 1.32 0.58 0.94 1.5 0.85 1.62 1.21 0.59 0.67 0.60 0.57 0.45
Table 3. Adopted and calculated absorption coefficients of samples for room 1
Since the Millington's formula showed the best results, analysis of the octave bands were done using
this formula. Since the available literature absorption coefficients are for the octave bands from 125Hz to 4kHz, these bands were analyzed. In most cases, large

77
deviations of calculated absorption coefficients relative to the adopted ones were noticed. Only for the 125 and 500 Hz octave bands the calculated coefficients are similar to adopted ones. For the band whose center frequency is 250Hz obtained values were lower than adopted coefficients, while for the octave bands 1 kHz, 2kHz and 4kHz the calculated coefficients were higher. A general increase in the calculated absorption coefficients with increasing frequency is observed. The exception is the 250Hz band coefficient.
‐0.60
‐0.40
‐0.20
0.00
0.20
0.40
0.60
0.80
1.00
1.20
125Hz 250Hz 500Hz 1kHz 2kHz 4kHz
adopted coefficients
calculated coefficients
Fig. 2.Absorption coefficients of 0.5m2 surface sample
0.00
0.20
0.40
0.60
0.80
1.00
1.20
125Hz 250Hz 500Hz 1kHz 2kHz 4kHz
adopted coefficients
calculated coefficients
Fig. 3.Absorption coefficients of sample of surface 1m2
0.00
0.20
0.40
0.60
0.80
1.00
1.20
125Hz 250Hz 500Hz 1kHz 2kHz 4kHz
adopted coefficients
calculated coefficients
Fig. 4.Absorption coefficients of sample of surface
1.5m2 Figure 5 shows decrease of measured reverberation times for all three samples as central frequencies are higher and there is no significant deviation of reverberation time for 250Hz frequency band. Therefore measured reverberation time is not reason for extremely low calculated absorption coefficient for this band. Since sound velocity and room volume are constant,
adopted values of absorption coefficients are cause for this deviation.
1
2
3
4
5
6
125Hz 250Hz 500Hz 1kHz 2kHz 4kHz
RT with 0.5m2 absorber
RT with 1m2 absorber
RT with 1.5m2 absorber
Fig. 5.Measured reverberation times with absorber
samples Results obtained for room 2 are similar to room 1. Small deviations of the calculated Millington's coefficients were obtained by including lateral surfaces of the samples in the calculation. For Sabine's coefficients, the deviation was reduced by including surfaces of edges in the calculation, but it was still significant. Zhang's formula gave similar results as Sabine's. Table 4 shows the adopted and calculated absorption coefficients for room 2.
‐0.4
‐0.2
0
0.2
0.4
0.6
0.8
1
125Hz 250Hz 500Hz 1kHz 2kHz 4kHz
adopted coefficients
calculated coefficients
Fig. 6.Absorption coefficients of 5cm thickness sample
0
0.1
0.2
0.3
0.4
0.5
0.6
0.7
0.8
0.9
125Hz 250Hz 500Hz 1kHz 2kHz 4kHz
adopted coefficients
calculated coefficients
Fig. 7.Absorption coefficients of 10cm layer sample
Sabine's α Millington's α without side surface of
sample with side surfaces of
sample Sample thickness
(cm) Adopted
without side surfaces of
sample
with side surfaces of
sample Adopted
Millington f. Zhang
f. Millington
f. Zhang
f.
5 0.67 1.07 0.91 0.50 0.56 0.92 0.50 0.78
10 0.85 1.53 1.12 0.59 0.72 1.36 0.61 1.15
Table 4. Adopted and calculated absorption coefficients of samples for room 2

78
The adopted absorption coefficients are larger than the calculated obtained by Millington's formula for 125 and 250 Hz octave bands for both sample thicknesses. Within other bands adopted absorption coefficients are smaller than calculated ones. A general increase in obtained coefficients with increase of central frequencies is observed in room 2 as well. 5.2 Predictions of reverberation time In the room 1 the mean value of the measured reverberation times of empty room was 4.00s. The maximum deviation of the measured reverberation time from the mean value was 0.05s. Reverberation time is also calculated by Sabine's, Millington's and Zhang's formulas. While Sabine's formula (t = 4.88s) showed significant deviation from the measured values, Millington's formula (t = 3.99s) resulted in a slight deviation. Reverberation time calculated by Zhang's formula (4.11s) resulted in some bigger deviation than Millington's, but much smaller than Sabine's formulation. In the room 2 the mean value of the measured reverberation times of the empty room was 1.21s and there was no deviation of measured times from mean value. Sabine's formula resulted in reverberation time of 1.26s, and the deviation was not significant (0.05s). Obtained reverberation time by Millington's formula was 1.15s, and deviation was negligible as well (0.06s). The best prediction gave Zhang's formula with reverberation time 1.20s. Analysis for individual octave bands are made only by Millington's formula from the reasons mentioned earlier in the paper. Prediction of reverberation time for individual octaves of empty rooms using the formula resulted in large deviations. The smallest deviation was for the 250Hz octave band, where the calculated reverberation time was 0.27s shorter than measured one. The maximum deviation was for the 4kHz octave band, where the calculated time was longer by nearly 2s than measured one.
0
1
2
3
4
5
6
7
8
125Hz 250Hz 500Hz 1kHz 2kHz 4kHz
measured RT
calculated RT
Fig. 8.Measured and calculated reverberation times in room 1 without absorber
Figure 8 show that higher the frequency shorter the measured reverberation times in empty room. This is not the case with calculated reverberation times due to similar values of adopted absorption coefficients for 500Hz to 4kHz frequency bands. Regarding octaves in room 2 the observed deviations are large for reverberation time of empty room in most cases. The least is deviation of 500Hz band, (0.03s) and the biggest for 125Hz octave (0.66s).
5.3 The dependence of the reverberation time of the distance of sound absorber from the sound source In room 1 measurement were performed with samples placed at different distances from the source. Different correlations between reverberation time and distance are obtained. It was observed that as the sample is further from the sound source, the reverberation time is greater only for the sample of surface 1.5 m2. Due to the lack of a clear dependence of reverberation time and absorption coefficient on the distance of sample from the sound source, it has not been further analyzed. 6. CONCLUSIONS Sabine's and Zhang's formulas did not result in good approximations of reverberation time and absorption coefficients of samples in most cases. Application of Millington's formula in combination with Millington's coefficients taking into account the lateral surfaces of the samples has resulted in small deviations from measured values, but it is limited to determination of mean reverberation time and mean absorption coefficient of the sample for the frequency range that includes the octave bands from 125Hz to 4kHz, as application to single octave parameters did not give satisfactory results. Tests included samples of several thicknesses and sizes and rooms of certain dimensions and shapes, therefore additional measurements are required to establish the general applicability of the method. 7. REFERENCES [1] Cox, J., D’Antonio, P.: Acoustic Absorbers and
Diffusers, Taylor & Francis, 2009. [2] Jambrosic, K., Horvat, M., Domitrovic, H.:
Reverberation time measuring methods, Acoustics 08 Paris, 2008.
[3] Dance, S. M., Shield, B. M.: Modeling of sound fields in enclosed spaces with absorbent room surfaces, Appl. Acoust. 58, 1–18, 1999.
[4] Zhang, Y.: A method to predict reverberation time in concert hall preliminary design stage, Ph.D., Georgia Institute of Technology, 2005
[5] http://www.maplesolution.com/sound_ab.php [6] Rossing, T. D.: Springer Handbook of Acoustics,
Springer, 2007. [7] Jacobsen, F., Poulsen, T., Rindel, J. H., Gade, A.
C., Ohlrich, M.: Fundamentals of Acoustics and Noise Control, Department of Electrical Engineering, Technical University of Denmark, 2009.
[8] Beranek, L. L.: Concert Halls and Opera Houses: Music, Acoustics, and Architecture, Springer-Verlag New York Inc., 2004.
Authors: MSc Ana Petelj, Assoc. Prof. Dr Miodrag Hadžistević, Assis. Prof. Dr Aco Antić, Prof. Dr Janko Hodolič, University of Novi Sad, Faculty of Technical Sciences, Trg Dositeja Obradovica 6, 21000 Novi Sad, Serbia, E-mail: [email protected]; [email protected]; [email protected]; [email protected]

79
Original Scientific Paper
Kuzman, K., Kacmarcik, I., Pepelnjak, T., Plancak, M., Vilotic, D.
EXPERIMENTAL CONSOLIDATION OF ALUMINIUM CHIPS BY COLD COMPRESSION
Received: 01 June 2012 / Accepted: 17 July 2012
Abstract: Solid state recycling of metal chips and scrap presents a relatively novel eco-friendly solution in which high deformations and hydrostatic pressures are induced to the chips in order to achieve proper material bonding. This paper deals with consolidation of aluminium chips obtained by milling process. All chips were cut from the same AlMgSi1 ingot in total of 4 different milling regimes. Afterwards, chips were cold compressed in closed die, by punch and die with 32mm diameter. The influences of type of chips as well as compression load values on final billets densities were investigated. Additionally, this research elaborates possibilities for further enhancement of mechanical properties of obtained billets. Key words: aluminium chips recycling, chips compression, severe plastic deformation
Eksperimentalna konsolidacija aluminijumske strugotine hladnom kompresijom. Reciklaža metalne strugotine i otpada u čvrstom stanju predstavlja relativno novo “eco-friendly” rešenje gde se odgovarajuće visoke deformacijije i hidrostatični pritisci indukuju na strugotinu u cilju postizanja vezivanja materijala. Ovaj rad se bavi konsolidacijom aluminijumske strugotine dobijene procesom glodanja. Sve strugotine su dobijene od iste šipke AlMgSi1 od ukupno 4 različita režima glodanja. Nakon toga, strugotine su hladno kompresovane u kalupu prečnika 32 mm na panč presi. Zavisnost tipa strugotine kao i vrednosti kompresionog opterećanja na kompresovane otkovke su istraženi. Pored toga ovo istraživanje razrađuje mogućnosti za dalje unapređivanje mehaničkih svojstava dobijenih kompresovanih otkovaka. Ključne reči: reciklaža aluminijumske strugotine, kompresovana strugotina, teške plastične deformacije
1. INTRODUCTION
Aluminium and its alloys are widely used in modern industry due to their good mechanical properties and low relative density. Main areas of application of Al-alloys are in transportation, packaging and civil industries. Another important advantage of these alloys is their great recyclability, i.e. they can be recycled unlimited number of times without degradation of mechanical properties. It is said that recycling of aluminium saves approximately 95% of the energy used to produce the same amount of material from a raw ore [1]. Nevertheless, even more energy savings is possible when Al-alloys are solid state recycled. In solid state recycling, scrap from Al-alloys obtained in industry, undergo large pressures and are compacted into solid billet at room or elevated temperatures. In this process no material remelting takes place and therefore, low amount of energy is consumed, which also leads to lower green house emissions. Research regarding solid state recycling started in the 1990s. Authors Gronostajski et al. in [2] granulated different aluminium chips obtained in industry. Granulated particles were cold compressed and hot extruded. Microstructure of the obtained workpieces was examined and it was concluded that low porosity and relatively good density was obtained. Latter work of Gronostajski et al. in [3] included composition of different Al-FeCr composites by solid state recycling. Once again, Al-chips were first granulated, than mixed with FeCr particles and afterwards cold compressed and hot extruded. Mechanical properties and
microstructure of obtained billets were compared. Results showed that better mechanical properties were obtained by smaller initial particles. Fogagnolo et al. in [4] avoided granulation of chips and performed direct cold compression by 650 MPa followed by hot pressing (500°C) and extrusion. Influence of particles size and compression pressures of billets’ final densities was investigated by Samuel in [5]. Xia and Wu in [6] consolidated aluminium pure particles by back pressure ECAP process. ECAP die was preheated at 100°C and particles were wrapped in the foil. In [7] Tekkaya et al. consolidated three different aluminium chips into solids by cold compression and hot extrusion. Third type of the chips was mixed with SiC particles. This research showed that yield strengths of compacted billets were only slightly lower than casted material of the same alloy. The main issue in consolidation of aluminium chips is breakage of aluminium oxide (Alumina – Al203). This very thin layer (≈ 4nm) forms almost instantly when aluminum is exposed to oxygen. Therefore, formation of this thin layer in inevitable in industrial circumstances. In order to achieve proper bonding, high deformations are essential to assure good alumina breakage and its distribution throughout the whole material volume.
2. PRODUCTION OF CHIPS
Chips were produced from ingot �110 mm of AlMgSi1 alloy (Fig. 1). This alloy belongs to aluminium 6xxx wrought series, which is widely used in industrial applications. AlMgSi1 contains following
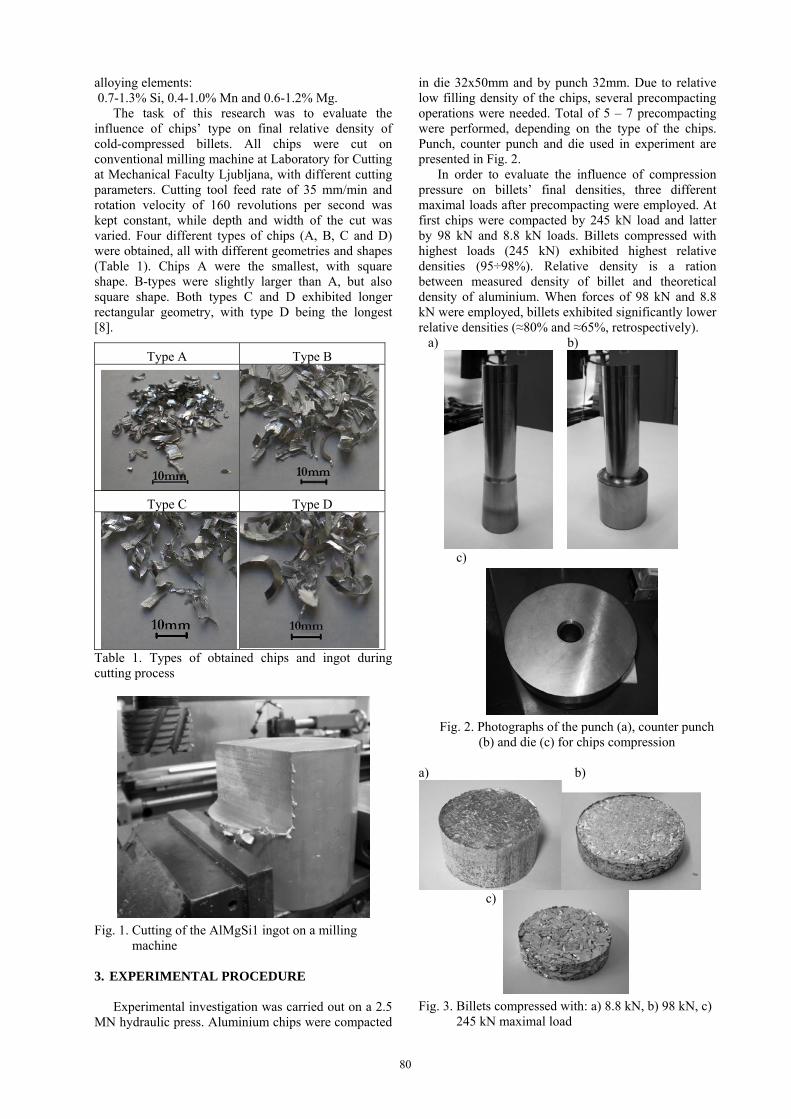
80
alloying elements: 0.7-1.3% Si, 0.4-1.0% Mn and 0.6-1.2% Mg. The task of this research was to evaluate the influence of chips’ type on final relative density of cold-compressed billets. All chips were cut on conventional milling machine at Laboratory for Cutting at Mechanical Faculty Ljubljana, with different cutting parameters. Cutting tool feed rate of 35 mm/min and rotation velocity of 160 revolutions per second was kept constant, while depth and width of the cut was varied. Four different types of chips (A, B, C and D) were obtained, all with different geometries and shapes (Table 1). Chips A were the smallest, with square shape. B-types were slightly larger than A, but also square shape. Both types C and D exhibited longer rectangular geometry, with type D being the longest [8].
Type A Type B
Type C Type D
Table 1. Types of obtained chips and ingot during cutting process
Fig. 1. Cutting of the AlMgSi1 ingot on a milling machine 3. EXPERIMENTAL PROCEDURE Experimental investigation was carried out on a 2.5 MN hydraulic press. Aluminium chips were compacted
in die 32x50mm and by punch 32mm. Due to relative low filling density of the chips, several precompacting operations were needed. Total of 5 – 7 precompacting were performed, depending on the type of the chips. Punch, counter punch and die used in experiment are presented in Fig. 2. In order to evaluate the influence of compression pressure on billets’ final densities, three different maximal loads after precompacting were employed. At first chips were compacted by 245 kN load and latter by 98 kN and 8.8 kN loads. Billets compressed with highest loads (245 kN) exhibited highest relative densities (95÷98%). Relative density is a ration between measured density of billet and theoretical density of aluminium. When forces of 98 kN and 8.8 kN were employed, billets exhibited significantly lower relative densities (≈80% and ≈65%, retrospectively).
a) b)
c)
Fig. 2. Photographs of the punch (a), counter punch
(b) and die (c) for chips compression
a) b)
c)
Fig. 3. Billets compressed with: a) 8.8 kN, b) 98 kN, c) 245 kN maximal load

81
Influence of chips type on relative density of final billet was also investigated, when compression was performed by maximal 245 kN load. As expected, billets obtained from smallest A- and B-type chips showed highest relative density (≈98%), while billets from C- and D-type chips exhibited ≈95% relative density (Fig. 4). In order to evaluate compactness of compressed chips, free upsetting was performed on press Amsler in Laboratory for Forming Technologies at Mechanical Faculty in Ljubljana.
Fig. 4. Influence of type of chips on final billets’ densities
Teflon tapes were put on both contact sides between billet and tools to reduce friction. Fig. 5. provides load-stroke curve for free upsetting process.
Fig. 5. Load-stroke diagram for free upsetting of cold compressed billets
While upsetting, disintegration of surface layer occurred (Fig. 6.) due to low homogenization of material in previous compacting process.
Fig. 6. Compacted billet after free upsetting
4. POSSIBILITIES FOR FURTHER ENHANCEMENT OF MECHANICAL PROPERTIES OF THE BILLETS Although compressed billets posses high relative density and compactness, the quality of the bond between the chips remains an issue. This issue was especially perceived during free upsetting experiment, when outer surface started to disintegrate. Particularly large shear deformations would contribute to better material bonding. Along large shear deformations, high hydrostatic pressures are a necessity as well, especially for ensuring that workpiece remains compact during processing. There are several solutions for improvement of mechanical characteristics of materials such as forward extrusion or severe plastic deformation. In previous work authors used forward extrusion for achieving better material bonding as in this process billets undergo large shear deformations. Billets were in most cases preheated at temperature above recrystallization. Even better material bonding can be achieved by severe plastic deformation (SPD), mainly due to the fact that in these processes little or no change of material shape takes place. High hydrostatic pressures prevent material deterioration and therefore enable extremely high shear deformations to be induced. The most applied SPD techniques are equal channel angular pressing, twist extrusion and high pressure torsion [9]. In equal channel angular pressing (ECAP), billet is extruded through an L-shaped die (Fig. 7a). There are many variants of this process, such as back pressure ECAP (Fig. 7b), ECAP processes with different L-angle values, double turn ECAP or ECAP with forward extrusion. Due to different contact interface on the upper and lower side of the billet in ECAP, a slightly tilted shape occurs (Fig. 7a). This phenomenon can be avoided if counter punch (Fig. 7b) is used. Counter punch also increases hydrostatic pressure and force Fbp must be set lower than main ECAP force F. The main advantage of ECAP is the possibility to induce very high homogenous deformation practically unlimited number of times and ability to produce relatively large billets [10], [11], [12].
a) b)
Fig. 7. Comparison between classical ECAP and Back pressure ECAP (BP-ECAP)
Twist extrusion (TE) consists of specific tooling through which material is rotated by a certain angle (e.g. 90 °C) and in that way, initial and final material shape remains constant (Fig. 8a). As is ECAP, there are several variations of TE, such as: back pressure TE, hydrostatic TE, high velocity TE...
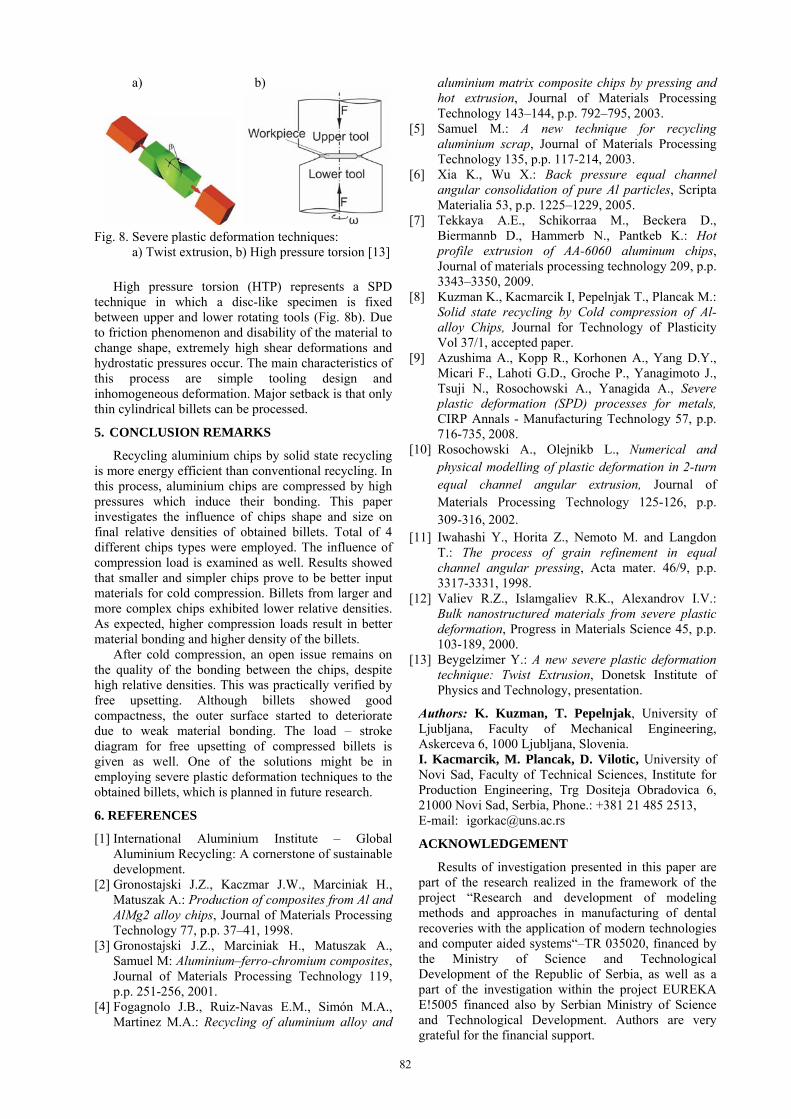
82
a) b)
Fig. 8. Severe plastic deformation techniques: a) Twist extrusion, b) High pressure torsion [13]
High pressure torsion (HTP) represents a SPD technique in which a disc-like specimen is fixed between upper and lower rotating tools (Fig. 8b). Due to friction phenomenon and disability of the material to change shape, extremely high shear deformations and hydrostatic pressures occur. The main characteristics of this process are simple tooling design and inhomogeneous deformation. Major setback is that only thin cylindrical billets can be processed.
5. CONCLUSION REMARKS
Recycling aluminium chips by solid state recycling is more energy efficient than conventional recycling. In this process, aluminium chips are compressed by high pressures which induce their bonding. This paper investigates the influence of chips shape and size on final relative densities of obtained billets. Total of 4 different chips types were employed. The influence of compression load is examined as well. Results showed that smaller and simpler chips prove to be better input materials for cold compression. Billets from larger and more complex chips exhibited lower relative densities. As expected, higher compression loads result in better material bonding and higher density of the billets. After cold compression, an open issue remains on the quality of the bonding between the chips, despite high relative densities. This was practically verified by free upsetting. Although billets showed good compactness, the outer surface started to deteriorate due to weak material bonding. The load – stroke diagram for free upsetting of compressed billets is given as well. One of the solutions might be in employing severe plastic deformation techniques to the obtained billets, which is planned in future research.
6. REFERENCES
[1] International Aluminium Institute – Global Aluminium Recycling: A cornerstone of sustainable development.
[2] Gronostajski J.Z., Kaczmar J.W., Marciniak H., Matuszak A.: Production of composites from Al and AlMg2 alloy chips, Journal of Materials Processing Technology 77, p.p. 37–41, 1998.
[3] Gronostajski J.Z., Marciniak H., Matuszak A., Samuel M: Aluminium–ferro-chromium composites, Journal of Materials Processing Technology 119, p.p. 251-256, 2001.
[4] Fogagnolo J.B., Ruiz-Navas E.M., Simón M.A., Martinez M.A.: Recycling of aluminium alloy and
aluminium matrix composite chips by pressing and hot extrusion, Journal of Materials Processing Technology 143–144, p.p. 792–795, 2003.
[5] Samuel M.: A new technique for recycling aluminium scrap, Journal of Materials Processing Technology 135, p.p. 117-214, 2003.
[6] Xia K., Wu X.: Back pressure equal channel angular consolidation of pure Al particles, Scripta Materialia 53, p.p. 1225–1229, 2005.
[7] Tekkaya A.E., Schikorraa M., Beckera D., Biermannb D., Hammerb N., Pantkeb K.: Hot profile extrusion of AA-6060 aluminum chips, Journal of materials processing technology 209, p.p. 3343–3350, 2009.
[8] Kuzman K., Kacmarcik I, Pepelnjak T., Plancak M.: Solid state recycling by Cold compression of Al-alloy Chips, Journal for Technology of Plasticity Vol 37/1, accepted paper.
[9] Azushima A., Kopp R., Korhonen A., Yang D.Y., Micari F., Lahoti G.D., Groche P., Yanagimoto J., Tsuji N., Rosochowski A., Yanagida A., Severe plastic deformation (SPD) processes for metals, CIRP Annals - Manufacturing Technology 57, p.p. 716-735, 2008.
[10] Rosochowski A., Olejnikb L., Numerical and physical modelling of plastic deformation in 2-turn equal channel angular extrusion, Journal of Materials Processing Technology 125-126, p.p. 309-316, 2002.
[11] Iwahashi Y., Horita Z., Nemoto M. and Langdon T.: The process of grain refinement in equal channel angular pressing, Acta mater. 46/9, p.p. 3317-3331, 1998.
[12] Valiev R.Z., Islamgaliev R.K., Alexandrov I.V.: Bulk nanostructured materials from severe plastic deformation, Progress in Materials Science 45, p.p. 103-189, 2000.
[13] Beygelzimer Y.: A new severe plastic deformation technique: Twist Extrusion, Donetsk Institute of Physics and Technology, presentation.
Authors: K. Kuzman, T. Pepelnjak, University of Ljubljana, Faculty of Mechanical Engineering, Askerceva 6, 1000 Ljubljana, Slovenia. I. Kacmarcik, M. Plancak, D. Vilotic, University of Novi Sad, Faculty of Technical Sciences, Institute for Production Engineering, Trg Dositeja Obradovica 6, 21000 Novi Sad, Serbia, Phone.: +381 21 485 2513, E-mail: [email protected]
ACKNOWLEDGEMENT
Results of investigation presented in this paper are part of the research realized in the framework of the project “Research and development of modeling methods and approaches in manufacturing of dental recoveries with the application of modern technologies and computer aided systems“–TR 035020, financed by the Ministry of Science and Technological Development of the Republic of Serbia, as well as a part of the investigation within the project EUREKA E!5005 financed also by Serbian Ministry of Science and Technological Development. Authors are very grateful for the financial support.

83
Original Scientific Paper
Vilotić, M., Lainović, T., Kakaš, D., Blažić, L., Marković, D., Ivanišević, A.
ROUGHNESS ANALYSIS OF DENTAL RESIN-BASED NANOCOMPOSITES Received: 10 June 2012 / Accepted: 2 August 2012
Abstract: The most widely used biomaterials for tooth reconstruction are the resin-based composites. These restorative materials consist of organic resin phase, inorganic filler particles and silane- the filler-resin interface. Contemporary composites are filled with nanoparticles, which are expected to improve materials properties. The aim of this study was to determine surface roughness of polished dental resin-based composites using atomic force microscopy analysis. Comparison of surface roughness parameters in the two directions was done (along and perpendicular to grinding tracks) among three different dental resin-based composites, each representative for its material group (nanofilled, microfilled, and microhybrid composites). Key words: surface roughness, AFM, grinding tracks, resin-based nanocomposites, dental finishing and polishing procedure
Analiza hrapavosti stomatoloških nanokompozita na bazi smole. Najrasprostranjeniji biomaterijali za rekonstrukciju zuba su kompoziti na bazi smole. Ovi poboljšani materijali sastoje se od organske smole, neorganskuh popunjujućih čestica i silan-popunske-smole. Savremeni kompozitni materijali su ispunjeni nano česticama u cilju poboljšanja osobina materijala. Cilj ovog istraživanja je utvrđivanje hrapavosti polirane površine smolom na bazi kompozita korišćenjem atomskog mikroskopa. Poređenjem hrapavosti površina na dva načina (uzdužno i normalo brušenje) sa tri različite smole na bazi kompozita, svaka predstavlja svoju materijalnu grupu (nanopopune, mikropopune i mikrohibridni kompoziti ). Ključne reči: hrapavost površine, AFM, brušenje, nanokompoziti na bazi smole, stomatološka dorada i poliranje 1. INTRODUCTION
The task of the modern restorative dentistry is to repair the damaged tooth structure, and to rehabilitate the patients’ oral health, as well as the function and natural esthetics of the teeth. After adequate cavity preparation and pre-treatment, damaged tooth structure needs to be reconstructed with chosen artificial restorative material [1]. Resin-based composites (RBCs) are the most commonly used biomaterials in contemporary dental practice [2]. RBCs are tooth-colored, highly aesthetic restorative materials, which consist of three different phases: organic resin matrix, inorganic filler particles and silane- the filler-resin interface [3]. The main resins of the organic phase are: bisglycidyl dimethacrylate (Bis GMA) or urethane dimethacrylate (UDMA), and some other resins added for the viscosity correction, such as triethylene glycol dimethacylate (TEGDMA) [1]. These are photo-polymerizable monomers that convert to the cross-linked polymers upon exposure to visible light, which activates photo-initiators incorporated in the single-paste material. Inorganic filler particles consist of silica in the form of quartz, or silicates of various types [1]. Fillers in composites have multiple roles: to reduce polymerization shrinkage, the coefficient of thermal expansion and water sorption and solubility; to mechanically reinforce the material; to improve optical and aesthetic characteristics of the material; to enable better initial polishing and polish retention, and to reduce wear during the masticatory forces [4-9]. Formulation of filler particles, have been passed from macro-, micro-, down to the nano-particles
[10] (fig. 1). Microhybrid composites, so-called universal restorative composites, are composed of filler particles of different sizes (15-20 μm and 0,01-0,05 μm) and have good mechanical properties for use in the lateral occlusal region, but relatively poor aesthetic qualities, to be used in the esthetic zone [11]. Microfilled composites have been developed in order to obtain high-quality aesthetic materials that meet the needs of restorative dentistry in the esthetic zone. Microfilled composites have average particle size in range of 0,01-0,05 μm.
Fig. 1. Diagrammatic summarization of development of
filler particles in resin-based composites (RBCs) [12]
Due to the relative poor mechanical strength, these materials are indicated for use in low-stress oral regions [11]. Trying to create a material that meets both of these properties, the mechanical resistance and the aesthetic and polishing qualities, nanofillers have been developed [8]. Finishing and polishing procedures are necessary clinical steps to establish a proper reconstruction of

84
dental crowns and to restore anatomical and morphological form of the tooth [13]. The aim of this study was to determine surface roughness of polished contemporary dental RBCs using atomic force microscopy analysis.
2. MATERIALS AND METHODS
Three representative dental resin-based composites were tested in the study: nanofilled (Filtek Ultimate Translucent), microfilled (GC Gradia Direct Anterior) and microhybrid (Filtek Z250). Detailed information about materials used in the study is shown in the tables 1, 2 and 3. One specimen of each material was made by using cylindrical plastic molds (4 mm diameter x 2 mm depth). Plastic molds were placed on the glass microscope slide, filled with material and covered with a polyester strip and a glass slide, taking care to obtain a flat surface without any defects and entrapped air. Material was then polymerized for 40 sec. with a SmartLite® IQTM 2 LED unit (Dentsply Caulk). After removing glass plate and polyester strip from the top of the samples, they were polished with multi-step polishing system- Super Snap (Shofu, Inc. Kyoto, Japan).
Name: Filtek Ultimate Translucent
Manufacturer: 3M ESPE, St. Paul, MN, USA
Classification: Nanofilled
Lot no: N225533
Shade: Clear shade
Matrix: Bis-GMA, UDMA, Bis-EMA, TEGMA and PEGDMA
Fillers: non- agglomerated/non-aggregated 20 nm silica filler, non- agglomerated/non-aggregated 4-11 nm zirconia filler, and aggregated zirconia/silica cluster filler (average cluster particle size – 0,6-20 μm)
Filler loading: 72,5 wt%, 55,6 vol%
Table 1. Details of Filtek Ultimate Translucent tested in the study
Name: GC Gradia Direct Anterior
Manufacturer: GC Dental Products Corporation, Tokyo, Japan
Classification: Microfilled (Micro-fine hybrid)
Lot no: 1106011
Shade: A2
Matrix: UDMA, dimethacrylate co-monomers, -II-
Fillers: Silica, 850 nm (0,85 μm) and prepolymerized filler
Filler loading: 73wt% 64-65 vol% (silica- 38 wt%, 22 vol%; prepolymerized filler- 35 wt%, 42 vol%)
Table 2. Details of GC Gradia Direct Anterior tested in the study
Name: Filtek Z250
Manufacturer: 3M ESPE, St. Paul, MN, USA
Classification: Microhybrid
Lot no: N367949
Shade: A2
Matrix: Bis-GMA, UDMA, Bis-EMA, TEGMA
Fillers: Zirconia, silica 10 – 3500 nm (0,01-3,5 μm)
Filler loading: 75-85 wt%, 60 vol%
Table 3. Details of Filtek Z250 tested in the study During the polishing procedure, each abrasive disk was used only once for each material, in the dry condition, for 1 minute, using handpiece rotating 10000 revolutions per minute (recommended speed by manufacturer). Four different abrasive disks were used during polishing procedure: black (coarse), violet (medium), green (fine) and red (extra-fine). One single operator did all of the polishing treatments, trying to simulate clinical finishing and polishing procedure. Two mutually perpendicular grinding directions were used during polishing procedure (Fig. 2).
Fig. 2. Grinding setup and grinding directions Immediately after the polishing treatment, topography of each specimen was examined by Veeco di CP-II Atomic Force Microscope. Specimen's surface has been scanned at points which lie at half distance between specimen's center and perimeter in contact mode with CONT20A-CP tips. 1 Hz scan rate and 256 × 256 resolution were used to obtain topography on a 90 µm × 90 µm scanning area. Before the scanning, specimen's surface has been blown through with cold air by hairdryer. Cleaning specimen's surface with alcohol created damaged surface. Once AFM images were obtained, surface roughness analysis was carried out on each AFM image, beginning by identifying the grinding tracks. After that, three analyzing lines along and three analyzing lines perpendicular to the grinding tracks were set on each AFM image, so that the roughness parameters in each line can be calculated. The purpose of setting the analyzing lines in this way was to compare roughness parameters in line and perpendicular to grinding tracks and to discover the influence that abrasive discs had on each material. Measured topography data were processed by Image Processing and Data Analysis v2.1.15 software. Following parameters were compared among specimens: average roughness (Ra) and maximum peak-to-valley distance (Rp-v).

85
3. RESULTS AND DISCUSSION Figures 3, 4 and 5 displays AFM images obtained from the surface of each specimen, while tables 4, 5 and 6 contain values of (Ra) and (Rp-v) roughness parameters from each analyzing line. Fig. 6 displays comparison of roughness parameters between all specimens, along and perpendicular to grinding tracks.
Fig. 3. AFM image and analyzing lines for Filtek
Ultimate Translucent (nanofilled)
Measuring location Ra [nm] Rp-v [nm]
Line 1 57.91 380.9
Line 2 32.04 239.0
Line 3 36.64 193.4
Line 4 26.16 214.7
Line 5 29.82 193.3
Line 6 29.28 165.6
Table 4. Ra and Rp-v parameters on analyzing lines for Filtek Ultimate Translucent
Fig. 4. AFM image and analyzing lines for GC Gradia
Direct Anterior (microfilled)
Measuring location Ra [nm] Rp-v [nm]
Line 1 87.62 786.5
Line 2 94.66 745.4
Line 3 85.68 774.7
Line 4 37.24 194.1
Line 5 48.92 333.3
Line 6 49.16 401.7
Table 5. Ra and Rp-v parameters on analyzing lines for GC Gradia Direct Anterior
Fig. 5. AFM image and analyzing lines for Filtek Z250
- (microhybrid)
Measuring location Ra [nm] Rp-v [nm]
Line 1 43.27 375.8
Line 2 37.52 351.4
Line 3 37.81 284.5
Line 4 21.25 154.2
Line 5 31.82 174.7
Line 6 29.44 162.9
Table 6. Ra and Rp-v parameters on analyzing lines for Filtek Z250
Based on the values of surface roughness parameters it can be concluded that Filtek Ultimate Translucent had the lowest values of (Ra) and (Rp-v) compared to GC Gradia Direct Anterior and Filtek Z250 (Fig. 6), which confirms the existence of advanced material features due to the nanoparticles filler composition. Also, when comparing same roughness parameters along and perpendicular to grinding tracks, Filtek Ultimate Translucent showed the best behavior in terms of surface uniformity after grinding by abrasive discs - there were the smallest differences in terms of roughness values in the both analyzing directions. In all cases, measuring roughness along grinding tracks showed lower values than perpendicular to grinding tracks.
Grinding direction
Line 1
Line 2
Line 3
Line 4
Line 5
Line 6
Grinding direction
Line 4
Line 5
Line 6
Line 1
Line 2
Line 3
Grinding direction
Line 1
Line 2
Line 3 Line 4 Line 5
Line 6
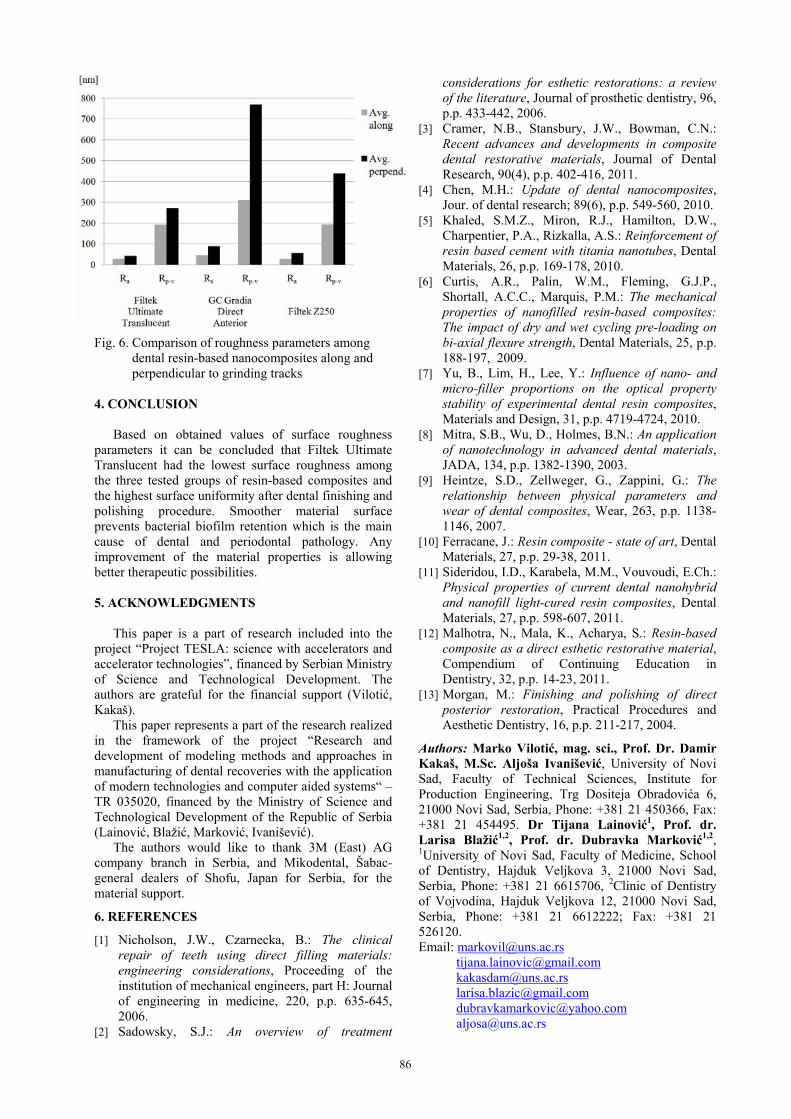
86
Fig. 6. Comparison of roughness parameters among dental resin-based nanocomposites along and perpendicular to grinding tracks
4. CONCLUSION Based on obtained values of surface roughness parameters it can be concluded that Filtek Ultimate Translucent had the lowest surface roughness among the three tested groups of resin-based composites and the highest surface uniformity after dental finishing and polishing procedure. Smoother material surface prevents bacterial biofilm retention which is the main cause of dental and periodontal pathology. Any improvement of the material properties is allowing better therapeutic possibilities. 5. ACKNOWLEDGMENTS This paper is a part of research included into the project “Project TESLA: science with accelerators and accelerator technologies”, financed by Serbian Ministry of Science and Technological Development. The authors are grateful for the financial support (Vilotić, Kakaš). This paper represents a part of the research realized in the framework of the project “Research and development of modeling methods and approaches in manufacturing of dental recoveries with the application of modern technologies and computer aided systems“ – TR 035020, financed by the Ministry of Science and Technological Development of the Republic of Serbia (Lainović, Blažić, Marković, Ivanišević). The authors would like to thank 3M (East) AG company branch in Serbia, and Mikodental, Šabac- general dealers of Shofu, Japan for Serbia, for the material support.
6. REFERENCES
[1] Nicholson, J.W., Czarnecka, B.: The clinical repair of teeth using direct filling materials: engineering considerations, Proceeding of the institution of mechanical engineers, part H: Journal of engineering in medicine, 220, p.p. 635-645, 2006.
[2] Sadowsky, S.J.: An overview of treatment
considerations for esthetic restorations: a review of the literature, Journal of prosthetic dentistry, 96, p.p. 433-442, 2006.
[3] Cramer, N.B., Stansbury, J.W., Bowman, C.N.: Recent advances and developments in composite dental restorative materials, Journal of Dental Research, 90(4), p.p. 402-416, 2011.
[4] Chen, M.H.: Update of dental nanocomposites, Jour. of dental research; 89(6), p.p. 549-560, 2010.
[5] Khaled, S.M.Z., Miron, R.J., Hamilton, D.W., Charpentier, P.A., Rizkalla, A.S.: Reinforcement of resin based cement with titania nanotubes, Dental Materials, 26, p.p. 169-178, 2010.
[6] Curtis, A.R., Palin, W.M., Fleming, G.J.P., Shortall, A.C.C., Marquis, P.M.: The mechanical properties of nanofilled resin-based composites: The impact of dry and wet cycling pre-loading on bi-axial flexure strength, Dental Materials, 25, p.p. 188-197, 2009.
[7] Yu, B., Lim, H., Lee, Y.: Influence of nano- and micro-filler proportions on the optical property stability of experimental dental resin composites, Materials and Design, 31, p.p. 4719-4724, 2010.
[8] Mitra, S.B., Wu, D., Holmes, B.N.: An application of nanotechnology in advanced dental materials, JADA, 134, p.p. 1382-1390, 2003.
[9] Heintze, S.D., Zellweger, G., Zappini, G.: The relationship between physical parameters and wear of dental composites, Wear, 263, p.p. 1138-1146, 2007.
[10] Ferracane, J.: Resin composite - state of art, Dental Materials, 27, p.p. 29-38, 2011.
[11] Sideridou, I.D., Karabela, M.M., Vouvoudi, E.Ch.: Physical properties of current dental nanohybrid and nanofill light-cured resin composites, Dental Materials, 27, p.p. 598-607, 2011.
[12] Malhotra, N., Mala, K., Acharya, S.: Resin-based composite as a direct esthetic restorative material, Compendium of Continuing Education in Dentistry, 32, p.p. 14-23, 2011.
[13] Morgan, M.: Finishing and polishing of direct posterior restoration, Practical Procedures and Aesthetic Dentistry, 16, p.p. 211-217, 2004.
Authors: Marko Vilotić, mag. sci., Prof. Dr. Damir Kakaš, M.Sc. Aljoša Ivanišević, University of Novi Sad, Faculty of Technical Sciences, Institute for Production Engineering, Trg Dositeja Obradovića 6, 21000 Novi Sad, Serbia, Phone: +381 21 450366, Fax: +381 21 454495. Dr Tijana Lainović1, Prof. dr. Larisa Blažić1,2, Prof. dr. Dubravka Marković1,2, 1University of Novi Sad, Faculty of Medicine, School of Dentistry, Hajduk Veljkova 3, 21000 Novi Sad, Serbia, Phone: +381 21 6615706, 2Clinic of Dentistry of Vojvodina, Hajduk Veljkova 12, 21000 Novi Sad, Serbia, Phone: +381 21 6612222; Fax: +381 21 526120. Email: [email protected]
[email protected] [email protected] [email protected] [email protected] [email protected]

87
Original Scientific Paper
Vitković, N., Veselinović, M., Mišić, D., Manić, M., Trajanović, M., Mitković, M.
GEOMETRICAL MODELS OF HUMAN BONES AND IMPLANTS, AND THEIR USAGE IN APPLICATION FOR PREOPERATIVE PLANNING IN ORTHOPEDICS
Received: 22 March 2012 / Accepted: 12 May 2012
Abstract: Geometrically accurate and anatomically correct three-dimensional geometric model(s) of human bones (or bone sections) and implants are essential for successful preoperative planning in orthopedic surgery. Such models are often used in various software systems for the preparation and control of surgical interventions. In this paper, the process of models’ creation and their usage in application for the preoperative planning in orthopedics are presented. Models are created by using reverse engineering techniques, CAD (CATIA) and 3D Content creation software (Blender). The application is web oriented, and developed with use of modern web technologies like HTML5 and WebGL. In relation to commercial and free software systems currently in use, this application has several advantages such as: implementation of adaptive geometrical models, the ability to work across multiple platforms, ease of installation and use, etc. Key words: geometrical models, bones, application, web, preoperative planning Geometrijski modeli ljudskih kostiju i implanata, i njihova primena za preoperativno planiranje u ortopediji. Geometrijski precizni i anatomski tačni trodimenzionalni geometrijski modeli ljudskih kostiju (ili delovi kostiju) i implanata su od suštinskog značaja za uspešno preoperativno planiranje u ortopedskoj hirurgiji. Takvi modeli se često koriste u različitim softverskim sistemima za pripremu i kontrolu hirurških intervencija. U ovom radu je predstavljen proces stvaranja modela i njihova primena za preoperativno planiranje u ortopediji. Modeli se kreiraju pomoću reverzibilne inženjerske tehnike, CAD (CATIA) i 3D kreirajućeg softvera (Blender). Aplikacija je web orijentisana, i razvijena uz korišćenje savremenih web tehnologija kao što su HTML5 i WebGL. U odnosu na komercijalne i besplatane softverske sisteme koji su trenutno u upotrebi, ova aplikacija ima nekoliko prednosti, kao što su: implementacija adaptivnih geometrijskih modela, sposobnost za rad na više platformi, jednostavnost instalacije i korišćenja, itd. Ključne reči: geometrijski modeli, kosti, aplikacija, web, preoperativna planiranja 1. INTRODUCTION In orthopedic surgery, but also in all other sub-branches of surgery, where there is need for preoperative planning or creation of customized implants (fixators), there is a specific requirement to know the exact geometrical model of the human bone. Therefore, it is very important to create geometry of the bone rapidly and accurately. Having such models, it is possible to build customized bone implants (fixators) using rapid prototyping technologies, or performing preoperative planning procedures in adequate applications. The classification and analysis of 3D modeling methods for the creation of human bones geometrical models are presented in [1]. This paper describes the study and the development of a script for a commercial software package (3ds Max) able to reconfigure the template model (deformable by Free Form Deformation method - FFD) of a femur starting from two orthogonal images representing the specific patient’s anatomy. Although this study provides an outstanding contribution to the research field, there are some drawbacks. First one is the semi-automatic image segmentation (X-ray images) which is always problematic due to previously known problems with the X-ray images (superposition, inaccurate patient
positioning, artifacts, etc.). The parametric model presented in this paper is not limited to the input data from only one source, because parameter values can be acquired from any available medical imaging devices: CT, X-ray, MRI, ultrasound, etc. The second drawback is creation of the script for the application in only one software (3ds Max). The points model created by this method can be used in any 3D graphic application which works with cloud of points model(s). The 3D reconstruction process which is based on anatomical properties is presented in [2]. The purpose of this study is to create a 3D model of human femur by using multiple X-ray images and anatomical properties of the femur. For 3D reconstruction, firstly, the 2D shape and specific parameters of the bone are measured from X-ray images. Then, the corresponding CT model is modified as it follows: the axial scaling, shearing transformation and radial scaling. Findings presented in [1,2] are the basis for the development of method presented in this paper. In [3], the authors are trying to create composite bone model with possible bone part adaptation and replacement from generic database of bone models. This is a useful approach when 3D scanning methods are available, but for 2D scanning methods more precise and patient-adapted models are required. In [4], the authors suggest application of standard bone
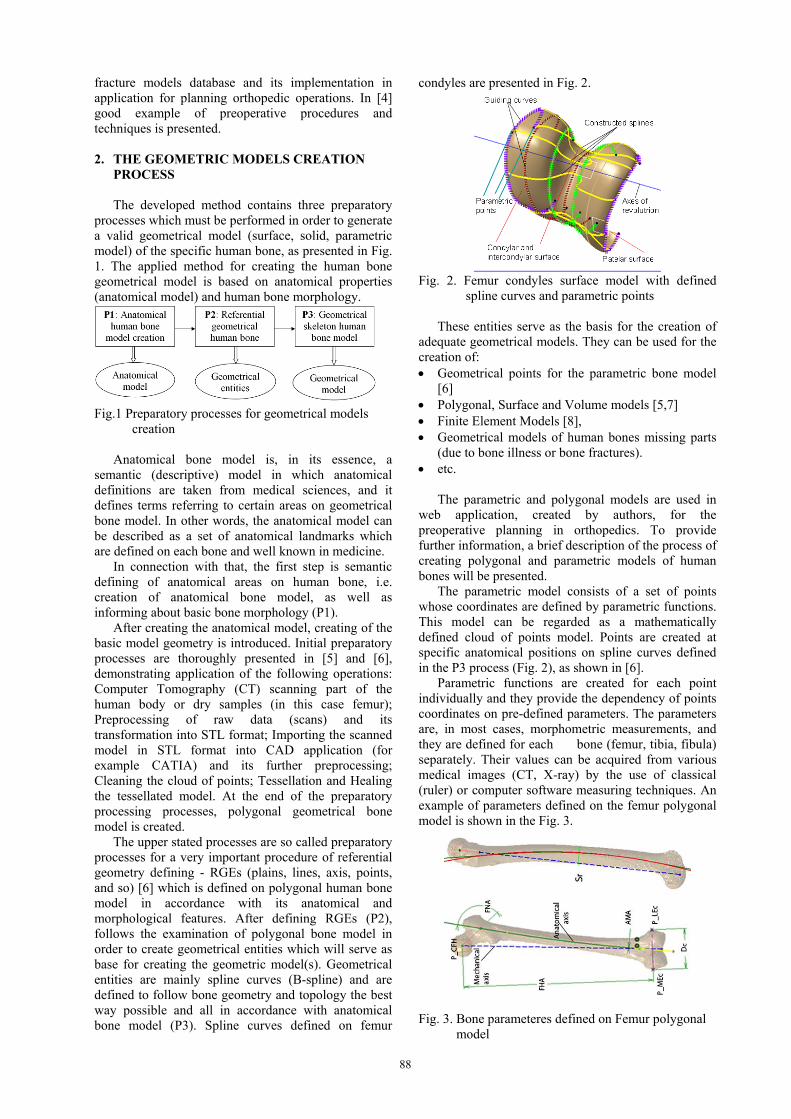
88
fracture models database and its implementation in application for planning orthopedic operations. In [4] good example of preoperative procedures and techniques is presented. 2. THE GEOMETRIC MODELS CREATION
PROCESS The developed method contains three preparatory processes which must be performed in order to generate a valid geometrical model (surface, solid, parametric model) of the specific human bone, as presented in Fig. 1. The applied method for creating the human bone geometrical model is based on anatomical properties (anatomical model) and human bone morphology.
Fig.1 Preparatory processes for geometrical models
creation Anatomical bone model is, in its essence, a semantic (descriptive) model in which anatomical definitions are taken from medical sciences, and it defines terms referring to certain areas on geometrical bone model. In other words, the anatomical model can be described as a set of anatomical landmarks which are defined on each bone and well known in medicine. In connection with that, the first step is semantic defining of anatomical areas on human bone, i.e. creation of anatomical bone model, as well as informing about basic bone morphology (P1). After creating the anatomical model, creating of the basic model geometry is introduced. Initial preparatory processes are thoroughly presented in [5] and [6], demonstrating application of the following operations: Computer Tomography (CT) scanning part of the human body or dry samples (in this case femur); Preprocessing of raw data (scans) and its transformation into STL format; Importing the scanned model in STL format into CAD application (for example CATIA) and its further preprocessing; Cleaning the cloud of points; Tessellation and Healing the tessellated model. At the end of the preparatory processing processes, polygonal geometrical bone model is created. The upper stated processes are so called preparatory processes for a very important procedure of referential geometry defining - RGEs (plains, lines, axis, points, and so) [6] which is defined on polygonal human bone model in accordance with its anatomical and morphological features. After defining RGEs (P2), follows the examination of polygonal bone model in order to create geometrical entities which will serve as base for creating the geometric model(s). Geometrical entities are mainly spline curves (B-spline) and are defined to follow bone geometry and topology the best way possible and all in accordance with anatomical bone model (P3). Spline curves defined on femur
condyles are presented in Fig. 2.
Fig. 2. Femur condyles surface model with defined
spline curves and parametric points These entities serve as the basis for the creation of adequate geometrical models. They can be used for the creation of: Geometrical points for the parametric bone model
[6] Polygonal, Surface and Volume models [5,7] Finite Element Models [8], Geometrical models of human bones missing parts
(due to bone illness or bone fractures). etc. The parametric and polygonal models are used in web application, created by authors, for the preoperative planning in orthopedics. To provide further information, a brief description of the process of creating polygonal and parametric models of human bones will be presented. The parametric model consists of a set of points whose coordinates are defined by parametric functions. This model can be regarded as a mathematically defined cloud of points model. Points are created at specific anatomical positions on spline curves defined in the P3 process (Fig. 2), as shown in [6]. Parametric functions are created for each point individually and they provide the dependency of points coordinates on pre-defined parameters. The parameters are, in most cases, morphometric measurements, and they are defined for each bone (femur, tibia, fibula) separately. Their values can be acquired from various medical images (CT, X-ray) by the use of classical (ruler) or computer software measuring techniques. An example of parameters defined on the femur polygonal model is shown in the Fig. 3.
Fig. 3. Bone parameteres defined on Femur polygonal
model
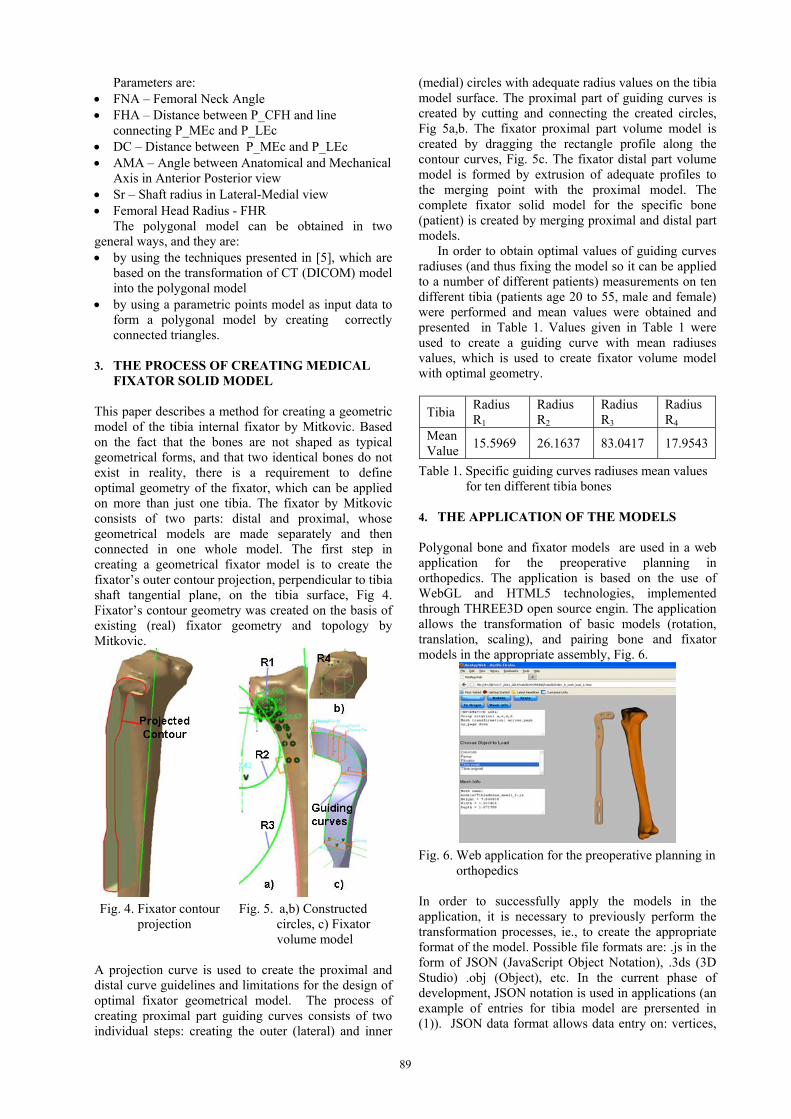
89
Parameters are: FNA – Femoral Neck Angle FHA – Distance between P_CFH and line
connecting P_MEc and P_LEc DC – Distance between P_MEc and P_LEc AMA – Angle between Anatomical and Mechanical
Axis in Anterior Posterior view Sr – Shaft radius in Lateral-Medial view Femoral Head Radius - FHR The polygonal model can be obtained in two general ways, and they are: by using the techniques presented in [5], which are
based on the transformation of CT (DICOM) model into the polygonal model
by using a parametric points model as input data to form a polygonal model by creating correctly connected triangles.
3. THE PROCESS OF CREATING MEDICAL
FIXATOR SOLID MODEL This paper describes a method for creating a geometric model of the tibia internal fixator by Mitkovic. Based on the fact that the bones are not shaped as typical geometrical forms, and that two identical bones do not exist in reality, there is a requirement to define optimal geometry of the fixator, which can be applied on more than just one tibia. The fixator by Mitkovic consists of two parts: distal and proximal, whose geometrical models are made separately and then connected in one whole model. The first step in creating a geometrical fixator model is to create the fixator’s outer contour projection, perpendicular to tibia shaft tangential plane, on the tibia surface, Fig 4. Fixator’s contour geometry was created on the basis of existing (real) fixator geometry and topology by Mitkovic.
Fig. 4. Fixator contour
projection Fig. 5. a,b) Constructed
circles, c) Fixator volume model
A projection curve is used to create the proximal and distal curve guidelines and limitations for the design of optimal fixator geometrical model. The process of creating proximal part guiding curves consists of two individual steps: creating the outer (lateral) and inner
(medial) circles with adequate radius values on the tibia model surface. The proximal part of guiding curves is created by cutting and connecting the created circles, Fig 5a,b. The fixator proximal part volume model is created by dragging the rectangle profile along the contour curves, Fig. 5c. The fixator distal part volume model is formed by extrusion of adequate profiles to the merging point with the proximal model. The complete fixator solid model for the specific bone (patient) is created by merging proximal and distal part models. In order to obtain optimal values of guiding curves radiuses (and thus fixing the model so it can be applied to a number of different patients) measurements on ten different tibia (patients age 20 to 55, male and female) were performed and mean values were obtained and presented in Table 1. Values given in Table 1 were used to create a guiding curve with mean radiuses values, which is used to create fixator volume model with optimal geometry.
Tibia Radius R1
Radius R2
Radius R3
Radius R4
Mean Value
15.5969 26.1637 83.0417 17.9543
Table 1. Specific guiding curves radiuses mean values for ten different tibia bones
4. THE APPLICATION OF THE MODELS Polygonal bone and fixator models are used in a web application for the preoperative planning in orthopedics. The application is based on the use of WebGL and HTML5 technologies, implemented through THREE3D open source engin. The application allows the transformation of basic models (rotation, translation, scaling), and pairing bone and fixator models in the appropriate assembly, Fig. 6.
Fig. 6. Web application for the preoperative planning in
orthopedics In order to successfully apply the models in the application, it is necessary to previously perform the transformation processes, ie., to create the appropriate format of the model. Possible file formats are: .js in the form of JSON (JavaScript Object Notation), .3ds (3D Studio) .obj (Object), etc. In the current phase of development, JSON notation is used in applications (an example of entries for tibia model are prersented in (1)). JSON data format allows data entry on: vertices,

90
triangles, lights, normals, etc.. which completely defines the corresponding 3D model, and the scene where the object model exists. JSON models are created on the basis of polygonal (STL) models in Blender software. { "vertices" : 71251, "faces" : 142498, "normals" : 71251,}, (1) "materials": [ { }], "vertices"=[-0.157411,1.041358,0.140951,...] "normals"=[0.861171,0.032258,-0.507248,...] 5. CONCLUSION Methods for creating human bone and fixators geometrical models are presented in this paper. Considering anatomical and morphological properties of the human bone, presented method(s) enables creation of more realistic, geometrically accurate and anatomically correct models as presented in [6,9,10]. The resulting model(s) of human bone(s) and fixators can be used for various purposes: preoperative planning in orthopedics (presented in this paper), learning processes, implant manufacturing, FEM analysis, etc. In addition to the process of creating geometric models, their use in a web application for the preoperative planning in orthopedics is presented. The application enables basic geometric transformations of bone and implant models, such as : translation, rotation, scaling, zooming, etc., as well as the option to receive data on models ( basic measurements, triangle quantity, and such), and to measure adequate distances on models, both individually and as part. Further work in the research includes improving the method of creating a geometric model for the construction of better quality models in terms of accurate geometry and morphology, as well as creating models of a large number of implants (fixators) and bones (library of models). Regarding the application for preoperative planning, further focus is directed towards the improvement of the algorithm for managing the parametric model. Adeqaute algorithm will allow creation of patient bone geometrical models, solely on the basis of a number of predefined parameters whose values can be read (measured) from the input medical images. ACKNOWLEDGEMENT The paper is part of the project III41017 - Virtual Human Osteoarticular System and its Application in Preclinical and Clinical Practice, sponsored by Republic of Serbia for the period of 2011-2014. 6. REFERENCES [1] Filippi, S., Motyl, B., Bandera, C.: Analysis of
existing methods for 3D modelling of femurs starting from two orthogonal images and development of a script for a commercial software package, Computer methods and programs in biomedicine, 89, p.p. 76-82, 2008
[2] Kyu Lee, M., Hyuk Lee, S., Kim, A., Youn, I., Soo Lee, T., Hur, N., Choi, K.: The Study of Femoral
3D Reconstruction Process Based on Anatomical Parameters Using a Numerical Method , Journal of Biomechanical Science and Engineering, 3, p.p. 443-451,2008
[3] Matthews, F., Messmer, P., Raikov, V., Wanner, G., Jacob, A., Regazzoni, P., Egli, A.: Patient-specific three-dimensional composite bone models for teaching and operation planning, Journal of Digital Imaging, 22, p.p. 473-482, 2009
[4] Sourina, O., Sourina, A., Howe, T.: Virtual Orthopedic Surgery Training on Personal Computer, International Journal of Information Technology, 6, p.p. 16-29, 2000
[5] Stojkovic, M., Trajanovic, M., Vitkovic, N., Milovanovic, J., Arsic, S., Manic, M.: Referential Geometrical Entities for Reverse Modeling of Geometry of Femur,Proceedings of VIP IMAGE 2009, p.p. 189-194, Taylor & Francis Group, Porto, Portugal, 2009
[6] Vitković, N., Trajanović, M., Milovanović, J., Korunović, N., Arsić, S., Ilić, D.: The geometrical models of the human femur and its usage in application for preoperative planning in orthopedics, ICIST 2011, Kopaonik, Serbia, 2011
[7] Veselinovic, M., Vitkovic, N., Stevanovic, D., Trajanovic, M., Arsic, S., Milovanovic, J., Stojkovic, M.: Study on creating human tibia geometrical models, Proceedings of the 3rd International Conference on E-Health and Bioengineering - EHB, p.p. 195-198, Iaşi, Romania, 2011
[8] Trajanović, M., Korunović, N., Milovanović, J., Vitković, N., Mitković, M.: Application of computer models of mitković selfdynabizable internal fixator in rehabilitation of femur traumas, FACTA UNIVERSITATIS Series: Mechanical Engineering, 8, p.p. 27 - 38, 2010
[9] Vitković, N., Milovanović, J., Trajanović, M., Korunović, N., Stojković, M., Manić, M.: Different Approaches for the Creation of Femur Anatomical Axis and Femur Shaft Geometrical Models, Proceedings of ICPE 2011, ICPE 2011, Niš, Serbia, p.p. 351-354, 2011
[10] Stojkovic, M., Milovanovic, J., Vitkovic, N., Trajanovic, M., Arsic, S., Mitkovic, M.: Analysis of femoral trochanters morphology based on geometrical model, Journal of Scientific and Industrial Research, 71, p.p. 210-216, 2012
Authors: M.Sc. Nikola Vitković, M.Sc. Marko Veselinović, Dr Dragan Mišić docent, Prof. Dr. Miodrag Manić, Prof. Dr. Miroslav Trajanović, University of Niš, Faculty of Mechanical Engineering in Niš, LIPS, Aleksandra Medvedeva 14, 18000 Niš, Serbia, Phone.: +381 18 500-669, Prof. Dr. Milorad Mitković, University of Niš, Faculty of Medicine E-mail: [email protected] [email protected]

91
Original Scientific Paper
Williams, R.J., Eggbeer, D., Lapcevic, A., Trifkovic, B., Puskar, T., Budak, I., Jevremovic, D.
RE-CAD/CAM APPROACH IN DESIGN AND MANUFACTURING OF DENTAL CERAMIC CROWNS IN COMBINATION WITH MANUAL INDIVIDUALIZATION
Received: 02 July 2012 / Accepted: 22 August 2012
Abstract: CAD/CAM technology in dentistry offers high-end ceramic restorations, known for its quality, preciseness, swiftness and repeatability. However, some features are still human-dependent. A young female patient required smile enhancement, since suffering from colour change on three devitalized frontal teeth. After fiber post placement, teeth were prepared for metal-free restoration. Consequently, abutments were scanned using extraoral scanner (Sirona, InEos Blue; Beinsheim, Germany). CAD software (version 3.8) has been used to create three crown copings, with cut-back in the incisal region. After finalization of the virtual modeling, data file has been transferred to a milling unit (Sirona, MCXL, Beinsheim, Germany) that produced crown copings out of a ceramic block (IPS e.max CAD, Ivoclar Vivadent, Schaan, Liechtestein). Crowns were tried for the fit and occlusion in the so-called blue stage, after which final strength and shape has been achieved by thermal treatment in the ceramic furnace. Individualization has been done manually, creating special effect in the cut-back region. Crowns were cemented adhesively. CAD/CAM offers modern and relevant way of producing ceramic restorations, however, special effects still require manual adjustments. Key words: CAD/CAM, dentistry, extraoral scanner, computer aided inspection RE-CAD/CAM pristup projektovanju i izradi zubnih keramičkih navlaka u kombinaciji sa ručnim individualnim prilagođavanjem. CAD/CAM tehnologije u stomatologiji nude visoko kvalitetne keramičke zamene, poznate po kvalitetu, preciznosti, brzini izrade i ponovljivosti. Međutim neke opcije još uvek zavise od ljudske intervencije. Mlada pacijentkinja je imala zahtev za poboljšanjem osmeha, pošto je patila od promene boje na tri prednja nezdrava zuba. Posle instalacije vlaknene podloge, zubi su bili spremni za bez-metalnu reparaciju. Otisci su bili skenirani ekstraoralnim skenerom (Sirona, InEos Blue, Beinsheim, Nemačka). CAD softver (verzija 3.8) je korišćen za generisanje tri navlake. Po završetku virtuelnog modeliranja podaci su prebačeni na glodalicu (Sirona, MCXL, Beinsheim, Nemačka) koja je izradila navlake od keramičkih blokova (IPS-a, max CAD, Ivoclar Vivadent, Schaan, Lihtenštajn). Navlake su posle isprobane zbog procene naleganja i začepljenja u tzv. plavoj etapi, posle čega je konačno očvršćavanje i oblikovanje postignuto termičkom obradom u peći za keramiku. Individualno prilagođavanje je izvršeno ručno, sa izradom posebnog efekta u zadnjem delu. Navlake su cementirane adhezijom. CAD/CAM nudi moderan i važan način u izradi keramičkih implanta ali posebni efekti još uvek zahtevaju intervenciju čoveka. Ključne reči: CAD/CAM, stomatologija, ekstraoral skener, računarom podržana inspekcija 1. INTRODUCTION
Striving towards its primary goal – primum non nocere („above all, do not harm“ eng.), the area of dental prosthetics has introduced numerous novel technologies and methods that allow the manufacture of precision, custom-made, optimal dental replacements. During the past decade, efforts have been concentrated towards an advancement of the modelling and manufacture of dental replacements by introducing advanced computer aided (CA) systems, new materials and machining technologies, as opposed to the traditional way of manual manufacture, which is prone to numerous subjective errors. Amongst modern CA systems that have found broad application in this area, the most widely used are 3D digitization systems, computer aided design (CAD) with reverse engineering (RE) and computer aided manufacturing (CAM). The development and implementation of such technologies and systems have paved the way towards a significant advancement in conventional modelling, manufacture
and the inspection of dental replacements [1-5]. RE-CAD/CAM approach has been introduced in
dentistry as a precise, efficient, accurate and error-free tool to produce high-quality dental restorations [1,2]. Practically, it can produce ceramic crowns in matter of hours, enabling reconstruction during single visit [3]. With the use of CAD/CAM, however, limited aesthetic results can be achieved, since individualization is still human-dependent.
CAD/CAM consists of three major parts [4,5]: 1) 3D digitization, 2) RE-CAD and 3) CAM. Current problem with CAM unit is related to the
milling process. It utilizes ceramic blocks, which are namely made out of a single material type. Further development enabled different translucency within a block, where enamel and dentin characteristics are reproduced [6]. These variations are possible within leucite blocks only. Since natural teeth exhibit variations in colour and translucency, they are hard to

92
reproduce with uniform blocks. 2. CASE REPORT ON APPLICATION OF
RE-CAD/CAM APPROACH IN DESIGN AND MANUFACTURING OF CERAMIC CROWNS
A young female patient, 35-year’s old, came into the practice requiring aesthetic enhancement of her anterior teeth. With clinical inspection, it has been concluded that left central, as well as right lateral incizors are devitalized and therefore significantly darker comparing to natural teeth. Right central incisor had a pre-existing metal-free restoration, with an active metal post reinforcement. The appointment was set in two weeks, and three metal-free crowns were planned. Interestingly, exactly on the treatment day, existing crown with the post broke. After removal of the metal post remainings, it became obvious that only dowel metal core can be inserted, due to a very insufficient dentin layer. In order to mask metal background, layers of opaquer were baked prior to cementation. Two other teeth were reconstructed with fibre posts. As a result, however, an uneven background became apparent (Fig. 1).
Fig. 1. Situation prior to impression taking 2.1 3D digitization
After impression taking, a dental cast model was made. For this purposes, a special, scanable gypsum was used (Fujirock EP OptiXscan, GC, Japan). Model was scanned with Cerec In Eos Blue (Sirona, Beinsheim, Germany) 3D digitization system (Fig. 2a). The scanner uses structured light (stripe projection) and has a narrow triangulation angle for deep cavities [7,8].
Blue light indicates a model part that is currently being scanned [10]. The model appears as a virtual model in CAD CEREC version 3.8 (Fig. 2b).
a) Cerec In Eos Blue 3D digitization system with the
detail during the scanning process
b) The result of 3D digitization in CAD CEREC
Fig. 2. The 3D digitization system with the digitization result
2.2 RE-CAD design of dental crowns
First step in creation of virtual crowns is determination of preparation line and insertion axis (Fig. 3). Operator can choose among several possibilities, that are implicated in various morphological bases (such as young, adult, old, Asian, etc.). Consequently, proposal of the crown is created by the software (Fig. 4) [9].
Further modifications of the crowns can be done using manual tools. Once finished, crown is fixed by the software and treated as a natural tooth. Then, a contra lateral incisor is created. Initially, there is an overlap between two crowns, that can be corrected using several crown equators (Fig. 5) [11,12]. Small modifications of the crown shape can be done using manual tools such as adding, removing, smoothening etc. (Fig. 6).
Fig. 3. Determination of the preparation line
Fig. 4. CAD model of the left central incizor
Fig. 5. Processing of the right central incizor in the
CAD module

93
Fig. 6. Manual modification of the size and shape with
specific toolbar Major challenge is creation of cervical isthmus, that appears a consequence of uneven gingival margins. If not paid attention to, it can create disrupted optical image of central incisors, normally know to be the most symmetric teeth in the jaws. 2.3 CAM of dental ceramic crowns
When finished in the CAD, modeled crowns are proceded to CAM module (Sirona MCXL). This is a new version of the milling machine, with accuracy of 25 µm and 60% faster comparing to the previous version. Lithium-disilicate blocks were used (IPS e.max CAD; Ivoclar Vivadent AG; Schaan, Liechtenstein), exhibiting 350 MPa flexural strength (Fig. 7).
To achieve optimal translucency, LT (low translucency) block was the choice. This block enables some level of light penetration, enabling life like appearance but still covering background colour to some intent.
CAM unit mills in a so-called blue block stage, where both hardness and strength of the material are not fully achieved (meta-silicate stage). Since blue blocks do not support stock milling (milling of multiple units out of a block), three C14 blocks were used. After milling and initial trial, blocks were crystalized in a ceramic furnace (Programat P300, Ivoclar Vivadent AG; Schaan, Liechtenstein).
Fig. 7. Cerec CAM unit with blue lithium-disilicate
block 2.4 Manual individualization of dental ceramic crowns
Milling, however, is the final stage in current possibilities of the CAD/CAM systems, in regards of individualization. Any further characteristics have to be done manually.
Individualization can be done using two basic
techniques: 1. layering and 2. staining. Layering creates in depth, profound esthetic
appearance. It, however, requires significant technical skills.
Staining is used as a toll to modify optical impression by superficial colouring of the restoration. In this case, both techniques were used. Fig. 8 presents the application of layering technique with ceramic powders, while the application of staining technique with ceramic stains is shown on Fig. 9.
Fig. 8. Application of the layering technique with
ceramic powders
Fig. 9. Application of staining technique with ceramic
stains
The other issue that cannot be solved with CAD/CAM systems only is background colour coverage. LT ingots still transmit light in a sufficient manner, that enable background colour influence if thickness of the restoration is not more than 1 mm. To predict this unwanted effect, background colour is simulated in the lab by the special die composite (Fig. 10). Therefore, the determination of the final esthetic result is still human-dependent. Finished restorations are shown in Fig. 11.
Fig. 10. Final colour modifications on a special
composite die
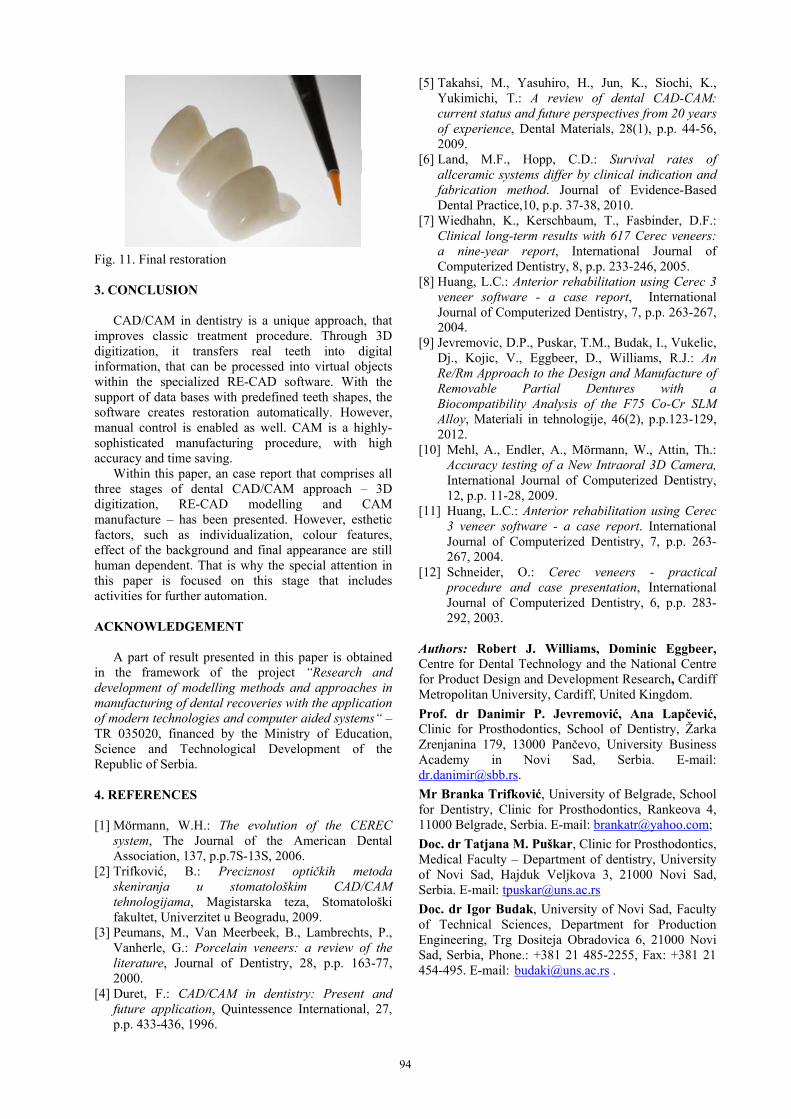
94
Fig. 11. Final restoration 3. CONCLUSION CAD/CAM in dentistry is a unique approach, that improves classic treatment procedure. Through 3D digitization, it transfers real teeth into digital information, that can be processed into virtual objects within the specialized RE-CAD software. With the support of data bases with predefined teeth shapes, the software creates restoration automatically. However, manual control is enabled as well. CAM is a highly-sophisticated manufacturing procedure, with high accuracy and time saving. Within this paper, an case report that comprises all three stages of dental CAD/CAM approach – 3D digitization, RE-CAD modelling and CAM manufacture – has been presented. However, esthetic factors, such as individualization, colour features, effect of the background and final appearance are still human dependent. That is why the special attention in this paper is focused on this stage that includes activities for further automation. ACKNOWLEDGEMENT A part of result presented in this paper is obtained in the framework of the project “Research and development of modelling methods and approaches in manufacturing of dental recoveries with the application of modern technologies and computer aided systems“ – TR 035020, financed by the Ministry of Education, Science and Technological Development of the Republic of Serbia. 4. REFERENCES [1] Mörmann, W.H.: The evolution of the CEREC
system, The Journal of the American Dental Association, 137, p.p.7S-13S, 2006.
[2] Trifković, B.: Preciznost optičkih metoda skeniranja u stomatološkim CAD/CAM tehnologijama, Magistarska teza, Stomatološki fakultet, Univerzitet u Beogradu, 2009.
[3] Peumans, M., Van Meerbeek, B., Lambrechts, P., Vanherle, G.: Porcelain veneers: a review of the literature, Journal of Dentistry, 28, p.p. 163-77, 2000.
[4] Duret, F.: CAD/CAM in dentistry: Present and future application, Quintessence International, 27, p.p. 433-436, 1996.
[5] Takahsi, M., Yasuhiro, H., Jun, K., Siochi, K., Yukimichi, T.: A review of dental CAD-CAM: current status and future perspectives from 20 years of experience, Dental Materials, 28(1), p.p. 44-56, 2009.
[6] Land, M.F., Hopp, C.D.: Survival rates of allceramic systems differ by clinical indication and fabrication method. Journal of Evidence-Based Dental Practice,10, p.p. 37-38, 2010.
[7] Wiedhahn, K., Kerschbaum, T., Fasbinder, D.F.: Clinical long-term results with 617 Cerec veneers: a nine-year report, International Journal of Computerized Dentistry, 8, p.p. 233-246, 2005.
[8] Huang, L.C.: Anterior rehabilitation using Cerec 3 veneer software - a case report, International Journal of Computerized Dentistry, 7, p.p. 263-267, 2004.
[9] Jevremovic, D.P., Puskar, T.M., Budak, I., Vukelic, Dj., Kojic, V., Eggbeer, D., Williams, R.J.: An Re/Rm Approach to the Design and Manufacture of Removable Partial Dentures with a Biocompatibility Analysis of the F75 Co-Cr SLM Alloy, Materiali in tehnologije, 46(2), p.p.123-129, 2012.
[10] Mehl, A., Endler, A., Mörmann, W., Attin, Th.: Accuracy testing of a New Intraoral 3D Camera, International Journal of Computerized Dentistry, 12, p.p. 11-28, 2009.
[11] Huang, L.C.: Anterior rehabilitation using Cerec 3 veneer software - a case report. International Journal of Computerized Dentistry, 7, p.p. 263-267, 2004.
[12] Schneider, O.: Cerec veneers - practical procedure and case presentation, International Journal of Computerized Dentistry, 6, p.p. 283-292, 2003.
Authors: Robert J. Williams, Dominic Eggbeer, Centre for Dental Technology and the National Centre for Product Design and Development Research, Cardiff Metropolitan University, Cardiff, United Kingdom.
Prof. dr Danimir P. Jevremović, Ana Lapčević, Clinic for Prosthodontics, School of Dentistry, Žarka Zrenjanina 179, 13000 Pančevo, University Business Academy in Novi Sad, Serbia. E-mail: [email protected].
Mr Branka Trifković, University of Belgrade, School for Dentistry, Clinic for Prosthodontics, Rankeova 4, 11000 Belgrade, Serbia. E-mail: [email protected];
Doc. dr Tatjana M. Puškar, Clinic for Prosthodontics, Medical Faculty – Department of dentistry, University of Novi Sad, Hajduk Veljkova 3, 21000 Novi Sad, Serbia. E-mail: [email protected]
Doc. dr Igor Budak, University of Novi Sad, Faculty of Technical Sciences, Department for Production Engineering, Trg Dositeja Obradovica 6, 21000 Novi Sad, Serbia, Phone.: +381 21 485-2255, Fax: +381 21 454-495. E-mail: [email protected] .

95
Preliminary Note
Todić, V.V., Suzić, N.
SYSTEMATIZATION OF PREVENTIVE MAINTENANCE PROCEDURES OF BRAKING SYSTEMS FOR RAIL VEHICLES AND CRITERIA FOR BRAKE INSERTS
REPLACEMENT Received: 10 September 2012 / Accepted: 15 October 2012
Abstract: Braking systems used in the Serbian Railways have a significant impact on the safety of railway transportation. Therefore, preventive maintenance procedures and criteria for the timely replacement of consumable elements of braking system are extremely important to the security of railway transport. This paper presents a systematization of preventive maintenance procedures and criteria for the replacement of consumable elements of braking system. Key words: braking systems, pedal brakes, disc brakes, brake inserts Sistematizacija postupaka preventivnog održavanja kočionih sistema šinskih vozila i kriterijuma za zamenu kočionih umetaka. Kočioni sistemi koji se koriste u železnicama Srbije imaju značajan uticaj na bezbednost železničkog saobraćaja. Zbog toga postupci preventivnog održavanja i kriterijumi za pravovremenu zamenu potrošnih elemenata kočionih sistema imaju izuzetan značaj u bezbednosti železničkog saobraćaja. U radu je prikazana sistematizacija postupaka preventivnog održavanja i kriterijuma za zamenu potrošnih elemenata kočionih sistema. Ključne reči: kočioni sistemi, kočnice sa papučama, disk kočnice, kočioni umeci 1. INTRODUCTION
Using rail vehicles presents a clear need for controlling the movement of a single composition or a single rail vehicle. The increase in speed of a rail vehicle is achieved through towing engine of the vehicle ie. the locomotive, while brake systems, located in each vehicle, are used to slow down the vehicle. Brake systems may be used to reduce the speed and for the full stop of the composition.
Brake includes the system of assemblies and devices that are organized into one unit on the rail vehicle. Control of this assembly is done from the locomotive. The principle of the present braking procedure is turning of the kinetic energy of rail vehicle into heat by work of the friction force. Depending on which type of brakes are applied a different form of friction is achieved.
2. BASIC TYPES AND DIVISION OF BRAKE SYSTEMS
Development of towing and towed vehicles, and the entire railway infrastructure, is followed by ongoing development of appropriate brake systems and brakes. Braking systems are complex systems that include a wide range of components that are physically found from the cabin to the wheels themselves [1]. Brakes represent very important devices built on the rail vehicles. Their importance is reflected in the safety of rail transport, as it is very often more important to stop than to move the rail vehicle. Brakes on rail vehicles can be divided as shown in Figure 1, according to the braking performance. At railway vehicles in the Republic of Serbia, the most represented brakes are pedal brakes and disc brakes. These two types of brakes are a group with a friction braking.
Fig. 1. Brake types
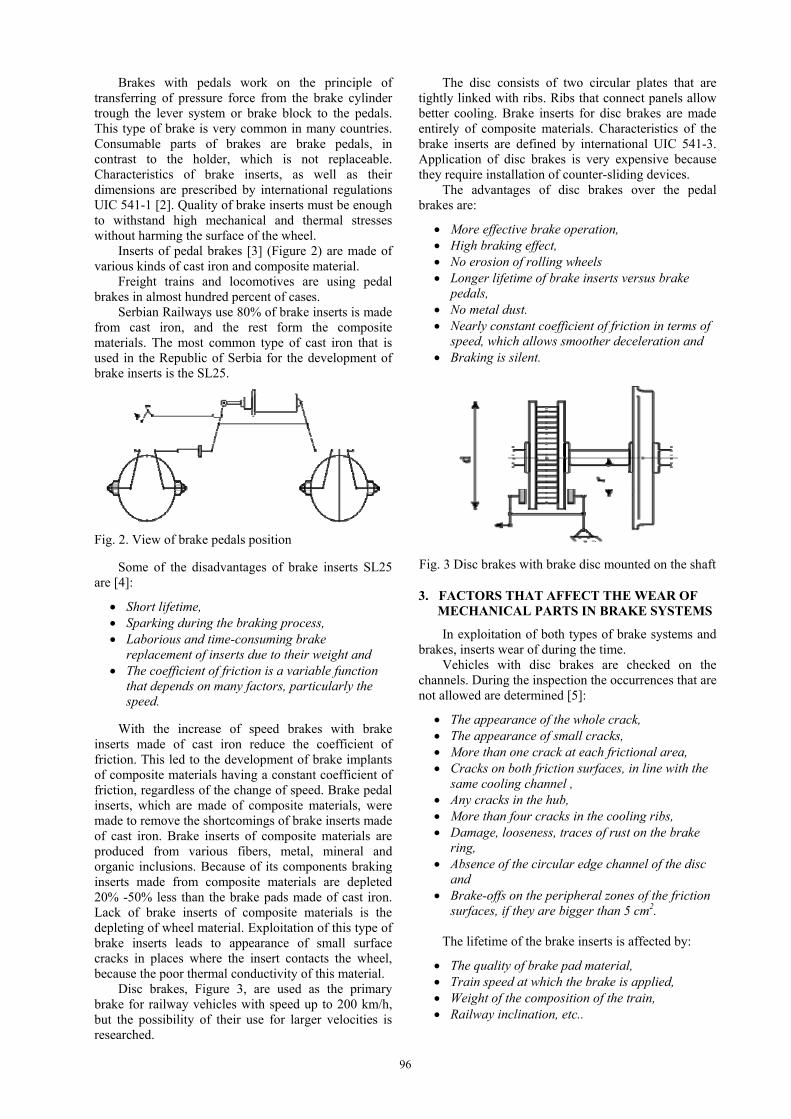
96
Brakes with pedals work on the principle of transferring of pressure force from the brake cylinder trough the lever system or brake block to the pedals. This type of brake is very common in many countries. Consumable parts of brakes are brake pedals, in contrast to the holder, which is not replaceable. Characteristics of brake inserts, as well as their dimensions are prescribed by international regulations UIC 541-1 [2]. Quality of brake inserts must be enough to withstand high mechanical and thermal stresses without harming the surface of the wheel.
Inserts of pedal brakes [3] (Figure 2) are made of various kinds of cast iron and composite material.
Freight trains and locomotives are using pedal brakes in almost hundred percent of cases.
Serbian Railways use 80% of brake inserts is made from cast iron, and the rest form the composite materials. The most common type of cast iron that is used in the Republic of Serbia for the development of brake inserts is the SL25.
Fig. 2. View of brake pedals position
Some of the disadvantages of brake inserts SL25 are [4]:
Short lifetime, Sparking during the braking process, Laborious and time-consuming brake
replacement of inserts due to their weight and The coefficient of friction is a variable function
that depends on many factors, particularly the speed.
With the increase of speed brakes with brake inserts made of cast iron reduce the coefficient of friction. This led to the development of brake implants of composite materials having a constant coefficient of friction, regardless of the change of speed. Brake pedal inserts, which are made of composite materials, were made to remove the shortcomings of brake inserts made of cast iron. Brake inserts of composite materials are produced from various fibers, metal, mineral and organic inclusions. Because of its components braking inserts made from composite materials are depleted 20% -50% less than the brake pads made of cast iron. Lack of brake inserts of composite materials is the depleting of wheel material. Exploitation of this type of brake inserts leads to appearance of small surface cracks in places where the insert contacts the wheel, because the poor thermal conductivity of this material.
Disc brakes, Figure 3, are used as the primary brake for railway vehicles with speed up to 200 km/h, but the possibility of their use for larger velocities is researched.
The disc consists of two circular plates that are tightly linked with ribs. Ribs that connect panels allow better cooling. Brake inserts for disc brakes are made entirely of composite materials. Characteristics of the brake inserts are defined by international UIC 541-3. Application of disc brakes is very expensive because they require installation of counter-sliding devices.
The advantages of disc brakes over the pedal brakes are:
More effective brake operation, High braking effect, No erosion of rolling wheels Longer lifetime of brake inserts versus brake
pedals, No metal dust. Nearly constant coefficient of friction in terms of
speed, which allows smoother deceleration and Braking is silent.
Fig. 3 Disc brakes with brake disc mounted on the shaft
3. FACTORS THAT AFFECT THE WEAR OF MECHANICAL PARTS IN BRAKE SYSTEMS
In exploitation of both types of brake systems and brakes, inserts wear of during the time.
Vehicles with disc brakes are checked on the channels. During the inspection the occurrences that are not allowed are determined [5]:
The appearance of the whole crack, The appearance of small cracks, More than one crack at each frictional area, Cracks on both friction surfaces, in line with the
same cooling channel , Any cracks in the hub, More than four cracks in the cooling ribs, Damage, looseness, traces of rust on the brake
ring, Absence of the circular edge channel of the disc
and Brake-offs on the peripheral zones of the friction
surfaces, if they are bigger than 5 cm2. The lifetime of the brake inserts is affected by:
The quality of brake pad material, Train speed at which the brake is applied, Weight of the composition of the train, Railway inclination, etc..

97
If material, and the relation of substances in the material is not suitable, brake pad lifetime will be shorter. The choice of material for making brake inserts can have a direct impact on the wear of disk or wheel, which are much harder to replace. The choice of material should meet the quality criteria to be met by manufactured brake inserts. Material for the production of brake inserts must not contain lead, heavy metals, solvents, rubber, etc.. [6] Great impact on the quality of the brake inserts has the production process itself.
Brake inserts wear most when composition brakes. Mass of composition is also a factor that affects the
wear of brake inserts. The bigger composition mass, and the inclination of the railway both affect the wear of brake inserts. Stopping of the train on the railway with rise affects the brake inserts considerably.
4. BASIC PHASES OF PREVENTIVE MAINTENANCE OF BRAKE SYSTEMS
Due to safety of railway traffic the inspection of brake systems on all rail vehicles is conducted. Inspection of air brakes is divided into four types: Type A includes a complete test of brakes, while braking and release the brakes is examined for all vehicles in the composition. Type B means the testing of brakes, with brake and release examined in all additional vehicles in one composition. Type C is the test that inspects the braking and release of the first braking vehicle located behind the split point. Type D test involves the examination of the main line, while braking and release of the braking vehicle at the end of the composition is checked.
The shorter testing of brakes means testing by type B, C or D.
Brake test is performed by the locomotive driver and review employee. The pressure in the main line should be at 5 bar. The time to charge up the air brakes working pressure of 5 bar code is:
Completely empty individual car without air, 2 to 4 minutes
Freight train of 60 to 80 axles, 6 to 8 minutes Freight train of 120 axles, 10 to 12 minutes Passenger train of 60 axles, 3 to 6 minutes.
Review workers check both sides of the train to
find:
Are all vehicles properly included in the main line,
Are all distributors connected, Are all vehicles cocked, Are the hand brakes all cocked, Does the gearshifts of brakes and braking force
on the correct position, With hearing sense reveal unsealed spots, Are the brake inserts of prescribed thickness, Is there mechanical damage affecting the proper
operation of the brake and Is involved rapid discharges of the main line
turned on.
After these inspections, the train driver checks the connection of main line with the main tank checking if it is sealed properly. If not satisfactory-sealed, disputed cars of the compositions are excluded. Thereafter, the train driver puts down the to 4.5 bar, and review employee evaluates if inserts are resting properly. This inspection is done according to the following procedure:
For inserts made of cast iron by hammering, For composite inserts pushing pedals with a
hammer For disc brakes reviewing whether inserts fit and
whether the control pointing devices shows blocked.
If inserts are resting properly train driver cocks of
the composition. Train driver places the handle in the possition of fast breaking , and than into the driving position. Review worker checks if the brakes are cocked, ie. is the gap on the entire range of pedals from 5 to 10 mm. If some inserts are not detached the detaching device is used.
Shortened brake preventive tests are carried out in stations while composing the towing and towed vehicles, if the test of type A and test of type D were made in less than 24 hours. In the event of a merger of two trains which were previously inspected in less than 24 hours with brake test type A test, the test of the main line - type D should be made. After the inclusion of one or more cars in one or more spots on the train, it is necessary to do:
Individual brake test of type B Examination of the main line type D.
If we have to uncouple one or more cars from any
part of the train, it is necessary to pass the test of the main line of type D. If after completion of the train ride or after dissolve in a passing station train continues moving in the same composition, it is necessary to pass the test of the main line of type D, provided that in the last 24 hours train had complete type A brake test.
The time required for testing of brakes with type A
test:
For a freight train of 100 axle, one employee ant the driver, 40 minutes or
Two operators and a driver, 20 minutes or One worker and fixed installations, 50 minutes The passenger train from 40 axles, 20 minutes.
Mentioned time is calculated after the merger of
towing vehicle (or stable plant) and charging brakes of all vehicles on the train up to work pressure.
Shortened the time required for the test of type B, C or D:
The freight train of 100 axle, 15 minutes Passenger train of 40 axles, 7 minutes.

98
5. CRITERIA FOR REPLACEMENT OF BRAKE INSERTS
For reliable movement of trains it is very important to check the validity of the brake system of composition.
Figure 4 shows the process of brake inspection and brake criteria for inserts replacement.
When the brake pedal is checked, the insert thickness, clearance and regularity of seating is inspected. If the thickness of the pad is less than 10 mm
the replacement should be done. The clearance between pedals and the wheel should be in the range of 5-10 mm. Checking the proper insertion of the pedal made of cast iron is done by hammering, and inserts from composite material are checked by pushing of pedals.
In disc brakes the thickness of inserts, the clearance between the insert and the disc and the proper fit is checked. If the thickness of the pedal is less than 5 mm it must be replaced. The clearance between the rotor and the pad should be 1-2 mm. Proper fit tests is done visually or using a pointing device.
Fig. 4. The procedure for brakes inspection 6. CONCLUSIONS
Procedures for preventive maintenance of brake
systems on the railways of Serbia have a significant impact on increasing of the safety of railway transportation.
Criteria for replacement of consumable elements of brake systems, as well as inspection of clearance and proper overlap of brake inserts on the wheels or discs, which are defined by the Directive on the braking of trains, set the main phase of work in the maintenance of brake systems, and also make a significant contribution to the safety of the railway transport.
ACKNOWLEDGEMENTS
Research for this article was conducted under the project “Development of software to manage repair and installation of brake systems for rail vehicles”, Ministry of Science of Serbia, no. 035050, for the period 2011th-2014th year.
7. REFERENCES
[1] Guido P.; Guido C.: Per bogie or per car brakes; which is better?, International Railway Journal; ProQuest Central, Vol. 49, No.2, pp. 30, 2009;.
[2] Tepić Đ. J.: Vuča vozova, FTN Izdavaštvo, Novi Sad, 2008.
[3] Milovanović M.; Lišanin R.: Kočnice i kočenje šinskih vozila, teorijske osnove, Mašinski fakultet, Beograd, 2000.
[4] Tepić Đ. J.: Šinska vozila, FTN Izdavaštvo, Novi Sad, 2007.
[5] Zajednica jugoslovenskih železnica: Uputstvo o kočenju vozova, Beograd, 1998.
[6] Hodges T.: A life- cycle approach to braking costs, International Railway Journal; ProQuest Central; Vol. 52, No. 5, pp. 47, 2012.
Authors: MS.c Vladimir V.Todic- Joung researcher, Mr Nikola Suzic- Assistant, University of Novi Sad, Faculty of Technical Sciences, Trg Dositeja Obradovića 6, 21000 Novi Sad, Serbia E-mail: [email protected]

99
Preliminary Note
Milanković, D., Milanović, B., Agarski, B., Crnobrnja, B., Ilić, M., Kosec, B., Budak, I.
LIFE CYCLE ASSESSMENT OF AN INTERMODAL STEEL BUILDING UNIT IN SERBIA
Received: 05 May 2012 / Accepted: 30 June 2012
Abstract: In order to minimize and eventually, in the future, eliminate the negative environmental impacts, such as emissions, waste, energy and excessive raw material consumption etc., of construction, and simultaneously move closer to sustainable development in the society, the life cycle assessment of buildings is essential. This paper provides an insight in environmental life cycle assessment (LCA) of a typical intermodal steel building unit (ISBU) in Serbia. The goal of this study was to determine the impact of ISBU lifetime on environment. For materials and methods in this work, a combination of input–output and process analysis was used in assessing the potential environmental impact associated with the system under study according to the ISO14040 methodology. The study covered the whole life cycle including material production, construction, occupation, maintenance, demolition, and disposal. Keywords: Life Cycle Assessment – LCA, intermodal steel building unit, environmental impact, Serbia Procena životnog ciklusa intermodalne čelične jedince zgrade u Srbiji. U cilju smanjenja, a u budućnosti i eliminisanja, negativnih environmentalnih uticaja, kao što su zagađenja, otpad, prekomerno iskorišćavanje energije i sirovina itd, konstrukcija a ujedno i približavanje održivog razvoja u društvu, procena životnog ciklusa zgrada je neophodna. Ovaj rad pruža uvid u procenu životnog ciklusa (LCA) tipske čelične intermodalne jedinice zgrade (ISBU) u Srbiji. Cilj ove studije je određivanje uticaja životnog ciklusa ISBU na okolinu. Kao materijal i metode, kombinacija ulazno-izlaznih i analiza procesa je korišćena u određivanju potencijala uticaja na životnu sredinu shodno sistemu definisanom ISO14040. Studija pokriva ceo ciklus uključujući izradu materijala, konstrukcije, korišćenje, održavanje, rasklapanje i odlaganje. Ključne reči: procena životnog ciklusa-LCA, intermodalne čelične jedinice zgrade, uticaj na okolinu, Srbija 1. INTRODUCTION
The built environment is a major contributor to both social an d ec onomic devel opment an d represents a large portion of real capital in many countries; but it is also a primary source of environm ental im pacts. Furthermore, exi sting bui lding st ock req uires continuous investments for repair and renovations. The notion t hat b uilding st ructures t hat would l ast for centuries is t he b est env ironmental so lution to ou r problems does not match with our existing building use trends an d knowledge of th e bu ilt en vironment. Buildings will be replaced with newer designs that are more sui ted t owards t he needs of future occ upants. Energy is an essen tial inpu t to ev ery production, transport, an d com munication process a nd i s t hus a driver for the econom ic as well as social devel opment of a ny nat ion. T he b uilding c onstruction i ndustry consumes 40% of the m aterials ent ering t he gl obal economy and generates 40–50% of the global output of greenhouse gases and the agents of acid rain [1,2]. The growing c oncern o f e nvironmental pr oblems, such as global w arming, wh ich hav e been link ed t o th e extended u se o f en ergy, h as in creased bo th the importance of al l ki nds of so-called ‘‘energy savi ng measures’’, a nd t he necessity for a n increase d efficiency in all fo rms of energy utilization [6,7]. As a consequence of the latest reports on climate change and the need for a reduction in CO2 emissions, huge efforts
must be made in the future to conserve high quality, or primary energy, resource s [9 ]. Wh ile con suming larg e amounts o f e nergy, building i ndustry has al so ca use large b urden on t he e nvironment du e t o t he environmental emissions by the production of building materials and t he ru nning of b uilding system [2] . Extraction or pu rification o f m aterials fro m th eir natural ores i s an activity that cons umes energy, generates waste, and also contributes to environmental damage wi th ne gative i mpacts s uch a s res ource depletion, biological diversity losses, and other. On the other hand they provide the necessary infrastructure for many productive activities such as indu stries, services, commerce, and utilities, an d th us satisfy a v ery b asic human need. However, due to this very basic nature of buildings, st akeholders i n development som etimes do not c onsider t he en vironmental im pacts of building, especially in developing econom ies. Life cycle assessment (LCA) is a very helpful too l in th is regard as it not only provide s a n account of materials and energy i nvolved i n a pr oduct or sy stem but al so measures the associated environmental impacts [10]. 2. METHODOLOGY
As a significant tool of environmental management, life-cycle asse ssment has b ecome an in ternationally recognized c riterion. It is the b asis for estab lishing environmental policy and is generally used to guide the
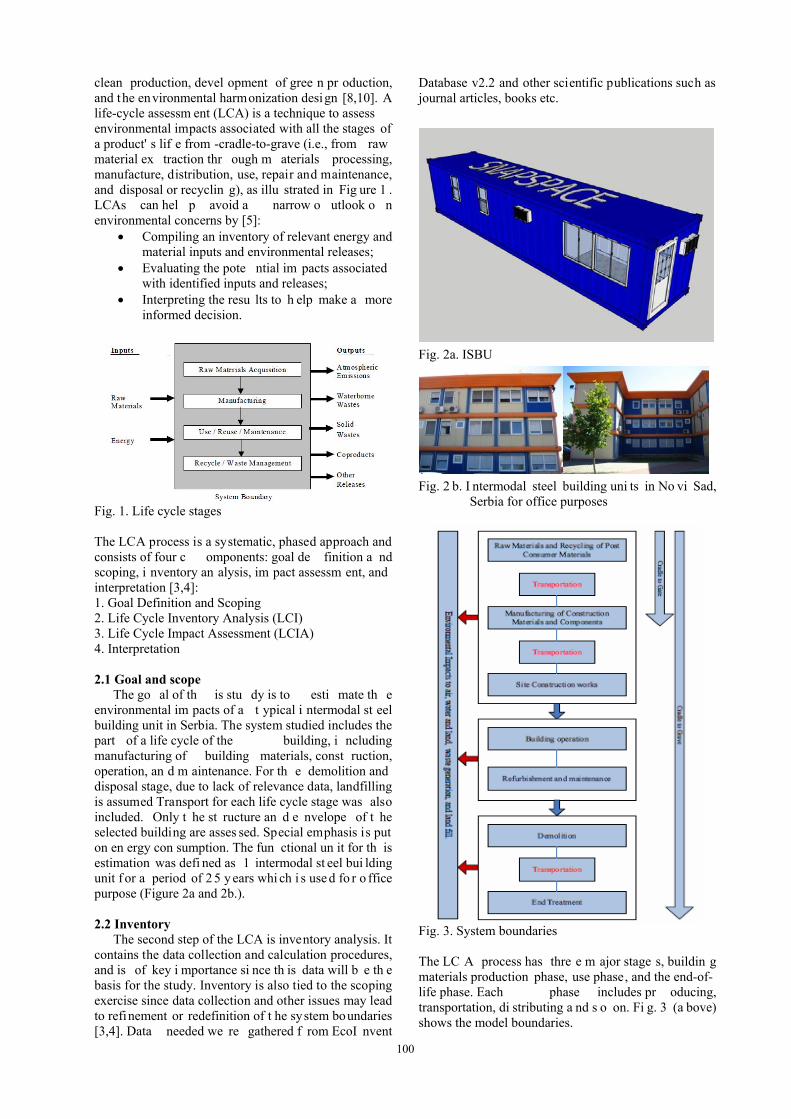
100
clean production, devel opment of gree n pr oduction, and the environmental harmonization design [8,10]. A life-cycle assessm ent (LCA) is a technique to assess environmental impacts associated with all the stages of a product' s lif e from -cradle-to-grave (i.e., from raw material ex traction thr ough m aterials processing, manufacture, distribution, use, repair and maintenance, and disposal or recyclin g), as illu strated in Fig ure 1 . LCAs can hel p avoid a narrow o utlook o n environmental concerns by [5]:
Compiling an inventory of relevant energy and material inputs and environmental releases;
Evaluating the pote ntial im pacts associated with identified inputs and releases;
Interpreting the resu lts to h elp make a more informed decision.
Fig. 1. Life cycle stages The LCA process is a systematic, phased approach and consists of four c omponents: goal de finition a nd scoping, i nventory an alysis, im pact assessm ent, and interpretation [3,4]: 1. Goal Definition and Scoping 2. Life Cycle Inventory Analysis (LCI) 3. Life Cycle Impact Assessment (LCIA) 4. Interpretation
2.1 Goal and scope
The go al of th is stu dy is to esti mate th e environmental im pacts of a t ypical i ntermodal st eel building unit in Serbia. The system studied includes the part of a life cycle of the building, i ncluding manufacturing of building materials, const ruction, operation, an d m aintenance. For th e demolition and disposal stage, due to lack of relevance data, landfilling is assumed Transport for each life cycle stage was also included. Only t he st ructure an d e nvelope of t he selected building are asses sed. Special emphasis is put on en ergy con sumption. The fun ctional un it for th is estimation was defi ned as 1 intermodal st eel bui lding unit f or a period of 2 5 y ears whi ch i s use d fo r o ffice purpose (Figure 2a and 2b.). 2.2 Inventory
The second step of the LCA is inventory analysis. It contains the data collection and calculation procedures, and is of key i mportance si nce th is data will b e th e basis for the study. Inventory is also tied to the scoping exercise since data collection and other issues may lead to refinement or redefinition of t he system boundaries [3,4]. Data needed we re gathered f rom EcoI nvent
Database v2.2 and other scientific publications such as journal articles, books etc.
Fig. 2a. ISBU
Fig. 2 b. I ntermodal steel building uni ts in No vi Sad,
Serbia for office purposes
Fig. 3. System boundaries
The LC A process has thre e m ajor stage s, buildin g materials production phase, use phase, and the end-of-life phase. Each phase includes pr oducing, transportation, di stributing a nd s o on. Fi g. 3 (a bove) shows the model boundaries.

101
Building parameters Specifications
Dimensions 12.2 x 2.4 x 2.6 Service life 25 years Floor area ~30m2
Office volume 67.7 m3 Structure S teel Envelope Steel
Foundation Reinforced concrete Coverings Gypsum, Plaster, Insulation
Floor finish Linoleum Windows PVC
Table 1. Input data gathered for assessment of ISBU
3. OBTAINED RESULTS
3.1 Impact Assessment
The assessm ent fo llows the LCI an alysis first categorizes the im pacts (re sources c onsumption a nd emissions) i nto a range of im pact categories. The characterization step is then performed, which converts the qu antities o f various types of im pacts u nder each category in to equ ivalent quantities of a referen ce impact (e.g. methane into an equivalent amount of CO2
under t he global warming cat egory), y ielding one single impact indicator for ea ch impact category. Each impact indicator retains the unit of measurement of the quantity. In t his case, t he BEES m ethod is em ployed. BEE S is the acron ym for B uilding for En vironmental an d Economic Sustainability, a software too l developed by the Nation al Institute of St andards and Technology (NIST). BEES combines a partial life cycle assessment and life cycle cost for building and constructio n materials in to one tool. Results are p resented in terms of life cycle assessm ent im pacts, c osts, or a combination o f bo th. BEES striv es to assist th e architect, engi neer, or purc haser t o c hoose a pr oduct that balance s environmental and econom ic performance, th us finding co st-effective so lutions fo r protecting t he en vironment. B EES uses t he S ETAC method of cl assification an d c haracterization. Characterization results are illustrated on Fig. 4. Impact is represente d via 12 im pact categories a ccording to BEES m ethodology. Fi g. 5 pr esents t he res ults o f energy co nsumption com pared during t he pr oduction and i nstallation st age an d operation a nd use st age.
Fig. 4. Characterization results of an ISBU production stage
Fig. 5. Characterization results of an ISBU regarding energy consumption
102
4. CONCLUSIONS
The general conclusion i s that bui lding with ISBU units from the aspect of evaluating the entire life cycle has its advantages. Based on the results obtained, ISBU that is analyzed indicat es certain problem areas observed i n t he pr oduct l ife cycle and t hat wi thin t he impact categories: Water i ntake, Oz one depletion and Global warm ing. Th e larg est i mpact with in th e abov e mentioned categories results from processes of c ement production that is used for the foundation on which the object is installed and also st eel from whic h structure and en velope is b uilt. Pro cesses o bserved in th e u se phase o f the ISBU life cycle with its in fluence on the environment stands out from the re st, m ainly because of th e t otal electricity co nsumption in the assu med lifetime of 25 years . T hese problems can be successfully overc ome if the existing s tructure is adapted t o t he ri gorous requirements of a LEE D (Leadership i n Ene rgy an d En vironmental Desi gn) certification. A LEED-certified office is desig ned an d constructed in accorda nce with the rigorous gui delines of th e LEED for Offices green bu ilding certificatio n program. LEED for Offices is a conse nsus-developed, third p arty-verified, voluntary rat ing sy stem whi ch promotes t he desi gn an d const ruction of high-performance green offices. Main advanta ges of ISBU modules are:
Strongest building construction on the planet Earthquake proof Fire proof Strong non-corrosion Corten steel Extreme security Recyclable - Green construction and
modifications Saves trees Unibody construction Ideal for multiple floors and levels Fast construction Insulation: bonds easily with space-age Ceramic
insulations Easily adapted to Prefab automation Easily adapted to custom homes/offices
Inter-modal Steel Building Units (ISBU) have become very p opular and t rendy fo r use as h ome, st orage, prefab, a nd business co nstruction purposes. O nly recently has the world begun to realize their value in housing, o ffice const ruction, st orage an d em ergency shelters. The possibilities are v irtually endless. One of the reasons for all the interest globally was the low cost of construction. ACKNOWLEDGMENT
A part o f resu lt p resented in th is paper is ob tained in the fram ework o f the project “Con tinuous q uality improvement of products and processes throughout the entire life cycle”, T R 114-451-1924/2011-02, supported by the Provincial Secretariat for Science and
Technological Devel opment of AP Vo jvodina, Republic of Serbia. 5. REFERENCES [1] Cheng, E WL, Chiang, Y H, Tang, BS: Exploring
the economic impact of construction pollution by disaggregating the construction sector of the input–output table, B uild En viron 4 :1940–195, 2006
[2] Adal berth, K.: Energy use during the life cycle of buildings: a method. B uild Envi ron 3 2(4):317–320, 1997
[3] Gui née, JB: LCA - An Operational Guide to the ISO-Standards, Kluwer Academic Publisher, Dordrecht, The Netherland 2002
[4] Heijungs, R., Suh, S.: The computational structure of life cycle assessment. Kluwer Ac ademic Publisher, Dordrecht, The Netherland, 2002
[5] IS O 14 040: Environmental Management—Life Cycle Assessment—Principles and Framework. International Or ganization fo r Standardization (ISO), Paris, 2006
[6] Osm an, A., Ries, R.: Life cycle assessment of electrical and thermal energy systems for commercial buildings. Int J Life Cycle Assess 12(5):308–316, 2007
[7] Scheuer, C., Keoleian, G.A., Reppe, P.: Life cycle energy and environmental performance of a new university building. Modeling challenges and design implications. Energy Build 35 :1049–1064, 2003
[8] Anderson, J., Shiers, D.E., Sinclair, M.: The green guide to specification: an environmental profiling system for building materials and components, 3rd edn. Blackwell Science, Malden, MA, 2002
[9] Bor jesson, P., Gustavsson, L.: Greenhouse gas balances in building construction: wood versus concrete from life-cycle and forest land-use perspectives. Energy Policy 28(9):575–588, 2000
[10] Kellenberger, D., Alth aus, H-J: Relevance of simplifications in LCA of building components. Build Environ 44(4):818–825, 2009
Authors: MSc Darko Milanković, MSc Branislav Milanović, Assist. MSc Boris Agarski, MSc Branislava Crnobrnja, MSc Milana Ilić, Assist. Prof. Dr Igor Budak, University of Novi Sad, Faculty of Tec hnical Sci ences, T rg Dosi teja Obradovica 6 , 21000 Novi Sad, Serbia, E-mail: [email protected]; [email protected]; [email protected]; [email protected] [email protected]; [email protected];
Prof. Dr Borut Kosec, University o f L jubljana (Faculty of Natural Sci ences a nd E ngineering), Kongresni trg 12, 1000 Ljubljana, Slovenia, E-mail: [email protected]

103
Preliminary Note
Novak-Marcincin, J., Novakova-Marcincinova, L.
PRODUCTION OF PARTS REALIZED BY FDM RAPID PROTOTYPING TECHNOLOGY AND THEIR TESTING
Received: 10 July 2012 / Accepted: 28 August 2012
Abstract: Paper presents knowledge about types of test in area of materials properties of selected methods of rapid prototyping technologies. In today used rapid prototyping technologies for production of models and final parts materials in initial state as solid, liquid or powder material structure are used. In solid state various forms such as pellets, wire or laminates. Basic range materials include paper, nylon, wax, resins, metals and ceramics are used. In Fused Deposition Modelling (FDM) rapid prototyping technology as basic materials ABS, polyamide, polycarbonate, polyethylene and polypropylene are mainly used. For advanced FDM applications are used special materials as silicon nitrate, PZT, aluminium oxide, hydroxypatite and stainless steel. Key words: rapid prototyping, fused deposition modelling, rapid prototyping materials, materials testing Proizvodnja delova FDM tehnologijom brzom izradom prototipa i njihovo testiranje. Ovaj rad prestavlja bazu tipova testova iz oblasti osobina materijala pri izboru metode brze izrade prototipa. Danas se tehnologije brze izrade prototipa koriste za proizvodnju modela i gotovih delova od materijala u čvrstom stanju, tečnom ili materijala u prahu. Postoje različite forme u čvrstom stanju kao što su peleti, žice ili laminati. Kao osnova koristi se papir, najlon, vosak, smole, metali i keramika. U FDM (solidifikacija istopljenog materijala) tehnologiji brze izrade prototipa kao osnovni materijali koriste se ABS, poliamid , polikarbonat, polietilen i polipropilen. Za napredne FDM aplikacije koriste se posebni materijali kao što su silicijum nitrat, PZT, aluminijum-oksid, hidroksipatit i nerđajući čelik. Ključne reči: brza izrada prototipa, solidifikacija istopljenog materijala, materijali za brzu izradu prototipa, test materijali 1. INTRODUCTION Rapid Prototyping (RP) involves creating a realistic model of a product’s user interface to get prospective customers involved early in the design of the product. Using rapid prototyping, you model the look and feel of the user interface without investing the time and labour required to write actual code. Then you show the prototype to prospective customers, revise the prototype to address their comments, and keep repeating these two steps. Your goal is to produce a complete, agreed-upon design of the product’s user interface before writing a single line of actual code. When walkthroughs and usability tests show you that customers are delighted with your prototype user interface, then programmers can model it when they code the actual product [1]. Rapid prototyping can be defined as a group of techniques used to quickly fabricate a scale model of a physical part or assembly using three-dimensional computer aided design (CAD) data. Construction of the part or assembly is usually done using 3D printing technology. The first techniques for rapid prototyping became available in the late 1980s and were used to produce models and prototype parts. Today, they are used for a much wider range of applications and are even used to manufacture production-quality parts in relatively small numbers. Some sculptors use the technology to produce exhibitions. There are a multitude of experimental RP methods
either in development or used by small groups of individuals. This paper will focused on RP techniques that are currently commercially available, including Stereolithography (SLA), Laminated Object Manufacturing (LOM), Selective Laser Melting (SLM) and Fused Deposition Modelling (FDM) techniques. 2. BASIC RAPID PROTOTYPING METHODS Stereolithography (SLA), also known as optical fabrication, photo-solidification, solid free-form fabrication and solid imaging, is an additive manufacturing 3D printing technology used for producing models, prototypes and production parts. The term Stereolithography was coined in 1986 by Charles W. Hull who patented it as a method and apparatus for making solid objects by successively printing thin layers of the ultraviolet curable material one on top of the other. Hull's patent described a concentrated beam of ultraviolet light focused onto the surface of a vat filled with liquid photopolymer. The light beam draws the object onto the surface of the liquid layer by layer, and using polymerization or cross-linking to create a solid, a complex process which requires automation. In 1986, Hull founded the first company to generalize and commercialize this procedure 3D Systems Inc. which is currently based in Rock Hill Sc. [1]. The Laminated Object Manufacturing (LOM) technique is used to produce low cost polymeric

104
products (from polyvinyl chloride) that have to meet certain mechanical properties, especially if they are used to perform functional tests. The workers of Faculty of Mechanical Engineering and Naval Architecture of University of Zagreb (Croatia) realised testing the influence of the position of products in the machine working area on the mechanical properties of the product [2]. The test specimens made by LOM procedure was made of PVC film. The test bodies in LOM procedure was made on the machine SD 300 Pro, produced by Solido. SD 300 Pro is a machine which can produce transparent prototypes of PVC film, has small dimensions, and is practical for use in offices. Tests were carried out on specimens made using various orientations in the working area (Fig. 1): - Lxy - test specimen laid in xy plane with height in z
direction 4 mm, - Pxy - test specimen raised in xy plane with height in z
direction 10 mm, - Pz - test specimen raised in z-axis with height 75 mm
and 80 mm depending on whether the specimen is for tension or bending tests.
Fig. 1. Orientation of layers in test specimen produced
by LOM [2] LOM procedure provides low surface roughness parameters in all three orientations. However, the lowest are in Lxy orientation which is only logical since the final layer is pure PVC film, independent of the construction (lamination) method. In test specimens Pxy and Pz, Ra is 95 times greater (Ra = 3 μm) than in Lxy orientation. The specimens of Lxy orientation have the highest strain, even up to an average of εp = 207 %, whereas the test specimens of Pz orientation have only εp = 24 %, which is 8.5 times lower value. However, it is interesting to note that the highest strength is not the feature of the test specimens of Lxy orientation, but the test specimens of Pxy orientation. Orientation affects also the fracture surface and in test specimens Pxy the surface is toothed, i.e. delamination of layers has occurred, whereas in Lxy and Pz the surface is flat. Such fracture in Pxy orientation occurs because the stresses are applied along each layer, and in Pz orientation the fracture occurs perpendicularly to the applied test force, and this is at the same time the layer lamination. The tests carried out at LOM test specimen lead to the conclusion that Pxy orientation features optimal properties. Possibly, in case of minimal roughness requirement and higher yield stress, Lxy orientation should be selected. The price and the
manufacturing speed also depend on the orientation and chamber filling, so that the orientations in z-axis direction should be avoided as much as possible [2]. Selective Laser Melting (SLM) is the digitally driven process if direct from sliced 3D CAD data in layer thicknesses ranging from 20 to 100 μm products are realized. The process then builds the part by distributing an even layer of metallic powder using a recoater, then fusing each layer in turn under a tightly controlled inert atmosphere. Once complete, the part is removed from the powder bed and undergoes heat treatment and finishing. For the SML components were realized on the TU of Cluj-Napoca (Romania) tests with application of different SML machine parameters. SLM is a complex thermo-physical process which depends on a lot of: material, laser, scan and environmental parameters. For two selected materials, a parameter study has been performed to optimize the process regarding part density, since porosity has a harmful effect on the mechanical properties of the part. Four main process parameters were selected for experiment: laser power, layer thickness, scan speed and hatching space. These factors determine the energy supplied by the laser beam to a volumetric unit of powder material, defined as energy density, an experimental quantity which has large influence on part density. After choosing the types of supports used for parts to be processed the next step is to see what material file is assigned for the future manufacturing component. Were two types of material used for manufacturing in the test, one is Ti6A17Nb and the other is stainless steel 316L. For the first material the optimal laser power could range from 50 to 200 W and the optimal power for stainless steel 316L is above 160 W. If the power applied on the powder bed is less than 100 W the components are not so strongly melted. The best power chosen to be applied to the next components, samples or final components is 160 W, the best parameters between the good melting, process stability and final components with good results. One of the machine parameters who can be changed is the speed of scanning witch has the following calculating relationship applied on selective laser melting machine SLM 250 Realizer. The scanning speed was tested on samples to see if the standard scan speed of 400 mm/s is the best speed to melt the stainless steel powder or could be another one. To see that, different scanning speeds were attributed to the samples. The samples with higher scanning speed were not fully melted. The big value of scanning speed parameters is not optimal one because the powder layer is not strongly and fully melted [3]. Stratasys Fused Deposition Modelling (FDM) is a typical RP process that can fabricate prototypes from ABS plastic. Researchers of Gyeongsang National University Jinju (Korea) and University of California, Berkeley (USA) realized selected tests the properties of parts fabricated by the FDM [4]. Using a Design of Experiment (DOE) approach, the process parameters of FDM, such as raster orientation, air gap, bead width, colour, and model temperature were examined. The FDM machine possesses a second nozzle that extrudes support material and builds support for any structure
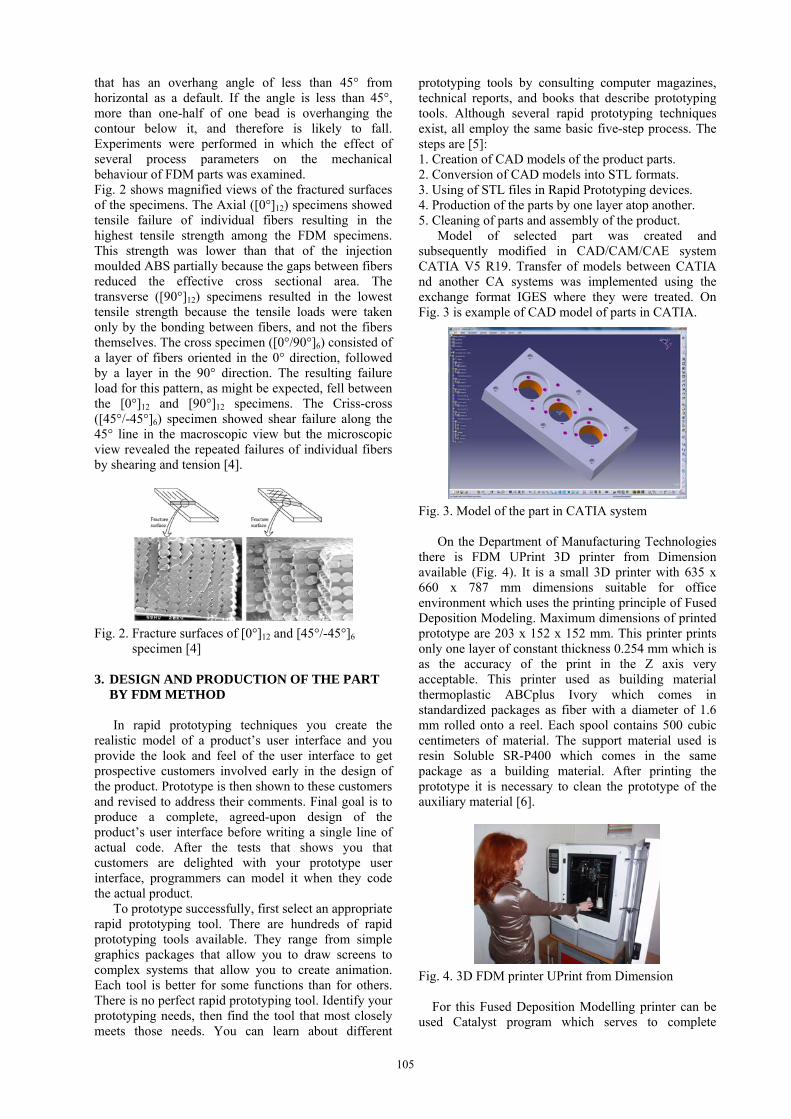
105
that has an overhang angle of less than 45° from horizontal as a default. If the angle is less than 45°, more than one-half of one bead is overhanging the contour below it, and therefore is likely to fall. Experiments were performed in which the effect of several process parameters on the mechanical behaviour of FDM parts was examined. Fig. 2 shows magnified views of the fractured surfaces of the specimens. The Axial ([0°]12) specimens showed tensile failure of individual fibers resulting in the highest tensile strength among the FDM specimens. This strength was lower than that of the injection moulded ABS partially because the gaps between fibers reduced the effective cross sectional area. The transverse ([90°]12) specimens resulted in the lowest tensile strength because the tensile loads were taken only by the bonding between fibers, and not the fibers themselves. The cross specimen ([0°/90°]6) consisted of a layer of fibers oriented in the 0° direction, followed by a layer in the 90° direction. The resulting failure load for this pattern, as might be expected, fell between the [0°]12 and [90°]12 specimens. The Criss-cross ([45°/-45°]6) specimen showed shear failure along the 45° line in the macroscopic view but the microscopic view revealed the repeated failures of individual fibers by shearing and tension [4].
Fig. 2. Fracture surfaces of [0°]12 and [45°/-45°]6
specimen [4] 3. DESIGN AND PRODUCTION OF THE PART BY FDM METHOD In rapid prototyping techniques you create the realistic model of a product’s user interface and you provide the look and feel of the user interface to get prospective customers involved early in the design of the product. Prototype is then shown to these customers and revised to address their comments. Final goal is to produce a complete, agreed-upon design of the product’s user interface before writing a single line of actual code. After the tests that shows you that customers are delighted with your prototype user interface, programmers can model it when they code the actual product. To prototype successfully, first select an appropriate rapid prototyping tool. There are hundreds of rapid prototyping tools available. They range from simple graphics packages that allow you to draw screens to complex systems that allow you to create animation. Each tool is better for some functions than for others. There is no perfect rapid prototyping tool. Identify your prototyping needs, then find the tool that most closely meets those needs. You can learn about different
prototyping tools by consulting computer magazines, technical reports, and books that describe prototyping tools. Although several rapid prototyping techniques exist, all employ the same basic five-step process. The steps are [5]: 1. Creation of CAD models of the product parts. 2. Conversion of CAD models into STL formats. 3. Using of STL files in Rapid Prototyping devices. 4. Production of the parts by one layer atop another. 5. Cleaning of parts and assembly of the product. Model of selected part was created and subsequently modified in CAD/CAM/CAE system CATIA V5 R19. Transfer of models between CATIA nd another CA systems was implemented using the exchange format IGES where they were treated. On Fig. 3 is example of CAD model of parts in CATIA.
Fig. 3. Model of the part in CATIA system On the Department of Manufacturing Technologies there is FDM UPrint 3D printer from Dimension available (Fig. 4). It is a small 3D printer with 635 x 660 x 787 mm dimensions suitable for office environment which uses the printing principle of Fused Deposition Modeling. Maximum dimensions of printed prototype are 203 x 152 x 152 mm. This printer prints only one layer of constant thickness 0.254 mm which is as the accuracy of the print in the Z axis very acceptable. This printer used as building material thermoplastic ABCplus Ivory which comes in standardized packages as fiber with a diameter of 1.6 mm rolled onto a reel. Each spool contains 500 cubic centimeters of material. The support material used is resin Soluble SR-P400 which comes in the same package as a building material. After printing the prototype it is necessary to clean the prototype of the auxiliary material [6].
Fig. 4. 3D FDM printer UPrint from Dimension
For this Fused Deposition Modelling printer can be used Catalyst program which serves to complete
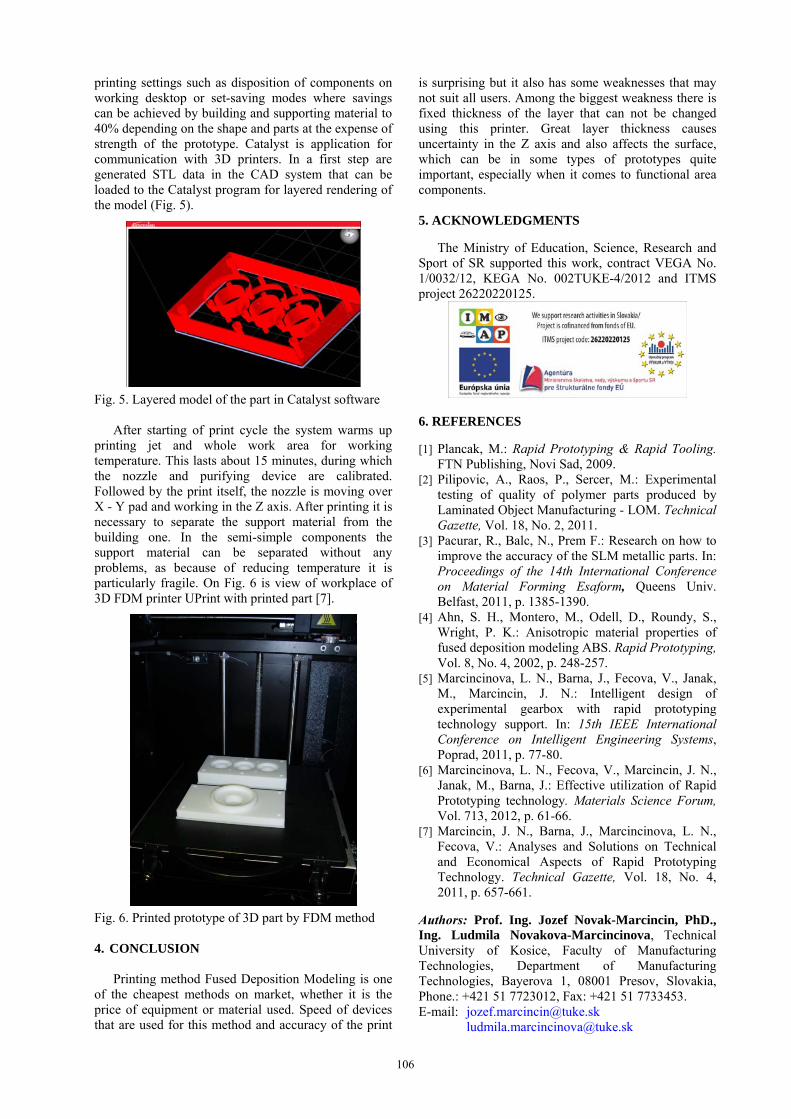
106
printing settings such as disposition of components on working desktop or set-saving modes where savings can be achieved by building and supporting material to 40% depending on the shape and parts at the expense of strength of the prototype. Catalyst is application for communication with 3D printers. In a first step are generated STL data in the CAD system that can be loaded to the Catalyst program for layered rendering of the model (Fig. 5).
Fig. 5. Layered model of the part in Catalyst software After starting of print cycle the system warms up printing jet and whole work area for working temperature. This lasts about 15 minutes, during which the nozzle and purifying device are calibrated. Followed by the print itself, the nozzle is moving over X - Y pad and working in the Z axis. After printing it is necessary to separate the support material from the building one. In the semi-simple components the support material can be separated without any problems, as because of reducing temperature it is particularly fragile. On Fig. 6 is view of workplace of 3D FDM printer UPrint with printed part [7].
Fig. 6. Printed prototype of 3D part by FDM method 4. CONCLUSION Printing method Fused Deposition Modeling is one of the cheapest methods on market, whether it is the price of equipment or material used. Speed of devices that are used for this method and accuracy of the print
is surprising but it also has some weaknesses that may not suit all users. Among the biggest weakness there is fixed thickness of the layer that can not be changed using this printer. Great layer thickness causes uncertainty in the Z axis and also affects the surface, which can be in some types of prototypes quite important, especially when it comes to functional area components. 5. ACKNOWLEDGMENTS
The Ministry of Education, Science, Research and Sport of SR supported this work, contract VEGA No. 1/0032/12, KEGA No. 002TUKE-4/2012 and ITMS project 26220220125.
6. REFERENCES
[1] Plancak, M.: Rapid Prototyping & Rapid Tooling. FTN Publishing, Novi Sad, 2009.
[2] Pilipovic, A., Raos, P., Sercer, M.: Experimental testing of quality of polymer parts produced by Laminated Object Manufacturing - LOM. Technical Gazette, Vol. 18, No. 2, 2011.
[3] Pacurar, R., Balc, N., Prem F.: Research on how to improve the accuracy of the SLM metallic parts. In: Proceedings of the 14th International Conference on Material Forming Esaform, Queens Univ. Belfast, 2011, p. 1385-1390.
[4] Ahn, S. H., Montero, M., Odell, D., Roundy, S., Wright, P. K.: Anisotropic material properties of fused deposition modeling ABS. Rapid Prototyping, Vol. 8, No. 4, 2002, p. 248-257.
[5] Marcincinova, L. N., Barna, J., Fecova, V., Janak, M., Marcincin, J. N.: Intelligent design of experimental gearbox with rapid prototyping technology support. In: 15th IEEE International Conference on Intelligent Engineering Systems, Poprad, 2011, p. 77-80.
[6] Marcincinova, L. N., Fecova, V., Marcincin, J. N., Janak, M., Barna, J.: Effective utilization of Rapid Prototyping technology. Materials Science Forum, Vol. 713, 2012, p. 61-66.
[7] Marcincin, J. N., Barna, J., Marcincinova, L. N., Fecova, V.: Analyses and Solutions on Technical and Economical Aspects of Rapid Prototyping Technology. Technical Gazette, Vol. 18, No. 4, 2011, p. 657-661.
Authors: Prof. Ing. Jozef Novak-Marcincin, PhD., Ing. Ludmila Novakova-Marcincinova, Technical University of Kosice, Faculty of Manufacturing Technologies, Department of Manufacturing Technologies, Bayerova 1, 08001 Presov, Slovakia, Phone.: +421 51 7723012, Fax: +421 51 7733453. E-mail: [email protected] [email protected]

107
Preliminary Note
Hronec, O., Vilček, J., Adamišin, P., Andrejovský, P., Huttmanová, E.
USE OF PHRAGMITES AUSTRALIS (CAV.) TRIN AND ITS REPRODUCTION IN
THE REVITALIZATION OF CONTAMINATED SOILS Received: 21 May 2012 / Accepted: 31 June 2012
Abstract: Significant resistance of Phragmites australis (Cav.) Trin against strongly alkalized soils was found by previous investigation, when it grows also on the grounds with pH 9.1 and produces very large biomass. Therefore we have verified the most suitable method of reproduction of this plant, both in generative and vegetative ways, including possibility of its growing on intoxicated grounds. We have found out that generative reproduction is technically more demanding and less successful, on the contrary, vegetative reproduction showed statistically significant results. Key words: imission, alkalization, magnesium, fertilizing of soils, Phragmites australis Upotreba Phragmites australis (Cav.) Trin i njegova reprodukcija u revitalizacija zagađenog zemljišta. Značajna otpornost Phragmites australis (Cav.) Trin protiv veoma alkalnih zemljišta pronadjena je na osnovu prethodnih istrazivanja koja je, takođe razvijena, na osnovu pH 9,1 i proizvodi veoma veliku kolicinu biomase. Zato smo verifikovali najpogodniji način reprodukcije ovog postrojenja, kako generativnom tako i u vegetativnog načina, uključujući i mogućnost njegovog raste pod dejstvom alkohola na osnovu. Otkrili smo da je generativna reprodukcija tehnički zahtevnija i manje uspešna, nasuprot toga, vegetativnog razmnožavanja pokazalo je statistički značajne rezultate. Ključne reči: imisija, alkalizacije, magnezijum, đubrenje zemljišta, Phragmites australis 1. INTRODUCTION
Slovak republic is a country extremely rich in the
natural crystal magnesite. Manufacture of the magnesite sinters by thermic disintegration and sintering operation belongs among dust technologies. Two factories process magnesite raw material in the middle of Slovakia in the region of the towns Jelsava and Lubenik namely:
SMZ Jelsava a.s., and Slovmag Lubenik a.s. Mag-nesium oxide, which alkalizes 12,000 ha of agricultural and 6,600 ha of forest soils, issues into the atmosphere during manufacturing process. The place of the interest is characterized by high oversaturation of the soils with magnesium where pH is 8-9 and higher. Neither practice nor science have known magnesitephilic plants still, which would be able to draw off macrobiotic element from the soil by accumulation of magnesium in above-ground parts. Magnesium immissions causes a lot of unfavorable effects to the soil, vegetation and animals. This manifests through the less productive and economic results. The sites, where in past the fall of solid reduction was higher than 20 g.m-2 showed disintegration of original phytocoenose in 30 days and only several resistant kinds were left, which are of very low importance as to production, agriculture, forest growing and aesthetic point of view. The root system of these plants is very weak, reaching the depth only 30-40 mm and they cannot protect soils sufficiently against the erosion [1-7].
By calcinations of the magnesite in rotary and shaft furnaces solid and vapor waste products originate, which are ejected into the atmosphere and hence to the
soil. They cause alkalization of the soil as well chemical and mineralogical changes are originated: pH value is changed (above 8), macronutriment ratio is changed, biologic value and quality of humus is reduced, the soil erosion is increased, reception of phosphorus and microelements in the soil is reduced, the seeds of the nonresistant kinds cannot germinate, therefore reduction of free grown plants occurs.
Long-term observation and investigation showed, that in this contaminated area was Phragmites australis (Cav.) Trin appeared in last years, which is originally humid plant, but in this area it grows literally in dry sites, where ground water is in the depth of several meters. Striking vitality of Phragmites australis (Cav.) Trin was found, as mega-population in more sites, where the pH value reached pH = 9.1 and in such sites, where it does not occur and according to the published statements its presentation was not recorded in the past [5]. It is hopeful, dominant, resistant, anti-erosive and technically available kind providing alternative solution of sanitation and fertilization of alkalized soils. Productivity and physiological relationship supporting this fact is discussed in works [8-14].
Therefore we have established the aim to verify different methods of Phragmites australis (Cav.) Trin reproduction with possibility of its using for broadcast fertilization of excessively contaminated soils with the magnesite.
2. MATERIAL AND METHODS
Phragmites australis belongs to the family
Poaceae, genus Phragmites. Phragmites australis

108
occurs in two forms: S = terrestrial form. V = littoral form. Terrestrial ecoform occurs in the marginal parts of the pond, where is minimum fluctuation of ground water and respectable humus substratum. Littoral form is flooded by regular water with fluctuant water column from 20-90 mm. The substratum is sandy-loamy with low content of the organic sediments.
The cultivation and reproduction of Phragmites australis in the greenhouse and field conditions was realized in the greenhouse of the Secondary Training Centre of Agriculture in Stitnik and field experiment was realized in the site of the soil devastated by magnesium immission in Jelsava in the immission area of exhalation sources. These methods of reproduction have been verified.
2.1 Vegetative reproduction
Green cuttings reproduction Green vegetative cuttings of Phragmites australis
were removed from the individual sites during five different terms from 9th to 25th May 2002. The segments were cut by the scissors, only matured stolons were chosen, from which part in the length of 30-40 mm from the top was cut and immediately put into the prepared bucket full of water. Green stalks were removed in five terms: the 1st term: 9th May, the 2nd term: lst May, 3rd term: 12th May, 4th term: 17th May, 5th term: 25th May.
Top green cutting reproduction - in water solution - in prepared composition in pot and seed box The cuttings of Phragmites australis were
processed on the day of their removal. The possibility of two methods of top green cutting reproduction was verified. The segments were cut from the top in length 300 mm, close (5 mm) under the node in slanting cut by budding knife. The segments cut in this way were dipped into the stimulator - STUMULAX - I and poked into the prepared box in 30 x 30 mm spacing. The box contained a composition of the soil (peat) mixed with sand in 1: 1. The bottle we full with ratio water from the pond and stimulator at the knife-point was added. The cuttings prepared in the same way as for the seed box were put into the bottle and covered with the plastic bag.
Middle green cutting with one node from the stalk
reproduction - in prepared composition in pot, - in prepared composition in reproduction seed
boxes. This method of reproduction was from the middle
green cutting of the Phragmites australis. Smaller segments were cut from the brought segments. The process was as follows: From the segment in the length of 300-400 mm was cut in lower part close under the node in slanting cut by budding knife and above the node in the height of 60-80 mm in straight cut. The component part of such cutting was a stalk and a part of the leaf. From one 300-400 mm cutting were removed 1-2 pieces of such segments, the top parts were not used as they were not matured enough. The
stalk segments prepared by this method were dipped into the stimulator and poked into the prepared composition (sand and compost) in the pots with 180 mm in diameter and in the boxes 80 mm deep to the depth of 40 mm.
Root segment (rhizome) reproduction Shallow grown roots of the Phragmites australis in
the above mentioned sites under the surface of the soil were pulled from the soil by the above ground parts in the length of 0.5 to 1 m and were cut. These ones containing the top bud were cut with one node, the others were cut with two nodes. Root segments prepared by this method were planted into the prepared composition in the pots. The top cuttings were placed with vegetative top of the root 10 mm above the soil surface and the middle root segments with two nodes were placed in horizontal position in the prepared pots in the depth of 50-60 mm above the root.
2.2 Generative reproduction
Seed reproduction of the Phragmites australis Summitas was isolated in two terms: the 1st term
20th October 2001, the 2nd term 15th November 2002. The seeds from the summitas were stripped by the comb and together with the glumes were sown on 20th January 2002 in the boxes with the composition (compost soil, sand), covered with 10 mm layer of the soil and put into the greenhouse with temperature 20oC. Grown plants 30 mm high with 2-3 leaves were planted in the boxes in 4 x 20 mm spacing since April and when they reached the height about 100 mm and had 3-4 leaves they were replanted in the pots with 120 nun in diameter.
Preparation of the location (or the planting) For the planting of the pre cultivated plants the area
250 m southern from SMZ Jelsava, near the Muráň river was chosen. The area with the acreage 10 x 20 m was demarcated and it was enclosed with the wooden fence. At the beginning of June the sad was removed from one half of the location. The samples of the soil were taken and the results are presented in the Tab 2. The pH value (pH/KCl) was 8.1. The content of the magnesium in the soil was 2988 mg.kg-1.
Planting of the Phragmites australis
Phragmites australis was planted on 22nd June 2002, at the day temperature of 31 oC from 9:00 am to 1:00 pm. The method was as follows: The holes deep 150 mm were digged and about 2 liters of water was poured there. Phragmites australis with the root ball was digged and planted into the holes in 600 x 600 mm spacing.
The care after planting on the site
Young plants after planting (because of the high temperatures in July and August) were regularly watered. Weeding preparation Roundup was applied in September. The new overgrows of Phragmites australis obtained by root segment reproduction were established in 2003. The plants were evaluated during the vegetation (number of growths, internodes, leaves

109
on the plants in 2002 - 2003). The measurements were done in regular intervals. The measurements were continued in 2004 and acquired values 2002-2004 were evaluated and they are shown in the tables.
The investigation of Phragmites australis was realized in 2002-2004. During each year several measurements were done, which is shown in the tables. The height of the plant, number of growths and number of leaves was measured. For the analysis itself, the results of two comparatible seasons were used (interannual ± 6 days):
- the 1st summer measurement (22nd July 2002, 20th July 2003, 25th July 2004)
- the 2nd summer measurement (30th August 2002, 2nd Sept. 2003,5th Sept.2004)
The comparation and the measurement took place in 64 localities, whilst the plants in the localities 1-32 were sown from the seeds and the plants in the localities 33-64 were from the root segments.
The sites (localities), from which seeds and vegetative parts were removed for the verification of the most suitable method of Phragmites australis reproduction occurs near the factories Slovmag Lubenik and SMZ Jelsava.
Statistical evaluation of the results
The following methods for statistical evaluation of the results were used: index analysis, correlation analysis and hypothesis testing.
The interannual changes of the method of repro-duction (vegetative, generative) were investigated by the index analysis. The correlation analysis was used for finding out the dependability among the height of the plant, the number of the growths and the number of the leaves of the plant for all plants together and for individual methods of reproduction particularly as well. At the hypothesis testing we were concentrated on the testing of the equality of the average value above presented parameters of the plants (the height of the plant, the number of the growths and the number of leaves) obtained generatively and vegetatively.
3. RESULTS AND DISCUSSION
The occurrence of Phragmites australis under the
dry conditions against its appearance in the wetlands with the still water was the impulse for the verification of Phragmites australis reproduction in these localities. Several methods of Phragmites australis reproduction were tested, namely vegetative and generative. The samples were taken from the described localities. The cultivation of the plants was realized on the contamined soil in the distance of 250 m southern from the factory SMZ Jelsava. The soil samples showed pH 8.1 determinated electrometric and the content of permissible nutrients 67 mg P.kg-1 of the soil according it Egner, 62 mg K.kg-1 of the soil according to Schaschabel and 2986 mg.kg-1 of the soil by method AAS in leach according to Schaschabel. The seeds for the seeding were taken in September 2001 from the free grown plants. The seeding was realized under the greenhouse conditions in spring 2002. The results achieved at vegetative and generative reproduction
were noticed in the tables. In 2003 the growth and the development of the
plants in the testing locality was observed under the field conditions from the seeds sown in 2002 as well as the growth and the development of the plants cultivated from the root segments (rhizoma) planted in 2002. The new overgrows in the test location were established from the root segments planted in 2003. During the vegetation the number of plants, the growths, the number of internodes and the number of the leaves on the highest plant was measured. Phenological investigation of the place of the interest continued. The original plant kind representation was confirmed.
In 2004 the measurement during vegetation period in the overgrow planted in 2002 continued. The results of the measurements during 2002-2004 were statistically evaluated.
1st summer measurement (22/07/2002, 20/07/2003, 25/07/2004)
2003/ 2002
2004/ 2003
from seed height in mm 2.399 1.036 leaves number 1.257 1.121 growths number 1.927 1.148 vegetative height in mm 2.195 1.051 leaves number 1.105 1.107 growths number 1.830 1.147 total height in mm 2.288 1.043 leaves number 1.179 1.114 growths number 1.876 1.147
2nd summer measurement (30/08/2002, 2/09/2003, 5/09/2004)
2003/ 2002
2004/ 2003
from seed height in mm 2.442 1.093 leaves number 1.573 1.062 growths number 1.930 1.083 vegetative height in mm 2.191 1.113 leaves number 1.363 1.072 growths number 1.958 1.095 total height in mm 2.309 1.103 leaves number 1.463 1.067 growths number 1.944 1.032 Table 1. Interannual changes of the observed signs
The highest index accumulation was notice d in 2003, i.e. one year after seeding. At the first or the second comparative measurement in 2003 the plants grew in average about 128.8%, or about 130.9 % more than in 2002. The more significant accumulation of the total height in mm was at the plants from the seed (139.9%, or 144.2 %), than at the plants from the root segments (119.5 %, or 119.1 %).The change of the plant height in 2004 in comparison to 2003 was less significant - increasing of 4.3 %, or 10.3 %, whilst lower dynamic at the first summer measurement was noticed at the plants from the seed -3.6 % increasing in comparison to 5.1 % at the plants from the root segments, at the second summer measurement 11.3 % increasing of the plants from the root segments in
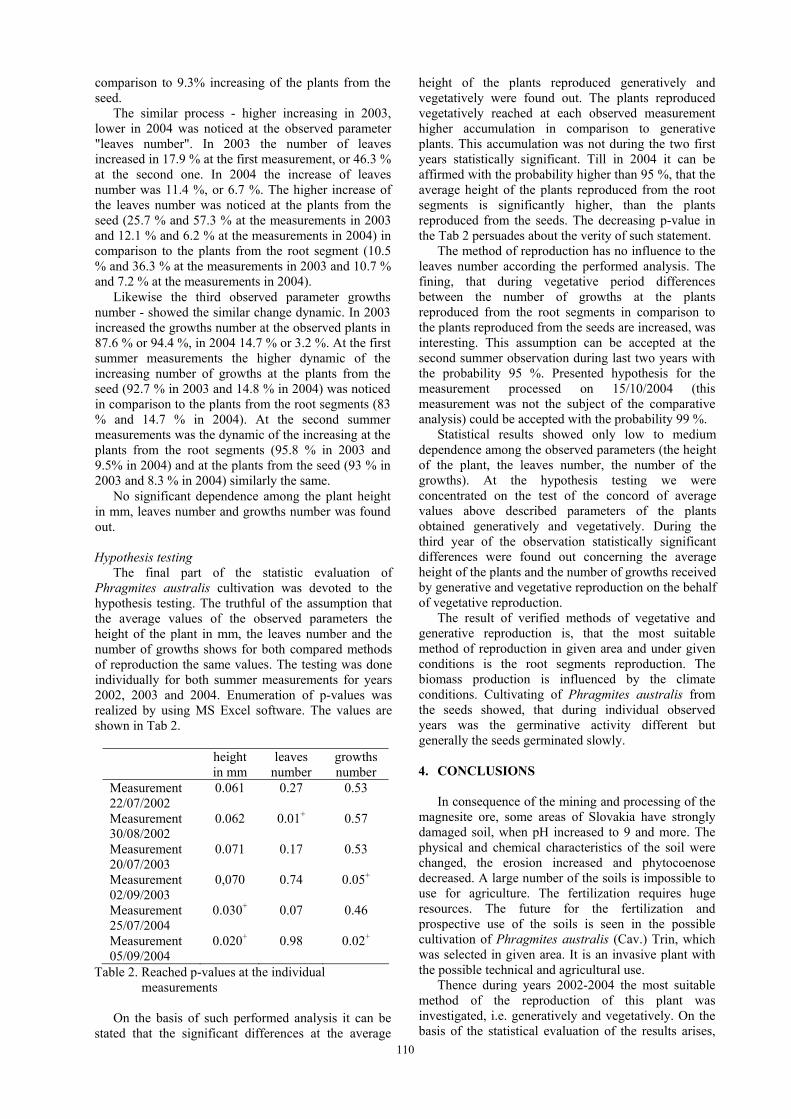
110
comparison to 9.3% increasing of the plants from the seed.
The similar process - higher increasing in 2003, lower in 2004 was noticed at the observed parameter "leaves number". In 2003 the number of leaves increased in 17.9 % at the first measurement, or 46.3 % at the second one. In 2004 the increase of leaves number was 11.4 %, or 6.7 %. The higher increase of the leaves number was noticed at the plants from the seed (25.7 % and 57.3 % at the measurements in 2003 and 12.1 % and 6.2 % at the measurements in 2004) in comparison to the plants from the root segment (10.5 % and 36.3 % at the measurements in 2003 and 10.7 % and 7.2 % at the measurements in 2004).
Likewise the third observed parameter growths number - showed the similar change dynamic. In 2003 increased the growths number at the observed plants in 87.6 % or 94.4 %, in 2004 14.7 % or 3.2 %. At the first summer measurements the higher dynamic of the increasing number of growths at the plants from the seed (92.7 % in 2003 and 14.8 % in 2004) was noticed in comparison to the plants from the root segments (83 % and 14.7 % in 2004). At the second summer measurements was the dynamic of the increasing at the plants from the root segments (95.8 % in 2003 and 9.5% in 2004) and at the plants from the seed (93 % in 2003 and 8.3 % in 2004) similarly the same.
No significant dependence among the plant height in mm, leaves number and growths number was found out.
Hypothesis testing
The final part of the statistic evaluation of Phragmites australis cultivation was devoted to the hypothesis testing. The truthful of the assumption that the average values of the observed parameters the height of the plant in mm, the leaves number and the number of growths shows for both compared methods of reproduction the same values. The testing was done individually for both summer measurements for years 2002, 2003 and 2004. Enumeration of p-values was realized by using MS Excel software. The values are shown in Tab 2.
height
in mm leaves
number growths number
Measurement 22/07/2002
0.061 0.27 0.53
Measurement 30/08/2002
0.062 0.01+ 0.57
Measurement 20/07/2003
0.071 0.17 0.53
Measurement 02/09/2003
0,070 0.74 0.05+
Measurement 25/07/2004
0.030+ 0.07 0.46
Measurement 05/09/2004
0.020+ 0.98 0.02+
Table 2. Reached p-values at the individual measurements
On the basis of such performed analysis it can be
stated that the significant differences at the average
height of the plants reproduced generatively and vegetatively were found out. The plants reproduced vegetatively reached at each observed measurement higher accumulation in comparison to generative plants. This accumulation was not during the two first years statistically significant. Till in 2004 it can be affirmed with the probability higher than 95 %, that the average height of the plants reproduced from the root segments is significantly higher, than the plants reproduced from the seeds. The decreasing p-value in the Tab 2 persuades about the verity of such statement.
The method of reproduction has no influence to the leaves number according the performed analysis. The fining, that during vegetative period differences between the number of growths at the plants reproduced from the root segments in comparison to the plants reproduced from the seeds are increased, was interesting. This assumption can be accepted at the second summer observation during last two years with the probability 95 %. Presented hypothesis for the measurement processed on 15/10/2004 (this measurement was not the subject of the comparative analysis) could be accepted with the probability 99 %.
Statistical results showed only low to medium dependence among the observed parameters (the height of the plant, the leaves number, the number of the growths). At the hypothesis testing we were concentrated on the test of the concord of average values above described parameters of the plants obtained generatively and vegetatively. During the third year of the observation statistically significant differences were found out concerning the average height of the plants and the number of growths received by generative and vegetative reproduction on the behalf of vegetative reproduction.
The result of verified methods of vegetative and generative reproduction is, that the most suitable method of reproduction in given area and under given conditions is the root segments reproduction. The biomass production is influenced by the climate conditions. Cultivating of Phragmites australis from the seeds showed, that during individual observed years was the germinative activity different but generally the seeds germinated slowly.
4. CONCLUSIONS
In consequence of the mining and processing of the magnesite ore, some areas of Slovakia have strongly damaged soil, when pH increased to 9 and more. The physical and chemical characteristics of the soil were changed, the erosion increased and phytocoenose decreased. A large number of the soils is impossible to use for agriculture. The fertilization requires huge resources. The future for the fertilization and prospective use of the soils is seen in the possible cultivation of Phragmites australis (Cav.) Trin, which was selected in given area. It is an invasive plant with the possible technical and agricultural use.
Thence during years 2002-2004 the most suitable method of the reproduction of this plant was investigated, i.e. generatively and vegetatively. On the basis of the statistical evaluation of the results arises,
111
that the vegetative root segment reproduction is more suitable and can be recommended under these conditions.
5. ACKNOWLEDGEMENT
This work was supported by the Slovak Research
and Development Agency under contract No. APVV 0131-11 and Scientific Grant Agency of the Ministry of Education of the Slovak Republic under contract No. VEGA 1/0070/12 and 1/0008/13.
6. REFERENCES [1] Hronec, O., Vilček, J., Tomáš J., Adamišin, P.,
Huttmanová, E.: Environmental Components Quality in Problem Areas in Slovakia, Mendelova univerzita, Brno, 2010.
[2] Steinnes E., Sjřbakk T.E., Donisa C., Brännvall M.L.: Quantification of Pollutant Lead in Forest Soils. Soil Sci. Soc. Am. J., 69, 1399-1404, 2005.
[3] Hovmand M.F., Kemp K., Kystol J., Johnsen I., Riis-Nielsen T., Pacyna J.M.: Atmospheric heavy metal deposition accumulated in rural forest soils of southern Scandinavia. Environmental pollution, 155, 537-541, 2008.
[4] Kaleta, M.: Vegetation circustanes in Jelsava area concentrated on the immission conditions. Veda SAV, Bratislava, Quaestiones Geobiologicae 17, 131 pp., 1975.
[5] Hronec, O., Hajduk, J.: Significant resistence of Phragmites australis Cay. Trin. on the soils intoxicated with magnesium immissions. Ecology 2, 117- 24, 1998.
[6] Vilček, J.: Bioenergy production of agricultural soil cover. Ekológia, 22, No.2: 177-182, 2003.
[7] Vilček, J., Hronec, O., Bedrna, Z.: Environmental pedology. VÚPOP, Bratislava, 2005.
[8] Dykyjová, D.: Kontaktdioagramme als Hilfsme-thode Fur vergleichende Biometrie, Allometrie und Produktionsanalyse von Phragmites Okotypen. Rev Rom. Biol. - Zoologie T 14, Bucarest, 107-119, 1969.
[9] Květ, J.: Mineral nutritiens in shoots of red (Phragmites communis Trin.) Polskie Arch. Hydriol. Warzawa, 20, 137-147, 1973.
[10] Mason, C. F., Bryant, R. J.: Production, nutritient content and decomposition of Phragmites communis Trin and Typha angustifolia L., Journ. Ecio., Oxford 63, 71-95., 1975.
[11] Brisson, J., S. de Blois, Lavoie, C.: 2010. Roadside as Invasion Pathway for Common Reed (Phragmites australis). Invasive Plant Science and Management, 3(4), 506-514, 2010.
[12] Chambers, R., L. Meyerson,. Saltonstall, K.: Expansion of Phragmites australis into tidal wetlands of North America. Aquatic Botany, 64(3), 261-273, 1999.
[13] Mal, T., Narine, L.: The Biology of Canadian Weeds. 129. Phragmites australis (Cav.) Trin. ex Steud. Canadian Journal of Plant Science. 84(1). 365-396 , 2004.
[14] Derr, J.: Common Reed (Phragmites australis) Response to Postemergence Herbicides. Invasive Plant Science and Management, 1(2), 153-157, 2008.
Autors: Prof. h.c., prof., Ing. Ondrej Hronec, DrSc. University of Central Europe in Skalica, Kráľovská 386/11, 909 01 Skalica, Slovakia, prof. Ing. Jozef Vilček, PhD., Soil Science and Conservation Research Institute, Bratislava, Raymanova 1, 08001 Prešov, Slovakia, University of Presov in Presov, Slovakia, doc. Ing. Peter Adamišin, PhD., Emilia Huttmanová, PhD., University of Presov in Presov, Ul. 17. novembra 15, 080 01 Presov, Slovakia, Pavol Andrejovský, PhD., University of Economics, Faculty of Business Economy, Kosice, Tajovského 13, 041 30, Košice, Slovakia. E-mail: [email protected] jozef.viá[email protected] [email protected] [email protected] [email protected]


Prof. Pavel Kovač, PhD, MEng. Borislav Savković, MSc. Assistant
FACULTY OF TECHNICAL SCIENCES Department for Production Engineering Trg Dositeja Obradovica 6
21000 Novi Sad Serbia
Tel.: (+381 21) 485 23 24; 485 23 20 ; 450 366; Fax: (+381 21) 454 495 E-mail: [email protected], [email protected] http://www.jpe.ftn.uns.ac.rs/
No. of pages: 4 DIN A4 pages Margins: left: 2,5 cm right: 2 cm top: 2 cm bottom: 2 cm Font: Times New Roman Title: Bold 12, capitals Abstract: Italic 10 Headings: Bold 10, capitals Subheadings: Bold 10, small letters Text: Regular 10 Columns: Equal column width with 0,7 cm spacing Spacing: Single line spacing Formulae: Centered and numerated from 1 in ascending order.
Equations must be typed in Equation Editor, with following settings: Style>Math – Times New Roman Size>Full 12pt, Subscript/Superscript 7pt, Symbol 18 pt
Figures: High quality, numerated from 1 in ascending order (e.g.: Fig.1, Fig. 2 etc.); Figures and tables can spread over both two columns, please avoid photographs and color prints
Tables: Numerated from 1 in ascending order (e.g..: Tab. 1, Tab. 2, etc.)
References: Numerated from [1] in ascending order; cited papers should be marked by the number from the reference list (e.g. [1], [2, 3] ...)
Submission: Papers prepared in MS Word format should be e-mailed to: [email protected], [email protected]
Notice: Papers are to be printed in Journal of Production Engineering Sample pa per with d etailed instructions can be fo und at : http://www.jpe.ftn.uns.ac.rs/
INSTRUCTIONS FOR CONTRIBUTORS
FOR MORE INFORMATION, PLEASE CONTACT:

Novi Sad, 2009
9 7 7 1 8 2 1 4 9 3 0 0 5
ISSN 1821-4932
J O U R N A L O F
PRODUCTION ENGINEERING
Volume 12 No.1
JO
UR
NA
L O
F P
RO
DU
CT
ION
EN
GIN
EE
RIN
G,
Vo
l.1
2,
No
.1,
20
09
JO
UR
NA
L O
F P
RO
DU
CT
ION
EN
GIN
EE
RIN
G,
Vo
l.1
2,
No
.1,
20
09
UNIVERSITY OF NOVI SADFaculty of Technical Sciences
Department of Production EngineeringNOVI SAD, SERBIA
UDK 621 ISSN 1821-4932