journal of structural geology - tau.ac.ilshmulikm/publications/alsop-gravity-thrust belts-jsg... ·...
TRANSCRIPT

Contents lists available at ScienceDirect
Journal of Structural Geology
journal homepage: www.elsevier.com/locate/jsg
Distinguishing thrust sequences in gravity-driven fold and thrust belts
G.I. Alsopa,∗, R. Weinbergerb,c, S. Marcod
a Department of Geology and Petroleum Geology, School of Geosciences, University of Aberdeen, Aberdeen, UKbGeological Survey of Israel, Jerusalem, Israelc Department of Geological and Environmental Sciences, Ben Gurion University of the Negev, Beer Sheva, Israeld Department of Geophysics, School of Geosciences, Tel Aviv University, Israel
A R T I C L E I N F O
Keywords:ThrustOverstepPiggybackMTDSoft sedimentDead sea
A B S T R A C T
Piggyback or foreland-propagating thrust sequences, where younger thrusts develop in the footwalls of existingthrusts, are generally assumed to be the typical order of thrust development in most orogenic settings. However,overstep or ‘break-back’ sequences, where later thrusts develop above and in the hangingwalls of earlier thrusts,may potentially form during cessation of movement in gravity-driven mass transport deposits (MTDs). In thisstudy, we provide a detailed outcrop-based analysis of such an overstep thrust sequence developed in an MTD inthe southern Dead Sea Basin. Evidence that may be used to discriminate overstep thrusting from piggybackthrust sequences within the gravity-driven fold and thrust belt includes upright folds and forethrusts that are cutby younger overlying thrusts. Backthrusts form ideal markers that are also clearly offset and cut by overlyingyounger forethrusts. Portions of the basal detachment to the thrust system are folded and locally imbricated infootwall synclines below forethrust ramps, and these geometries also support an overstep sequence. However,new ‘short-cut’ basal detachments develop below these synclines, indicating that movement continued on thebasal detachment rather than it being abandoned as in classic overstep sequences. Further evidence for ‘syn-chronous thrusting’, where movement on more than one thrust occurs at the same time, is provided by dis-placement patterns on sequences of thrust ramp imbricates that systematically increases downslope towards thetoe of the MTD. Older thrusts that initiate downslope in the broadly overstep sequence continue to move andtherefore accrue greater displacements during synchronous thrusting. Our study provides a template to helpdistinguish different thrust sequences in both orogenic settings and gravity-driven surficial systems, with dis-placement patterns potentially being imaged in seismic sections across offshore MTDs.
1. Introduction
Piggyback or foreland-propagating thrust sequences, where youngerthrust imbricates develop in the footwalls of existing thrusts, are gen-erally assumed to be the typical order of thrust development in mosttectonic settings (e.g. Boyer and Elliot, 1982; Morley, 1988; Fossen,2016, p.359). However, Boyer (1992, p. 377) notes that such foreland-propagating systems “have taken on the role of an axiom in the study ofthrust kinematics” while Butler (2004, p.2) challenges “the dogma ofsimple foreland-propagation”. An alternative overstep thrust sequence,where later thrusts develop in the hangingwalls of earlier thrusts, mayalso develop (e.g. Elliot and Johnson, 1980, p. 90; Boyer and Elliot,1982; Park, 2013, p.16). Such overstep thrust sequences are consideredto be particularly relevant to gravity-driven mass transport deposits(MTDs), where retrogressive slope failure encourages the locus of de-formation to migrate upslope, while thrusting is still directed down-slope. Overstep thrust sequences have been interpreted to develop
during cessation of movement in MTDs for more than 30 years since theapplication of the ‘dislocation model’ to slumps by Farrell (1984), butno outcrop detail has been provided (see Farrell, 1984; Martinsen andBakken, 1990).
Suggestions of overstep thrust sequences imaged in seismic datafrom the offshore Norwegian margin were described by Ireland et al.(2011, p. 34) who noted that “Thrusts probably propagated retro-gressively based upon the observation that fold amplitudes decreaseupslope”. Working with seismic sections from the Orange Basin of off-shore Namibia, de Vera et al. (2010, p.230) also suggested that localareas of overstep thrusting develop due to truncation of underlyingstructures by overlying thrusts, although an overall piggyback system ofthrusting is considered to operate. In a further seismic example across afold and thrust system developed offshore Borneo, Totake et al. (2017)recognised that “upper imbricate sheets appear to be younger thanunderlying sheets, creating a similar structure to break-backward im-bricate structure” (i.e. overstep thrusting).
https://doi.org/10.1016/j.jsg.2018.01.005Received 13 June 2017; Received in revised form 15 January 2018; Accepted 22 January 2018
∗ Corresponding author.E-mail address: [email protected] (G.I. Alsop).
Journal of Structural Geology 109 (2018) 99–119
0191-8141/ © 2018 Elsevier Ltd. All rights reserved.
T

Gross age relationships of gravity-driven fold and thrust belts maybe discernible on seismic sections where the ages of strata within, andoverlying, an MTD may be determined (e.g. Bull et al., 2009; Morleyet al., 2011; Peel, 2014; Reis et al., 2016; Cruciani et al., 2017).Overlying strata that display onlap relationships onto structures andbathymetry created by the MTD are particularly useful in bracketingthe timing of thrust movement (e.g. Frey-Martinez et al., 2005; Jollyet al., 2016; Scarselli et al., 2016). A number of seismic studies tenta-tively interpret piggyback sequences within gravity-driven fold andthrust belts based on “increasing (thrust) dips back up the regionalslope” (de Vera et al., 2010, p.229), or “ back rotation and straighteningof inner, older thrust ramps” (Scarselli et al., 2016, p.168), with olderthrusts considered to be steepened-up by new thrusts forming in theirfootwall. However, despite improvements in seismic imaging, the re-solution still does not typically permit detailed cross-cutting relation-ships between individual thrusts and folds within imbricate sequencesto be clearly determined. Indeed, some authors stress that numbering ofthrusts on seismic sections does “not imply a sequence of formation”
(Butler and Paton, 2010, p.7), while Frey-Martinez et al. (2006, p.591)stress that it is not possible to give a definitive direction of thrustpropagation. Thus, within many natural gravity-driven systems asso-ciated with MTDs, there remains significant uncertainty as to the orderof development of thrust sequences.
Field-based studies of ancient MTDs may provide further informa-tion about styles of deformation (e.g. Woodcock, 1976a, b; 1979; Ortnerand Kilian, 2016; Korneva et al., 2016) and the sequence of thrust de-velopment (e.g. Lucente and Pini, 2003; Sharman et al., 2015; Sobiesiaket al., 2017), although they may be complicated by the effects of laterregional tectonism that frequently masks original relationships gener-ated during MTD emplacement. In addition, although such outcrop-based work enables small-scale details to be ascertained (e.g. Gibertet al., 2005; Garcia-Tortosa et al., 2011; Basilone, 2017), it is sometimeslimited by the nature and extent of good exposures, with Ireland et al.(2011, p 34) noting only “rare opportunities to study the geometry ofinternal deformation (within) submarine landslides”. Martinsen andBakken (1990, p.162) examined onshore exposures of Carboniferous
Fig. 1. Schematic illustrations of sections across a) piggyback, b) overstep and c) synchronous thrust sequences in a downslope-directed mass transport deposit (MTD). In c), a thrustsystem that initiates in an overstep sequence subsequently undergoes continued synchronous thrusting. In each case, thrusts (T) are numbered in the order of development (T1, T2, etc.)and are shown in red where active and black where inactive, while the direction of thrust transport (large red arrow) and overall thrust propagation (blue arrow) are also highlighted. (Forinterpretation of the references to colour in this figure legend, the reader is referred to the Web version of this article.)
G.I. Alsop et al. Journal of Structural Geology 109 (2018) 99–119
100

age slumps in western Ireland and note that the truncation of under-lying structures by overlying thrusts “suggest that the compressionalzone developed in an overstep manner”. They concluded that in thedownslope (toe) regions of MTDs, the “development of thrusts in anoverstep manner rather than in a piggyback fashion may be the ex-pected” (Martinsen and Bakken, 1990, p.163).
In order to investigate detailed thrust sequences within gravity-driven fold and thrust belts, and the potential role that overstep thrustsequences may play, we have therefore undertaken an outcrop-basedanalysis of relatively recent (< 70 ka) thrust sequences developed in anMTD in the southern Dead Sea Basin. Superb exposure allows cross-cutting relationships and hence timing of thrust sequences to be directlydetermined, and enables the following fundamental research questionsto be addressed.
i) What criteria can be used to distinguish different thrust sequences?ii) What are the cross-cutting relationships between forethrusts and
backthrusts?iii) Why do overstep thrust sequences develop?iv) Can some thrusts move synchronously?v) How do displacement-distance plots relate to overstep thrust se-
quences?vi) Which models best constrain the geometry and kinematics of
MTDs?
2. Thrust sequences
A variety of different thrust sequences can theoretically be appliedto orogenic belts and gravity-driven fold and thrust systems that formMTDs.
2.1. Piggyback thrust sequences
Where new thrusts develop in the footwall of older thrusts, the olderthrust is displaced by movement on the younger thrust in a ‘piggyback’or foreland-propagating thrust sequence (e.g. Dahlstrom, 1970, p. 349;Butler, 1982, p. 240, his Fig. 4) (Fig. 1a). In a sequence of thrusts, thisbehaviour results in higher thrusts representing the earliest displace-ment, while the lowermost thrusts contain the youngest movement (e.g.Dahlstrom, 1970, p.354; Cooper, 1981, p. 228; Butler, 1982, 1987,p.240, p. 620, his Fig. 2). The basal detachment is considered to beactive throughout translation of the thrust sheet, resulting in olderthrust ramps (T1) being passively carried in its hangingwall (Fig. 1a).Overall, the thrust system therefore propagates in the transport direc-tion, which in orogenic belts is towards the foreland, whereas ingravity-driven MTDs is downslope broadly towards the depocentre ofthe basin (Fig. 1a).
2.2. Overstep thrust sequences
Where new thrusts develop in the hangingwall of older thrusts, an‘overstep’ (or ‘break-back’) thrust sequence develops (e.g. Elliot andJohnson, 1980, p.90; Boyer and Elliot, 1982, p.1209; Butler, 1982, p.240) (Fig. 1b). In a sequence of thrusts, this behaviour results in higherthrusts representing the youngest displacement, while the lowermostthrusts contain the earliest movement (e.g. Butler, 1982, p.240, hisFig. 5). In strict overstep thrusting, the basal detachment formed duringtranslation of the thrust sheet, would become progressively inactivefrom the foreland (toe) as deformation migrated back towards thehinterland (upslope in MTDs) (Fig. 1b). Consequently, older thrusts(T1) maintain a fixed position on the slope once abandoned (Fig. 1b).Overall, the thrust system therefore propagates in a direction oppositeto the transport direction, which in orogenic belts is towards the hin-terland, whereas in gravity-driven MTDs is upslope away from the de-pocentre of the basin (Fig. 1b).
2.3. Synchronous thrust sequences
Synchronous thrusting may simply be defined as “when two or morethrusts move together” (McClay, 1992, p.431) and has been applied to anumber of orogenic thrust belts (e.g. Morley, 1988; Boyer, 1992; Butler,2004) and gravity-driven MTDs (e.g. Cruciani et al., 2017) (Fig. 1c).Imbricates within a synchronous thrust system may still initiate in asystematic order, with older thrusts that propagate downslope in apiggyback sequence, or thrusts getting younger upslope in an overstepsequence (see Sections 2.1. and 2.2. above). Within synchronous thrustssystems, the earlier formed thrusts (T1) remain active, even whenyounger thrusts (T2) are moving, thereby leading to older thrusts ac-cruing the greater displacements (Boyer, 1992), (Fig. 1c). Within MTDs,this behaviour results in older thrusts (T1) being carried downslope bythe underlying basal detachment that continues to move (Fig. 1c). Thus,during synchronous thrusting of broadly overstep sequences, the finalposition of thrust imbricates is not fixed and is dependent on both therate of thrust slip downslope and the rate of upslope propagation of newthrusts (Fig. 1c).
3. Geological setting
The Dead Sea Basin is a pull-apart basin developed between twoleft-stepping, parallel fault strands that define the sinistral Dead SeaFault (Garfunkel, 1981; Garfunkel and Ben-Avraham, 1996) (Fig. 2aand b). The Dead Sea Fault has been active since the Early to MiddleMiocene (e.g. Bartov et al., 1980; Nuriel et al., 2017) including duringdeposition of the Lisan Formation in Lake Lisan that covered up to∼2000 km2 in the late Pleistocene (70-15 ka) (Haase-Schramm et al.,2004). This fault produced numerous earthquakes triggering co-seismicdeformation (e.g. Agnon et al., 2006; Weinberger et al., 2016) as well assoft-sediment deformation and slumping in the Lisan Formation (e.g. El-Isa and Mustafa, 1986; Marco et al., 1996; Alsop and Marco, 2011,2014; Alsop et al., 2016). The slump systems around the Dead Sea Basinare developed on very gentle slopes of< 1° dip and define an overallregional pattern of radial slumping associated with MTDs that are di-rected towards the depo-centre of the present Dead Sea Basin (Alsopand Marco, 2012a, 2013). Such a coherent pattern indicates that theslopes were original and linked to the basin depo-centre rather thanwholesale later tectonic tilting. The observation that MTDs on theeastern side of the Dead Sea are transported towards the west (El-Isaand Mustafa, 1986) and the centre of the basin also supports the ori-ginal palaeoslope interpretation. The investigation of drill cores takenfrom the depo-centre of the Dead Sea reveals that the stratigraphicthickness of the Lisan Formation is three times greater than its onshoreequivalent, largely due to the input of MTDs from around the basinmargin that ‘pond’ and accumulate in the depo-centre. (Marco andKagan, 2014; Lu et al., 2017).
The Lisan Formation comprises a sequence of alternating aragonite-rich and detrital-rich laminae on a sub-mm scale. They are thought torepresent annual varve-like cycles with aragonite-rich laminae pre-cipitating from hypersaline waters in the hot dry summer, while winterflood events wash clastic material into the lake to form the detrital-richlaminae (Begin et al., 1974). Varve counting combined with isotopicdating suggests that the average sedimentation rate of the Lisan For-mation is∼1mm per year (Prasad et al., 2009). Detrital laminae withinthe varved aragonite-rich Lisan Formation display grain sizes of∼8–10 μm (silt), while the thicker detrital-rich units are generallycoarser grained (60–70 μm) and can be classified as very fine sands(Haliva-Cohen et al., 2012). Compositionally, the detrital units mainlyconsist of quartz and calcite grains with minor feldspar, and clays (il-lite-smectite) (Haliva-Cohen et al., 2012). Seismic events along theDead Sea Fault are considered to trigger surficial slumps within theLisan Formation (Marco and Agnon, 1995; Lu et al., 2017), resulting inwell-developed gravity-driven fold and thrust belts in the MTDs (Alsopand Marco, 2011; Alsop et al., 2017a). Individual slump sheets are
G.I. Alsop et al. Journal of Structural Geology 109 (2018) 99–119
101

typically< 1.5m thick and are capped by undeformed horizontal bedsof the Lisan Formation, indicating that fold and thrust systems formedat the sediment surface, with the position of basal detachments con-trolled by variable lithologies and potentially fluid pressure (e.g. Alsopet al., 2016, 2017a).
The Zin case study area (N30°57′38″ E35°18′9″) is located to the NWof Wadi Zin, which is positioned between the Dead Sea western borderfault zone, which bounds the Cretaceous basin margin ∼1 km to thewest, and the Amazyahu Fault∼ 5 km further NE (Fig. 2b, c, d). Thisarea is ideal for the present case study concerning thrust sequences inunlithified sediments of MTDs as it is well exposed and accessible alongcuttings. The varved lacustrine sequence permits high resolution mm-scale correlation of sequences across thrust faults. In addition, thenature of the surficial slumping, where overburden has not exceeded afew metres (e.g. Alsop et al., 2016), removes many complications as-sociated with changes in geometries and angles arising from subsequentcompaction of sediments. The Lisan Formation is considered to havebeen fluid-saturated at the time of deformation, with numerous flui-dised clastic dykes cutting the deformed beds (see Alsop et al., 2017c),while the present fluid content is still∼ 25% (Arkin and Michaeli,1986; Frydman et al., 2008). The actual water depth in the lake hasbeen discussed in detail by Alsop and Marco (2012b) who suggest thatsediments were below storm wave base, with water likely to have beenbetween 30m and 100m deep at the time of deformation.
4. Orientation and vergence of the fold and thrust system
The Zin case study area (N30°57′38″ E35°18′9″ or N31.00615,E35.26342) contains a number of natural outcrops immediately to thewest of Highway 90 that runs south to Eilat (Fig. 2c and d, 3a). Ingeneral, folds and thrusts within the Lisan Formation verge pre-dominantly towards the south throughout this area (Fig. 3a). There arealso a number of sub-ordinate south-dipping and north-verging back-thrusts that are generally steeper and are similar to backthrusts seenelsewhere in the Lisan Formation (Fig. 3a) (e.g. Alsop et al., 2017b).The area is dominated by these contractional structures that we inter-pret to verge down slope (e.g. Alsop and Marco, 2012a; Alsop et al.,2016).
The main basal detachment to the fold and thrust system is devel-oped a few mm below a distinctive 5 cm thick dark green detrital-richlayer that forms a prominent marker in the sequence (Figs. 3a and 4a).The thrust sequence overlying the basal detachment is 80–100 cm thick,suggesting that the detachment formed about 1m below the lake floor,and is therefore similar in thickness to other deformed units in the LisanFormation (Alsop et al., 2016). The MTD horizon is overlain by anundeformed depositional cap that varies in thickness, but is typicallyless than 10 cm (Fig. 4a, c, e, g). The cap, that comprises detritals andmm-scale aragonite fragments, is interpreted to have been depositedout of suspension following downslope movement of the MTD (seeAlsop and Marco, 2012b).
In addition to the general outcrops, a N-S (020°–200°) trendingcutting adjacent to a disused track approximately 30m west ofHighway 90 provides a superb section along an imbricated fold andthrust sequence (Fig. 2c and d, 3b, c). The 25m long cutting contains 7north-dipping forethrust ramps (FT) that are directed towards thesouth, and also three steeper backthrusts (BT) verging northwards(Figs. 3b, c, 4a–h). Associated fold hinges are E-W trending and sub-horizontal, with the fold hinges and axial planes trending broadlyparallel to the strike of the related thrust planes (Figs. 3d, 4a–h). Thenormals to the mean thrust strike and mean fold axes are towards 194°and 181°, respectively (Fig. 3d). Individual thrusts and folds follow thisoverall transport direction, with thrust transport directions rangingfrom 181° to 208°, while transport calculated from the normal to foldhinges vary from 182° to 204° (see Alsop and Marco, 2012a; Alsopet al., 2016 for methodologies of determining MTD movement)(Fig. 4a–h). The 220° trending section is therefore almost transport-
Fig. 2. a) Tectonic plates in the Middle East. General tectonic map showing the locationof the present Dead Sea Fault (DSF). b) Map of the current Dead Sea showing the positionof the Wadi Zin case study area (red box) (based on Sneh and Weinberger, 2014). c) Insetlocality map showing details of the Zin case study area and location of the cutting (Fig. 3)relative to major Highways 25 and 90. d) Image of the light-coloured Lisan Formation atWadi Zin, with the brownish Cretaceous rocks to the west and the trace of the AmazyahuFault to the east. Coordinates of the Israel national grid are shown. (For interpretation ofthe references to colour in this figure legend, the reader is referred to the Web version ofthis article.)
G.I. Alsop et al. Journal of Structural Geology 109 (2018) 99–119
102

parallel and suitably orientated for structural analysis.
4.1. Overall displacement patterns along an imbricate section
A 7 cm thick, dark brown detrital-rich bed towards the top of the
sequence forms a clear marker horizon (highlighted in yellow on Fig. 3band c) that may be readily traced around folds and across thrusts. Re-storation of this marker suggests ∼40% shortening along the section,which is a similar value to other restored thrust sections in the LisanFormation (e.g., Alsop et al., 2017a). In detail, the amount of
Fig. 3. a) Imbricated south-verging thrusts and associated folds developed within the Lisan Fm. at Wadi Zin (N30°57′38″ E35°18′9″). The photograph has been mirrored so that south isuniformly towards the right-hand side of all photos. b) View of the imbricated sequence along a disused track, while c) shows an interpretation of the same section with the basaldetachment displaying forethrust ramps (FT) and backthrusts (BT) that are sequentially numbered from oldest (1) to youngest (10). A distinctive 10 cm thick detrital marker horizon ishighlighted (in yellow), while a sedimentary capping layer deposited from suspension following the slump is shown in blue. d) Stereonet of thrust planes (N=11), and folds (N=32),showing fold hinges (mean 3/091), axial planes (N=29) and thrust planes (mean 104/10N). Structural data on the stereonet is represented as follows: fold hinges (solid red circles),mean fold hinge (open red circle), poles to fold axial planes (open blue squares), thrust planes (red great circles), and poles to thrust planes (solid red squares). Calculated slump transportdirections based on thrust data (red arrow) are subparallel to the trend of the outcrop section (black arrows). e, f) Graphs comparing the original distance along the section (measuredfrom the northern end) with e) displacement on each forethrust (FT), and f) cumulative displacement on the forethrust sequence. (For interpretation of the references to colour in thisfigure legend, the reader is referred to the Web version of this article.)
G.I. Alsop et al. Journal of Structural Geology 109 (2018) 99–119
103
(caption on next page)
G.I. Alsop et al. Journal of Structural Geology 109 (2018) 99–119
104
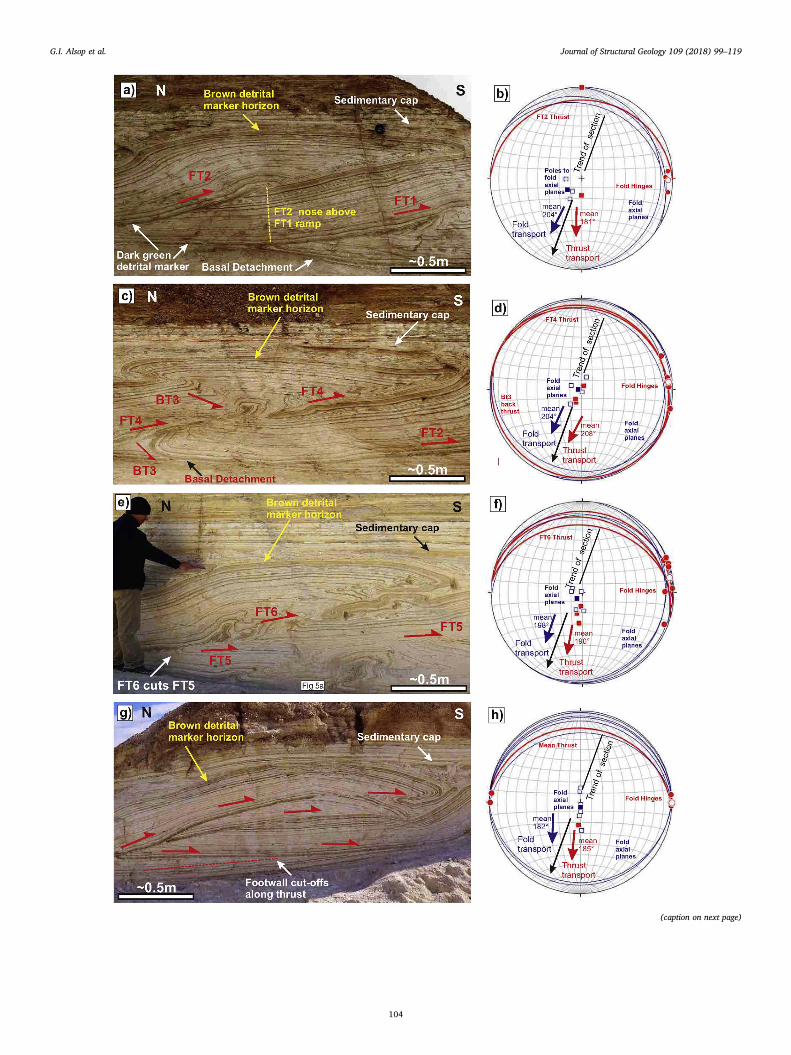
displacement shown by this marker across each forethrust increases inthe thrust transport direction, from ∼1m displacement (FT10) at thenorthern end to∼ 2.5 m (FT2) at the southern end of the section(Fig. 3b and c, e, f). The maximum amount of displacement across eachthrust displays a similar trend and systematically increases towards thesouthern end of the section. The significantly smaller displacement(∼0.5m) of the marker horizon across forethrust 6 (FT6) (Fig. 3e) isanomalous and may reflect the fact that the marker horizon is folded inthe footwall of this thrust.
5. Detailed geometry and kinematics of the fold and thrust system
We now describe in detail a number of structural relationships thatallow us to determine the general order of thrust development in theimbricated sequence.
5.1. Truncation of underlying folds
Upright and south-verging folds that are generated above thrustramps and detachments are truncated by younger overlying forethrustsdirected towards the south (Fig. 5a and b). This relationship suggeststhat folding is slightly earlier, and deformation related to thrusting hastransferred to higher levels and cuts across the underlying folds. Al-though an increment of folding developing in advance of the thrustfront is to be expected in piggyback sequences (see Butler, 1987, p.626,his Fig. 14; Morley, 1988), the repeated cutting of thrust-related foldingby structurally higher thrusts supports an overstep sequence ofthrusting.
5.2. Truncation of underlying forethrusts
Our observations consistently show that forethrusts directed to-wards the south may be cut by younger thrusts in their hangingwall(Fig. 3b and c). Within the imbricate sequence, forethrust 5 (FT5) is cutby the structurally overlying FT6 (Fig. 3b and c, 4e). Multiple systemsof thrusts (T) are successively cut by younger thrusts in their hang-ingwall, such that T1 is cut by T2, while T2 is subsequently truncatedby T3 (Fig. 5c–f). This geometry suggests that deformation andthrusting have transferred successively to higher levels, upslope to-wards the north, that is consistent with an overstep thrust sequence.
5.3. Truncation of underlying stratigraphy
Butler (1987, p. 627, his Fig. 17) demonstrated that overstep thrustsequences may cut up or down section in their footwall, depending onthe geometry of underlying pre-existing structures. Within the studyarea, basal detachments cut through footwall stratigraphy that is tiltedupslope (i.e. thrusts are cutting down stratigraphic section in theirfootwall) (Figs. 4g and 5c, d). This down-cutting in the direction ofthrust transport suggests that older structures may have formed lowerdown, below the present surface exposure, to create a geometry de-scribed by Morley (1988, p. 541, his Fig. 2f) as reflecting out-of-se-quence (or overstep) thrusting.
5.4. Loading by thrust sheets
Within areas where thrusts and associated folds overlap with oneanother to form imbricates, the leading ‘nose’ of the overlying thrustsheet is marked by a downward-directed deflection of underlying thrustsheets in their footwalls (Fig. 5 c, h). Downward deflections are asso-ciated with attenuation and ‘pinching’ of underlying layers, which isespecially apparent when detrital marker horizons in the upper thrustsheet are in contact with equivalent markers in the underlying thrustsheet (Fig. 5c, h). In some instances, overlying thrusts remain relativelyplanar (e.g. T3 in Fig. 5h), while the underlying thrusts are deflecteddownwards (T2 in Fig. 5h), thereby suggesting that the upper thrust hasdepressed the underlying thrust. We therefore propose that loadingfrom overlying thrust sheets causes downward deflections of underlyingthrusts, and is consistent with an overstep thrust sequence.
5.5. Folding of thrust sheets
The order of thrust development is clearly established via cross-cutting relationships (Fig. 3b and c, 5d, section 5.2). Where the over-lying and younger thrust sheets are translated above the underlyingpre-existing thrusts, arching and downward facing fold noses in theyounger thrusts can result (Fig. 5c, h). The downward-facing of foldnoses may be further enhanced by expulsion of sediment from belowthrust sheets as noted above (section 5.4). The arched thrusts anddownward facing fold geometry is not a consequence of later folding,but rather the passive draping of the younger overlying thrust sheetover a pre-existing culmination created by earlier thrusts (Fig. 5c, h).The observation that the thrusts in Fig. 5c, do not meet at a commontrailing point or branch line, and are intersected by the overlying thrust(T3), means that this structure is not an antiformal stack (see McClay,1992, p.425), although it superficially resembles an antiform. Thisgeometry is therefore consistent with overstep thrust sequences.
5.6. Extension over culminations
The passive folding and arching of thrust sheets noted above (sec-tion 5.5.) results in a series of conjugate normal faults at the crest of theculmination (Fig. 5g). These normal faults are E-W trending and arerestricted to the upper portion of the uppermost thrust sheet reflectingouter-arc extension. Where normal faults continue into the overlyingcap that was deposited from suspension following the failure event(Alsop and Marco, 2012b; Alsop et al., 2016), the cap displays thick-ening in the hangingwall of the normal fault (Fig. 5g). This observationis interpreted to represent ‘growth’ geometries, indicating that thenormal faulting took place before and during deposition of the cap. Thisgrowth faulting, and the observation that the normal faults do not cutacross the cap into the overlying sequence, demonstrates that thrustingand subsequent crestal extension was complete prior to deposition ofthe younger sequence. Although not considered unique to overstepthrust sequences, the outer-arc extension is thought to be a consequenceof draping of the upper thrust sheet over the underlying and pre-ex-isting culmination.
Fig. 4. Photographs (a, c, e, g) and associated stereonets of structural data (b, d, f, h) from the slumped horizon at Wadi Zin (N30°57′38″ E35°18′9″). Photograph g) has been mirrored sothat south is uniformly towards the right-hand side of all photos. b) Stereonets of FT2 thrust plane (N=1), and folds (N=2), showing fold hinges (mean 6/091), axial planes (mean 142/16N) and thrust planes (mean strike 091°). d) Stereonets of FT4 thrust planes (N=3), and folds (N=5), showing fold hinges (mean 5/085), axial planes (mean 116/10N) and thrustplanes (mean strike 119°). f) Stereonets of FT6 thrust planes (N=3), and folds (N=7), showing fold hinges (mean 4/080), axial planes (mean 137/7NE) and thrust planes (mean 100/19N). h) Stereonets of thrust planes (N=1), and folds (N=7), showing fold hinges (mean 0/090), axial planes (mean 093/4N) and thrust planes (mean 095/20N). Structural data oneach stereonet is represented as follows: fold hinges (solid red circles), mean fold hinge (open red circle), poles to fold axial planes (open blue squares), mean pole to fold axial plane (solidblue squares), thrust planes (red great circles), and poles to thrust planes (solid red squares). Calculated slump transport directions based on fold data (blue arrows) and thrust data (redarrows) are subparallel to the trend of the outcrop section (black arrows). (For interpretation of the references to colour in this figure legend, the reader is referred to the Web version ofthis article.)
G.I. Alsop et al. Journal of Structural Geology 109 (2018) 99–119
105

(caption on next page)
G.I. Alsop et al. Journal of Structural Geology 109 (2018) 99–119
106

5.7. Control of underlying ramps
Where sequences of thrusts are observed, the nose of the hanging-wall anticline (as defined by the competent marker horizon) within theupper thrust sheet frequently overlies the point where underlyingthrusts start to steepen up and ramp from the basal detachment(Figs. 3a, 4a and 5h, i). This steepening-up of underlying thrust sheets isconsidered to act as a buttress and inhibit displacement along lateroverlying thrusts. While some of these geometries were perhaps en-hanced by the effects of loading from the overlying thrusts (section 5.4),the influence exerted by underlying older thrust ramps on displacementin overlying thrusts is consistent with overstep thrust sequences.
6. Backthrusts within imbricate sequences
Backthrusts typically dip more steeply, and in an opposing directionto adjacent forethrusts in MTDs around the Dead Sea Basin (Alsop et al.,2017b) (Figs. 3b and c, 4c, 6a). Within the imbricate sequence, back-thrusts (BT3, BT7, BT9) displace the marker horizon by 286mm,400mm and 500mm respectively, are convex up with dips of 35°–40°(making angles of 42° with adjacent bedding in BT3) and flatten to-wards their upper tips (Figs. 3b and c, 6a–e). Stratigraphy in the foot-wall of backthrusts may locally deflect downwards within the trianglezone, suggesting that the footwall may have been ‘wedged in’ duringdownslope-directed under-thrusting (Fig. 6b, c, d) (see Alsop et al.,2017b). These backthrusts display a number of geometric relationshipsto the adjacent forethrusts that permit the order of thrusting to be es-tablished, and are described below.
6.1. Truncation of backthrusts by forethrusts
Backthrust ramps represent ideal markers that may be offset by laterforethrusts and therefore used to help determine the order of thrustpropagation. In piggyback sequences, forethrusts may be cut by back-thrusts that initiate downslope in their footwall. However, in overstepsequences, backthrust ramps are likely to be cut by forethrusts thatinitiate upslope in the footwall of the backthrust. Within the imbricatesequence, backthrusts (BT3, BT7) are cut and displaced by youngerforethrusts in their footwall (FT4 and FT8 respectively, Fig. 3b and c,6a, e). Cutting of backthrust ramps by younger forethrusts causes thebackthrust to be folded into hangingwall anticlines and footwall syn-clines linked to the younger thrust (Fig. 6a–e). The backthrust can thenno longer operate as it becomes ‘locked-up’ and inactive, thereby pro-ducing relatively small displacements on the backthrusts (< 400mm inBT3 and BT7). The hangingwall sequence above FT4 dips gently to-wards the south in the direction of thrusting, suggesting that theyounger forethrust has not fully compensated and rotated the sequencethat would have dipped in the direction of thrusting above the steeperBT3 (Fig. 6a).
6.2. Truncation of forethrusts by backthrusts
Within the imbricated sequence, backthrust BT9 at the northern endof the section cuts FT8 (Fig. 3b and c, 6d). While the backthrust (BT9)ramps off the basal detachment, FT8 does not cut down onto the basaldetachment, but forms a flat ∼10 cm above the imbricated lower det-rital layer (Fig. 6c, d, e). This difference in the levels of the backthrust
and forethrust flats permits the younger backthrust to cut the forethrustin its hangingwall (Fig. 6d). In addition, downslope-verging folds de-veloped in the hangingwall of the forethrust flat (FT8) may be subse-quently tilted downslope, to become downward-facing, as they aretranslated along the BT9 ramp (Fig. 6d). This backthrust (BT9) dips at40° and causes stratigraphy in its footwall to be deflected downwards asthe upslope wedge is ‘driven-in’ (see Alsop et al., 2017b). In summary,FT8 cuts and displaces BT7, but is itself cut by BT9, providing a clearsequence of thrusting that gets progressively younger towards thenorth, in the upslope direction, and therefore collectively defines anoverstep thrust sequence.
7. Folding of detachments and ‘short-cut’ thrusts
7.1. Basal detachment
The basal detachment is universally developed immediately below a5 cm thick dark green detrital-rich layer (Figs. 3a, 4a and 6a). Thisdiscontinuity locally cuts obliquely across beds in the footwall that aretilted gently upslope (Figs. 5c and 7a, b). Some thrust ramps branchdirectly from the basal detachment, and define overstep sequences withunderlying thrusts and folds truncated and offset by overlying(younger) thrusts (Fig. 7a, c). This behaviour may result in fold hingeswithin the dark green detrital layer becoming progressively ‘detached’and isolated by younger thrusts cutting across them (Fig. 7c). In otherinstances, thrust ramps initiate in the hangingwall of the basal de-tachment, and fail to propagate downwards across the green detritalmarker to join the underlying detachment (Fig. 7d).
The basal detachment itself is generally< 1 cm thick, although itlocally forms a zone up to ∼5 cm thick marked by disrupted beds(Fig. 7e) with extensional shears (Fig. 7f) and several individual de-tachments (Fig. 7g). The base of the detachment zone is generally asharp planar discontinuity, while individual strands of the detachmentsystem are locally observed to cut into the dark green marker layer(Fig. 7h). The top of the detachment zone is marked by a gouge layerdirectly beneath the dark green detrital bed (Fig. 7g and h). The gougeis generally light grey to buff coloured, up to 30mm thick, and is si-milar to gouge horizons formed along bedding-parallel slip surfacesobserved elsewhere in the Lisan Formation (Weinberger et al., 2016)(Fig. 7b, d–h). Locally, the underlying sediment and gouge within thebasal detachment zone penetrate upwards as small ‘fingers’ into theoverlying dark green detrital marker (Fig. 7i and j). We speculate thatthis dark green layer significantly controlled the depth to basal de-tachment at ∼0.8 m, with potential increases in pore fluid pressuredirectly below this marker causing the injection of sediment fingers.
7.2. Fault gouge and thrust ramps
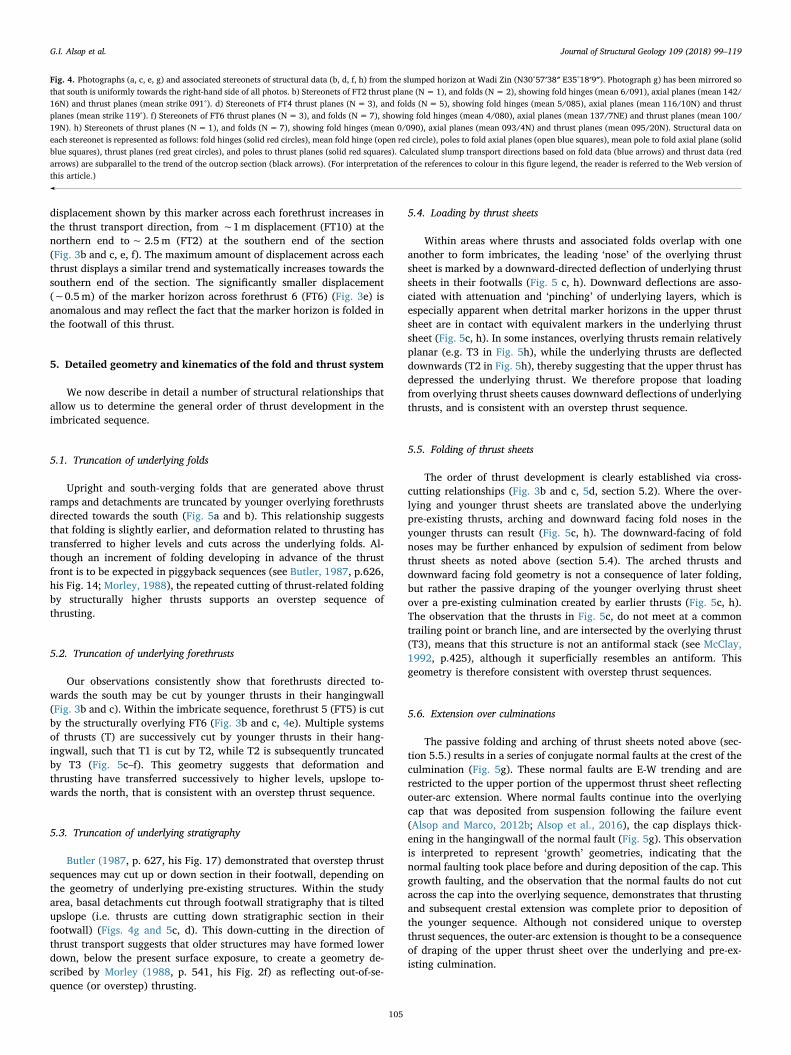
While thrust displacement along bedding-parallel flats and basaldetachments may be difficult to determine due to the lack of suitableoffset markers, the position of thrust ramps is clearly shown by dis-placement of bedding. In addition, a locally developed fault gouge up to20mm thick and extending for tens of cm is formed along the thrustramps (Figs. 7g–j, 8a-d). The gouge comprises disaggregated grains andfragments of white aragonite and dark detrital-rich sediment that aremixed together to form the light grey-buff gouge (Fig. 8a, c). The gougeis sometimes bordered by 10mm thick brecciated zones, where dark
Fig. 5. Photographs of transport-parallel sections from the Zin case study (N30°57′38″ E35°18′9″). The hammer (25 cm long with 20 cm head) and chequered rule (10 cm long) act asscales. a, b) Upright folds within the dark-green detrital-rich marker horizon that are truncated by overlying thrusts. c) Overlying younger thrust (T3) cuts across older thrusts (T1, T2) inits footwall. The lowermost T1 thrust also truncates tilted stratigraphy in its footwall. d) Detail of thrust truncations shown in Fig. 5c. e, f) Details of older thrusts being folded andtruncated by overlying younger thrusts (see Fig. 5d for location). g) Conjugate normal faults developed over the crest of the arched thrust sheet (T3) shown in Fig. 5c. The insetphotograph highlights sedimentary thickening and ‘growth’ where the normal faults influence deposition of the overlying sedimentary cap. h) Deflection of older underlying thrust (T2)by overlying thrust sheet and planar T3 thrust (see Fig. 5c for position). i) Overlying thrusts (T) with noses of hangingwall anticlines positioned above ramps that branch from theunderlying basal detachment. See text for further details. Photographs c, d, g, and h) are mirrored so that south is uniformly towards the righthand side of all photos. (For interpretation ofthe references to colour in this figure legend, the reader is referred to the Web version of this article.)
G.I. Alsop et al. Journal of Structural Geology 109 (2018) 99–119
107

(caption on next page)
G.I. Alsop et al. Journal of Structural Geology 109 (2018) 99–119
108

detrital-rich horizons are broken into mm-scale fragments (Fig. 8a). Insome cases, the breccia zone is bordered on both sides by extremelyfine-grained gouge that truncates bedding laminae above and below thebreccia (Fig. 8b). The thickness of the breccia and gouge horizons doesnot appear to correlate with the displacement magnitudes across thethrusts, with gouge perhaps best developed where thrusts cut directlyacross aragonite- and detrital-rich layers in their footwall and hang-ingwall. Anisotropy of magnetic susceptibility (AMS) studies(Weinberger et al., 2017) within the gouge developed along FT4(Fig. 6a and b) reveal a predominantly oblate fabric and thrust trans-port towards the south. Taken with the development of gouge-flankingbreccia, our observations suggest that once breccia and gouge horizonsdeveloped, they were relatively weak and focussed continued slip, ra-ther than becoming wider zones of deformation (see Weinberger et al.,2016).
7.3. Detachments and ‘short-cut’ thrusts
Detailed examination of gouge reveals that it may be locally thrustand displaced (Fig. 8e). In addition, gouge may form along basal de-tachments that are developed below detachment folds (Fig. 8f). Parts ofthe gouge are displaced and imbricated within the core of such folds,while the main horizon of gouge is present along the basal detachment(Fig. 8f). This relationship suggests that while earlier-formed gouge isimbricated, new gouge forms along the basal detachment during con-tinued translation. Similar patterns of multiple generations of gouge areobserved around footwall synclines positioned immediately beneathwhere thrusts ramp from the basal detachment (Fig. 8g–j). Gougeformed along the basal detachment is locally imbricated and thrustwithin the footwall syncline (Fig. 8h, i, j), while the underlying basaldetachment is also marked by gouge beneath the imbricated zone. Weinterpret this geometry to reflect imbrication and folding of earlyformed gouge along the basal detachment, with new gouge thenforming along a ‘short-cut’ fault that defines a new basal detachmentbelow the syncline during continued movement (section 9.4.1.).
8. Displacement –distance plots
Displacement-distance analysis involves measuring the distancealong the hangingwall of a thrust from a fixed reference point (‘R’ nearthe fault tip) to a marker horizon, and comparing this distance with thedisplacement of that marker across the thrust (Muraoka and Kamata,1983; Williams and Chapman, 1983; Chapman and Williams, 1984)(Fig. 9a). The process is then repeated for different marker beds alongthe length of the fault to create a displacement-distance (D-D) plot forthat fault. In general, steeper gradients on D-D plots represent slowerpropagation of the thrust tip relative to slip accrual in weaker units,while gentle gradients on D-D plots represent more rapid propagation ofthe thrust tip relative to slip accrual in stronger or more competentunits (e.g. Williams and Chapman, 1983; Ferrill et al., 2016). As dis-placement on faults is typically assumed to be time-dependent, thenolder portions of faults are assumed to accumulate the greatest dis-placement (e.g. Ellis and Dunlap, 1988; Hedlund, 1997; Kim andSanderson, 2005). The point of maximum displacement on a D-D plot istherefore typically interpreted to represent the site of nucleation of afault (e.g. Ellis and Dunlap, 1988; Peacock and Sanderson, 1996;Hedlund, 1997; Ferrill et al., 2016).
In the Zin case study, displacement-distance (D-D) plots acrossthrust ramps, which root downwards onto the basal detachment of thesystem, show the greatest displacement at the lowermost part of theramp, or further up the ramp itself (Fig. 9a–j). Unlike forethrusts de-veloped in piggyback sequences elsewhere in the Lisan Formation(Alsop et al., 2017a), the forethrusts analysed in this study do notdisplay simple linear displacement-distance relationships (Fig. 9a–j). Insome cases, the greatest displacement is developed further up the ramp,to create ‘hook shaped’ D-D profiles (Fig. 9a–f). In other cases, the D-Dprofiles display distinct steps and jumps which correlate with where thethrusts cuts detrital markers (Fig. 9e, f, i, j), or pre-existing thrusts intheir footwall (e.g. Fig. 9g and h). Displacement-distance data from athrust ramp developed within the hinge of a hangingwall anticlineabove FT6 (labelled FTa in Fig. 9g and h) reveals marked displacementgradients towards both its lower and more especially upper tips, anddemonstrates that pronounced displacement gradients are an importantfeature of thrusts cutting unlithified sediments. Overall, the steepestdisplacement gradients consistently developed towards the upper faulttip (Fig. 9a–j). These relationships collectively suggest that thrust rampsdo not always propagate upwards from the underlying basal detach-ment, which must have already been present in an overstep sequence,but initiated in the hangingwall of the detachment (e.g. Fig. 7d). In-dividual thrust ramps that display a number of displacement maximaare inferred to be thrusts that possibly formed via amalgamation ofseveral smaller fault strands (Fig. 9g–j) (Alsop et al., 2017a).
9. Discussion
Our structural analysis demonstrates that a south-directed fold andthrust imbricated sequence formed within the case study (Figs. 3 and4). This south-verging MTD is directed away from the Dead Sea, andclearly does not form part of a radial pattern of slumping developedfurther north, which verges towards the depocentre of the basin (Alsopand Marco, 2012a), This apparently anomalous situation can be ex-plained by tilting of large-scale fault blocks associated with the NW-SEtrending Amazyahu Fault, which was active during deposition of theLisan Formation and is developed immediately to the NE of the studyarea (Fig. 1b, d) (Smit et al., 2008; Weinberger et al., 2017). Gentletectonic tilting of fault blocks by just a few degrees across this NE-dipping listric transverse fault system (Smit et al., 2008) would besufficient to alter directions of slope failure and gravity-driven MTDemplacement during deposition of the Lisan Formation (Alsop andMarco, 2012a, 2013).
9.1. What criteria can be used to distinguish different thrust sequences?
9.1.1. Cross-cutting relationshipsThe most straightforward criteria to establish order of thrust de-
velopment are cross-cutting relationships between thrusts themselves.Butler (1987, p. 619) stated that overstep geometries are marked byearlier structures being truncated in the footwall of a later fault. Thus,in our study, thrusts are subsequently truncated by overlying thrustsand are therefore indicative of an overstep sequence (e.g. Figs. 4e and5c, d, 10). In addition, folds that detach on underlying thrusts are alsocut by overlying thrusts supporting an overstep sequence (e.g. Fig. 5aand b, 7a, 10). Similar observations of folds being truncated by over-lying thrusts have also been reported from outcrop studies of other
Fig. 6. Photographs from the transport-parallel trench at the Zin case study (N30°57′38″ E35°18′9″). The chequered rule (10 cm long) and 25 cm long hammer act as a scale. Refer toFig. 3b and c for details of location of forethrusts and backthrusts. a) Backthrust 3 (BT3) is cut and displaced by a younger forethrust (FT4) that developed upslope in its footwall. The‘pop-up block’ in the hangingwalls of BT3 and FT4 is tilted gently downslope (to the south). b) Details of BT3 and FT4 branching from the same basal detachment, with BT3 being foldedinto a footwall syncline along FT4. Position shown in Fig. 6a. c) Details of the imbrication of dark-green detrital rich marker horizon in the footwall of BT7. These imbricates are cut acrossby the younger FT8. Position shown in Fig. 6d. d) Details of BT9 that truncates FT8 and its associated south-verging folds. Folds are interpreted to have been tilted by BT9 to becomedownward-facing towards the south. The stratigraphy forming the footwall to BT9 is marked by pronounced downward deflection towards the south. e) Backthrust 7 (BT7) is truncatedand folded by forethrust 8 (FT8) that develops upslope (towards the north). See text for further details. (For interpretation of the references to colour in this figure legend, the reader isreferred to the Web version of this article.)
G.I. Alsop et al. Journal of Structural Geology 109 (2018) 99–119
109

(caption on next page)
G.I. Alsop et al. Journal of Structural Geology 109 (2018) 99–119
110

MTDs (e.g. Strachan, 2002, p.32, her Fig. 7a).
9.1.2. Loading and deflection of underlying thrustsThe effects of loading by overlying thrust sheets are most pro-
nounced where competent marker horizons impinge directly on oneanother, and where the overlying thrust sheet comprises a recumbentfold nose (e.g. Figs. 3a and 5c, h). Loading may locally depress un-derlying thrusts to create upright synforms (e.g. T2 in Fig. 5h), whilethe overriding thrust remains relatively planar (e.g. T3 in Fig. 5h). Thissuggests that T3 generated the loading, and while there may be somelocal ‘out-of-the syncline’ movement along T2, which caused displace-ment of the marker horizon, T2 effectively became ‘locked’ due to itsfolded geometry (Fig. 10). Overlying thrusts loading and deformingunderlying thrusts is suggestive of an overstep thrust sequence (e.g.Fig. 5h).
9.1.3. Structural inheritance from underlying thrustsStructural inheritance whereby the extent and geometry of an
overlying thrust is controlled by the geometry of the underlyingstructure may also be used to determine the sequence of thrust devel-opment (e.g. Fig. 5i). Following Dahlstrom (1970, p.352), Boyer andElliot (1982, p.1207) note that “a higher horse is folded over a lowerone proving forward development”. However, in the case study, wherehigher thrust sheets (horses) are folded over lower ones, then the highersheet clearly truncates the underlying thrust (Fig. 5c and d). Thus, al-though the overall geometry of Fig. 5c broadly resembles an ‘antiformalstack’ (e.g. Butler, 1987, p. 621), detailed relationships and the lack of acommon trailing branch line (e.g. McClay, 1992, p.425) demonstrate anoverstep rather than a piggyback sequence.
In summary, these three primary strands of evidence collectivelydemonstrate a predominant overstep sequence of thrusting (Fig. 10).Although overstep thrusting has long been suggested to occur duringslumping of sediments (e.g. Farrell, 1984), this detailed study of such asequence within a gravity-driven fold and thrust belt is the first todocument the sequencing.
9.2. What are the cross-cutting relationships between forethrusts andbackthrusts?
In gravity-driven MTDs, fold and thrust systems will translate andverge down the regional slope (Fig. 10). In downslope-propagatingpiggyback thrust sequences (Fig. 1a), it is more likely that youngerbackthrusts developed in the footwalls of forethrusts will cut the fore-thrusts (Fig. 11a), whereas if backthrusts develop first they may betranslated up the ramp of the later forethrust (Fig. 11b). No such re-lationships relating to downslope-propagating thrust systems have beenobserved in the case study. Conversely, in upslope propagating overstepsequences (Fig. 1b), oppositely dipping backthrusts are more prone tobeing cut by younger forethrusts developed further upslope (Fig. 11c),while older forethrusts may be truncated and carried in the hangingwallof younger backthrusts (Fig. 11d). The relationships observed in thecase study where older backthrusts are cut by younger forethrusts de-veloped upslope (e.g. BT3, BT7 in Fig. 6a, e relates to Fig. 11c), or olderforethrusts are cut by younger backthrusts upslope (e.g. BT9 in Fig. 6drelates to Fig. 11d) are entirely consistent with an overstep sequence ofthrust development.
9.3. Why do overstep thrust sequences develop?
When discussing orogenic thrust belts, Butler (1982, p. 241) notedthat “overstep thrust sequences are rarely recognised and, hence, thegeometry of such thrust splays is not well described”. Although localexamples of overstep sequences within orogenic belts are documented(e.g. Butler and Coward, 1984; Coward, 1985; Butler, 1987), a foreland-propagating or piggyback system of thrusting is generally applied tothrust belts. Morley (1988, p.540) suggested that any individual‘random’ thrust, or sequence of thrusts that follows a break-back(overstep) sequence should be termed out-of-sequence and providedsome general examples. In addition, Butler and McCaffrey (2004,p.916) described a clear km-scale example of an individual break-backor overstep sequence in the Alps of SE France. In this example, foldingof thrust ramps lead to new short-cut thrusts forming in the hanging-wall that truncated the underlying thrust ramp.
Within MTDs, Farrell (1984, p.735) noted that if movement of theslumped mass ceases first at the downslope toe, perhaps due to a re-duction in slope gradient, then continued downslope movement of theportions of the slump further upslope will lead to a late-stage con-tractional strain wave propagating back up the slumped mass (see alsoStrachan and Alsop, 2006; Alsop and Marco, 2011, 2014). This beha-viour will generate downslope-verging folds and thrusts that form at arelatively late-stage and get progressively younger back up the slope inan overall overstep sequence (Fig. 1b). A number of studies do indeedinvoke an upslope-propagating contractional strain wave to create late-stage thrusts such as observed in Carboniferous-aged slumps of westernIreland (Martinsen and Bakken, 1990; Strachan and Alsop, 2006) orMiocene-aged slumps of New Zealand (Strachan, 2008), although de-tails of the exact timing relationships between thrusts are lacking inthese cases. Thus, despite such overstep thrust sequences having longbeen assumed to operate during cessation of downslope movementwithin sediments, we have not found existing detailed descriptions ofsuch thrust sequences developed in gravity-driven fold and thrust belts.
Within the Zin case study, we have demonstrated that slumptransport is directed towards the south, resulting in an overstep thrustsequence where structures get younger up the depositional slope to-wards the north (see section 10.1.) (Fig. 3b and c). However, evidenceis lacking for an earlier deformation with significant structures that pre-date the thrusts, and the fold and thrust imbricates cannot therefore beregarded as ‘late stage’ features. We propose that similar overstep thrustsequences will be created if movement towards the toe of the MTDsimply reduces velocity compared to more rapid translation of theslumped mass further upslope. We suggest that in this case, the overstepsequence is not linked to cessation of movement but was created duringvariable rates of downslope flow during actual translation of the MTD.Furthermore, if second-order cells of variable flow were developedduring translation (Alsop and Marco, 2014), then local sequences ofoverstep thrusting could form throughout the gravity-driven fold andthrust belt.
9.4. Can some thrusts move synchronously?
Despite the common expectation that piggyback thrusting occurs, ithas long been recognised that “it is unrealistic to expect older thrusts tobe deactivated as movement is transferred to younger thrusts” (Boyer,1992, p.386). Indeed, a number of authors including Morley (1988),
Fig. 7. Photographs of the basal detachment and directly overlying dark green detrital rich marker bed. a, b) Basal detachment cuts across footwall stratigraphy that is gently-dippingupslope. In a) fold hinges are cut across by overlying thrusts in an overstep sequence. c) Thrusts ramping up from the basal detachment that cut existing folds forming detached fold hingeswithin the dark green marker layer. d) Thrusts developed in the hangingwall of the basal detachment fail to propagate downwards through the dark green marker layer. e, f) Basaldetachment marked by an intensely deformed ∼5 cm thick zone beneath the dark green marker. The base of the detachment zone is a planar discontinuity, while the top displays faultgouge. g) Basal detachment zone marked by several individual detachment strands that in h) are locally interpreted to propagate through the detrital marker. i) The top of the detachmentzone is marked by fault gouge that locally truncates the overlying hangingwall stratigraphy. j) Basal detachment beneath a backthrust (BT3) that displays a ‘finger’ and injection of gougeand sediment up into the overlying dark green detrital marker. 10 cm long chequered rule and 15mm diameter coin for scale. (For interpretation of the references to colour in this figurelegend, the reader is referred to the Web version of this article.)
G.I. Alsop et al. Journal of Structural Geology 109 (2018) 99–119
111
(caption on next page)
G.I. Alsop et al. Journal of Structural Geology 109 (2018) 99–119
112

Boyer (1992, p. 377) and Butler (2004, p.2) suggest that thrusts mayhave been active synchronously in many orogenic belts. Totake et al.(2017) utilizing seismic reflection data across an offshore fold andthrust belt that may be driven by a combination of both collisional platetectonics and gravitational failure of the slope emphasise that “foldstructures and their underlying thrusts were not active in a strict se-quence” and that “structures were active in parallel” (i.e. synchronous).Synchronous development of thrust systems has also been proposed byCruciani et al. (2017) within gravity-driven fold and thrust belts withinMTDs. Based on modelling, Liu and Dixon (1995, p.885) also noted that“early formed thrusts continue to accumulate displacement even whilenew ones are nucleating”. We therefore discuss some of the featuresassociated with synchronous thrusting in MTDs from the Zin case study(Fig. 1c).
9.4.1. Folding of earlier detachmentsIn piggyback systems, earlier thrust ramps are abandoned and may
be passively carried in the hangingwall of younger underlying ramps(e.g. Butler, 1987, p. 620) (Fig. 1a). The entire underlying basal de-tachment or floor thrust is generally considered to be active throughoutthis process (Fig. 1a). Conversely, in overstep sequences, the foreland,or downslope, portions of the underlying basal detachment are pro-gressively abandoned as the locus of displacement propagates backtowards the hinterland, or upslope (Fig. 1b). Upslope propagation ofdownslope-verging overstep sequences may result in basal detachmentsbeing folded by footwall synclines as they become sequentially aban-doned (Fig. 10). Where a basal detachment is tightly folded then it canno longer be active. Within our study, the basal detachment may befolded around the footwall syncline of forethrusts, leading to localimbrication (Fig. 8h, i, j). In other cases, bridging ‘short-cut’ faultsmarked by gouge layers run along the base of the footwall syncline,indicating that the basal detachment was still active and did not lock-up(Fig. 8f–j).
We suggest that downslope thrusts and basal detachment may havecontinued to move, but not as rapidly as upslope thrusts. This behaviourwould produce short-cut faults and gouge layers developed belowfolded detachments as downslope movement continued during syn-chronous thrusting (Fig. 10).
9.4.2. Systematic increase in displacement across imbricatesIf early-formed thrusts remain active as newer thrusts develop, and
assuming thrust displacement rates have remained fairly constant, thenolder thrusts should accrue larger displacements (Boyer, 1992, p.384)(Fig. 1c). Seismic sections across the Orange Basin offshore Namibiareveal “Displacement on individual faults increases progressively fromthe deformation front to the inner part of the contractional domain” (deVera et al., 2010, p.229). Within this piggyback system of thrusting (deVera et al., 2010), such a systematic increase upslope towards thepresumed older thrusts suggests that a component of synchronousthrusting may also have operated. In the case of broadly overstep se-quences associated with a component of synchronous thrusting, greaterdisplacements should therefore be observed in the downslope portion ofthe gravity-driven fold and thrust belt adjacent to the toe (Fig. 1c).Indeed, many interpretations of slumps and MTDs suggest increasingdeformation towards the toe (e.g. Cruciani et al., 2017). The sectionthrough the imbricated overstep sequence clearly displays a systematicincrease in displacement in the direction of thrust transport and
vergence (Fig. 3b–f). Forethrust 6 (FT6) forms the single exception tothis general trend, which may relate to FT6 cutting through earlierupright folds of the competent detrital marker layer causing the thrustto take a slightly steeper trajectory, before it can create a bedding-parallel flat above the marker (Fig. 4e). Where FT6 has cut through thiscompetent marker, a distinct step in the displacement-distance plot isobserved (Fig. 9g, f). In addition, FT6 truncates earlier thrusts (FT5) inits footwall (Fig. 4e) (section 4.1.), while FT6 is itself cut across by ayounger upslope backthrust (BT7) that may have truncated and ‘locked-up’ the forethrust before it had opportunity for displacement to growfurther (Fig. 3b–f).
In summary, pre-existing or subsequently formed structures mayinfluence displacement on imbricates, although the overall progressiveincrease in displacement downslope towards the toe indicates syn-chronous thrusting of an overstep sequence.
9.4.3. Displacement on backthrustsBackthrusts typically have much smaller displacements than ad-
jacent forethrusts with<500mm displacement of the marker horizonon BT3, BT7 and BT9 (e.g. Fig. 3b–c) and is partially a consequence ofbackthrusts being steeper than forethrusts, so that they are less efficientat accommodating horizontal shortening. However, backthrusts maynot have a large component of synchronous thrusting displacement asthey are folded and truncated by later overlying forethrusts in anoverstep sequence. This truncation and dislocation effectively ‘locks-up’the backthrusts causing them to become abandoned. Backthrusts thatare not cut across by forethrusts may have slightly larger displacements(e.g. BT9 in Fig. 3b and c). In general, synchronous thrusting is hin-dered and reduced by thrusts that cut across one another therebyleading to abandonment of the displaced thrust plane.
9.5. How do displacement-distance plots relate to overstep thrust sequences?
9.5.1. Displacement on thrust rampsAs noted previously (Alsop et al., 2017a), displacement-distance (D-
D) patterns are much more variable along thrust ramps cutting un-lithified sediments compared to those plots from thrusts in lithifiedsequences. Analysis of D-D plots from seismic sections across large-scaleMTDs in offshore setting suggests that the greatest displacement mayoccur near the basal detachment/shear zone, and that this displacementprogressively diminishes up the thrust ramp (Frey-Martinez et al., 2006,p.595). However, in some instances within our study, displacementdoes not reduce significantly towards the apparent fault tip leaving thedisplacement profile ‘detached’ from the tip (e.g. Fig. 9g–j). Such pro-files are most obvious where thrusts have a ramp geometry throughtilted stratigraphy in the underlying thrust sheet (Fig. 9e and f, 9i, j).This relationship suggests that some faults may follow a bedding-par-allel ‘flat’ trajectory above the upper marker, with the actual fault tippotentially located further downslope. However, marked displacementgradients towards both upper and lower thrust tips in other cases areconstrained by adjacent stratigraphy, thereby demonstrating that suchgradients are genuine and not an artefact of measurement error (Fig. 9gand h) (see also Alsop et al., 2017a, b).
Similar pronounced gradients in fault displacement have beenidentified by Butler and McCaffrey (2004) who described km-scalethrusts that locally display break-back (overstep) sequences cuttingweakly lithified turbidites in the Alps. Butler and McCaffrey (2004,
Fig. 8. Photographs (a, b, c, d) of fault gouge developed along thrust imbricate ramps from the Zin cutting. The light-grey or buff colour of the gouge is created by mixing of aragonite-and detrital-rich laminae that are truncated by the thrust. e) Gouge horizon cut by a small thrust associated with an overlying fold pair picked out by the dark-green detrital rich markerhorizon. f) Upright detachment fold that deforms the dark-green detrital rich marker horizon. The gouge horizon is folded and imbricated within the fold core, but also is developed alongthe underlying basal detachment to the fold. Photograph f) has been mirrored so that south is uniformly towards the righthand side of all photos. g) Bifurcation and folding of gougehorizon along a fore thrust ramp and basal detachment below the dark-green marker horizon. h) Imbricates marked by gouge horizons folded into a footwall syncline defined by the darkgreen marker horizon. i, j) Imbricates marked by gouge horizons folded into a footwall syncline. New gouge is developed along a ‘short-cut’ fault that forms a new basal detachment alongthe base of the imbricates. The chequered rule (10 cm long) and 15mm diameter coin act as scales. (For interpretation of the references to colour in this figure legend, the reader isreferred to the Web version of this article.)
G.I. Alsop et al. Journal of Structural Geology 109 (2018) 99–119
113

p.916) measured steep gradients in along-strike shortening that is morethan an order of magnitude greater than is expected using Elliot (1976)‘bow and arrow’ rule of 10% variation for shallow thrust system in li-thified rocks. Seismic studies of a 350 km long and 70 km wide offshore
deepwater fold and thrust belt by Totake et al. (2017), who measuredthrust heave, thereby avoiding uncertain depth conversion on seismic,found “high heave gradients of the master thrusts” that is consistentwith restricted fault-tip propagation (Totake et al., 2017). It would
Fig. 9. Photographs (a, c, e, g, i) and asso-ciated displacement-distance plots (b, d, f, h,j) across thrusts in the Zin case study.Photograph c) has been mirrored so thatsouth is uniformly towards the right-handside on all photographs. Displaced markerhorizons are highlighted on photographs bycoloured squares (footwall) and circles(hangingwall), with displacement dying outat the fault tip (light green circle). Equivalenthorizons on displacement-distance plots areshown by matching coloured circles, whilered circles correspond to intervening dis-placed beds. Measurements of distance fromthe fault tip and displacement of the yellowmarkers are illustrated on a). A 10 cm thickdetrital-rich competent horizon is highlightedby a yellow marker in each case (as alsoshown in Fig. 3c). Note that fore thrustnumbering (FT2, FT6, FT8) is used to denoteorder of ramp development as shown inFig. 3b and c. In g, h), displacement-distanceacross a smaller thrust (FTa) that displayspronounced displacement gradients towardsthe fault tips is also shown. (For interpreta-tion of the references to colour in this figurelegend, the reader is referred to the Webversion of this article.)
G.I. Alsop et al. Journal of Structural Geology 109 (2018) 99–119
114

Fig. 10. Summary cartoon highlighting some of the main features developed during an overstep thrust sequence that continues to undergo synchronous thrusting. Thrusts (T) arenumbered according to the order of development (T1, T2 etc.) while the directions of thrust transport (large red arrow) and overall thrust propagation (blue arrow) are also shown. Referto text for further details. (For interpretation of the references to colour in this figure legend, the reader is referred to the Web version of this article.)
Fig. 11. Summary cartoons illustrating the four possible end-member scenarios of forethrust (T) and backthrust (BT) interaction. The thrusts are numbered according to their relativetiming (T1, BT2 etc.) where the resulting structural geometries depend on relative timing and position of each thrust. Directions of thrust transport (large red arrows) and overall thrustpropagation (blue arrows) down (a, b) or up (c, d) the regional slope are also shown. (For interpretation of the references to colour in this figure legend, the reader is referred to the Webversion of this article.)
G.I. Alsop et al. Journal of Structural Geology 109 (2018) 99–119
115

appear therefore that pronounced displacement-distance gradients arenot restricted to m-scale structures within fold and thrust systems of ourstudy, but also ocurred along km-scale thrusts cutting weakly lithifiedsediments and are therefore scale independent.
Models of thrust ramp propagation by linking of smaller thrustsegments have been suggested where thrusts cut turbidite sequences inthe Alps of SE France (Butler and McCaffrey, 2004, p.920). Slip alongthe thrust ramp may ‘leak’ into adjacent parts of the multilayer to createa series of smaller displacement thrusts (Butler and McCaffrey, 2004,p.920). This proposed behaviour is similar to smaller thrusts seen ad-jacent to larger ramps in the Zin case study. The displacement profilesvary where the thrusts cut detrital marker layers or pre-existing thrustsin the footwall (Fig. 9g–j), suggesting that competency contrast influ-enced fault propagation and geometries (e.g. Teixell and Koyi, 2003:Ferrill et al., 2016). In summary, this first use of D-D plots to analyseoverstep thrust sequences cutting unlithified sediments demonstratesthat displacement patterns along thrusts are varied and may initiate inthe hangingwall above the basal detachment (e.g. Fig. 7d).
9.5.2. Displacement on basal detachmentsBasal detachments to MTDs within the Lisan Formation are gen-
erally developed beneath detrital units at∼1m depth, suggesting that amechanical control is significant (e.g. Alsop et al., 2017a, b). Foldgeometry (e.g. Fig. 8g) with ‘cusps’ of aragonite pointing into thisdetrital layer indicates that it is more competent, as do studies ofbuckled detrital layers elsewhere in the Lisan Formation (e.g. Alsopet al., 2017a, b). The mechanical heterogeneity displayed by the darkgreen marker layer within the present study, coupled with potentialincreases in pore pressure if the detrital unit acted as a ‘seal’ to theunderlying aragonite, may have contributed to it being an efficientdetachment. Imbricates cutting the dark green layer may have locallybroken the ‘seal’ and reduced fluid pressure thereby facilitating re-duction of movement along that particular ramp and encouraging anew ramp to form further upslope. The current high fluid content(∼25%) in the Lisan Formation (Arkin and Michaeli, 1986; Frydmanet al., 2008) suggests that it would have been saturated at the time ofdeformation in the subaqueous basin setting (Alsop et al., 2017a,b,c),explaining some of the clastic dykes that cut the entire area, andsmaller-scale fingers of injected sediment directly above the detach-ment (e.g. Fig. 7j).
Similar stratigraphic controls on basal detachments have been de-scribed from outcrops of gravity-driven fold and thrusts belts elsewhere,and also from offshore seismic data across large-scale MTDs (Frey-Martinez et al., 2006). Clay-rich units have been considered to controlbasal detachments within outcrops of MTDs in California (Garcia-Tortosa et al., 2011), while basal detachments interpreted from seismicdata across larger offshore gravity-driven fold and thrust belts arethought to form along specific contourite deposits (Frey-Martinez et al.,2006). Extreme weakness along basal detachments is often linked tohigh pore fluid pressures, as proven by drilling programmes (e.g. Mooreet al., 2005), with estimates of high pore fluid pressure ratios> 0.9(Bilotti and Shaw, 2005; Morley, 2007; Morley et al., 2017, p.218). Insummary, we speculate that detrital-rich units overlying basal detach-ments in the Lisan Formation may have acted as a ‘top seal’ or baffle tofluid movement, and thereby generated fluid overpressure directly be-neath it along which the basal detachment then formed. Gouge devel-oped along the basal detachment is locally injected upwards to create‘fingers’ of gouge that cut the dark green detrital marker, and attests tohigh fluid pressures (e.g. Fig. 7j). Earthquakes along the Dead Sea faultsystem may have further increased overpressure leading to slope failureand seismites within the Lisan Formation (Lu et al., 2017). Local var-iation in fluid overpressure along the basal detachment may also ulti-mately lead to variations in displacement along the detachment andconsequent second order flow cells (Alsop and Marco, 2014).
9.6. Which models best constrain the geometry and kinematics of MTDs?
9.6.1. Frontally confined versus frontally emergent models within MTDsFrey-Martinez et al. (2006) originally divided MTDs into two broad
groups that they termed frontally-confined and frontally emergent de-pending on the geometry of the downslope toe. Where MTDs haveoverrun and ‘spilled’ on top of the undeformed downslope strata toform a frontally emergent toe, the gravity-driven fold and thrust systemresults in thickening and consequent surface topography (Frey-Martinezet al., 2006). However, where MTDs fail to overrun the undeformeddownslope strata and do not create significant topographic relief theyare termed frontally confined (Frey-Martinez et al., 2006). This dis-tinction is important as the upper thrust tips within frontally confinedMTDs are broadly at the same level, and simply define a ‘tabular bodywhich is pervasively deformed by a set of closely and regularly spacedthrusts” (Frey-Martinez et al., 2006, p.591). When describing frontallyconfined systems, Frey-Martinez et al. (2006, p.602) note that “con-tinued slip is accommodated downslope by additional contractionalstraining within the toe region” Although no mention is made of thrustsequences (overstep or break back etc.) they do highlight “impressivefrontal thrust and fold belts”.
Fold- and thrust-dominated MTDs within the Lisan Formation arenot generally observed to overrun downslope strata, and are nottherefore frontally-emergent systems as discussed by Alsop et al. (2016,p.85). Where the terminations of MTD toes are observed in the LisanFormation, they pass downslope into upright folds that fail to overridedownslope strata and are therefore best described as open-ended toesthat are a variant of frontally-confined MTDs (see discussion in Alsopet al., 2016 p. 85). Although the downslope leading edge of the MTD inthe present study is not exposed, it is likely that frontally confinedMTDs, where the undeformed downslope strata act as a buttress tocontinued downslope movement at the toe may encourage overstepthrust sequences, as a compressive strain wave propagates back upslope following cessation of movement at the toe (Farrell, 1984).
9.6.2. Critical taper models versus dislocation models within MTDsOrogenic wedges and their associated thick-skinned thrust belts are
essentially modelled in terms of material being driven or pushed up agentle detachment by compressive forces acting on a buttress frombehind during collisional tectonics (the ‘critical taper’ model of Daviset al., 1983; Dahlen, 1990; Koyi, 1995). Conversely, MTDs are inter-preted in terms of downslope-directed gravitational slope failure thatinduces upslope extension and downslope contraction resulting in thin-skinned fold and thrust systems (the dislocation model of Farrell, 1984).If any ‘buttress’ exists, it is considered to be the undeformed strata infront of the translating MTD (section 9.6.1.). While these two scenariosare clearly distinct, the downslope contractional portions of MTDscould be considered in terms of critical taper mechanics.
Within the critical taper model, extension is generally considered aconsequence of a thickened wedge attempting to restore stability byreducing its thickness and taper angle. Conversely, within the disloca-tion model of Farrell (1984), contraction at the downslope toe isbroadly balanced by extension at the upslope head, so that extension isconsidered a consequence of accelerating flow during translation of theslump (Alsop and Marco, 2014). If secondary flow cells develop atsmaller scales, then simultaneous movement of individual flow cellsmay result in a range of overprinting relationships incorporating con-traction and extension within the toe region (see Alsop and Marco,2014).
Previous analysis of critical tapers calculated from wedge thick-nesses over distances of ∼500m indicates negligible taper angles ofbetween 0.19° and 0.38° for MTDs elsewhere in the Lisan Formation(Alsop et al., 2017a). These values are an order of magnitude less thantaper angles from large-scale accretionary wedges that have calculatedangles of 4.7° (e.g. Yang et al. in press). The lack of significant taperangles within MTDs of the Lisan Formation was attributed to very weak
G.I. Alsop et al. Journal of Structural Geology 109 (2018) 99–119
116
sediments that form the fold and thrust system, together with low-friction basal detachments that follow weak bedding planes, and higherdensity brines that overlie the failed sediment mass (Alsop et al.,2017a). Although thrusts duplicate stratigraphy, the MTD's of the LisanFormation lack evidence of a build-up of topography or erosion duringthrusting, although truncation may occur immediately afterwardsduring deposition of the sedimentary ‘cap’. Given the rapidity of slopefailure, very little time exists for adjustments to wedge morphologybefore deposition of this cap that may have lasted just hours or days(Alsop et al., 2016). Within the case study, upper thrust tips terminateat the same level, while the basal detachment maintains its positiondirectly beneath the dark green detrital layer. Consequently, no evi-dence exists for thickening and surface uplift, or of the basal detach-ment cutting deeper in a process of ‘underplating’ to actually create awedge or critical taper. Our study therefore supports the findings ofFrey-Martinez (2006, p.591) who noted that frontally-confined MTDs“do not define a critical wedge”. The critical taper model may nottherefore be the most suitable model in this case, although factors thatinfluence the stability and geometry of a series of thrust imbricates,such as the thickness of the deformed sequence, friction along the basaldetachment and ‘strength’ of the sediments may all clearly influence theresulting geometry.
9.6.3. Models and controls on thrust spacing within MTDsWithin the present study, the thickness of the deformed sequence is
0.8 m and the average thrust spacing along the disused track is 4.66m(Fig. 3). These values yield a thickness to thrust spacing ratio (see Liuand Dixon, 1995) of 1:5.8 that is broadly similar to the 1:5 ratio cal-culated for thrusts elsewhere in the Lisan Formation (Alsop et al.,2017a,b,c), and also from seismic analysis of larger-scale offshoregravity-driven fold and thrust belts (e.g. Butler and Paton, 2010; Morleyet al., 2017, p.180). Morley et al. (2017 p.175) indicated that the thrustthickness to ramp spacing ratio in major orogenic thrust belts rangesbetween 1:1 and 1:5, with thrust spacing increasing with thrust sheetthickness. The slightly higher ratio in the case study (1:5.8) may reflecta weaker basal detachment relative to the strength of the sedimentpotentially created by trapped pore fluids beneath the green detritalmarker (see also Mulugeta, 1988; Morley et al., 2017, p.176).
Physical modelling indicates that a decrease in friction along thebasal detachment also increases the number of backthrusts, with theinitial ramp angle of backthrusts (35°–40°) and forethrusts (25°–30°)appearing to be unaffected by the basal friction (Liu et al., 1992). Theseangles, together with the number of backthrusts in the present studysupport the interpretation of a weak basal detachment. In addition,analogue modelling by Deng et al. (2017) suggests that greater dis-placement velocities along basal detachments also result in increasedfault spacing and a greater number of backthrusts. Rates of displace-ment may be important given that slope failures and resulting fold andthrust systems within the Lisan Formation are considered to formwithin a matter of hours or days before deposition of the overlyingsedimentary cap out of suspension (Alsop et al., 2016). It would appearthat within the case study, thrust spacing, together with forethrust andbackthrust geometries are broadly consistent with both analoguemodels and analysis of larger scale fold and thrust systems developed inaccretionary complexes and orogenic belts.
In summary, the critical taper model may be most applicable tofrontally emergent MTDs that overrun the downslope area and createnew topography, whereas it is less suitable for frontally confined MTDs.In this case, the MTD cannot be defined as a critical taper as the basaldetachment remains at the same horizon, while thrusts do not propa-gate to higher levels meaning that the top of the MTD lacks topographyand remains at the same level, with no wedge or taper actually created(Frey-Martinez et al., 2006 p.591). Studies of MTDs within the LisanFormation, including the present case study, are interpreted in terms offrontally confined or open-ended MTDs and are best interpreted interms of dislocation models where contraction and extension are linked
to variable displacement along the underlying basal detachment.However, aspects of the critical taper model, including the relationshipbetween thrust spacing and thickness of the deformed sequence, seemto have similar ratios to those recorded elsewhere in orogenic belts andaccretionary complexes. Friction along the basal detachment maycontrol overall geometries and development of back thrusts, while theposition of the initial toe thrust may be influenced by early bucklefolding or detrital facies variation (see discussion in Alsop et al., 2016).
10. Conclusions
In summary, our study forms the first detailed analysis of overstepthrust sequences developed in a gravity-driven fold and thrust belt, andprovides a range of criteria to distinguish different thrust sequences.Cross-cutting relationships whereby folds and thrusts are truncated byoverlying thrusts are the most straightforward principle to determineoverstep thrust sequences. In addition, loading and deflection of un-derlying thrusts by overthrust sheets, and structural inheritance relatingto the position of the underlying thrust ramp, may control the geometryof the overlying and younger thrust sheet within overstep thrust se-quences. We identify, four possible scenarios for the interaction offorethrusts and backthrusts in piggyback and overstep thrust sequences.Overstep thrust sequences are marked by backthrusts being truncatedand displaced by overlying forethrusts, while older forethrusts may becarried and rotated in the hangingwall of younger backthrusts.
Within MTDs, overstep thrust sequences get younger in a directionopposite to the overall downslope thrust vergence, and are traditionallythought to develop at a ‘late stage’ due to cessation of movement at thedownslope toe. In the present case study, the overstep thrust sequencedoes not overprint any earlier structures, and is therefore considered toform because of a deceleration of flow during actual translation of theMTD. Synchronous thrusting within this overstep sequence is supportedby: a) systematic increases in displacement across older imbricates inthe thrust system, whereby older thrusts continue to move and there-fore accumulate the greatest displacement; b) bridging ‘short-cut’ faultsthat develop below folded detachments; and c) backthrusts truncatedby forethrusts that become immediately inactive and therefore displayless displacement during synchronous thrusting. In detail, displace-ment-distance plots show that displacement may increase up the thrustramp, suggesting that thrusts initiated in the hangingwall of the basaldetachment during overstep thrusting. Displacement patterns are inaddition influenced by a) the position of detrital marker horizons, b) thelocation of older (and truncated) thrusts in the footwall.
Frontally confined MTDs may display overstep thrust sequencesdeveloped from a basal detachment that maintains the same strati-graphic horizon. Thrusts terminate at the same upper level meaningthat the MTD lacks topography and does not define a critical taper.Thrust sheet thickness to ramp spacing ratios are however similar tothose recorded in accretionary complexes and orogenic belts, andfrontally confined MTDs may therefore be better interpreted usingmodels of dislocation and thrust ramp spacing along the basal detach-ment. Although the detailed relationships observed in this study areclearly below the limits of seismic resolution, they do provide a tem-plate for the types and styles of structural interaction that may begenerated within MTDs. The overall displacement paths formed acrossimbricates during synchronous thrusting may be resolvable in seismicsections, and therefore represents a viable test of synchronous thrustingwithin large-scale MTDs.
Acknowledgements
RW was supported by the Israel Science Foundation (ISF grant No.868/17). SM acknowledges the Israel Science Foundation (ISF grant No.1436/14) and the Ministry of National Infrastructures, Energy andWater Resources (grant # 214-17-027). We would like to thank ChrisMorley and an anonymous referee for careful and constructive reviews,
G.I. Alsop et al. Journal of Structural Geology 109 (2018) 99–119
117

together with Bill Dunne, for efficient editorial handling of the manu-script.
References
Agnon, A., Migowski, C., Marco, S., 2006. Intraclast breccia layers in laminated se-quences: recorders of paleo-earthquakes, in Enzel, Y., Agnon, A., and Stein, M., eds.,New Frontiers in Dead Sea Paleoenvironmental Research, Geological Society ofAmerica Special Publication, p. 195–214.
Alsop, G.I., Marco, S., 2011. Soft-sediment deformation within seismogenic slumps of theDead Sea Basin. J. Struct. Geol. 33, 433–457.
Alsop, G.I., Marco, S., 2012a. A large-scale radial pattern of seismogenic slumping to-wards the Dead Sea Basin. J. Geol. Soc. 169, 99–110.
Alsop, G.I., Marco, S., 2012b. Tsunami and seiche-triggered deformation within offshoresediments. Sediment. Geol. 261, 90–107.
Alsop, G.I., Marco, S., 2013. Seismogenic slump folds formed by gravity-driven tectonicsdown a negligible subaqueous slope. Tectonophysics 605, 48–69.
Alsop, G.I., Marco, S., 2014. Fold and fabric relationships in temporally and spatiallyevolving slump systems: a multi-cell flow model. J. Struct. Geol. 63, 27–49.
Alsop, G.I., Marco, S., Weinberger, R., Levi, T., 2016. Sedimentary and structural controlson seismogenic slumping within mass transport deposits from the Dead Sea Basin.Sediment. Geol. 344, 71–90.
Alsop, G.I., Marco, S., Levi, T., Weinberger, R., 2017a. Fold and thrust systems in masstransport deposits. J. Struct. Geol. 94, 98–115.
Alsop, G.I., Marco, S., Weinberger, R., Levi, T., 2017b. Upslope-verging back thrustsdeveloped during downslope-directed slumping of mass transport deposits. J. Struct.Geol. 100, 45–61.
Alsop, G.I., Weinberger, R., Marco, S., Levi, T., 2017c. Identifying soft-sediment de-formation in rocks. J. Struct. Geol. http://dx.doi.org/10.1016/j.jsg.2017.09.001.
Arkin, Y., Michaeli, L., 1986. The significance of shear strength in the deformation oflaminated sediments in the Dead Sea area. Isr. J. Earth Sci. 35, 61–72.
Bartov, Y., Steinitz, G., Eyal, M., Eyal, Y., 1980. Sinistral movement along the Gulf ofAqaba - its age and relation to the opening of the red Sea. Nature 285, 220–221.
Basilone, L., 2017. Seismogenic rotational slumps and translational glides in pelagic deep-water carbonates. Upper Tithonian-Berriasian of Southern Tethyan margin (W Sicily,Italy). Sediment. Geol. 356, 1–14.
Begin, Z.B., Ehrlich, A., Nathan, Y., 1974, Lake Lisan, the Pleistocene precursor of theDead Sea: Geological survey of Israel Bulletin, 63, p. 30.
Bilotti, F., Shaw, J.H., 2005. Deep-water Niger Delta fold and thrust belt modeled as acritical taper wedge: the influence of elevated basal fluid pressure on structural styles.AAPG (Am. Assoc. Pet. Geol.) Bull. 89, 1475–1491.
Boyer, S.E. 1992. Geometric evidence for synchronous thrusting in the southern Albertaand northwest Montana thrust belts. In: McClay, K. (Editor), Thrust Tectonics.Chapman and Hall. London. p. 377–390.
Boyer, S.E., Elliot, D., 1982. Thrust systems. AAPG (Am. Assoc. Pet. Geol.) Bull. 66,1196–1230.
Bull, S., Cartwright, J., Huuse, M., 2009. A review of kinematic indicators from mass-transport complexes using 3D seismic data. Mar. Petrol. Geol. 26, 1132–1151.
Butler, R.W.H., 1982. The terminology of structures in thrust belts. J. Struct. Geol. 4,239–245.
Butler, R.W.H., 1987. Thrust sequences. J. Geol. Soc. Lond. 144, 619–634.Butler, R.W.H., 2004. The nature of ‘roof thrusts’ in the Moine Thrust Belt, NW Scotland:
implications for the structural evolution of thrust belts. J. Geol. Soc. Lond. 161, 1–11.Butler, R.W.H., Coward, M.P., 1984. Geological constraints, structural evolution and deep
geology of the Northwest Scottish Caledonides. Tectonics 3, 347–365.Butler, R.W.H., McCaffrey, W.D., 2004. Nature of thrust zones in deep water sand-shale
sequences: outcrop examples from the Champsaur sandstones of SE France. Mar.Petrol. Geol. 21, 911–921.
Butler, R.W.H., Paton, D.A., 2010. Evaluating lateral compaction in deepwater fold andthrust belts: How much are we missing from “nature's sandbox”? GSA Today (Geol.Soc. Am.) 20, 4–10. http://dx.doi.org/10.1130/GSATG77A.1.
Chapman, T.J., Williams, G.D., 1984. Displacement-distance methods in the analysis offold-thrust structures and linked-fault systems. J. Geol. Soc. 141, 121–128.
Cooper, M.A. 1981. The internal geometry of nappes: criteria for models of emplacement.In: McClay K.R., Price N.J. (eds.) Thrust and Nappe Tectonics. Special Publication ofthe Geological Society of London vol. 9, 225–234.
Coward, M.P., 1985. The thrust structures of southern Assynt, Moine thrust zone. Geol.Mag. 122, 595–607.
Cruciani, F., Barchi, M.R., Koyi, H.A., Porreca, M., 2017. Kinematic evolution of a re-gional-scale gravity-driven deepwater fold-and-thrust belt: the Lamu Basin case-his-tory (East Africa). Tectonophysics 712–713, 30–44.
Dahlen, F.A., 1990. Critical taper model of fold- and thrust- belts and accretionarywedges. Annu. Rev. Earth Planet Sci. 18, 55–99.
Davis, D., Suppe, J., Dahlen, F.A., 1983. Mechanics of fold-and-thrust belts and accre-tionary wedges. J. Geophys. Res. 88 (B2), 1153–1172.
Dahlstrom, C.D.A., 1970. Structural geology in the eastern margin of the Canadian RockyMountains. Bull. Can. Petrol. Geol. 18, 332–406.
Deng, B., Jiang, L., Zhao, G., Huang, R., Wang, Y., Liu, S., 2017. Insights into the velocity-dependent geometry and internal strain in accretionary wedges from analoguemodels. Geol. Mag. http://dx.doi.org/10.1017/S0016756816001266.
de Vera, J., Granado, P., McClay, K., 2010. Structural evolution of the Orange Basingravity-driven system, offshore Namibia. Mar. Petrol. Geol. 27, 223–237.
El-Isa, Z.H., Mustafa, H., 1986. Earthquake deformations in the Lisan deposits and seis-motectonic implications. Geophys. J. Roy. Astron. Soc. 86, 413–424.
Elliot, D., 1976. The energy balance and deformation mechanisms of thrust sheets. Philos.Trans. R. Soc. London, Ser. A 283, 289–312.
Elliot, D., Johnson, M.R.W., 1980. Structural evolution in the northern part of the moinethrust belt of NW scotland. Transactions of the Royal society of Edinburgh. Earth Sci.71B, 69–96.
Ellis, M.A., Dunlap, W.J., 1988. Displacement variation along thrust faults: implicationsfor the development of large faults. J. Struct. Geol. 10, 183–192.
Farrell, S.G., 1984. A dislocation model applied to slump structures, Ainsa Basin, SouthCentral Pyrenees. J. Struct. Geol. 6, 727–736.
Ferrill, D.A., Morris, A.P., Wigginton, S.S., Smart, K.J., McGinnis, R.N., Lehrmann, D.,2016. Deciphering thrust fault nucleation and propagation and the importance offootwall synclines. J. Struct. Geol. 85, 1–11.
Fossen, H. 2016. Structural Geology. second ed.. Cambridge University Press, Cambridge,UK, p.510.
Frey-Martinez, J., Cartwright, J., Hall, B., 2005. 3D seismic interpretation of slumpcomplexes: examples from the continental margin of Israel. Basin Res. 17, 83–108.
Frey-Martinez, J., Cartwright, J., James, D., 2006. Frontally confined versus frontallyemergent submarine landslides: a 3D seismic characterisation. Mar. Petrol. Geol. 23,585–604.
Frydman, S., Charrach, J., Goretsky, I., 2008. Geotechnical properties of evaporite soils ofthe Dead Sea area. Eng. Geol. 101, 236–244.
Garcia-Tortosa, F.J., Alfaro, P., Gibert, L., Scott, G., 2011. Seismically induced slump onan extremely gentle slope (< 1°) of the Pleistocene Tecopa paleolake (California).Geology 39, 1055–1058.
Garfunkel, Z., 1981. Internal structure of the Dead Sea leaky transform (rift) in relation toplate kinematics. Tectonophysics 80, 81–108.
Garfunkel, Z., Ben-Avraham, Z., 1996. The structure of the Dead Sea basin.Tectonophysics 26, 155–176.
Gibert, L., Sanz de Galdeano, C., Alfaro, P., Scott, G., Lopez Garrido, A.C., 2005. Seismic-induced slump in early Pleistocene deltaic deposits of the Baza basin (SE Spain).Sediment. Geol. 179, 279–294.
Haase-Schramm, A., Goldstein, S.L., Stein, M., 2004. U-Th dating of Lake Lisan aragonite(late Pleistocene Dead Sea) and implications for glacial East Mediterranean climatechange. Geochem. Cosmochim. Acta 68, 985–1005.
Haliva-Cohen, A., Stein, M., Goldstein, S.L., Sandler, A., Starinsky, A., 2012. Sources andtransport routes of fine detritus material to the late quaternary Dead Sea Basin. Quat.Sci. Rev. 50, 55–70.
Hedlund, C.A., 1997. Fault-propagation, ductile strain, and displacement-distance re-lationships. J. Struct. Geol. 19, 249–256.
Ireland, M.T., Davies, R.J., Goulty, N.R., Moy, D.J., 2011. Thick slides dominated byregular-wavelength folds and thrusts in biosiliceous sediments on the Vema Domeoffshore of Norway. Mar. Geol. 289, 34–45.
Jolly, B.A., Lonergan, L., Whittaker, A.C., 2016. Growth history of fault-related folds andinteraction with seabed channels in the toe-thrust region of the deep-water Nigerdelta. Mar. Petrol. Geol. 70, 58–76.
Kim, Y.S., Sanderson, D.J., 2005. The relationship between displacement and length offaults. Earth Sci. Rev. 68, 317–334.
Korneva, I., Tondi, E., Jablonska, D., Di Celma, C., Alsop, I., Agosta, F., 2016.Distinguishing tectonically- and gravity-driven synsedimentary deformation struc-tures along the Apulian platform margin (Gargano Promontory, southern Italy). Mar.Petrol. Geol. 73, 479–491.
Koyi, H., 1995. Mode of internal deformation in sand wedges. J. Struct. Geol. 17,293–300.
Liu, H. McClay, K.R., Powell, D. 1992. Physical models of thrust wedges. In: McClay, K.R.(Editor) Thrust Tectonics. Chapman and Hall, London. P. 71–81.
Liu, S., Dixon, J.M., 1995. Localization of duplex thrust-ramps by buckling: analog andnumerical modelling. J. Struct. Geol. 17, 875–886.
Lu, Y., Waldmann, N., Alsop, G.I., Marco, S., 2017. Interpreting soft sediment deformationand mass transport deposits as seismites in the Dead Sea depocentre. J. Geophys.Res.: Solid Earth 122 (10), 8305–8325. http://dx.doi.org/10.1002/2017JB014342.
Lucente, C.C., Pini, G.A., 2003. Anatomy and emplacement mechanism of a large sub-marine slide within a Miocene foredeep in the northern Appenines, Italy: a fieldperspective. Am. J. Sci. 303, 565–602.
Marco, S., Agnon, A., 1995. Prehistoric earthquake deformations near Masada, Dead Seagraben. Geology 23, 695–698.
Marco, S., Kagan, E.J. 2014. Deformed sediments in the Dead Sea drill core: a long termpalaeoseismic record. EGU General Assembly Conference Abstracts, vol. 16, 4375.(Vienna).
Marco, S., Stein, M., Agnon, A., Ron, H., 1996. Long term earthquake clustering: a 50,000year paleoseismic record in the Dead Sea Graben. J. Geophys. Res. 101, 6179–6192.
Martinsen, O.J., Bakken, B., 1990. Extensional and compressional zones in slumps andslides in the namurian of county Claire, Eire. J. Geol. Soc. Lond. 147, 153–164.
McClay, K.R., 1992. Glossary of thrust tectonic terms. In: McClay, K.R. (Editor) ThrustTectonics. Chapman and Hall, London. P. 419–433.
Moore, G.F., Mikada, H., Moore, C.J., Becker, K., Taira, A. 2005. 1. Legs 190 and 196synthesis: deformation and fluid flow processes in the Nankai Trough accretionaryprism. In: Mikada H., Moore G.F., Taira A., Becker K., Moore J.C., Klaus, A. (Eds.),Proc. ODP Scientific Results 190/196. pp.1-26.
Morley, C.K., 1988. Out-of-sequence thrusts. Tectonics 7, 539–561.Morley, C.K., 2007. Interaction between critical wedge geometry and sediment supply in
a deepwater fold belt, NW Borneo. Geology 35, 139–142.Morley, C.K., King, R., Hillis, R., Tingay, M., Backe, G., 2011. Deepwater fold and thrust
belt classification, tectonics, structure and hydrocarbon prospectivity: a review. EarthSci. Rev. 104, 41–91.
Morley, C.K., von Hagke, C., Hansberry, R.L., Collins, A.S., Kanitpanyacharoen, W., King,R., 2017. Review of major shale-dominated detachment and thrust characteristics in
G.I. Alsop et al. Journal of Structural Geology 109 (2018) 99–119
118
the diagenetic zone: Part I, meso- and macro-scopic scale. Earth Sci. Rev. 173,168–228.
Mulugeta, G., 1988. Modelling the geometry of Coulomb thrust wedges. J. Struct. Geol.10, 847–859.
Muraoka, H., Kamata, H., 1983. Displacement distribution along minor fault traces. J.Struct. Geol. 5, 483–495.
Nuriel, P., Weinberger, R., Kylander-Clark, A.R.C., Hacker, B.R., Cradock, J.P., 2017. Theonset of the Dead Sea transform based on calcite age-strain analyses. Geology 45,587–590.
Ortner, H., Kilian, S., 2016. Sediment creep on slopes in pelagic limestones: upperJurassic of northern Calcareous Alps, Austria. Sediment. Geol. 344, 350–363.
Park, R.G. 2013. Foundations of Structural Geology. Routledge, Oxford, UK. pp. 214.ISBN-1136784357.
Peacock, D.C.P., Sanderson, D.J., 1996. Effects of propagation rate on displacementvariations along faults. J. Struct. Geol. 18, 311–320.
Peel, F.J., 2014. The engines of gravity-driven movement on passive margins: quantifyingthe relative contribution of spreading vs. gravity sliding mechanisms. Tectonophysics633, 126–142.
Prasad, S., Negendank, J.F.W., Stein, M., 2009. Varve counting reveals high resolutionradiocarbon reservoir age variations in palaeolake Lisan. J. Quat. Sci. 24, 690–696.
Reis, A.T., Araújo, E., Silva, C.G., Cruz, A.M., Gorini, C., Droz, L., Migeon, S., Perovano,R., King, I., Bache, F., 2016. Effects of a regional décollement level for gravity tec-tonics on late Neogene to recent large-scale slope instabilities in the Foz do AmazonasBasin, Brazil. Mar. Petrol. Geol. 75, 29–52.
Scarselli, N., McClay, K., Elders, C., 2016. Seismic geomorphology of Cretaceous mega-slides offshore Namibia (Orange Basin): insights into segmentation and degradationof gravity-driven linked systems. Mar. Petrol. Geol. 75, 151–180.
Sharman, G.R., Graham, S.A., Masalimova, L.U., Shumaker, L.E., King, P.R., 2015. Spatialpatterns of deformation and palaeoslope estimation within the marginal and centralportions of a basin-floor mass-transport deposit, Taranaki Basin, New Zealand.Geosphere 11, 266–306.
Smit, J., Brun, J.-P., Fort, X., Cloetingh, S., Ben-Avraham, Z., 2008. Salt tectonics in pull-apart basins with application to the Dead Sea Basin. Tectonophysics 449, 1–16.
Sneh, A., Weinberger, R. 2014. Major Structures of Israel and Environs, Scale 1:50,000.Israel Geological Survey, Jerusalem.
Sobiesiak, M., Alsop, G.I., Kneller, B.C., Milana, J.P., 2017. Sub-seismic scale folding andthrusting within an exposed mass transport deposit: a case study from NW Argentina.J. Struct. Geol. 96, 176–191.
Strachan, L.J., 2002. Slump-initiated and controlled syndepositional sandstone re-mobilization; an example from the Namurian of County Clare, Ireland.Sedimentology 49, 25–41.
Strachan, L.J., 2008. Flow transformations in slumps: a case study from the WaitemataBasin, New Zealand. Sedimentology 55, 1311–1332.
Strachan, L.J., Alsop, G.I., 2006. Slump folds as estimators of palaeoslope: a case studyfrom the Fisherstreet Slump of County Clare, Ireland. Basin Res. 18, 451–470.
Teixell, A., Koyi, H.A., 2003. Experimental and field study of the effects of lithologicalcontrasts on thrust-related deformation. Tectonics 22, 1054. http://dx.doi.org/10.1029/2002TC001407.
Totake, Y., Butler, R.W.H., Bond, C.E., Aziz, A., 2017. Analyzing structural variationsalong strike in a deep-water thrust belt. J. Struct. Geol. http://dx.doi.org/10.1016/j.jsg 2017.06.007.
Weinberger, R., Levi, T., Alsop, G.I., Eyal, Y., 2016. Coseismic horizontal slip revealed bysheared clastic dikes in the Dead Sea basin. Geol. Soc. Am. Bull. 128, 1193–1206.
Weinberger, R., Levi, T., Alsop, G.I., Marco, S., 2017. Kinematics of mass transport de-posits revealed by magnetic fabrics. Geophys. Res. Lett. 44, 7743–7749.
Williams, G., Chapman, T., 1983. Strains developed in the hangingwall of thrusts due totheir slip/propagation rate: a dislocation model. J. Struct. Geol. 5, 563–571.
Woodcock, N.H., 1976a. Ludlow series slumps and turbidites and the form of theMontgomery trough, Powys, Wales. Proc. Geol. Assoc. 87, 169–182.
Woodcock, N.H., 1976b. Structural style in slump sheets: Ludlow series, Powys, Wales. J.Geol. Soc. Lond. 132, 399–415.
Woodcock, N.H., 1979. The use of slump structures as palaeoslope orientation estimators.Sedimentology 26, 83–99.
Yang, C.M., Dong, J.J., Hsieh, Y.L., Liu, H.H., Cheng, L.L., 2018. Non-linear critical tapermodel and determination of accretionary wedge strength. Tectonophysics. http://dx.doi.org/10.1016/j.tecto.2016.04.026. (in press).
G.I. Alsop et al. Journal of Structural Geology 109 (2018) 99–119
119