journal of wind engineering & industrial...
TRANSCRIPT

Journal of Wind Engineering & Industrial Aerodynamics 172 (2018) 379–394
Contents lists available at ScienceDirect
Journal of Wind Engineering & Industrial Aerodynamics
journal homepage: www.elsevier .com/locate/ jweia
An experimental investigation on the aeromechanics and wake interferencesof wind turbines sited over complex terrain
Wei Tian a,b, Ahmet Ozbay b, Hui Hu b,*
a School of Aeronautics and Astronautics, Shanghai Jiao Tong University, Shanghai 200240, Chinab Department of Aerospace Engineering, Iowa State University, Ames, IA 50010, USA
A R T I C L E I N F O
Keywords:Wind turbineComplex terrainWake interferencesAtmospheric boundary layer windWind tunnel experiment
* Corresponding author.E-mail address: [email protected] (H. Hu).
https://doi.org/10.1016/j.jweia.2017.11.018Received 13 June 2016; Received in revised form 18 Nov
0167-6105/© 2017 Elsevier Ltd. All rights reserved.
A B S T R A C T
An experimental study was conducted to investigate the aeromechanics and wake interferences of wind turbinessited on two-dimensional hills with different slopes. First, detailed flow field measurements were correlated withdynamic wind load measurements to reveal the effect of topography on the performance of an individual windturbine sited at different locations on hilly terrains. Compared to a flat surface, wind turbines sited on a hilltop notonly generate more power due to the speed-up effect but also experience reduced fatigue loads due to thedecreased level of the turbulence on a hilltop. It was also found that a wind turbine located downstream of a steephill has a greater likelihood of experiencing extreme wind loads compared to one on a gentle hill. Second, windturbine wake characteristics and their effects on the dynamic wind loads of downstream wind turbines were alsoassessed. The effect of an upstream turbine wake on the wind turbine sited on a hilltop was found to be much lesssignificant compared to a wind turbine on a flat surface. In addition, while the wake of an upstream turbine sitedon hilltop has a significant influence on the dynamic wind loads of a downstream turbine sited behind a gentlehill, the effect of an upstream turbine wake on a downstream turbine placed behind a steep hill was found to bealmost negligible. The quantitative measurement results of the present study not only provide a database for thevalidation of wake models and numerical simulations but can also be used to optimize the layout of wind turbinessited on complex terrain for higher power yield and better durability.
1. Introduction
Wind energy, as a renewable and clean energy source, has receivedincreased attention in recent years due to its vast potential and avail-ability. With the rapid increase of installed wind energy capacity, theexploitation of additional areas with high wind potential is one of themost important challenges faced by the entire wind energy community.The considerable heights of most rolling hills in complex terrains tend toincrease the mean wind velocities due to the speed-up effects. Numerouswind farms in the planning stages are to be located in complex terrains.However, complex terrains also induce negative influences due to theincreased turbulence level, high wind shear and flow separation.Therefore, in order to utilize the high mean wind speeds to increase thepower production while avoiding the negative influences, the under-standing of detailed surface wind characteristics over complex terrainsand the optimum micro-siting design of wind farms sited in complexterrains are greatly desired.
It is known that complex terrains have a significant influence on the
ember 2017; Accepted 18 November
local wind environment, including wind speed, wind direction, and windturbulence. These parameters are all highly affected by the local topog-raphy, and they usually change significantly over a short distance. Manystudies related to the turbulent flow over complex terrains have beenperformed since the 1970s. Taylor and Gent (1974) and Jackson andHunt (1975) presented analytical solutions to model the turbulent flowover two-dimensional, smooth hills. Their theories were then extendedby many other researchers, including Mason and Sykes (1979), Bradley(1980) and Hunt et al. (1988a, 1988b). Mason and Sykes (1979) devel-oped an analytical solution for three-dimensional topography thatbecome the basis for the models developed byWalmsley et al. (1982) andTaylor et al. (1983). The rapid distortion theory was introduced byBritter et al. (1981) to estimate the change in turbulent properties of theflow over hills. An important feature of flow over hills is the speed-upeffect. The speed-up effect along the upstream slope of the hill ismainly dominated by the pressure gradient along the streamline. Thispressure gradient was found to be highly related to the hill slope, whichhas been demonstrated by several theories (Jackson and Hunt, 1975;
2017

W. Tian et al. Journal of Wind Engineering & Industrial Aerodynamics 172 (2018) 379–394
Hunt et al., 1988a). By applying linear theory to a gentle hill, Jackson andHunt (1975) predicted that the speed-up at the hilltop is approximatelyproportional to the hill slope. Later, Lemelin et al. (1988) proposed asimple empirical model to estimate the wind speed-up based oncomputational and wind tunnel data obtained for various shapes of hills.By utilizing computational fluid dynamic (CFD) with the k� ε turbulencemodel, Paterson and Holmes (1993) established the values of topo-graphic multipliers to estimate the wind speed-up over hills. Miller andDavenport (1998) quantified the effect of topography and compared theobserved speed-ups with those predicted by the Canadian and UK windloading codes. Weng et al. (2000) incorporated the effects of surfaceroughness and non-linearity on the fractional speed-up over hilly ter-rains. Pellegrini and Bodstein (2004) proposed a newanalytically-derived expression to predict the height of the maximumspeed-up for atmospheric boundary layer (ABL) flows over low hills. ACFD trained neural network for computing the speed-up ratio for flowover hills was introduced in the studies of Bitsuamlak et al. (2006, 2007).Finnigan and Belcher (2004) and Harman and Finnigan (2010) developan analytical model for ABL flow over a hill that is covered with avegetation canopy. They indicated that the perturbations to the flowwithin the canopy are driven by the pressure gradient associated with theflow over the hill. In addition, a majority of the CFD studies were per-formed by means of the Reynolds-Averaged Navier-Stokes equations(RANS) and Large Eddy Simulation (LES) (Bowen, 2003; Uchida andOhya, 2003; Bechmann and Sørensen, 2011; Balogh et al., 2012). Inaddition to these theoretical and CFD studies, numerous wind tunnelexperiments and field measurements have been also performed. Britteret al. (1981) measured the stream-wise velocity over a bell-shaped,two-dimensional hill placed in a neutrally stratified boundary layer.The results agree well with the model proposed by Jackson and Hunt(1975). Furthermore, Coppin et al. (1994) investigated the flow fieldover Cooper's Ridge for various atmospheric stability conditions, andfound that the speed-ups over the ridge show significant differencesbetween neutral and non-neutral conditions. Lubitz and White (2007)found that wind speed-up could vary significantly depending on theapproaching wind direction.
In comparison to the flow characteristics on a gentle hill, the behaviorof the mean and turbulent characteristics of the flow on the lee side of asteep hill fundamentally differ due to the flow separation. A number ofexperimental and numerical studies were conducted to better understandthe flow characteristics over steep hills. Ferreira et al. (1991, 1995)studied the turbulent isothermal flow around two-dimensional sinusoidalhills and indicated that the extension of the recirculating region wasstrongly dependent on the hill shapes. Kim et al. (1997) compared thelow Reynolds number model with the k� ε model and found that theformer predicted the flow separation on the lee side of a steep hill muchbetter. Ying and Canuto (1997) numerically studied turbulent flow overtwo-dimensional hills and proposed a second-order closure model whichaccounts for advection, diffusion, production and dissipation processes torepresent the Reynolds stresses distribution over hills. Carpenter andLocke (1999) performed a wind tunnel study of the flow over a variety ofhill geometries and compared mean speeds with the results calculatedusing CFD. Athanassiadou and Castro (2001) investigated neutral flowover a series of sinusoidal hills and compared the results with lineartheory predictions for the flow in the inner region and aloft. Cao andTamura (2006) indicated that the surface roughness increases thespeed-up ratio above the crest. Later, Cao and Tamura (2007) studied theeffects of sudden changes in roughness on the turbulent flow over a steephill, and found that the speed-up ratio depends strongly on the surfaceconditions in the middle layer, with the inviscid but rotational part of theouter layer defined by Hunt et al. (1988a). Røkenes and Krogstad (2009)experimentally demonstrated that even for the hill models with steepslope, the speed-up of the flow on the hilltops still approximately has aproportional relationship with average slope of the hill. These studieshave given insight into the turbulent flow over hills, and the related datahave been embodied in numerous wind loading codes (AIJ, 1996; ASCE,
380
2002, 2005, 2010; AS/NZ1170.2, 2002; CEN, 2004). This foundationenables us to further explore the effects of mean and turbulent flowcharacteristics on the performances of wind turbines placed at differentlocations over a hill.
In addition, the interaction among turbine arrays in a large wind farmis an important aspect that needs to be considered because it reducespower generation and creates higher fatigue loads for the wind turbinesexperiencing wake flow compared to the upstream turbines under free-stream conditions. The turbine wake is characterized by a substantialstream-wise velocity deficit, which leads to less available wind energy forthe downstream turbines to harvest. It also causes enhanced turbulenceintensity, which increases the fatigue loads acting on the downstreamturbines. It has been found that the power generation of a wind turbinecould be reduced by up to 40% when the wind turbine operates withinthe wake of an array rather than within free-stream flow (Corten et al.,2004). The enhanced turbulence intensity can dramatically shorten thelifetime of the wind turbine (Van Binh et al., 2008; Sanderse, 2009). Onearea of focus in wind farm design is to develop robust wake models withvarious atmosphere conditions. However, most of these studies arerelated to flat surfaces. Barthelmie et al. (2007) and Politis et al. (2012)attempted to evaluate the performance of those models and to examinethe evolution of turbine wakes over complex terrains. They found thatthose wake models could not be used to accurately predict the wakeinterference in wind farms on complex terrains. The challenges associ-ated with the development of wake models for wind farms sited oncomplex terrains are that there have been few quantitative measurementson the wake interferences of the wind turbines sited over com-plex terrains.
In the present study, the flow characteristics of the surface wind overtwo-dimensional hills with different slopes were studied to assess thecharacteristics of surface wind energy resources over hilly terrains. Thedynamic forces acting on the model wind turbines mounted at differentpositions on hilly terrains were alsomeasured. The quantitative flow fieldmeasurements were correlated with the wind load measurements toinvestigate the effects of topography on the performance of the windturbines sited on hilly terrains. In addition, the wake interferences ofwind turbines sited on hilly terrains were assessed. The quantitativemeasurement results of the present study can not only be used as adatabase for the development of wakemodels and numerical simulations,but can also be used in designing the optimal layout of wind farmslocated in complex terrains.
2. Experimental setup
2.1. Atmospheric boundary layer wind tunnel
Experimental studies were performed in a large-scale ABL wind tun-nel located at the Aerospace Engineering Department of Iowa StateUniversity. Fig. 1(a) shows a sketch of the ABL wind tunnel. The windtunnel has a contraction section with a 4.8:1 area ratio upstream of thetest section along with a set of honeycombs, wire meshes, and a coolingsystem to provide uniform airflow into the test section. The wind tunnelis operated as a closed return loop. The test section is 20 m long, 2.4 mwide and 2.3 m high. The maximum wind speed is 45 m=s in the testsection. During the experiments, the triangular spires at the beginning ofthe test section and wooden blocks spaced on the wind tunnel floor wereused to simulate the flow conditions similar to ABL wind under thermallyneutral conditions. As shown in Fig. 1(b), five spires with aspect ratio of0.16 are equally distributed at the beginning of the test section, on aplane normal to the flow direction. A thin plate with the height of 200mm are mounted on the wind tunnel floor and connected with the fivespires. In addition, surface roughness elements with different size andspacing are covered on the wind tunnel floor. The parameters of thesurface roughness elements are listed in Table 1.
In the present study, Cobra Probe anemometry was used to charac-terize the ABL inflow condition. Mean velocities and turbulent

Fig. 1. ABL wind tunnel (a) A sketch of the wind tunnel and (b) A picture of the test section.
Table 1The parameters of the surface roughness elements.
Roughnesselements
Height Length Width Stream-wisespacing
Span-wisespacing
Layout
Dimension(mm)
50.8 38.1 38.1 381 190.5 Staggered25.4 25.4 25.4 152.4 152.4 Staggered12.7 12.7 12.7 101.6 101.6 Staggered6.35 6.35 6.35 50.8 50.8 Staggered
W. Tian et al. Journal of Wind Engineering & Industrial Aerodynamics 172 (2018) 379–394
fluctuations of the ABL inflow were measured in three spatial directionsbefore the hill and wind turbine models were installed. Measurements
Fig. 2. Measured mean stream-wise velocity profile of the ABL wind. The figure (a) is in linear urepresent the top and bottom rotor tip heights, while the dash-dotted line indicates the turbin
381
were taken at the centerline of the wind tunnel in the transverse directionand at a fixed stream-wise location (i.e., where the tested wind turbinemodel will be installed) with the vertical coordinate ranging fromz ¼ 12.7 to 762 mm with an increment of 12.7 mm between12.7 mm � z � 381 mm and an increment of 25.4 mm in the range of381 mm �z � 762 mm. During the experiments, the oncoming ABL windspeed at hub height of the model wind turbine was kept constant and setas UHub ¼ 5.0 m=s. It has been suggested that the mean velocity profile ofABL wind over open terrain can usually be fitted well by a power functionor a logarithmic function (Zhou and Kareem, 2002; Jain, 2007). Fig. 2(a)shows the measured mean stream-wise velocity profile of the simulatedoncoming ABL wind in the wind tunnel test section. The horizontal axis
nits, while the figure (b) is in linear-logarithmic units (In figure (a), horizontal dotted linese hub height).

W. Tian et al. Journal of Wind Engineering & Industrial Aerodynamics 172 (2018) 379–394
represents the non-dimensional averaged wind velocity U/U(Z10), whereU(Z10) is the velocity at a height of Z10 ¼ 31.25 mm above the windtunnel floor, which is equivalent of 10 m height above the ground in afull-scale wind farm with the scale ratio of 1:320. Fig. 2(a) clearly showsthat the present measurement data can be fit well with the power law.According to ASCE standard (ASCE, 2005), the power law exponent foran ABL wind over natural open terrain usually ranges from 0.1 to 0.2. Asshown in Fig. 2(a), the power law exponent of the curve fit to the presentmeasurement data is 0.16, which is well within the range of ABL windover open terrain.
In Fig. 2(b), the measured stream-wise velocity profile is fitted using alogarithmic profile. A friction velocity of u� ¼ 0:3 m=s is determined byusing the measured Reynolds shear stress (see Fig. 3(b)). The fitted sur-face roughness length and zero plane displacement can then be obtainedby fitting a logarithmic profile to the measured mean velocity. The fittedsurface roughness length is approximately z0 ¼ 0:24 mm. For the scaledABL wind, this surface roughness length can translate into a roughnesswith an average height of approximately 8 cm, which is consistent withopen terrain or grassland containing a small amount of scattered obsta-cles with heights approximately 1.5–10 m, as described in AustralianStandard (AS/NZ1170.2, 2002). The fitted zero plane displacement isapproximately d ¼ 0:16 mm. It should be noted that the experimentaldata in the near-wall region (z � 38.1 mm) do not fit the logarithmicprofile very well. In the present study, the turbine hub height isH ¼ 225 mm, which is much larger than the near-wall region mentionedabove (i.e., z � 38.1 mm). Our focus will be mainly on heights between85mm�z� 365mm (i.e., heights corresponding to the rotor plane regionof model wind turbine).
The turbulence intensity profiles for the simulated ABL flow are givenin Fig. 3(a). The turbulence intensities are calculated as Iu¼ σu/Ulocal, Iv¼σv/Ulocal and Iw ¼ σw/Ulocal, where σu, σv and σw are the root mean squareof the velocity fluctuations in the stream-wise, span-wise and verticaldirections, respectively. Ulocal is the time-averaged velocity at the mea-surement point. It can be seen that the turbulence intensities follow therelation Iu > Iv > Iw, which agree with the observations of Panofsky andDutton (1984). In addition, as shown in Fig. 3(a), the stream-wise tur-bulence intensities (i.e., Iu) in the turbine rotor plane region areapproximately 0.18. The standard stream-wise turbulence intensityprofile of an ABL wind over an open terrain as suggested by ArchitecturalInstitute of Japan (AIJ, 1996), which is scaled at a ratio of 1:320, was alsoplotted in Fig. 3(a) for comparison. It can be clearly seen that the tur-bulent boundary layer flow generated inside the wind tunnel can be usedto simulate the ABL wind over an open terrain in nature reasonably well.Fig. 3(b) shows the Reynolds shear stress profile of the simulated ABLflow normalized by the square of the friction velocity (i.e., u2*). TheReynolds shear stress increases with the height, reaches a peak at a shortdistance from the wall and then decreases with further increase in height.
Fig. 3. Simulated ABL wind (a) Turbulence intensities and (b) Reynol
382
Similar trends of Reynolds shear stress were reported in the previouswind tunnel studies conducted by Chamorro and Port�e-Agel (2009), Calet al. (2010) and Markfort et al. (2012).
Fig. 3(c) gives the vertical profile of the stream-wise turbulence in-tegral length scale (Lxu), which is calculated using the direct integration ofauto-correlation function based on the Taylor “Frozen Turbulence”hypothesis:
Lxu ¼ U∫ τ0:05
0 RuðτÞ dτ (1)
As indicated by Flay and Stevenson (1998), the error caused by Taylor“Frozen Turbulence” hypothesis would increase dramatically when theauto-correlation coefficient is very small. They suggested that the upperlimit of the integral is taken RuðτÞ ¼ 0:05 as the best. Therefore, τ0:05 inEq. (1) is the delay time corresponding to the auto-correlation coefficientRuðτÞ monotonically decreasing from 1 to 0.05. It should be noted thatthe turbulence integral length scale shown in Fig. 3(c) decreasescontinuously with increasing height, which differs from what is expectedfor ABL wind. This limitation can be traced to the structural character-istics of the triangular spires with narrow top and wide bottom. Still, itcan be seen in Fig. 3(c) that the calculated Lxu at turbine hub height isapproximately 0.56 m, which could translate into a turbulence integrallength scale of approximately 180 m for the full-scale ABL wind. Thisturbulence integral length scale (i.e., 180 m) is close to the empiricalvalue as suggested by Counihan (1975) and Architectural Institute ofJapan (AIJ, 1996).
The power spectrum, which reflects the distribution of the averagedpower of fluctuating wind as a function of frequency, is an importantcharacteristic of ABL wind. The Kaimal spectrum (Kaimal et al., 1972) isone of the most commonly used power spectra and can be expressed as:
nSuðnÞσ2u
¼ 200χ
6ð1þ 50χÞ5=3(2)
where n is the frequency, SuðnÞ is the power spectral density and σu is thestandard deviation of the fluctuating velocity at the measurement point.χð¼ nz=UÞ is the reduced frequency, where U is the mean wind speed atheight z.
Fig. 4 shows the power spectrum of the stream-wise velocitycomponent measured at turbine hub height, which is calculated using afast Fourier transform (FFT) analysis procedure with the multi-tapermethod (MTM). To improve the statistics of wavenumbers in the lowerfrequency range, 216 bins are used for the FFT in the range of χ <0:2,while 212 bins are used in the range of χ >0:2. It can be seen that thepower spectrum profile of the measured velocity agrees reasonably withthe Kaimal spectrum.
ds shear stresses (c) Stream-wise turbulence integral length scale.

Fig. 4. Power spectrum of the stream-wise velocity component measured at turbinehub height.
Table 2The primary design parameters of the wind turbine model.
Parameter R H drod dnacelle α a a1 a2
Dimension (mm) 140 225 18 26 5 68 20 35
W. Tian et al. Journal of Wind Engineering & Industrial Aerodynamics 172 (2018) 379–394
2.2. The tested wind turbine and terrain models
The wind turbine model uses a scale ratio of 1:320, which is deter-mined by the height ratio of the simulated ABL wind as mentioned above.The rotor radius of the wind turbine model is R¼ 140mm and the turbinehub height is H¼225 mm. Based on the ERS-100 prototype of the windturbine blade developed by TPI Composites Inc., the blademodel sectionswere generated by mathematically applying a spline under tension tointerpolate between the defined input locations. As shown in Fig. 5, acircular section extending from the root of the blade to a distance of 5%of the blade radius (R) and three NREL airfoils (S819, S820, S821) placedat various locations were used as inputs to generate the blade profile. TheS821 root airfoil was used between 0.208R and 0.40R; the S819 primaryairfoil was positioned at 0.70R; and the S820 tip airfoil was specified at0.95R. While the primary design parameters of the model turbine arelisted in Table 2, further information about the ERS-100 rotor blades areavailable in Locke and Valencia (2004) and Somers (2005). Experimentsusing similar turbines include Tian et al. (2014) and Yuan et al. (2014).
In general, the Reynolds number of the large-scale wind turbine inatmospheric flow cannot be matched by wind-tunnel experiments. TheReynolds number based on the averaged chord length of the rotor blades(C) and the oncoming wind speed at the hub height (UHub) was found tobe approximately 7000. This Reynolds number is significantly low
Fig. 5. Schematic diagram of the wind turbine model.
383
compared to that of a large-scale wind turbine that is typically in therange of 0.7� 106 to 10� 106 (Wilson, 1994). However, as suggested byMedici and Alfredsson (2006), the behavior of the turbulent flow in thewake of a wind turbine would be nearly independent of the chord Rey-nolds numbers of the wind turbine. Furthermore, the main purpose of thepresent study was not to evaluate the performance of a full-scale windturbine but to provide experimental data under well-controlled flowconditions for the validation of numerical simulations. As indicated byAdaramola and Krogstad (2011), Grant et al. (1997), Vermeer et al.(2003) and Haans et al. (2008), as a test case for numerical simulations, alower Reynolds number is acceptable as long as the aerodynamic per-formances of the airfoils used for the model wind turbine are known.Therefore, the experimental data obtained in the present study can stillbe used if the numerical simulation is conducted at the model scaleReynolds number range.
In the present study, the rotational frequency of the turbine rotor wascontrolled by applying different electric loads to a small DC generatorplaced inside the turbine nacelle. The rotational speed of wind turbine Ωcan change from 0 to 2 200 rpm, which corresponds to the tip-speed-ratio(i.e., λ ¼ ΩR/UHub) changing from 0 to 6.5. For each tested case, a seriesof tip-speed-ratio values were adjusted to search for the optimum tip-speed-ratio (i.e., the tip-speed-ratio with maximum power output ofthe model wind turbine). All the dynamic load data presented in thisstudy were obtained with the model turbine operating under the opti-mum tip-speed-ratio.
As shown in Fig. 6, two typical two-dimensional hill models withdifferent slopes were made of wooden frames and thin film covers. Thegeometry of the two-dimensional hill model with a Gaussian curve isdefined by the following relationship:
Z ¼ h�exp���xL
�2ln 2
�(3)
where h ¼ 285 mm is the height of the hill model, and L is the lengthmeasured in the flow direction between hill height form h/2 to h. The hillslope is defined as s¼(h/2)/L. As shown in Fig. 6, the two hill modelswith slope of s ¼ 0.25 (i.e., gentle hill) and s ¼ 0.5 (i.e., steep hill) weretested in the present study. According to the study of Mason and King(1985), the critical slope for the occurrence of flow separation over hillyterrain is approximately 0.3. Therefore, the two hill models shown inFig. 6 can be used to represent typical hilly terrains with and without
Fig. 6. Schematic diagram of the hill models (a) Gentle hill; (b) Steep hill.

W. Tian et al. Journal of Wind Engineering & Industrial Aerodynamics 172 (2018) 379–394
flow separation on the lee side.In addition, as shown in Fig. 6, three typical positions, which are
located 6D in front of the hilltop, on the hilltop and 6D behind the hilltop,were chosen to investigate the terrain effects on the performance of thewind turbine sited on the hill model, where D¼280mm is the diameter ofthe turbine rotor. First, the dynamic wind loads of a single wind turbineinstalled on the hilltop and 6D behind the hilltop were tested. Second,after installing three wind turbine models at the selected positions, thedynamic wind loads of the downstreamwind turbines sited on the hilltopand 6D behind the hilltop were measured. Third, flow measurementswere conducted on the hilltop and 6D behind the hilltop to reveal theeffect of topography on the evolution of the upstream turbine wake.During the experiments, in order to measure the wake characteristics atthe selected position, the wind turbine model was removed before theflow measurements were conducted at that position. Furthermore, ex-periments with three wind turbine models aligned in the free-streamdirection with 6D spacing on flat surface were also conducted forcomparison.
It should be noted that the blockage of the wind tunnel cross sectioncaused by the hill model was approximately 12.5%. This is higher thanthe suggested upper limit of the blockage effect to avoid wind tunnel walleffects on the measurements. The blockage effect should be consideredwhen the data are studied. However, as suggested by Røkenes andKrogstad (2009), because the main objective of the present study was toobtain data for the validation and verification of the numerical simula-tions, the blocking effect may be accounted for in the calculations bysetting the computational boundaries at the wind tunnel walls.
2.3. Dynamic wind loads and flow field measurements
In the present study, a high-sensitivity load cell (JR3, model 30E12A-I40) was used to measure the dynamic wind loads acting on the windturbine model. The JR3 load cell was mounted at the tower base of thewind turbine model, and it can provide instantaneous measurements ofthe aerodynamic forces and moment (torque) about all three axes. Themeasurement range of the JR3 load cell is 40 N for aerodynamic forcesand 5 N �m for moment (torque). While similar wind loads features wererevealed by different components of the aerodynamic forces and themoments, only the measured thrust coefficient, CT, is given in the presentstudy for conciseness. The coefficients of the thrust force were calculatedby using following equation:
CT ¼ T12 ρU
2πR2(4)
where ρ is the air density. During the experiments, the sampling rate ofthe wind load data was 1000 Hz. For each test case, the sampling timewas set to be 60 s to ensure sufficient convergence of the mean andstandard deviation of the measured thrust force. In addition, according tothe sampling theorem, the analyzable frequency for the measured thrustforce is in the range of 1/120 Hz–500 Hz with the frequency resolution of1/60 Hz.
A Cobra Probe anemometry system was applied to measure the tur-bulent flow over the hill, as well as the flow in the wake behind the windturbine model. By using this Cobra Probe, all three components of ve-locity vector could be measured instantaneously. During the experi-ments, the maximum flow velocity measured in the wind tunnel isapproximately 8 m=s. The relative uncertainty of the Cobra Probeanemometry is 1.50% for 8 m=s which is 0.12 m=s. The accuracies of allthe other velocity values measured in the present study are within±0:12 m=s. The sampling rate of the instantaneous velocity vector was1250 Hz with a measurement period of 60 s at each point of interest. Theselected sampling time (i.e., 60 s) ensure sufficient convergence for thehigher-order statistical analysis of the components of the measured ve-locity vector, such as the turbulence intensity, turbulence kinetic energyand Reynolds shear stress. Based on the selected sampling rate and
384
sampling time, the analyzable signal frequency range for the measuredvelocity vector is 1/120 Hz–625 Hz with the frequency resolution of1/60 Hz.
To interpret the terrain effect more clearly, the stream-wise meanvelocity measured in the oncoming ABL wind profile over a flat surface atthe turbine hub height (i.e., UHub) is used as the reference velocity inSection 3. During the experiments, the reference velocity was held con-stant atUHub¼5.0m=s. In addition, while the height from the local surfacein the hill model is denoted by z, Z is used to represent the height from thewind tunnel floor.
3. Results and discussion
3.1. Flow characteristics over hilly terrain with different slopes
Five positions (i.e., x=D ¼ �6; � 3; 0; 3; 6; and x ¼ 0 correspondsto the stream-wise location of the hilltop) were selected to measure theturbulent flow characteristics over the tested hill models. The compari-son of stream-wise velocity profiles between the gentle and steep hillmodels are plotted in Fig. 7. The stream-wise mean velocity profile of theoncoming ABL wind on the flat surface was also plotted for comparison.As expected, no flow separation can be observed for the gentle hill, whileflow separation occurs for the steep hill.
The fractional speed-up ratio, which is defined as ΔS ¼ ðUðzÞ �U0ðzÞÞ=U0ðzÞ , is usually used to quantify the speed-up effect over a hillyterrain, where U0ðzÞ is the mean velocity of the oncoming ABL flow on aflat surface. The fractional speed-up ratio profiles obtained at differentlocations over the gentle and steep hill models are plotted in Figs. 8 and9, respectively. The results reported by Kim et al. (1997), Gong andIbbetson (1989) and Cao and Tamura (2006) with similar hill slopes andtest conditions as those of the present study are given for quantitativecomparison. In addition, the standard profiles suggested by wind loadingcodes (ASCE, 2002; AS/NZ1170.2, 2002; CEN, 2004) were also plotted inthe figures for comparison.
For the gentle hill, it can be seen that the measurement results are ingood agreement with the profiles provided by wind loading codes exceptfor the near-wall region. At the location of x ¼ �3D, the discrepancies inthe near-wall region indicate that the wind loading codes cannot accu-rately reveal the blocking effect caused by the downstream hill. At thelocations of x¼ 3D and x¼ 6D, the distinct velocity deficits caused by thehigh adverse pressure gradient in the near-wall region also cannot berevealed correctly by the wind loading codes. As comparison with theprevious studies, it can be seen in Fig. 8(b) and (c) that the speed-upratios at x ¼ �3D and x ¼ 0 were slightly lower than those reported byKim et al. (1997) and Gong and Ibbetson (1989). In addition, at the lo-cations of x ¼ 3D and x ¼ 6D, the velocity deficits in the near-wall regionwere also lower than the results provided by Kim et al. (1997) and Gongand Ibbetson (1989). These discrepancies are believed to be attributed tothe different hill slopes (i.e., s¼ 0.25 for the present study vs. s¼ 0.30 forKim et al. (1997) and s ¼ 0.31 for Gong and Ibbetson (1989)).
For the steep hill, it can be seen in Fig. 9 that the measurement dataare in good agreement with the experimental results provided by Kimet al. (1997) and Cao and Tamura (2006). As comparison with the windloading codes, the discrepancies in the near-wall region shown inFig. 9(b) also indicate that the wind loading codes cannot accuratelyreveal the blocking effect caused by the downstream hill. In addition, asshown in Fig. 9(d), the results obtained at the location of x ¼ 3D showsignificant difference when compared with the profiles provided by thewind loading codes. This difference could be attributed to the fact thatthe data suggested by the wind loading codes are mainly derived usinglinear theory, which has very poor ability to predict the flow character-istics in the separation region on the lee side of a steep hill.
While the mean wind speed distributions over the hilly terrains areclosely related to the amount of power that can be extracted by the windturbines, the turbulence levels of the flows are directly associated withthe fatigue loads acting on the wind turbines. Because the flow direction

Fig. 7. Comparison of stream-wise mean velocity profiles at different locations (a) Gentle hill, (b) Steep hill.
Fig. 8. The fractional speed-up ratio profiles measured at different locations over the gentle hill (a) x ¼ �6D, (b) x ¼ �3D, (c) x ¼ 0, (d) x ¼ 3D and (e) x ¼ 6D.
W. Tian et al. Journal of Wind Engineering & Industrial Aerodynamics 172 (2018) 379–394
changes significantly over hilly terrain, the turbulence kinetic energy(TKE), which is calculated by summing the fluctuation of velocity inthree directions, is used in the present study to analyze the turbulentcharacteristics. The TKE is calculated by using the following equation:
385
TKE ¼12
�σ2u þ σ2v þ σ2w
�2 (5)
UHub
where σu; σv; σw are the standard deviations of the fluctuating velocities

Fig. 9. The fractional speed-up ratio profiles measured at different locations over the steep hill (a) x ¼ �6D, (b) x ¼ �3D, (c) x ¼ 0, (d) x ¼ 3D and (e) x ¼ 6D.
W. Tian et al. Journal of Wind Engineering & Industrial Aerodynamics 172 (2018) 379–394
in stream-wise, span-wise and vertical directions, respectively.The TKE profiles for both the gentle and steep hill models are plotted
in Fig. 10. The TKE profile of the oncoming ABL wind on the flat surfacewas also plotted for comparison. While no appropriate TKE data can befound in previous studies to compare with that of the steep hill, the re-sults reported by Kim et al. (1997) with hill slope of s ¼ 0.3 were plottedin Fig. 10 to compare with the TKE profiles over the gentle hill. It can beseen that for the gentle hill, the measurement results of the present studyare in good agreement with the results reported by Kim et al. (1997). Forthe gentle hill, the change of the TKE distributions appears mainly at thelocations behind the hilltop. With flow moving over the downgrade ofthe hill, the increase of TKE mainly occurred in the region below the hillheight. However, compared to the gentle hill, the variations of the TKEdistributions at the locations behind the steep hill are much more sig-nificant due to the flow separation. As shown in Fig. 10(d) and (e), theexpansion of the regions with high TKE is extremely large for the steephill case. At the location of x ¼ 6D, the flow with high TKE levels canexpand to the height of z/H ¼ 3.0, which is two times higher than thehill height.
In addition, as shown in Fig. 10(c), for both the gentle and steep hills,the TKE values measured on the hilltops are slightly lower than those ofthe oncoming ABL wind on the flat surface. It can be concluded that thehill will have a positive effect on a wind turbine sited on a hilltop forvirtually any hill slopes, not only by increasing the flow velocity due tothe speed-up effect but also by decreasing the turbulence level of the flowon the hilltops.
386
3.2. Wind turbine sited on top of the hills
3.2.1. Dynamic wind loads acting on single wind turbines sited on the hilltopsAs mentioned above, a JR3 load cell was used to measure the thrust
force acting on the wind turbine model. In the present study, themaximum thrust force acting on the wind turbine model is approximately1.0 N. The uncertainty of the JR3 load cell is approximately 0.02 N for1.0 N. The accuracies of all the other thrust forces measured in the pre-sent study are within ±0:02 N.
In the present study, the thrust coefficients are defined using twodifferent approaches. First, the thrust coefficients were calculated byusing a constant reference velocity (i.e., UHub¼5.0 m=s, which is theoncoming ABL wind velocity at hub height of the wind turbine sited onthe flat surface). The means and standard deviations of the thrust co-efficients calculated by using UHub¼5.0 m=s as reference velocity arelisted in the first and second lines of Table 3. The thrust coefficient of theturbine model mounted on the flat surface is also listed for comparison.As expected, the high flow velocity caused by the speed-up effect leads toa significant increase in the mean wind loads acting on the wind turbinemodel. Compared to the case of flat surface, the increased thrust forcesacting on the wind turbines sited on top of the gentle and steep hills reach33% and 47%, respectively. According to the momentum and energyconservation laws, while the aerodynamic thrust force acting on a windturbine is proportional to themomentum deficits in the square of the flowvelocity across the rotation disk of the wind turbine, the power output ofthe wind turbine (i.e., the wind energy harvested by the wind turbine)would be proportional to the deficits in the cube of the flow velocity (i.e.,

Fig. 10. Comparison of TKE profiles at different locations over the gentle and steep hills (a) x ¼ �6D, (b) x ¼ �3D, (c) x ¼ 0, (d) x ¼ 3D and (e) x ¼ 6D.
Table 3Dynamic thrust coefficients acting on single wind turbine sited on the hilltops and the flatsurface.
Wind load measurement results Gentle hill Steep hill Flatsurface
Mean thrust coefficient(UHub¼5 m/s as reference velocity)
0.68 0.75 0.51
Standard deviation of the thrust coefficient(UHub¼5 m/s as reference velocity)
0.21 0.20 0.23
Local hub height velocity, UHub, local (m/s) 6.0 6.6 5.0Mean thrust coefficient(UHub, local as reference velocity)
0.47 0.43 0.51
Standard deviation of the thrust coefficient(UHub, local as reference velocity)
0.15 0.11 0.23
W. Tian et al. Journal of Wind Engineering & Industrial Aerodynamics 172 (2018) 379–394
the differences in flow kinetic energy) across the rotation disk. With theturbine model mounted on the hilltops, the higher mean wind loads arebelieved to be closely related to the improved wind energy harnessing. Inaddition, while the mean thrust forces acting on the wind turbines sitedon the hilltops are much higher than that of the flat surface, the standarddeviations of the dynamic wind loads acting on the wind turbine sited onthe hilltops are slightly lower than that of the flat surface case. This slightdecrease is in accordance with the TKE distributions on the hilltops, asshown in Fig. 10(c).
Second, the thrust coefficients were calculated by using the local hubheight velocity (i.e., UHub, local, which is the hub height velocity measuredat the location where the tested wind turbine will be mounted). The re-sults are listed in the fourth and fifth lines of Table 3. Interestingly, it can
387
be seen that both the means and standard deviations of the thrust co-efficients acting on the wind turbines sited on the hilltops were smallerthan that of the flat surface case, especially for the standard deviations ofthe thrust coefficients. It can be deduced that, for the same hub heightvelocity, the decrease of means and standard deviations of the wind loadsacting on the wind turbines sited on the hilltops would become morepronounced with the increase of hill slope.
As shown in Fig. 11, the histograms of the measured thrust co-efficients acting on the wind turbine models sited on the hilltops werefitted quite well by a Gaussian function. The study of Hu et al. (2012)indicated that the histogram of dynamic wind loads acting on the windturbine experiencing ABL wind could be reasonably fitted with aGaussian distribution, which can also be observed in the present study, asshown in Fig. 11(c). Compared to the flat surface, the closer matchesbetween the measurement results and the Gaussian distributions for thewind turbines sited on the hilltops are believed to be closely related tomore uniform flows with lower turbulence levels experienced by thewind turbines. The good agreement with a Gaussian distribution con-firms that the standard deviations of the dynamic wind loads listed inTable 3 can be used as a quantitative parameter to evaluate the fatigueloads acting on wind turbines sited on the hilltops.
Fig. 12 shows the power spectra of the measured fluctuating thrustcoefficients obtained using an FFT analysis procedure, which reveals theamplitudes of the fluctuating thrust coefficient at different frequencies. Inorder to evaluate the turbulent flow over complex terrains, the ABL windsimulated in the present study was controlled at a relatively high tur-bulence level. As shown in Fig. 3(a), the stream-wise turbulence in-tensities of the simulated ABL wind in the turbine rotor plane region can

Fig. 11. Histograms of the instantaneous thrust force coefficients. (a) Single turbine sited on top of the gentle hill (b) Single turbine sited on top of the steep hill (c) Single turbine sited onthe flat surface.
W. Tian et al. Journal of Wind Engineering & Industrial Aerodynamics 172 (2018) 379–394
reach approximately 0.18. The behavior of dynamic wind loads acting onwind turbines under different types of ABL winds has been revealed bythe study of Tian et al. (2014), which indicated that high turbulence inABL flow would cause the rotational speed of the wind turbine to fluc-tuate in a wide frequency range, and no well-defined peak can be iden-tified in the corresponding power spectrum. As shown in Fig. 10, there isno significant difference between the turbulence characteristics on thehilltops and the flat surface. Therefore, the power spectra of themeasured dynamic wind loads shown in Fig. 12 have similar behavior.During measurement of the thrust force, a tachometer was used tosimultaneously measure the instantaneous rotational speed of the windturbine blades. The measurement data obtained by the tachometer alsoindicate that the inflow turbulence significantly affects the rotationalspeed of wind turbine blades. The behaviors of rotational frequenciesrevealed by the FFT analysis of the wind load measurements were foundto agree well with the rotational speed of the rotor blades measured usingthe tachometer.
3.2.2. Effect of the upstream turbine wake on the wind turbine sited on thehilltops
Figs. 13 and 14 show the stream-wise mean velocity and TKE distri-butions measured on the hilltops with and without a model wind turbinemounted 6D in front of the hilltop. The flow characteristics measured 6Ddownstream of a model turbine sited on a flat surface are also plotted forcomparison. As expected, due to the increase of the surface height, thewake of the upstream turbine mainly affected the flow near the surface ofthe hilltop. Only a slight velocity deficit and enhanced TKE can beobserved in the region of the rotation disk of the wind turbine sited onthe hilltops. The effect of hill slope on the evolution of the turbine wakecan be also observed in Fig. 13. The velocity deficit reaches the height ofz/H ¼ 0.6 for the gentle hill, which is higher than that of the steep hill
388
(i.e., z/H ¼ 0.5). Therefore, compared to the steep hill, the upstreamturbine wake could expand into a wider region as it traveled up the hillwith gentle slope.
The dynamic wind loads measured at the tower base of the windturbines sited on the hilltops with and without the wake interference ofthe upstream turbine are shown in Table 4. The data from a wind turbinelocated 6D behind an upstream turbine on the flat surface are also listedfor comparison. Compared to the flat surface case, the effects of the up-stream turbine wake on the thrust forces are much less distinct for thewind turbines sited on the hilltops. The decreases of mean thrust forcescaused by the velocity deficit are only approximately 4.4% and 2.6% forthe gentle and steep hills, respectively, which are much lower than that ofthe flat surface case (i.e., 12%). As described above, the standard de-viations of the dynamic wind loads represent the fluctuations that couldbe correlated to the fatigue loads acting on the wind turbine. As listed inTable 4, the effects of the upstream turbine wake on the fatigue loadsacting on the downstream turbine models sited on the hilltops werefound to be rather small (i.e., within the range of the measurement un-certainty), which agrees reasonably well with the TKE distributionsshown in Fig. 14.
3.3. Wind turbine sited behind the hills
3.3.1. Dynamic wind loads acting on a single wind turbine sited behind thehills
The means and standard deviations of the thrust coefficients acting onthe wind turbines mounted 6D behind the top of the gentle and steep hills(calculated by using UHub¼5.0 m=s as reference velocity) are listed in thefirst and second lines of Table 5. As described in Section 3.1, the flowcharacteristics behind the gentle and steep hills show significant differ-ences due to the flow separation. As expected, due to the distinct velocity

Fig. 13. Comparison of velocity profiles with and without the effect of the upstream turbine wake. (a) Measured on top of the gentle hill (b) Measured on top of the steep hill (c) Measuredon the flat surface.
Fig. 12. Power spectra of the instantaneous thrust forces. (a) Single turbine sited on top of the gentle hill (b) Single turbine sited on top of the steep hill (c) Single turbine sited on theflat surface.
W. Tian et al. Journal of Wind Engineering & Industrial Aerodynamics 172 (2018) 379–394
deficit caused by the terrain effect, the thrust force acting on the windturbine sited 6D behind the top of the steep hill decreases significantly toonly approximately 31% of that of a single wind turbine sited on the flatsurface. For the gentle hill, as shown in Fig. 7(a), the topographic effect atthe location 6D behind the hilltop is relatively small, and the velocitydeficit mainly occurs in the near-wall region. The mean thrust forceacting on the wind turbine sited 6D behind the top of the gentle hill is0.46, which is approximately 90% of that of a single wind turbine sitedon the flat surface. In addition, while the mean thrust forces were foundto correlate well with the characteristics of the mean flow velocity pro-files, the variations in the standard deviations of the thrust forces wereclosely related to the measured TKE profiles. Due to the enhanced TKE
389
shown in Fig. 10(e), the standard deviation of the thrust force for thegentle hill case was found to be 0.28, which is approximately 22% morethan that of a single turbine sited on the flat surface.
In addition, the means and standard deviations of the thrust co-efficients calculated by using local hub height velocity (i.e.,UHub, local) arelisted in the fourth and fifth lines of Table 5. A key point here is that forthe same hub height velocity, the standard deviation of the thrust coef-ficient acting on the wind turbine sited behind the steep hill is muchhigher than that of a single wind turbine sited on the flat surface. Thisdramatic increase of standard deviation of the thrust coefficient signifi-cantly shortens the lifetime of wind turbine sited behind the steep hill.
Fig. 15 shows the histograms of the measured thrust coefficients

Fig. 14. Comparison of TKE profiles with and without the effect of the upstream turbine wake. (a) Measured on top of the gentle hill (b) Measured on top of the steep hill (c) Measured onthe flat surface.
Table 4Effect of upstream turbine wake on dynamic wind loads of downstream wind turbines sitedon the hilltops (Using UHub ¼ 5 m/s as reference velocity).
Wind loadmeasurement results
Gentle hill Steep hill Flat surface
Nowake
In thewake
Nowake
In thewake
Nowake
In thewake
Mean thrustcoefficient
0.68 0.65 0.75 0.73 0.51 0.45
Standard deviationof the thrust
coefficient
0.21 0.22 0.20 0.21 0.22 0.25
Table 5Dynamic thrust coefficients acting on a single wind turbine sited 6D behind the hilltop.
Wind load measurement results Gentle hill Steep hill Flatsurface
Mean thrust coefficient(UHub¼5 m/s as reference velocity)
0.46 0.16 0.51
Standard deviation of the thrust coefficient(UHub¼5 m/s as reference velocity)
0.28 0.15 0.23
Local hub height velocity, UHub, local (m/s) 5.0 2.8 5.0Mean thrust coefficient(UHub, local as reference velocity)
0.46 0.51 0.51
Standard deviation of the thrust coefficient(UHub, local as reference velocity)
0.28 0.48 0.23
W. Tian et al. Journal of Wind Engineering & Industrial Aerodynamics 172 (2018) 379–394
acting on the wind turbine models sited 6D behind the hilltops. For thegentle hill, the histogram of dynamic wind loads also can be reasonablyfitted with a Gaussian distribution. However, compared to the flat surfaceand gentle hill cases, the wind turbine located behind the steep hill has agreater probability of experiencing extreme wind loads. The histogramshown in Fig. 15(b) indicates that the standard deviation of the dynamicwind loads would undervalue the fatigue loads acting on the wind tur-bine sited behind the steep hill, thereby overestimating the lifetime of thewind turbine.
The behavior of dynamic wind loads acting on the wind turbine ishighly related to the local flow characteristics. The histograms of theinstantaneous hub height velocity measured 6D behind the top of thegentle and steep hills (i.e., the locations where the wind turbine modelswill be mounted) are plotted in Fig. 16. The histogram of the hub heightvelocity measured on the flat surface is also plotted for comparison. Itshould be noted that Cobra Probe cannot measure the velocities in theopposite direction of the probe. Therefore, for the steep hill case, nonegative velocities are being recorded at the measurement point, whichcause the histogram distribution shown in Fig. 16(b) to rise sharply fromzero. As shown in Fig. 16, the histogram distribution for the steep hill
390
case shows a significant difference when compared with the gentle hilland the flat surface cases. The wind turbine sited behind the steep hill hasa much higher chance of experiencing instantaneous wind speeds farfrom the mean value, which could be the reason for the greater proba-bility of extreme wind loads acting on the wind turbine located behindthe steep hill.
Fig. 17 shows the power spectra of the measured instantaneous thrustcoefficients. The power spectrum corresponding to the steep hill is quitedifferent from those of the flat surface and gentle hill cases. It can be seenform Fig. 17(b) that the rotational speed of the wind turbine sited behindthe steep hill fluctuates in a wide range (i.e., from a frequency close tozero to a quite high frequency). It is difficult to distinguish the dominantfrequency from the spectrum shown in Fig. 17(b). This behavior ofrotation frequency agrees well with the rotational speeds of the rotorblades measured by using the tachometer. During the experiments, it canbe observed that the rotational speeds of the wind turbine sited behindthe steep hill fluctuated randomly over a wide range with its lower boundclose to zero.
3.3.2. Effect of upstream turbine wake on the wind turbine sited behind thehills
After mounting a model turbine on the hilltops, the characteristics ofthe inflow experienced by the wind turbines sited 6D behind the hilltopsweremeasured and are plotted in Figs. 18 and 19. For the gentle hill, withthe expanding of the upstream turbine wake over the downgrade of thehill, the velocity deficit can be observed clearly at the location 6D behindthe hilltop, and this velocity deficit is even higher than that of the flatsurface, as observed by comparing Fig. 18(a) and Fig. 13(c). Thisincreased velocity deficit indicates that the wake effect can be enhancedby the topography with flow moving downgrade of the gentle hill. Thisenhancedwake effect for the gentle hill could be attributed to the adversepressure gradient over the downgrade of the hill, which restricts theturbulent mixing of the low-speed wake flow with the outer high-speedflow, thereby reducing the recovery of the wake flow.
Interestingly, Fig. 19(a) shows that the upstream turbine leads to areduction in the TKE below the hill height (compared to the relativelyhigh turbulence levels near the hill surface). This can be explained by theenhanced turbulent mixing in the turbine wake flow resulting in a weakershear layer in the region below the hill height, as shown in Fig. 18(a),which would reduce the production of the TKE in this region. In the re-gion above the hill height, the enhancement of TKE caused by the up-stream turbine wake can be clearly observed in Fig. 19(a).
While the effect of the upstream turbine wake can be enhanced overthe downgrade of the gentle hill, the wake of the wind turbine sited onthe hilltop shows quite a different behavior as it moves over the down-grade of the steep hill. As described in Fig. 7(b), the hill with steep slopeinduces a flow separation behind the hilltop. The wind turbine sited 6D

Fig. 15. Histograms of the instantaneous thrust coefficients. (a) Single turbine sited 6D behind the top of the gentle hill (b) Single turbine sited 6D behind the top of the steep hill.
Fig. 16. Histograms of the instantaneous inflow wind speed measured at the local hub height. (a) 6D behind the top of the gentle hill (b) 6D behind the top of the steep hill (c) Onflat surface.
W. Tian et al. Journal of Wind Engineering & Industrial Aerodynamics 172 (2018) 379–394
behind the hilltop is immersed in the separated flow region. Compared tothe significant change of flow velocity and TKE caused by the separatedflow, the influence of the upstream turbine wake is negligibly small.Figs. 18(b) and 19(b) show that the measured velocity and TKE profilesare nearly independent of whether or not the upstream wind turbine ismounted on the hilltop.
Fig. 20 shows the comparison of the spectra of the flow velocitiesmeasured at the selected point x ¼ 6D, (z-H)/D ¼ 0.5 (i.e., top tip heightof rotor blades of the wind turbines sited 6D behind the hilltops) with andwithout the upstream wind turbine mounted on the hilltop. The spectrashown in Fig. 20 are normalized by UHub, H and σ2u , whilst the horizontalaxis represents the non-dimensional frequency nH=UHub. For the gentle
391
hill, the spectrum of the stream-wise velocity in the wake of the upstreamturbine presents an evident increase of the kinetic energy in the highfrequency range compared to the no-wake case. This indicates that theupstream turbine wake has a significant effect on the downstream flowover the downgrade of the gentle hill. However, for the steep hill, thespectrum shown in Fig. 20 indicates that over the whole frequency range,there is no difference between the kinetic energy distributions with andwithout the effect of the upstream turbine wake. It is believed that theexpansion and mixing of the turbulent wake flow is highly restricted bythe separated flow induced by the topography. Therefore, the phenom-enon of increased kinetic energy in the high-frequency range, which canbe clearly found in the gentle hill case, has not been observed in the steep
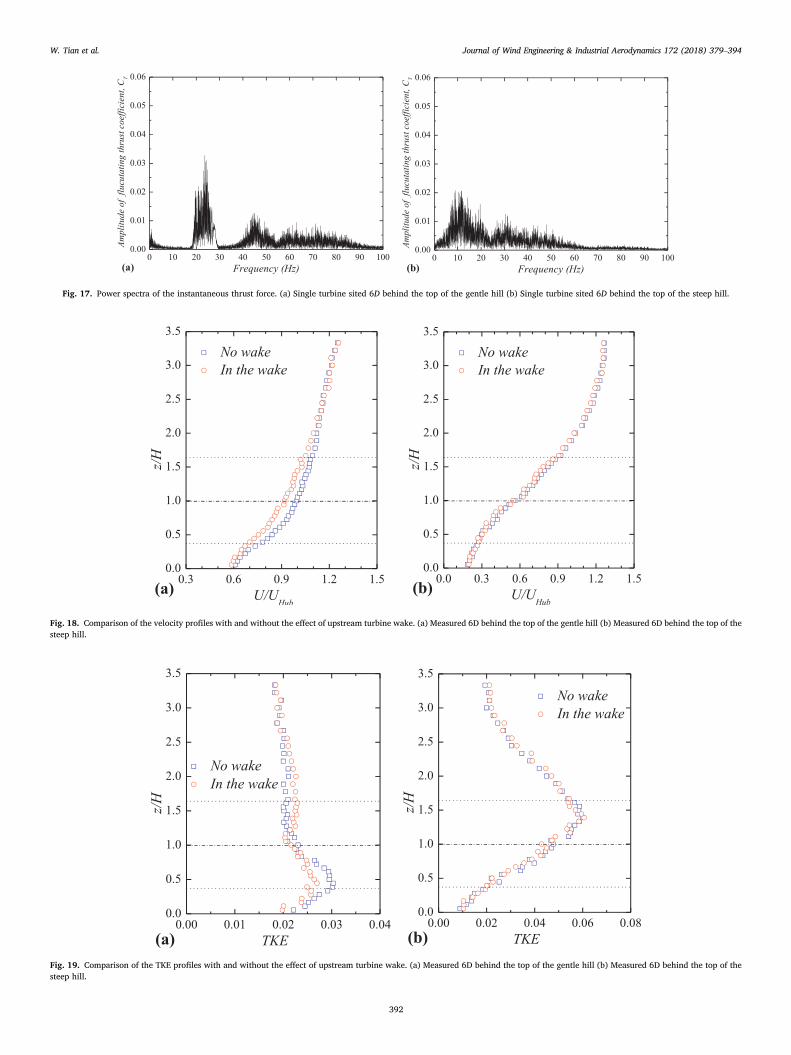
Fig. 17. Power spectra of the instantaneous thrust force. (a) Single turbine sited 6D behind the top of the gentle hill (b) Single turbine sited 6D behind the top of the steep hill.
Fig. 18. Comparison of the velocity profiles with and without the effect of upstream turbine wake. (a) Measured 6D behind the top of the gentle hill (b) Measured 6D behind the top of thesteep hill.
Fig. 19. Comparison of the TKE profiles with and without the effect of upstream turbine wake. (a) Measured 6D behind the top of the gentle hill (b) Measured 6D behind the top of thesteep hill.
W. Tian et al. Journal of Wind Engineering & Industrial Aerodynamics 172 (2018) 379–394
392

Fig. 20. Spectra comparison of the stream-wise velocity components with and without anupstream turbine mounted on the hilltop (measurement point, x¼6D, (z-H)/D¼0.5).
Table 6Effect of upstream turbine wake on dynamic wind loads of a wind turbine sited 6D behindthe hilltop (Using UHub ¼ 5 m/s as reference velocity).
Wind load measurement results Gentle hill Steep hill
Nowake
In thewake
Nowake
In thewake
Mean thrust coefficient 0.46 0.37 0.16 0.16The standard deviation of thethrust
coefficient
0.28 0.28 0.15 0.15
W. Tian et al. Journal of Wind Engineering & Industrial Aerodynamics 172 (2018) 379–394
hill case.The dynamic wind loads acting on the wind turbines sited 6D behind
the hilltops with and without the effect of the upstream turbine wake arelisted in Table 6. First, while the wind turbine sited on the top of thegentle hill has a significant effect on the mean wind loads acting on thedownstream turbine sited 6D behind the hilltop (i.e., ~18% decrease intime-averaged thrust force), the change of mean thrust forces corre-sponding to the steep hill case are almost negligible. Second, the changeof the standard deviations of the thrust forces are very small for both thegentle and steep hill cases, which agrees well with the behavior of theTKE distributions shown in Fig. 19.
4. Conclusion
Wind-tunnel experiments were conducted to characterize the aero-mechanic performances and wake interferences of wind turbines sited onhilly terrains with different slopes. The dynamic wind loads acting on themodel turbines sited on the hilltops and behind the hills were measuredand correlated with the flow field measurements to reveal the relation-ship between the wind turbine performances and the surface windcharacteristics for the optimal site design of wind turbines on hilly ter-rains. The effects of upstream turbine wake on the performances ofdownstream turbines were also investigated. Some major findings of thepresent study are summarized as follows:
(1) Compared to the flat surface, the wind turbine sited on the hilltopnot only generates more power due to the speed-up effect but alsoexperiences less fatigue loads due to the decreased TKE on thehilltop.
(2) Due to the increase of surface height, the wake effect of the up-stream turbine on the wind turbine sited on the hilltop becomesmuch less significant compared to that on the flat surface. Thedecreases of mean wind loads caused by the wake of the upstream
393
wind turbines located 6D in front of the hilltops are onlyapproximately 4.4% and 2.6% for the gentle and steep hillsrespectively, which are much lower than that of the flat surfacecase with the same turbine spacing (i.e., 12%).
(3) The behavior of the dynamic wind loads acting on the wind tur-bine sited 6D behind the hilltop shows obvious differences be-tween the gentle and steep hill cases. Compared to thecharacteristics of Gaussian distribution for the gentle hill case, thewind turbine located behind the steep hill has a much greaterprobability to experience extreme wind loads.
(4) While the effect of the upstream turbine wake can be enhancedover the downgrade of the gentle hill, the wake of the wind tur-bine sited on the top of the steep hill is highly restricted by theseparated flow induced by the topography. Compared to the sig-nificant wake effect on the mean wind loads acting on thedownstream turbine sited behind the gentle hill (i.e., ~18%decrease in mean thrust force), the effect of the upstream turbinewake on the wind turbine sited behind the steep hill is almostnegligible.
It should be noted that the topographies investigated in the presentstudy are uniformly shaped two-dimensional hills. Gong and Ibbetson(1989) indicated that for a gentle hill, the mean flow and turbulence overa three-dimensional hill generally resemble those over a two-dimensionalhill of similar cross-section. The major differences between two- andthree-dimensional hills are found on the upwind slope and in the wakewhere, respectively, horizontal divergence and convergence of thethree-dimensional flow are most pronounced. Ishihara et al. (1999)experimentally studied the turbulent flow over a three-dimensional steephill. It was found that the pronounced speed-up of flow occurs not only onthe hilltop but also at the midway of the sides. In addition, the ABL windover a three-dimensional steep hill separates behind the crest and reat-taches just at the lee foot of the hill, which is quite different from that ofthe two-dimensional hill. Obviously, these discrepancies of flow char-acteristics between two- and three-dimensional hills would have a sig-nificant effect on the aeromechanic performances of wind turbines.Therefore, a wind tunnel study will be performed in our future work toreveal the aeromechanics and wake interferences of wind turbines sitedover typical three-dimensional hills.
Acknowledgement
The funding support from the Iowa Energy Center with Grant No. 14-008-OG and National Science Foundation (NSF) with Grant Numbers ofCBET-1133751 and CBET-1438099 are gratefully acknowledged. WeiTian also wants to thank the support from the National Key TechnologySupport Program of China (No.2015BAA06B04) and Shanghai NaturalScience Foundation (No.16ZR1417600).
References
Adaramola, M.S., Krogstad, P.A., 2011. Experimental investigation of wake effects onwind turbine performance. Renew. Energy 36, 2078–2086.
Architecture Institute of Japan, 1996. AIJ Recommendations for Loads on Buildings. AIJ.AS/NZ1170.2, 2002. Australian/New Zealand Standard, Structural Design Actions, Part
2: Wind Actions. Standards Australia and Standards New Zealand.ASCE 7-02, 2002. Minimum Design Loads for Buildings and Other Structures. American
Society of Civil Engineers.ASCE 7-05, 2005. Minimum Design Loads for Buildings and Other Structures. American
Society of Civil Engineers.ASCE 7-10, 2010. Minimum Design Loads for Buildings and Other Structures. American
Society of Civil Engineers.Athanassiadou, M., Castro, I.P., 2001. Neutral flow over a series of rough hills: a
laboratory experiment. Bound.-Layer Meteorol. 101, 1–30.Balogh, M., Parente, A., Benocci, C., 2012. RANS simulation of ABL flow over complex
terrains applying an enhanced k� ε model and wall function formulation:implementation and comparison for fluent and openFOAM. J. Wind Eng. Ind.Aerodyn. 104, 360–368.
Barthelmie, R.J., Rathmann, O., Frandsen, S.T., 2007. Modelling and measurements ofwakes in large wind farms. J. Phys. Conf. Ser. 75, 012049.

W. Tian et al. Journal of Wind Engineering & Industrial Aerodynamics 172 (2018) 379–394
Bechmann, A., Sørensen, N.N., 2011. Hybrid RANS/LES applied to complex terrain. WindEnergy 14, 225–237.
Bitsuamlak, G., Stathopoulos, T., B�edard, C., 2006. Effects of upstream two-dimensionalhills on design wind loads: a computational approach. Wind Struct. 9, 37–58.
Bitsuamlak, G.T., B�edard, C., Stathopoulos, T., 2007. Modeling the effect of topographyon wind flow using a combined numerical-neural network approach. J. Comput. Civ.Eng. 21, 384–392.
Bowen, A.J., 2003. Modelling of strong wind flows over complex terrain at smallgeometric scales. J. Wind Eng. Ind. Aerodyn. 91, 859–1871.
Bradley, E.F., 1980. An experimental study of the profile of wind speed, shearing stressand turbulence at the crest of a large hill. Quart. J. Roy. Meteorol. Soc. 106, 101–124.
Britter, R.E., Hunt, J.C.R., Richards, K.J., 1981. Air flow over a two-dimensional hill:studies of velocity speed-up, roughness effects and turbulence. Quart. J. Roy.Meteorol. Sot 107, 91–110.
Cal, R.B., Lebr�on, J., Castillo, L., Kang, H.S., Meneveau, C., 2010. Experimental study ofthe horizontally averaged flow structure in a model wind-turbine array boundarylayer. J. Renew. Sustain. Energy 2, 013106.
Cao, S., Tamura, T., 2006. Experimental study on roughness effects on turbulent boundarylayer flow over a two-dimensional steep hill. J. Wind Eng. Ind. Aerodyn. 94, 1–19.
Cao, S., Tamura, T., 2007. Effects of roughness blocks on atmospheric boundary layerflow over a two-dimensional low hill with/without sudden roughness change.J. Wind Eng. Ind. Aerodyn. 95, 679–695.
Carpenter, P., Locke, N., 1999. Investigation of wind speeds over multiple two-dimensional hills. J. Wind Eng. Ind. Aerodyn. 83, 109–120.
Chamorro, L., Porte-Agel, F., 2009. A wind-tunnel investigation of wind-turbine wakes:boundary-layer turbulence effects. Bound.-Layer Meteorol. 132, 129–149.
Coppin, P.A., Bradley, E.F., Finnigan, J.J., 1994. Measurements of flow over an elongatedridge and its thermal stability dependence: the mean field. Bound.-Layer Meteorol.69, 173–199.
Corten, G.P., Schaak, P., Hegberg, T., 2004. Turbine Interaction in Large Offshore WindFarms: Wind Tunnel Measurements. Energy Research Centre of the Netherlands(ECN). Technical Report No. ECN-C-04–048.
Counihan, J., 1975. Adiabatic atmospheric boundary layers: a review and analysis of datafrom the period 1880–1972. Atmos. Environ. 9, 871–905.
European Committee for Standardization (CEN), 2004. Eurocode 1: Action on Structures-general Actions-part 1-4: Wind Action (European Standard).
Ferreira, A.D., Lopes, A.M.G., Viegas, D.X., Sousa, A.C.M., 1995. Experimental andnumerical simulation of flow around two-dimensional hills. J. Wind Eng. Ind.Aerodyn. 54, 173–181.
Ferreira, A.D., Silva, M.C.G., Viegas, D.X., Lopes, A.G., 1991. Wind tunnel simulation ofthe flow around two-dimensional hills. J. Wind Eng. Ind. Aerodyn. 38, 109–122.
Finnigan, J.J., Belcher, S.E., 2004. Flow over a hill covered with a plant canopy. Quart. J.Roy. Meteorol. Soc. 130, 1–29.
Flay, R.G.J., Stevenson, D.C., 1998. Integral length scales in strong winds below 20m.J. Wind Eng. Ind. Aerodyn. 28, 21–30.
Gong, W., Ibbetson, A., 1989. A wind tunnel study of turbulent flow over model hills.Bound.-Layer Meteorol. 49, 113–148.
Grant, I., Parkin, P., Wang, X., 1997. Optical vortex tracking studies of a horizontal axiswind turbine in yaw using laser-sheet, flow visualization. Exp. Fluids 23, 513–519.
Haans, W., Sant, T., van Kuik, G., van Bussel, G., 2008. HAWT near-wake aerodynamics,part I: axial flow conditions. Wind Energy 11, 245–264.
Harman, I.N., Finnigan, J.J., 2010. Flow over hills covered by a plant canopy: extension togeneralised two-dimensional topography. Bound.-Layer Meteorol. 135, 51–65.
Hu, H., Yang, Z., Sarkar, P., 2012. Dynamic wind loads and wake characteristics of a windturbine model in an atmospheric boundary layer wind. Exp. Fluids 52, 1277–1294.
Hunt, J.C.R., Leibovich, S., Richards, K.J., 1988a. Turbulent shear flows over low hills.Quart. J. Roy. Meteorol. Soc. 114, 1435–1470.
Hunt, J.C.R., Richards, K.J., Brighton, P.W.M., 1988b. Stably stratified shear flow overlow hills. Quart. J. Roy. Meteorol. Soc. 114, 859–886.
Ishihara, T., Hibi, K., Oikawa, S., 1999. A wind tunnel study of turbulent flow over athree-dimensional steep hill. J. Wind Eng. Ind. Aerodyn. 83, 95–107.
Jackson, P.S., Hunt, J.C.R., 1975. Turbulent wind flow over a low hill. Quart. J. Roy.Meteorol. Soc. 101, 929–955.
Jain, P., 2007. Wind Energy Engineering. McGraw Hill. ISBN: 978-0-07-171477-8.
394
Kaimal, J.C., Wyngaard, J., Izumi, Y., Cote, O.R., 1972. Spectral characteristics of surface-layer turbulence. Quart. J. Roy. Meteorol. Soc. 98, 563–589.
Kim, H.G., Lee, C.M., Lim, H.C., Kyong, N.H., 1997. An experimental and numerical studyon the flow over two-dimensional hills. J. Wind Eng. Ind. Aerodyn. 66, 17–33.
Lemelin, D.R., Surry, D., Davenport, A.G., 1988. Simple approximations for wind speed-up over hills. J. Wind Eng. Ind. Aerodyn. 28 (1), 117–127.
Locke, J., Valencia, U., 2004. Design Studies for Twist-coupled Wind Turbine Blades.Sandia National Laboratories. Technical Report No. SAND 2004–0522.
Lubitz, W.D., White, B.R., 2007. Wind-tunnel and field investigation of the effect of localwind direction on speed-up over hills. J. Wind Eng. Ind. Aerodyn. 95, 639–661.
Markfort, C.D., Zhang, W., Port�e-Agel, F., 2012. Turbulent flow and scalar transportthrough and over aligned and staggered wind farms. J. Turbul. 13, 1–36.
Mason, P.J., King, J.C., 1985. Measurements and predictions of flow and turbulence overan isolated hill of moderate slope. Quart. J. Roy. Meteorol. Soc. 111, 617–640.
Mason, P.J., Sykes, R.I., 1979. Flow over an isolated hill of moderate slope. Quart. J. Roy.Meteorol. Soc. 105, 383–395.
Medici, D., Alfredsson, P.H., 2006. Measurements on a wind turbine wake: 3D Effects andbluff body vortex shedding. Wind Energy 9, 219–236.
Miller, C.A., Davenport, A.G., 1998. Guidelines for the calculation of wind speed-ups incomplex terrain. J. Wind Eng. Ind. Aerodyn. 74, 189–197.
Panofsky, H.A., Dutton, J.A., 1984. Atmospheric Turbulence-models and Methods forEngineering Applications. John Wiley & Sons, New York.
Paterson, D.A., Holmes, J.D., 1993. Computation of wind flow over topography. J. WindEng. Ind. Aerodyn. 46, 471–476.
Pellegrini, C.C., Bodstein, G.C.R., 2004. The height of maximum speed-up in theatmospheric boundary layer flow over low hills. J. Braz. Soc. Mech. Sci. Eng. 26,249–259.
Politis, E.S., Prospathopoulos, J., Cabezon, D., Hansen, K.S., Chaviaropoulos, P.K.,Barthelmie, R.J., 2012. Modeling wake effects in large wind farms in complex terrain:the problem, the methods and the issues. Wind Energy 15, 161–182.
Røkenes, K., Krogstad, P., 2009. Wind tunnel simulation of terrain effects on wind farmsiting. Wind Energy 12, 391–410.
Sanderse, B., 2009. Aerodynamics of Wind Turbine Wakes: Literature Review. EnergyResearch Centre of the Netherlands (ECN). Technical Report No. ECN-E-09–016.
Somers, D.M., 2005. The S819, S820, and S821 Airfoils. National Renewable EnergyLaboratory. Technical Report No. NREL/SR-500–36334.
Taylor, P.A., Gent, P.R., 1974. A model of atmospheric boundary layer flow above anisolated two-dimensional hill: an example of flow over gentle topography. Bound.-Layer Meteorol. 7, 349–362.
Taylor, P.A., Walmsley, J.L., Salmon, J.R., 1983. A simple model of neutrally stratifiedboundary-layer flow over real terrain incorporating wavenumber-dependent scaling.Bound.-Layer Meteorol. 26, 169–189.
Tian, W., Ozbay, A., Hu, H., 2014. Effects of incoming surface wind conditions on thewake characteristics and dynamic wind loads acting on a wind turbine model. Phys.Fluids 26, 125108.
Uchida, T., Ohya, Y., 2003. Large-eddy simulation of turbulent airflow over complexterrain. J. Wind Eng. Ind. Aerodyn. 91, 219–229.
Van Binh, L., Ishihara, T., Van Phuc, P., Fujino, Y., 2008. A peak factor for non-Gaussianresponse analysis of wind turbine tower. J. Wind Eng. Ind. Aerodyn. 96, 2217–2227.
Vermeer, L.J., Sørensen, J.N., Crespo, A., 2003. Wind turbine wake aerodynamics. Prog.Aerosp. Sci. 39, 467–510.
Walmsley, J.L., Salmon, J.R., Taylor, P.A., 1982. On the application of a model ofboundary-layer flow over low hills to real terrain. Bound.-Layer Meteorol. 23, 17–46.
Weng, W., Taylor, P.A., Walmsley, J.L., 2000. Guidelines for airflow over complex terrain:model developments. J. Wind Eng. Ind. Aerodyn. 86, 169–186.
Wilson, R.E., 1994. Aerodynamic behavior of wind turbines. In: Spera, D.A. (Ed.), WindTurbine Technology: Fundamental Concepts of Wind Turbine Engineering. ASMEPress, pp. 215–282.
Ying, R., Canuto, V.M., 1997. Numerical simulation of flow over two-dimensional hillsusing a second-order turbulence closure model. Bound.-Layer Meteorol. 85, 447–474.
Yuan, W., Tian, W., Ozbay, A., Hu, H., 2014. An experimental study on the effects ofrelative rotation direction on the wake interferences among tandem wind turbines.Sci. China Phys. Mech. Astron 57, 935–949.
Zhou, Y., Kareem, A., 2002. Definition of wind profiles in ASCE 7. J. Struct. Eng. 128,1082–1086.