journalof applied physiology in u.s.a. effect of inspired ... · exercise in 21 mm hg pi coz...
TRANSCRIPT

JOURNALOF APPLIED PHYSIOLOGY
Vol. 28, No. 5, May 1970. P,inted in U.S.A.
Effect of inspired PCO, up to 30 mm Hg on
response of normal man to exercise
STUART J. MENN, RICHARD D. SINCLAIR, AND B. E. WELCH
Sealed Environment Branch, Environmental Systems Division, US Air Force School of AeroJ/mce M&ii~e, Brooks Air Force Base, Texas 7823.5
MENN, STUART J., RICHARD D. SINCLAIR, AND B. E. WELCH.
Effect of inspired Pco2 up to 30 mm Hg on response of normal man to
exercise. J. Appl. Physiol. 28(5) : 663-671. 1970.-Trained
volunteers performed steady-state moderate exercise (s maximum
002) rind heavy excrcisc ( 54 maximum &) in 0, 8, 15, 2 1, and ,
30 mm Hg PIED, for 30 min on a bicycle ergometer. At CO* levels
of 8 and 15 mm Hg, no difficulty was encountered by the subjects.
The higher levels of hypercapnia caused some respiratory symp-
toms of “air hunger” (dyspnea) and intercostal muscle pain, but
were of mild enough degree to permit all subjects to complete
the exercise. Incremental exercise up to work loads producing
maximum voz were also performed. The tolerance to maximum
exercise in 21 mm Hg PI coz resembled that at x work load in 30
mm Hg P~qo,. VE during maximum exercise did not vary with
the level of inspired COS, whereas at submaximal work loads,
9~ increased as PICO, increased. At s and maximum work loads,
ho:! during exercise fell progressively with increasing Prco,. The
ineffective CO2 removal was accompanied by a decreased alveolar-
inspired CO2 gradient with increasing PICO,. Inadequate elimina-
tion of CO2 caused respiratory acidosis to be superimposed on the metabolic acidosis normally present during exercise.
hypercapnia; carbon
acid-base balance dioxide; respiration; CO2 tolerance; work/
SPACE AND UNDERSEA EXPLORATIOX have placed man in sealed environmental situations which require highly effi- cient gaseous control systems. With the ever-present possi- bility of malfunction of the system for CO2 removal, it is imperative to know the extent of man’s tolerance and adap- tability to increased partial pressures of this gas. Consider- able effort has been directed to the study of physiological adjustments of resting man to acute and chronic exposure to increased CO2 levels (5, 14, 15, 25, 26, 32, 33) and a con- cept of maximum limits is emerging. However, little is known about interaction of the combined stressors of exer- cise and hypercapnia. Previous studies of these combined stressors have focused primarily upon ventilation effects
(2, 8, 13, 17). Quantitative measurements of gas exchange in the lungs and resulting balance are not available.
effects on arterial acid-base
The following experiment was designed to obtain such quantitative data during steady-state and exhaustive exer- cise in 0, 8, 15, 2 1, and 30 mm Hg inspired carbon dioxide
(Pko2); PIco2 = (PB - 47h02 l
METHODS
Eight US Air Force airmen between 18 and 2 1 years of age and in excellent physical condition served as volunteers for the experiment. A 3.6 x 3.6 x 2.4 m environmental room equipped with a control system for inspired 02 (PI,~),
PI co:! 7 and temperature was used. Oxygen and carbon di- oxide were continuously monitored with a Beckman model F-3 paramagnetic analyzer and a Beckman LB-l infrared analyzer, respectively. Both analyzers were calibrated with gases which had been cross-checked for accuracy by Scho- lander and gas chromatographic techniques. Barometric pressure was monitored by a Wallace and Tiernan absolute pressure gauge, and water vapor was measured by a Cam- bridge dew point hygrometer. A window air conditioner was used for temperature control.
The desired atmosphere composition was established early each morning and maintained throughout the day or changed to a second CO2 level following the morning ex- periments. Approximately 1 hr was required for the stabili- zation of a new atmosphere. Subjects and investigators entered the environmental room through a 1 .O x 1.5 x 2.4 m transfer lock which prevented disturbance of the internal environments.
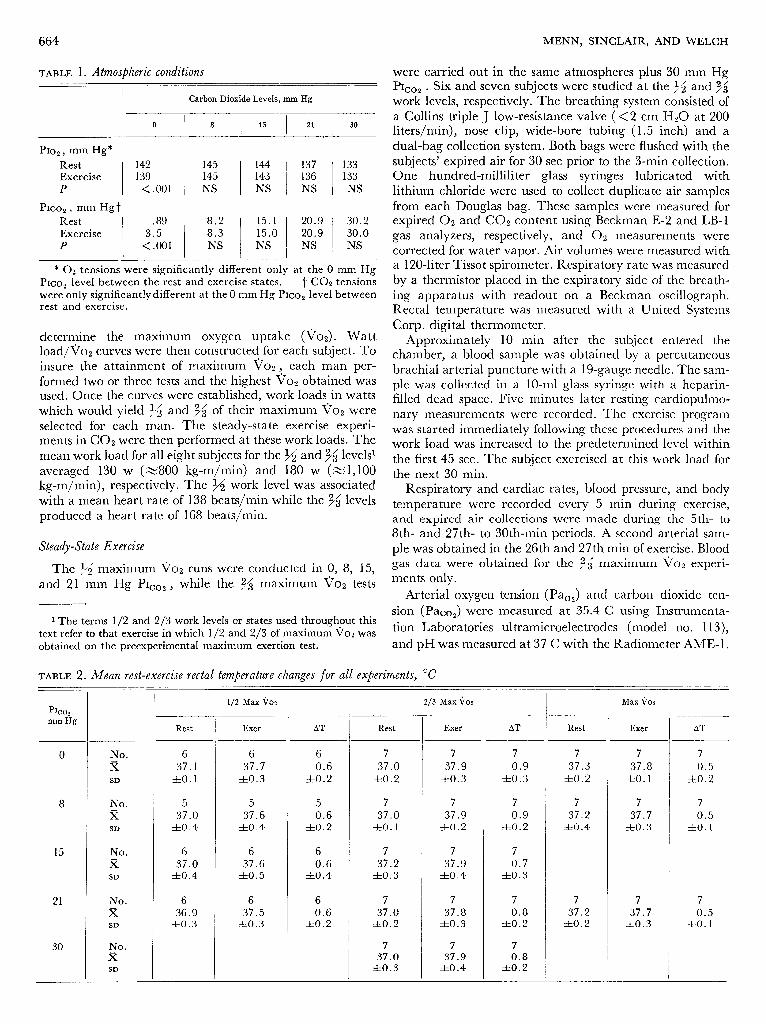
In Table 1, the data show the mean resting (time 0) and exercise (time 30 min) 02 and CO2 inspired partial pres- sures for all phases of the study. There was a significant dif- ference between rest and exercise in the chamber 02 and CO2 atmosphere only for the 0 mm Hg P1e02 studies. Com- parison of the atmosphere for the various exercise levels re- vealed no significant differences. The Pro2 was reduced at the higher CO2 levels in an attempt to prevent the increase in alveolar 02 tension caused by hypercapnic hyperventila- tion. Room temperature was held at 68-72 F, and the rela- tive humidity ranged between 65 and 85 cio.
Experimental Projle
On completion of preliminary medical evaluation studies, the subjects began a 14-day exercise training program using a Collins bicycle ergometer. Following this conditioning period, each subject performed maximum exertion tests on the ergometer which consisted of stepwise increases in work load of 10 w every 3 min, starting at 120 w while maintain- ing a constant pedal speed of 60 rpm. Respiratory rate and expired air collection were taken at various work loads to
663
664 MENN, SINCLAIR, AND WELCH
TABLE 1. Atmospheric conditions
Carbon Dioxide Levels, mm Hg
0 8 15 21 30
PI02 9 mm Hg*
20.9 30.2 20.9 30.0 NS NS
* 02 tensions were significantly different only at the 0 mm Hg PICO~ level between the rest and exercise states. “f CO2 tensions
were only significantly different at the 0 mm Hg P1c02 level between rest and exercise.
determine the maximum oxygen uptake (voz). Watt load/To* curves were then constructed for each subject. To insure the attainment of maximum Tjoz , each man per- formed two or three tests and the highest voz obtained was used. Once the curves were established, work loads in watts which would yield s and /3 o 2’ f their maximum voz were
selected for each man. The steady-state exercise experi- ments in CO2 were then performed at these work loads. The mean work load for all eight subjects for the x and $3’ levels1 averaged 130 w (~800 kg-m/min) and 180 w (Z 1,100 kg-m/min), respectively. The 45 work level was associated with a mean heart rate of 138 beats/min while the 36 levels produced a heart rate of 168 beats/mm.
Steady-State Exercise
were carried out in the same atmospheres plus 30 mm Hg
PIco2 - Six and seven subjects were studied at the x and 33’ work levels, respectively. The breathing system consisted of a Collins triple J low-resistance valve ( < 2 cm Hz0 at 200 liters/min), nose clip, wide-bore tubing ( 1.5 inch) and a dual-bag collection system. Both bags were flushed with the subjects’ expired air for 30 set prior to the 3-min collection. One hundred-milliliter glass syringes lubricated with lithium chloride were used to collect duplicate air samples from each Douglas bag. These samples were measured for expired 02 and CO2 content using Beckman E-Z and LB-l gas analyzers, respectively, and 02 measurements were corrected for water vapor. Air volumes were measured with a 120-liter Tissot spirometer. Respiratory rate was measured by a thermistor placed in the expiratory side of the breath- ing apparatus with readout on a Beckman oscillograph. Rectal temperature was measured with a United Systems Corp. digital thermometer.
Approximately 10 min after the subject entered the chamber, a blood sample was obtained by a percutaneous brachial arterial puncture with a 19-gauge needle. The sam- ple was collected in a lo-ml glass syringe with a heparin- filled dead space. Five minutes later resting cardiopulmo- nary measurements were recorded. The exercise program was started immediately following these procedures and the work load was increased to the predetermined level within the first 45 sec. The subject exercised at this work load for the next 30 min.
Respiratory and cardiac rates, blood pressure, and body temperature were recorded every 5 min during exercise, and expired air collections were made during the 5th- to 8th- and 27th- to 30th-min periods. A second arterial sam- ple was obtained in the 26th and 27th min of exercise. Blood
The x maximum \jo2 runS were conducted in 0, 8, 15, gas data ,were obtained for the 96 maxinlum ~OS experi-
and 2 1. mm Hg P1c02 , while the 35 maximum voz tests ments only.
Arterial oxygen tension (Pao2) and carbon dioxide ten-
1 The terms l/2 and Z/3 work levels or states used throughout this sion (Paoo,) were measured at 35.4 C using Instrumenta-
text refer to that exercise in which l/2 and Z/3 of maximum vo2 was tion Laboratories ultramicroelectrodes (model no. 113),
obtained on the preexperimental maximum exertion test. and pH was measured at 37 C with the Radiometer AME- 1.
TABLE 2. Mean ?-eSt-e.%eKiSe rectal temperature changes for all experiments, “c
PICO:! , mm Hg
8
15
21
30
No. 6 6 6 7 7 7
x 37.1 37.7 0.6 37.0 37.9 0.9
SD zfro.1 hO.3 zto.2 zto.2 zlzo.3 rto.3
No. x
SD
r
3;.0 hO.4
3G.6 zto.4
5 7 7 7 0.6 37.0 37.9 0.9
zto.2 zto.1 *0.2 rto.2
No. 6 6 6 7 7 7
x 37.0 37.6 0.6 37.2 37.9 0.7
SD zto.4 zto.5 zto.4 rto.3 zto.4 *0.3
No. 6 6 6
x 36.9 37.5 0.6
SD zto.3 zko.3 zto.2
7 37.0
zto.2
7 37.0
Ito.
7 7 7 7 37.8 0.8 37.2 37.7
zto.3 zto.2 hO.2 zto.3
No. x
SD
7 7 37.9 0.8
zto.4 hO.2
Rest Exer
l/2 Max Vo2 2/3 Max Qo:! Max \~OZ -
_ - AT Rest Exer AT Rest Exer
- . 7 7
37.3 37.8 zto.2 zko. 1
7 7 37.2 37.7
zto.4 Ito.
- . AT

EXERCISE DURING ACUTE HYPERCAPNIA 665
Blood gas and pH results were corrected to the subject’s ret tal temperature recorded at the time of arterial blood
rise in crease
VE with in both
different exercise respiratory rate
load and
s was due to tidal volume
an in-
(VT), sampling, and all cited measurements refer to the tempera- while the rise related to PI co2 reflects chiefly VT changes. ture-corrected values. Table 2 lists the mean resting and VE did not significantly change between the 10th and the
end-exercise rectal temperatures for all experiments.
Maximum Exercise Tests
The eight subjects also participated in maximum exertion tests in 0, 8, and 2 1 mm Hg P1coz to determine the effect of hypercapnia on maximum work performance.2 The profile of these maximum runs involved starting at 50 w, while maintaining a steady pedal speed of 60 rpm, and then increasing the work load by 15 w each minute until exhaus- tion occurred. Heart rate, respiratory rate, VE, Vcoz , and Vo:! were obtained during these studies. TE was measured over a 45-set period after 15 set of adjustment to each in- crease in watt load. Collections occurred at rest, 95 w, 125 w, 155 w, and at work loads near maximum Tj02 .
RESULTS
30th min in seven of the nine exercise conditions, but did crease slightly during the 34 exercise in 8 and 30 mm
PIco2 l _
.
;;,
PO,, h02, R. At the 34 and 35 exercise levels, the Vo2 did not vary significantly with the CO2 atmospheres (Table 4). Respiratory exchange of CO2 (Vco2) did decrease sig- nificantly from 2.43 liters/min (STPD) to 1.84 liters/min
as PICOZ increased from 0 to 30 mm Hg at the 95 exercise level. Paralleling the Vco, results, the respiratory exchange ratio fell from .95 to .72 at the 35 exercise level. In seven of the nine conditions, a steady state was reached for Vo2 and Vco, .
Pulse rate and rectal temperature. Resting and exercise pulse
rates at both the g and 35 work levels did not change with PI COa . The mean pulse rates wcrc 70.4 =t 3.6 (rest), 139.3 -J= 2.9 (g level), and 166.0 & 2.0 (y$ level). Rectal tempera- ture also showed no variation with the different levels of
General Observations
mum exercise runs at all CO2 level-work load combinations tested. NO difficulty was noticed by the subjects exercising
The subjects completed all 30-min steady-state and maxi-
lower P1coz tensions.
at any work level below 21 mm Hg P1cOa . However, at the 21 m m Hg level and above, there were noticeable respira-
At 30 mm Hg PIVOT,
tory symptoms during exercise at 36 maximum and maxi-
six of the seven subjects experi-
mum V02, and the subjects were well aware of their in- crcascd ventilation. Intercostal muscle pain occurred in two of eight subjects during the maximum exercise run in 2 1 mm Hg PIED,, . Three other subjects experienced dyspnea during the maximum exertion studies. The subjects stated that the chest pain and dyspnea were the subjective factors termi- nating exercise rather than muscle fatigue noted at the
hypercapnia, but did increase an average of 0.3 C between
Table 5. The delta values refer to -changes between the
34 and 33’ levels of exercise (Table 2).
exercise and rest measurements at each PIED, level. Arterial
Acid-base changes. Results of blood gas data are shown in
Pco2 increased during exercise from the resting value in the 15, 2 1, and 30 mm Hg P1coz environment. Analysis of vari- ance showed that the difference between exercising and
Paoz did not show a linear trend with P1c02 . hTo arterial
resting Pacoz
desaturation (Sa
increased significantly with elevation of
PICO, l The ApH increased linearly with increasing P1c02 .
This occurred because the exercise arterial pH dropped to a greater extent than the resting pH levels with increasing
ho2 l Calculated bicarbonate declined during exercise in
all Prco2 atmospheres but this fall did not follow a linear trend. While resting Pao2 increased progressively, exercise
enced mild to moderate frontal headaches. These varied o2 < 95 %) occurred at any P1c02 level in
rest or exercise. considerably in onset and duration and occurred usually in the final minutes of the exercise run and disappeared Maximum Exercise Runs within 1 hr after exposure.
The appearance of ectopic foci on the precordial ECG Only Go2 and R changed significantly during maximum
was seen in four of eight subjects on nine different occasions. exercise in the Plco2 levels employed (Table 6). These two
In all cases but one (a premature atria1 contraction), these parameters decreased as the level of P1c02 increased. VE
foci originated from below the A-V node. These premature during maximum Vo2 did not change with increasing P1002 .
ventricular contractions (PVC’s) varied in frequency from This was in marked contrast to that VE at 155 w (zg max
3/min to a trigeminy rhythm alternating with two sinus v02) which was 19.7 liters higher in 2 1 mm Hg P1c02 than
beats. The incidence of occurrence of PVC’s was not re- in air (see Tab1e 7)* lated to the level of exercise or the inspired CO2 environ- ments. In no case did the subjects complain of cardiovascu- DISCUSSION
lar symptoms. General Observations
Steady-State Studies Headaches have occurred in acute and chronic hyper-
ventilation. For any given inspired Co2 tension, the VE caPnia studies (5, 7, 2% 27, 33) with varying frequency, de-
was greater for the 93’ exercise level than for the x level. pendent on the level of P1c02 . Glatte et al. (14) reported
The results in Table 3 show that at rest, the g, or the 95 occurrence in four of seven subjects exposed to 2 1 mm Hg
state, J?E significantly increased with P1c02 elevation. The ploo~ for 5 days and in six of seven subjects exposed to 30 mm Hg PIVOT environment for the same period. These occurred
2 M ax i 117 urn work performance was judged by total exhaustion and all cases Wa .s associated with plateauing of the heart rate greater in
than 190 beats/min.
in the first 24 hr of exposure and disappeared by the second day in CO2. The headaches were of a throbbing nature and were aggravated by the recumbent position and the

666 MENN, SINCLAIR, AND WELCH
TABLE 3. VentdatiOn u0hme.S - -
Subj
130 131 132 133 134 135 136
x SD
130 131 132
133 134 135 136
x SD
130 131 132 133 134 135
136
x SD
130 131 132 133 134 135 136
x SD
130 131 132 133
134 135
136
x SD
No. of subj
PIco2 9 mm Hg
0
8
15
21
VE, liters/min BTPS VT, liters BTPS
Rest $5 % Rest $5 % Rest
14.3 9.4
12.1 10.5
9.1 7.0 7.0
64.0 58.5 69.1
59.7 47.6 43.5
78.8 0.84 73.0 0.45 80.0 0.86 86.2 0.75 65.2 0.51 70.4 0.54 75.0 0.37
2.13 1.77 1.77 2.49 1.98
2.07
2.63 17 1.74 21 2.05 14 2.39 14
2.10 18
2.93 13 2.21 19
30 33 39 24 24 21
30 42 39 36 31 24 34
9.9 zt2.7
57.1 zt9.8
59.7
57.1 60.6 62.3 55.4
75.5 0.62 3x6.9 rfio.20
2.04 ho.27
1.99
1.37 2.02 1.60 2.05
2.29 zto.40
16.6 zk3.0
33.7
zt6.0
11.0 12.7 10.0 11.2 13.6 10.0 11.2
89.6 0.58 70.3 0.64 79.0 0.59 83.8 0.59 75.5 0.80 62.3 0.71 90.0 0.56
2.72 19 2.13 20 2.19 17 2.15 19 1.94 17 2.60 14 1.88 20
28.5 zt6.8
30
33 30 39 27
33
33 36
39 39 24 48
11.4 *I .3
59.0* zt2.8
73.5 66.9 60.3 78.0 74.5 51.4
78.6 0.64 zt10.2 rto.90
87.6 0.74 84.5 1 .Ol 84.3 0.77 73.9 0.69 70.5 0.64 67.8 0.82 95.8 0.76
1.81* hO.30
2.72 2.03 1.55
1.86 2.07 2.14
2.23 18.0 ho.32 zt2.2
36.0 xk7.3
15.5 17.1 13.9 11.8 11.6 10.7 15.1
2.65 21 2.22 17 2.48 18 2.11 17 1.81 18 2.61 13 2.13 20
31.8* zk4.5
27 33 39 42 36 24
33 38 34 35 39 26 45
13.7 zt2.4
2.29 17.7 zto.31 zt2.6
35.7 3z5.9
12.4 15.5 12.5 12.5
12.5 14.0 10.0
67.4 *lo. 1
84.6 78.0 72.7 85.7
67.0 46.0
80.6 0.78 zk10.2 *o. 12
99.1 0.59 75.3 0.78 85.1 0.69 92.6 0.78 92.2 1.25 83.1 1.08 80.7 0.48
2.06 zto.39
2.56 2.60 2.20 2.38 2.23 1.92
3.00 21 2.28 20 2.03 18 2.57 16 2.36 10 3.61 13 1.79 21
33.5 zt6.9
33 30
33 36 30 24
33 33 42 36
39 23 45
12.8 72.3 86.9 0.81 2.32 2.52 17.0 31 .o 35.9 h1.7 zt14.7 zk8.2 ho.27 ho.25 zt0.62 zt4.2 zk4.1 zt7.2
21.5 90.5 0.90 2.51 24 36 24.1 85.5 1.42 2.38 17 36 24.5 107.2 1.11 2.75 22 39 23.4 109.5 1.30 2.81 18 39 25.0 100.8 1.39 2.40 18 42 24.3 104.3 1.62 3.48 15 30 26.4 126.1 1.06 2.47 25 51
24.2 zt1.5
1.26 2.69 ztO.25 zfio.39
< .025 NS < .025
19.9 zt3.8
NS
39.0 zt6.5
< .OOl
7
NS NS
6
103.4 zt13.3
< .OOl
7
< .OOl
7 6 7 7 6 7 -
Respiratory Rate -
* These means are based on statistical estimates for subject 1.31.
of variance.
t P values refer to significance of trend relating to PICO~ by analysis
Valsalva maneuver.They may have been caused by cerebral curred at the 30 mm Hg Prcoz level only, but they did not vascular dilation which occurs during exposure to increased appear or disappear in any pattern. In no case were they PICKS (23). In the present study, the added factor of exercise severe enough to interfere with the subjects’ performance of and sudden, rather than gradual, exposure to CO2 may exercise. have modified the headache pattern. The headaches oc- Premature ventricular contractions (PVC’s) have not

EXERCISE DURING ACUTE HYPERCAPNIA
TABLE 4. Oxygen and carbon dioxide exchange
667
Subj PICO 2 9 -Hg
90, , liters/min STPD ~COIL , liters/min STPD Respiratory Exchange Ratio .
130 131
132 133 134 135 136
0 1.965 2.087 2.087 2.186 1.740 2.045
2.516 2.579 2.462 2.522 2.594 2.825 2.466
1.723 1.849 1.736 2.039 1.613 1.625
x 2.018 2.566
SD zko. 154 *o. 125
130 131 132 133 134 135 136
8 1.835
1.984 2.034
1.934 2.049
2.871 2.517 2.495 2.470 2.377
2.151 2.448
1.764 zkO.160
1.574
1.533 1.913 1.647
1.931
x 1.967* 2.476
SD ztO.087 ztO.214
130 131 132 133 134 135 136
15 2.082 1.981 2.053 2.140 2.460 1.920
2.287 2.920 2.566 2.145 2.356 2.410 2.242
1.720” =tO. 189
1.848 1.770 1.708 1.996 2.551
1.803
x 2.106 2.418
SD *o. 190 rt0.258
130 131 132 133 134 135 136
21 1.905 1.991 1.851 2.126 2.096 1.579
2.574 2.653 2.543 2.745 2.710 2.616 2.266
1.946 ztO.312
1.705 1.884 1.431 1.628 1.857 1.420
x 1.925 2.587 1.654
SD rto. 200 SfiO. 158 zto.201
130 131 132 133 134 135 136
30 2.228 2.486 2.615 2.423 2.675 2.839 2.636
x 2.557
SD ho.198
pt NS NS NS
* These means are based on statistical estimates for subject 131. of variance.
been reported during hypercapnic studies in resting man ectopic foci and since the incidence of PVC’s was not re-
with the PICKS below 35 mm Hg (14, 27). Brackett et al. (5) lated solely to the hypercapnic environment, it is likely that
observed no ECG changes in men exposed to 42 mm Hg these ectopic beats were exercise induced. PVC’s are a fre-
PICOZ l
Other acute studies at P1coz levels over 60 mm Hg quent finding in normal men during exercise, and at the
have resulted in the occurrence of PVC’s (24, 27). All these US Air Force School of Aerospace Medicine the incidence
studies, however, involved man in a resting situation. Since among apparently healthy pilots is over 30 % (personal one subject contributed to five of the nine incidents of communication) .
. - 2.707 2.454 2.270 2.438 2.413 2.669 2.060
.88
.89
.83
.93
.93
.79
1.08 .95 .92 .97 .93 .94 .84
2.430 ztO.223
0.95 zto.07
2.402 2.164 2.185 2.485 2.335 2.155 2.209
0.88 ho.06
.86
l 77 .94 .85 .94
.84
.86
.88 1.00
.98 1.00
.90
2.276 zto. 131
J37* zto.07
.89
.89
.83
.93 1.04
.94
.92 zto.o’i
1.943 2.680 1.634 2.054 2.022
2.121 1.933
.85
.92
.63
.96
.86
.88
.86
2.057 zto.319
.92 rto.07
.90
.95
.77
.77
.89
.90
.85 zto.11
2.161 1.906 2.243 2.378 2.142 2.050 1.950
.84
.72
.88
.87
.79
.78
.86
2.119 0.86 .82 ho.165 rtO.08 ztO.06
1.668 .75 1.785 .72 1.812 .69 1.827 .75 1.929 .72 2.068 .73 1.799 .68
1.841 .72 &O. 126 zlzo.03
< .OOl NS < .OOl
. -
- t P values refer to significance of trend relating to PICO~ by analysis

668 MENN, SINCLAIR, AND WELCH
TABLE 5. Mean rest-exercise blood gas changes
Calculated HC03 , mEq/liter
Po2, mm Hg Pc02, mm Hg PH AHC03,
Z’ APo2,
mm Hg Subj APco2,
mm Hg
Rest Exer Rest Exer Rest Exer Rest Exer . .
130 131 132 133 134 135 136
0 93.1 94.6 +1.5 38.5 35.4 -3.1 7.388 7.324 - .064 22.5 17.8 -4.7 88.4 84.8 -3.6 51.9 45.9 -6.0 7.398 7.344 - .054 31 .o 24.2 -6.8 98.7 96.2 -2.5 37.5 37.4 -0.1 7.399 7.356 - .033 22.5 20.3 -2.2
108.8 94.3 -14.5 34.5 36.9 +2.4 7.385 7.310 - .075 20.0 18.0 -2.0 97.2 99.8 +2.6 36.8 37.8 +1.0 7.385 7.390 + .005 21.3 22.2 +1.9 86.4 95.9 +9.5 42.7 39.5 -3.2 7.373 7.341 - .032 24.1 20.7 -3.4 91.8 90.6 -1.2 38.3 39.6 +1.3 7.397 7.311 - .086 22.8 19.4 -3.4
x 94.9 93.7 -1.2 40.0 38.9 -1.1 7.389 7.339 - .048 23.5 20.4 -2.9
SD zk7.5 zk4.8 zt7.3 zt5.8 zt3.4 rt3.1 * .Ol It .028 zt .031 zk3.6 zt2.3 It2.7
p-t NS NS < .Ol
130 131 132 133 134 135 136
8 108.7 110.4 -+I.7 40.3 37.4 -2.9 7.378 7.270 - .106 23.0 16.6 -6.4 98.6 100.8 +2.2 40.2 39.5 -0.7 7.389 7.341 - .045 23.5 20.7 -2.8
105.6 104.2 -1.4 38.6 44.3 j-5.7 7.401 7.319 - .082 23.2 22.1 -1.1 98.4 101.5 +3.1 42.7 43.7 +1 .o 7.374 7.339 - .035 24.2 22.8 -1.4
103.1 98.0 -5.1 37.9 44.2 +6.3 7.371 7.320 - .051 21.3 22.1 +0.8 98.3 99.5 +1.2 42.3 39.7 -2.6 7.360 7.322 - .038 23.2 19.9 -3.3
103.1 114.7 +11.6 40.2 36.7 -3.5 7.392 7.359 - .033 23.7 20.1 -3.6
x 102.3 104.2 +1.9 40.3 40.8 j-.47 7.381 7.324 - .056 23.2 20.6 -2.5
SD rt4.0 zt6.2 zt5.1 zk1.8 zt3.3 rt4.1 Zt.01 zt .028 zt .028 dzo.9 Ik2.0 zt2.3
pt NS NS < .Ol
130 131 132 133 134 135 136
15 116.7 118.9 +2.2 47.1 ~ 47.2 +0.1 7.347 96.5 84.2 -12.3 41.3 52.0 +10.7 7.371
102.9 99.4 -3.5 37.3 45.1 -j-7.8 7.348 107.8 103.6 -4.2 46.3 49.4 +3.1 7.348 109.7 104.2 -5.5 43.5 50.0 +6.5 7.367 116.3 110.5 -5.8 46.7 50.2 +3.5 7.360 116.7 101.9 - 14.8 40.6 40.5 -0.1 7.406
7.326 - .021 25.0 23.9 -1.1 7.263 -.108 23.2 22.8 -0.4 7.277 - .071 19.9 20.4 +0.5 7.301 - .047 24.7 23.6 -1.1 7.316 - .051 24.2 24.7 +0.5 7.320 - .040 25.6 25.1 -0.5 7.318 - .088 24.7 20.1 -4.6
x SD
109.5 103.2 -6.3 43.3 47.8 +4.5 7.364 zk7.8 HO.6 zt5.7 zt3.7 zt3.9 zt4.0 zk.02
7.303 - .061 23.9 22.9 -1.0 AZ .024 * ,030 zkl.9 zt2.0 zt1.7
pt .05 > P > .02 .05 > P > .02 < -01
130 131 132 133 134 135 136
21 110.2 105.2 -5.0 105.4 95.6 -9.8 108.0 97.3 -10.7 113.1 103.0 -10.1 112.2 101.5 -10.7
111.3 102.6 -8.7
117.9 106.4 -11.5
111.2 -9.5
zk4.0 It2.2
42.8 48.6 +5.8 7.375 45.2 55.3 +10.1 7.382 41.2 51.1 +9.9 7.384 39.4 49.7 +10.3 7.367 41.9 53.8 +11.9 7.371 45.4 52.4 +7.0 7.367
44.3 49.3 +5.0 7.387
7.266 -.109 24.3 21.4 -2.9 7.278 -.104 26.0 25.1 -0.9 7.250 -.134 23.8 21.7 -2.1 7.308 - .059 21.9 24.2 +2.3 7.279 - .092 23.8 24.4 +0.6 7.286 - .081 25.6 24.4 -1.2 7.285 - .102 25.8 22.7 -3.1
x* SD
42.9 +8.6 h2.2 ~z2.6
7.376
*.Ol
7.279 - .097 24.4 23.4 -1.0
* .Ol & .028 ztl.7 &l .6 *2 .o
pt < .Ol
130 131 132 133 134 135 136
30 110.2 104.9 -5.3 46.4 57.2 +10.8 7.338 106.6 95.6 -11 .o 47.3 57.0 +9.7 7.364 113.3 107.4 -5.9 45.2 54.3 +9.1 7.337 118.2 104.4 -13.8 45.0 59.0 +14.0 7.353 115.7 104.6 -11.1 47.3 61.6 +14.3 7.346 120.8 104.9 -15.9 47.8 58.4 +10.6 7.359 117.8 119.7 +1.9 42.9 48.7 f-5.8 7.390
7.249 - .089 24.2 24.3 +0.1 7.291 - ,073 26.1 26.6 t-o.5 7.222 -.115 23.5 21.6 -1.9 7.262 - .091 24.2 25.8 +1.6 7.179 - .167 25.1 22.2 -2.9
7.249 -.lOO 26.1 24.8 -1.3
7.210 - .180 25.2 18.9 -6.3
x 114.7 SD zk5.0
7.237 -.116 24.9 23.5 -1.5 * .037 It .04-l rtl .o zk2.7 rt2.6
PF
ps
105.9
z.fI7.1
< .Ol
-8.7 46.0 56.6 +10.6 7.355 rfr6.1 rt1.7 zk4.1 zt2.9 I+.02
< .Ol < .Ol
< .OOl 1
< .Ol < .Ol < ,025 < .OOl I
< .OOl < .OOl < .OOl I < .005
* Mean based on estimated values for subject 134 and subject 13.5. t Significance of rest-exercise change (paired observation t test). $ Significance of variation with P1c02 (analysis of variance).

EXERCISE DURING ACUTE HYPERG4PNIA 669
TABLE 6. bfnximum exercise runs
Subj PIco2 ) mm Hg
kg-m/min VE Resp Rate Pulse Rate Max ii02 ho2 R kcal/hr
. -
130 131 132 133 134 135 136 137
0 2,233 143.9 48 192 3.627 3.604 .99 1,088 1,957 90.3 45 192 2.917 3.432 1.25 875 1,957 143.8 54 189 3.593 3.419 .95 1,078 1,866 144.8 51 198 3.374 3.811 1.13 1,012 2,141 147.5 51 180 3.567 4.241 1.19 1,070 2,416 163.0 51 201 4.395 4.688 1.07 1,319 2,019 152.5 65 195 3.486 3.755 1.08 1,046 1,866 110.9 33 195 3.358 3.775 1.12 1,007
x 2,057 137.1 49.8 192.8 3.540 3.841 1.10 1,062 SD ztl93 zk24.0 st9.0 zk6.4 *o .413 rto ,430 *o. 10 Al24
130 131 132 133
134 135 136 137
8 2,141 159.3 48 192 3.422 3.675 1.07 1,027 2,141 117.5 36 195 4.103 4.368 1.06 1,231 2,141 140.0 51 189 3.330 3.632 1.09 999 1,866 134.2 48 204 3.503 3.738 1.07 1,051 1,866 136.8 48 173 3.680 3.928 1.07 1,104 2,233 152.6 48 204 4.266 4.139 .97 1,280 1,957 156.3 60 195 3.207 3.541 1.10 962 1,988 133.9 42 195 3.689 3.643 .99 1,107
x 2,042 141.3 47.6 193.4 3.650 3.833 1.05 1,095 SD zt 140 xtl4.0 zt6.9 dz9.8 rto.370 ho.289 zto.05 Ml1
130 131
132 133 134 135 136 137
21 2,049 169.1 48 192 3.436 3.308 .96 1,031 2,049 119.6 36 192 3.451 3.583 1.04 1,035 1,957 144.7 51 192 3.511 3.368 .96 1,053 2,049 146.8 45 195 3.440 3.380 .98 1,032 1,682 125.9 54 177 3.123 3.073 .98 937 2,141 156.0 48 192 3.807 3.589 .94 1,142 1,774 149.1 60 195 3.186 3.448 1.08 956 1,774 117.4 36 192 3.047 2.882 .95 914
x SD
P*
1,934 141.1 47.3 190.9 3.375 3.329 .99 1,013 *168 ztl8.4 rt8.3 5.8 &O .247 3~0.244 zto.05 *74
NS NS NS NS NS < .005 < .025
No. of subj 8 8 8 8 8 8 8
- -
* P values refer to significance of trend relating to PICO~ by analysis of variance.
Ven tilu t ion Studies
Ventilation limitations may have altered the work ca- pacity of the subjects and led to physiologic abnormalities. During maximum work runs when minute ventilation ex- ceeded 130 liters/min [~70% of maximum voluntary ventilation (MVV)], the subjects experienced intercostal muscle pain and dyspnea only when the ~~~~~ was at 21 mm Hg. Although the same level of ventilation was reached in 0 and 8 mm Hg PICO~ , respiratory distress did not occur
and generalized fatigue was the determining factor in end- ing these runs. It appears that an increase in PacOz rather than the magnitude of ventilation was the major cause of the subjective feeling of respiratory embarrassment. This was suggested by the observation that exercise at 93/ maxi- mum Voz in 30 mm Hg P1coz was accompanied by com- plaints of dyspnea on two occasions even though VE was only 50 % of MVV. Dripps et al. (9) reported the observa- tion that several of his subjects having VE greater than 100 liters/min while breathing ambient air insisted that they
had no dyspnea. The significant increase in VE during exercise with hyper-
capnia was not surprising and has been reported by others
(l-3, 8, 13, 16). V E’S 10 times resting ambient levels were successfully maintained for the entire 30-min exercise period at the x workload in 30 mm Hg Plcoz . While this VE is only 50 % of the subjects’ MVV, it should be remem- bered that the MVV test usually is performed only over a 20-set period. Freedman ( 12) has stated that after 4 min of hyperventilation, the maximum VE is only 61% of the 15-set MVV. In a recent study on MVV during exercise, Shephard (29) reported that while working at 80 % of aerobic work capacity and simultaneously undergoing hypercapnic hyperventilation of 2 % CO2 , men could at- tain only 80, 74, and 75 % of MVV in the 5th, 1 Oth, and 15th min of exercise, respectively. In addition, the me- chanics of breathing while exercising on a bicycle have been found to be altered from the normal situation, even if the exercise is carried out in an ambient air environment ( 16). Dripps (9) reported that his subjects could reach only 66 %
of their MVV while performing strenuous muscular exercise
on a stationary bicycle. How these findings are affected by
the added stress of hypercapnia is not known, but it ap-
pears that some limitation to further VT increases to achieve
adequate ventilation was present in our subjects during the

670 MENN, SINCLAIR, AND WELCH
TABLE 7. Submaximum and maximum VE comparison during maximum exercise testing
- -
Subj 0 21
130 51.1 89.4 131 23.4 60.4 132 54.0* 83.0
133 57.4 62.0* 134 47.4 58.2 135 46.6 50.5 136 58.9 72.3 137 35.9 56.4
x 46.8 66.5
SD zkll.9 zt13.7
P < .Ol I
. yz MaxV02 Max902
143.9 169.1 90.3 119.6
143.8 144.7 144.8 146.8 147.5 125.9
163.0 156.0
152.5 149.1 110.9 117.4
137.1 141.1
zt24.0 ztl8.4
21
NS
Estimated values from subjects’ %/watt load curve.
95 exercise level in 30 mm Hg P1coz and maximum exercise in 21 mm Hg P1c02 . This limitation may have contributed to the decreases in vco:! observed.
CO2 Exchange
The observed fall in CO2 respiratory exchange (%o,) with progressive increase in inspired CO2 levels suggests a retention of CO2 resulting in the buildup of body stores. Since the respiratory system is the primary route for CO2 excretion, a buildup in stores may represent a failure of fully adequate ventilation. A decrease in %oz in the face of a constant vo2 and rising PacOz does not suggest the possibility of a drop in CO2 production by the tissues but points to a reduction in the amount which leaves the body. The explanation of why a higher level of ventilation at F$ maximum J?oz ( 100 liters/min) in 30 mm Hg P1coz would be inadequate to prevent CO2 retention while a lower ventilation (75 liters/min) in ambient air would be fully adequate, may be found if the alveolar-inspired gradient for CO2 is examined. In the ambient atmosphere which contains .03 70 CO2 , the lungs operate under a 38-42 mm Hg Pcos alveolar-inspired gradient. ~~~~~ is dependent on CO8 production, alveolar ventilation (VA), and P1coz , and is described by the equation (22) :
P&02 = -863 hoa - + PIco2
VA (0
Thus, under normal ambient conditions such as alveolar ventilation of 5.5 liters/min and a ~~~~~ of 40 mm Hg, 250 ml of CO, will be excreted by the lungs each minute. The importance of the alveolar-inspired CO2 gradient is shown by a rearrangement of equation I ( 19) :
(PAC02 - PIcO,)TjE = ircOa (VT/VA .863 (2)
Assuming a constant for the tidal volume/alveolar volume ratio (VT/VA),~ the relationship between the gradient and
3 It has been found that VT/VA will slightly decrease during exercise (1) and hypercapnic hyperventilation (26) since the rise in dead space is always proportionally smaller than the rise in tidal volume
(VT) l
VE for a constant %o, will be inversely proportional. At the 30 mm Hg P1coz level, the normal alveolar-inspired gradient of 38 mm Hg in air was reduced to 16 mm Hg with a J?E of 24.2 liters/min at rest, and 26 mm Hg with a VE of 103.4 liters/min during exercise. In the latter case, the ventila- tory response and resultant decrease in alveolar-inspired gradient were such that a liter of alveolar ventilation was less effective in removing CO2 , thereby causing PacOz and body stores to increase. Decreased efficiency of alveolar ventilation with CO2 retention can be expected to continue until the mean pulmonary capillary Pco:! and/or VE in- crease sufficiently to restore equality between CO2 produc- tion and CO2 elimination.
Bullard (6) asserted that during heavy exercise with a Vco:! of 3.5 liters/min a VE of 88 liters/min was sufficient to keep Pacon at 40 mm Hg in normocapnic atmospheres. Disproportionately higher ventilations would be needed to prevent Pace, and CO2 stores from rising in hypercapnic atmospheres. By calculation using equation 2, the subjects exercising in 30 mm Hg Prcoz would have had to raise their VE to 113 liters/min to prevent the decrease in Vcoz ob- served.4 The reason why our subjects did not increase their ventilation is unclear but, since they had not yet reached a maximal mechanical limitation, CO:! retention apparently was not an adequate stimulus to produce the additional increment of ventilation.
Acid-Base Changes
The rise in PacOz from rest to exercise seen in this study is not the usual finding in the literature. While small in- creases of 2.5-5.0 mm Hg during light exercise have been described (4, 17, 30), the majority of studies have found no change ( 1, 18) in moderate exercise or a decrease in Paco2 (1, 10, 18, 31) in heavy exercise. Normocapnia during exercise has been used as evidence of respiratory compe- tence even when maximum I\ioz has occurred and the car- diovascular system has reached its limit. The above studies, however, were at ambient conditions. Hickam’s data (17) on untrained men in 5 % CO2 (~36 mm Hg Prcoz) show a rise in Paoo, of 12.8 mm Hg bctwcen rest and exercise as opposed to a 4.5 mm Hg rise in 0% CO2 . In this study at 95 maximum To2 in the 30 mm Hg Prco2 atmosphere, we found that a 10.6 mm Hg rise in Pa,,, occurred in spite of a VE increase to 103 liters/mm. This was in contrast to a decrease of 1.1 mm Hg PacOz associated with a l/‘e of 75.5 liters/min for the same exercise performance in air. The en- suing respiratory acidosis due to elevation of PacOz should have accounted for a drop of .08 pH units instead of the . 118 units decrease observed (2 1). This added pH drop and associated fall in bicarbonate was due to the metabolic acidosis which accompanies heavy exercise ( 1).
The findings of no change in J?oz with increasing Prco2 indicates that the metabolic cost of work is not influenced by hypercapnia. These results agree with Krasnogor’s study in
8 mm Hg (20). Craig (8), h owever, found vo2 to increase with increasing Prcoz in one subject doing submaximal work.
4 This calculation was made using Kao’s formula (19) assuming a constant 26 mm Hg PCO~ gradient and a value of 1.14 for the VT/VA ratio based on data by Asmussen (1).

EXERCISE DURING ACUTE HYPERCAPNIA 671
Conversely, a recent study by Finkelstein et al. (11) of maximum exercise at 0 and 16 mm Hg P1c02 showed a sig- nificant decrease in maximum vo:! at the latter PIVOT level.
The US Air Force School of Aerospace Medicine BiometricsDivision
carried out analysis of variance on the data presented. The authors
are deeply indebted to the personnel of the Environmental Systems
Division of the US Air Force School of Aerospace Medicine and the
participating subjects for their dedicated support of this study.
The research reported in this paper was conducted by personnel
of the Sealed Environment Branch, Environmental Systems Division,
US Air Force School of Aerospace Medicine, Aerospace Medical
Division, AFSC, US Air Force, Brooks Air Force Base, Texas. This
study was partially supported by National Aeronautics and Space
Administration Defense PR T-636 15 (G). The voluntary informed
consent of the subjects used in this research was obtained as required
by AFR 169-8. Further reproduction is authorized to satisfy the needs
of the US Government.
Present address of S. J. Menn: hlassachusetts General Hospital,
Respiratory Care Unit, Sommerville, Mass. 02 143.
Received for publication 7 November 1969.
REFERENCES
1.
2.
3.
4.
5.
6.
7.
8.
9.
10.
11.
12.
13.
14.
15.
16.
ASMUSSEN, E. Muscular exercise. In: Handbook of Physiology.
Respiration. Washington, D.C.: Am. Physiol. Sot., 1965, sect. 3,
vol. II, chapt. 36, p. 934-978.
ASMUSSEN, E., AND M. NIELSEN. Ventilatory response to CO* during work at normal and at low oxygen tensions. Acta Physiol.
Stand. 39 : 27-35, 1956.
BANNISTER, R. G., D. J. C. CUNNINGHAM, AND C. G. DOUGLAS. The carbon dioxide stimulus to breathing in severe exercise. J.
Physiol., London 125 : 90-l 17, 1954.
BARR, P. O., M. BECKMAN, H. BJURSTEDT, J. BRISMAR, C. M. HESSER, AND G. MATELL. Time courses of blood gas changes
provoked by light and moderate exercise in man. Acta Physiol.
Stand. 60: 1-17, 1964.
BRACKETT, C. N., J. COHEN, AND W. SCHWARTZ. Carbon dioxide
titration curve of normal man. New Engl. J. Med. 272: 6-12,
1965.
BULLARD, R. W. Physzology of Exercise. Physiology (2nd ed.), edited
by E. E. Selkurt. Boston: Little, Brown, 1966, p. 635-655.
BUSBY, 33. E. A Prospective Look at Medical Problems From Hazards of
Space Operations: Clinical Space Medicine. Washington, D. C.:
National Aeronautics and Space Administration, CR-856, 1967.
CRPJG, F. Pulmonary ventilation during exercise and inhalation
of carbon dioxide. J. AppZ. Physiol. 7: 467-471, 1955.
ERIPPS, R., AND ,J. H. COMROE. The respiratory and circulatory ;esponse of normal man to inhalation of 7.6 and 10.4yo CO2 with
a comparison of the maximal ventilation produced by severe
muscular exercise, inhalation of CO2 and maximal voluntary
hyperventilation. Am. J. Physiol. 149: 43-51, 1947.
FILLEY, G. F., F. GREGOIRE, AND C. W. WRIGHT. Alveolar and
arterial oxygen tensions and the significance of the alveolar-
arterial oxygen tension difference in normal men. J. CZin. Inuest.
33: 517-529, 1954.
FINKELSTEIN, S. J., J. E. ELLIOTT, AND U. C. LUFT. The Ejects of Breathing Low Concentrations of CO2 on Exercise Tolerance. Preprints
of the Scientific Program, 1968 Aerospace Medical Assoc. 1968,
p. 75.
FREEDMAN, S. Prolonged maximum voluntary ventilation. J.
Physiol., London 6 : 37-47, 1966.
FROEB, H. Ventilatory response of SCUBA divers to CO2 inhala-
tions. J. APPZ. Physiol. 16 : 8-10, 196 1.
GLATTE, H. Nonpathologic hypercapnia in man. Lectures in Aero-
space Medicine, 6th Series, USAF School of Aerospace Medicine,
Brooks AFB, Texas, 6-9 February 1967, p. 110-129.
GLATTE, H., G. J. MOTSAY, AND B. E. WELCH. Carbon Dioxide
Tolerance Studies. Brooks Air Force Base, Texas: School of Aero-
space Medicine, SAM-TR-67-77, Sept. 1967.
GRIMBY, G., J. BUNN, AND J. MEAD. Relative contribution of rib
cage and abdomen to ventilation during exercise. J. APPZ. Physiol.
24: 159-167, 1968.
17.
18.
19.
20.
21.
22.
23.
24.
25.
26.
27.
28.
29.
30.
31.
32.
33.
HICKAM, J., W. PRYOR, E. PAGE, AND R. ATNELL. Respiratory
regulation during exercise in unconditioned subjects. J. CZin.
Invest. 30: 503-516, 1951.
HOLMGREN, A., AND H. LINDERHOLM. Oxygen and carbon dioxide
tension of arterial blood during heavy and exhaustive exercise.
Acta Physiol. &and. 44: 203-215, 1958.
KAO, F. F., C. C. MICHEL, S. S. MEI, AND W. K. LI. Somatic
afferent influence on respiration. Ann. N. Y. Acad. Sci. 109: 696-
710, 1963.
KRASNOGOR, L. J., R. WEMPEN, AND B. E. WELCH. Physiology of
man during steady-state exercise in a 180 mm Hg environment:
respiratory function and metabolism. Aerospace Med. 39 : 592-597,
1968.
LAMBERTSEN, C. J. Carbon dioxide and respiration in acid-base
homeostasis. Anesthesiology 2 1 : 643-65 1, 1960. OTIS, A. B. Quantitative relationships in steady-state gas exchange.
In: Handbook of Physiology. Respiration. Washington D. C. : Am.
Physiol. Sot., 1965, sect. 3, vol. I, chapt. 27, p. 681-698.
PATTERSON, J. L., A. HEYMAN, L. L. BATTEY, AND R. W. FERGUSON. Threshold of response of the cerebral vessels of man to increases
in blood carbon dioxide. J. CZin. Invest. 34: 1857-1964, 1955.
PRICE, H. L. Effects of carbon dioxide on the cardiovascular
system. Anesthesiology 2 1: 652-663, 1960. SCHAEFER, K. E. Respiratory and acid-base balance during pro-
longed exposure to a 3yo CO2 atmosphere. Arch. Ges. Physiol.
251: 689-715, 1949.
SCHAEFER, K. E. Respiratory adaptation to chronic hypercapnia.
Ann. N. Y. Acad. Sci. 109 : 772-782, 1963.
SECHZER, P. H., L. D. EGBERT, H. W. LINDE, D. Y. COOPER, R. D. DRIPPS, AND H. L. PRICE. Effects of CO2 inhalation on
arterial pressure, ECG, and plasma catecholamines and 17-OH
corticosteroids in normal man. J. APPZ. Physiol. 15 : 454-458, 1960.
SEVERINGHAUS, J. W. Blood gas calculator. J. AppZ. Physiol. 21:
1108-l 116, 1966. SHEPHARD, R. J. The maximum sustained voluntary ventilation
in exercise. CZin. Sci. 32: 167-176, 1967.
SUSKIND, hl., R. A. BRUNER, M. E. MCDOWELL, D. N. G. Yu, AND F. W. LOVEJOY. Normal ventilation in end tidal-air and ar-
terial carbon dioxide and oxygen tensions during moderate
exercise. J. ApipZ. Physiol. 3: 282-290, 1950.
WATHEM, R. L., H. H. ROSTORFER, S. ROBINSON, J. L. NEWTON,
AND M. D. BALLIE. Changes in blood gases and acid-base balance
in the exercising dog. J. APPZ. Physiol. 17 : 656-660, 1962.
WHITE, C. S., J. H. HUMM, E. D. ARMSTRONG, AND N. P. V.
LUNDGREN. Human tolerance to acute exposure to carbon dioxide.
Aviation Med. 23 : 439455, 1952.
ZHAROV, S. G. Effects on man of prolonged exposure to atmos-
pheres with high carbon dioxide content. Aviation and Space Medicine
(Moscow), 1963, p. 182-l 85, NASA-TF-F-228.