j.p. morgan iraq and mena trade forum monday 24 september presentation
TRANSCRIPT
Middle East and North Africa Trade Forum
Sunday 23 – Tuesday 25 September, 2012
J . P
.
M O
R G
A N
M I
D D
L E
E
A S
T A
N D
N
O R
T H
A
F R
I C
A
T R
A D
E
F O
R U
M
This presentation was prepared exclusively for the benefit and internal use of the J.P. Morgan client to whom it is directly addressed and delivered including such client’s subsidiaries,
(the “Company”) in order to assist the Company in evaluating, on a preliminary basis, certain products or services that may be provided by J.P. Morgan. This presentation is for
discussion purposes only and is incomplete without reference to, and should be viewed solely in conjunction with, the oral briefing provided by J.P. Morgan. It may not be copied,
published or used, in whole or in part, for any purpose other than as expressly authorised by J.P. Morgan.
The statements in this presentation are confidential and proprietary to J.P. Morgan and are not intended to be legally binding. Neither J.P. Morgan nor any of its directors, officers,
employees or agents shall incur any responsibility or liability to the Company or any other party with respect to the contents of this presentation or any matters referred to in, or
discussed as a result of, this document. J.P. Morgan makes no representations as to the legal, regulatory, tax or accounting implications of the matters referred to in this presentation.
IRS Circular 230 Disclosure: JPMorgan Chase & Co. and its affiliates do not provide tax advice. Accordingly, any discussion of U.S. tax matters included herein (including any
attachments) is not intended or written to be used, and cannot be used, in connection with the promotion, marketing or recommendation by anyone not affiliated with JPMorgan Chase &
Co. of any of the matters addressed herein or for the purpose of avoiding U.S. tax-related penalties.
J.P. Morgan is a marketing name for the treasury services businesses of JPMorgan Chase Bank, N.A. and its subsidiaries worldwide. In the United Kingdom, JPMorgan Chase Bank,
N.A., London branch and J.P. Morgan Europe Limited are authorised and regulated by the Financial Services Authority
JPMorgan Chase is licensed under US patent numbers 5, 910,988, and 6, 032 and 137
©2012 JPMorgan Chase & Co. All rights reserved.
J . P
.
M O
R G
A N
M I
D D
L E
E
A S
T A
N D
N
O R
T H
A
F R
I C
A
T R
A D
E
F O
R U
M

Asif Raza
Head of Treasury and Securities Services,
Middle East and North Africa, J.P. Morgan
W E L C O M E R E M A R K S
J . P
.
M O
R G
A N
M I
D D
L E
E
A S
T A
N D
N
O R
T H
A
F R
I C
A
T R
A D
E
F O
R U
M

Agenda
Monday September 24
09:15 Welcome Refreshments
09:45 Welcome Remarks
Asif Raza, Head of Treasury and Securities Services, Middle East and North Africa, J.P. Morgan
10:00 Changing Paradigms of Trade and Currency Settlement Patterns
Examination of the regional market landscape with identification and analysis of key growth areas and emerging
economies allows capitalization of the trade corridors between MENA and Asia and the growing use of RMB as a
trade settlement currency.
Sonam Kapadia, Global Trade, Middle East and North Africa, J.P. Morgan
11:00 Refreshments
11:30 The Product Landscape in a Growing Trade Environment
To accommodate the growing trade patterns the product landscape is simultaneously increasing it’s range
and scope of offerings. Analyzing the importance of the Cash Conversion Cycle is a vital exercise when choosing
Documentary Credit and Supply Chain.
Amr El Haddad, Global Trade Product, Middle East and North Africa, J.P. Morgan
12:15 Compliance
Evaluating compliance issues specifically encountered in the MENA region and how we can work in this
context to better understand and identify the needs of our clients.
Ian Lyall, Compliance, Europe Middle East and Africa, J.P. Morgan
13:15 Lunch
Al Saraya Restaurant
J . P
.
M O
R G
A N
M I
D D
L E
E
A S
T A
N D
N
O R
T H
A
F R
I C
A
T R
A D
E
F O
R U
M
Agenda
14:15 Credit Risk Management in a Challenging Environment
Managing credit risk requires in depth analysis of the current challenging environment
Florence Coronel, Risk, Europe, Middle East and Africa, J.P. Morgan
15:15 Panel Discussion: Corporate Perspectives on the State of the Regional Market
How have Corporates adapted their strategies to cope with the unpredictable nature of regional growth and plan to
avoid future liquidity shortages? Examination of opportunities and benefits provided by market diversification in
converged cash and trade finance solutions to help improve working capital.
Moderator: Zeeshan Khan, Global Trade, Middle East and North Africa, J.P. Morgan
Panellists: Azmi Shaban, Shaban Group
Santosh Babu Karkera, A. A. Bin Hindi Group
Guillermo Arias, General Motors
Neeraj Tekchandani, Apparel FZCO
16:30 Close of Day
19:30 Dinner
Meet in Hotel Lobby
J . P
.
M O
R G
A N
M I
D D
L E
E
A S
T A
N D
N
O R
T H
A
F R
I C
A
T R
A D
E
F O
R U
M

Sonam Kapadia
Global Trade, Middle East and North Africa, J.P. Morgan
C H A N G I N G P A R A D I G M S O F T R A D E A N D
C U R R E N C Y S E T T L E M E N T P A T T E R N S
J . P
.
M O
R G
A N
M I
D D
L E
E
A S
T A
N D
N
O R
T H
A
F R
I C
A
T R
A D
E
F O
R U
M

Changing face of the world
Trade within Europe accounted for 65% of European trade
More than half of Asia’s exports (54%) remained within Asia
28% of North Americas exports remained in North America
Trade within regions dominates world trade. Europe and Asia remain their own top trading destinations
Slow
Growth Accelerating
Decelerating Fast Growth
<3%
<3% ≥3 %
≥3%
2010 – 2017
GDP growth
2003 –
2007
GD
P g
row
th
Intra/Inter table Origin
Destination NA1 SCA2 Europe CIS Africa MENA APAC Total
North America1 480.3 643.2 405.3 36.6 97.1 68.1 732.0 2,462.5
South & Central America2 415.7 187.3 152.8 7.3 16.6 9.4 329.1 1,118.3
Europe 311.9 152.4 3,513.8 269.3 185.4 147.8 844.8 5,425.3
CIS 15.1 12.6 176.9 100.2 3.6 2.2 99.5 410.1
Africa 34.9 19.5 172.2 9.5 61.4 36.5 128.9 462.9
MENA 51.1 18.0 177.7 10.9 20.9 52.1 171.1 501.8
APAC 419.3 196.4 580.0 94.6 136.2 419.3 2,753.1 4,598.9
Total 1,728.3 1,229.3 5,178.6 528.4 521.2 735.5 5,058.4 14,979.7
Source: UNCTAD database, 2010 international trade data & JPM Analysis 1 excluding Mexico 2 including Mexico
Source: IMF WEO database, JPM Analysis
Country as percentage of Region
US as % of North America1 76.02%
Russia as % of CIS 70.79%
China as % of Asia 39.25%
Mexico as % of SCA2 25.41%
Canada as % of NA1 23.98%
Germany as % of Europe 23.31%
Brazil as % of SCA2 17.94%
India as % of Asia 4.82%
Source: UNCTAD database, JPM Analysis
NA 28%
SCA 24%
Europe 18%
CIS 1%
Africa 2%
MENA 3%
APAC 24%
NA 52%
SCA 15%
Europe 12% CIS
1% Africa
2%
MENA 2%
APAC 16%
NA 14%
SCA 7%
Europe 17% CIS
2% Africa
3% MENA
3%
APAC 54% NA
9%
SCA 1%
Europe 20%
CIS 1%
Africa 5% MENA
7%
APAC 57%
19%
3%
35%
1%
12%
4%
26%
NA 8%
SCA 3%
Europe 68%
CIS 3%
Africa 3%
MENA 4% APAC
11%
7% 1%
51%
19% 2%
2%
18%
J . P
.
M O
R G
A N
M I
D D
L E
E
A S
T A
N D
N
O R
T H
A
F R
I C
A
T R
A D
E
F O
R U
M
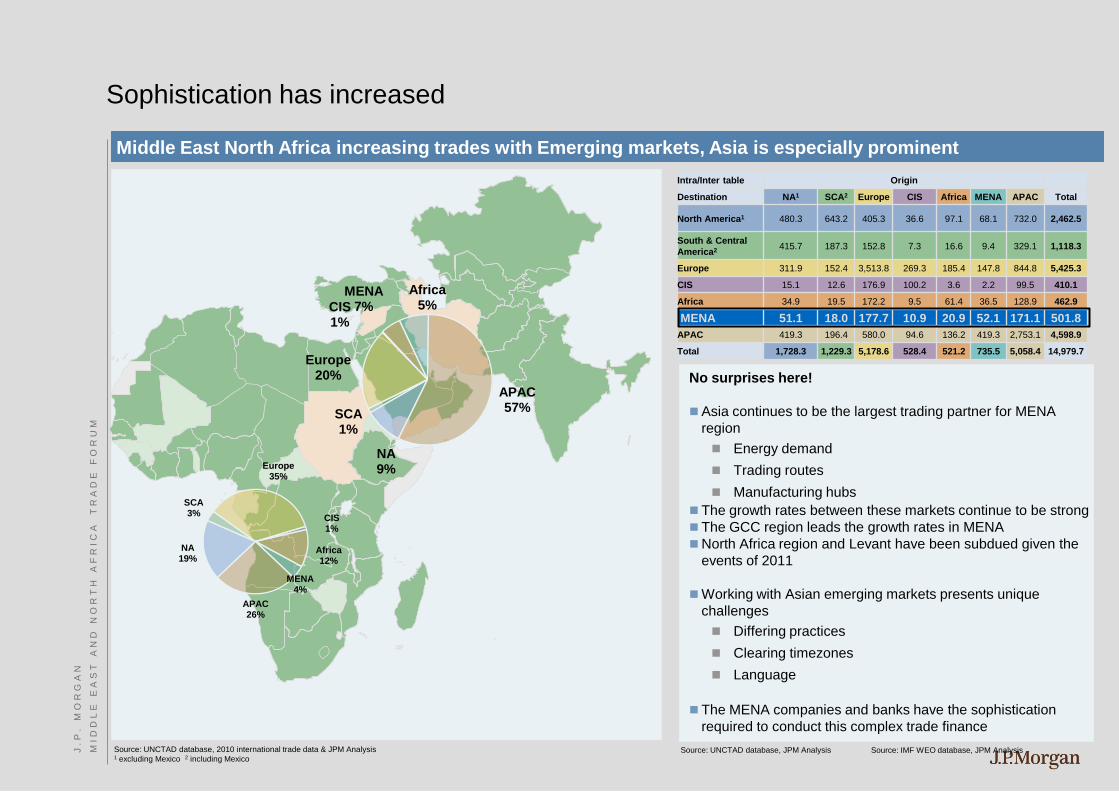
Sophistication has increased
Middle East North Africa increasing trades with Emerging markets, Asia is especially prominent
Intra/Inter table Origin
Destination NA1 SCA2 Europe CIS Africa MENA APAC Total
North America1 480.3 643.2 405.3 36.6 97.1 68.1 732.0 2,462.5
South & Central
America2 415.7 187.3 152.8 7.3 16.6 9.4 329.1 1,118.3
Europe 311.9 152.4 3,513.8 269.3 185.4 147.8 844.8 5,425.3
CIS 15.1 12.6 176.9 100.2 3.6 2.2 99.5 410.1
Africa 34.9 19.5 172.2 9.5 61.4 36.5 128.9 462.9
MENA 51.1 18.0 177.7 10.9 20.9 52.1 171.1 501.8
APAC 419.3 196.4 580.0 94.6 136.2 419.3 2,753.1 4,598.9
Total 1,728.3 1,229.3 5,178.6 528.4 521.2 735.5 5,058.4 14,979.7
Source: UNCTAD database, 2010 international trade data & JPM Analysis 1 excluding Mexico 2 including Mexico
Source: IMF WEO database, JPM Analysis Source: UNCTAD database, JPM Analysis
NA 9%
SCA 1%
Europe 20%
CIS 1%
Africa 5%
MENA 7%
APAC 57%
NA 19%
SCA 3%
Europe 35%
CIS 1%
Africa 12%
MENA 4%
APAC 26%
No surprises here!
Asia continues to be the largest trading partner for MENA
region
Energy demand
Trading routes
Manufacturing hubs
The growth rates between these markets continue to be strong
The GCC region leads the growth rates in MENA
North Africa region and Levant have been subdued given the
events of 2011
Working with Asian emerging markets presents unique
challenges
Differing practices
Clearing timezones
Language
The MENA companies and banks have the sophistication
required to conduct this complex trade finance
J . P
.
M O
R G
A N
M I
D D
L E
E
A S
T A
N D
N
O R
T H
A
F R
I C
A
T R
A D
E
F O
R U
M
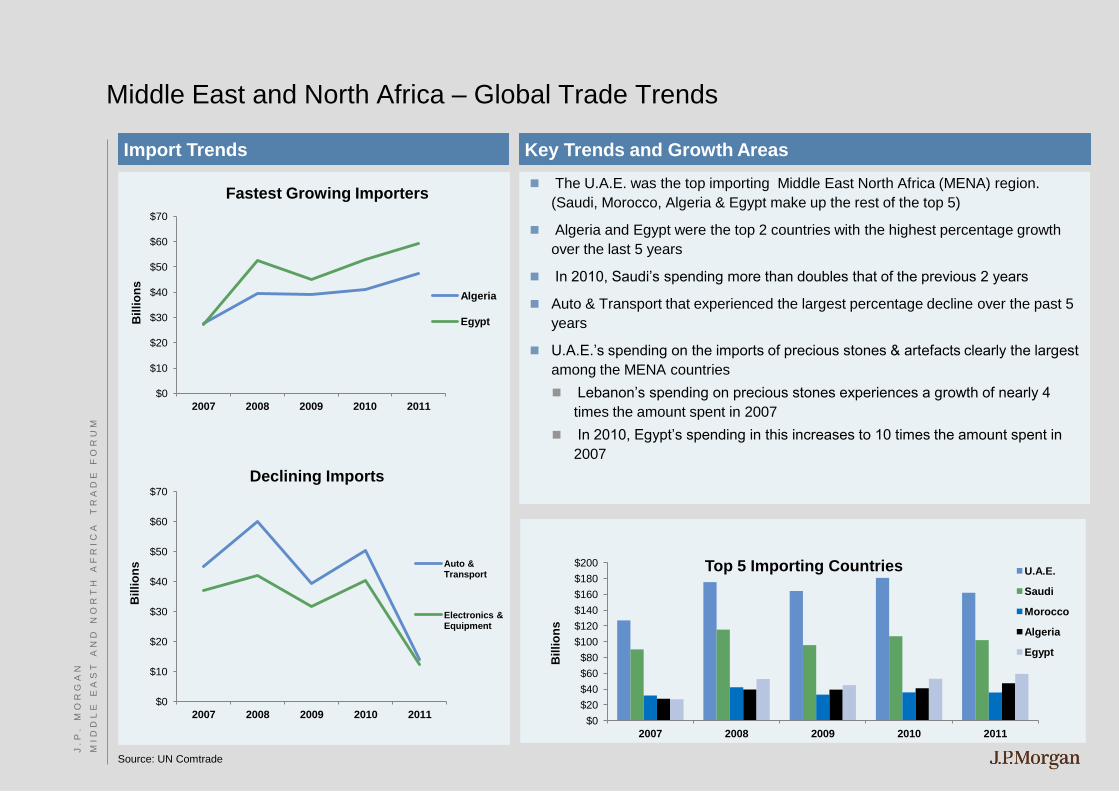
Middle East and North Africa – Global Trade Trends
Import Trends
The U.A.E. was the top importing Middle East North Africa (MENA) region.
(Saudi, Morocco, Algeria & Egypt make up the rest of the top 5)
Algeria and Egypt were the top 2 countries with the highest percentage growth
over the last 5 years
In 2010, Saudi’s spending more than doubles that of the previous 2 years
Auto & Transport that experienced the largest percentage decline over the past 5
years
U.A.E.’s spending on the imports of precious stones & artefacts clearly the largest
among the MENA countries
Lebanon’s spending on precious stones experiences a growth of nearly 4
times the amount spent in 2007
In 2010, Egypt’s spending in this increases to 10 times the amount spent in
2007
Key Trends and Growth Areas
$0
$10
$20
$30
$40
$50
$60
$70
2007 2008 2009 2010 2011
Bil
lio
ns
Fastest Growing Importers
Algeria
Egypt
$0
$20
$40
$60
$80
$100
$120
$140
$160
$180
$200
2007 2008 2009 2010 2011
Billi
on
s
Top 5 Importing Countries U.A.E.
Saudi
Morocco
Algeria
Egypt
$0
$10
$20
$30
$40
$50
$60
$70
2007 2008 2009 2010 2011
Billi
on
s
Declining Imports
Auto & Transport
Electronics & Equipment
Source: UN Comtrade
J . P
.
M O
R G
A N
M I
D D
L E
E
A S
T A
N D
N
O R
T H
A
F R
I C
A
T R
A D
E
F O
R U
M
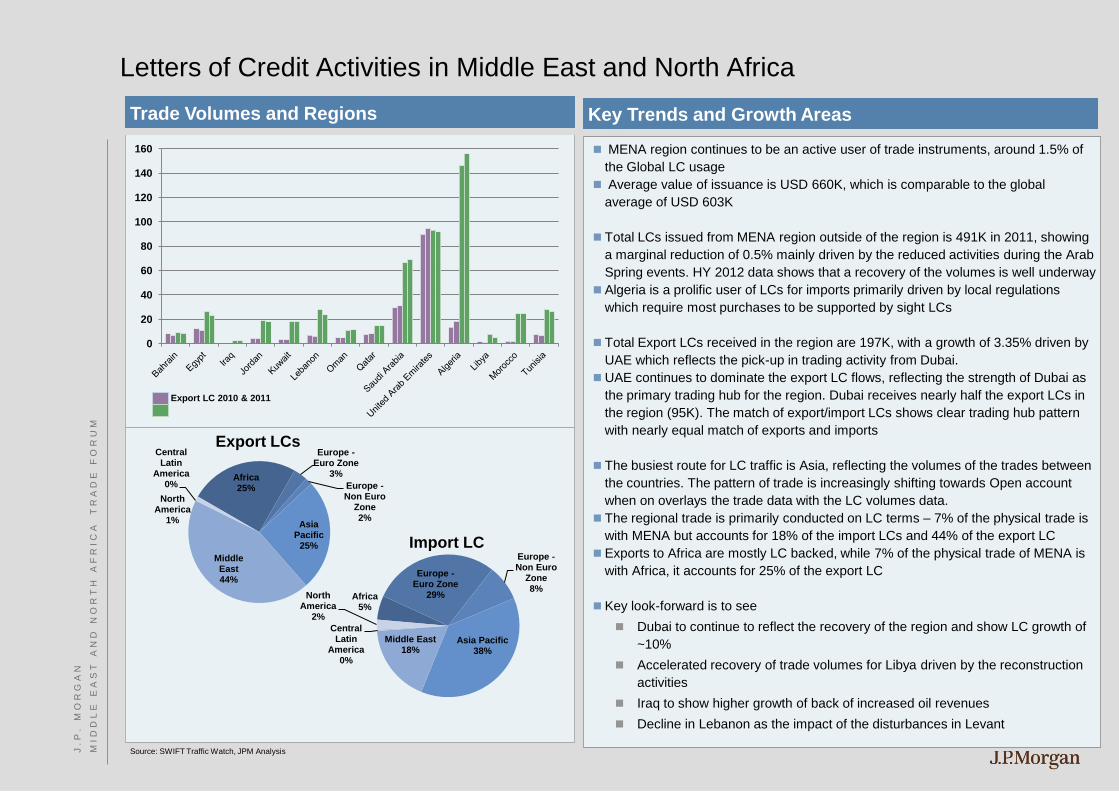
Letters of Credit Activities in Middle East and North Africa
0
20
40
60
80
100
120
140
160
Export LC 2010 & 2011
MENA region continues to be an active user of trade instruments, around 1.5% of
the Global LC usage
Average value of issuance is USD 660K, which is comparable to the global
average of USD 603K
Total LCs issued from MENA region outside of the region is 491K in 2011, showing
a marginal reduction of 0.5% mainly driven by the reduced activities during the Arab
Spring events. HY 2012 data shows that a recovery of the volumes is well underway
Algeria is a prolific user of LCs for imports primarily driven by local regulations
which require most purchases to be supported by sight LCs
Total Export LCs received in the region are 197K, with a growth of 3.35% driven by
UAE which reflects the pick-up in trading activity from Dubai.
UAE continues to dominate the export LC flows, reflecting the strength of Dubai as
the primary trading hub for the region. Dubai receives nearly half the export LCs in
the region (95K). The match of export/import LCs shows clear trading hub pattern
with nearly equal match of exports and imports
The busiest route for LC traffic is Asia, reflecting the volumes of the trades between
the countries. The pattern of trade is increasingly shifting towards Open account
when on overlays the trade data with the LC volumes data.
The regional trade is primarily conducted on LC terms – 7% of the physical trade is
with MENA but accounts for 18% of the import LCs and 44% of the export LC
Exports to Africa are mostly LC backed, while 7% of the physical trade of MENA is
with Africa, it accounts for 25% of the export LC
Key look-forward is to see
Dubai to continue to reflect the recovery of the region and show LC growth of
~10%
Accelerated recovery of trade volumes for Libya driven by the reconstruction
activities
Iraq to show higher growth of back of increased oil revenues
Decline in Lebanon as the impact of the disturbances in Levant
Key Trends and Growth Areas
Africa 25%
Europe - Euro Zone
3%
Europe - Non Euro
Zone 2%
Asia Pacific
25%
Middle East 44%
Central Latin
America 0%
North America
1%
Export LCs
Africa 5%
Europe - Euro Zone
29%
Europe - Non Euro
Zone 8%
Asia Pacific 38%
Middle East 18%
Central Latin
America 0%
North America
2%
Import LC
Source: SWIFT Traffic Watch, JPM Analysis
Trade Volumes and Regions
J . P
.
M O
R G
A N
M I
D D
L E
E
A S
T A
N D
N
O R
T H
A
F R
I C
A
T R
A D
E
F O
R U
M

China is the largest trade partner for MENA Region
China is the largest trading partner for the MENA region and has an
accelerated growth path for the trade corridor
The top commodities, that were imported from China and into the MENA
region, from 2007 – 2011 were:
Plant & Machinery (USD 47 billion)
Electronics & Equipment (USD 41 billion)
Clothing & Accessories (USD 21 billion)
Iron & Steel (USD 16 billion)
Auto & Transport (USD 13 billion)
This trend is being witnessed globally and has led to an active increase
in the use of RMB as the trade settlement currency
Banks estimate that 10% China’s trade is now in RMB
The forecast is that in 3-5 years, it will increase to 20% as China’s
share of global trade increases
SWIFT data shows that Renminbi (RMB) is the third largest currency for
Letters of Credit (LCs), after Dollar and the Euro
About 4% of LCs issued were in RMB
Overall it is the 15th largest currency for trade
There are challenges to using RMB which are being actively addressed
Strict documentation requirements
Availability of RMB to the company to pay for purchases
Hedging of RMB exposures
Trade with China is an incentive for RMB settlement
Plant & Machinery
34%
Electronics & Equipment
29%
Clothing & Accessories
15%
Iron & Steel 12%
Auto & Transport
10%
MENA Imports from China
$0
$10
$20
$30
$40
2007 2008 2009 2010 2011
Billio
ns
Import Trends from China 2007-2011
Source: UN Comtrade
J . P
.
M O
R G
A N
M I
D D
L E
E
A S
T A
N D
N
O R
T H
A
F R
I C
A
T R
A D
E
F O
R U
M

RMB Settlement has significant tail winds
China’s central bank is increasing the coverage of the Swap agreements that they have with other central banks
Central Banks of key trading markets like Singapore and Dubai are already on-board
London expected to become an off-shore centre for RMB
Liquidity in the Hong Kong market for RMB has increased
Estimates are that the deliverables market in Hong Kong has now increased to USD 3 billion, which provides the ability
to purchase/sell large order without moving the market
RMB based bonds are being issued to provide alternatives for managing RMB liquidity
Faster processing times
Chinese exports estimate that sales based on RMB are cleared in a day as compared to a week or fortnight for USD
Transparency
Typically, Chinese exporters build in a buffer of 3% for currency movements in the sales
RMB invoicing typically shows an improvement of 3%-7% in the cost of goods
Benefits of RMB Trade Settlement Scheme
Enhanced relationships with suppliers in China
A shorter turnaround time processing trade documentation improves the supplier’s cash flow
Exporters settling trades in RMB will be better able to grow their client base in China
Transparency in pricing and better management of foreign exchange risk
Factors providing support
Source: Global Trade Review
J . P
.
M O
R G
A N
M I
D D
L E
E
A S
T A
N D
N
O R
T H
A
F R
I C
A
T R
A D
E
F O
R U
M
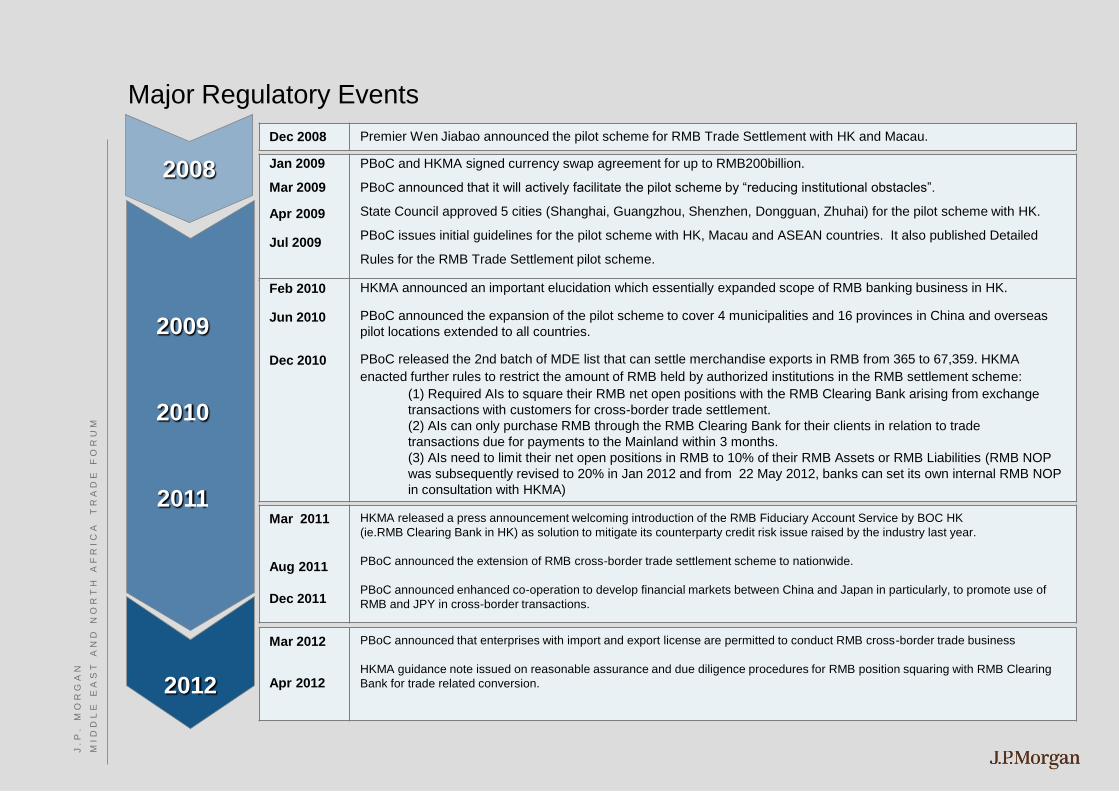
Major Regulatory Events
2008
2009
2010
2011
Jan 2009 Mar 2009 Apr 2009 Jul 2009
PBoC and HKMA signed currency swap agreement for up to RMB200billion. PBoC announced that it will actively facilitate the pilot scheme by “reducing institutional obstacles”. State Council approved 5 cities (Shanghai, Guangzhou, Shenzhen, Dongguan, Zhuhai) for the pilot scheme with HK. PBoC issues initial guidelines for the pilot scheme with HK, Macau and ASEAN countries. It also published Detailed Rules for the RMB Trade Settlement pilot scheme.
Mar 2012
Apr 2012
PBoC announced that enterprises with import and export license are permitted to conduct RMB cross-border trade business
HKMA guidance note issued on reasonable assurance and due diligence procedures for RMB position squaring with RMB Clearing
Bank for trade related conversion.
Dec 2008 Premier Wen Jiabao announced the pilot scheme for RMB Trade Settlement with HK and Macau.
Feb 2010
Jun 2010
Dec 2010
HKMA announced an important elucidation which essentially expanded scope of RMB banking business in HK.
PBoC announced the expansion of the pilot scheme to cover 4 municipalities and 16 provinces in China and overseas
pilot locations extended to all countries.
PBoC released the 2nd batch of MDE list that can settle merchandise exports in RMB from 365 to 67,359. HKMA
enacted further rules to restrict the amount of RMB held by authorized institutions in the RMB settlement scheme:
(1) Required AIs to square their RMB net open positions with the RMB Clearing Bank arising from exchange
transactions with customers for cross-border trade settlement.
(2) AIs can only purchase RMB through the RMB Clearing Bank for their clients in relation to trade
transactions due for payments to the Mainland within 3 months.
(3) AIs need to limit their net open positions in RMB to 10% of their RMB Assets or RMB Liabilities (RMB NOP
was subsequently revised to 20% in Jan 2012 and from 22 May 2012, banks can set its own internal RMB NOP
in consultation with HKMA)
Mar 2011
Aug 2011
Dec 2011
HKMA released a press announcement welcoming introduction of the RMB Fiduciary Account Service by BOC HK
(ie.RMB Clearing Bank in HK) as solution to mitigate its counterparty credit risk issue raised by the industry last year.
PBoC announced the extension of RMB cross-border trade settlement scheme to nationwide.
PBoC announced enhanced co-operation to develop financial markets between China and Japan in particularly, to promote use of
RMB and JPY in cross-border transactions.
2012
J . P
.
M O
R G
A N
M I
D D
L E
E
A S
T A
N D
N
O R
T H
A
F R
I C
A
T R
A D
E
F O
R U
M
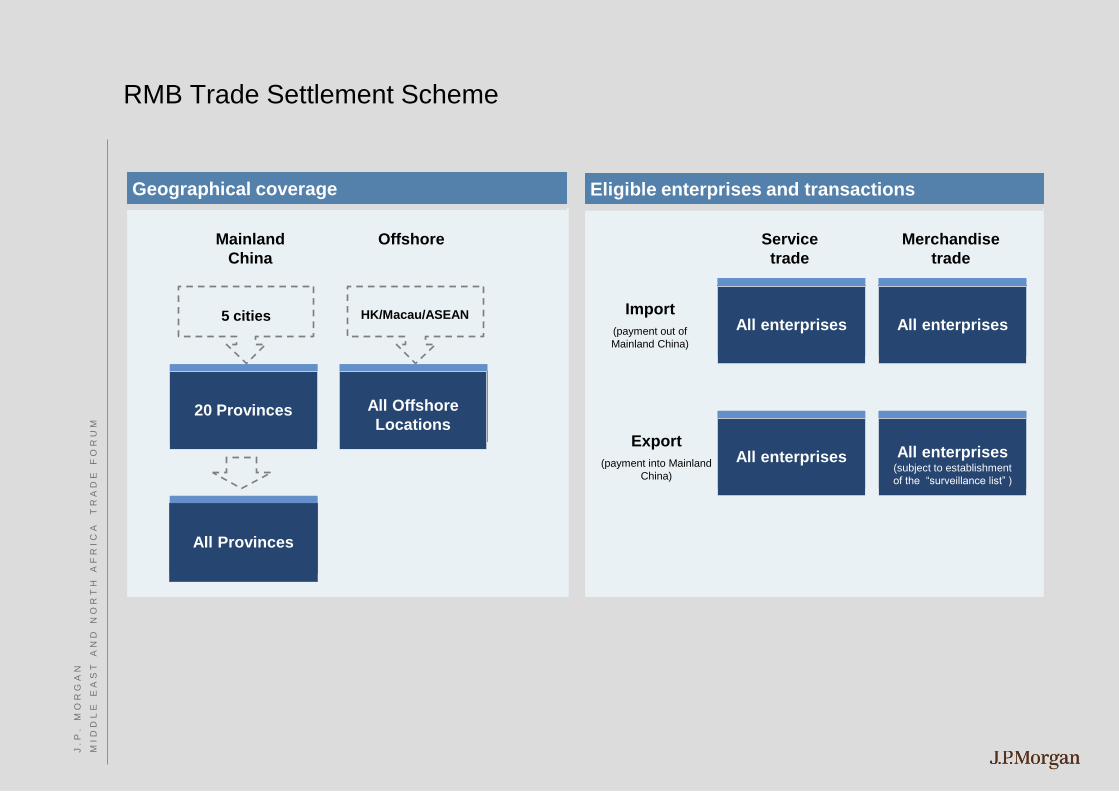
RMB Trade Settlement Scheme
Machinery
and transport
equipment
Geographical coverage Eligible enterprises and transactions
Import
(payment out of
Mainland China)
All enterprises
Merchandise
trade
Service
trade
All enterprises
Export
(payment into Mainland
China)
All enterprises
All enterprises (subject to establishment
of the “surveillance list” )
Offshore Mainland
China
20 Provinces
All Offshore
Locations
HK/Macau/ASEAN
5 cities
All Provinces
J . P
.
M O
R G
A N
M I
D D
L E
E
A S
T A
N D
N
O R
T H
A
F R
I C
A
T R
A D
E
F O
R U
M

Currency Swap Arrangement
China
Argentina
70Bn
Iceland
3.5Bn
New
Zealand
25Bn
Indonesia
100Bn
Malaysia
180Bn
Singapore
150Bn
Hong Kong
400Bn
Belarus
20Bn
South
Korea
360Bn
Australia
200Bn
Pakistan
10Bn
Mongolia
10Bn
UAE
35Bn Thailand
70Bn
Ukraine
15Bn
Japan
Direct
Swap
China is expanding its bilateral currency swap arrangement
Source: PBoC – Bilateral currency swap arrangement (RMB)
RMB1,648.5 billion
J . P
.
M O
R G
A N
M I
D D
L E
E
A S
T A
N D
N
O R
T H
A
F R
I C
A
T R
A D
E
F O
R U
M
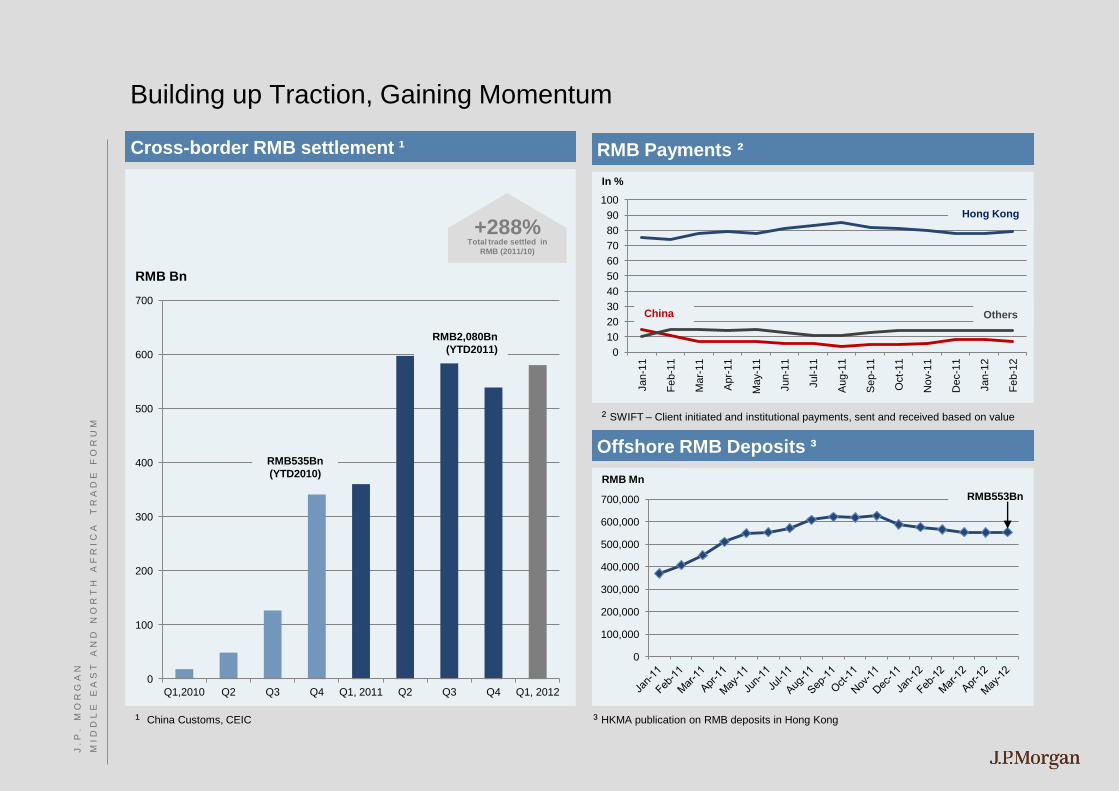
Building up Traction, Gaining Momentum
Cross-border RMB settlement ¹ RMB Payments ²
³ HKMA publication on RMB deposits in Hong Kong
Offshore RMB Deposits ³
0
100,000
200,000
300,000
400,000
500,000
600,000
700,000
RMB Mn
RMB553Bn
0
10
20
30
40
50
60
70
80
90
100
Jan-1
1
Fe
b-1
1
Mar-
11
Apr-
11
May-1
1
Jun-1
1
Jul-
11
Aug-1
1
Sep-1
1
Oct-
11
Nov-1
1
Dec-1
1
Jan-1
2
Fe
b-1
2
² SWIFT – Client initiated and institutional payments, sent and received based on value
Hong Kong
Others China
In %
0
100
200
300
400
500
600
700
Q1,2010 Q2 Q3 Q4 Q1, 2011 Q2 Q3 Q4 Q1, 2012
RMB Bn
¹ China Customs, CEIC
+288% Total trade settled in
RMB (2011/10)
RMB535Bn
(YTD2010)
RMB2,080Bn
(YTD2011)
J . P
.
M O
R G
A N
M I
D D
L E
E
A S
T A
N D
N
O R
T H
A
F R
I C
A
T R
A D
E
F O
R U
M
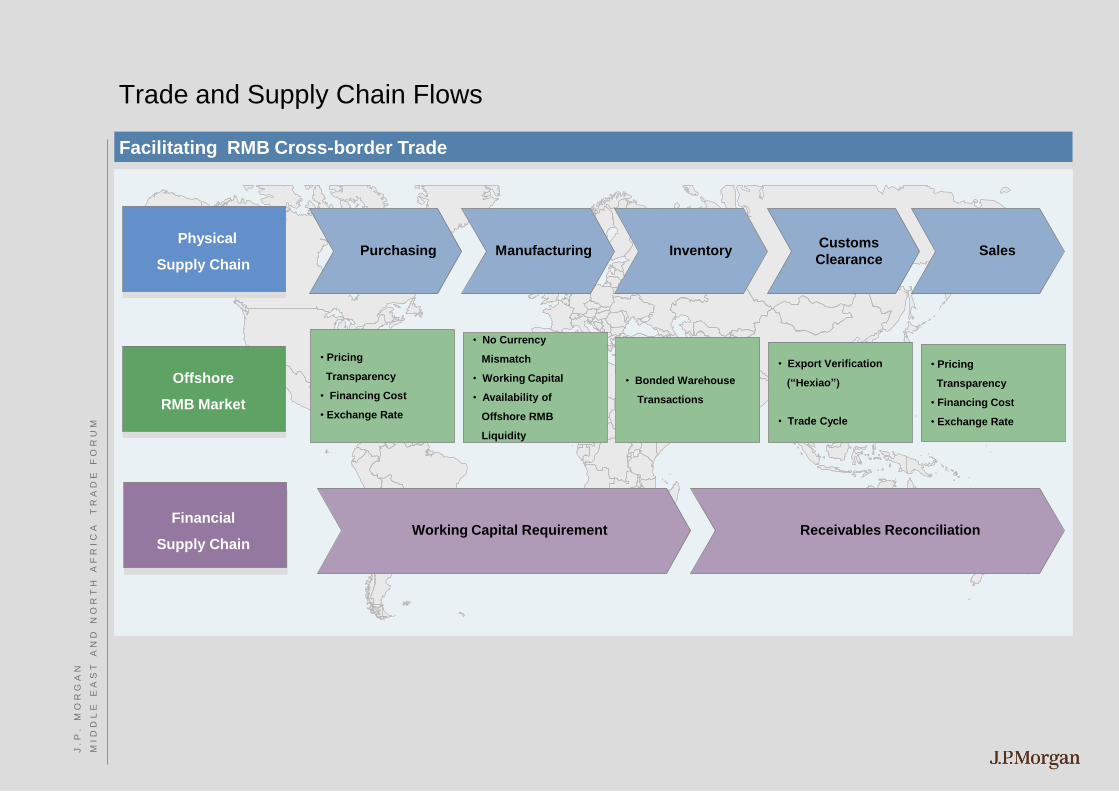
Trade and Supply Chain Flows
Facilitating RMB Cross-border Trade
• Pricing
Transparency
• Financing Cost
• Exchange Rate
• No Currency
Mismatch
• Working Capital
• Availability of
Offshore RMB
Liquidity
• Bonded Warehouse
Transactions
• Export Verification
(“Hexiao”)
• Trade Cycle
• Pricing
Transparency
• Financing Cost
• Exchange Rate
Physical
Supply Chain
Offshore
RMB Market
Financial
Supply Chain
Purchasing Manufacturing Inventory Customs
Clearance Sales
Working Capital Requirement Receivables Reconciliation
J . P
.
M O
R G
A N
M I
D D
L E
E
A S
T A
N D
N
O R
T H
A
F R
I C
A
T R
A D
E
F O
R U
M
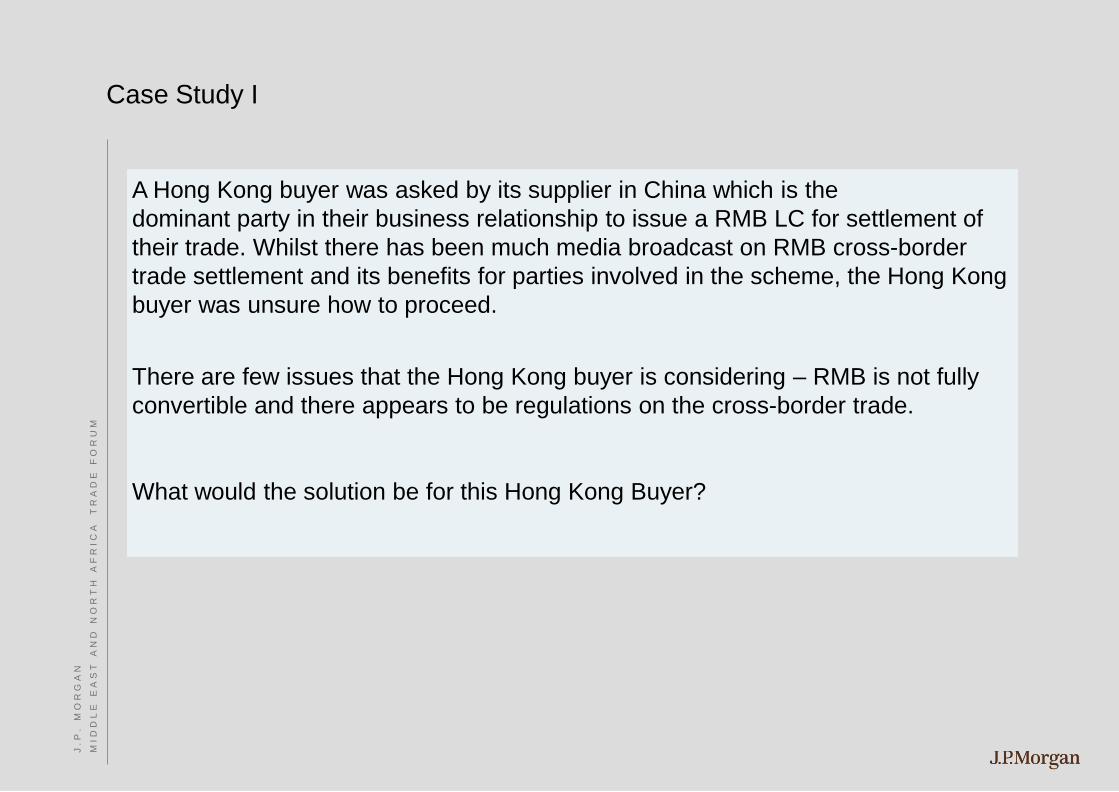
Case Study I
A Hong Kong buyer was asked by its supplier in China which is the
dominant party in their business relationship to issue a RMB LC for settlement of
their trade. Whilst there has been much media broadcast on RMB cross-border
trade settlement and its benefits for parties involved in the scheme, the Hong Kong
buyer was unsure how to proceed.
There are few issues that the Hong Kong buyer is considering – RMB is not fully
convertible and there appears to be regulations on the cross-border trade.
What would the solution be for this Hong Kong Buyer?
J . P
.
M O
R G
A N
M I
D D
L E
E
A S
T A
N D
N
O R
T H
A
F R
I C
A
T R
A D
E
F O
R U
M
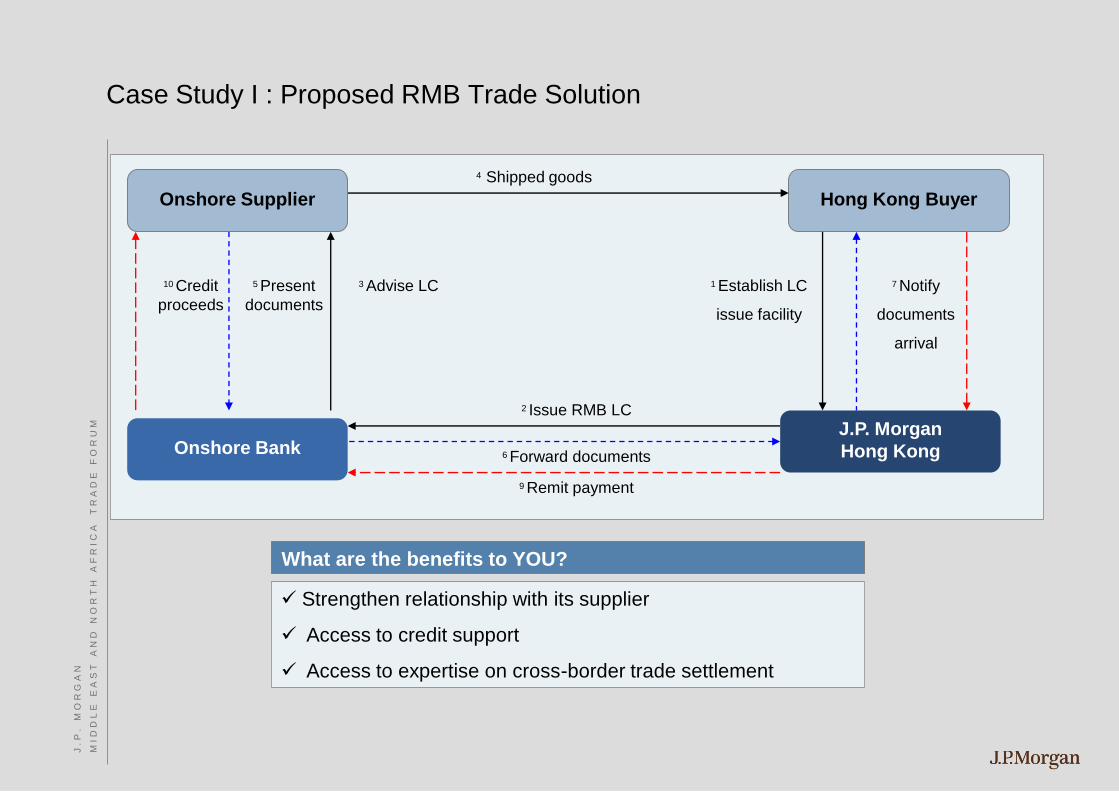
Case Study I : Proposed RMB Trade Solution
9 Remit payment
Hong Kong Buyer
Onshore Bank J.P. Morgan
Hong Kong
Onshore Supplier
2 Issue RMB LC
1 Establish LC
issue facility
3 Advise LC
4 Shipped goods
5 Present
documents
6 Forward documents
7 Notify
documents
arrival
10 Credit
proceeds
Strengthen relationship with its supplier
Access to credit support
Access to expertise on cross-border trade settlement
What are the benefits to YOU?
J . P
.
M O
R G
A N
M I
D D
L E
E
A S
T A
N D
N
O R
T H
A
F R
I C
A
T R
A D
E
F O
R U
M
Case Study 2
A company in Hong Kong which is the trading entity for a PRC Manufacturer
arranged with its Ultimate Buyers in Middle East to settle their trade in RMB under
LC terms. The company in Hong Kong contemplates to settle its trade with the PRC
Manufacturer in RMB to mitigate its FX exposure.
The other consideration is the funding needs of its PRC Manufacturer. It is
challenged by the increasing onshore interest rates and the lending limits quota.
What would the proposed solution be?
J . P
.
M O
R G
A N
M I
D D
L E
E
A S
T A
N D
N
O R
T H
A
F R
I C
A
T R
A D
E
F O
R U
M

Case Study 2 : Proposed RMB Trade Solution
PRC
Manufacturer J.P.Morgan China LIB
1) Advise RMB LC
J.P.Morgan Hong Kong Hong Kong
Trading Company
2) Issue RMB LC
3) Provide import LC bills financing
Lower COF offshore
4) Use RMB proceeds received from its Ultimate Buyers to settle loan
Ultimate Buyers
(Middle East)
Enhanced banking relationship
Access to credit support
Increase sales opportunities
Access to credit and funding support
Access to expertise on cross-border trade settlement
What is it for YOU?
J . P
.
M O
R G
A N
M I
D D
L E
E
A S
T A
N D
N
O R
T H
A
F R
I C
A
T R
A D
E
F O
R U
M

J.P. Morgan locations worldwide (alternate) cities
Argentina Buenos Aires
Bahamas Nassau
Brazil Rio de Janeiro São Paulo
Canada Calgary Montreal Toronto Vancouver
Cayman Islands Georgetown
Chile Santiago
Colombia Bogotá
Mexico Mexico City Monterrey
Peru Lima
United States Chicago Dallas Houston Los Angeles New York San Francisco
Venezuela Caracas
Austria Vienna
Belgium Brussels
Channel Islands Jersey
France Paris
Germany Berlin Frankfurt Munich
Greece Athens
Ireland Dublin
Italy Milan Rome
Luxembourg
Netherlands Amsterdam
Norway Oslo
Poland Warsaw
Portugal Lisbon
Russian Federation Moscow
Spain Madrid
Sweden Stockholm
Switzerland Geneva Zurich
United Kingdom Bournemouth Edinburgh Essex Glasgow Isle of Man London
Egypt Cairo
Nigeria Lagos
South Africa Johannesburg
Australia Melbourne Sydney
Bahrain Manama
China Beijing Hong Kong Shanghai Shenzhen Tianjin
Dubai (UAE)
India Bangalore Mumbai
Indonesia Jakarta Israel Tel Aviv
Sri Lanka Colombo
Thailand Bangkok
Taiwan Kaohsiung Pan Chiao City Taichung Tainan City Taipei Taoyuan
Turkey Istanbul
Uzbekistan Tashkent
Vietnam Hanoi Ho Chi Minh City
Japan Osaka Tokyo
Lebanon Beirut
Malaysia Kuala Lumpur Labuan
Pakistan Karachi
Philippines Manila
Saudi Arabia Riyadh
Singapore
South Korea Seoul
Lagos
Lisbon
Madrid
Rome
Athens Istanbul
Beirut Tel Aviv
Cairo
Riyadh
Manama
Karachi
Mumbai
Bangalore
Colombo
Johannesburg
Edinburgh
Glasgow
Isle of Man
Dublin
Essex
London
Bournemouth
Jersey
Paris
Amsterdam
Brussels
Luxembourg
Zurich
Geneva
Milan
Munich Vienna
Berlin
Frankfurt
Warsaw Moscow
Vancouver Calgary
San Francisco
Los Angeles Dallas Houston
Monterrey
Mexico City Georgetown
Nassau
Caracas
Bogotá
Lima
Rio de Janeiro
São Paulo Santiago
Buenos Aires
Hanoi
Bangkok
Ho Chi Minh City
Kuala Lumpur
Singapore
Labuan
Manila
Hong Kong
Shenzhen
Taoyuan
Taichung
Pan Chiao City
Tainan City
Kaohsiung
Sydney
Melbourne
Taipei
Chicago
Toronto
Montreal
New York
Oslo
Stockholm Beijing
Shanghai
Tianjin
Jakarta
Tokyo
Seoul
Osaka Tashkent
Dubai
Americas Europe Africa Asia Pacific/Middle East
J . P
.
M O
R G
A N
M I
D D
L E
E
A S
T A
N D
N
O R
T H
A
F R
I C
A
T R
A D
E
F O
R U
M
Amr El Haddad
Global Trade Product, Middle East and North Africa, J.P. Morgan
T H E P R O D U C T L A N D S C A P E I N A
G R O W I N G T R A D E E N V I R O N M E N T
J . P
.
M O
R G
A N
M I
D D
L E
E
A S
T A
N D
N
O R
T H
A
F R
I C
A
T R
A D
E
F O
R U
M

Blank slide
In This Presentation
Growth • How have global trade exports grown since the 1950’s?
Action • What did banks do to design the right tools for trade financing?
Re-action
• What’s most suitable for Corporate sector?
Developing trade patterns
Growing product landscape to meet the growth in Trade
Importance of using the Cash Conversion Cycle (CCC) as a criteria to choose the right product
J . P
.
M O
R G
A N
M I
D D
L E
E
A S
T A
N D
N
O R
T H
A
F R
I C
A
T R
A D
E
F O
R U
M
Blank slide
Section 1 : How did Global Trade Grow?
J . P
.
M O
R G
A N
M I
D D
L E
E
A S
T A
N D
N
O R
T H
A
F R
I C
A
T R
A D
E
F O
R U
M

Blank slide
I - Developing trade patterns
Despite a post-crisis dip, the current level of world gross exports is
almost three times that prevailing in the 1950s
Commodity trade accounted for a declining share of this growth (with
some exceptions)
What explains the expansion of global trade?
1) The rise of Emerging Market Economies (EMEs)
2) The growing importance of regional trade
3) The shift of higher technology exports towards dynamic EMEs
Systemic important trading nations are increasing
A chief contributor is the growing role of global supply chains in overall trade, facilitated by lower tariffs
With vertical specialization, production of certain goods is fragmented into several stages
Goods cross borders several times before being transformed into final products, further increasing trade
interconnectedness
Outsourcing of production stages from advanced “upstream” countries to neighbouring EMEs has also
supported a shift in the technology content of exports towards the latter
A. The global trade landscape has witnessed dramatic shifts over the past several decades
B. Trade expansion was further associated with growing trade interconnectedness
J . P
.
M O
R G
A N
M I
D D
L E
E
A S
T A
N D
N
O R
T H
A
F R
I C
A
T R
A D
E
F O
R U
M
Blank slide
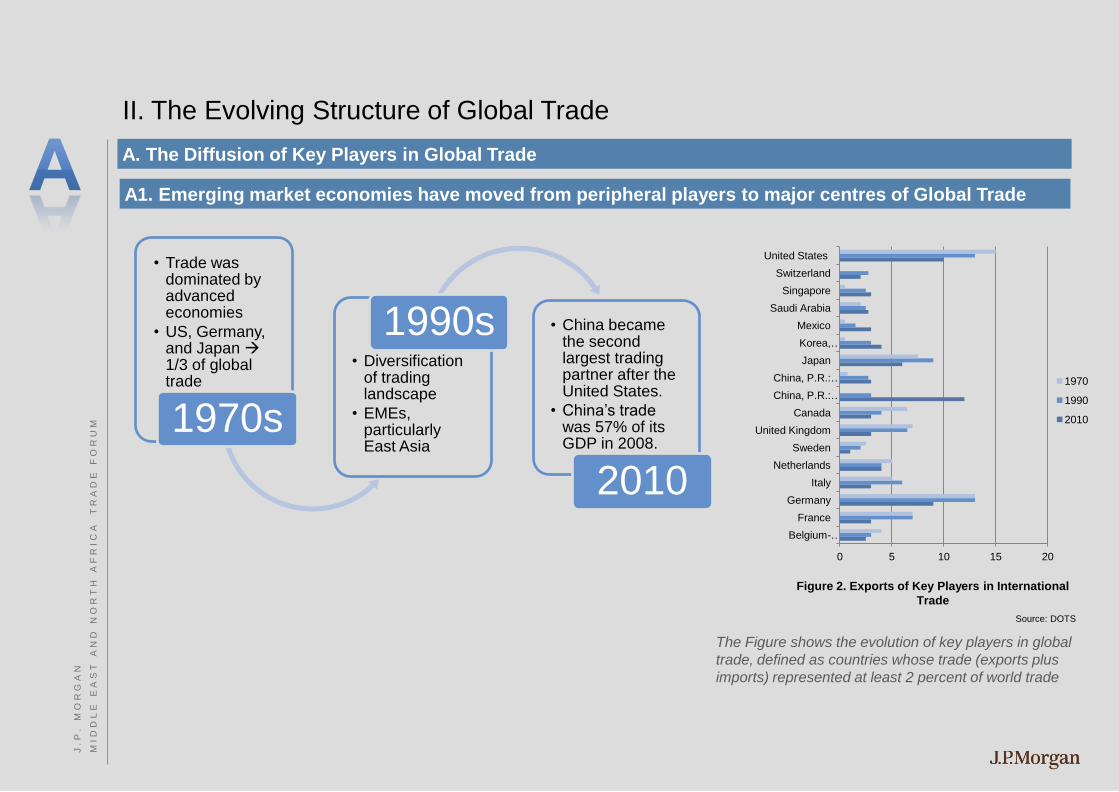
II. The Evolving Structure of Global Trade
• Trade was dominated by advanced economies
• US, Germany, and Japan 1/3 of global trade
1970s
• Diversification of trading landscape
• EMEs, particularly East Asia
1990s • China became the second largest trading partner after the United States.
• China’s trade was 57% of its GDP in 2008.
2010
The Figure shows the evolution of key players in global
trade, defined as countries whose trade (exports plus
imports) represented at least 2 percent of world trade
0 5 10 15 20
Belgium-…
France
Germany
Italy
Netherlands
Sweden
United Kingdom
Canada
China, P.R.: …
China, P.R.: …
Japan
Korea, …
Mexico
Saudi Arabia
Singapore
Switzerland
United States
1970
1990
2010
Figure 2. Exports of Key Players in International
Trade
Source: DOTS
A. The Diffusion of Key Players in Global Trade
A1. Emerging market economies have moved from peripheral players to major centres of Global Trade
J . P
.
M O
R G
A N
M I
D D
L E
E
A S
T A
N D
N
O R
T H
A
F R
I C
A
T R
A D
E
F O
R U
M
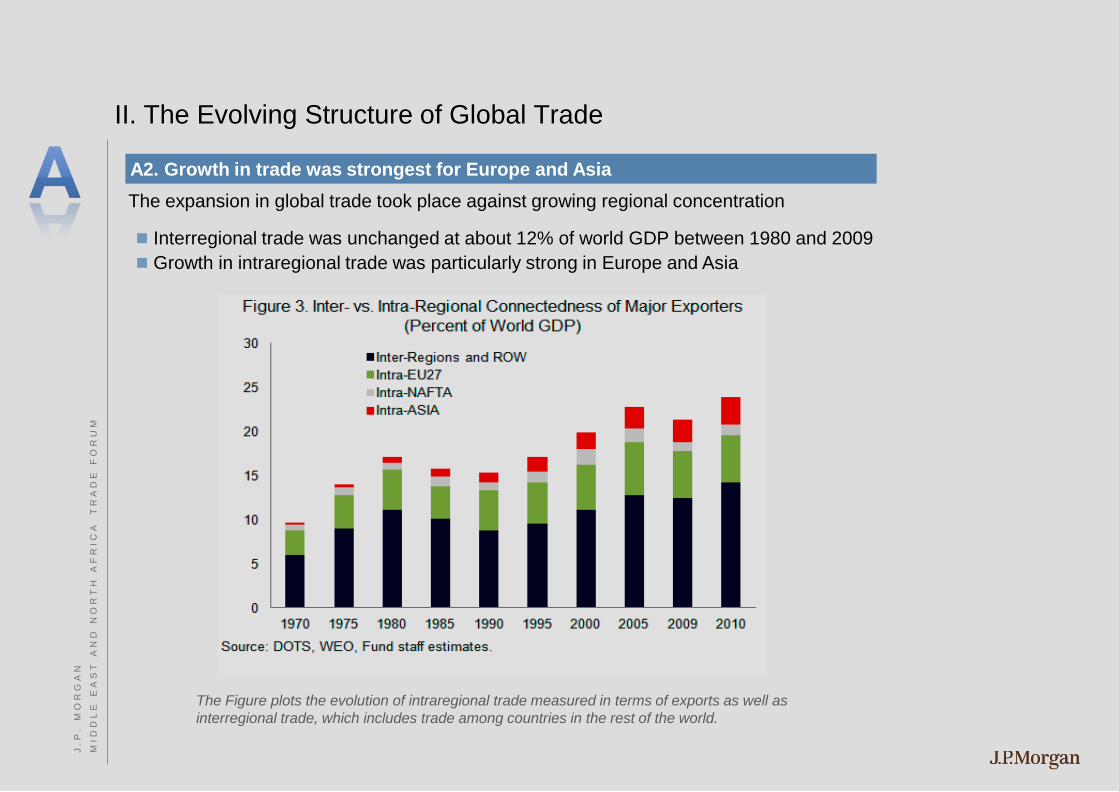
II. The Evolving Structure of Global Trade
The expansion in global trade took place against growing regional concentration
Interregional trade was unchanged at about 12% of world GDP between 1980 and 2009
Growth in intraregional trade was particularly strong in Europe and Asia
The Figure plots the evolution of intraregional trade measured in terms of exports as well as
interregional trade, which includes trade among countries in the rest of the world.
A2. Growth in trade was strongest for Europe and Asia
J . P
.
M O
R G
A N
M I
D D
L E
E
A S
T A
N D
N
O R
T H
A
F R
I C
A
T R
A D
E
F O
R U
M
Blank slide
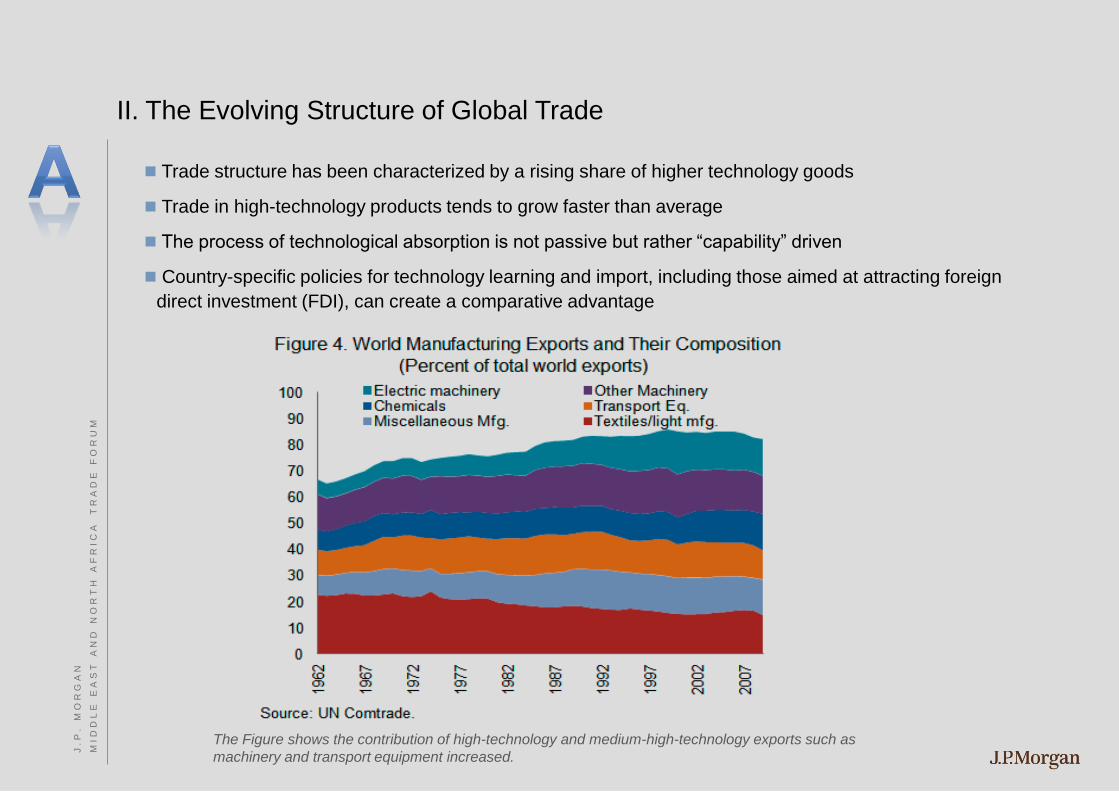
II. The Evolving Structure of Global Trade
Trade structure has been characterized by a rising share of higher technology goods
Trade in high-technology products tends to grow faster than average
The process of technological absorption is not passive but rather “capability” driven
Country-specific policies for technology learning and import, including those aimed at attracting foreign
direct investment (FDI), can create a comparative advantage
The Figure shows the contribution of high-technology and medium-high-technology exports such as
machinery and transport equipment increased.
J . P
.
M O
R G
A N
M I
D D
L E
E
A S
T A
N D
N
O R
T H
A
F R
I C
A
T R
A D
E
F O
R U
M

II. The Evolving Structure of Global Trade
The volume of trade in relation to GDP increased and took the form of intra-industry trade
Intra-industry trade as a share of overall trade has increased steadily
Highest for products such as machinery, chemicals and manufactures
Countries that experienced higher changes in intra-industry trade between 1985 and 2009 are
those integrated in a supply chain, such as China, Thailand, and Mexico (Figure 5B)
Convergence in Income levels
J . P
.
M O
R G
A N
M I
D D
L E
E
A S
T A
N D
N
O R
T H
A
F R
I C
A
T R
A D
E
F O
R U
M
Blank slide
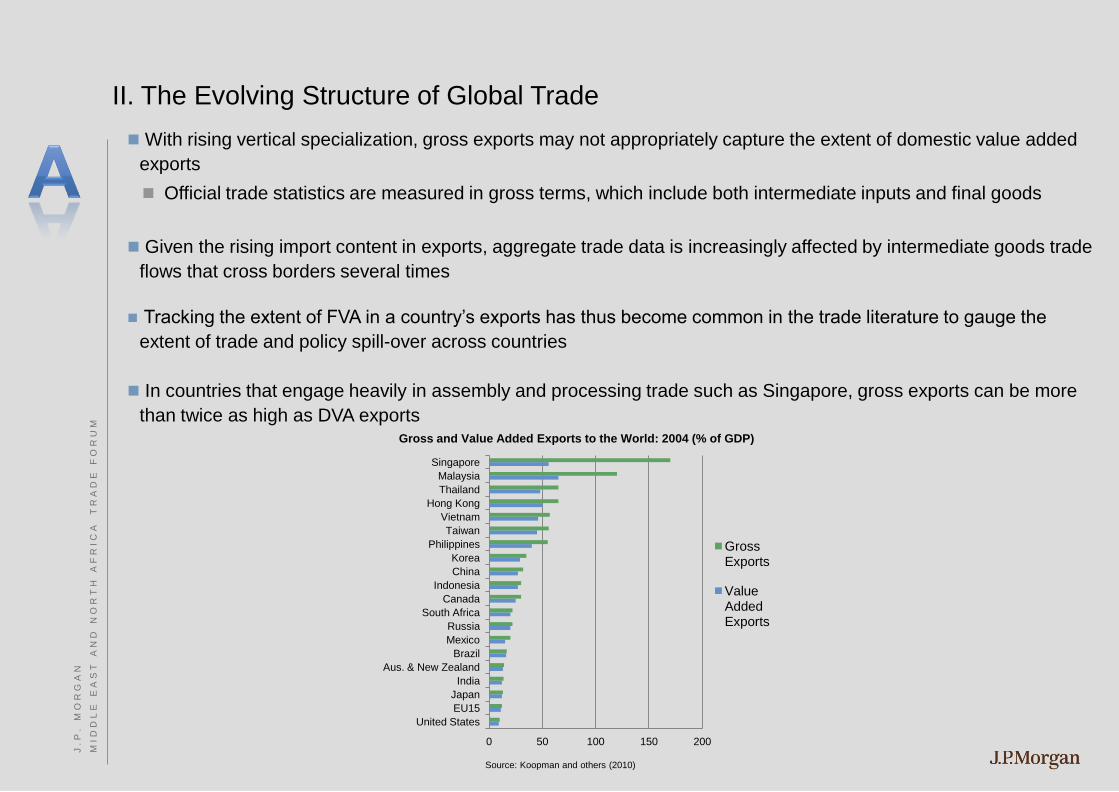
II. The Evolving Structure of Global Trade
With rising vertical specialization, gross exports may not appropriately capture the extent of domestic value added
exports
Official trade statistics are measured in gross terms, which include both intermediate inputs and final goods
Given the rising import content in exports, aggregate trade data is increasingly affected by intermediate goods trade
flows that cross borders several times
Tracking the extent of FVA in a country’s exports has thus become common in the trade literature to gauge the
extent of trade and policy spill-over across countries
In countries that engage heavily in assembly and processing trade such as Singapore, gross exports can be more
than twice as high as DVA exports
0 50 100 150 200
United States
EU15
Japan
India
Aus. & New Zealand
Brazil
Mexico
Russia
South Africa
Canada
Indonesia
China
Korea
Philippines
Taiwan
Vietnam
Hong Kong
Thailand
Malaysia
Singapore
Gross Exports
Value Added Exports
Gross and Value Added Exports to the World: 2004 (% of GDP)
Source: Koopman and others (2010)
J . P
.
M O
R G
A N
M I
D D
L E
E
A S
T A
N D
N
O R
T H
A
F R
I C
A
T R
A D
E
F O
R U
M
Blank slide
Section 2 : What did Banks do?
J . P
.
M O
R G
A N
M I
D D
L E
E
A S
T A
N D
N
O R
T H
A
F R
I C
A
T R
A D
E
F O
R U
M
Blank slide
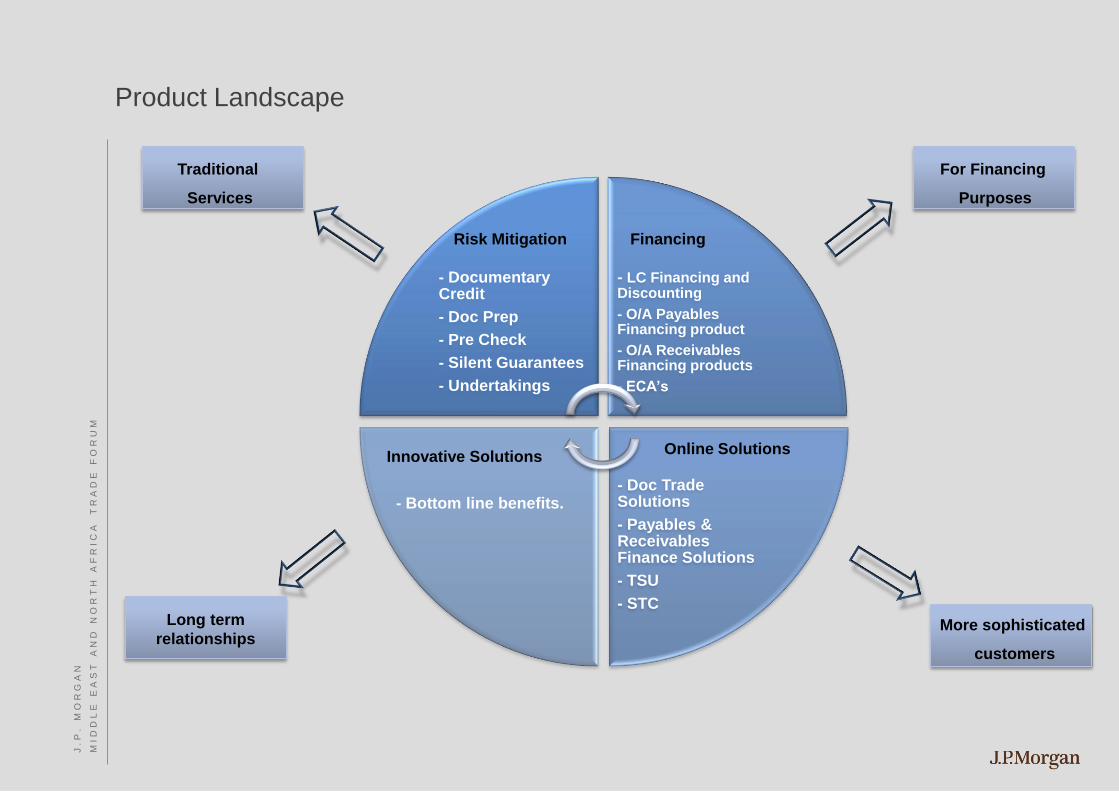
- Documentary Credit
- Doc Prep
- Pre Check
- Silent Guarantees
- Undertakings
- LC Financing and Discounting
- O/A Payables Financing product
- O/A Receivables Financing products
- ECA’s
- Doc Trade Solutions
- Payables & Receivables Finance Solutions
- TSU
- STC
Online Solutions Innovative Solutions
Product Landscape
Financing Risk Mitigation
- Bottom line benefits.
For Financing
Purposes
More sophisticated
customers
Long term
relationships
Traditional
Services
J . P
.
M O
R G
A N
M I
D D
L E
E
A S
T A
N D
N
O R
T H
A
F R
I C
A
T R
A D
E
F O
R U
M

Blank slide
Product Landscape
Documentary Trade
Instruments: Letters of Credit – Letters of Guarantees – Documentary Collection - Others
Did they meet the growth?
The more demanding customers?
Today’s technical sophistication?
Were they flexible enough to meet today’s demands?
Silent Guarantees
Undertakings
Services
Document Preperation, Pre Check
Buyer Seller
Bank (s)
Seller
Bank (s)
Buyer
Documentary Credit
J . P
.
M O
R G
A N
M I
D D
L E
E
A S
T A
N D
N
O R
T H
A
F R
I C
A
T R
A D
E
F O
R U
M

Blank slide
Product Landscape
LC Financing and Discounting
O/A Payables Financing Product
O/A Receivables Financing Products
Many forms of longer term Financing; ECA’s
Buyer
Seller
Bank (s) Ins. & Others
Finance
J . P
.
M O
R G
A N
M I
D D
L E
E
A S
T A
N D
N
O R
T H
A
F R
I C
A
T R
A D
E
F O
R U
M
Did they meet the growth?
The more demanding customers?
Today’s technical sophistication?
Were they flexible enough to meet
today’s demands?

Blank slide
Product Landscape
Doc Trade Solutions
Payables & Receivables Finance Solutions
Trade Services Utility
SWIFT Trade for Corporates
Bank (s)
Buyer
Seller
Online Solutions
J . P
.
M O
R G
A N
M I
D D
L E
E
A S
T A
N D
N
O R
T H
A
F R
I C
A
T R
A D
E
F O
R U
M
Did they meet the growth?
The more demanding customers?
Today’s technical sophistication?
Were they flexible enough to meet today’s
demands?

Blank slide
Product Landscape
Think Bottom Line Benefits
Innovative Solutions
J . P
.
M O
R G
A N
M I
D D
L E
E
A S
T A
N D
N
O R
T H
A
F R
I C
A
T R
A D
E
F O
R U
M

Blank slide
Section 3 : How should Corporates re-act?
J . P
.
M O
R G
A N
M I
D D
L E
E
A S
T A
N D
N
O R
T H
A
F R
I C
A
T R
A D
E
F O
R U
M

Factors
Capabilities
Can you do it?
Or not?
Leverage
Who dictates the terms?
Can you financially
benefit from it?
Cost or Benefit?
Thinking of the cost?
Or bottom line?
Factors Affecting Decision Making
Product
J . P
.
M O
R G
A N
M I
D D
L E
E
A S
T A
N D
N
O R
T H
A
F R
I C
A
T R
A D
E
F O
R U
M
Blank slide
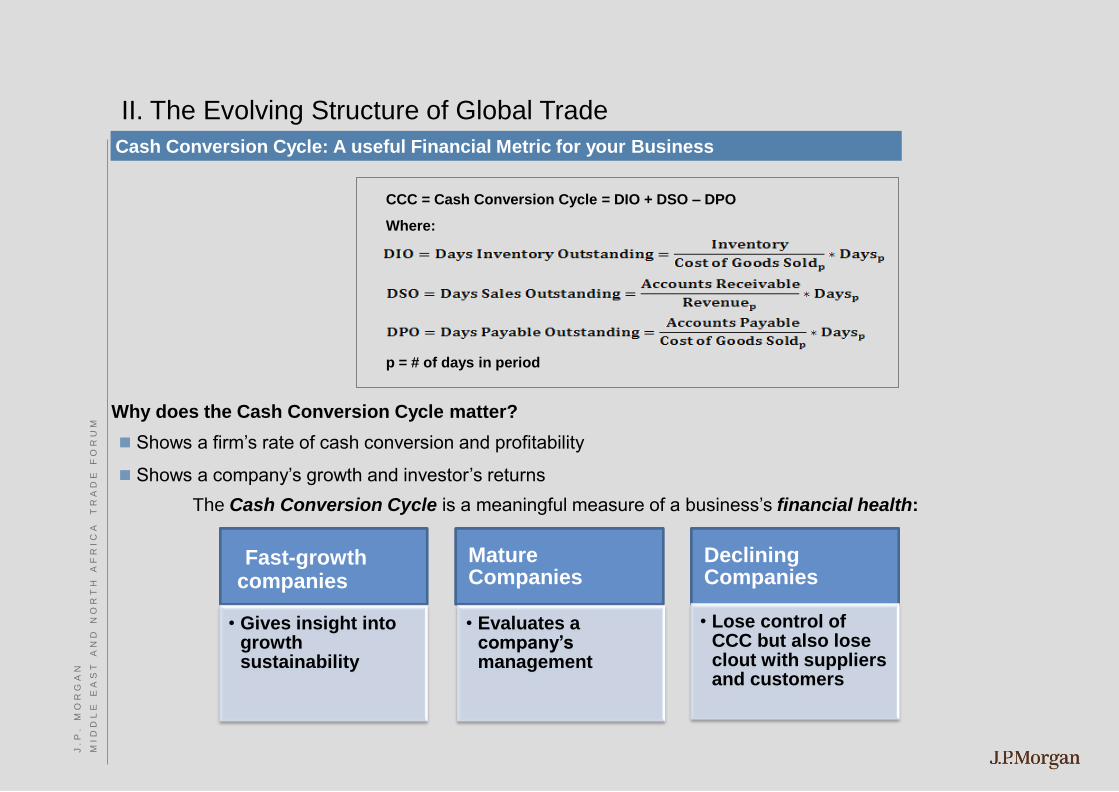
II. The Evolving Structure of Global Trade
Why does the Cash Conversion Cycle matter?
Shows a firm’s rate of cash conversion and profitability
Shows a company’s growth and investor’s returns
The Cash Conversion Cycle is a meaningful measure of a business’s financial health:
Fast-growth companies
• Gives insight into growth sustainability
Mature Companies
• Evaluates a company’s management
Declining Companies
• Lose control of CCC but also lose clout with suppliers and customers
CCC = Cash Conversion Cycle = DIO + DSO – DPO
Where:
p = # of days in period
Cash Conversion Cycle: A useful Financial Metric for your Business
J . P
.
M O
R G
A N
M I
D D
L E
E
A S
T A
N D
N
O R
T H
A
F R
I C
A
T R
A D
E
F O
R U
M
Blank slide
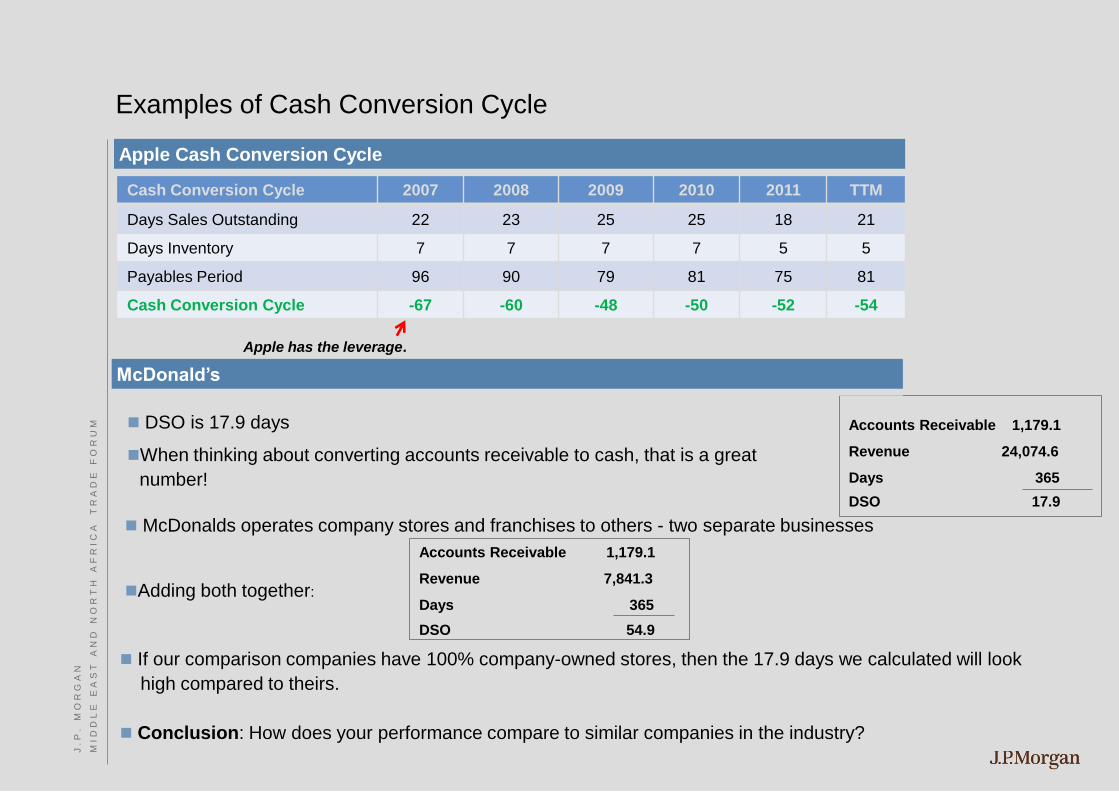
Apple has the leverage.
Examples of Cash Conversion Cycle
DSO is 17.9 days
When thinking about converting accounts receivable to cash, that is a great
number!
McDonalds operates company stores and franchises to others - two separate businesses
Adding both together:
If our comparison companies have 100% company-owned stores, then the 17.9 days we calculated will look
high compared to theirs.
Conclusion: How does your performance compare to similar companies in the industry?
Cash Conversion Cycle 2007 2008 2009 2010 2011 TTM
Days Sales Outstanding 22 23 25 25 18 21
Days Inventory 7 7 7 7 5 5
Payables Period 96 90 79 81 75 81
Cash Conversion Cycle -67 -60 -48 -50 -52 -54
Accounts Receivable 1,179.1
Revenue 24,074.6
Days 365
DSO 17.9
Accounts Receivable 1,179.1
Revenue 7,841.3
Days 365
DSO 54.9
Apple Cash Conversion Cycle
McDonald’s
J . P
.
M O
R G
A N
M I
D D
L E
E
A S
T A
N D
N
O R
T H
A
F R
I C
A
T R
A D
E
F O
R U
M

Ian Lyall
Compliance, Europe Middle East and Africa, J.P. Morgan
C O M P L I A N C E
J . P
.
M O
R G
A N
M I
D D
L E
E
A S
T A
N D
N
O R
T H
A
F R
I C
A
T R
A D
E
F O
R U
M
Agenda
Sanctions / Recent US Regulatory Actions and Settlements
Trade and AML / Sanctions
International Sanctions
Bureau of Industry and Security (BIS)
Anti-Corruption Program
Questions
J . P
.
M O
R G
A N
M I
D D
L E
E
A S
T A
N D
N
O R
T H
A
F R
I C
A
T R
A D
E
F O
R U
M
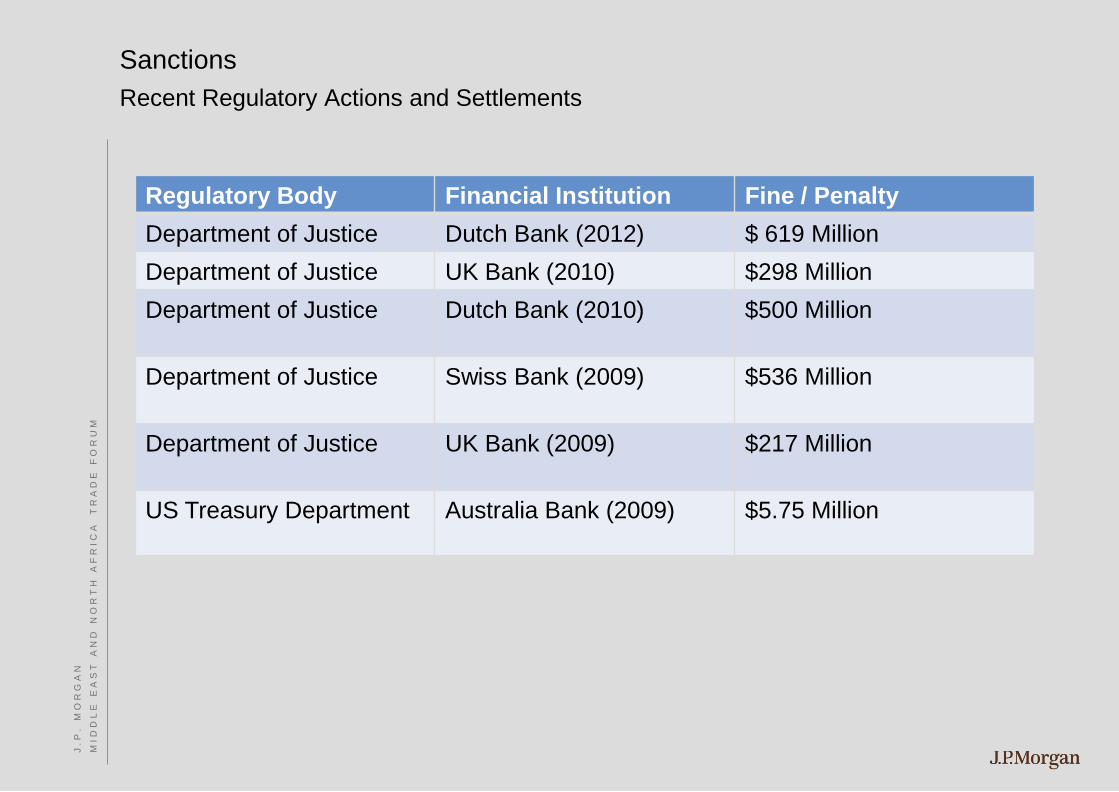
Sanctions
Recent Regulatory Actions and Settlements
Regulatory Body Financial Institution Fine / Penalty
Department of Justice Dutch Bank (2012) $ 619 Million
Department of Justice UK Bank (2010) $298 Million
Department of Justice
Dutch Bank (2010) $500 Million
Department of Justice
Swiss Bank (2009) $536 Million
Department of Justice
UK Bank (2009) $217 Million
US Treasury Department Australia Bank (2009) $5.75 Million
J . P
.
M O
R G
A N
M I
D D
L E
E
A S
T A
N D
N
O R
T H
A
F R
I C
A
T R
A D
E
F O
R U
M

Trade and AML/ Sanctions
There is much anecdotal information about trade and its high risk for money laundering
Regulatory interest is high
Few public domain case studies
The FATF paper (June 28, 2008) titled “Best Practices Paper on Trade Based Money Laundering”
characterizes trade as “one of the main methods by which criminal organizations and terrorist
financiers move money for the purpose of disguising its origins and integrating it into the formal
economy” and concludes that “many customs agencies, law enforcement agencies, financial
intelligence units (FIU), tax authorities and banking supervisors appear less capable of identifying
and combating trade-based money laundering than they are in dealing with other forms of money
laundering and terrorist financing.”
The Wolfsberg Group published a paper on Trade Finance Principles in January 2009 setting out
the responsibilities for each of the banks in the documentary credit and collection process.
Usually requires collusion between two or more parties
Over/Under Invoicing
Multiple invoicing
Short shipping
Over shipping
Shipping inferior/substandard goods
Deliberate concealment of the type of goods
J . P
.
M O
R G
A N
M I
D D
L E
E
A S
T A
N D
N
O R
T H
A
F R
I C
A
T R
A D
E
F O
R U
M

International Sanctions
TRADE
SANCTIONS2
FLIGHT BANS
RESTRICTIONS
ON ADMISSION
DIPLOMATIC
SANCTIONS1
FINANCIAL
SANCTIONS3
BOYCOTT
SPORTS OR
CULTURAL
EVENTS
SUSPEND
COOPERATION
WITH A THIRD
COUNTRY
Sanctions can range from economic/ trade sanctions to
more targeted measures. J.P. Morgan Chase and
other financial institutions are required to apply
financial/ trade sanctions including those issued by the
Office of Foreign Assets Control, OFAC.
Sanctions may include
1 Diplomatic sanctions such as expulsion of diplomats, severing of diplomatic ties, suspension of official visits 2 Trade sanctions such as general or specific trade sanctions, arms embargoes 3 Financial sanctions such as freezing of funds or economic resources, prohibition on financial transactions, restrictions on export credits or investment
J . P
.
M O
R G
A N
M I
D D
L E
E
A S
T A
N D
N
O R
T H
A
F R
I C
A
T R
A D
E
F O
R U
M
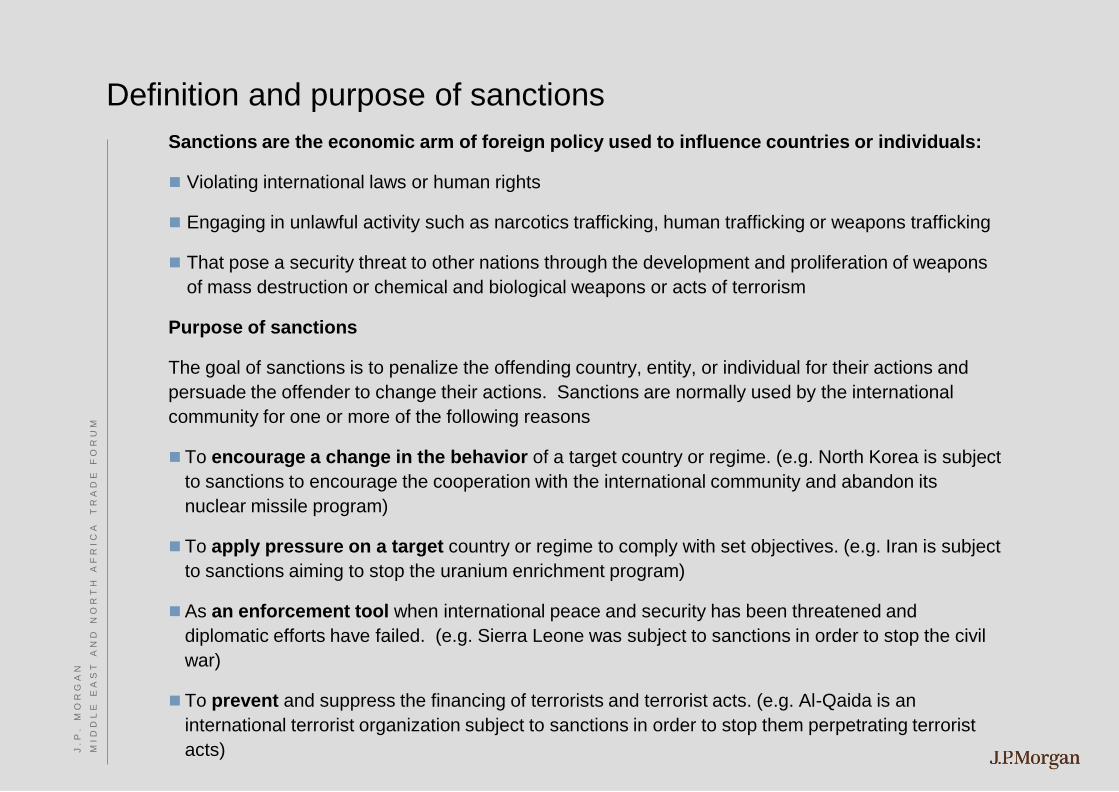
Definition and purpose of sanctions
Sanctions are the economic arm of foreign policy used to influence countries or individuals:
Violating international laws or human rights
Engaging in unlawful activity such as narcotics trafficking, human trafficking or weapons trafficking
That pose a security threat to other nations through the development and proliferation of weapons
of mass destruction or chemical and biological weapons or acts of terrorism
Purpose of sanctions
The goal of sanctions is to penalize the offending country, entity, or individual for their actions and
persuade the offender to change their actions. Sanctions are normally used by the international
community for one or more of the following reasons
To encourage a change in the behavior of a target country or regime. (e.g. North Korea is subject
to sanctions to encourage the cooperation with the international community and abandon its
nuclear missile program)
To apply pressure on a target country or regime to comply with set objectives. (e.g. Iran is subject
to sanctions aiming to stop the uranium enrichment program)
As an enforcement tool when international peace and security has been threatened and
diplomatic efforts have failed. (e.g. Sierra Leone was subject to sanctions in order to stop the civil
war)
To prevent and suppress the financing of terrorists and terrorist acts. (e.g. Al-Qaida is an
international terrorist organization subject to sanctions in order to stop them perpetrating terrorist
acts)
J . P
.
M O
R G
A N
M I
D D
L E
E
A S
T A
N D
N
O R
T H
A
F R
I C
A
T R
A D
E
F O
R U
M
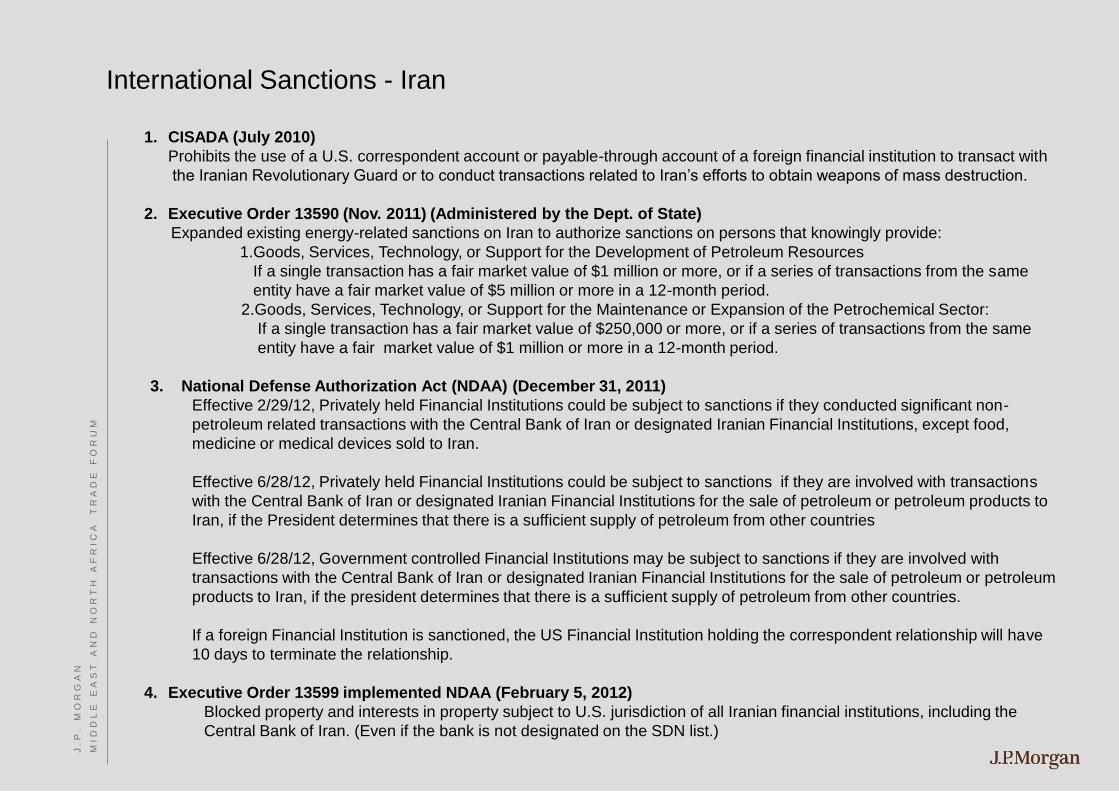
International Sanctions - Iran
1. CISADA (July 2010)
Prohibits the use of a U.S. correspondent account or payable-through account of a foreign financial institution to transact with
the Iranian Revolutionary Guard or to conduct transactions related to Iran’s efforts to obtain weapons of mass destruction.
2. Executive Order 13590 (Nov. 2011) (Administered by the Dept. of State)
Expanded existing energy-related sanctions on Iran to authorize sanctions on persons that knowingly provide:
1.Goods, Services, Technology, or Support for the Development of Petroleum Resources
If a single transaction has a fair market value of $1 million or more, or if a series of transactions from the same
entity have a fair market value of $5 million or more in a 12-month period.
2.Goods, Services, Technology, or Support for the Maintenance or Expansion of the Petrochemical Sector:
If a single transaction has a fair market value of $250,000 or more, or if a series of transactions from the same
entity have a fair market value of $1 million or more in a 12-month period.
3. National Defense Authorization Act (NDAA) (December 31, 2011)
Effective 2/29/12, Privately held Financial Institutions could be subject to sanctions if they conducted significant non-
petroleum related transactions with the Central Bank of Iran or designated Iranian Financial Institutions, except food,
medicine or medical devices sold to Iran.
Effective 6/28/12, Privately held Financial Institutions could be subject to sanctions if they are involved with transactions
with the Central Bank of Iran or designated Iranian Financial Institutions for the sale of petroleum or petroleum products to
Iran, if the President determines that there is a sufficient supply of petroleum from other countries
Effective 6/28/12, Government controlled Financial Institutions may be subject to sanctions if they are involved with
transactions with the Central Bank of Iran or designated Iranian Financial Institutions for the sale of petroleum or petroleum
products to Iran, if the president determines that there is a sufficient supply of petroleum from other countries.
If a foreign Financial Institution is sanctioned, the US Financial Institution holding the correspondent relationship will have
10 days to terminate the relationship.
4. Executive Order 13599 implemented NDAA (February 5, 2012)
Blocked property and interests in property subject to U.S. jurisdiction of all Iranian financial institutions, including the
Central Bank of Iran. (Even if the bank is not designated on the SDN list.)
J . P
.
M O
R G
A N
M I
D D
L E
E
A S
T A
N D
N
O R
T H
A
F R
I C
A
T R
A D
E
F O
R U
M
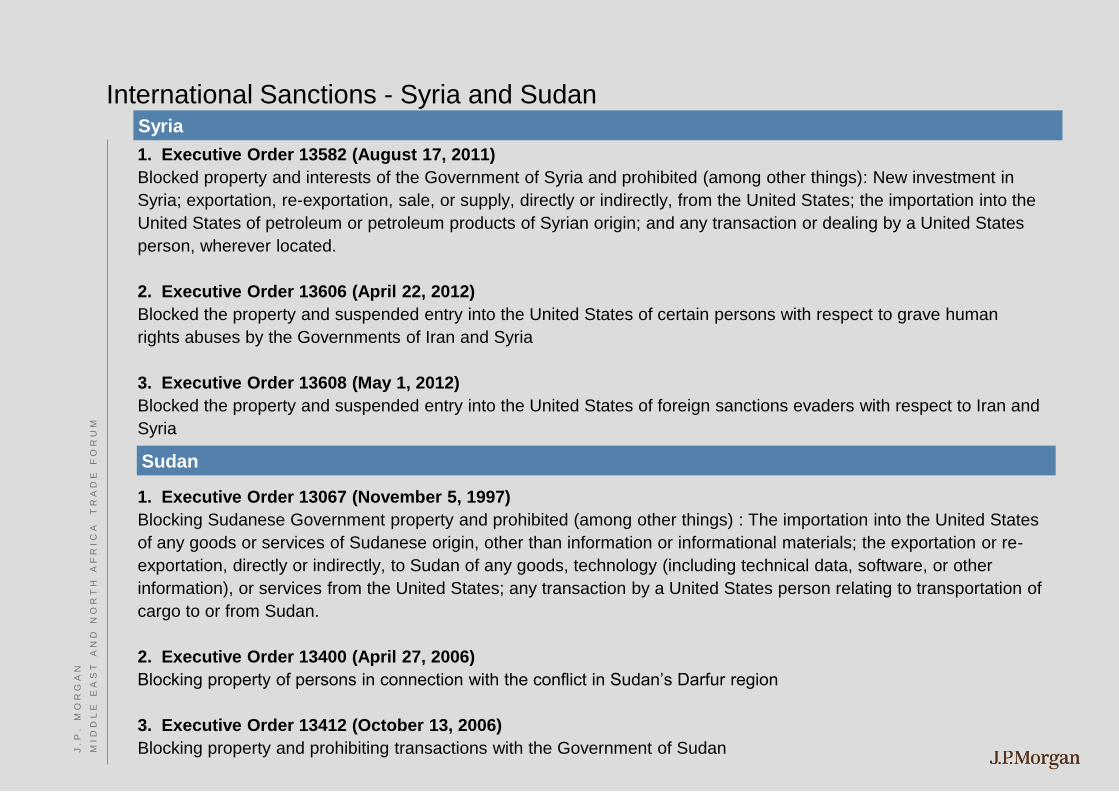
International Sanctions - Syria and Sudan
1. Executive Order 13582 (August 17, 2011)
Blocked property and interests of the Government of Syria and prohibited (among other things): New investment in
Syria; exportation, re-exportation, sale, or supply, directly or indirectly, from the United States; the importation into the
United States of petroleum or petroleum products of Syrian origin; and any transaction or dealing by a United States
person, wherever located.
2. Executive Order 13606 (April 22, 2012)
Blocked the property and suspended entry into the United States of certain persons with respect to grave human
rights abuses by the Governments of Iran and Syria
3. Executive Order 13608 (May 1, 2012)
Blocked the property and suspended entry into the United States of foreign sanctions evaders with respect to Iran and
Syria
1. Executive Order 13067 (November 5, 1997)
Blocking Sudanese Government property and prohibited (among other things) : The importation into the United States
of any goods or services of Sudanese origin, other than information or informational materials; the exportation or re-
exportation, directly or indirectly, to Sudan of any goods, technology (including technical data, software, or other
information), or services from the United States; any transaction by a United States person relating to transportation of
cargo to or from Sudan.
2. Executive Order 13400 (April 27, 2006)
Blocking property of persons in connection with the conflict in Sudan’s Darfur region
3. Executive Order 13412 (October 13, 2006)
Blocking property and prohibiting transactions with the Government of Sudan J . P
.
M O
R G
A N
M I
D D
L E
E
A S
T A
N D
N
O R
T H
A
F R
I C
A
T R
A D
E
F O
R U
M
Syria
Sudan
Sanctions Impact on Trade?
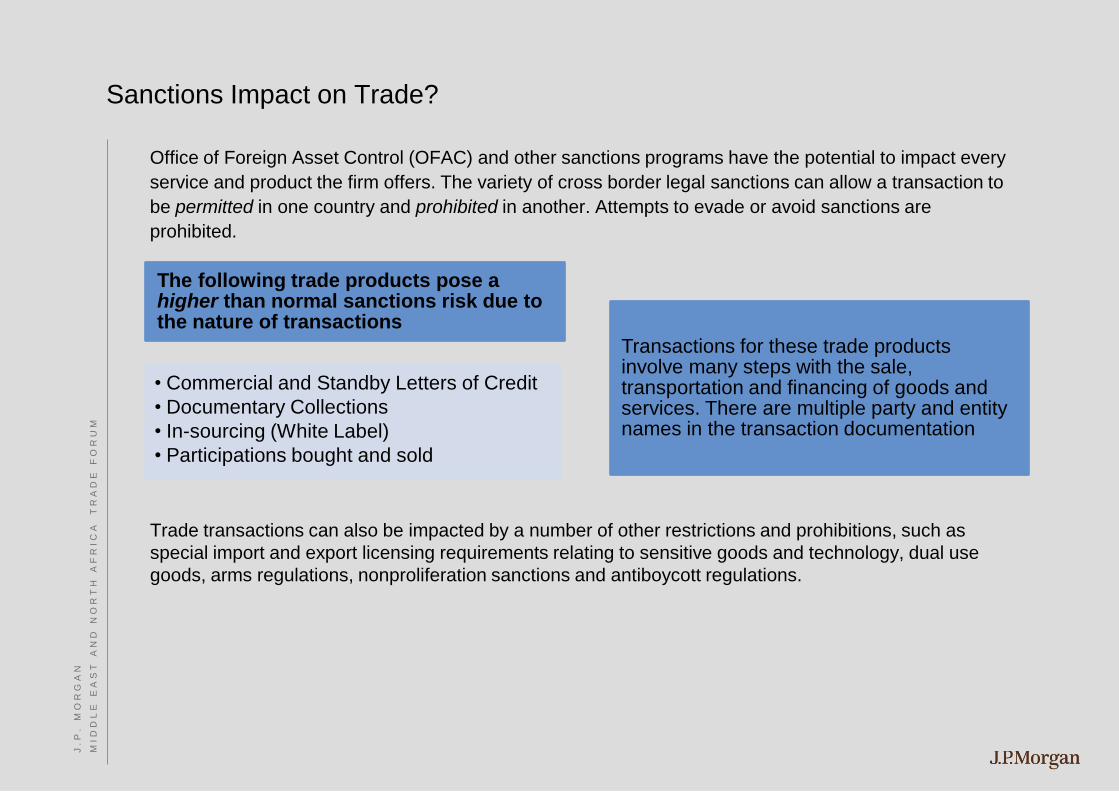
Office of Foreign Asset Control (OFAC) and other sanctions programs have the potential to impact every
service and product the firm offers. The variety of cross border legal sanctions can allow a transaction to
be permitted in one country and prohibited in another. Attempts to evade or avoid sanctions are
prohibited.
Trade transactions can also be impacted by a number of other restrictions and prohibitions, such as
special import and export licensing requirements relating to sensitive goods and technology, dual use
goods, arms regulations, nonproliferation sanctions and antiboycott regulations.
The following trade products pose a higher than normal sanctions risk due to the nature of transactions
• Commercial and Standby Letters of Credit
• Documentary Collections
• In-sourcing (White Label)
• Participations bought and sold
Transactions for these trade products involve many steps with the sale, transportation and financing of goods and services. There are multiple party and entity names in the transaction documentation
J . P
.
M O
R G
A N
M I
D D
L E
E
A S
T A
N D
N
O R
T H
A
F R
I C
A
T R
A D
E
F O
R U
M

Bureau of Industry and Security (BIS) – Dual Use Goods and Boycott Clauses
Bureau of Industry and Security (BIS) – a department within the U.S Department of Commerce charged with the
responsibility for U.S national security, foreign policy and economic interests. All U.S. financial institutions, regardless of
their locations, are required to comply with BIS regulations. Penalties for violations are severe and include the fines of up
to $250,000 per violation or twice the transaction value (whichever is greater) and imprisonment of up to ten years.
BIS Activities include
•Enforcement of antiboycott regulations – the laws are directed generally against foreign boycotts of countries friendly to the U.S.
•Regulation of export of sensitive goods and technology
•Enforcement of export controls, including dual use goods and technology – primarily commercial goods which have potential military applications (proliferation, national security and combating terrorism)
•Assistance of U.S. industry to comply with international arms control agreements
•Requiring compliance with sanctions against imports and exports of goods and cervices to certain Denied / Embargoes Persons
Examples of Dual Use Goods
•Computers;
• Integrated circuits;
•High energy devices;
•Telecommunications;
•Marine acoustic systems and equipment;
•Optical equipment (mirrors, components, cable);
•Chemical mixtures (e.g. ammonium bifluoride, ammonium nitrate, etc.);
•Alloys of metals (e.g. aluminum, lithium, magnesium, metal powder, etc.)
•Chemical compounds (e.g. beryllium, indium, etc.);
•Uranium, helium, hydrogen
BIS Lists
•Denied Persons List (DPL) – A list of entities and individuals that have been exporting privileges. Any dealings with a party on this list that would violate the terms of its denial order are prohibited.
•Unverified List – A list of parties where BIS has been unable to verify the end-user in prior transactions. The presence of a party on this list is a “Red Flag” that should be resolved before proceeding with the transaction.
•Entity List – A list of parties whose presence in a transaction can trigger license requirement under the Export Administration Regulations. The list specifies the license requirements that apply to each listed party, additional to the requirements under the Export Administration Regulations.
Antiboycott Clauses
•Examples of prohibited activities:
•Agreement to refuse or to refuse to do business with or in Israel or with blacklisted companies.
• Implementation of a letter of credit that contains prohibited terms and conditions.
•Agreement to discriminate or actually discriminate against a person, based on race, religion, sex, nationality or national origin.
•Examples of potential antiboycott language:
•Black list:
•Shipment of goods originating from Israel is strictly prohibited.
•Certificate from the manufacturer stating that they are not blacklisted.
•White List:
•Certificate from the steamship company or owner or master or their agents stating that the carrying vessel is allowed/eligible to enter U.A.E. ports.
J . P
.
M O
R G
A N
M I
D D
L E
E
A S
T A
N D
N
O R
T H
A
F R
I C
A
T R
A D
E
F O
R U
M

Policy/ Program Overview
• A statement of zero tolerance for bribery in all forms
• A strong statement from senior management, setting the tone from the top
• Facilitation payments prohibited
• Pre-clearance required for expenses benefitting government officials
• Strong controls governing the engagement of third parties that help develop business or seek government action
• Mandatory training to all relevant employees; enhanced training for higher risk employees
• Mechanisms provided for employees to self-report issues
Risk Assessment/ Monitoring Training
• Country Corruption Index
• Identification of high risk countries, industries, activities
• Increased attention to local legal requirements
• Monitoring process to enforce pre-clearance requirement
• Generate relevant metrics
• Centralization of due diligence for third party engagements
• Targeted training for high risk employees
• Develop best practices around required due diligence and contractual agreements
Third Party Oversight
• Third parties (that help develop business or seek government action) can create liability for the firm even if not directly paid by the bank
• Most enforcement actions involve third parties that pay bribes for their principals
• Regulatory expectation requiring strong controls
• Engagement of third parties must be treated as a significant event
Governance
• Board level reports
• Senior level accountability
• Increased corporate-level staffing
• Senior governance committee
• Designated legal and compliance officers
Anti-Corruption Program J . P
.
M O
R G
A N
M I
D D
L E
E
A S
T A
N D
N
O R
T H
A
F R
I C
A
T R
A D
E
F O
R U
M
Florence Coronel
Risk, Europe Middle East and Africa, J.P. Morgan
C R E D I T R I S K M A N A G E M E N T I N A
C H A L L E N G I N G E N V I R O N M E N T
J . P
.
M O
R G
A N
M I
D D
L E
E
A S
T A
N D
N
O R
T H
A
F R
I C
A
T R
A D
E
F O
R U
M

Agenda
Risk Management at J.P. Morgan
Pillars of Risk Management
Risk Ratings
Counterparty Credit Risk Analysis
Sovereign Risk
Reputational Risk Management
Market Themes and Risk Management Actions
Eurozone Crisis
Arab Spring
Other issues for risk managers
Q&A
J . P
.
M O
R G
A N
M I
D D
L E
E
A S
T A
N D
N
O R
T H
A
F R
I C
A
T R
A D
E
F O
R U
M
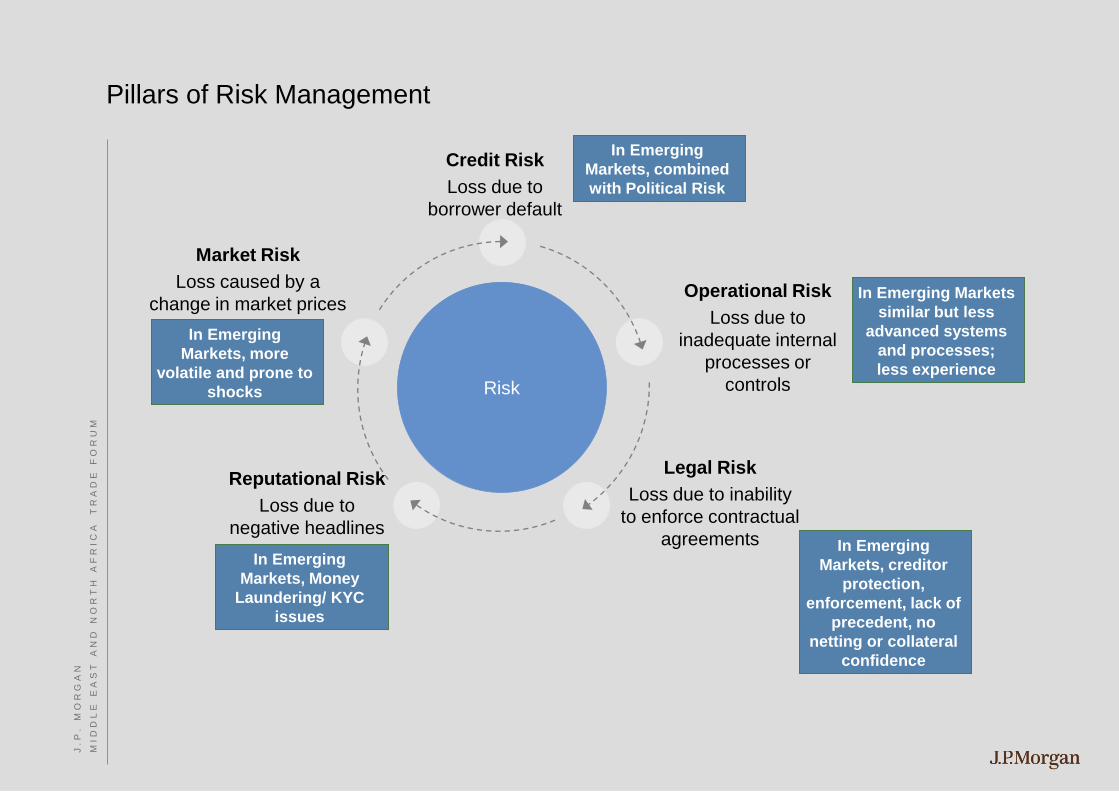
Pillars of Risk Management
Risk
Market Risk
Loss caused by a
change in market prices
or rates
Operational Risk
Loss due to
inadequate internal
processes or
controls
Credit Risk
Loss due to
borrower default
Reputational Risk
Loss due to
negative headlines
Legal Risk
Loss due to inability
to enforce contractual
agreements In Emerging
Markets, Money
Laundering/ KYC
issues
In Emerging
Markets, more
volatile and prone to
shocks
In Emerging
Markets, combined
with Political Risk
In Emerging
Markets, creditor
protection,
enforcement, lack of
precedent, no
netting or collateral
confidence
In Emerging Markets
similar but less
advanced systems
and processes;
less experience
J . P
.
M O
R G
A N
M I
D D
L E
E
A S
T A
N D
N
O R
T H
A
F R
I C
A
T R
A D
E
F O
R U
M

Risk ratings are used to manage credit exposures
J.P. Morgan risk ratings
Credit risk is the risk of loss from counterparty
default
Risk ratings are assigned to differentiate risk levels
J.P. Morgan risk ratings range from 1+ (low) to 10
(worst)
Corporate Counterparty Ratings
3 step risk grading process:
Stand-alone grade
Obligor grade
Facility grade
Risk Monitoring and Control
Credit risk is monitored at an aggregate portfolio,
industry and individual counterparty level
Risk ratings
J . P
.
M O
R G
A N
M I
D D
L E
E
A S
T A
N D
N
O R
T H
A
F R
I C
A
T R
A D
E
F O
R U
M
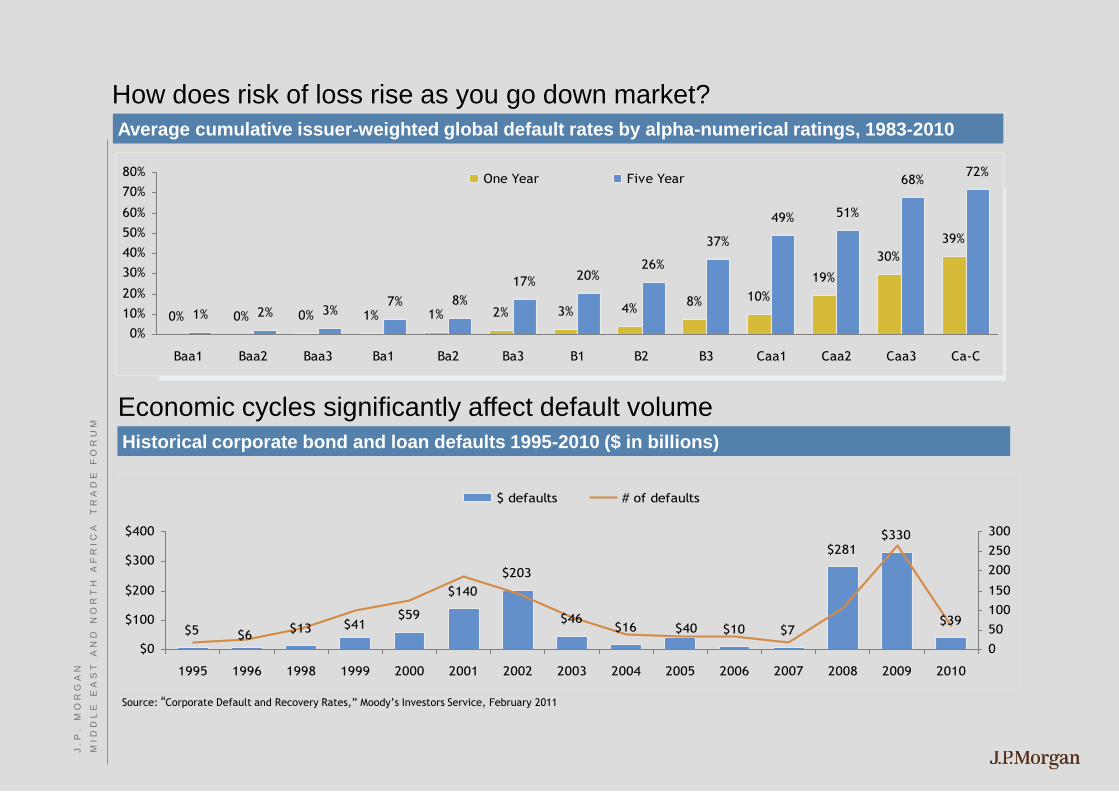
Historical corporate bond and loan defaults 1995-2010 ($ in billions)
How does risk of loss rise as you go down market?
Height: 2.00”
Width: 8.84”
Horizontal: 1.67”
Vertical: 2.00”
Source:
Average cumulative issuer-weighted global default rates by alpha-numerical ratings, 1983-2010
0% 0% 0% 1% 1% 2% 3% 4%8% 10%
19%
30%
39%
1% 2% 3%7% 8%
17% 20%26%
37%
49% 51%
68%72%
0%
10%
20%
30%
40%
50%
60%
70%
80%
Baa1 Baa2 Baa3 Ba1 Ba2 Ba3 B1 B2 B3 Caa1 Caa2 Caa3 Ca-C
One Year Five Year
$5 $13$59
$140
$203
$46$16 $10 $7
$281$330
$39$6
$41 $40
$0
$100
$200
$300
$400
1995 1996 1998 1999 2000 2001 2002 2003 2004 2005 2006 2007 2008 2009 2010
0
50
100
150
200
250
300
$ defaults # of defaults
Source: “Corporate Default and Recovery Rates,” Moody’s Investors Service, February 2011
Economic cycles significantly affect default volume
J . P
.
M O
R G
A N
M I
D D
L E
E
A S
T A
N D
N
O R
T H
A
F R
I C
A
T R
A D
E
F O
R U
M
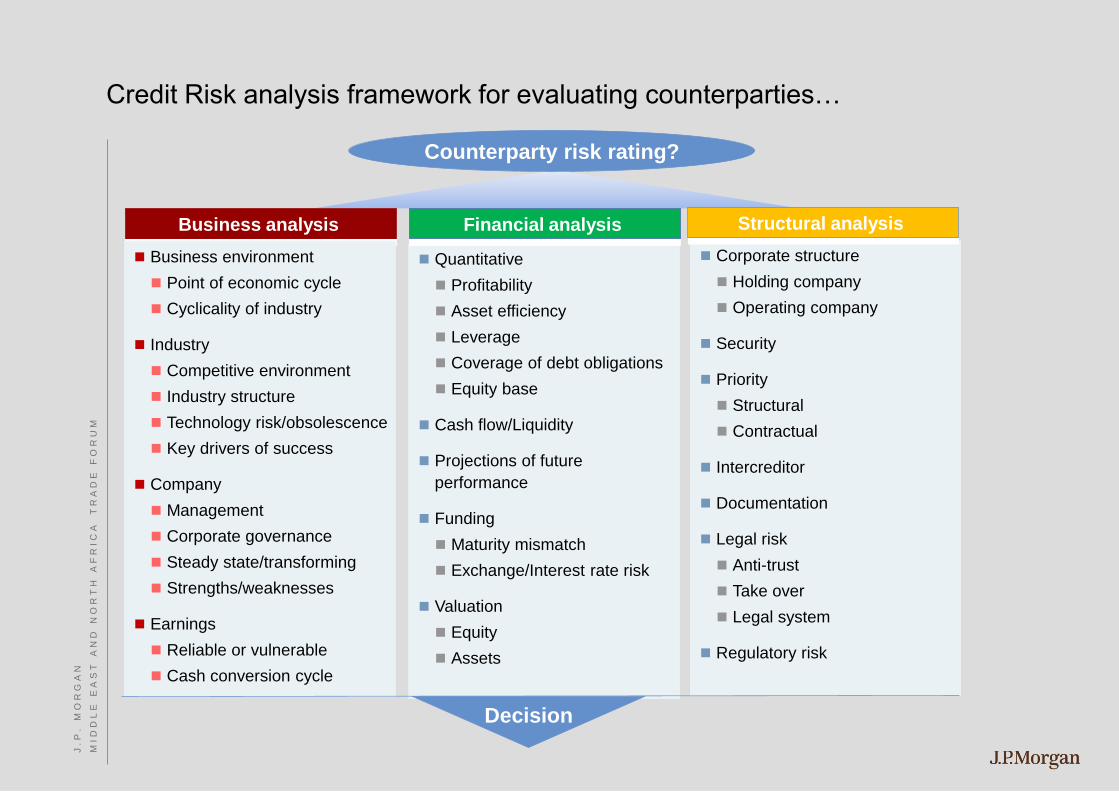
Credit Risk analysis framework for evaluating counterparties…
Quantitative
Profitability
Asset efficiency
Leverage
Coverage of debt obligations
Equity base
Cash flow/Liquidity
Projections of future
performance
Funding
Maturity mismatch
Exchange/Interest rate risk
Valuation
Equity
Assets
Corporate structure
Holding company
Operating company
Security
Priority
Structural
Contractual
Intercreditor
Documentation
Legal risk
Anti-trust
Take over
Legal system
Regulatory risk
Business analysis Financial analysis Structural analysis
Business environment
Point of economic cycle
Cyclicality of industry
Industry
Competitive environment
Industry structure
Technology risk/obsolescence
Key drivers of success
Company
Management
Corporate governance
Steady state/transforming
Strengths/weaknesses
Earnings
Reliable or vulnerable
Cash conversion cycle
Decision
Counterparty risk rating?
J . P
.
M O
R G
A N
M I
D D
L E
E
A S
T A
N D
N
O R
T H
A
F R
I C
A
T R
A D
E
F O
R U
M
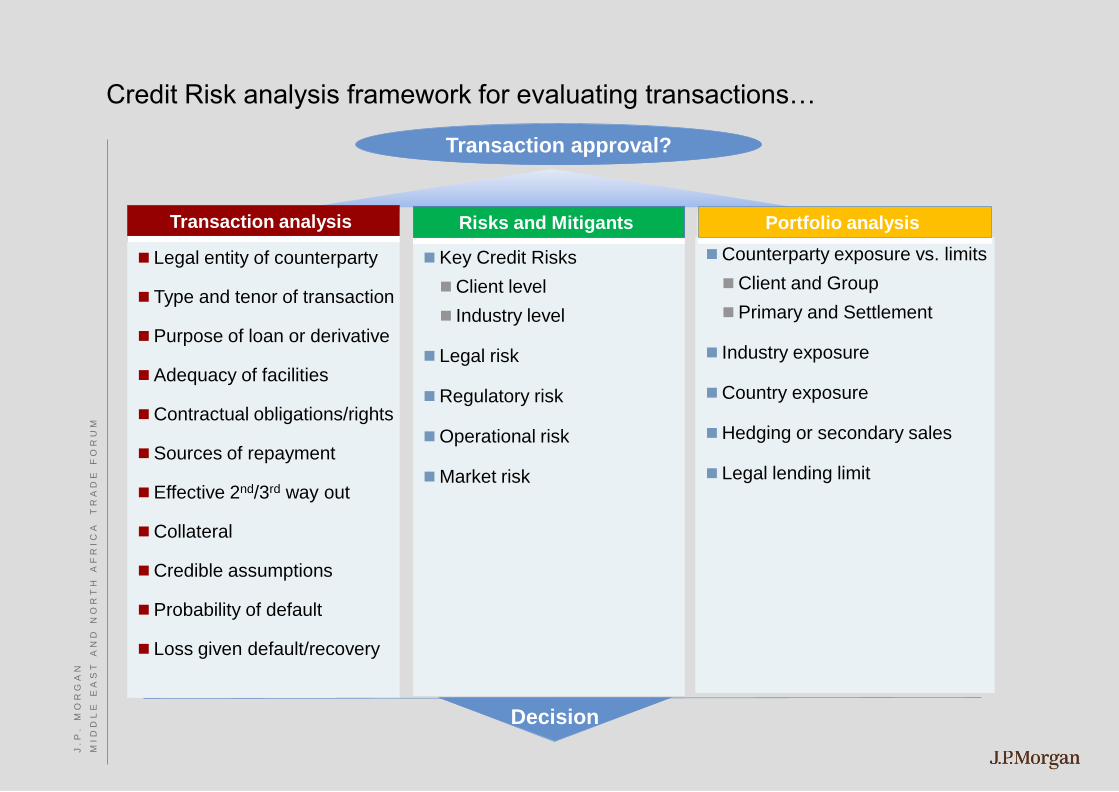
Credit Risk analysis framework for evaluating transactions…
Key Credit Risks
Client level
Industry level
Legal risk
Regulatory risk
Operational risk
Market risk
Counterparty exposure vs. limits
Client and Group
Primary and Settlement
Industry exposure
Country exposure
Hedging or secondary sales
Legal lending limit
Transaction analysis Risks and Mitigants Portfolio analysis
Legal entity of counterparty
Type and tenor of transaction
Purpose of loan or derivative
Adequacy of facilities
Contractual obligations/rights
Sources of repayment
Effective 2nd/3rd way out
Collateral
Credible assumptions
Probability of default
Loss given default/recovery
Decision
Transaction approval?
J . P
.
M O
R G
A N
M I
D D
L E
E
A S
T A
N D
N
O R
T H
A
F R
I C
A
T R
A D
E
F O
R U
M
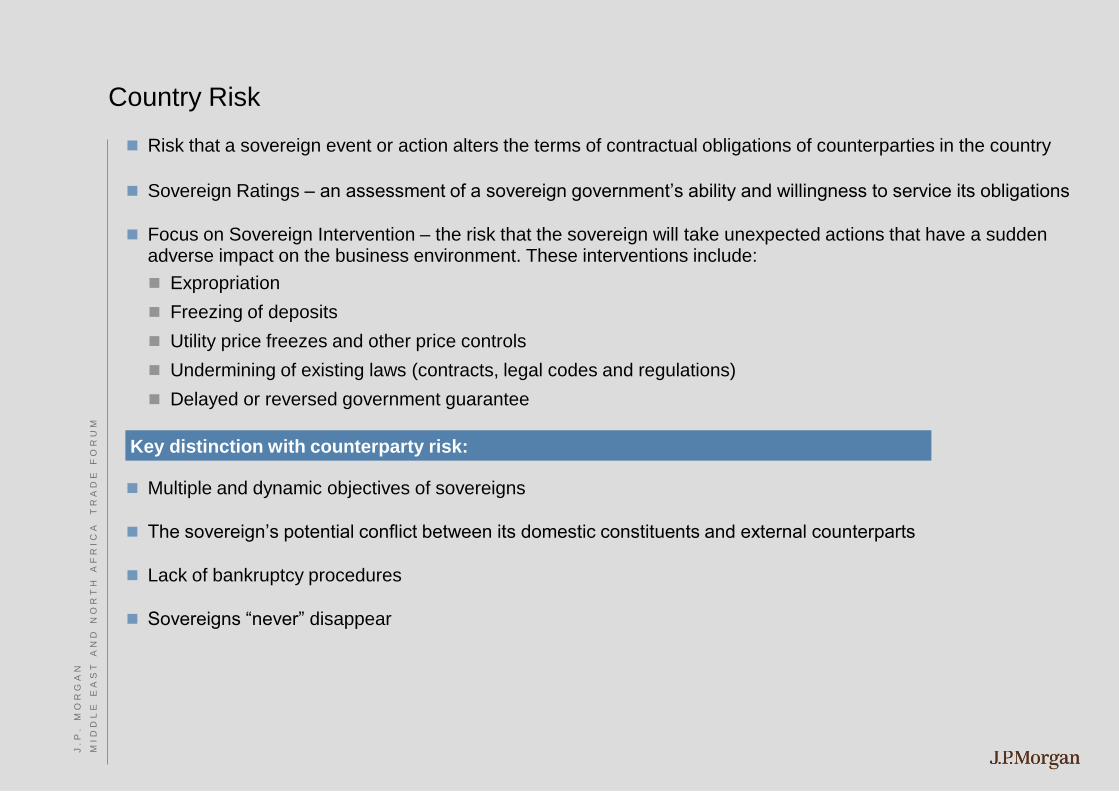
Risk that a sovereign event or action alters the terms of contractual obligations of counterparties in the country
Sovereign Ratings – an assessment of a sovereign government’s ability and willingness to service its obligations
Focus on Sovereign Intervention – the risk that the sovereign will take unexpected actions that have a sudden adverse impact on the business environment. These interventions include:
Expropriation
Freezing of deposits
Utility price freezes and other price controls
Undermining of existing laws (contracts, legal codes and regulations)
Delayed or reversed government guarantee
Multiple and dynamic objectives of sovereigns
The sovereign’s potential conflict between its domestic constituents and external counterparts
Lack of bankruptcy procedures
Sovereigns “never” disappear
Country Risk J . P
.
M O
R G
A N
M I
D D
L E
E
A S
T A
N D
N
O R
T H
A
F R
I C
A
T R
A D
E
F O
R U
M
Key distinction with counterparty risk:

Reputation Risk
Exists in virtually every activity, transaction and relationship
Reputation risk is hard to measure and difficult to discern
It can lead to lost business and ultimately a failure of confidence by our clients and counterparties.
Such failure has in the past resulted in failure of financial firms
It can impair our relationship with our regulators
It can affect our ability to attract the best employees
Reputation risk is among the most complex risks facing a financial institution
Definition: The potential for loss of confidence in an institution’s integrity resulting
from adverse publicity – true or not – over its practices and associations
J . P
.
M O
R G
A N
M I
D D
L E
E
A S
T A
N D
N
O R
T H
A
F R
I C
A
T R
A D
E
F O
R U
M

Managing Reputation Risk
Individual accountability and responsibility for working in a manner consistent with
the highest ethical standard
Vetting clients and transactions
Due diligence
Investigations
Approval process
Internal escalation process
Reputation Risk Committees
LOB Risk Committees
Conflicts Office
Risk Control oversight functions
Compliance
Audit
Policies
While we cannot remove reputation risk, we can make efforts to minimize it
J . P
.
M O
R G
A N
M I
D D
L E
E
A S
T A
N D
N
O R
T H
A
F R
I C
A
T R
A D
E
F O
R U
M

Slower economic growth in most developed markets
Sovereign debt default concerns in the Eurozone
Political instability in Middle East and North Africa
Regulatory and political scrutiny of the banking industry
Higher capital and liquidity requirements under Basel III
Emerging markets still transforming
J.P. Morgan expansion into new countries in Sub-Saharan Africa
Recent market events are unprecedented and pose tremendous challenges
What are the background issues that J.P. Morgan Risk Management are currently dealing with?
Credit Challenges in 2012 J . P
.
M O
R G
A N
M I
D D
L E
E
A S
T A
N D
N
O R
T H
A
F R
I C
A
T R
A D
E
F O
R U
M

Middle East and North Africa Turmoil J . P
.
M O
R G
A N
M I
D D
L E
E
A S
T A
N D
N
O R
T H
A
F R
I C
A
T R
A D
E
F O
R U
M
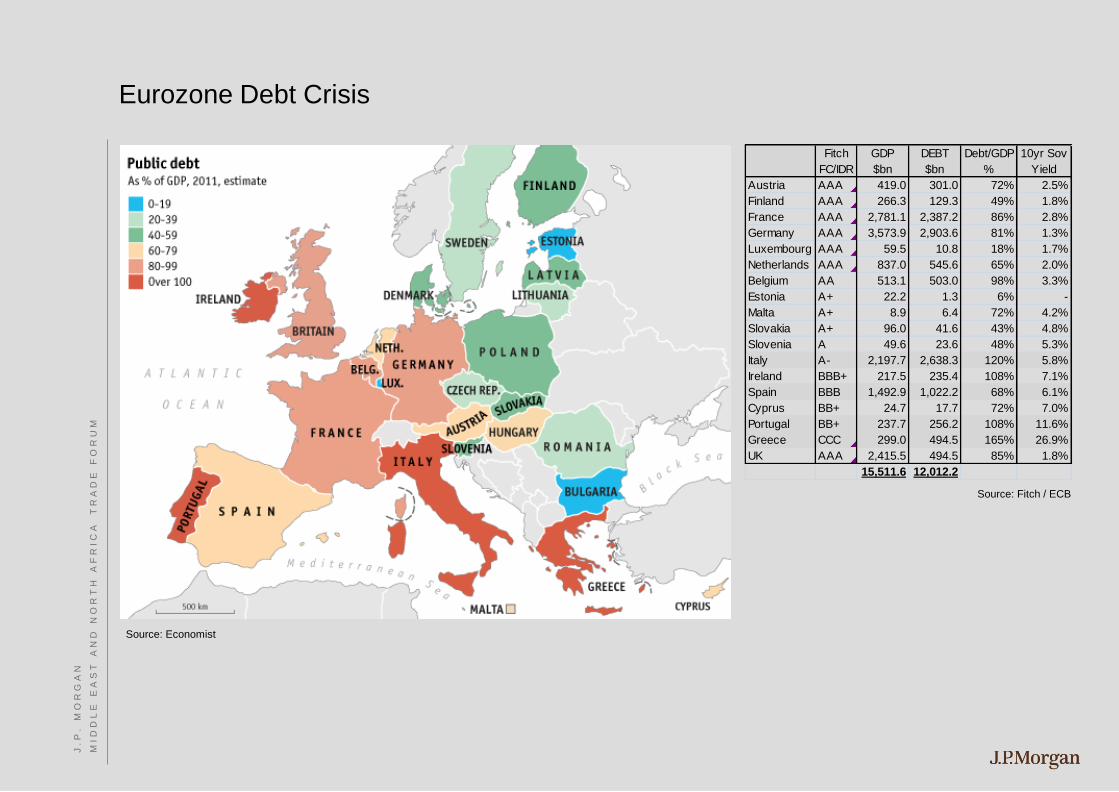
Eurozone Debt Crisis
Source: Economist
Source: Fitch / ECB
Fitch
FC/IDR
GDP
$bn
DEBT
$bn
Debt/GDP
%
10yr Sov
Yield
Austria AAA 419.0 301.0 72% 2.5%
Finland AAA 266.3 129.3 49% 1.8%
France AAA 2,781.1 2,387.2 86% 2.8%
Germany AAA 3,573.9 2,903.6 81% 1.3%
Luxembourg AAA 59.5 10.8 18% 1.7%
Netherlands AAA 837.0 545.6 65% 2.0%
Belgium AA 513.1 503.0 98% 3.3%
Estonia A+ 22.2 1.3 6% -
Malta A+ 8.9 6.4 72% 4.2%
Slovakia A+ 96.0 41.6 43% 4.8%
Slovenia A 49.6 23.6 48% 5.3%
Italy A- 2,197.7 2,638.3 120% 5.8%
Ireland BBB+ 217.5 235.4 108% 7.1%
Spain BBB 1,492.9 1,022.2 68% 6.1%
Cyprus BB+ 24.7 17.7 72% 7.0%
Portugal BB+ 237.7 256.2 108% 11.6%
Greece CCC 299.0 494.5 165% 26.9%
UK AAA 2,415.5 494.5 85% 1.8%
15,511.6 12,012.2
J . P
.
M O
R G
A N
M I
D D
L E
E
A S
T A
N D
N
O R
T H
A
F R
I C
A
T R
A D
E
F O
R U
M
Impact from slower developed market economic growth – greater emphasis on Emerging Markets?
Sovereign debt default in the Eurozone?
What if interest rates rise rapidly to counter inflation in Emerging Markets?
Will poor corporate governance and transparency hinder bank asset quality in Emerging Markets?
Can Regulators keep up with Basel III and banking product advances in Emerging Markets?
Whatever happens – be prepared!
Cash/ liquidity is king
Avoid concentrations
Be ready for the unexpected - think holistically
Sound risk management more important than ever
Themes to look out for
Near Term Outlook J . P
.
M O
R G
A N
M I
D D
L E
E
A S
T A
N D
N
O R
T H
A
F R
I C
A
T R
A D
E
F O
R U
M

Moderator:
Zeeshan Khan, Global Trade, Middle East and North Africa, J.P. Morgan
Panellists:
Azmi Shaban, Shaban Group
Santosh Babu Karkera, A. A. Bin Hindi Group
Guillermo Arias, General Motors
Neeraj Tekchandani, Apparel FZCO
C O R P O R A T E P E R S P E C T I V E S O N T H E
S T A T E O F T H E R E G I O N A L M A R K E T
J . P
.
M O
R G
A N
M I
D D
L E
E
A S
T A
N D
N
O R
T H
A
F R
I C
A
T R
A D
E
F O
R U
M