jrc bibliometric analysis -...
TRANSCRIPT

The research performance of the
European Commissionrsquos
Science and Knowledge Service
Joint Research Centre (2007-2015)
A bibliometric analysis
Koen Jonkers
Juan Carlos Del Rio
Niels Meyer
June 2017
EUR 28647 EN
This publication is a Technical report by the Joint Research Centre (JRC) the European Commissionrsquos science and knowledge service It aims to provide evidence-based scientific support to the European policymaking process The scientific output expressed does not imply a
policy position of the European Commission Neither the European Commission nor any person acting on behalf of the Commission is responsible for the use that might be made of this publication
Contact information Name Koen Jonkers Address Marsveldstraat 21 B-1050 Brussels
Email koenjonkerseceuropaeu Tel +32 229 57113
JRC Science Hub httpseceuropaeujrc
JRC107025
EUR 28647 EN
PDF ISBN 978-92-79-69557-5 ISSN 1831-9424 doi102760286276
Luxembourg Publications Office of the European Union 2017
copy European Union 2017
The reuse of the document is authorised provided the source is acknowledged and the original meaning or message of the texts are not
distorted The European Commission shall not be held liable for any consequences stemming from the reuse
How to cite this report Koen Jonkers Juan Carlos Del Rio Niels Meyer The research performance of the European Commissionrsquos Science and Knowledge Service Joint Research Centre (2007-2015) EUR 28647 EN doi102760286276
All images copy European Union 2017
3
Contents
1 Introduction 7
2 Methodology 9
21 Field definitions 9
22 Normalising name variants 9
23 Time frame 9
24 Comparator organisations 10
25 Metrics and research performance indicators 11
26 Task description 12
27 Methodology 12
3 Results 13
31 Analysis of JRC research performance 13
32 Analysis of JRC research performance - ESI fields 16
33 Analysis of JRC performance - WoS fields 18
34 Comparator analysis JRC versus benchmark organizations 22
4 Discussion and conclusions 25
Literature references 27
List of figures 28
List of tables 29
Annex 1 Annual trends in publication output of the comparator organisations 30
4
Foreword
This report was requested in support of an interim evaluation of the JRCrsquos research activities under
Horizon 2020 the EU Framework Programme for Research and Innovation to be carried out with the
assistance of independent experts
5
Acknowledgments
This report is a follow up to a previous report prepared by Thomson Reuters Peter Fako provided
assistance in the micro-level publication analysis The report has been internally reviewed by Pieter
van Nes and Goumlran Loumlvestam Professor Robert Tijssen from the Centre for Science and Technology
Studies at Leiden University validated the methodology and reviewed the document as external
bibliometric expert
6
Executive summary
This report presents an assessment of the JRCs scientific and technical research activities in the
period 2007-2015 focusing on research outputs and citation impact It complements a 2014 report
drafted by Thomson Reuters The aim of the report is to inform a panel of independent experts who
will carry out an implementation review of the JRC half way the EU Framework Programme for
Research and Innovation Horizon 2020
The report provides information on the number of JRC research publications and the scientific
impact of those publications based on data and metrics derived from Thomson Reuterrsquos InCites
platform and the Web of Science database
The total number of JRC publications during the period under study was 6 970 Of these publications
1 362 ranked in the worldrsquos top 10 highly cited publications as categorised per scientific field
which means a 20 ratio of highly cited papers This is almost twice the world-average
performance A notable increase in the number of highly cited publications gives an indication of an
improved JRC performance
The JRCrsquos share of top 1 highly cited publication per field is more than three times the world
average in recent years A considerable number of JRC publications thus have a major impact in the
scientific literature The high score on this metric may be related to the regulatory science role of
the JRC
The five fields of science in which the JRC produces most publications are Environmental Sciences
Nuclear Science amp Technology Material Science Analytical Chemistry and Meteorology amp
Atmospheric Science
The field-normalised citation impact (FNCI) is 65 above the average world level For some fields
high productivity and impact overlap These areas of excellence include Ecology Energy amp Fuels
Environmental Studies Environmental Sciences Toxicology Applied Physics and Meteorology amp
Atmospheric Sciences There are also some fields of large JRC publication productivity with relatively
low citation impact Very few of those fields have an FNCI score below world average
Around 81 of the JRCrsquos highly cited publications are the result of international co-operation For
39 of the highly cited publications a JRC researcher is the corresponding author This indicates
that to a significant extent the highly cited publications are the result of JRC research activities
In terms of the shares of highly cited publications the JRC performs at a similar level as top level
lsquobasic science organisationsrsquo such as leading research universities and public research centres The
same can be said for the FNCI metric where the JRC outperforms most of its comparator
organisations in fields of major research activity like Environmental Sciences and in Geosciences
As for JRCrsquos outreach to industry the share of JRC research publications that are co-produced with
private-sector partners (business enterprises and industry) may provide some indication of the
contribution to innovations and future socioeconomic impacts With 35 of its peer-reviewed
scientific articles published together with private sector partners the JRC has a percentage score on
par with EPA and NIST in the US or the CEA in France While the score is lower than that of typical
research and technology organisations (RTOs) such as Fraunhofer (DE) TNO (NL) and VTT (SF) for
which working with industry is a core part of their mission it is significantly higher than for most of
the academic science organisations such as Oxford University and the Max Planck Society
7
1 Introduction
As the European Commissions science and knowledge service the Joint Research Centres (JRC)
mission is lsquoto support EU policies with independent evidence throughout the whole policy cycle Its
work has a direct impact on the lives of citizens by contributing with its research outcomes to a
healthy and safe environment secure energy supplies sustainable mobility and consumer health and
safetyrsquo
In 2014 the JRC carried out an evaluation of its research performance as part of a broader effort by
the EC to evaluate and monitor the outcome of the FP7 For this purpose Thomson Reuters (TR)1 an
international media conglomerate and data provider prepared a data analytical report2 responding
to a list of open questions that were designed to measure the quantity and quality of JRC research
publication outputs Traditional lsquobibliometricrsquo data ndash ie publication counts scientific references to
publications (lsquocitationsrsquo) as well as the institutional affiliations of the authors3 ndash were extracted
from the TR-owned Web of Science database (WoS) and analysed to provide a clearer picture of the
international comparative state of research at the JRC
Against this background the current document provides an update of the abovementioned
Thomson Reuters report This assessment of the JRCs scientific and technical research activities in
the period 2007-2015 solely focuses on research outputs and citation impact4
A grand total of 6 970 publications were identified within the WoS5 for the publication years 2007-
2015 where the author address list on each publication mentions at least one JRC affiliation This is
the core bibliographical dataset that was used for the lsquobibliometricrsquo data analysis underlying this
report6 A corresponding set of publications for a group of comparator organisations was extracted
1 The Thomson Reuters division that owned the Web of Science and related information products such as the InCitestrade platform and
Essential Science Indicators was sold to a new company Clarivate Analytics in late 2016 Given the fact that our data refer to earlier
years and for the sake of internal consistency with the prior report we will keep referring throughout this report to Thomson Reuters
as the owner of the information source 2 Thomson Reuters (2014) ldquoEvaluation of the Research Performance of the Joint Research Centre of the European Commission during
the 7th Framework Programme (2007-2013)rdquo httpseceuropaeujrcsitesjrcshfilesthomson-reuters-study-2007-2013pdf 3 The field of lsquobibliometricsrsquo is devoted to the measurement of science and research performance based on information retrieved from
(online) published scientific documents especially research articles in scientific and technical journals contributions to conference
proceedings and academic books The most well-known measures are based on publication outputs and citation-based scientific
impact 4 The report focus is thus solely on research outputs and impacts and does not consider inputs (such as researcher FTE or funding) It
will therefore not include measures of productivity or effectiveness The main methodological problem which underlies this decision is
the lack of information on the amount of time and funding devoted to fundamental research This issue holds for both the JRC as well
as for the comparator organisations to which it will be benchmarked No reliable assessment or comparison was deemed possible 5 Both the Web of Science (WoS) database and Scopus database provide powerful analytical tools for advanced citation analysis Both
include many thousands of scholarly journals Although the journal inclusion criteria in Scopus are similar to the Web of Science and
the databases are similar in their coverage of the worlds science (Moya-Anegon et al 2007 p 76) coverage differences between the
two remain While Scopus includes more trade journals and national language journals the worldrsquos major lsquocorersquo journals are thought
to be sufficiently covered in both databases If the bibliometric analyses would have been based on Scopus somewhat different
results would have been found but general patterns and trends ndash at the aggregate level of the studied large research-active
organisations - would most likely have been the same 6 To understand how representative WoS-indexed research publications are for JRC publication productivity the records kept of JRC
publication output as presented in the PRIME report are explored Across all fields the WoS-indexed publications represent 61 of all
JRC publications The Scopus database produced by the publisher Elsevier has a somewhat broader coverage ndash 4 of JRC
publications are covered in Scopus and not in the WoS Other publications contributed to books or periodicals comprise another 32
of publications which are not covered by these two main databases Monographs and books represent 2 and PhD theses another
8
for this time period in order to benchmark the JRC research performance The analysis comprises
two levels (1) all fields of science in total and (2) selected fields
The aim of this report is to inform a qualitative expert peer assessment of the JRC performance
across all JRC research fields by analysing the scientific output and impact of JRC research (as
measured by the number of publications and an analysis of the citations these publications
received)
1 of JRC publication output (JRC Productivity and Impact Report Results from PRIME 2015 (2016) Ref Ares(2016)2889992 -
22062016) This provides some indication of the relative representativeness of the WoS database
9
2 Methodology
In general most methodological choices were made in order to produce an updated report that is as
similar and comparable to the previous report as possible To this end the analysts used the TR-
owned InCitestrade platform which produces publication metrics and citation indicators based on the
Web of Science (WoS) database Some methodological improvements have however been made
This section discusses the methodological choices that were made and explains how this analytical
report differs from the TR 2014 report
21 Field definitions
Each of the research publications selected from the WoS were assigned to one or more fields of
science These fields were defined in two ways according to
(1) TRrsquos 22 Essential Science Indicators (ESI) categories This has the advantage that each publication
is assigned to a single broad mutually-exclusive category In principle the report thus covers
(almost) all JRC research through this approach and does not engage in double counting ie the
results from the different lsquoESI fieldsrsquo can be added to attain the total volume of JRC-produced
publications
(2) TRrsquos WoS Journal Subject categories which allows for a much more fine grained analysis of fields
of research activity at the level of 256 (overlapping) fields A publication can be assigned to multiple
lsquoWoS fieldsrsquo depending on the cross-field coverage of the journal in which the publication appeared
It is difficult to represent the JRC research profile for all 256 lsquoWoS fieldsrsquo The selection was therefore
restricted to the 35 fields with the highest publication volume The number of publications in each of
the categories is sufficiently large to ensure statistically robust data for each selected field Both sets
of fields (ESI fields and WoS fields) are presented in the report
22 Normalising name variants
In consultation with TRsrsquo InCites team a few minor improvements were made in the harmonisation
of JRCrsquos organisation name variants as they appear in the author addresses in WoS-indexed research
publications These minor adaptations will not have had a major effect on the analyses carried out
by TR in 2014 For the comparator organisations to be discussed in the next section TR has carried
out a similar process of organisational name harmonisation in the InCites platform
23 Time frame
One of the most significant differences in the current report compared to the 2014 report is that the
analysis goes up to the year 20157 To explore trends it was decided to provide an analysis covering
the entire FP7 timespan (2007-2013) and the first part of Horizon 2020 (2014 and 2015)
7 The time frame applied within the Thomson Reutersrsquo study did not extend beyond 2013
10
24 Comparator organisations
This report takes the 16 organisations identified by the JRC and TR for the TR 2014 report It
compares the JRCrsquos performance with the performance of these organisations When comparing it is
important to realise that the nature of these organisations can be quite different from the JRC8 The
TR group of comparators (see Table 1) includes some major research universities which apart from
having substantial resources for basic lsquodiscovery-orientedrsquo research also have an important teaching
and training function Although the JRC also has a training role it is less of a core activity than at
universities Like the JRC these universities may play a role in lsquosupporting policymakers with
independent evidence throughout the whole policy cyclersquo but this is not their core objective The
same can be said for large public research organisations such as the Max-Planck-Gesellschaft (MPG)
(Germany) the Consiglio Nazionale delle Ricerche (CNR) (Italy) and the CNRS (France)9 These
organisations tend to be focused more on basic research and have a different relationship with
policy-making bodies than the JRC has
Table 1 Comparator organisations
1 Commissariat agrave lrsquoeacutenergie atomique et aux eacutenergies alternatives (CEA) France
2 Centre national de la recherche scientifique (CNRS) France
3 Max-Planck-Gesellschaft (MPS) Germany
4 Oak Ridge National Laboratory (ORNL) United States
5 Argonne National Laboratory (ANL) United States
6 Consiglio Nazionale delle Ricerche (CNR)Italy
7 VTT Technical Research Centre of Finland (VTT)Finland
8 University of Oxford (OX) United Kingdom
9 National Institute of Standards and Technology (NIST) United States
10 National Physical Laboratory (NPL) United Kingdom
11 University of Cambridge (CAM) United Kingdom
12 Austrian Research Centre (AITARC) Austria
13 Fraunhofer-Gesellschaft (FG) Germany
14 Netherlands Organisation for Applied Scientific Research (TNO) Netherlands
15 Environmental Protection Agency (EPA) United States
16 Commonwealth Scientific and Industrial Research Organisation (CSIRO) Australia
17 Rikagaku Kenkyūsho (RIKEN) Japan
18 Chinese Academy of Science (CAS) China
19 Institut national de la recherche agronomique (INRA) France
8 As the European Commissions science and knowledge service the Joint Research Centres mission is to support EU policies with
independent evidence throughout the whole policy cycle 9 Cruz Castro Bleda Jonkers Derrick Martinez Sanz Menendez (2011) lsquoOECD IPP actor brief public research organisationsrsquo
11
The list of organisations selected by the JRC for the TR report underwent some adaptation Firstly
instead of including only the policy advice unit of the US Environmental Protection Agency (US EPA)
the total organisation was included for analysis This was done because the policy advice unit
produces only a handful of publications a year The Spanish organisation CIEMAT a network of
Research and Technology Organisations (RTOs) has been excluded for methodological reasons as its
string of organisational name variants were not harmonized in the InCites information platform In
addition a few additional organisations such as CSIRO in Australia were added CSIRO was
considered to have a degree of similarity to the JRC both in its development history and its current
mission Other additional organisations include INRA in France the Chinese Academy of Sciences in
China and RIKEN in Japan The list of organisations has been validated by Pieter van Nes the Chief
Evaluating Officer of the JRC
25 Metrics and research performance indicators
The set of performance measures comprises the following six metrics1011
Number of publications frequency count of research publications (co-)authored by the JRC or the
comparator organisations12
Number of highly cited publications frequency count of publications falling within the top 10 and
top 1 13 highly cited publications per field produced worldwide14
Share of highly cited publications15 percentage of JRC publications that falls within the top 10
and top 1 highly cited publications produced worldwide
Share of non-cited publications percentage of publications that had not received any citations in
the period 2007-2015 from other Web of Science indexed publications
Field-normalised citation impact (FNCI)16 number of citations per publication received up until April
2017 normalised by the world-average citation rate per field and publication year The FNCI score
allows comparisons between organisations of different sizes and research portfolios An FNCI value
10 The definitions of these indicators is derived from the InCites Indicator Handbook
httpresearchanalyticsthomsonreuterscommpdfsindicators-handbookpdf 11 A lsquometricrsquo is a measurement or a measurement scale related to a specific observable phenomenon whereas an lsquoindicatorrsquo is usually
defined as a (composite) lsquoproxyrsquo score that reflects a higher-level or more abstract phenomenon 12 InCites uses absolute counting to calculate this metric This means that a publication which is co-authored by two (or more)
organisations is counted as one publication for each organisation 13 The number and share of top 1 most highly cited publications is reported because even if the numbers involved are small these
publications are especially interesting given the skewedness of citation distributions Such publications can have a disproportionate
influence 14 The definition of highly cited publication used in this report follows international common practice (eg Hicks et al 2015) and
diverges from the indicator used in the 2014 Thomson Reuters report in which they select publications with a FNCI value larger than 4 15 In its report Thomson Reuter uses an alternative definition of highly cited publications namely those publications with an average
citation impact of four or more This report follows common practice in the field by selecting the top 10 most highly cited
publications indicator (Tijssen et al 2002) 16 The FNCI of a document is calculated by dividing the actual count of citing items by the expected citation rate for documents with the
same document type year of publication and subject area When a document is assigned to more than one subject area an average
of the ratios of the actual to expected citations is used The FNCI of a set of documents for example the collected works of the JRC is
the average of the FNCI values for all the documents in the set (InCites indicator handbook) Note that TR presents a different
indicator the average impact factor which leads to different results
12
of 1 represents performance at par with world average values above 1 are considered above
average and values below one are considered below average An FNCI value of two is considered
twice the world average
Percentage industry co-publications1718 An industry co-publication is a co-publication in which at
least one of the authorrsquos affiliation is listed as lsquocorporatersquo The percentage of industry co-
publications is thus the number of industry co-publications for an entity divided by the total number
of documents for the same entity represented as a percentage
26 Task description
The guiding research questions are how many publications has the JRC published in total and how
many of those are highly cited publications How does the JRC compare to the comparator
organisations in terms of research publication output and highly cited publications And is the
citation impact of JRC above world average in key fields of science
27 Methodology
In line with TRsrsquo 2014 report the steps listed below are followed to complete the data analysis and
address those three questions
1) The total number of publications citations and derived indicators were collected for the JRC
and its comparator organisations for the years 2007-2015
2) The number of publications citations and derived indicators in each of the 22 ESI fields were
collected for the JRC and its comparator organisations for the years 2007-2015
3) The number of publications citations and derived indicators in each of the largest WoS fields
by number of JRC publications are collected for the JRC and its comparator organisations for
the years 2007-2015
4) In these ESI and WoS fields the JRCs performance is compared with the performance of the
comparator organisations
5) The individual publications were downloaded from the online version of the Web of Science
These publications were analysed to identify those in which JRC researchers are the
corresponding author and those which were lsquointernationally co-authoredrsquo19 20
17 Note that Thomson Reuter cautions that lsquoIt is not possible to unify the data for every single affiliation of all the publications in InCites
therefore only those entities that have been unified will have an organization type There will be corporate affiliations that have not
yet been unified will not have an organization type and therefore will not be identified as an industrial collaborationrsquo 18 Tijssen RJW (2012) Co-authored research publications and strategic analysis of public-private collaboration Research Evaluation
21 204-215 19 This refers to co-publications with researchers based in research organisations in a country other than the JRC research facility in
which JRC authors are employed eg a publication by a researcher in Petten the Netherlands with a researcher in France Co-
publications between JRC researchers based in different geographical sites are not included Arguably JRC co-publications with
researchers in other domestic organisations could also be considered as international co-publications given the special status of the
JRC as being part of an international organisation However this decision was not taken in the following instance eg a co-publication
between JRC researchers in Petten and those at Delft University (Netherlands) is not considered as an international co-publication 20 Note that the volume of publications found for the JRC in all years is larger than reported in the Thomson Reuters (2014) report
Plausible explanations include 1) that in this report letters and notes were included alongside articles and reviews This can
account only for a minor increase however 2) The WoS database grows over time and the publications from newly included journals
13
3 Results
31 Analysis of JRC research performance
Table 2 provides the evolution in the number of publications (co-)authored by JRC staff (lsquototal JRC
publication outputrsquo) per year It also shows the number and share of the top 10 highly cited
publications the share of non-cited publications and the field normalised citation impact metric
One observes a steady upward trend in publication output This indicates an increase in production
and may also reflect improved levels of productivity - if the output growth surpassed the increase of
research-active staff at JRC The JRC has also improved its performance in terms of highly cited
publications which are now double the expected amount in the worldrsquos top 10 highly cited (the
JRCrsquos share was more than 20 from 2012 onwards) and three times more than expected in the
top 1 highly cited (JRC shares exceed 4 in recent years ie 4 times the world average of 1) The
share of JRC publications cited in the international scientific literature is high more than 90 The
declining share in more recent years (2013-2015) results from the fact that most publications take at
least 4 to 5 years to reach their full potential in terms of citation impact21 The citation impact
profile is summarized by the FNCI score which has increased quite significantly since 2007-2008
(with an impact 27-38 above world average) to scores in 2012-2013 that are 75-94 above world
average The scores in the two most recent years (2014-2015) confirm this upward trend The share
of co-publications with industry fluctuates annually around 35 per cent This metric will be placed
into context in the comparison with other research organisations in section 34
Table 1 JRC research performance trends publication output and citation impact
Publication
year
Total JRC
publication
output
Percentage JRC
publications in
the worldrsquos top
10 highly cited
Percentage JRC
publications in the
worldrsquos top 1
highly cited
Percentage
publs cited FNCI
Percentage
industry
copublication
2007 641 165 16 958 127 374
2008 690 142 09 958 138 435
2009 650 202 22 925 136 277
2010 729 184 29 940 158 425
2011 791 197 29 946 148 405
2012 784 202 41 920 194 217
2013 854 219 47 912 175 351
2014 923 219 46 871 171 379
2015 908 209 41 789 214 308
Overall 6 970 195 32 908 165 352
are included retro-actively This may account for a larger share of the observed increase 3) A third explanation for the observed
difference is that the TR search algorithms for finding JRC publications (the name and address variants included) increases ie recall
has increased 21 Note that the validity and statistical robustness of a publicationrsquos citation impact score declines as the time frame for the
accumulation of citations shortens The citation impact scores for 2014 and 2015 publications with a citation window of 3 years or
less should be interpreted with caution
14
Figure 1 provides a graphical overview of JRC publications according to the number of highly cited
publications (top 1 and top 10) per year22 Annual publication output increased from 641 in 2007
to around 900 per year in 2015
Figure 1 JRC publication output total top 10 and top 1 highly cited publications
Figure 2 shows the annual trends according to the FNCI value for the JRCrsquos total publication output
In most years JRC publications receive well over the world average number of citations when
normalised by citation intensity in the different fields The lsquoover-performancersquo among the highly
cited papers especially among the top 1 publications is higher than the over-performance for the
whole portfolio of research publications
22 The number of top 1 and top 10 most highly cited publications in Figure 1 is based on the WoS field classification scheme Different
numbers of highly cited publications would have been found using the broader ESI classification scheme reported in section 32 but
the overall pattern across all fields of science will not change significantly
15
Figure 2 Trends in FNCI values of total JRC publication output
Digging deeper into the collaborative patterns responsible for JRCrsquos top 10 highly cited
publications Table 3 shows the share of publications that result from external research
cooperation23 That is co-publications with an lsquoexternal researcherrsquo affiliated with or based at
another research organisation abroad The table shows that international collaboration occurs in
81 of all top 10 highly cited JRC publications This high share was expected as international co-
publications are known to receive a relatively high number of citations on average However the
excellent performance levels are not solely the result of JRC authors making (potentially minor)
contributions to publications produced by large international research projects or RampD consortia
There is ample evidence that they are (also) based on substantive JRC research efforts This becomes
clear by zooming in on the share of top 10 highly cited publications with a JRC-affiliated
lsquocorresponding authorrsquo Being nominated a corresponding author on a research publication tends to
reflect project leadership The share of publications with a JRC corresponding author is 41 Hence
JRC-affiliated authors are the leading authors in almost half of the JRC publications that are among
the top 10 highly cited publications
Table 2 JRC publication distribution by research contribution
JRC as research partner
(publications co-authored with non-JRC researchers abroad)
Share of all top 10 cited JRC publications 81
JRC as research leader
(international co-publications with JRC-affiliated lsquocorresponding authorrsquo)
Share of all top 10 cited JRC publications 39
23 The micro-data publication analysis that was performed to construct this table led to the identification of another few misclassified
organisational addresses which will be communicated to the InCites team
16
32 Analysis of JRC research performance - ESI fields
As explained in the methodological section the first part of the field analysis has split the JRC
publication output in journal-based categories The ESI classification system24 is not perfect as it was
not possible to allocate 257 JRC publications
Figure 3 Number of publications by ESI field
Figure 3 shows the number of publications in the different ESI fields One observes that the majority
of the JRC output is classified in five broad fields Engineering (155 ) Geosciences (137 )
Environment ampEcology (136 ) Physics (121 ) and Chemistry (113 ) The figure also shows that
in some of these categories a relatively large share of publications belong to the publications which
are among the top 10 or even top 1 highly cited publications in the world This is especially true
for Pharmacology amp Toxicology Geosciences Environment amp Ecology General Social Sciences (which
24 These ESI fields are derived from TRsrsquo Essential Science Indicators information product
17
does not include Economics amp Business) Agricultural Sciences Computer Sciences and Plant amp
Animal Science25
Figure 4 expands on the latter observation by showing the share of top 10 highly cited
publications one observes that the JRC performs well above the world average of 10 in most fields
of publication activity This also holds for fields in which a large share of its publication activity is
concentrated - such as the Geosciences Social Sciences Pharmacology amp Toxicology and
EnvironmentEcology The share of the JRCrsquos publications that is among the lsquotop 10 highly cited
publicationsrsquo is below the world average in Molecular Biology amp Genetics Physics Chemistry and
Materials Science
Figure 4 Share of top 10 publications by ESI field
25 As well as some small field of publication activity Immunology Neuroscience amp Behaviour and Mathematics
18
Figure 5 Citation impact scores (FNCI) by ESI field
This brings one to the analysis of the field-normalised citation impact (FNCI) scores in Figure 5 This
metric indicates how many citations an average JRC publication receives relative to the world
average in a specific field26 We observe that in most fields the JRC performs well above the world
average value of 1 In some fields of large JRC activity - including Geosciences EnvironmentEcology
Pharmacology amp Toxicology the General Social Sciences and Engineering - the JRC receives more
than double the world average of citations per publication The lsquomultidisciplinaryrsquo field stands out
This is due to the inclusion of broad scope lsquomultidisciplinaryrsquo journals like Nature Science and PNAS
in this category alongside other lower impact journals Again the JRC performs under the world
average in the same fields as in the previous figure As was shown in Figure 3 Physics Chemistry and
Materials Science are fields of substantial JRC publication output which means these fields have an
influence on overall JRC performance on this metric This is less the case for the remaining (smaller)
fields which score low on this metric
33 Analysis of JRC performance - WoS fields
Figure 6 shows the relative share in JRC output of the main research WoS fields which was limited
to the top 35 fields in terms of publication volume in the period 2007-2015 As explained in the
26 A FNCI score of 15 would signify that the JRC receives 50 more citations than the world average A score of 05 signifies that an
average JRC publication in this field receives 50 less citations than world average
19
methodological section these fields overlap making it impossible to compute a de-duplicated JRC
total output Also not all JRC publications will be represented in these categories as there are
smaller fields which could not be presented in this figure Nonetheless these WoS fields provide
additional finer-grained information on JRC performance supplementary to the previous ESI-based
figures (3 to 5)27 The figure reveals that Environmental Sciences is the largest field of JRC publication
activity followed by Nuclear Science amp Technology Meteorology amp Atmospheric science Materials
Science Analytical Chemistry and Geosciences
Figure 6 JRC publication output by WoS field
For some of these fields most notably Environmental Sciences and Meteorology amp Atmospheric
Sciences one observes a relatively large number of publications in the top 10 and top 1 highly
cited publications Further insight in this observation is provided by looking at the share of top 10
27 The WoS field based data is also included in this report to ensure consistency with Thomson Reuters 2014 report
20
highly cited publications in Figure 7 The world average of this share is 110 One thus sees that the
JRC performs above the world average in most fields An especially strong performance is observed
in the fields Toxicology Meteorology amp Atmospheric Sciences Ecology Environmental Studies
Geosciences Water Resources Marine amp Freshwater Biology Computer Science (interdisciplinary
applications) and the Environmental Sciences In all these fields the JRC has more than double the
world average number of highly cited papers In a few fields the JRC has a share of highly cited
publications below the world average of 110 This includes fields of substantial JRC publication
activity like Materials Science Analytical Chemistry Physical Chemistry Nuclear Physics Condensed
Matter Physics and Instruments amp Instrumentation
A word of warning is in order For example the latter statistics could lead to the wrong conclusion
that eg the nuclear branch of the JRC is performing below the world average While 110 in the field
Nuclear Physics is indeed just at the world average the JRC registered three times more publications
in the field Nuclear Science amp Technology which with a 16 result scores much higher than world
average
Figure 7 Share of Top 10 highly cited publications by WoS field
21
Figure 8 shows again the FNCI scores In some fields marked by large JRC research activity ndash notably
Toxicology Geosciences Ecology Energy amp Fuels Environmental Studies Environmental Sciences
and Meteorology amp Atmospheric Sciences - JRC publications receive more than double the world
average of citations per paper Only a few fields perform below the world average of 1
Figure 8 Citation impact scores (FNCI) by WoS fields
22
34 Comparator analysis JRC versus benchmark organizations
Table 5 compares the JRC research profile to that of the selected comparator lsquobenchmarkrsquo
organisations The table also shows data on field-normalised citation impact and the share of highly
cited (top 1 and top 10 ) publications In terms of the shares of highly cited publications one
observes that the JRC performs at a similar level as top-level lsquobasic science organisationsrsquo such as the
leading research universities and public research centres considered The same can be said for the
field-normalised citation impact metric Another metric of potential interest in relation to societal
impact is the share of JRC publications which are made together with private sector partners
(business enterprises and industry) With 35 of its peer-reviewed scientific articles published
together with industrial partners the JRC has a percentage score on par with NIST and EPA in the US
or the CEA in France While it is lower than that of typical RTOs such as Fraunhofer (DE) TNO (NL)
and VTT (SF) for whom an industry focus is central to their mission it is significantly higher than for
Australiarsquos CSIRO and most of the academic science organisations such as Oxford University and the
Max Planck Society Hence this share indicates a substantial degree of interaction with industrial
RampD and business sector partners
Table 4 Comparator analysis research performance profiles
Total
publication
output
Citation
Impact
(FNCI)
publ
cited
publ
in world
Top 1
cited
publ
in world
Top 10
cited
industry
co-
publ
CNRS 263 142 129 912 17 149 23
CAS 239 602 118 891 18 142 09
MPS 90 337 178 939 33 225 19
OX 76 908 192 858 37 217 27
CAM 69 716 181 869 35 215 38
CNR 43 253 117 925 14 129 15
CEA 42 339 160 930 28 187 35
INRA 34 181 142 927 21 168 21
CSIRO 25 455 154 931 29 191 14
RIKEN 22 276 148 926 24 174 20
ORNL 15 373 171 932 35 212 39
ANL 14 864 188 934 38 231 22
NIST 11 798 158 929 27 191 33
EPA 8 741 142 922 24 178 37
FG 8 434 123 884 17 141 45
JRC 6 970 165 908 32 195 35
TNO 5 005 130 920 15 160 75
VTT 4 193 147 859 20 155 52
NPL 2 099 098 889 10 98 37
ARC 1 287 125 896 16 149 27 World average performance FNCI=1 Above average FNCI gt 1 below average FNCI lt 1
23
Figure 9 provides an overview of the publication output of the comparator organisations It clearly
shows that several organisations - especially CNRS MPG and CEA - publish considerably more
publications than JRC
The actual degree of comparability between organisations is a critical issue that needs careful
consideration and determines the margin for drawing strong conclusions28 When comparing JRC
with such broad organisations sufficient attention should be paid to how lsquoeconomies of scale and
scopersquo may beneficially affect the research performance of large organisations Further analysis
suggests that these organisations do not only differ in size but also in terms of research
specialisation29 Hence due caution is needed when interpreting the results of figures 9-11 The
findings are best seen as a high-level proxy of institutional differences in research performance
levels
Figure 9 Comparator analysis total publication output and highly cited publications
Figure 10 zooms in on the share of top 10 highly cited publications JRC is among the top
performers surpassed only by Oak Ridge National Laboratory the Max Planck Society Oxford
University Cambridge University and Argonne National Laboratory Considering the relatively small
28 The JRC as well as all comparators mentioned in this report are unique lsquoone of a kindrsquo organisations because of their specific mission
history funding sources specialisation profiles country of location and other distinctive features When interpreting the results of
cross-organisational comparisons one needs to take these inherent differences into account For example the effects of sheer size
due to economies of scale and scope can influence the relative performance in terms of research collaboration (both within the
organisation and with external partners) this can then affect international visibility and scientific impact as measured by citation
indicators This may limit the comparability between the JRC and organisations that are substantially larger such as the CEA CNRS
the Max Planck Society and the Chinese Academy of Science Ideally one should opt for lsquolike-with-like benchmarkingrsquo exercises that
involve similar organisations or lsquoaspirational benchmarkingrsquo with pre-selected organisations that exhibit desirable performance levels
However there are few if any research organisations that are similar to the JRC in nature and mission 29 Additional data and figures on the detailed comparison between organizations can be provided upon request
24
numbers of publications concerned small differences in performance between organisations like the
JRC CNRS and the Max Planck Society should not be over-interpreted
Figure 10 Comparator analysis top 10 highly cited publications
Figure 11 shows the comparison in terms of FNCI JRC has a FNCI score of 168 indicating that an
average JRC publication receives 68 more citations than an average paper published worldwide
That of Argonne (ANL) is similar to the JRC whereas publications by the Max Planck Society
Cambridge University Oxford University and the US Oak Ridge National Laboratory receive a higher
number of citations per paper than those by the JRC Nonetheless the JRC clearly remains in the top
group of performers on this metric as well
Figure 11 Comparator analysis Field-normalised Citation Impact
The full name of each comparator organisations is mentioned in Table 1
25
4 Discussion and conclusions
This bibliometric analysis of JRC research publication output was guided by some general
considerations to which such quantitative research evaluations should adhere In principle the
analysis should be replicable by any data analyst who has access to the InCites platform or the
underlying Web of Science (WoS) database As the citation metrics are calculated at a specific point
in time (in our case in March-April 2017) there will be changes especially in the citation metrics for
recent years where more recent citations to publications are accumulated
The metrics used are standard performance measures and widely accepted as such within the
international bibliometric community30 This should ensure the credibility of the analysis and these
findings Given that 62 of JRCrsquos published output is captured in the WoS and that this publication
set comprises the bulk of the research publications having international scientific impact the report
argues that the analysis has a sufficient level of accuracy and representativeness within an
international comparative setting The performance levels and trends observed for the JRC are
largely in line with many comparator organisations worldwide there are no major deviations or
fluctuations nor unexplainable observations within the JRC research performance patterns This
adds to the credibility of the results of the analysis
Given the nature of this study and the depth of the data analysis too strong general conclusions are
avoided Instead the next section repeats some of the most noteworthy findings and possible
explanations
In terms of scientific impact the analyses established that JRC researchers produce around 95
more top 10 highly cited publications than the world average The share of top 1 highly
cited publications is at 3 three times the world average In recent years the share of top
1 highly cited publications increased to 4 This indicates that JRC researchers succeed in
producing a relatively large number of publications with a major influence on the scientific
literature The high score on these metrics may be related to the regulatory science role of the
JRC The JRCrsquos field-normalised citation impact score is around 65 above the world average
This high level performance also seems to have improved even further in recent years The JRC
performs considerably better than many of the other organisations considered and at a similar
level as organisations with a basic science mission This finding is potentially remarkable given
the broad mission of the JRC which includes much more than producing research for peer
reviewed journals
The JRC also has a relatively high share of industrial co-publications compared to many
comparator organisations These co-authored publications are an indication of close research
collaboration and interaction with the business sector which in turn could be a precursor of
science-related innovations and socioeconomic impacts in future years
International co-publications with research partners located in other countries comprise 81
of the high-impact JRC NST publications In 39 of the high-impact publications JRC
researchers are the lead researchers and lsquocorresponding authorsrsquo Thus the high-impact
publications are not solely the result of (potentially minor) JRC participation in large research
30 See for example Tijssen et al 2002 De Bellis 2009 OECD 2013
26
consortia To an important extent they are thought to be the outcome of substantial JRC
research activity
In most fields JRC publications achieve an above average number of citations and have a
relatively large share of high citation impact publications Fields in which the JRC has both a
large output and a high impact include Ecology Energy amp Fuels Environmental Studies
Environmental Sciences Toxicology Applied Physics and Meteorology amp Atmospheric Sciences
The JRC citation impact levels in these fields are high in comparison to most of the comparator
organisations
The JRC as well as all comparators mentioned in this report are unique lsquoone of a kindrsquo organisations
because of their specific mission history size funding sources funding per researcher time
researchers devote to research specialisation profiles country of location and other distinctive
features When interpreting the results of cross-organisational comparisons one needs to take these
inherent differences into account In spite of this caveat the analysis shows that the JRC performs
well in comparison to the other organisations on all metrics considered Over time its performance
appears to be improving
27
Literature references
Cruz Castro L Bleda M Jonkers K Derrick G Martinez C and Sanz Menendez L (2011) OECD
IPP actor brief public research organisations
De Bellis N (2009) Bibliometrics and citation analysis from the Science citation index to
cybermetrics Scarecrow Press
Hicks D Wouters P Waltman L De Rijcke S and Rafols I (2015) Bibliometrics The Leiden
Manifesto for research metrics Nature Volume 520 Issue 7548 pp 429-431
JRC (2016) JRC Productivity and Impact Report Results from PRIME 2015 Ref Ares(2016)2889992 -
22062016
Moya-Anegoacuten F Guerrero-Bote VP Bornmann L et al (2013) The research guarantors of
scientific papers and the output counting a promising new approach Scientometrics Volume 97
Issue 2 pp 421-434
OECD (2015) Bibliometrics OECD Glossary of Statistical Terms Paris Organisation of Economic
Cooperation and Development
Thomson Reuters (2016) InCites Indicator Handbook
httpresearchanalyticsthomsonreuterscommpdfsindicators-handbookpdf
Thomson Reuters (2014) Evaluation of the Research Performance of the Joint Research Centre of the
European Commission during the 7th Framework Programme (2007-2013)
httpseceuropaeujrcsitesjrcshfilesthompson-reuters-study-2007-2013pdf
Tijssen RJW Visser M and Van Leeuwen T (2002) Benchmarking international scientific
excellence Are highly cited research papers an appropriate frame of reference Scientometrics
Volume 54 Issue3 pp 381-397
Tijssen RJW Co-authored research publications and strategic analysis of public-private
collaboration Research Evaluation 21 204-215 2012
28
List of figures
Figure 1 JRC publication output total top 10 and top 1 highly cited publications
Figure 2 Trends in FNCI values of total JRC publication output
Figure 3 Number of publications by ESI field
Figure 4 Share of top 10 publications by ESI field
Figure 5 Citation impact scores (FNCI) by ESI field
Figure 6 JRC publication output by WoS field
Figure 7 Share of Top 10 highly cited publications by WoS field
Figure 8 Citation impact scores (FNCI) by WoS fields
Figure 9 Comparator analysis total publication output and highly cited publications
Figure 10 Comparator analysis top 10 highly cited publications
Figure 11 Comparator analysis Field-normalised Citation Impact
29
List of tables
Table 1 Comparator organisations
Table 2 JRC research performance trends publication output and citation impact
Table 3 JRC publication distribution by research contribution
Table 4 Comparator analysis research performance profiles
30
Annex 1 Annual trends in publication output of the comparator
organisations
Table A1 shows the evolution (growth or decline) in publications for the comparator organisations
Whereas there are notable year-on-year fluctuations in general the relative ranking of the
organisations in terms of scientific output remains fairly stable over time
Organisation 2007 2008 2009 2010 2011 2012 2013 2014 2015 Total
CNRS 23134 26365 28460 29558 29901 30206 31365 31762 32391 263142
CAS 17736 19396 20633 22652 24867 28326 32288 35349 38355 239602
MPS 8473 8796 9481 9973 10598 10730 10853 10776 10657 90337
OX 6332 6873 7370 7910 8663 9135 10116 9856 10653 76908
CAM 6266 6514 6925 7161 7797 8548 8684 8837 8984 69716
CNR 5454 4963 5118 4724 3891 4074 4647 4919 5463 43253
CEA 3936 4219 4508 4665 5034 4842 5046 5087 5002 42339
INRA 3210 3496 3517 3634 4031 3959 4176 4168 3990 34181
CSIRO 1946 2256 2402 2805 3033 3077 3232 3321 3383 25455
RIKEN 2330 2401 2432 2387 2333 2514 2677 2583 2619 22276
ORNL 1356 1378 1418 1571 1829 1812 2034 1959 2016 15373
ANL 1394 1266 1354 1391 1602 1831 2013 1989 2024 14864
NIST 1245 1297 1307 1232 1384 1348 1347 1352 1286 11798
EPA 1056 1004 1032 950 1021 970 922 937 849 8741
FG 533 672 807 859 1012 1004 1116 1218 1213 8434
JRC 641 690 650 729 791 784 854 923 908 6970
TNO 525 515 553 569 582 594 572 577 518 5005
VTT 343 313 444 449 513 471 558 630 472 4193
NPL 205 187 165 227 248 249 235 277 306 2099
ARC 139 126 162 162 164 119 124 136 155 1287
Web of sciences documents
HOW TO OBTAIN EU PUBLICATIONS
Free publications
bull one copy
via EU Bookshop (httpbookshopeuropaeu)
bull more than one copy or postersmaps
from the European Unionrsquos representations (httpeceuropaeurepresent_enhtm)
from the delegations in non-EU countries (httpeeaseuropaeudelegationsindex_enhtm)
by contacting the Europe Direct service (httpeuropaeueuropedirectindex_enhtm) or
calling 00 800 6 7 8 9 10 11 (Freephone number from anywhere in the EU) ()
() The information given is free as are most calls (though some operators phone boxes or hotels may charge you)
Priced publications
bull via EU Bookshop (httpbookshopeuropaeu)
Europe Direct is a service to help you find answers
to your questions about the European Union
Freephone number ()
00 800 6 7 8 9 10 11 () The information given is free as are most calls (though some operators phone boxes or hotels may charge you)
More information on the European Union is available on the internet (httpeuropaeu)
KJ-N
A-2
8647-E
N-N
doi102760286276
ISBN 978-92-79-69557-5
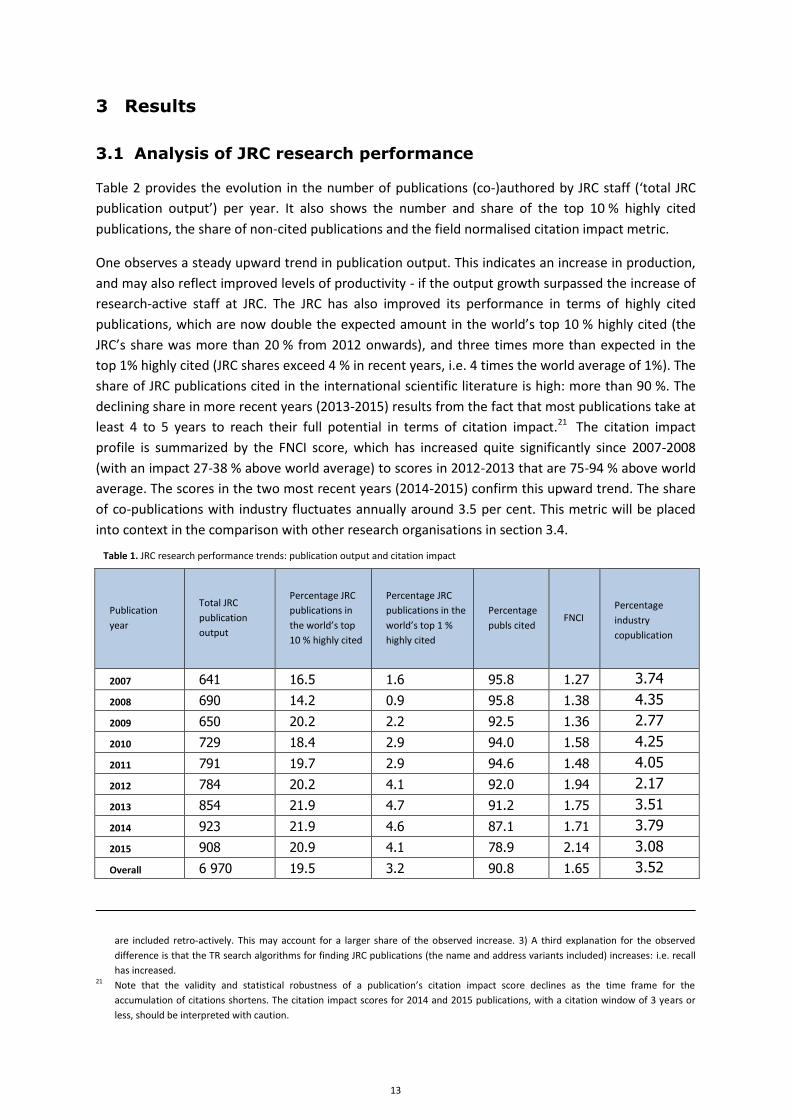
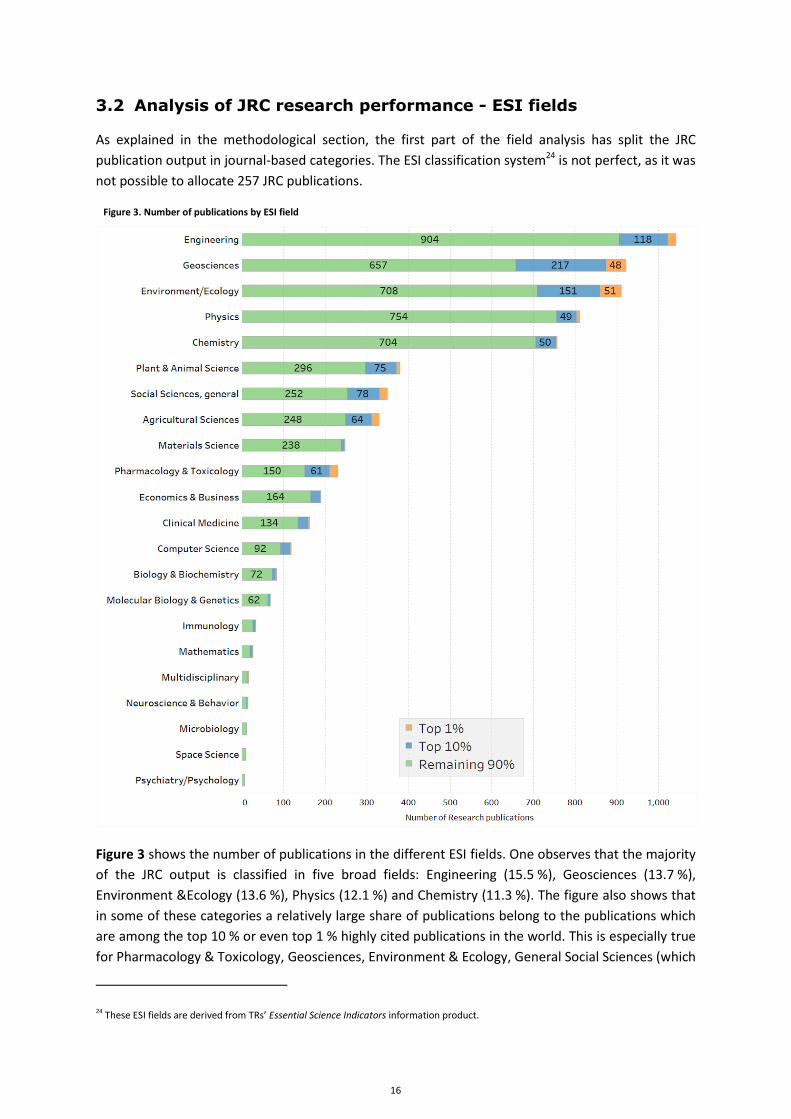

KJ-N
A-2
8647-E
N-N
doi102760286276
ISBN 978-92-79-69557-5