jürgenh - università cattolica del sacro cuorecamere/books/mass_spectrometry.pdf ·...
TRANSCRIPT


Jürgen H. Gross
Mass Spectrometry

Jürgen H. Gross
Mass SpectrometryA Textbook
With 357 Illustrations and Tables
123

Dr. Jürgen H. GrossInstitute of Organic ChemistryUniversity of HeidelbergIm Neuenheimer Feld 27069120 [email protected]
Problems and Solutions available via author’s websitewww.ms-textbook.com
Library of Congress Control Number: 2006923046
1st ed. 2004. Corr. 2nd printing
ISBN-10 3-540-40739-1 Springer Berlin Heidelberg New YorkISBN-13 978-3-540-40739-3 Springer Berlin Heidelberg New York
This work is subject to copyright. All rights reserved, whether the whole or part of the material isconcerned, specifically the rights of translation, reprinting, reuse of illustrations, recitation, broadcasting,reproduction on microfilm or in any other way, and storage in data banks. Duplication of this publicationor parts thereof is permitted only under the provisions of the German Copyright Law of September 9,1965, in its current version, and permission for use must always be obtained from Springer. Violationsare liable for prosecution under the German Copyright Law.
Springer is a part of Springer Science+Business Mediaspringer.com
© Springer-Verlag Berlin Heidelberg 2004Printed in Germany
The use of general descriptive names, registered names, trademarks, etc. in this publication does not imply,even in the absence of a specific statement, that such names are exempt from the relevant protective lawsand regulations and therefore free for general use.
Typesetting: Data conversion by authorProduction: LE-TEX, Jelonek, Schmidt & Vöckler GbR, LeipzigCoverdesign: KünkelLopka, Heidelberg
Printed on acid-free paper 2/3100/YL – 5 4 3 2 1 0

Dedicated to my wife Michaela and my daughters Julia and Elena
Preface
When non-mass spectrometrists are talking about mass spectrometry it rather often sounds as if they were telling a story out of Poe's Tales of Mystery and Imagina-tion. Indeed, mass spectrometry appears to be regarded as a mysterious method, just good enough to supply some molecular weight information. Unfortunately, this rumor about the dark side of analytical methods reaches students much earlier than their first contact with mass spectrometry. Possibly, some of this may have been bred by mass spectrometrists themselves who tended to celebrate each mass spectrum they obtained from the gigantic machines of the early days. Of course, there were also those who enthusiastically started in the 1950s to develop mass spectrometry out of the domain of physics to become a new analytical tool for chemistry.
Nonetheless, some oddities remain and the method which is to be introduced herein is not always straightforward and easy. If you had asked me, the author, just after having finished my introductory course whether mass spectrometry would become my preferred area of work, I surely would have strongly denied. On the other hand, J. J. Veith's mass spectrometry laboratory at Darmstadt Univer-sity was bright and clean, had no noxious odors, and thus presented a nice contrast to a preparative organic chemistry laboratory. Numerous stainless steel flanges and electronics cabinets were tempting to be explored and – whoops – infected me with CMSD (chronic mass spectrometry disease). Staying with Veith's group slowly transformed me into a mass spectrometrist. Inspiring books such as Fundamental Aspects of Organic Mass Spectrometry or Metastable Ions, out of stock even in those days, did help me very much during my metamorphosis. Hav-ing completed my doctoral thesis on fragmentation pathways of isolated immo-nium ions in the gas phase, I assumed my current position. Since 1994, I have been head of the mass spectrometry laboratory at the Chemistry Department of Heidelberg University where I teach introductory courses and seminars on mass spectrometry.
When students ask what books to read on mass spectrometry, there are various excellent monographs, but the ideal textbook still seemed to be missing – at least in my opinion. Finally, encouraged by many people including P. Enders, Springer-Verlag Heidelberg, two years of writing began.
The present volume would not have its actual status without the critical reviews of the chapters by leading experts in the field. Their thorough corrections, re-marks, and comments were essential. Therefore, P. Enders, Springer-Verlag Hei-delberg (Introduction), J. Grotemeyer, University of Kiel (Gas Phase Ion Chemis-try), S. Giesa, Bayer Industry Services, Leverkusen (Isotopes), J. Franzen, Bruker

VIII Preface
Daltonik, Bremen (Instrumentation), J. O. Metzger, University of Oldenburg (Electron Ionization and Fragmentation of Organic Ions and Interpretation of EI Mass Spectra), J. R. Wesener, Bayer Industry Services, Leverkusen (ChemicalIonization), J. J. Veith, Technical University of Darmstadt (Field Desorption),R. M. Caprioli, Vanderbilt University, Nashville (Fast Atom Bombardment), M. Karas, University of Frankfurt (Matrix-Assisted Laser Desorption/Ionization),M. Wilm, European Molecular Biology Laboratory, Heidelberg (Electrospray Ionization) and M. W. Linscheid, Humboldt University, Berlin (Hyphenated Methods) deserve my deep gratitude.
Many manufacturers of mass spectrometers and mass spectrometry supply are gratefully acknowledged for sending large collections of schemes and photographs for use in this book. The author wishes to express his thanks to those scientists, many of them from the University of Heidelberg, who generously allowed to use material from their actual research as examples and to those publishers, who granted the numerous copyrights for use of figures from their publications. The generous permission of the National Institute of Standards and Technology (G. Mallard, J. Sauerwein) to use a large set of electron ionization mass spectra from the NIST/EPA/NIH Mass Spectral Library is also gratefully acknowledged. My thanks are extended to the staff of my facility (N. Nieth, A. Seith, B. Flock) for their efforts and to the staff of the local libraries for their friendly support. I am indebted to the former director of our institute (R. Gleiter) and to the former dean of our faculty (R. N. Lichtenthaler) for permission to write a book besides my of-ficial duties.
Despite all efforts, some errors or misleading passages will still have remained. Mistakes are an attribute that make us human, but unfortunately, they do not con-tribute to the scientific or educational value of a textbook. Therefore, please do not hesitate to report errors to me or to drop a line of comment in order to allow for corrections in a future edition.
Hopefully, Mass Spectrometry – A Textbook will introduce you to the many facets of mass spectrometry and will satisfy your expectations.
Jürgen H. Gross
University of Heidelberg Institute of Organic Chemistry Im Neuenheimer Feld 270 69120 Heidelberg Germanyemail: [email protected]

Table of Contents
Contents.......................................................................................................IX
1 Introduction ........................................................................................................11.1 Aims and Scope ...........................................................................................11.2 What Is Mass Spectrometry? .......................................................................2
1.2.1 Mass Spectrometry ...............................................................................31.2.2 Mass Spectrometer ...............................................................................31.2.3 Mass Spectrum .....................................................................................4
1.3 Filling the Black Box...................................................................................71.4 Terminology ................................................................................................71.5 Units, Physical Quantities, and Physical Constants .....................................9Reference List ..................................................................................................10
2 Gas Phase Ion Chemistry.................................................................................132.1 Quasi-Equilibrium Theory .........................................................................13
2.1.1 Basic Assumptions of QET ................................................................142.2 Ionization ...................................................................................................14
2.2.1 Electron Ionization .............................................................................152.2.2 Ionization Energy ...............................................................................16
2.3 Vertical Transitions....................................................................................182.4 Ionization Efficiency and Ionization Cross Section...................................202.5 Internal Energy and the Further Fate of Ions .............................................21
2.5.1 Degrees of Freedom ...........................................................................212.5.2 Appearance Energy ............................................................................222.5.3 Bond Dissociation Energies and Heats of Formation.........................242.5.4 Randomization of Energy...................................................................26
2.6 Rate Constants from QET..........................................................................272.6.1 Meaning of the Rate Constant ............................................................282.6.2 Typical k(E) Functions.........................................................................292.6.3 Description of Reacting Ions Using k(E) Functions.............................292.6.4 Direct Cleavages and Rearrangement Fragmentations.......................302.6.5 Practical Consequences of Internal Energy ........................................31

X Table of Contents
2.7 Time Scale of Events ................................................................................. 322.7.1 Stable, Metastable, and Unstable Ions................................................ 332.7.2 Kinetic Shift ....................................................................................... 35
2.8 Activation Energy of the Reverse Reaction and Kinetic Energy Release.. 362.8.1 Activation Energy of the Reverse Reaction ....................................... 362.8.2 Kinetic Energy Release ...................................................................... 37
2.9 Isotope Effects ........................................................................................... 402.9.1 Kinetic Isotope Effects ....................................................................... 40
2.10 Determination of Ionization Energies and Appearance Energies ............ 442.10.1 Conventional Determination of Ionization Energies ........................ 442.10.2 Experimental Improvements of IE Accuracy ................................... 452.10.3 Photoelectron Spectroscopy and Derived Modern Methods ............ 462.10.4 Determination of Appearance Energies............................................ 482.10.5 Breakdown Graphs........................................................................... 492.11 Gas Phase Basicity and Proton Affinity .............................................. 50
2.12 Tandem Mass Spectrometry .................................................................... 532.12.1 Collision-Induced Dissociation ........................................................ 532.12.2 Other Methods of Ion Activation ..................................................... 572.12.3 Reactive Collisions........................................................................... 59
Reference List.................................................................................................. 61
3 Isotopes.............................................................................................................. 673.1 Isotopic Classification of the Elements...................................................... 67
3.1.1. Monoisotopic Elements..................................................................... 683.1.2 Di-isotopic Elements .......................................................................... 683.1.3 Polyisotopic Elements ........................................................................ 693.1.4 Calculation of Atomic, Molecular, and Ionic Mass............................ 713.1.5 Natural Variations in Relative Atomic Mass...................................... 73
3.2 Calculation of Isotopic Distributions ......................................................... 743.2.1 X+1 Element Carbon.......................................................................... 743.2.2 Binomial Approach ............................................................................ 773.2.3 Halogens............................................................................................. 783.2.4 Combinations of Carbon and Halogens.............................................. 793.2.5 Polynomial Approach......................................................................... 803.2.6 Oxygen, Silicon and Sulfur ................................................................ 813.2.7 Polyisotopic Elements ........................................................................ 833.2.8 Practical Aspects of Isotopic Patterns ................................................ 843.2.9 Isotopic Enrichment and Isotopic Labeling........................................ 87
3.3 High-Resolution and Accurate Mass ......................................................... 883.3.1 Exact Mass ......................................................................................... 883.3.2 Deviations from Nominal Mass ......................................................... 893.3.3 Mass Accuracy ................................................................................... 923.3.4 Resolution .......................................................................................... 963.3.5 Mass Calibration ................................................................................ 99
3.4 Interaction of Resolution and Isotopic Patterns ....................................... 1043.4.1 Multiple Isotopic Compositions at Very High Resolution ............... 104

XI
3.4.2 Multiple Isotopic Compositions and Accurate Mass........................1063.4.3 Isotopic Patterns of Large Molecules ...............................................106
3.5 Interaction of Charge State and Isotopic Patterns ....................................108Reference List ................................................................................................109
4 Instrumentation ..............................................................................................1114.1 Creating a Beam of Ions ..........................................................................1124.2 Time-of-Flight Instruments......................................................................113
4.2.1 Introduction to Time-of-Flight .........................................................1134.2.2 Basic Principle of TOF Instruments .................................................1144.2.3 Linear Time-of-Flight Analyzer .......................................................1174.2.4 Reflector Time-of-Flight Analyzer...................................................1194.2.5 Further Improvement of Resolution .................................................1224.2.6 Orthogonal Acceleration TOF..........................................................1254.2.7 Tandem MS on TOF Instruments.....................................................128
4.3 Magnetic Sector Instruments ...................................................................1304.3.1 Introduction to Magnetic Sector Instruments ...................................1304.3.2 Principle of the Magnetic Sector ......................................................1314.3.3 Double-Focusing Sector Instruments ...............................................1344.3.4 Setting the Resolution of a Sector Instrument ..................................1384.3.5 Further Improvement of Sector Instruments.....................................1394.3.6 Tandem MS with Magnetic Sector Instruments ...............................140
4.4 Linear Quadrupole Instruments ...............................................................1454.4.1 Introduction to the Linear Quadrupole .............................................1454.4.2 Principle of the Linear Quadrupole ..................................................1464.4.3 Resolving Power of Linear Quadrupoles..........................................1504.4.4 RF-Only Quadrupoles ......................................................................1514.4.5 Tandem MS with Quadrupole Analyzers .........................................1524.4.6 Linear Quadrupole Ion Traps ...........................................................153
4.5 Three-Dimensional Quadrupole Ion Trap................................................1544.5.1 Introduction to the Quadrupole Ion Trap..........................................1544.5.2 Principle of the Quadrupole Ion Trap...............................................1554.5.3 Operation of the Quadrupole Ion Trap .............................................1574.5.4 External Ion Sources for the Quadrupole Ion Trap ..........................1624.5.6 Tandem MS with the Quadrupole Ion Trap......................................163
4.6 Fourier Transform Ion Cyclotron Resonance ..........................................1644.6.1 Introduction to Ion Cyclotron Resonance.........................................1644.6.2 Principle of Ion Cyclotron Resonance..............................................1654.6.3 Fourier Transform Ion Cyclotron Resonance ...................................1664.6.4 Experimental Setup of FT-ICR-MS .................................................1674.6.5 Excitation Modes in FT-ICR-MS.....................................................1684.6.6 Detection in FT-ICR-MS..................................................................1694.6.7 External Ion Sources for FT-ICR-MS ..............................................1714.6.8 Tandem MS with FT-ICR Instruments.............................................172
4.7 Hybrid Instruments ..................................................................................1734.8 Detectors ..................................................................................................175

XII Table of Contents
4.8.1 Discrete Dynode Electron Multipliers.............................................. 1754.8.2 Channel Electron Multipliers ........................................................... 1764.8.3 Microchannel Plates ......................................................................... 1774.8.4 Post-Acceleration and Conversion Dynode...................................... 1784.8.5 Focal Plane Detectors....................................................................... 179
4.9 Vacuum Technology................................................................................ 1804.9.1 Basic Mass Spectrometer Vacuum System ...................................... 1804.9.2 High Vacuum Pumps ....................................................................... 181
4.10 Buying an Instrument ............................................................................ 182Reference List................................................................................................ 182
5 Electron Ionization......................................................................................... 1935.1 Behavior of Neutrals Upon Electron Impact ........................................... 193
5.1.1 Formation of Ions............................................................................. 1935.1.2 Processes Accompanying Electron Ionization ................................. 1955.1.3 Efficiency of Electron Ionization ..................................................... 1965.1.4 Practical Consequences of Internal Energy...................................... 1975.1.5 Low-Energy Electron Ionization Mass Spectra................................ 198
5.2 Electron Ionization Ion Sources............................................................... 2005.2.1 Layout of an Electron Ionization Ion Source ................................... 2005.2.2 Generation of Primary Electrons...................................................... 2025.2.3 Overall Efficiency of an Electron Ionization Ion Source ................. 2035.2.4 Optimization of Ion Beam Geometry ............................................... 205
5.3 Sample Introduction................................................................................. 2065.3.1 Direct Insertion Probe ...................................................................... 2065.3.2 Direct Exposure Probe ..................................................................... 2105.3.3 Reference Inlet System..................................................................... 2115.3.4 Gas Chromatograph ......................................................................... 2135.3.5 Liquid Chromatograph ..................................................................... 213
5.4 Ion Chromatograms ................................................................................. 2145.4.1 Total Ion Current.............................................................................. 2145.4.2 Reconstructed Ion Chromatogram.................................................... 215
5.5 Mass Analyzers for EI ............................................................................. 2175.6 Analytes for EI......................................................................................... 2175.7 Mass Spectral Databases for EI ............................................................... 218Reference List................................................................................................ 218
6 Fragmentation of Organic Ions and Interpretation of EI Mass Spectra... 2236.1 Cleavage of a Sigma-Bond ...................................................................... 223
6.1.1 Writing Conventions for Molecular Ions ......................................... 2236.1.2 -Bond Cleavage in Small Non-Functionalized Molecules ............. 2256.1.3 'Even-Electron Rule'......................................................................... 2266.1.4 -Bond Cleavage in Small Functionalized Molecules ..................... 228
6.2 Alpha-Cleavage ....................................................................................... 2296.2.1 -Cleavage of Acetone Molecular Ion............................................. 2296.2.2 Stevenson's Rule............................................................................... 230
XIII
6.2.3 -Cleavage of Non-Symmetrical Aliphatic Ketones........................2326.2.4 Acylium Ions and Carbenium Ions...................................................2346.2.5 -Cleavage of Amines, Ethers, and Alcohols ..................................2356.2.6 -Cleavage of Halogenated Hydrocarbons ......................................2436.2.7 Double -Cleavage ..........................................................................244
6.3 Distonic Ions............................................................................................2476.3.1 Definition of Distonic Ions...............................................................2476.3.2 Formation and Properties of Distonic Ions.......................................2476.3.3 Distonic Ions as Intermediates..........................................................248
6.4 Benzylic Bond Cleavage..........................................................................2496.4.1 Cleavage of the Benzylic Bond in Phenylalkanes ............................2496.4.2 The Further Fate of [C6H5]
+ and [C7H7]+..........................................251
6.4.3 Isomerization of [C7H8]+• and [C8H8]
+•Ions......................................2526.4.4 Rings Plus Double Bonds.................................................................254
6.5 Allylic Bond Cleavage.............................................................................2556.5.1 Cleavage of the Allylic Bond in Aliphatic Alkenes .........................2556.5.2 Methods for the Localization of the Double Bond ...........................257
6.6. Cleavage of Non-Activated Bonds .........................................................2586.6.1 Saturated Hydrocarbons ...................................................................2586.6.2 Carbenium Ions ................................................................................2606.6.3 Very Large Hydrocarbons ................................................................2626.6.4 Recognition of the Molecular Ion Peak............................................263
6.7 McLafferty Rearrangement......................................................................2646.7.1 McLafferty Rearrangement of Aldehydes and Ketones ...................2646.7.2 Fragmentation of Carboxylic Acids and Their Derivatives..............2676.7.3 McLafferty Rearrangement of Aromatic Hydrocarbons ..................2716.7.4 McLafferty Rearrangement with Double Hydrogen Transfer ..........272
6.8 Retro-Diels-Alder Reaction .....................................................................2766.8.1 Properties of the Retro-Diels-Alder Reaction...................................2766.8.2 Influence of Positional Isomerism on the RDA Reaction.................2786.8.3 Is the RDA Reaction Stepwise or Concerted?..................................2796.8.4 RDA Reaction in Natural Products ..................................................2796.8.5 Widespread Occurrence of the RDA Reaction.................................280
6.9 Elimination of Carbon Monoxide ............................................................2816.9.1 CO Loss from Phenols .....................................................................2816.9.2 CO and C2H2 Loss from Quinones ...................................................2836.9.3 Fragmentation of Arylalkylethers.....................................................2856.9.4 CO Loss from Transition Metal Carbonyl Complexes.....................2876.9.5 CO Loss from Carbonyl Compounds ...............................................2886.9.6 Differentiation Between Loss of CO, N2, and C2H4 .........................288
6.10 Thermal Degradation Versus Ion Fragmentation...................................2896.10.1 Decarbonylation and Decarboxylation ...........................................2896.10.2 Retro-Diels-Alder Reaction............................................................2896.10.3 Loss of H2O from Alkanols............................................................2906.10.4 EI Mass Spectra of Organic Salts ...................................................291
6.11 Alkene Loss from Onium Ions...............................................................292

XIV Table of Contents
6.11.1 McLafferty Rearrangement of Onium Ions .................................... 2936.11.2 Onium Reaction ............................................................................. 296
6.12 Ion-Neutral Complexes.......................................................................... 3006.13 Ortho Elimination (Ortho Effect) .......................................................... 304
6.13.1 Ortho Elimination from Molecular Ions......................................... 3056.13.2 Ortho Elimination from Even-Electron Ions .................................. 3066.13.3 Ortho Elimination in the Fragmentation of Nitroarenes................. 308
6.14 Heterocyclic Compounds....................................................................... 3116.14.1 Saturated Heterocyclic Compounds ............................................... 3116.14.2 Aromatic Heterocyclic Compounds ............................................... 315
6.15 Guidelines for the Interpretation of Mass Spectra ................................. 3196.15.1 Summary of Rules.......................................................................... 3196.15.2 Systematic Approach to Mass Spectra ........................................... 320
Reference List................................................................................................ 320
7 Chemical Ionization ....................................................................................... 3317.1 Basics of Chemical Ionization ................................................................. 331
7.1.1 Formation of Ions in Chemical Ionization........................................ 3317.1.2 Chemical Ionization Ion Sources ..................................................... 3327.1.3 Sensitivity of Chemical Ionization ................................................... 333
7.2 Chemical Ionization by Protonation ........................................................ 3337.2.1 Source of Protons ............................................................................. 3337.2.2 Methane Reagent Gas Plasma .......................................................... 3347.2.3 Energetics of Protonation ................................................................. 3367.2.4 Methane Reagent Gas PICI Spectra ................................................. 3377.2.5 Other Reagent Gases in PICI ........................................................... 338
7.3 Charge Exchange Chemical Ionization.................................................... 3417.3.1 Energetics of CE .............................................................................. 3417.3.2 Reagent Gases for CE-CI ................................................................. 3427.3.4 Compound Class-Selective CE-CI ................................................... 3437.3.5 Regio- and Stereoselectivity in CE-CI ............................................. 344
7.4 Electron Capture ...................................................................................... 3457.4.1 Ion Formation by Electron Capture.................................................. 3457.4.3 Energetics of EC .............................................................................. 3457.4.4 Creating Thermal Electrons ............................................................. 3477.4.5 Appearance of EC Spectra ............................................................... 3487.4.6 Applications of EC........................................................................... 348
7.5 Sample Introduction in CI ....................................................................... 3487.5.1 Desorption Chemical Ionization....................................................... 349
7.6 Analytes for CI ........................................................................................ 3507.7 Mass Analyzers for CI ............................................................................. 351Reference List................................................................................................ 351
8 Field Ionization and Field Desorption .......................................................... 3558.1 Field Ionization Process........................................................................... 3558.2 FI and FD Ion Source .............................................................................. 357

XV
8.3 Field Emitters...........................................................................................3588.3.1 Blank Metal Wires as Emitters.........................................................3588.3.2 Activated Emitters............................................................................3588.3.3 Emitter Temperature.........................................................................3598.3.4 Handling of Activated Emitters........................................................3608.3.5 Liquid Injection Field Desorption Ionization ...................................362
8.4 FI Spectra.................................................................................................3638.4.1 Origin of [M+H]+ Ions in FI-MS......................................................3638.4.2 Field-Induced Dissociation...............................................................3648.4.3 Multiply-Charged Ions in FI-MS......................................................364
8.5 FD Spectra ...............................................................................................3658.5.1 Ion Formation in FD-MS..................................................................3658.5.2 Cluster Ion Formation in FD-MS .....................................................3698.5.3 FD-MS of Ionic Analytes .................................................................3718.5.4 Best Anode Temperature and Thermal Decomposition ...................3728.5.5 FD-MS of Polymers .........................................................................3738.5.6 Sensitivity of FI-MS and FD-MS .....................................................3738.5.7 Types of Ions in FD-MS...................................................................374
8.6 Analytes for FI and FD ............................................................................3758.7 Mass Analyzers for FI and FD.................................................................376Reference List ................................................................................................376
9 Fast Atom Bombardment ..............................................................................3819.1 Ion Sources for FAB and LSIMS.............................................................382
9.1.1 FAB Ion Sources ..............................................................................3829.1.2 LSIMS Ion Sources ..........................................................................3839.1.3 FAB Probes ......................................................................................383
9.2 Ion Formation in FAB and LSIMS ..........................................................3849.2.1 Ion Formation from Inorganic Samples............................................3849.2.2 Ion Formation from Organic Samples ..............................................385
9.3 FAB Matrices...........................................................................................3879.3.1 The Role of the Liquid Matrix..........................................................3879.3.2 Characteristics of FAB Matrix Spectra ............................................3889.3.3 Unwanted Reactions in FAB-MS.....................................................389
9.4 Applications of FAB-MS.........................................................................3899.4.1 FAB-MS of Analytes of Low to Medium Polarity ...........................3899.4.2 FAB-MS of Ionic Analytes ..............................................................3919.4.3 High-Mass Analytes in FAB-MS .....................................................3929.4.4 Accurate Mass Measurements in FAB .............................................3939.4.5 Continuous-Flow FAB .....................................................................3959.4.6 Low-Temperature FAB ....................................................................3969.4.7 FAB-MS and Peptide Sequencing....................................................398
9.5 Massive Cluster Impact ...........................................................................4009.6 252Californium Plasma Desorption...........................................................4009.7 General Characteristics of FAB and LSIMS............................................402
9.7.1 Sensitivity of FAB-MS.....................................................................402

XVI Table of Contents
9.7.2 Types of Ions in FAB-MS................................................................ 4029.7.3 Analytes for FAB-MS ...................................................................... 4039.7.4 Mass Analyzers for FAB-MS........................................................... 403
Reference List................................................................................................ 404
10 Matrix-Assisted Laser Desorption/Ionization............................................ 41110.1 Ion Sources for LDI and MALDI .......................................................... 41110.2 Ion Formation ........................................................................................ 413
10.2.1 Ion Yield and Laser Fluence .......................................................... 41310.2.2 Effect of Laser Irradiation on the Surface ...................................... 41410.2.3 Temporal Evolution of a Laser Desorption Plume......................... 41510.2.4 Ion Formation in MALDI............................................................... 416
10.3 MALDI Matrices ................................................................................... 41610.3.1 Role of the Solid Matrix................................................................. 41610.3.2 Matrices in UV-MALDI................................................................. 41710.3.3 Characteristics of MALDI Matrix Spectra ..................................... 418
10.4 Sample Preparation................................................................................ 41910.4.1 Standard Sample Preparation ......................................................... 41910.4.2 Cationization and Cation Removal................................................. 42010.4.3 Solvent-Free Sample Preparation................................................... 42110.4.4 Sample Introduction ....................................................................... 42210.4.5 Additional Methods of Sample Supply .......................................... 423
10.4 Applications of LDI............................................................................... 42310.5 Applications of MALDI ........................................................................ 425
10.5.1 MALDI-MS of Synthetic Polymers ............................................... 42510.5.2 Fingerprints by MALDI-MS .......................................................... 42710.5.3 Carbohydrates by MALDI-MS ...................................................... 42710.5.4 Structure Elucidation of Carbohydrates by MALDI ...................... 42810.5.5 Oligonucleotides in MALDI .......................................................... 429
10.6 Desorption/Ionization on Silicon ........................................................... 43010.7 Atmospheric Pressure MALDI .............................................................. 43110.8 General Characteristics of MALDI........................................................ 432
10.8.1 Sample Consumption and Detection Limit .................................... 43210.8.2 Analytes for MALDI...................................................................... 43210.8.3 Types of Ions in LDI and MALDI-MS .......................................... 43310.8.4 Mass Analyzers for MALDI-MS ................................................... 433
Reference List................................................................................................ 434
11 Electrospray Ionization................................................................................ 44111.1 Development of ESI and Related Methods............................................ 441
11.1.1 Atmospheric Pressure Ionization.................................................... 44111.1.2 Thermospray .................................................................................. 44211.1.3 Electrohydrodynamic Ionization .................................................... 44311.1.4 Electrospray Ionization .................................................................. 444
11.2 Ion Sources for ESI................................................................................ 44411.2.1 Basic Design Considerations.......................................................... 444

XVII
11.2.2 ESI with Modified Sprayers ...........................................................44511.2.3 Nano-Electrospray..........................................................................44711.2.4 ESI with Modified Spray Geometries ............................................44911.2.5 Skimmer CID .................................................................................451
11.3 Ion Formation ........................................................................................45111.3.1 Formation of an Electrospray .........................................................45111.3.2 Disintegration of Charged Droplets................................................45311.3.3 Formation of Ions from Charged Droplets .....................................454
11.4 Charge Deconvolution ...........................................................................45511.4.1 Problem of Multiple Charging........................................................45511.4.2 Mathematical Charge Deconvolution.............................................45811.4.3 Hardware Charge Deconvolution ...................................................46011.4.4 Controlled Charge Reduction in ESI ..............................................461
11.5 Applications of ESI................................................................................46211.5.1 ESI of Small Molecules..................................................................46211.5.2 ESI of Metal Complexes ................................................................46211.5.3 ESI of Surfactants...........................................................................46411.5.4 Oligonucleotides, DNA, and RNA.................................................46411.5.5 ESI of Oligosaccharides .................................................................465
11.6 Atmospheric Pressure Chemical Ionization ...........................................46511.7 Atmospheric Pressure Photoionization ..................................................46711.8 General Characteristics of ESI...............................................................467
11.8.1 Sample Consumption .....................................................................46711.8.2 Types of Ions in ESI.......................................................................46811.8.3 Mass Analyzers for ESI..................................................................468
Reference List ................................................................................................468
12 Hyphenated Methods ...................................................................................47512.1 General Properties of Chromatography-Mass Spectrometry Coupling..475
12.1.1 Chromatograms and Spectra...........................................................47712.1.2 Selected Ion Monitoring.................................................................47812.1.3 Quantitation....................................................................................479
12.2 Gas Chromatography-Mass Spectrometry .............................................48212.2.1 GC-MS Interfaces...........................................................................48212.2.2 Volatility and Derivatization ..........................................................48312.2.3 Column Bleed.................................................................................48312.2.4 Fast GC-MS....................................................................................484
12.3 Liquid Chromatography-Mass Spectrometry.........................................48512.3.1 LC-MS Interfaces ...........................................................................48512.3.2 Multiplexed Electrospray Inlet Systems.........................................487
12.3 Tandem Mass Spectrometry ..................................................................48812.4. Ultrahigh-Resolution Mass Spectrometry.............................................490Reference List ................................................................................................491

XVIII Table of Contents
Appendix ............................................................................................................ 4951 Isotopic Composition of the Elements........................................................ 4952 Carbon Isotopic Patterns............................................................................. 5013 Silicon and Sulfur Isotopic Patterns............................................................ 5024 Chlorine and Bromine Isotopic Patterns ..................................................... 5035 Characteristic Ions ...................................................................................... 5036 Frequent Impurities..................................................................................... 505
Subject Index ..................................................................................................... 507

1 Introduction
Mass spectrometry is an indispensable analytical tool in chemistry, biochemistry,pharmacy, and medicine. No student, researcher or practitioner in these disciplinescan really get along without a substantial knowledge of mass spectrometry. Massspectrometry is employed to analyze combinatorial libraries [1,2] sequence bio-molecules, [3] and help explore single cells [4,5] or other planets. [6] Structureelucidation of unknowns, environmental and forensic analytics, quality control ofdrugs, flavors and polymers: they all rely to a great extent on mass spectrometry.[7-11]
From the 1950s to the present mass spectrometry has changed tremendouslyand still is changing. [12,13] The pioneering mass spectrometrist had a home-builtrather than a commercial instrument. This machine, typically a magnetic sector in-strument with electron ionization, delivered a few mass spectra per day, providedsufficient care was taken of this delicate device. If the mass spectrometrist knewthis particular instrument and understood how to interpret EI spectra he or she hada substantial knowledge of mass spectrometry of that time. [14-18]
Nowadays, the output of mass spectra has reached an unprecedented level.Highly automated systems are able to produce even thousands of spectra per daywhen running a routine application where samples of the very same type are to betreated by an analytical protocol that has been carefully elaborated by an expertbefore. A large number of ionization methods and types of mass analyzers hasbeen developed and combined in various ways. People bringing their samples to amass spectrometry laboratory for analysis by any promising ionization methodoften feel overburdened by the task of merely having to select one out of about adozen techniques offered. It is this variety, that makes a basic understanding ofmass spectrometry more important than ever before. On the other extreme, thereare mass spectrometry laboratories employing only one particular method – pref-erably matrix-assisted laser desorption/ionization (MALDI) or electrospray ioni-zation (ESI). In contrast to some 40–50 years ago, the instrumentation is con-cealed in a “black box” actually, a nicely designed and beautifully colored unitresembling an espresso machine or tumble dryer. Let us take a look inside!
1.1 Aims and Scope
This book is tailored to be your guide to mass spectrometry – from the first stepsto your daily work in research. Starting from the very principles of gas phase ionchemistry and isotopic properties, it leads through design of mass analyzers, mass

2 1 Introduction
spectral interpretation and ionization methods in use. Finally, the book closes witha chapter on chromatography–mass spectrometry coupling. In total, it comprisesof twelve chapters that can be read independently from each other. However, forthe novice it is recommended to work through from front to back, occasionallyskipping over more advanced sections.
Step by step you will understand how mass spectrometry works and what it cando as a powerful tool in your hands that serves equally well for analytical applica-tions as for basic research. A clear layout and many high-quality figures andschemes are included to assist your understanding. The correctness of scientificcontent has been examined by leading experts in a manner that has been adaptedas Sponsor Referee Procedure by an established mass spectrometry journal. [19]Each chapter provides a list of carefully selected references, emphasizing tutorialand review articles, book chapters and monographs in the respective field. Titlesare included with all citations to help with the evaluation of useful further reading.[20] References for general further reading on mass spectrometry are compiled atthe end of this chapter.
The coverage of this book is restricted to the field of what is called “organicmass spectrometry” in a broad sense. It includes the ionization methods and massanalyzers currently in use, and in addition to classical organic compounds it cov-ers applications to bio-organic samples such as peptides and oligonucleotides. Ofcourse, transition metal complexes, synthetic polymers and fullerenes are dis-cussed as well as environmental or forensic applications. The classical fields ofinorganic mass spectrometry, i.e., elemental analysis by glow-discharge, thermalionization or secondary ion mass spectrometry are omitted. Accelerator and iso-tope ratio mass spectrometry are also beyond the scope of this volume.
Note: “Problems and solutions“ sections are omitted from the printed book.These are offered free of charge at http://www.ms-textbook.com.
1.2 What Is Mass Spectrometry?
Well, mass spectrometry is somewhat different. The problems usually start withthe simple fact that most mass spectrometrists do not like to be called mass spec-troscopists.
Rule: “First of all, never make the mistake of calling it 'mass spectroscopy'.Spectroscopy involves the absorption of electromagnetic radiation, and massspectrometry is different, as we will see. The mass spectrometrists sometimesget upset if you confuse this issue.” [21]
Indeed, there is almost no book using the term mass spectroscopy and all sci-entific journals in the field bear mass spectrometry in their titles. You will findsuch highlighted rules, notes and definitions throughout the book. This moreamusing one – we might call it the “zeroth law of mass spectrometry” – has been

1.2 What Is Mass Spectrometry? 3
taken from a standard organic chemistry textbook. The same author finishes hischapter on mass spectrometry with the conclusion that “despite occasional mys-teries, mass spectrometry is still highly useful”. [21]
Historical Remark: Another explanation for this terminology originates fromthe historical development of our instrumentation. [13] The device employedby Thomson to do the first of all mass-separating experiments was a type ofspectroscope showing blurred signals on a fluorescent screen. [22] Dempsterconstructed an instrument with a deflecting magnetic field with an angle of180°. In order to detect different masses, it could either be equipped with aphotographic plate – a so-called mass spectrograph – or it could have a variablemagnetic field to detect different masses by focusing them successively onto anelectric point detector. [23] Later, the term mass spectrometer was coined forthe latter type of instruments with scanning magnetic field. [24]
To have a common platform to build on, we need to define mass spectrometryand several closely related issues, most of them being generalized or refined inlater chapters. Then, we may gather the pieces of the puzzle to get a rough esti-mate of what needs to be known in order to understand the subject. Finally, it isindicated to agree on some conventions for naming and writing. [25-27]
1.2.1 Mass Spectrometry
“The basic principle of mass spectrometry (MS) is to generate ions from either in-organic or organic compounds by any suitable method, to separate these ions bytheir mass-to-charge ratio (m/z) and to detect them qualitatively and quantitativelyby their respective m/z and abundance. The analyte may be ionized thermally, byelectric fields or by impacting energetic electrons, ions or photons. The ... ions canbe single ionized atoms, clusters, molecules or their fragments or associates. Ionseparation is effected by static or dynamic electric or magnetic fields.” Althoughthis definition of mass spectrometry dates back to 1968 when organic mass spec-trometry was in its infancy, [28] it is still valid. However, two additions should bemade. First, besides electrons, (atomic) ions or photons, energetic neutral atomsand heavy cluster ions can also be used to effect ionization of the analyte. Second,as demonstrated with great success by the time-of-flight analyzer, ion separationby m/z can be effected in field free regions, too, provided the ions possess a well-defined kinetic energy at the entrance of the flight path.
1.2.2 Mass Spectrometer
Obviously, almost any technique to achieve the goals of ionization, separation anddetection of ions in the gas phase can be applied – and actually has been applied –in mass spectrometry. This leads to a simple basic setup having all mass spec-trometers in common. A mass spectrometer consists of an ion source, a mass

4 1 Introduction
analyzer and a detector which are operated under high vacuum conditions. Acloser look at the front end of such a device might separate the steps of sample in-troduction, evaporation and successive ionization or desorption/ionization, re-spectively, but it is not always trivial to identify each of these steps clearly sepa-rated from the others. If the instrument is not a too old one, some data system willbe added to the rear end which is used to collect and process data from the detec-tor. Since the 1990s, data systems are also employed to control all functions of theinstrument (Fig. 1.1).
The consumption of analyte by its examination in the mass spectrometer is anaspect deserving our attention: Whereas other spectroscopic methods such as nu-clear magnetic resonance (NMR), infrared (IR) or Raman spectroscopy do allowfor sample recovery, mass spectrometry does consume the analyte. This is thelogical result of the sequence from ionization and translational motion through themass analyzer to the detector during analysis. Although some sample is consumedfor mass spectrometry, it may still be regarded as a practically non-destructivemethod because the amount of analyte needed is in the low microgram range andoften by several orders of magnitude below. In turn, the extremely low sampleconsumption of mass spectrometry makes it the method of choice when most otheranalytical techniques fail because they are not able to yield analytical informationfrom nanogram amounts of sample.
ionsource
massanalyzer detector data
systemsample
inlet
atmosphere/vacuum high vacuum
Fig. 1.1. General scheme of a mass spectrometer. Often, several types of sample inlets areattached to the ion source housing. Transfer of the sample from atmospheric pressure to thehigh vacuum of the ion source and mass analyzer is accomplished by use of a vacuum lock(Chap. 5.3).
1.2.3 Mass Spectrum
A mass spectrum is the two-dimensional representation of signal intensity (ordi-nate) versus m/z (abscissa). The intensity of a peak, as signals are usually called,directly reflects the abundance of ionic species of that respective m/z ratio whichhave been created from the analyte within the ion source.
The mass-to-charge ratio, m/z, (read “m over z”) [29] is dimensionless by defi-nition, because it calculates from the dimensionless mass number, m, of a givenion, and the number of its elementary charges, z. The number of elementarycharges is often, but by far not necessarily, equal to one. As long as only singlycharged ions are observed (z = 1) the m/z scale directly reflects the m scale. How-

1.2 What Is Mass Spectrometry? 5
ever, there can be conditions where doubly, triply or even highly charged ions arebeing created from the analyte depending on the ionization method employed. Thelocation of a peak on the abscissa is reported as “at m/z x”.
Note: Some mass spectrometrists use the unit thomson [Th] (to honorJ. J. Thomson) instead of the dimensionless quantity m/z. Although the thom-son is accepted by some journals, it is not a SI unit.
The distance between peaks on that axis has the meaning of a neutral loss fromthe ion at higher m/z to produce the fragment ion at lower m/z. Therefore, theamount of this neutral loss is given as “x u”, where the symbol u stands for unifiedatomic mass. It is important to notice that the mass of the neutral is only reflectedby the difference between the corresponding m/z ratios. This is because the massspectrometer detects only charged species, i.e., the charge-retaining group of afragmenting ion. Since 1961 the unified atomic mass [u] is defined as 1/12 of themass of one atom of nuclide 12C which has been assigned to 12 u exactly by con-vention.
Note: In particular mass spectrometrists in the biomedical field of mass spec-trometry tend to use the dalton [Da] (to honor J. Dalton) instead of the unifiedatomic mass [u]. The dalton also is not a SI unit.
Often but not necessarily, the peak at highest m/z results from the detection ofthe intact ionized molecule, the molecular ion, M+•. The molecular ion peak isusually accompanied by several peaks at lower m/z caused by fragmentation of themolecular ion to yield fragment ions. Consequently, the respective peaks in themass spectrum may be referred to as fragment ion peaks.
The most intense peak of a mass spectrum is called base peak. In most repre-sentations of mass spectral data the intensity of the base peak is normalized to100 % relative intensity. This largely helps to make mass spectra more easilycomparable. The normalization can be done because the relative intensities are in-dependent from the absolute ion abundances registered by the detector. However,there is an upper limit for the number of ions and neutrals per volume inside theion source where the appearance of spectra will significantly change due to auto-protonation (Chap. 7). In the older literature, spectra were sometimes normalizedrelative to the sum of all intensities measured, e.g., denoted as % ions, or the in-tensities were reported normalized to the sum of all intensities above a certain m/z,e.g., above m/z 40 (% 40).
Example: In the electron ionization mass spectrum of a hydrocarbon, the mo-lecular ion peak and the base peak of the spectrum correspond to the same ionicspecies at m/z 16 (Fig. 1.2). The fragment ion peaks at m/z 12–15 are spaced at 1 udistance. Obviously, the molecular ion, M+•, fragments by loss of H• which is theonly possibility to explain the peak at m/z 15 by loss of a neutral of 1 u mass. Ac-cordingly, the peaks at lower m/z might arise from loss of a H2 molecule (2 u) andso forth. It does not take an expert to recognize that this spectrum belongs tomethane, CH4, showing its molecular ion peak at m/z 16 because the atomic mass

6 1 Introduction
number of carbon is 12 and that of hydrogen is 1, and thus 12 u + 4 1 u = 16 u.Removal of one electron from a 16 u neutral yields a singly-charged radical ionthat is detected at m/z 16 by the mass spectrometer. Of course, most mass spectraare not that simple, but this is how it works.
Fig. 1.2. Electron ionization mass spectrum of a hydrocarbon. Adapted with permission.© National Institute of Standards and Technology, NIST, 2002.
The above spectrum is represented as a bar graph or histogram. Such data re-duction is common in mass spectrometry and useful as long as peaks are well re-solved. The intensities of the peaks can be obtained either from measured peakheights or more correctly from peak areas. The position, i.e., the m/z ratio, of thesignal is determined from its centroid. Noise below some user-defined cut level isusually subtracted from the bar graph spectrum. If peak shape and peak width be-come important, e.g., in case of high mass analytes or high resolution measure-ments, spectra should be represented as profile data as initially acquired by themass spectrometer. Tabular listings of mass spectra are used to report mass andintensity data more accurately (Fig. 1.3).
m/z
100 100
760750 770m/z760750 770
cut level 3 %
rela
tive
inte
nsity
[%]
M M+. +.
m/z rel. int. [%]
758.9 100.0759.9 63.2760.9 21.7
noise
a b c
Fig. 1.3. Three representations of the molecular ion signal in the field desorption massspectrum (Chap. 8) of tetrapentacontane, C54H110; (a) profile spectrum, (b) bar graph repre-sentation, and (c) tabular listing.

1.4 Terminology 7
1.3 Filling the Black Box
There is no one-and-only approach to the wide field of mass spectrometry. Atleast, it can be concluded from the preceding pages that it is necessary to learnabout the ways of sample introduction, generation of ions, their mass analysis andtheir detection as well as about registration and presentation of mass spectra. Thestill missing issue is not inherent to a mass spectrometer, but of key importancefor the successful application of mass spectrometry. This is mass spectral inter-pretation. All these items are correlated to each other in many ways and contributeto what we call mass spectrometry (Fig. 1.4).
fundamentals
ionization processesinternal energytime scale of events
isotopic distributionisotopic mass
technical realization
sample introduction
ionization methods
vacuum systems
types of mass analyzerscombinations of mass analyzersmodes of operation
coupling of separation devices
mass spectral interpretation
fragmentation pathwayscharacteristic ionsrules
applications
identificationquantitation
MS
Fig. 1.4. The main contributions to what we call mass spectrometry. Each of the segmentsis correlated to the others in multiple ways.
1.4 Terminology
As indicated in the very first introductory paragraphs, terminology can be a deli-cate issue in mass spectrometry (shouldn't it be mass spectroscopy?). To effec-tively communicate about the subject we need to agree on some established terms,acronyms and symbols for use in mass spectrometry.
The current terminology is chiefly defined by three authoritative publications:i) a compilation by Price under the guidance of the American Society for MassSpectrometry (ASMS), [25] ii) one by Todd representing the official recommen-dations of the International Union of Pure and Applied Chemistry (IUPAC), [26]and iii) one by Sparkman trying to bring the preceding and sometimes contradic-tory ones together. [27] IUPAC, for example, stays in opposition to the vast ma-
8 1 Introduction
jority of practitioners, journals and books when talking about mass spectroscopyand defining terms such as daughter ion and parent ion as equivalent to production and precursor ion, respectively. Sparkman discourages the use of daughter ionand parent ion as these are archaic and gender-specific terms. On the other hand,Price and Sparkman keep using mass spectrometry. Unfortunately, none of thesecollections is fully comprehensive, e.g., only IUPAC offers terms related to vac-uum technology and Sparkman does not give a definition of ionization energy.Nevertheless, there is about 95 % agreement between these guidelines to termi-nology in mass spectrometry and their overall coverage can be regarded highlysufficient making the application of any of these beneficial to oral and writtencommunication.
One cannot ignore the existence of multiple terms for one and the same thingsometimes just coined for commercial reasons, e.g., mass-analyzed ion kinetic en-ergy spectrometry (MIKES, correct) and direct analysis of daughter ions (DADI,incorrect and company term). Another prominent example concerns the use of MSas an acronym for mass spectrometry, mass spectrometer and mass spectrum, too.This is misleading. The acronym MS should only be used to abbreviate massspectrometry. Unfortunately, misleading and redundant terms are used throughoutthe literature, and thus, we need at least to understand their meaning even if we arenot going to use them actively. Terminology in this book avoids outdated or vagueterms and special notes are given for clarification wherever ambiguities mightarise. Furthermore, mass spectrometrist like to communicate their work usingcountless acronyms, [30,31] and there is no use to avoid them here. They are allexplained when used for the first time in a chapter and they are included in thesubject index for reference.
Table 1.1. Symbols
Symbol Meaning
• unpaired electron in radicals+ positive even-electron ions– negative even-electron ions+• positive radical ions–• negative radical ions
arrow for transfer of an electron pairsingle-barbed arrow for transfer of a single electron
to indicate position of cleaved bond
fragmentation or reactionrearrangement fragmentation
1.5 Units, Physical Quantities, and Physical Constants 9
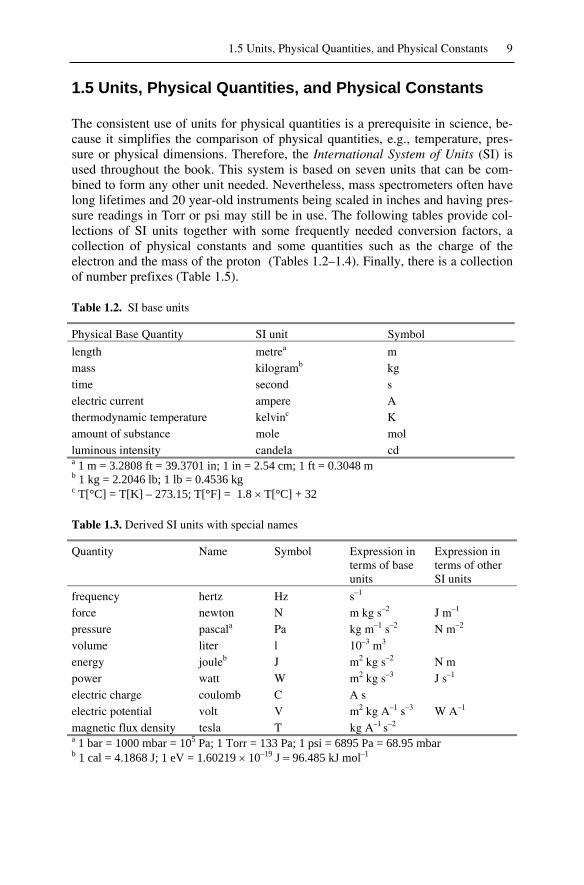
1.5 Units, Physical Quantities, and Physical Constants
The consistent use of units for physical quantities is a prerequisite in science, be-cause it simplifies the comparison of physical quantities, e.g., temperature, pres-sure or physical dimensions. Therefore, the International System of Units (SI) isused throughout the book. This system is based on seven units that can be com-bined to form any other unit needed. Nevertheless, mass spectrometers often havelong lifetimes and 20 year-old instruments being scaled in inches and having pres-sure readings in Torr or psi may still be in use. The following tables provide col-lections of SI units together with some frequently needed conversion factors, acollection of physical constants and some quantities such as the charge of theelectron and the mass of the proton (Tables 1.2–1.4). Finally, there is a collectionof number prefixes (Table 1.5).
Table 1.2. SI base units
Physical Base Quantity SI unit Symbol
length metrea mmass kilogramb kgtime second selectric current ampere Athermodynamic temperature kelvinc Kamount of substance mole molluminous intensity candela cda 1 m = 3.2808 ft = 39.3701 in; 1 in = 2.54 cm; 1 ft = 0.3048 mb 1 kg = 2.2046 lb; 1 lb = 0.4536 kgc T[°C] = T[K] – 273.15; T[°F] = 1.8 T[°C] + 32
Table 1.3. Derived SI units with special names
Quantity Name Symbol Expression interms of baseunits
Expression interms of otherSI units
frequency hertz Hz s–1
force newton N m kg s–2 J m–1
pressure pascala Pa kg m–1 s–2 N m–2
volume liter l 10–3 m3
energy jouleb J m2 kg s–2 N mpower watt W m2 kg s–3 J s–1
electric charge coulomb C A selectric potential volt V m2 kg A–1 s–3 W A–1
magnetic flux density tesla T kg A–1 s–2
a 1 bar = 1000 mbar = 105 Pa; 1 Torr = 133 Pa; 1 psi = 6895 Pa = 68.95 mbarb 1 cal = 4.1868 J; 1 eV = 1.60219 10–19 J 96.485 kJ mol–1

10 1 Introduction
Table 1.4. Physical constants and frequently used quantities
Physical Constant/Quantity Symbol Quantity
charge of the electron e 1.60219 10–19 Cmass of the electron me 9.10953 10–31 kgmass of the proton mp 1.67265 10–27 kgmass of the neutron mn 1.67495 10–27 kgunified atomic mass u 1.66055 10–27 kgspeed of light in vacuum c 2.99793 108 m s–1
Avogadro's constant NA 6.02205 1023 mol–1
Table 1.5. Number Prefixes
a f p n µ m c d k M G
atto femto pico nano micro milli centi deci kilo mega giga10–18 10–15 10–12 10–9 10–6 10–3 10–2 10–1 103 106 109
Reference List
Direct Reference
1. Enjalbal, C.; Maux, D.; Martinez, J.;Combarieu, R.; Aubagnac, J.-L. MassSpectrometry and Combinatorial Chemis-try: New Approaches for Direct Support-Bound Compound Identification. Comb.Chem. High Throughput Screening 2001,4, 363-373.
2. Enjalbal, C.; Maux, D.; Combarieu, R.;Martinez, J.; Aubagnac, J.-L. ImagingCombinatorial Libraries by Mass Spec-trometry: From Peptide to Organic-Supported Syntheses. J. Comb. Chem.2003, 5, 102-109.
3. Maux, D.; Enjalbal, C.; Martinez, J.; Au-bagnac, J.-L.; Combarieu, R. Static Sec-ondary Ion Mass Spectrometry to MonitorSolid-Phase Peptide Synthesis. J. Am. Soc.Mass Spectrom. 2001, 12, 1099-1105.
4. Beverly, M.B.; Voorhees, K.J.; Hadfield,T.L. Direct Mass Spectrometric Analysisof Bacillus Spores. Rapid Commun. MassSpectrom. 1999, 13, 2320-2326.
5. Jones, J.J.; Stump, M.J.; Fleming, R.C.;Lay, J.O., Jr.; Wilkins, C.L. Investigationof MALDI-TOF and FT-MS Techniquesfor Analysis of Escherichia Coli WholeCells. Anal. Chem. 2003, 75, 1340-1347.
6. Fenselau, C.; Caprioli, R. Mass Spec-trometry in the Exploration of Mars. J.Mass Spectrom. 2003, 38, 1-10.
7. He, F.; Hendrickson, C.L.; Marshall, A.G.Baseline Mass Resolution of Peptide Iso-bars: A Record for Molecular Mass Reso-lution. Anal. Chem. 2001, 73, 647-650.
8. Cooper, H.J.; Marshall, A.G. ESI-FT-ICRMass Spectrometric Analysis of Wine. J.Agric. Food. Chem. 2001, 49, 5710-5718.
9. Hughey, C.A.; Rodgers, R.P.; Marshall,A.G. Resolution of 11,000 Composition-ally Distinct Components in a Single ESI-FT-ICR Mass Spectrum of Crude Oil.Anal. Chem. 2002, 74, 4145-4149.
10. Mühlberger, F.; Wieser, J.; Ulrich, A.;Zimmermann, R. Single Photon IonizationVia Incoherent VUV-Excimer Light: Ro-bust and Compact TOF Mass Spectrome-ter for Real-Time Process Gas Analysis.Anal. Chem. 2002, 74, 3790-3801.
11. Glish, G.L.; Vachet, R.W. The Basics ofMass Spectrometry in the Twenty-FirstCentury. Nat. Rev. Drug Discovery 2003,2, 140-150.
12. Busch, K.L. Synergistic Developments inMS. A 50-Year Journey From "Art" toScience. Spectroscopy 2000, 15, 30-39.
13. Measuring Mass - From Positive Rays toProteins; Grayson, M.A., editor; ASMSand CHF: Santa Fe and Philadelphia,2002.
14. Meyerson, S. Reminiscences of the EarlyDays of MS in the Petroleum Industry.Org. Mass Spectrom. 1986, 21, 197-208.

Reference List 11
15. Quayle, A. Recollections of MS of theFifties in a UK Petroleum Laboratory.Org. Mass Spectrom. 1987, 22, 569-585.
16. Maccoll, A. Organic Mass Spectrometry -the Origins. Org. Mass Spectrom. 1993,28, 1371-1372.
17. Meyerson, S. Mass Spectrometry in theNews, 1949. Org. Mass Spectrom. 1993,28, 1373-1374.
18. Meyerson, S. From Black Magic toChemistry. The Metamorphosis of OrganicMS. Anal. Chem. 1994, 66, 960A-964A.
19. Boyd, R.K. Editorial: The Sponsor Refe-ree Procedure. Rapid Commun. MassSpectrom. 2002, 16.
20. Gross, M.L.; Sparkman, O.D. The Impor-tance of Titles in References. J. Am. Soc.Mass Spectrom. 1998, 9, 451.
21. Jones, M., Jr. Mass Spectrometry, in Or-ganic Chemistry, 2nd ed.; W. W. Norton& Company: New York, 2000; 641-649.
22. Griffiths, I.W. J. J. Thomson - the Centen-ary of His Discovery of the Electron andof His Invention of Mass Spectrometry.Rapid Commun. Mass Spectrom. 1997, 11,1-16.
23. Dempster, A.J. A New Method of PositiveRay Analysis. Phys. Rev. 1918, 11, 316-325.
24. Nier, A.O. Some Reflections on the EarlyDays of Mass Spectrometry at the Univer-sity of Minnesota. Int. J. Mass Spectrom.Ion Proc. 1990, 100, 1-13.
25. Price, P. Standard Definitions of TermsRelating to Mass Spectrometry. A ReportFrom the Committee on Measurementsand Standards of the ASMS. J. Am. Soc.Mass Spectrom. 1991, 2, 336-348.
26. Todd, J.F.J. Recommendations for No-menclature and Symbolism for MassSpectroscopy Including an Appendix ofTerms Used in Vacuum Technology. Int.J. Mass Spectrom. Ion. Proc. 1995, 142,211-240.
27. Sparkman, O.D. Mass Spec Desk Refer-ence; 1st ed.; Global View Publishing:Pittsburgh, 2000.
28. Kienitz, H. Einführung, in Massenspek-trometrie, Kienitz, H., editor; VerlagChemie: Weinheim, 1968.
29. Busch, K.L. Units in Mass Spectrometry.Spectroscopy 2001, 16, 28-31.
30. Busch, K.L. SAMS: Speaking With Acro-nyms in Mass Spectrometry. Spectroscopy2002, 17, 54-62.
31. Busch, K.L. A Glossary for Mass Spec-trometry. Spectroscopy 2002, 17, S26-S34.
Classical Mass Spectrometry Books
32. Field, F.H.; Franklin, J.L. Electron ImpactPhenomena and the Properties of GaseousIons; Academic Press: New York, 1957.
33. Beynon, J.H. Mass Spectrometry and ItsApplications to Organic Chemistry; 1sted.; Elsevier: Amsterdam, 1960.
34. Biemann, K. Mass Spectrometry; 1st ed.;McCrawHill Book Co.: New York, 1962.
35. Biemann, K. Mass Spectrometry - OrganicChemical Applications; 1st ed.; McCraw-Hill: New York, 1962.
36. Mass Spectrometry of Organic Ions; 1sted.; McLafferty, F.W., editor; AcademicPress: London, 1963.
37. Budzikiewicz, H.; Djerassi, C.; Williams,D.H. Mass Spectrometry of Organic Com-pounds; 1st ed.; Holden-Day: San Fran-cisco, 1967.
38. Massenspektrometrie; 1st ed.; Kienitz, H.,editor; Verlag Chemie: Weinheim, 1968.
39. Cooks, R.G.; Beynon, J.H.; Caprioli, R.M.Metastable Ions; Elsevier: Amsterdam,1973.
40. Levsen, K. Fundamental Aspects of Or-ganic Mass Spectrometry; Verlag Chemie:Weinheim, 1978.
Introductory Texts
41. Duckworth, H.E.; Barber, R.C.; Venkata-subramanian, V.S. Mass Spectroscopy;2nd ed.; Cambridge University Press:Cambridge, 1986.
42. McLafferty, F.W.; Turecek, F. Interpreta-tion of Mass Spectra; 4th ed.; UniversityScience Books: Mill Valley, 1993.
43. Watson, J.T. Introduction to Mass Spec-trometry; 3rd ed.; Lippincott-Raven: NewYork, 1997.
44. Budzikiewicz, H. Massenspektrometrie -eine Einführung; 4th ed.; Wiley-VCH:Weinheim, 1998.
45. Barker, J. Mass Spectrometry - AnalyticalChemistry by Open Learning; 2nd ed.;John Wiley & Sons: Chichester, 1999.
46. Smith, R.M. Understanding Mass Spectra- A Basic Approach; 1st ed.; John Wiley &Sons: New York, 1999.
47. Pretsch, E.; Bühlmann, P.; Affolter, C.Structure Determination of Organic Com-pounds - Tables of Spectral Data; 3rd ed.;Springer-Verlag: Heidelberg, 2000.
48. De Hoffmann, E.; Stroobant, V. MassSpectrometry - Principles and Applica-tions; 2nd ed.; John Wiley & Sons: Chich-ester, 2001.

12 1 Introduction
49. Herbert, C.G.; Johnstone, R.A.W. MassSpectrometry Basics; CRC press: BocaRaton, 2002.
Monographs
50. Porter, Q.N.; Baldas, J. Mass Spectrometryof Heterocyclic Compounds; 1st ed.;Wiley Interscience: New York, 1971.
51. Dawson, P.H. Quadrupole Mass Spec-trometry and Its Applications; Elsevier:New York, 1976.
52. Beckey, H.D. Principles of Field Desorp-tion and Field Ionization Mass Spec-trometry; Pergamon Press: Oxford, 1977.
53. Meuzelaar, H.L.C.; Haverkamp, J.; Hile-man, F.D. Pyrolysis Mass Spectrometry ofRecent and Fossil Biomaterials; Elsevier:Amsterdam, 1982.
54. Tandem Mass Spectrometry; 1st ed.;McLafferty, F.W., editor; John Wiley &Sons: New York, 1983.
55. Message, G.M. Practical Aspects of GasChromatography/Mass Spectrometry; 1sted.; John Wiley & Sons: New York, 1984.
56. Vogel, P. Carbocation Chemistry; Am-sterdam, 1985.
57. Gaseous Ion Chemistry and Mass Spec-trometry; Futrell, J.H., editor; John Wileyand Sons: New York, 1986.
58. Secondary Ion Mass Spectrometry: BasicConcepts, Instrumental Aspects, Applica-tions; 1st ed.; Benninghoven, A.; Werner,H.W.; Rudenauer, F.G., editors; WileyInterscience: New York, 1986.
59. Busch, K.L.; Glish, G.L.; McLuckey, S.A.Mass Spectrometry/Mass Spectrometry;1st ed.; Wiley VCH: New York, 1988.
60. March, R.E.; Hughes, R.J. QuadrupoleStorage Mass Spectrometry; John Wiley &Sons: Chichester, 1989.
61. Wilson, R.G.; Stevie, F.A.; Magee, C.W.Secondary Ion Mass Spectrometry: APractical Handbook for Depth Profilingand Bulk Impurity Analysis; John Wiley &Sons: Chichester, 1989.
62. Prókai, L. Field Desorption Mass Spec-trometry; Marcel Dekker: New York,1990.
63. Continuous-Flow Fast Atom Bombard-ment Mass Spectrometry; Caprioli, R.M.,editor; John Wiley & Sons: Chichester,1990.
64. Fourier Transform Ion Cyclotron Reso-nance Mass Spectrometry: Analytical Ap-plications; 1st ed.; Asamoto, B., editor;John Wiley & Sons: New York, 1991.
65. Harrison, A.G. Chemical Ionization MassSpectrometry; 2nd ed.; CRC Press: BocaRaton, 1992.
66. Chapman, J.R. Practical Organic MassSpectrometry: A Guide for Chemical andBiochemical Analysis; 2nd ed.; JohnWiley & Sons: Chichester, 1993.
67. Time of Flight Mass Spectrometry and ItsApplications; 1st ed.; Schlag, E.W., editor;Elsevier: Amsterdam, 1994.
68. Forensic Applications of Mass Spec-trometry; Yinon, J., editor; CRC Press:Boca Raton, 1994.
69. Applications of Mass Spectrometry to Or-ganic Stereochemistry; 1st ed.; Splitter,J.S.; Turecek, F., editors; Verlag Chemie:Weinheim, 1994.
70. Practical Aspects of Ion Trap Mass Spec-trometry; March, R.E.; Todd, J.F.J., edi-tors; CRC: Boca Raton, 1995; Vols. 1–3.
71. Lehmann W.D. Massenspektrometrie inder Biochemie; Spektrum AkademischerVerlag: Heidelberg, 1996.
72. Electrospray Ionization Mass Spectrome-try - Fundamentals, Instrumentation andApplications; 1st ed.; Dole, R.B., editor;John Wiley & Sons: Chichester, 1997.
73. Cotter, R.J. Time-of-Flight Mass Spec-trometry: Instrumentation and Applica-tions in Biological Research; AmericanChemical Society: Washington, DC, 1997.
74. Platzner, I.T.; Habfast, K.; Walder, A.J.;Goetz, A. Modern Isotope Ratio MassSpectrometry; John Wiley & Sons: Chich-ester, 1997.
75. Mass Spectrometry of Proteins and Pep-tides; Chapman, J.R., editor; HumanaPress: 2000.
76. Kinter, M.; Sherman, N.E. Protein Se-quencing and Identification Using TandemMass Spectrometry; John Wiley & Sons:Chichester, 2000.
77. Taylor, H.E. Inductively Coupled PlasmaMass Spectroscopy; Academic Press:London, 2000.
78. Mass Spectrometry of Polymers; 1st ed.;Montaudo, G.; Lattimer, R.P., editors;CRC Press: Boca Raton, 2001.
79. Budde, W.L. Analytical Mass Spectrome-try; ACS and Oxford University Press:Washington, D.C. and Oxford, 2001.
80. Ardrey, R.E. Liquid Chromatography-Mass Spectrometry - An Introduction;John Wiley & Sons: Chichester, 2003.

2 Gas Phase Ion Chemistry
The mass spectrometer can be regarded as a kind of chemistry laboratory, espe-cially designed to study ions in the gas phase. [1,2] In addition to the task it isusually employed for – creation of mass spectra for a generally analytical purpose– it allows for the examination of fragmentation pathways of selected ions, for thestudy of ion–neutral reactions and more. Understanding these fundamentals is pre-requisite for the proper application of mass spectrometry with all technical facetsavailable, and for the successful interpretation of mass spectra because “Analyticalchemistry is the application of physical chemistry to the real world.” [3]
In the first place, this chapter deals with the fundamentals of gas phase ionchemistry, i.e., with ionization, excitation, ion thermochemistry, ion lifetimes, andreaction rates of ion dissociation. The final sections are devoted to more practicalaspects of gas phase ion chemistry such as the determination of ionization and ap-pearance energies or of gas phase basicities and proton affinities.
Brief discussions of some topics of this chapter may also be found in physicalchemistry textbooks; however, much better introductions are given in the special-ized literature. [4-11] Detailed compound-specific fragmentation mechanisms,ion–molecule complexes, and more are dealt with later (Chap. 6.).
2.1 Quasi-Equilibrium Theory
The quasi-equilibrium theory (QET) of mass spectra is a theoretical approach todescribe the unimolecular decompositions of ions and hence their mass spectra.[12-14,14] QET has been developed as an adaptation of Rice-Ramsperger-Marcus-Kassel (RRKM) theory to fit the conditions of mass spectrometry and itrepresents a landmark in the theory of mass spectra. [11] In the mass spectrometeralmost all processes occur under high vacuum conditions, i.e., in the highly dilutedgas phase, and one has to become aware of the differences to chemical reactions inthe condensed phase as they are usually carried out in the laboratory. [15,16] Con-sequently, bimolecular reactions are rare and the chemistry in a mass spectrometeris rather the chemistry of isolated ions in the gas phase. Isolated ions are not inthermal equilibrium with their surroundings as assumed by RRKM theory. In-stead, to be isolated in the gas phase means for an ion that it may only internallyredistribute energy and that it may only undergo unimolecular reactions such asisomerization or dissociation. This is why the theory of unimolecular reactionsplays an important role in mass spectrometry.

14 2 Gas Phase Ion Chemistry
The QET is not the only theory in the field; indeed, several apparently com-petitive statistical theories to describe the rate constant of a unimolecular reactionhave been formulated. [10,14] Unfortunately, none of these theories has been ableto quantitatively describe all reactions of a given ion. Nonetheless, QET is wellestablished and even the simplified form allows sufficient insight into the behaviorof isolated ions. Thus, we start out the chapter from the basic assumptions of QET.Following this trail will lead us from the neutral molecule to ions, and over transi-tion states and reaction rates to fragmentation products and thus, through the basicconcepts and definitions of gas phase ion chemistry.
2.1.1 Basic Assumptions of QET
Due to QET the rate constant, k, of a unimolecular reaction is basically a functionof excess energy, Eex, of the reactants in the transition state and thus k(E) isstrongly influenced by the internal energy distribution of the ions under study. Thequasi-equilibrium theory makes the following essential assumptions: [12,17]1. The initial ionization is “vertical”, i.e., without change in position and kinetic
energy of the nuclei while it takes place. With the usual electron energy anyvalence shell electron may be removed.
2. The molecular ion will be of low symmetry and have an odd electron. It willhave as many low-lying excited electronic states as necessary to form essen-tially a continuum. Radiationless transitions then will result in transfer of elec-tronic energy into vibrational energy at times comparable to the periods of nu-clear vibrations.
3. These low-lying excited electronic states will in general not be repulsive;hence, the molecular ions will not dissociate immediately, but rather remain to-gether for a time sufficient for the excess electronic energy to become ran-domly distributed as vibrational energy over the ion.
4. The rates of dissociation of the molecular ion are determined by the probabili-ties of the energy randomly distributed over the ion becoming concentrated inthe particular fashions required to give several activated complex configura-tions yielding the dissociations.
5. Rearrangements of the ions can occur in a similar fashion.6. If the initial molecular ion has sufficient energy, the fragment ion will in turn
have enough energy to undergo further decomposition.
2.2 Ionization
Besides some rare experimental setups the mass analyzer of any mass spectrome-ter can only handle charged species, i.e., ions that have been created from atoms ormolecules, more seldom from radicals, zwitterions or clusters. It is the task of theion source to perform this crucial step and there is a wide range of ionizationmethods in use to achieve this goal for a wide variety of analytes.

2.2 Ionization 15
2.2.1 Electron Ionization
The classical procedure of ionization involves shooting energetic electrons on aneutral. This is called electron ionization (EI). Electron ionization has formerlybeen termed electron impact ionization or simply electron impact (EI). For EI, theneutral must previously have been transferred into the highly diluted gas phase,which is done by means of any sample inlet system suitable for the evaporation ofthe respective compound. In practice, the gas phase may be regarded highly di-luted when the mean free path for the particles becomes long enough to make bi-molecular interactions almost impossible within the lifetime of the particles con-cerned. This is easily achieved at pressures in the range of 10–4 Pa usually realizedin electron ionization ion sources.
Here, the description of EI is restricted to what is essential for understandingthe ionization process itself [18,19] and the consequences for the fate of the ionscreated. The practical aspects of EI and the interpretation of EI mass spectra arediscussed later (Chaps. 5, 6).
2.2.1.1 Ions Generated by Electron Ionization
When a neutral is hit by an energetic electron carrying several tens of electron-volts (eV) of kinetic energy, some of the energy of the electron is transferred tothe neutral. If the electron, in terms of energy transfer, collides very effectivelywith the neutral, the amount of energy transferred can effect ionization by ejectionof one electron out of the neutral, thus making it a positive radical ion:
M + e– M+• + 2e– (2.1)
EI predominantly creates singly charged ions from the precursor neutral. If theneutral was a molecule as in most cases, it started as having an even number ofelectrons, i.e., it was an even-electron (closed-shell) molecule. The molecular ionformed must then be a radical cation or an odd-electron (open-shell) ion as thesespecies are termed, e.g., for methane we obtain:
CH4 + e– CH4+• + 2e– (2.2)
In the rare case the neutral was a radical, the ion created by electron ionizationwould be even-electron, e.g., for nitric oxide:
NO• + e– NO+ + 2e– (2.3)
Depending on the analyte and on the energy of the primary electrons, doublyand even triply charged ions can also be observed. [20] In general, these are oflow abundance.
M + e– M2+ + 3e– (2.4)
M + e– M3+• + 4e– (2.5)

16 2 Gas Phase Ion Chemistry
While the doubly charged ion, M2+, is an even-electron ion, the triply chargedion, M3+•, again is an odd-electron ion. In addition, there are several other eventspossible from the electron–neutral interaction, e.g., a less effective interaction willbring the neutral into an electronically excited state without ionizing it.
2.2.1.2 Ions Generated by Penning Ionization
Non-ionizing electron–neutral interactions create electronically excited neutrals.The ionization reactions occurring when electronically excited neutrals, e.g., noblegas atoms A*, collide with ground state species, e.g., some molecule M, can bedivided into two classes. [21] The first process is Penning ionization (Eq. 2.6),[22] the second is associative ionization which is also known as the Hornbeck-Molnar process (Eq. 2.7). [23]
A* + M A + M+• + e– (2.6)
A* + M AM+• + e– (2.7)
Penning ionization occurs with the (trace) gas M having an ionization energylower than the energy of the metastable state of the excited (noble gas) atoms A*.The above ionization processes have also been employed to construct mass spec-trometer ion sources. [21,24] However, Penning ionization sources never escapedthe realm of academic research to find widespread analytical application.
2.2.2 Ionization Energy
2.2.2.1 Definition of Ionization Energy
It is obvious that ionization of the neutral can only occur when the energy depos-ited by the electron–neutral collision is equal to or greater than the ionization en-ergy (IE) of the corresponding neutral. Formerly, the ionization energy has beentermed ionization potential (IP).
Definition: The ionization energy (IE) is defined as the minimum amount ofenergy which has to be absorbed by an atom or molecule in its electronic andvibrational ground states form an ion that is also in its ground states by ejectionof an electron.
2.2.2.2 Ionization Energy and Charge-Localization
Removal of an electron from a molecule can formally be considered to occur at a-bond, a -bond or at a lone electron pair with the -bond being the least favor-
able and the lone electron pair being the most favorable position for charge-localization within the molecule. This is directly reflected in the IEs of molecules(Table 2.1). Nobel gases do exist as atoms having closed electron shells and there-

2.2 Ionization 17
fore, they exhibit the highest IEs. They are followed by diatomic molecules withfluorine, nitrogen and hydrogen at the upper limit. The IE of methane is lowerthan that of molecular hydrogen but still higher than that of ethane and so on untilthe IE of long-chain alkanes approaches a lower limit. [25] The more atoms arecontained within a molecule the easier it becomes to find a way for stabilization ofthe charge, e.g., by delocalization or hyperconjugation.
Molecules with -bonds have lower IEs than those without, causing the IE ofethene to be lower than that of ethane. Again the IE is reduced further with in-creasing size of the alkene. Aromatic hydrocarbons can stabilize a single chargeeven better and expanding -systems also help making ionization easier.
The electron charge is never really localized in a single orbital, but assuming sois often a good working hypothesis. In case of the para-tolyl ion, for example, ithas been calculated that only about 36 % of the electron charge rest at the para-carbon atom (Fig. 2.1). [26] In addition, the ionic geometry looses the symmetryof the corresponding neutral molecule.
Fig. 2.1. Formula representation (left), calculated geometries (middle) and calculated dis-tributions of formal charge (right) in the para-tolyl ion, [C7H7]
+. Reproduced from Ref.[26] with permission. © American Chemical Society, 1977.
Free electron pairs are a good source for an electron which is to be ejected andtherefore, the IE of ethanol and dimethylether is lower than that of ethane. It hasbeen shown that the IE of a poly-substituted alkane is almost the same as the IE ofthe structurally identical mono-substituted alkane which has the lowest value. [27]The other substituent, provided it is separated by at least two carbon atoms, exertsa very small effect upon the IE, e.g., the IE of dimethylsulfide, CH3SCH3, 8.7 eV,is almost the same as that of methionine, CH3SCH2CH2CH(NH2)COOH. Intro-duction of an oxygen decreases the IE less than nitrogen, sulfur or even seleniumdo, since these elements have lower electronegativities and thus, are even bettersources of an electron.
The bottom line of IEs is reached when -systems and heteroatoms are com-bined in the same molecule.
Note: Ionization energies of most molecules are in the range of 7–15 eV.

18 2 Gas Phase Ion Chemistry
Table 2.1. Ionization energies of selected compoundsa
Compound IEb [eV] Compound IEb [eV]
hydrogen, H2 15.4 helium, He 24.6methane, CH4 12.6 neon, Ne 21.6ethane, C2H6 11.5 argon, Ar 15.8propane, n-C3H8 10.9 krypton, Kr 14.0butane, n-C4H10 10.5 xenon, Xe 12.1pentane, n-C5H12 10.3hexane, n-C6H14 10.1 nitrogen, N2 15.6decane, n-C10H22 9.7 oxygen, O2 12.1
carbonmonoxide, CO 14.0ethene, C2H4 10.5 carbondioxide, CO2 13.8propene, C3H6 9.7(E)-2-butene, C4H8 9.1 fluorine, F2 15.7
chlorine, Cl2 11.5benzene, C6H6 9.2 bromine, Br2 10.5toluene, C6H8 8.8 iodine, I2 9.3indene, C9H8 8.6naphthalene, C10H8 8.1 ethanol, C2H6O 10.5biphenyl, C12H10 8.2 dimethylether, C2H6O 10.0anthracene, C14H10 7.4 ethanethiol, C2H6S 9.3aniline, C6H7N 7.7 dimethyldisulfide, C2H6S2 8.7triphenylamine, C18H15N 6.8 dimethylamine, C2H7N 8.2a IE data extracted from Ref. [28] with permission. © NIST 2002.b All values have been rounded to one digit.
2.3 Vertical Transitions
Electron ionization occurs extremely fast. The time needed for an electron of70 eV to travel 1 nm distance, i.e., roughly half a dozen bonds, through a moleculeis only about 2 10–16 s and even larger molecules can be traversed on the lowfemtosecond scale. The molecule being hit by the electron can be seen at rest be-cause the thermal velocity of a few 100 m s–1 is negligible compared to the speedof the electron rushing through. Vibrational motions are slower by at least two or-ders of magnitude, e.g., even the fast C–H stretching vibration takes 1.1 10–14 sper cycle as can be calculated from its absorbance around 3000 cm–1 in infraredspectra. According to the Born-Oppenheimer approximation, the electronic mo-tion and the nuclear motion can therefore be separated, i.e., the positions of the at-oms and thus bond lengths do not change while ionization takes place. [29,30] Inaddition, the Franck-Condon principle states that the probability for an electronictransition is highest where the electronic wave functions of both ground state andionized state have their maxima. [31,32] This gives rise to vertical transitions.

2.3 Vertical Transitions 19
Fig. 2.2. Electron ionization can be represented by a vertical line in this diagram. Thus, ionsare formed in a vibrationally excited state if the internuclear distance of the excited state islonger than in the ground state. Ions having internal energies below the dissociation energyD remain stable, whereas fragmentation will occur above. In few cases, ions are unstable,i.e., there is no minimum on their potential energy curve. The lower part schematicallyshows the distribution of Franck-Condon factors, fFC, for various transitions.
The probability of a particular vertical transition from the neutral to a certainvibrational level of the ion is expressed by its Franck-Condon factor. The distri-bution of Franck-Condon factors, fFC, describes the distribution of vibrationalstates for an excited ion. [33] The larger r1 compared to r0, the more probable willbe the generation of ions excited even well above dissociation energy. Photo-electron spectroscopy allows for both the determination of adiabatic ionization en-ergies and of Franck-Condon factors (Chap. 2.10.1).
The counterpart of the vertical ionization is a process where ionization of theneutral in its vibrational ground state would yield the radical ion also in its vibra-tional ground state, i.e., the (0 0) transition. This is termed adiabatic ionizationand should be represented by a diagonal line in the diagram. The difference IEvert –IEad can lead to errors in ionization energies in the order of 0.1–0.7 eV. [7]
Independent of where the electron has formally been taken from, ionizationtends to cause weakening of the bonding within the ion as compared to the precur-sor neutral. Weaker bonding means longer bond lengths on the average and thisgoes with a higher tendency toward dissociation of a bond. In terms of potentialenergy surfaces, the situation can be visualized by focusing on just one bond

20 2 Gas Phase Ion Chemistry
within the molecule or simply by discussing a diatomic molecule. The minimumof the potential energy curve of the neutral, which is assumed to be in its vibra-tional ground state, is located at shorter bond length, r0, than the minimum of theradical ion in its ground state, r1 (Fig. 2.2). Along with ionization of the neutralthere has to be some vibrational excitation because the positions of the atoms arefixed during this short period, i.e., the transition is described by a vertical line inthe diagram crossing the potential energy surface of the ion at some vibrationallyexcited level.
The characteristics of the ionization process as described above give the justifi-cation of the first assumption of QET. Further, it is obvious that electronic excita-tion goes along with vibrational excitation and thus, the second assumption ofQET is also met.
The further fate of the ion depends on the shape of its potential energy surface.If there is a minimum and the level of excitation is below the energy barrier fordissociation, D, the ion can exist for a very long time. Ions having internal energyabove the dissociation energy level will dissociate sooner or later causing frag-ment ions to occur in a mass spectrum. In some unfavorable cases, ions do nothave any minimum on their energy surface at all. These will suffer spontaneousdissociation and consequently, there is no chance to observe a molecular ion.
Note: To understand the situation of the molecule imagine an apple throughwhich a gun bullet is being shot: the impacting bullet passes through the apple,transfers an amount of energy, tears some of the fruit out and has left it by farwhen the perforated apple finally drops or breaks into pieces.
2.4 Ionization Efficiency and Ionization Cross Section
The ionization energy represents the absolute minimum required for ionization ofthe neutral concerned. This means in turn that in order to effect ionization, the im-pacting electrons need to carry at least this amount of energy. If this energy wouldthen be quantitatively transferred during the collision, ionization could take place.Obviously, such an event is of rather low probability and therefore, the ionizationefficiency is close to zero with electrons carrying just the IE of the neutral understudy. However, a slight increase in electron energy brings about a steady increasein ionization efficiency.
Strictly speaking, every molecular species has an ionization efficiency curve ofits own depending on the ionization cross section of the specific molecule. In caseof methane, this issue has been studied repeatedly (Fig. 2.3). [18] The ionizationcross section describes an area through which the electron must travel in order toeffectively interact with the neutral and consequently, the ionization cross sectionis given in units of square-meters. Ionization cross section graphs are all of thesame type exhibiting a maximum at electron energies around 70 eV (Chap. 5.1.3).
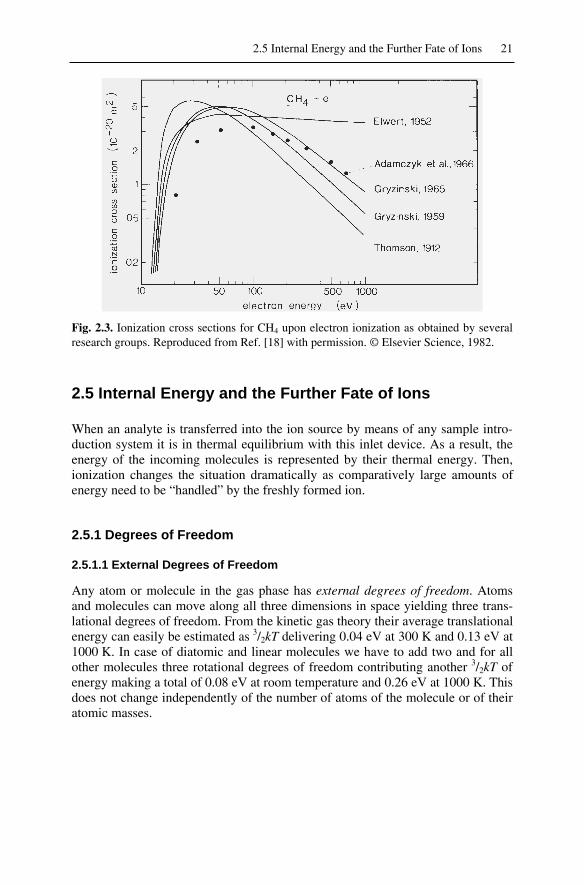
2.5 Internal Energy and the Further Fate of Ions 21
Fig. 2.3. Ionization cross sections for CH4 upon electron ionization as obtained by severalresearch groups. Reproduced from Ref. [18] with permission. © Elsevier Science, 1982.
2.5 Internal Energy and the Further Fate of Ions
When an analyte is transferred into the ion source by means of any sample intro-duction system it is in thermal equilibrium with this inlet device. As a result, theenergy of the incoming molecules is represented by their thermal energy. Then,ionization changes the situation dramatically as comparatively large amounts ofenergy need to be “handled” by the freshly formed ion.
2.5.1 Degrees of Freedom
2.5.1.1 External Degrees of Freedom
Any atom or molecule in the gas phase has external degrees of freedom. Atomsand molecules can move along all three dimensions in space yielding three trans-lational degrees of freedom. From the kinetic gas theory their average translationalenergy can easily be estimated as 3/2kT delivering 0.04 eV at 300 K and 0.13 eV at1000 K. In case of diatomic and linear molecules we have to add two and for allother molecules three rotational degrees of freedom contributing another 3/2kT ofenergy making a total of 0.08 eV at room temperature and 0.26 eV at 1000 K. Thisdoes not change independently of the number of atoms of the molecule or of theiratomic masses.

22 2 Gas Phase Ion Chemistry
2.5.1.2 Internal Degrees of Freedom
Opposed to the external degrees of freedom, the number of internal degrees offreedom, s, increases with the number of atoms within the molecule, N. These in-ternal degrees of freedom represent the number of vibrational modes a moleculecan access. In other words, N atoms can each move along three coordinates inspace yielding 3N degrees of freedom in total, but as explained in the precedingparagraph, three of them have to be subtracted for the motion of the molecule as awhole and an additional two (linear) or three (non-linear) have to be subtracted forrotational motion as a whole. Thus, we obtain for the number of vibrational modes
s = 3N – 5 in case of diatomic or linear molecules (2.8)
s = 3N – 6 in case of non-linear molecules. (2.9)
It is obvious that even relatively small molecules offer a considerable number ofvibrational modes.
Example: The thermal energy distribution curves for 1,2-diphenylethane,C14H14, s = 3 28 – 6 = 78, have been calculated at 75 and 200 °C. [34] Theirmaxima were obtained at about 0.3 and 0.6 eV, respectively, with almost no mole-cules reaching beyond twice that energy of maximum probability. At 200 °C, themost probable energy roughly corresponds to 0.008 eV per vibrational degree offreedom.
This tells us that excited vibrational states are almost fully unoccupied at roomtemperature and only the energetically much lower lying internal rotations are ef-fective under these conditions. Upon electron ionization, the situation changesquite dramatically as can be concluded from the Franck-Condon principle andtherefore, energy storage in highly excited vibrational modes becomes of key im-portance for the further fate of ions in a mass spectrometer. In case of an indenemolecule having 45 vibrational modes, the storage of 10 eV would mean roughly0.2 eV per vibration, i.e., roughly 20fold value of thermal energy, provided theenergy is perfectly randomized among the bonds as postulated by the third as-sumption of QET.
2.5.2 Appearance Energy
When the neutral is hit by an electron, some of the energy transferred is convertedinto external degrees of freedom, i.e., translational motion and rotational motionas a whole. Most of the energy exchanged during this interaction creates electronicexcitation along with ionization if at least the IE has been transferred. In that veryspecial case the freshly generated molecular ion, M+•, would be in its vibrationalground state.
As explained by the Franck-Condon diagram, almost no molecular ions will begenerated in their vibrational ground state. Instead, the majority of the ions createdby EI is vibrationally excited and many of them are well above the dissociationenergy level, the source of this energy being the 70 eV electrons. Dissociation of

2.5 Internal Energy and the Further Fate of Ions 23
M+•, or fragmentation as it is usually referred to in mass spectrometry, leads to theformation of a fragment ion, m1
+, and a neutral, a process generally formulated as
M+• m1+ + n• (2.10)
M+• m1+• + n (2.11)
Reaction 2.10 describes the loss of a radical, whereas reaction 2.11 correspondsto the loss of a molecule, thereby conserving the radical cation property of themolecular ion in the fragment ion. Bond breaking is a endothermal process andthus the potential energy of the fragment ion is usually located at a higher energylevel (Fig. 2.4).
Definition: The amount of energy needed to be transferred to the neutral M toallow for the detection of the fragment ion m1
+ is called appearance energy(AE) of that fragment ion. The old term appearance potential (AP) is stillfound in the literature.
In fact, the ions are not generated with one specific internal energy applying forall ions, but with a broad energy distribution P(E). One should not forget however,that such a distribution is only valid for a large number of ions as each individualone bears a defined internal energy, ranging from just above IE to well beyond10 eV for certain ones. Fragmentation of those highly excited ions from the tail ofthe P(E) curve yields fragment ions having still enough energy for a second disso-ciation step, m1
+ m2+ + n' or even a third one. Each of the subsequent steps can
in principle also be characterized by an appearance energy value.
Fig. 2.4. Definition of appearance energy and visualization of changes in internal energydistributions, P(E), of relevant species upon electron ionization and subsequent fragmenta-tion. The energy scale is shown compressed for the ions.

24 2 Gas Phase Ion Chemistry
2.5.3 Bond Dissociation Energies and Heats of Formation
Great efforts have been made to generate accurate and reliable ion thermochemis-try data (Chap. 1.2.8). Once such data is available, it can be employed to elucidatefragmentation mechanisms and in addition, it is useful for obtaining some back-ground on the energetic dimensions in mass spectrometry.
Heats of formation of neutral molecules, Hf(RH), can be obtained from com-bustion data with high accuracy. Bond dissociation energies can either be derivedfor homolytic bond dissociation
R–H R• + H•, HDhom (2.12)
or heterolytic bond dissociation
R–H R+ + H–, HDhet (2.13)
The homolytic bond dissociation enthalpies give the energy needed to cleave abond of the neutral molecule which is in the gas phase in its vibrational and elec-tronic ground states, to obtain a pair of radicals which also are not in excitedmodes. Homolytic bond dissociation enthalpies are found in the range of 3–5 eV(Table 2.2). The heterolytic bond dissociation energies apply for creation of a ca-tion and an anion in their ground states from the neutral precursor which meansthat these values include the amount of energy needed for charge separation. Theyare in the order of 10–13 eV (Table 2.3). Due to the significantly altered bondingsituation, breaking of a bond is clearly less demanding in molecular ions than inneutrals.
Table 2.2. Homolytic bond dissociation enthalpies, HDhom, and heats of formation, Hf(X•),of some selected bonds and radicals [kJ mol–1] a
X• H• CH3• Cl• OH• NH2
•
Hf(X•) 218.0 143.9 121.3 37.7 197.5
R• Hf(R•)
H• 218.0 436.0 435.1 431.4 497.9 460.2
CH3• 143.9 435.1 373.2 349.8 381.2 362.8
C2H5• 107.5 410.0 354.8 338.1 380.3 352.7
i-C3H7• 74.5 397.5 352.3 336.4 384.5 355.6
t-C4H9• 31.4 384.9 342.3 335.6 381.6 349.8
C6H5• 325.1 460.1 417.1 395.4 459.0 435.6
C6H5CH2• 187.9 355.6 300.4 290.4 325.9 300.8
C6H5CO• 109.2 363.5 338.1 336.8 440.2 396.6a Values from Ref. [35]

2.5 Internal Energy and the Further Fate of Ions 25
Table 2.3. Heterolytic bond dissociation enthalpies, HDhet, and heats of formation of somemolecules and ions [kJ mol–1] a
Ion HDhet Hf(R+) Hf(RH)
proton, H+ 1674 1528 0.0
methyl, CH3+ 1309 1093 –74.9
ethyl, C2H5+ 1129 903 –84.5
n-propyl, CH3CH2CH2+ 1117 866 –103.8
i-propyl, CH3CH+CH3 1050 802 –103.8
n-butyl, CH3CH2CH2CH2+ 1109 837 –127.2
sec-butyl, CH3CH2CH+CH3 1038 766 –127.2
i-butyl, (CH3)2CHCH2+ 1109 828 –135.6
t-butyl, (CH3)3C+ 975 699 –135.6
phenyl, C6H5+ 1201 1138 82.8
a Values from Refs. [8,36-38]
Example: The minimum energy to form a CH3+ ion and a hydrogen radical
from the methane molecular ion can be estimated from the heat of reaction, Hr, ofthis process. According to Fig. 2.4, Hr = AE(CH3+) – IE(CH4). In order to calculatethe missing AE(CH3+) we use the tabulated values of Hf(H•) = 218.0 kJ mol–1,
Hf(CH3+) = 1093 kJ mol–1, Hf(CH4) = –74.9 kJ mol–1, and IE(CH4) = 12.6 eV 1216 kJ mol–1. First, the heat of formation of the methane molecular ion is deter-mined:
Hf(CH4+•) = Hf(CH4) + IE(CH4)
Hf(CH4+•) = –74.9 kJ mol–1 + 1216 kJ mol–1 = 1141.1 kJ mol–1(2.14)
Then, the heat of formation of the products is calculated from
Hf(prod) = Hf(CH3+) + Hf(H•)
Hf(prod) = 1093 kJ mol–1 + 218 kJ mol–1 = 1311 kJ mol–1
(2.15)
Now, the heat of reaction is obtained from the difference
Hr = Hf(prod) – Hf(CH4+•)
Hr = 1311 kJ mol–1 – 1141.1 kJ mol–1 = 169.9 kJ mol–1
(2.16)
The value of 169.9 kJ mol–1 (1.75 eV) corresponds to AE(CH3+) = 14.35 eVwhich is in good agreement with published values of about 14.3 eV. [28,39] Inaddition, this is only 40 % of the homolytic C–H bond dissociation enthalpy of theneutral methane molecule, thereby indicating the weaker bonding in the molecularion.
The heat of formation of organic radicals and positive ions decreases with theirsize and even more important with their degree of branching at the radical or ionicsite. A lower heat of formation is equivalent to a higher thermodynamic stability
26 2 Gas Phase Ion Chemistry
of the respective ion or radical. The corresponding trends are clearly expressed bythe values given in Tables 2.2 and 2.3. This causes the fragmentation pathways ofmolecular ions proceeding by formation of secondary or tertiary radicals and/orions to become dominant over those leading to smaller and/or primary radical andionic fragments, respectively (Chap. 6.2.2).
Example: The effects of isomerization upon thermal stability of butyl ions,C4H9
+, are impressing. This carbenium ion can exist in four isomers with heats offormation that range from 837 kJ mol–1 in case of n-butyl over 828 kJ mol–1 foriso-butyl (also primary) to 766 kJ mol–1 for sec-butyl to 699 kJ mol–1 in case of t-butyl, meaning an overall increase in thermodynamic stability of 138 kJ mol–1
(Chap. 6.6.2) [36].
2.5.4 Randomization of Energy
The question remains as to how to validate the third and fourth assumptions ofQET. The best evidence for randomization of internal energy over all vibrationalmodes of a molecular ion before any fragmentation occurs, is delivered by EImass spectra themselves. If there was no randomization, fragmentation would oc-cur directly at any bond that immediately suffers from the withdrawal of an elec-tron. As a result, mass spectra would show an almost statistical bond breakingthroughout the molecular ion. Instead, mass spectra reveal a great deal of selectiv-ity of the molecular ion when choosing fragmentation pathways. This means themolecular ion explores many pathways up to their respective transition states andprefers the thermodynamically (and as we will see, also kinetically) more favor-able ones. The same is true for fragment ions.
From the purely thermodynamic point of view the situation can be elucidatedby considering a hypothetical molecular ion having some internal energy and be-ing faced to the selection of a fragmentation pathway (Fig. 2.5).
a) The molecular ion ABC+• has an internal energy Einta being slightly abovethe activation energy, E02, required to cross the transition state TS2 leading to theformation of A• and BC+
, but definitely more than needed to dissociate into AB+
and C•. The difference between the energy content Einta and E01 is termed excessenergy, Eex = Eint – E0, of the transition state TS1. In this case either ionic productwould be observed, but the third pathway could not be accessed.
b) The molecular ion ABC+• has an internal energy Eintb being clearly higherthan any of the three activation energies. Here, formation of all possible productsshould occur.
A simple comparison of activation energies does not allow however, to predictthe relative intensities of the ions AB+ and BC+ or of AB+, BC+ and A+, respec-tively. In fact, from this model one would expect similar or even equal abundancesof all fragment ions accessible. Actual mass spectra show greatly differing inten-sities of signals resulting from competing decomposition pathways. This is an im-portant issue revealing some oversimplification of the preceding passage.

2.6 Rate Constants from QET 27
Note: Thermodynamic data such as heats of formation and activation energiesalone are not sufficient to adequately describe the unimolecular fragmentationsof excited ions.
Fig. 2.5. Competition of fragmentation pathways strongly depends on the internal energy ofthe fragmenting ion and on the activation energies, E0, of the transition states, i.e., the “en-ergy barriers” of the respective reactions.
2.6 Rate Constants from QET
QET brings the dynamic aspects of ion fragmentation into focus. It describes therate constants for the dissociation of isolated ions as a function of internal energy,Eint, and activation energy of the reaction, E0. By doing so, it compensates for theshortcomings of the merely thermodynamic treatment above.
QET delivers the following expression for the unimolecular rate constant
tE
EEEEE
E dEh
k t
)(
),,(
0)(
0int0 *1 (2.17)
In this equation, (E) is the density of energy levels for the system with total en-ergy Eint, and (E,E0,Et) is the density of energy levels in the activated complex, i.e.,transition state, with activation energy E0 and translational energy Et in the reac-tion co-ordinate. The reaction co-ordinate represents the bond which is actuallybeing broken. The expression is slightly simplified by approximating the systemby as many harmonic oscillators as there are vibrational degrees of freedom

28 2 Gas Phase Ion Chemistry
1
1
11
int
0int)(
*s
ii
s
jjs
E EEE
k
(2.18)
Then, the exponent is given by the number of degrees of freedom, s, minus 1for the breaking bond. For a strict treatment of fragmenting ions by QET onewould need to know the activation energies of all reactions accessible and theprobability functions describing the density of energy levels.
In the most simplified form, the rate constant, k(E), can be expressed as
1
int
0int)(
s
E EEE
k(2.19)
where is a frequency factor which is determined by the number and density ofvibrational states. The frequency factor thereby replaces the complex expressionof probability functions. Now, it becomes clear that a reaction rate considerablyincreases with growing Eex.
1
int)(
sex
E EE
k(2.20)
Unfortunately, as with all oversimplified theories, there are limitations for theapplication of the latter equation to ions close to the dissociation threshold. Inthese cases, the number of degrees of freedom has to be replaced by an effectivenumber of oscillators which is obtained by use of an arbitrary correction factor. [7]However, as long as we are dealing with ions having internal energies considera-bly above the dissociation threshold, i.e., where (E – E0)/E 1, the relationship isvalid and can even be simplified to give the quasi-exponential expression
EEs
E ek0)1(
)((2.21)
Example: For = 1015 s–1, s = 15, Eint = 2 eV and E0 = 1.9 eV the rate constantis calculated as 3.0 10–5 s–1. For the same parameters but Eint = 4 eV we obtaink = 6.3 1010 s–1 being a 2.1 1015-fold increase. This means that a reaction isextremely slow at small excess energies but becomes very fast as soon there issome substantial excess energy available.
2.6.1 Meaning of the Rate Constant
The rate constants of unimolecular reactions have the dimension per second (s–1).This means the process can happen that often per second, e.g., k = 6.3 1010 s–1
being equivalent to 1.6 10–11 s per fragmentation on the average. It is important

2.6 Rate Constants from QET 29
to notice an emphasis on “average”, because rate constants are macroscopic andstatistical in nature as they get their meaning only from looking at a very largenumber of reacting particles. A single ion will have a lifetime of 1.6 10–11 s onthe average in this case; however, a specific one in consideration at might also de-cay much sooner or later, with the actual decay occurring at the speed of vibra-tional motions. The dimension s–1 also means there is no dependence on concen-tration as it is the case with second- or higher order reactions. This is because theions are isolated in the gas phase, alone for their entire lifetime, and the onlychance for change is by means of unimolecular reaction.
2.6.2 Typical k(E) Functions
Although the general shape of any k(E) function resembles the ionization efficiencycurve to the left of the maximum, these must not be confused. At an excess energyclose to zero, the rate constant is also close to zero but it rises sharply upon slightincrease of the excess energy. However, there is an upper limit for the rate of adissociation that is defined by the vibrational frequency of the bond to be cleaved.The fragments are not able to fly apart at a higher velocity than determined bytheir vibrational motion (Fig. 2.6).
Fig. 2.6. General shape of a log k vs. E plot as determined by the simplified QET. At E = E0
the reaction is extremely slow. A a slight increase in energy causes k to rise sharply.
2.6.3 Description of Reacting Ions Using k(E) Functions
Bearing the knowledge on rate constants in mind, Fig. 2.5 has to be interpreted ina different way. At an internal energy Einta the molecular ion ABC+• can easilycross the transition state TS1 to form AB+ and C•. The products of the second re-action can in principle be formed, even though the excess energy at TS2 is so smallthat the product ion BC+ will almost be negligible. The third pathway is still notaccessible. At an internal energy Eintb the excess energy is assuredly high enoughto allow for any of the three pathways with realistic rates to observe the products.

30 2 Gas Phase Ion Chemistry
Nevertheless, due to the strong dependence of the rate constant on Eex, the reactionover TS3 will be by far the least important.
2.6.4 Direct Cleavages and Rearrangement Fragmentations
The reactions of excited ions are not always as straightforward as expected. Ofcourse, the existence of multiple fragmentation pathways for an ion consisting ofseveral tens of atoms brings about different types of reactions all of which cer-tainly will not lead to the same k(E) function. [40]
The k(E) functions of two reactions of the same type, appear to be “parallel” incomparison, starting out at different activation energies (Fig. 2.7a), whereas dif-ferent types of reactions will show a crossover of their k(E) functions at intermedi-ate excess energy (Fig. 2.7b).
For example, case (a) is obtained when two homolytic bond cleavages are incompetition. Homolytic bond cleavages are simple fragmentations of molecularions creating an even-electron ion and a radical. One cleavage might require asomewhat higher activation energy than the other (E02 > E01) because of the differ-ent bonds that are to be cleaved, but once having enough excess energy their rateswill rise sharply. The more energy is pushed into the ion, the faster the bond rup-ture can occur. A further increase of excess energy only becomes ineffective whenthe rate approaches the upper limit as defined by the vibrational frequency of thebond to be cleaved.
Case (b) compares a rearrangement fragmentation (reaction 1) with a homo-lytic bond cleavage (reaction 2). During a rearrangement fragmentation the pre-cursor ion expels a neutral fragment which is an intact molecule after having rear-ranged in an energetically favorable manner. Rearrangements have their onset atlow excess energy, but then the rate approaches the limit relatively soon, whereasthe cleavage starts out later, then overrunning the other at higher excess energy.The differences can be explained by the different transition states belonging toboth types of reactions. The cleavage has a loose transition state, [34] i.e., there isno need for certain parts of the molecule to gain a specific position while thecleavage proceeds. The dissociation merely requires enough energy in the respec-tive bond that the binding forces can be overcome. Once the bond is stretched toofar, the fragments drift apart. The rearrangement demands less excess energy toproceed, because the energy for a bond rupture on one side is compensated for bythe energy received when a new bond is formed on the accepting position. Com-pared to the simple cleavage, such a transition state is usually termed tight transi-tion state (cf. Chap. 6.12.2). Then, the neutral is expelled in a second step. Such areaction obviously depends on having the suitable conformation for rearrangementat the same time when sufficient energy is put into the bond to be cleaved. Fur-thermore, the second step has to follow in order to yield the products. In the endthis means that there is no use in having more than enough energy until the ionreaches the conformation needed. Thus, after considering either basic type offragmentation, the fifth assumption of QET is justified, because there is no reasonwhy rearrangements should not be treated by means of QET.

2.6 Rate Constants from QET 31
Fig. 2.7. Comparison of different types of reactions by their k(E) functions. Reactions of thesame type show k(E) functions that are “parallel” (a), whereas k(E) functions of differenttypes tend to cross over at intermediate excess energy (b). In a reaction 1 would proceed102.8 (630) times faster at an internal energy E' than would reaction 2. In b both reactionshave the same rate constant, k = 105.4 s-1, at an internal energy E', whereas reaction 2 be-comes 101.9 (80) times faster at E''.
2.6.5 Practical Consequences of Internal Energy
Even comparatively small molecular ions can exhibit a substantial collection offirst, second, and higher generation fragmentation pathways due their internal en-ergy. [40] The fragmentation pathways of the same generation are competing witheach other, their products being potential precursors for the next generation offragmentation processes (Figs. 2.4 and 2.8).
The hypothetical molecular ion ABYZ+•, for example, might show three possi-ble first generation fragmentation pathways, two of them proceeding by rear-rangement, one by simple cleavage of a bond. There are three first generationfragment ions which again have several choices each. The second generationfragment ions Y+• and YZ+ are even formed on two different pathways each, awidespread phenomenon. In an EI mass spectrum of ABYZ, all ionic speciesshown would be detected (Chap. 5.1.4).
Fragmentation trees similar to that shown here can be constructed from any EImass spectrum, providing ten thousands of examples for the sixth assumption ofQET that fragment ions may again be subject to dissociation, provided their inter-nal energy suffices.
Note: The assumptions of QET have turned into basic statements governing thebehavior of isolated ions in the gas phase and thus, in mass spectrometry ingeneral.

32 2 Gas Phase Ion Chemistry
ABYZ+.
- Z- B
- A
- Z- BZ- B
- A- AZ
- Y
- A
- AB ..
.
ABY+. AYZ+. BYZ+
AB+. BY+ Y+. YZ+ Y+ BY+
Fig. 2.8. Possible fragmentation pathways for hypothetical molecular ions ABYZ+• havinginternal energies typical for EI.
2.7 Time Scale of Events
A mass analyzer normally brings only those ions to detection that have been prop-erly formed and accelerated by the ion source beforehand (Chap. 4). Therefore, areaction needs to proceed within a certain period of time – the dwelltime of ionswithin the ion source – to make the products detectable in the mass spectrum, andfor this purpose there is a need for some excess energy in the transition state.
The dwelltime of ions within the ion source is defined by the extraction volt-ages applied to accelerate and focus them into an ion beam and by the dimensionsof that ion source. In standard EI ion sources the freshly formed ions dwell about1 µs before they are forced to leave the ionization volume by action of the acceler-ating potential. [41] As the ions then travel at speeds of some 104 m s–1 they passthe mass analyzer in the order of 10–50 µs (Fig. 2.9). [9] Even though this illus-tration has been adapted for a double focusing magnetic sector mass spectrometer,an ion of m/z 100, and an acceleration voltage of 8 kV, the effective time scalesfor other types of instruments (quadrupole, time-of-flight) are very similar undertheir typical conditions of operation (Table 2.4).
Table 2.4. Typical ion flight times in different types of mass spectrometers
Mass Analyzer Flight Path[m]
AccelerationVoltage [V]
Typical m/z Flight Time [µs]
quadrupole 0.2 10 500 57
magnetic sector 2.0 5000 500 45
time-of-flight 2.0 20,000 2000 45

2.7 Time Scale of Events 33
Fig. 2.9. The mass spectrometric time scale. It is important to note the logarithmic timescale for the ion source spanning over nine orders of magnitude. Reproduced from Ref. [9]with permission. © John Wiley & Sons Ltd., 1985.
2.7.1 Stable, Metastable, and Unstable Ions
The terminology for ions has been coined as a direct consequence of the massspectrometric time scale. Non-decomposing molecular ions and molecular ionsdecomposing at rates below about 105 s–1 will reach the detector without frag-mentation and are therefore termed stable ions. Consequently, ions dissociating atrates above 106 s–1 cannot reach the detector. Instead, their fragments will be de-tected and thus they are called unstable ions. A small percentage, however, de-composing at rates of 105–106 s–1 will just fragment on transit through the massanalyzer; those are termed metastable ions (Fig. 2.10) [4,5,9].
Definition: stable ions, k < 105 s–1
metastable ions, 105 s–1 < k < 106 s–1
unstable ions, k > 106 s–1
There is no justification for such a classification of ion stabilities outside themass spectrometer because almost all ions created under the conditions inside amass spectrometer would spontaneously react in the atmosphere or in solvents.Nevertheless, this classification is useful as far as ions isolated in the gas phase areconcerned and is valid independently of the type of mass analyzer or ionizationmethod employed.
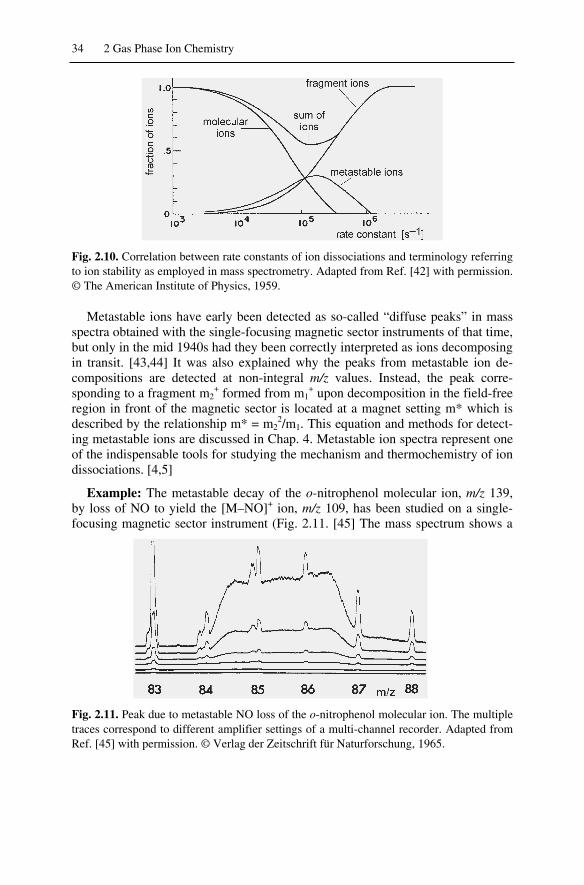
34 2 Gas Phase Ion Chemistry
Fig. 2.10. Correlation between rate constants of ion dissociations and terminology referringto ion stability as employed in mass spectrometry. Adapted from Ref. [42] with permission.© The American Institute of Physics, 1959.
Metastable ions have early been detected as so-called “diffuse peaks” in massspectra obtained with the single-focusing magnetic sector instruments of that time,but only in the mid 1940s had they been correctly interpreted as ions decomposingin transit. [43,44] It was also explained why the peaks from metastable ion de-compositions are detected at non-integral m/z values. Instead, the peak corre-sponding to a fragment m2
+ formed from m1+ upon decomposition in the field-free
region in front of the magnetic sector is located at a magnet setting m* which isdescribed by the relationship m* = m2
2/m1. This equation and methods for detect-ing metastable ions are discussed in Chap. 4. Metastable ion spectra represent oneof the indispensable tools for studying the mechanism and thermochemistry of iondissociations. [4,5]
Example: The metastable decay of the o-nitrophenol molecular ion, m/z 139,by loss of NO to yield the [M–NO]+ ion, m/z 109, has been studied on a single-focusing magnetic sector instrument (Fig. 2.11. [45] The mass spectrum shows a
Fig. 2.11. Peak due to metastable NO loss of the o-nitrophenol molecular ion. The multipletraces correspond to different amplifier settings of a multi-channel recorder. Adapted fromRef. [45] with permission. © Verlag der Zeitschrift für Naturforschung, 1965.

2.7 Time Scale of Events 35
flat-topped peak of low intensity expanding over three mass units).Some minorand narrow “regular” peaks corresponding to fragment ions formed within the ionsource are observed beside and on top of it. The peak due to the metastable disso-ciation is centered at m/z 85.5 which can be explained by the simple calculationm* = m2
2/m1 = 1092/139 = 85.5.
2.7.2 Kinetic Shift
Fragment ion abundances as observed by means of any mass spectrometerstrongly depend on ion lifetimes within the ion source and on ion internal energydistributions, i.e., kinetic aspects play an important role for the appearance of amass spectrum. As explained by QET the rate constant of an ion dissociation is afunction of excess energy in the transition state of the respective reaction, andthere is a need of substantial excess energy to make the rate constant exceed thecritical 106 s–1 needed to dissociate during the residence times within the ionsource. Therefore, appearance and activation energies are overestimated frommeasurements by this amount of excess energy. This phenomenon is known as ki-netic shift (Fig. 2.12). [34,42] Often, kinetic shifts are almost negligible (0.01–0.1 eV), but they can be as large as 2 eV, [34] e.g. an activation energy of 2.07 eVfor the process C3H6
+• C3H5+ + H• is accompanied by a kinetic shift of 0.19 eV.
[46] As k(E) functions greatly differ between reactions and especially between ho-mogeneous bond cleavages and rearrangement fragmentations, it is not an easytask to correct the experimental AEs by subtraction of Eex. The influence of thekinetic shift can be minimized by increasing the ion source residence time and/orby increasing the detection sensitivity of the instrument.
Fig. 2.12. Kinetic shift. The excess energy in the transition state affects AE measurementsin the way that it always causes experimental values to be too high.
Note: The kinetic shift denotes the overestimation of AEs due to the contribu-tion of excess energy in the transition state necessary to yield rate constantslarger than 106 s–1. The determination of IEs does not suffer from kinetic shiftas there are no kinetics involved in electron or photon ionization.

36 2 Gas Phase Ion Chemistry
2.8 Activation Energy of the Reverse Reaction and KineticEnergy Release
2.8.1 Activation Energy of the Reverse Reaction
By merely considering thermodynamic and kinetic models we may be able to un-derstand how ions are formed and what parameters are effective to determine theirfurther fate in the mass spectrometer. However, the potential energy surfaces con-sidered did only reach up to the transition state (Fig. 2.5) Without explicitly men-tioning it, we assumed the curves to stay on the same energetic level between tran-sition state and the products of ion dissociation, i.e., the sum of heats of formationof the products would be equal to the energy of the transition state. This assump-tion is almost correct for homolytic bond cleavages in molecular ions because therecombination of an ion with a radical proceeds with almost negligible activationenergy. [4,5] In other words, the activation energy of the reverse reaction, E0r (oroften simply called reverse activation energy) is then close to zero. This explainswhy the result of our simple estimation of the activation energy for hydrogen radi-cal loss from the molecular ion of methane could be realistic (Chap. 2.5.3).
In case of rearrangement fragmentations the situation is quite different, becauseone of the products is an intact neutral molecule of comparatively high thermody-namic stability, i.e., having negative or at least low values of Hf (Table 2.5).Once the transition state is crossed, the reaction proceeds by formation of productsenergetically much lower than the transition state. In case of the reverse reaction,this would require some or even substantial activation energy transfer to the frag-ments to allow their recombination, and thus E0r > 0 (Fig. 2.13).
Fig. 2.13. Definition of E0r and origin of KER. The excess energy of the decomposing ionin the transition state relative to the sum of the heats of formation of the ionic and neutralproduct is partitioned into vibrational excitation of the products plus KER.

2.8 Activation Energy of the Reverse Reaction and Kinetic Energy Release 37
Table 2.5. Gas phase heats of formation, Hf, of some frequently eliminated moleculesa
Molecule Hf [kJ mol-1]b Molecule Hf [kJ mol-1]b
CO2 –393.5 H2CO –115.9HF –272.5 HCl –92.3H2O –241.8 NH3 –45.9CH3OH –201.1 C2H4 52.5CO –110.5 HCN 135.1a IE data extracted from Ref. [28] with permission. © NIST 2002.b All values have been rounded to one digit.
2.8.2 Kinetic Energy Release
2.8.2.1 Source of Kinetic Energy Release
The total excess energy, Eextot, of the precursor ion relative to the heats of forma-tion of the products in their ground state, comprises the excess energy in the tran-sition state, Eex, plus the activation energy of the reverse reaction, E0r:
Eextot = Eex + E0r (2.22)
Although most ion fragmentations are endothermic, there is still a significantamount of energy to be redistributed among the reaction products. Much of Eextot
is redistributed as vibrational energy, Evib, among the internal modes, thereby sup-plying the energy for consecutive fragmentation of the fragment ion. Nonetheless,some of the energy is converted into translational motion of the fragments relativeto their center of gravity. This portion of Eextot is released in the direction of thebond that is being cleaved, i.e., into diversion from each other. This is termed ki-netic energy release, KER (Fig. 2.13). [4,5,9,47,48]
The larger the sum of Eex + E0r the larger is the expected KER. Large reverseactivation energy, especially when combined with repulsive electronic states in thetransition state, will cause significant KER that can reach up to 1.64 eV [49-52],and significant KERs also have been observed in case of an exothermic fragmen-tation. [53] On the other hand, homolytic cleavages and ion–neutral complex-mediated reactions tend to proceed with very small KER in the range of 1–50 meV(Fig. 2.14).
Note: The importance of KER measurements results from the fact that the po-tential energy surface between transition state and products of a reaction can bereconstructed. [47] Thus, KER and AE data are complementary in determiningthe energy of the transition state.
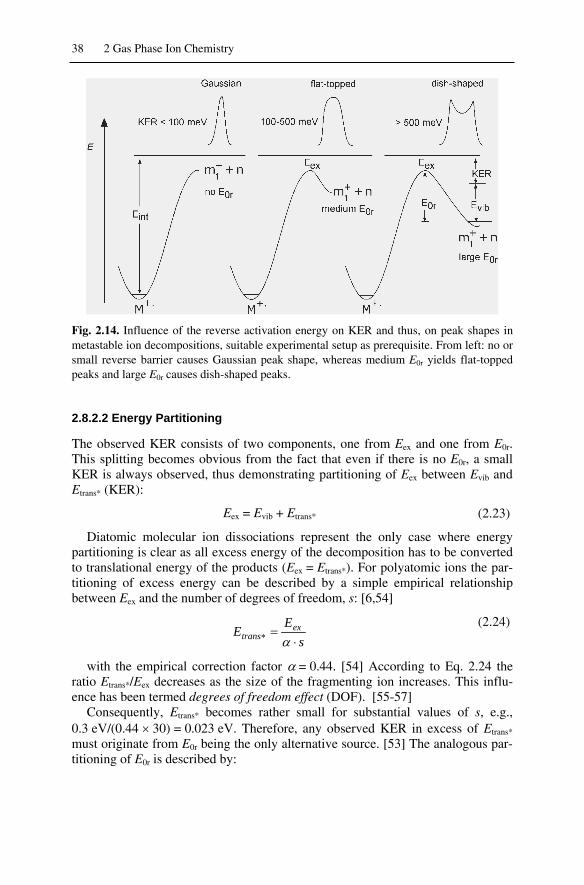
38 2 Gas Phase Ion Chemistry
Fig. 2.14. Influence of the reverse activation energy on KER and thus, on peak shapes inmetastable ion decompositions, suitable experimental setup as prerequisite. From left: no orsmall reverse barrier causes Gaussian peak shape, whereas medium E0r yields flat-toppedpeaks and large E0r causes dish-shaped peaks.
2.8.2.2 Energy Partitioning
The observed KER consists of two components, one from Eex and one from E0r.This splitting becomes obvious from the fact that even if there is no E0r, a smallKER is always observed, thus demonstrating partitioning of Eex between Evib andEtrans* (KER):
Eex = Evib + Etrans* (2.23)
Diatomic molecular ion dissociations represent the only case where energypartitioning is clear as all excess energy of the decomposition has to be convertedto translational energy of the products (Eex = Etrans*). For polyatomic ions the par-titioning of excess energy can be described by a simple empirical relationshipbetween Eex and the number of degrees of freedom, s: [6,54]
sE
E extrans
(2.24)
with the empirical correction factor = 0.44. [54] According to Eq. 2.24 theratio Etrans*/Eex decreases as the size of the fragmenting ion increases. This influ-ence has been termed degrees of freedom effect (DOF). [55-57]
Consequently, Etrans* becomes rather small for substantial values of s, e.g.,0.3 eV/(0.44 30) = 0.023 eV. Therefore, any observed KER in excess of Etrans*
must originate from E0r being the only alternative source. [53] The analogous par-titioning of E0r is described by:
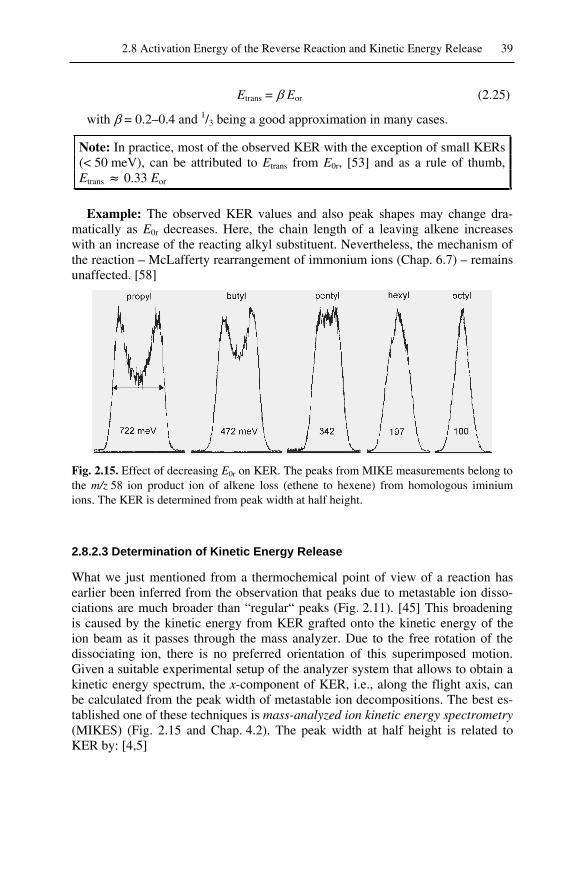
2.8 Activation Energy of the Reverse Reaction and Kinetic Energy Release 39
Etrans = Eor (2.25)
with = 0.2–0.4 and 1/3 being a good approximation in many cases.
Note: In practice, most of the observed KER with the exception of small KERs(< 50 meV), can be attributed to Etrans from E0r, [53] and as a rule of thumb,Etrans 0.33 Eor
Example: The observed KER values and also peak shapes may change dra-matically as E0r decreases. Here, the chain length of a leaving alkene increaseswith an increase of the reacting alkyl substituent. Nevertheless, the mechanism ofthe reaction – McLafferty rearrangement of immonium ions (Chap. 6.7) – remainsunaffected. [58]
Fig. 2.15. Effect of decreasing E0r on KER. The peaks from MIKE measurements belong tothe m/z 58 ion product ion of alkene loss (ethene to hexene) from homologous iminiumions. The KER is determined from peak width at half height.
2.8.2.3 Determination of Kinetic Energy Release
What we just mentioned from a thermochemical point of view of a reaction hasearlier been inferred from the observation that peaks due to metastable ion disso-ciations are much broader than “regular“ peaks (Fig. 2.11). [45] This broadeningis caused by the kinetic energy from KER grafted onto the kinetic energy of theion beam as it passes through the mass analyzer. Due to the free rotation of thedissociating ion, there is no preferred orientation of this superimposed motion.Given a suitable experimental setup of the analyzer system that allows to obtain akinetic energy spectrum, the x-component of KER, i.e., along the flight axis, canbe calculated from the peak width of metastable ion decompositions. The best es-tablished one of these techniques is mass-analyzed ion kinetic energy spectrometry(MIKES) (Fig. 2.15 and Chap. 4.2). The peak width at half height is related toKER by: [4,5]
40 2 Gas Phase Ion Chemistry
22
16 EE
neUm
T b(2.26)
where T is the average kinetic energy released, m2 is mass of the fragment ion,n the mass of the neutral, Ub the acceleration voltage, e the electron charge, Egives the position and E the width of the peak on the kinetic energy scale. Cor-rection of the width of the metastable peak, w50meta, for the width of the mainbeam, w50main, should be applied for smaller values of T: [59,60]
250
25050 mainmetacorr www (2.27)
Note: Before performing KER measurements, a “calibration” of the instru-ment(al parameters) against a well-established standard is recommended. Al-lylmethylether molecular ions, for example, decompose to yield three peaks ofdifferent shape and position in the spectrum. [61-63]
2.9 Isotope Effects
Most elements are composed of more than one naturally occurring isotope, i.e.,having nuclei of the same atomic number but different mass numbers due to dif-ferent numbers of neutrons. [64] The mass number of an isotope is given as a su-perscript preceding the element symbol, e.g., 1H and 2H (D) or 12C and 13C(Chap. 3).
Obviously, mass spectrometry is ideally suited for distinguishing between iso-topic species, and isotopic labeling is used for mechanistic as well as analyticalapplications (Chap. 3.2.9). However, the effect of isotopic substitution is not onlyan effect on ionic mass, but “isotopic substitution can have several simultaneouseffects, and this complication sometimes produces results which are at first sightcurious.” [65]
Any effect exerted by the introduction of isotopes are termed isotope effects.Isotope effects can be intermolecular, e.g., upon D• loss from CD4
+• versus H• lossfrom CH4
+•, or intramolecular, e.g., upon H• loss versus D• loss from CH2D2+•.
2.9.1 Kinetic Isotope Effects
Kinetic isotope effects represent one particular type of an isotope effect. They arebest rationalized when considering the potential energy diagram of both H• and D•
loss from equivalent positions in the same isotopically labeled, e.g., deuterated,molecular ion (Fig. 2.16). [4,5,66] The diagram is basically symmetrical, the onlydifferences arising from the zero-point energy (ZPE) terms. Since H• and D• arebeing lost from the same molecular ion, the single ZPE to start from is defined by

2.9 Isotope Effects 41
this species. The transition states on the way to H• and D• loss possess ZPE termsassociated with all the degrees of freedom of the dissociating ion except that in-volved in the reaction under consideration. The transition state corresponding toH• loss must therefore have a lower ZPE because it contains a C—D bond that isnot involved in the actual cleavage. This corresponds to a lower ZPE than is pro-vided by the C—H bond-retaining transition state that leads to D• loss. Therefore,an ion with an internal energy Eint has a larger excess energy EexH when it is goingto eliminate H• than if it would cleave off a D•. The activation energy for H• loss isthereby lowered making it proceed faster than D• loss (kH/kD > 1).
The reason for the lower ZPE of the deuterium-retaining species is found in itslower vibrational frequencies due to the double mass of D as compared to H atalmost identical binding forces. From classical mechanics the vibrational fre-quency D should therefore be lower by the inverse ratio of the square roots oftheir masses, i.e., D / H 1/1.41 0.71. [67]
Example: Isotopic labeling does not only reveal the original position of a rear-ranging atom, but can also reveal the rate-determining step of multi-step reactionsby its marked influence on reaction rates. Thus, the examination of H/D and12C/13C isotope effects led to the conclusion that the McLafferty rearrangement ofaliphatic ketones (Chap. 6.7) rather proceeds stepwise than concerted. [68]
Notes: i) The isotope effects dealt with in mass spectrometry are usually in-tramolecular kinetic isotope effects, i.e., two competing fragmentations onlydiffering in the isotopic composition of the products exhibit different rate con-stants kH and kD. [69] ii) The kinetic isotope effect is called normal if kH/kD > 1and inverse if kH/kD < 1. iii) Isotope effects can also be observed on KER,[52,70] e.g. the KER accompanying H2 loss from methylene immonium ionvaries between 0.61 and 0.80 eV upon D labeling at various positions. [52]
Fig. 2.16. Origin of kinetic isotope effects. [4,5,66] The change in vibrational frequencies,and thus in density of states causes somewhat higher activation energy and consequentlysmaller excess energy for the reaction of the deuterated bond, and thus reduces kD.

42 2 Gas Phase Ion Chemistry
2.9.1.1 Primary Kinetic Isotope Effects
Primary kinetic isotope effects are observed if the isotopic bond itself is beingbroken or formed during the reaction. It seems clear that there is no single well-defined value of the kinetic isotope effect of a reaction (Fig. 2.16) and it stronglydepends on the internal energy of the decomposing ions. In the rare case where Eint
is just above the activation energy for H• loss but still below that for D• loss, theisotope effect would be infinite. As ions in a mass spectrometer usually exhibitcomparatively wide distributions of Eint, the probability for such a case is ex-tremely low. However, kinetic isotope effects can be large in case of decomposingmetastable ions (kH/kD 2–4) because these ions possess only small excess ener-gies. Such circumstances make them sensitive to the difference between EexD andEexH. On the other hand, ions decomposing in the ion source have usually high in-ternal energies, and thus smaller isotope effects are observed (kH/kD 1–1.5).
While the mass of H remarkably differs from that of D (2 u/1 u = 2), the rela-tive increase in mass is much less for heavier elements such as carbon(13 u/12 u 1.08) [68] or nitrogen (15 u/14 u 1.07). As a result, kinetic iso-tope effects of those elements are particularly small and special attention has to bedevoted in order for their proper determination.
2.9.1.2 Measurement of Isotope Effects
Mass spectrometry measures the abundance of ions versus their m/z ratio, and it iscommon practice to use the ratio ImH/ImD = kH/kD as a direct measure of the isotopeeffect. The typical procedure for determining isotope effects from intensity ratiosis to solve a set of simultaneous equations. [71-74]
Example: The transfer of a D compared to the transfer of an H during propeneloss from partially labeled phenylproylethers is accompanied by an isotope effect,the approximate magnitude of which was estimated as follows: [74]
1][][
:]1,1[56
662
iODHCOHC
D(2.28)
iODHCOHC
D )1(][
][:]3,3,3,2,2[
56
665
(2.29)
where is the total fraction of H transferred from positions 2 and 3 and i is theisotope effect favoring H over D transfer. Unfortunately, the situation is morecomplicated if more than just one complementary pair is being studied, as an exactsolution is no longer feasible. Then, a numerical approach is required to approxi-mate the i value. [74,75]
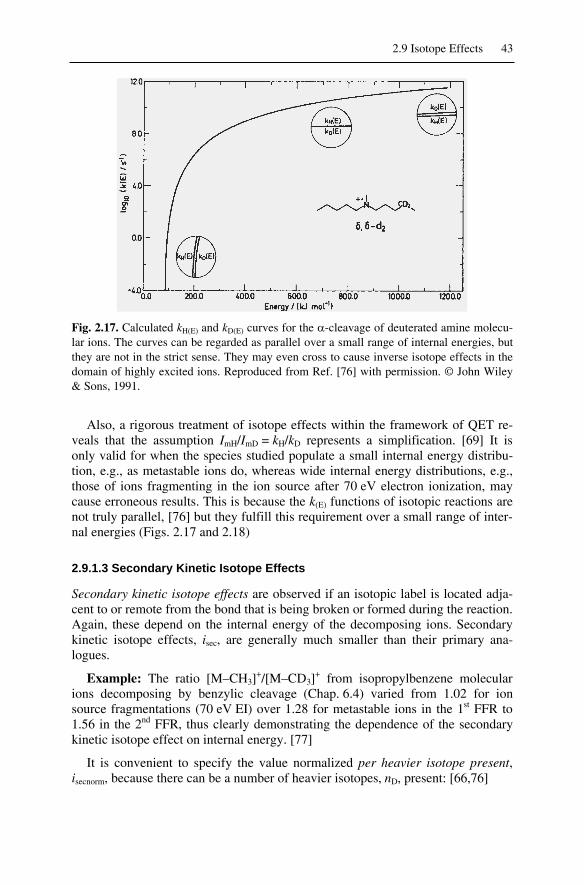
2.9 Isotope Effects 43
Fig. 2.17. Calculated kH(E) and kD(E) curves for the -cleavage of deuterated amine molecu-lar ions. The curves can be regarded as parallel over a small range of internal energies, butthey are not in the strict sense. They may even cross to cause inverse isotope effects in thedomain of highly excited ions. Reproduced from Ref. [76] with permission. © John Wiley& Sons, 1991.
Also, a rigorous treatment of isotope effects within the framework of QET re-veals that the assumption ImH/ImD = kH/kD represents a simplification. [69] It isonly valid for when the species studied populate a small internal energy distribu-tion, e.g., as metastable ions do, whereas wide internal energy distributions, e.g.,those of ions fragmenting in the ion source after 70 eV electron ionization, maycause erroneous results. This is because the k(E) functions of isotopic reactions arenot truly parallel, [76] but they fulfill this requirement over a small range of inter-nal energies (Figs. 2.17 and 2.18)
2.9.1.3 Secondary Kinetic Isotope Effects
Secondary kinetic isotope effects are observed if an isotopic label is located adja-cent to or remote from the bond that is being broken or formed during the reaction.Again, these depend on the internal energy of the decomposing ions. Secondarykinetic isotope effects, isec, are generally much smaller than their primary ana-logues.
Example: The ratio [M–CH3]+/[M–CD3]
+ from isopropylbenzene molecularions decomposing by benzylic cleavage (Chap. 6.4) varied from 1.02 for ionsource fragmentations (70 eV EI) over 1.28 for metastable ions in the 1st FFR to1.56 in the 2nd FFR, thus clearly demonstrating the dependence of the secondarykinetic isotope effect on internal energy. [77]
It is convenient to specify the value normalized per heavier isotope present,isecnorm, because there can be a number of heavier isotopes, nD, present: [66,76]

44 2 Gas Phase Ion Chemistry
Dnnorm ii secsec
(2.30)
Example: Secondary kinetic isotope effects on the -cleavage of tertiary aminemolecular ions occurred after deuterium labeling both adjacent to and remote fromthe bond cleaved (Chap. 6.2.5). They reduced the fragmentation rate relative to thenonlabeled chain by factors of 1.08–1.30 per D in case of metastable ion decom-positions (Fig. 2.18), but the isotope effect vanished for ion source processes. [78]With the aid of field ionization kinetic measurements the reversal of these kineticisotope effects for short-lived ions (10–11–10–10 s) could be demonstrated, i.e., thenthe deuterated species decomposed slightly faster than their nonlabeled isoto-pomers (Fig. 2.17). [66,76]
Fig. 2.18. Observation of secondary H/D isotope effects on the -cleavage of tertiary aminemolecular ions. For convenience, m/z labels have been added to the original energy scale ofthe MIKE spectrum. Adapted from Ref. [78] with permission. © American Chemical Soci-ety, 1988.
2.10 Determination of Ionization Energies andAppearance Energies
2.10.1 Conventional Determination of Ionization Energies
The experimental determination of ionization energies [46] is rather uncompli-cated. One simply would have to read out the lower limit of the electron energy ata vanishing molecular ion signal. Unfortunately, doing so yields only coarse ap-proximations of the real ionization energy of a molecule. The accuracy of IE dataobtained by this simple procedure will be about ± 1 eV. One of the problems is lo-cated in the measurement of the electron energy itself. The electrons are thermallyemitted from a hot metal filament (1600–2000 °C), and therefore, their total ki-netic energy is not only defined by the potential applied to accelerate them, butalso by their thermal energy distribution. [25] In addition, electron ionization pref-
2.10 Determination of Ionization Energies and Appearance Energies 45
erably creates vibrationally excited ions (Chap. 2.3), because ionization is athreshold process, i.e., it will take place not just when the energy needed to ac-complish the process is reached, but also for all higher energies. [79] This givesrise to a systematic error in that vertical IEs are obtained being higher than theadiabatic IEs one would like to measure. Further drawbacks are: i) Due to inho-mogeneous electric fields within the ionization volume, the actual electron energyalso depends on the location where ionization takes place. ii) The fact that the lowelectron acceleration voltages of 7–15 V have to be superimposed on the ion ac-celeration voltage of several kilovolts causes low precision of the voltage settingsin commercial magnetic sector instruments. iii) There is additional thermal energyof the neutrals roughly defined by the temperature of the inlet system and the ionsource.
2.10.1.1 Improved IE Accuracy from Data Post-Processing
Numerous approaches have been published to improve the accuracy of IE data.However, the uncertainty of electron energy remains, causing the ionization effi-ciency curves not to directly approach zero at IE. Instead of being linear, theybend close to the ionization threshold and exponentially approximate zero. Eventhough the electron energy scale of the instrument has been properly calibratedagainst IEs of established standards such as noble gases or solvents, IE data ob-tained from direct readout of the curve have accuracies of ± 0.3 eV (Fig. 2.19a).
To overcome the uncertainty of the actual onset of ionization, among severalothers, [80] the critical slope method has been developed. [25,81] It makes use ofthe fact that from theory realistic values of IE are expected at the position of theionization efficiency curve where the slope of a semilog plot of the curve is
kTnnN
dVd
i1
1)(ln (2.31)
with Ni being the total number of ions produced at an electron accelerationvoltage V, and with an empirical value of n = 2 (Fig. 2.19b).
2.10.2 Experimental Improvements of IE Accuracy
If reliable thermochemical data [28,82] is required, the above influences have tobe substantially reduced. [46] One way is to use an electron monochromator (ac-curacy up to ± 0.1 eV). [83,84] An electron monochromator is a device for se-lecting nearly monoenergetic electrons from an electron beam. [85] Alternatively,one can employ photoionization (PI) instead of EI:
M + h M+• + e– (2.32)
Photoionization yields even more accurate results (± 0.05 eV) than the electronmonochromator. [86] In any case, the half width of the electron or photon energydistribution becomes small enough to detect detailed structural features of the
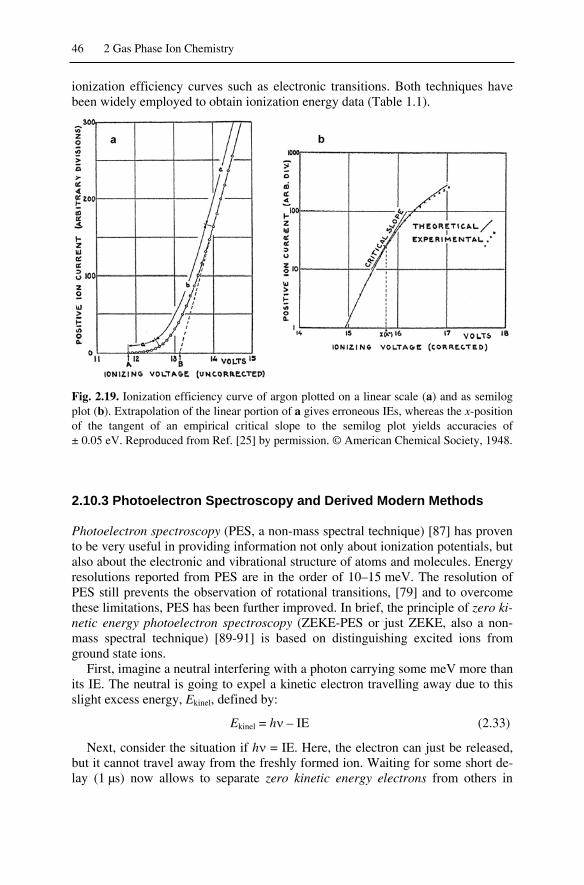
46 2 Gas Phase Ion Chemistry
ionization efficiency curves such as electronic transitions. Both techniques havebeen widely employed to obtain ionization energy data (Table 1.1).
Fig. 2.19. Ionization efficiency curve of argon plotted on a linear scale (a) and as semilogplot (b). Extrapolation of the linear portion of a gives erroneous IEs, whereas the x-positionof the tangent of an empirical critical slope to the semilog plot yields accuracies of± 0.05 eV. Reproduced from Ref. [25] by permission. © American Chemical Society, 1948.
2.10.3 Photoelectron Spectroscopy and Derived Modern Methods
Photoelectron spectroscopy (PES, a non-mass spectral technique) [87] has provento be very useful in providing information not only about ionization potentials, butalso about the electronic and vibrational structure of atoms and molecules. Energyresolutions reported from PES are in the order of 10–15 meV. The resolution ofPES still prevents the observation of rotational transitions, [79] and to overcomethese limitations, PES has been further improved. In brief, the principle of zero ki-netic energy photoelectron spectroscopy (ZEKE-PES or just ZEKE, also a non-mass spectral technique) [89-91] is based on distinguishing excited ions fromground state ions.
First, imagine a neutral interfering with a photon carrying some meV more thanits IE. The neutral is going to expel a kinetic electron travelling away due to thisslight excess energy, Ekinel, defined by:
Ekinel = h – IE (2.33)
Next, consider the situation if h = IE. Here, the electron can just be released,but it cannot travel away from the freshly formed ion. Waiting for some short de-lay (1 µs) now allows to separate zero kinetic energy electrons from others in

2.10 Determination of Ionization Energies and Appearance Energies 47
space. Applying an extraction voltage along a given drift direction will then add adifferent amount of kinetic energy to the kinetic electrons, as these have traveledfurther, than to those ejected at threshold, i.e., they differ in speed. A time-of-flight measurement of the electrons therefore produces one signal for each groupof electrons. (For another application of this concept cf. Chap. 4.2.5).
Example: The electronic and vibrational states of the oxygen molecular ioncould be perfectly resolved by PES (Fig. 2.20), thus allowing to directly read outthe Franck-Condon factors and to identify the (0 0) transitions corresponding toadiabatic ionization. [88]
Fig. 2.20. High resolution photoelectron spectrum of O2, showing overlapping vibrationalprogressions from transitions to different electronic states of the ion (range of IE notshown). Reproduced from Ref. [88] with permission. © Royal Swedish Academy of Sci-ences, 1970.
The main disadvantage of PES and ZEKE experiments results from the detec-tion of electrons making the measurements sensitive to impurities, because theelectrons could arise from these instead of the intended sample. This can be cir-cumvented by detecting the ions produced instead, and the corresponding tech-nique is known as mass-analyzed threshold ionization (MATI). [92] In MATI ex-periments, the neutrals are excited in a field-free environment by means of atunable light source (usually a multi-photon laser process) very close to ionizationthreshold. Eventually occurring prompt ions are removed after about 0.1 µs by aweak positive electric field. Then, the near-threshold Rydberg species are ionizedby applying a negative electric field pulse also effecting acceleration of those ionstowards a time-of-flight mass analyzer. [92-94] Thus, we are finally back to a realmass spectral technique. Different from ZEKE, the mass selectivity of MATI al-lows not only for the study of molecules, [92,94] but also to deal with dissociatingcomplexes and clusters. [79,95,96]
Example: The ionization spectra at the first ionization threshold of pyrazine asobtained by PI, MATI and ZEKE-PES are clearly different (Fig. 2.21). [92] The

48 2 Gas Phase Ion Chemistry
PI spectrum is a plot of ion current versus wavelength of the probe laser. Whilethe PI spectrum shows a simple rise of the curve at IE, MATI and ZEKE yield asharp peak at ionization threshold plus additional signals from lower vibrationalionization thresholds.
Fig. 2.21. Comparison of PI, MATI and ZEKE spectra of pyrazine. Reproduced from Ref.[92] with permission. © American Institute of Physics, 1991.
2.10.4 Determination of Appearance Energies
The techniques used for the determination of appearance energies are essentiallyidentical to those described above for IEs. However, even when using the mostaccurately defined electron or photon energies, great care has to be taken whenAEs are to be determined because of the risk of overestimation due to kinetic shift.Provided that there is no reverse activation energy for the reaction under study, theAE value also delivers the sum of heats of formation of the dissociation products.If substantial KER is observed, the AE may still be used to determine the activa-tion energy of the process.

2.10 Determination of Ionization Energies and Appearance Energies 49
2.10.5 Breakdown Graphs
Employing the above techniques, one can examine the fragmentations of a mo-lecular ion as a function of internal energy by constructing a so-called breakdowngraph. This is essentially done by plotting the ion intensities of interest, i.e., thoseof a certain m/z, versus electron energy or versus ion internal energy if the IE hasbeen subtracted before. [97] Typically, a molecular ion can access a considerablenumber of fragmentation pathways as soon as there are some 1–3 eV of internalenergy available. Breakdown graphs allow to compare the energetic demands ofthose different fragmentation pathways. In addition, breakdown graphs help tocorrelate ion internal energy distributions derived from other methods such asphotoelectron spectroscopy [98] with mass spectral data.
Example: For the case of 4-methyl-1-pentene, the breakdown graph, the internalenergy distribution from the photoelectron spectrum, and the 70 eV EI mass spec-trum are compared (Fig. 2.22). [99] From the fragmentation threshold to about
Fig. 2.22. Relationship of breakdown graph (a), internal energy distribution from PES (b),and mass spectrum of 4-methyl-1-pentene (c). Reproduced from Ref. [99] by permission.© John Wiley & Sons, 1982.
2 eV of internal energy the breakdown graph is dominated by the [C4H8]+• ion,
m/z 56. In the range 2–4.5 eV the [C3H7]+ ion, m/z 43, becomes most prominent.
However, in the spectrum, [C4H8]+• is of only 60 % of the intensity of [C3H7]
+. Itis obvious from the graphs that the 0.5–1 eV energy region, where [C4H8]
+• is the

50 2 Gas Phase Ion Chemistry
predominating fragment ion, corresponds to a region of the internal energy distri-bution which has a low ion population. This explains why [C3H7]
+ constitutes thebase peak of the spectrum. Beyond 5 eV internal energy, the [C3H5]
+ ion, m/z 41,becomes the most prominent fragment ion.
2.11 Gas Phase Basicity and Proton Affinity
Not all ionization methods rely on such strictly unimolecular conditions as EIdoes. Chemical ionization (CI, Chap. 7), for example, makes use of reactive colli-sions between ions generated from a reactant gas and the neutral analyte toachieve its ionization by some bimolecular process such as proton transfer. Thequestion which reactant ion can protonate a given analyte can be answered fromgas phase basicity (GB) or proton affinity (PA) data. Furthermore, proton transfer,and thus the relative proton affinities of the reactants, play an important role inmany ion-neutral complex-mediated reactions (Chap. 6.12).
2.11.1 Definition of Gas Phase Basicity and Proton Affinity
Proton affinity and gas phase basicity are thermodynamic quantities. Consider thefollowing gas phase reaction of a (basic) molecule, B:
Bg + Hg+ [BH]g
+ (2.34)
The tendency of B to accept a proton is then quantitatively described by
– Gr0 = GB(B) and – Hr
0 = PA(B) , (2.35)
i.e. the gas phase basicity GB(B) is defined as the negative free energy changefor the proton transfer, – Gr
0, whereas the proton affinity PA(B) is the negativeenthalpy change, – Hr
0, for the same reaction. [100,101] From the relation
G0 = H0 – T S0 (2.36)
we obtain the expression
PA(B) = GB(B) – T S0 (2.37)
with the entropy term T S0 usually being relatively small (25–40 kJ mol–1).Furthermore, in case of an equilibrium
[AH]+ + B A + [BH]+ (2.38)
with the equilibrium constant Keq for which we have
Keq = [BH+]/[AH+] . [A]/[B] (2.39)
the gas phase basicity is related to Keq by [102,103]
GB(B) = – G0 = RT ln Keq (2.40)

2.10 Determination of Ionization Energies and Appearance Energies 51
2.11.2 Determination of Gas Phase Basicities and Proton Affinities
The methods for the determination of GBs and PAs make use of their relation toKeq (Eq. 2.40) and the shift of Keq upon change of [AH]+ or B, respectively.[101,103] Basically, the value of GB or PA is bracketed by measuring Keq with aseries of several reference bases ranging from lower to higher GB than the un-known. There are two methods we should address in brief, a detailed treatment ofthe topic being beyond the scope of the present book, however.
2.11.2.1 Kinetic Method
The kinetic method [102,104-106] compares the relative rates of the competitivedissociations of a proton-bound adduct [A–H–B]+ formed by admitting a mixtureof A and B to a CI ion source. [104,105] There, the proton-bound adduct [A–H–B]+ is generated amongst other products such as [AH]+ and [BH]+. Using standardtandem MS techniques, e.g., MIKES, the cluster ion [A–H–Bref]
+ is selected andallowed to undergo metastable decomposition:
[AH]+ + Bref [A–H–Bref]+ A + [BrefH]+ (2.41)
The relative intensities of the products [AH]+ and [BrefH]+ are then used as ameasure of relative rate constants of the competing reactions. In case the PA of theunknown was equal to that of the reference, both peaks would be of equal inten-sity. As this will almost never be the case, a series of reference bases is employedinstead, and PA is determined by interpolation. The value of PA(A) is obtainedfrom a plot of ln[AH]+/[BrefH]+ versus PA(B) at ln[AH]+/[BrefH]+ = 0.
2.11.2.2 Thermokinetic Method
The thermokinetic method [107,108] uses the measurement of the forward rateconstant of the equilibrium
[AH]+ + Bref A + [BrefH]+ (2.42)
The thermokinetic method takes advantage of the correlation observed betweenkexp and G2
0 through the relationship
RT/)GGexp(k
k
acoll
exp00
21
1 (2.43)
where kcoll is the collision rate constant and Ga0 a term close to RT. The GB of
the unknown is then obtained from G20 = GB – GBref. The task to establish a
proper value of the reaction efficiency RE = kexp/kcoll, is solved by plotting the ex-perimental values of RE versus GB(B) and interpolating these points with a para-metric function. Although this can be done with high accuracy, it is still a matterof debate which value of RE yields the most realistic GB, suggestions beingRE = 0.1–0.5. [101]

52 2 Gas Phase Ion Chemistry
Example: GB and PA of cyclohexanecarboxamide were determined by eitherexperimental method. The kinetic method based on both metastable dissociation(MI) and collision-induced dissociation (CID, Chap. 2.12.1) yieldedGB = 862 ± 7 kJ mol–1 and PA = 896 ± 5 kJ mol–1, while the thermokineticmethod gave GB = 860 ± 5 kJ mol–1 and PA = 891 ± 5 kJ mol–1, i.e., both methodsyield comparable results (Fig. 2.23).
Fig. 2.23. Determination of the proton affinity of cyclohexanecarboxamide (a) by the ki-netic method, and (b) by the thermokinetic method. The horizontal lines show the indica-tive values ln[AH]+/[BrefH]+ = 0 in (a) and REs according to different authors in (b). [101]Adapted from Ref. [109] by permission. © IM Publications, 2003.
Table 2.6. Selected proton affinities and gas phase basicities [28,100,110]
Molecule PA(B) [kJ mol–1] GB(B) [kJ mol–1]H2 424 396CH4 552 527C2H6 601 558H2O 697 665H2C=O 718 685CH3CH=CH2 751 718C6H6 (benzene) 758 731(CH3)2C=CH2 820 784(CH3)2C=O 823 790C14H10 (phenanthrene) 831 802C4H8O (tetrahydrofurane) 831 801C2H5OC2H5 838 805NH3 854 818CH3NH2 896 861C5H5N (pyridine) 924 892(CH3)3N 942 909

2.12 Tandem Mass Spectrometry 53
2.12 Tandem Mass Spectrometry
Tandem mass spectrometry summarizes the numerous techniques where mass-selected ions (MS1) are subjected to a second mass spectrometric analysis (MS2).[111,112] Dissociations in transit through the mass analyzer may either occurspontaneously (metastable, Chaps. 2.7.1, 2.8.2) or can result from intentionallysupplied additional activation, i.e., typically from collisions with neutrals. Below,we will chiefly discuss the collision process as such and its consequences for thefurther fate of the ions. Instrumental aspects of tandem MS are included in Chap. 4and applications are presented in Chaps. 7-12.
Note: Tandem mass spectrometry is also known as MS/MS or MS2. The latterterminology elegantly allows for the expansion to multi-stage experimental set-ups, e.g., MS3, MS4 or generally MSn.
2.12.1 Collision-Induced Dissociation
Even though collisions of ions with neutral gas atoms or molecules appear to beperfectly contradictory to the conditions of high vacuum, most mass spectrometersare equipped or can be upgraded to allow for their study. Consequently, funda-mental and analytical studies make use of activating or reactive collisions withinthe mass spectrometer. The most prominent collision technique is collision-induced dissociation (CID); [113,114] the terms collisionally activated dissocia-tion (CAD) or collisional activation (CA) also have been in use. CID allows forthe fragmentation of gaseous ions that were perfectly stable before the activatingevent. Thus, CID is especially useful for the structure elucidation of ions of lowinternal energy, e.g., for those created by soft ionization methods (Chaps. 7-11).
2.12.1.1 Effecting Collisions in a Mass Spectrometer
CID is generally realized by passing an ion beam through a collision cell wherethe collision gas (He, N2, Ar) is regulated at a pressure considerably above that ofthe surrounding high vacuum. This can be achieved by introducing the gas via aneedle valve into a comparatively tight volume only having a narrow entrance andexit for the ion beam (Fig. 2.24). A vacuum pump is placed near by to remove ef-fusing gas, thereby creating a differentially pumped region, because there is nomore laminar flow at some 10–4 Pa. Instead, expansion of the gas is diffusion-controlled. The reading of a pressure gauge can be used to reproduce the pressureadjustment, but it never shows the real pressure inside the cell. [9]

54 2 Gas Phase Ion Chemistry
m1 m2 + n++
collision cell He, N2, Ar
flight tube
turbomolecular ordiffusion pump
CID10-4 Pa10-4 Pa
10-3 Pa
10-2 Pa
1 Paion beam
pressure gauge
MS 2MS 1
Fig. 2.24. Schematic of a collision cell for CID experiments in a beam instrument.
2.12.1.2 Energy Transfer During Collisions
The collision of an ion AB+ carrying some kiloelectronvolts of kinetic energy witha neutral N takes about 10–15 s. This allows to apply the assumptions of QETanalogously to electron ionization [5,115-118] (Chap. 2.1.1). The collision-induced dissociation of AB+ can therefore be regarded as a two-step process. [119]First, the activated species AB+* is formed. Second, after randomization of the in-ternal energy AB+* dissociates along any fragmentation pathway available at thisspecific level of internal energy:
AB+ + N AB+* + N A+ + B + N (2.44)
The internal energy EAB+* is composed of the internal energy prior to the colli-sion, EAB+, and of the amount of energy Q transferred during the collision:
EAB+* = EAB+ + Q (2.45)
Thus, the collision marks a new start of the time scale for the activated ion. AsQ > EAB+ generally holds valid, the internal energy prior to the collision is of mi-nor relevance – though not generally negligible – for the behavior of the activatedion. As may be expected, the CID spectra of stable molecular ions exhibit markedsimilarity to the 70 eV EI spectra of the respective compounds. [113,114]
Example: Except for the intensities relative to the precursor ion, the B/E linkedscan CID spectrum of toluene molecular ion, m/z 92, closely resembles the 70 eVEI mass spectrum of toluene (Fig. 2.25; for EI cf. Chap. 6.4.3). Here, all fragmentsare due to CID because the molecular ion was generated by field ionization anddid not show any metastable decomposition, i.e., EAB+ = 0 and EAB+* = Q.

2.12 Tandem Mass Spectrometry 55
Fig. 2.25. CID spectrum of toluene molecular ion, m/z 92. Elab = 10 kV, B/E linked scan,collision gas He at about 50 % transmission.
The absolute upper limit for the value of Q is defined by the center-of-masscollision energy, ECM, [115,116]
ABN
NLABCM mm
mEE
(2.46)
where mN is the mass of the neutral, mAB the mass of the ion, and ELAB the ionkinetic energy in the laboratory frame of reference. By regarding a polyatomic ionas separated into the atom B actually involved in the collision process and the re-mainder A, the maximum of Q is calculated to have a lower value than ECM. As-suming central collisions we obtain: [116]
2
maxint )(4
NBAB
NBALAB mmm
mmmEE
(2.47)
However, most collisions are not “head-on”, but occur at some angle . In-creasing mAB makes Eintmax decrease, whereas larger mN is beneficial for energytransfer. In CID-MIKES the center of the peak is shifted to the low mass side, i.e.,to the low ion translational energy side, because the uptake Q originates from aloss in ELAB. [120-125] The relationship between ELAB and Q can be expressedas: [122]
cos12)(
LAB
LABLAB
N
LABAB
N
NABLAB
EEE
mEm
mmmE
Q(2.48)
Several conclusions can be drawn from Eq. 2.48: i) Q has a broad distribution(0–15 eV) due to variations in and typically is in the order of some electronvolts[126]; ii) up to a certain ionic mass the neutral penetrates the incident ion, i.e., the

56 2 Gas Phase Ion Chemistry
activated ion leaves the neutral behind (forward-scattered ion), but beyond thelimit (> 102 atoms) the neutral is expelled in the direction of ion motion (back-ward-scattered ion) [122]; iii) at about m/z 1500 ELAB = Q, i.e., the translationalenergy loss is fully converted into vibrational excitation of the ion; and iv) Q de-creases beyond m/z 1500, thus explaining the difficulties in fragmenting heavyions by CID (Fig. 2.26). [118,122,127]
Note: In magnetic sector and TOF instruments, He is typically used as the col-lision gas because Eintmax from high-energy collisions (keV) is still compara-tively large, and He reduces the risk of charge exchange due to its high IE. Inthe low collision energy regime [116] of quadrupole and ion trapping instru-ments (1–200 eV), heavier gases are frequently employed (N2, Ar, Xe) to makeCID more effective.
Fig. 2.26. Illustration of the relationship between ECM, ELAB, and Q. Adapted from Ref.[122] with permission. © Verlag der Zeitschrift für Naturforschung, 1984.
2.12.1.3 Single and Multiple Collisions in CID
Generally, the collision gas pressure is adjusted in order to achieve a certain at-tenuation of the beam of mass-selected ions that are going to be collided. As theso-called main beam becomes increasingly attenuated, the probability for multiplecollisions rises and so does the yield of fragments resulting from high activationenergy processes. In a typical high collision energy experiment a transmission of90 % for the main beam means that 95 % of the colliding ions undergo single col-lisions, about 25 % of the ions encounter double and some percent even triple andquadruple collisions at 50 % transmission (Fig. 2.27). [9] To achieve sufficient

2.12 Tandem Mass Spectrometry 57
activation of the ions in the low collision energy regime, elongated collision cellsare employed where Q is accumulated from numerous collision events.
Note: It has turned out that medium transmission is optimal for structure eluci-dation. Too strong reduction of the main beam favors ion losses due to scatter-ing, charge exchange (M+• + N M + N+•) or charge stripping processes(M+• + N M2+ + N+•) instead of delivering additional structural information.
Fig. 2.27. Total collision probability Pn and fractions of single, double, triple and quadruplecollisions versus collision gas pressure. The transmission of the main beam It is given onthe right ordinate. Values are for an ion of collision cross section 5 10–16 cm2 and 1 cmcollision path; 10–2 Torr = 1.33 Pa. Reproduced from Ref. [9] with permission. © JohnWiley & Sons, 1985.
2.12.2 Other Methods of Ion Activation
2.12.2.1 Surface-Induced Dissociation
Instead of using gaseous atoms as the collision partners, collisions with solid sur-faces can be employed to induce dissociation of the incident ions. This techniquehas become known as surface-induced dissociation (SID). [128] Ions of some tenelectronvolts kinetic energy are collided with a solid surface typically at an angleof 45° to effect SID. The evolving fragments are mass-analyzed by means of a lin-ear quadrupole mass analyzer at right angles to the incident ion beam (Fig. 2.28).[128-130] Such an experimental setup allows for the control of the energy of theincident ions, and therefore for the adjustment of the degree of fragmentation.
It has been shown that SID spectra are very similar to high as well as to low-energy CID spectra. [128] The absence of collision gas presents an advantage of
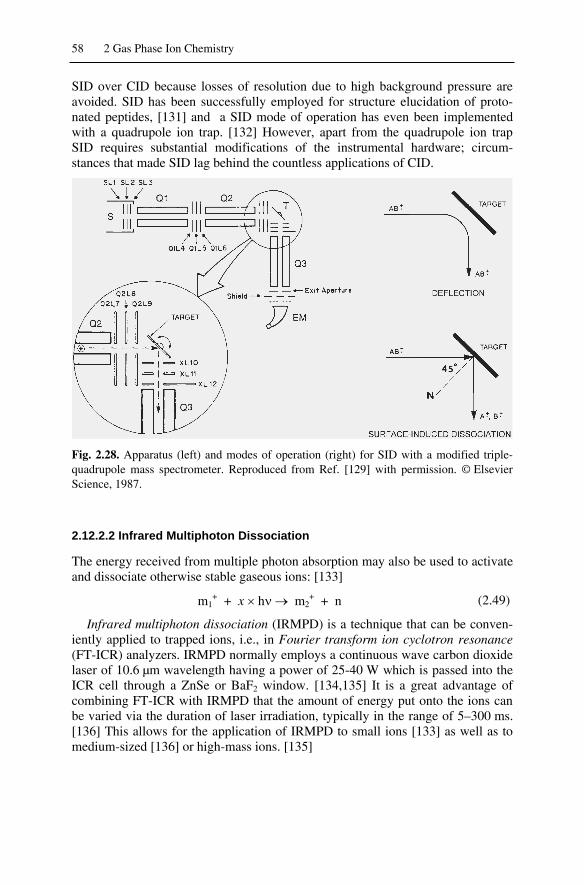
58 2 Gas Phase Ion Chemistry
SID over CID because losses of resolution due to high background pressure areavoided. SID has been successfully employed for structure elucidation of proto-nated peptides, [131] and a SID mode of operation has even been implementedwith a quadrupole ion trap. [132] However, apart from the quadrupole ion trapSID requires substantial modifications of the instrumental hardware; circum-stances that made SID lag behind the countless applications of CID.
Fig. 2.28. Apparatus (left) and modes of operation (right) for SID with a modified triple-quadrupole mass spectrometer. Reproduced from Ref. [129] with permission. © ElsevierScience, 1987.
2.12.2.2 Infrared Multiphoton Dissociation
The energy received from multiple photon absorption may also be used to activateand dissociate otherwise stable gaseous ions: [133]
m1+ + x h m2
+ + n (2.49)
Infrared multiphoton dissociation (IRMPD) is a technique that can be conven-iently applied to trapped ions, i.e., in Fourier transform ion cyclotron resonance(FT-ICR) analyzers. IRMPD normally employs a continuous wave carbon dioxidelaser of 10.6 µm wavelength having a power of 25-40 W which is passed into theICR cell through a ZnSe or BaF2 window. [134,135] It is a great advantage ofcombining FT-ICR with IRMPD that the amount of energy put onto the ions canbe varied via the duration of laser irradiation, typically in the range of 5–300 ms.[136] This allows for the application of IRMPD to small ions [133] as well as tomedium-sized [136] or high-mass ions. [135]

2.12 Tandem Mass Spectrometry 59
2.12.2.3 Electron Capture Dissociation
For an ion, the cross section for electron capture (EC) roughly increases with thesquare of the ionic charge. [137] This makes multiply charged ions as produced byelectrospray ionization (ESI, Chap. 11) the ideal targets for this process, e.g.:
[M+11H]11+ + e– [M+11H]10+• (2.50)
The energy from partial neutralization becomes the ion's internal energy, thuscausing its dissociation, so-called electron capture dissociation (ECD). Again, thisis a technique for trapped ions only. To effectively achieve ECD the electronsmust have energies < 0.2 eV. Therefore, they are supplied analogously to EI froma carefully regulated heated filament [138] (Chap. 5.2.3) externally mounted to theICR cell. Although a very recent discovery, [137,139] ECD is now widely appliedin biomolecule sequencing by means of ESI-FT-ICR-MS. [138,140] Presumablythe main reason for the numerous ECD applications arises from the fact that ECDyields information complementary to CID [141] and IRMPD. [134]
Note: As one electron charge is neutralized upon EC, the precursor ion forECD must at least be a doubly charged positive even-electron ion to yield asingly charged radical ion for subsequent dissociation.
2.12.3 Reactive Collisions
2.12.3.1 Neutralization-Reionization Mass Spectometry
In CID, charge exchange between the ions and the collision gas is an unwantedside reaction. However, it may become useful when employed in combinationwith a subsequent reionization step as realized in neutralization-reionization massspectrometry (NR-MS). [142-147] In NR-MS the precursor ion of some kiloelec-tronvolts kinetic energy is mass-selected in MS1 and passed through a first colli-sion cell containing a reducing collision gas. A certain fraction of these ions willbe reduced by charge exchange to become neutrals. As these neutrals basicallyretain their initial kinetic energy and direction, they leave the first collision cellalong with the precursor ion beam. Remaining ions can then be removed from thebeam by electrostatic deflection. Having traveled for some microseconds along ashort path through the field-free region, the neutrals are subjected to ionizing col-lisions in a second collision cell. Finally, the mass spectrum of the reionized spe-cies is detected by means of MS2.
For the purpose of neutralization it is possible to employ i) noble gases of lowIE such as Xe (12.1 eV), [144] ii) metal vapors effusing from an oven, e.g., Hg(10.4 eV), Zn (9.3 eV) and Cd (9.0 eV), [142,148] or iii) volatile organic mole-cules, e.g., benzene (9.2 eV) or triphenylamine (6.8 eV). [149] Reionization of theneutrals in the second collision cell can be achieved i) using O2 (12.1 eV) or He(24.6 eV), [148,149] or ii) some standard ionization method such as electron ioni-zation or field ionization. [146]

60 2 Gas Phase Ion Chemistry
The applications of NR-MS are numerous. [147,150-152] In particular, NR-MSplays to its strength where the existence of short-lived and otherwise unstable spe-cies has to be proved. [153-155]
Example: The NR mass spectrum of acetone closely resembles its 70 eV EImass spectrum (Chap. 6.2.1), thereby demonstrating that the molecular ion basi-cally retains the structure of the neutral (Fig. 2.29). [144] However, the isomericC3H6O
+• ions formed by McLafferty rearrangement of 2-hexanone molecular ionare expected to have enol structure (Chap. 6.7.1), and thus the corresponding NRmass spectrum is easily distinguished from that of acetone.
Fig. 2.29. NR-MS (Xe–He) of acetone (a) and its enol (b) from neutralization of the corre-sponding ions. Adapted from Ref. [144] with permission. © Elsevier Science, 1985.
2.12.3.2 Ion-Molecule Reactions
When gaseous ions collide with neutrals at thermal energy rather than at multi- oreven kiloelectronvolt energy other bimolecular reactions than the mere charge ex-change may take place.
Proton transfer is one of the prominent representatives of an ion-molecule re-action in the gas phase. It is employed for the determination of GBs and PAs(Chap. 2.11.2) by either method: the kinetic method makes use of the dissociationof proton-bound heterodimers, and the thermokinetic method determines the equi-librium constant of the acid-base reaction of gaseous ions. In general, proton trans-fer plays a crucial role in the formation of protonated molecules, e.g., in positive-ion chemical ionization mass spectrometry (Chap. 7).
More recently, the catalytic activities of a large pool of transition-metal carbenecomplexes have been screened by means of ion-molecule reactions in tandem-MSexperiments. [156-158] Different from the concepts and methods discussed so far,the latter experiments are not designed to study the fundamentals of mass spec-trometry. Instead, sophisticated methods of modern mass spectrometry are nowemployed to reveal the secrets of other complex chemical systems.

Reference List 61
Reference List
1. Porter, C.J.; Beynon, J.H.; Ast, T. TheModern Mass Spectrometer. A CompleteChemical Laboratory. Org. Mass Spec-trom. 1981, 16, 101-114.
2. Schwarz, H. The Chemistry of NakedMolecules or the Mass Spectrometer As aLaboratory. Chem. Unserer Zeit 1991, 25,268-278.
3. Kazakevich, Y. Citation Used by Permis-sion. http://hplc. chem. shu. edu/ 1996,Seton Hall University, South Orange, NJ.
4. Cooks, R.G.; Beynon, J.H.; Caprioli, R.M.Metastable Ions; Elsevier: Amsterdam,1973.
5. Levsen, K. Fundamental Aspects of Or-ganic Mass Spectrometry; 1st ed.; VerlagChemie: Weinheim, 1978.
6. Franklin, J.L. Energy Distributions in theUnimolecular Decomposition of Ions, inGas Phase Ion Chemistry, 1st ed.; Bowers,M.T., editor; Academic Press: New York,1979; Vol. 1, Chapter 7, pp. 272-303.
7. Beynon, J.H.; Gilbert, J.R. Energetics andMechanisms of Unimolecular Reactions ofPositive Ions: Mass Spectrometric Meth-ods, in Gas Phase Ion Chemistry; Bowers,M.T., editor; Academic Press: New York,1979; Vol. 2, Chap. 13, 153-179.
8. Vogel, P. The Study of Carbocations in theGas Phase, in Carbocation Chemistry, El-sevier: Amsterdam, 1985; Chap. 2, 61-84.
9. Holmes, J.L. Assigning Structures to Ionsin the Gas Phase. Org. Mass Spectrom.1985, 20, 169-183.
10. Lorquet, J.C. Basic Questions in MassSpectrometry. Org. Mass Spectrom. 1981,16, 469-481.
11. Lorquet, J.C. Landmarks in the Theory ofMass Spectra. Int. J. Mass Spectrom.2000, 200, 43-56.
12. Wahrhaftig, A.L. Ion Dissociations in theMass Spectrometer, in Advances in MassSpectrometry, Waldron, J.D., editor; Per-gamon Press: Oxford, 1959; pp. 274-286.
13. Wahrhaftig, A.L. Unimolecular Dissocia-tions of Gaseous Ions, in Gaseous ionChemistry and Mass Spectrometry, Futrell,J.H., editor; John Wiley and Sons: NewYork, 1986; 7-24.
14. Rosenstock, H.M.; Krauss, M. Quasi-Equilibrium Theory of Mass Spectra, inMass Spectrometry of Organic Ions, 1sted.; McLafferty, F.W., editor; AcademicPress: London, 1963; 1-64.
15. Bohme, D.K.; Mackay, G.I. Bridging theGap Between the Gas Phase and Solution:Transition in the Kinetics of NucleophilicDisplacement Reactions. J. Am. Chem.Soc. 1981, 103, 978-979.
16. Speranza, M. Gas Phase Ion ChemistryVersus Solution Chemistry. Int. J. MassSpectrom. Ion Proc. 1992, 118/119, 395-447.
17. Rosenstock, H.M.; Wallenstein, M.B.;Wahrhaftig, A.L.; Eyring, H. AbsoluteRate Theory for Isolated Systems and theMass Spectra of Polyatomic Molecules.Proc. Natl. Acad. Sci. U. S. A. 1952, 38,667-678.
18. Märk, T.D. Fundamental Aspects of Elec-tron Impact Ionization. Int. J. Mass Spec-trom. Ion Phys. 1982, 45, 125-145.
19. Märk, T.D. Electron Impact Ionization, inGaseous ion Chemistry and Mass Spec-trometry, Futrell, J.H., editor; John Wileyand Sons: New York, 1986; 61-93.
20. Meyerson, S.; Van der Haar, R.W. Multi-ply Charged Organic Ions in Mass Spectra.J. Chem. Phys. 1962, 37, 2458-2462.
21. Jones, E.G.; Harrison, A.G. Study of Pen-ning Ionization Reactions Using a Single-Source Mass Spectrometer. Int. J. MassSpectrom. Ion Phys. 1970, 5, 137-156.
22. Penning, F.M. Ionization by MetastableAtoms. Naturwissenschaft. 1927, 15, 818.
23. Hornbeck, J.A.; Molnar, J.P. Mass-Spectrometric Studies of Molecular Ions inthe Noble Gases. Phys. Rev. 1951, 84,621-625.
24. Faubert, D.; Paul, G.J.C.; Giroux, J.; Be-trand, M.J. Selective Fragmentation andIonization of Organic Compounds Usingan Energy-Tunable Rare-Gas MetastableBeam Source. Int. J. Mass Spectrom. IonProc. 1993, 124, 69-77.
25. Honig, R.E. Ionization Potentials of SomeHydrocarbon Series. J. Chem. Phys. 1948,16, 105-112.
26. Cone, C.; Dewar, M.J.S.; Landman, D.Gaseous Ions. MINDO/3 Study of the Re-arrangement of Benzyl Cation to Tropy-lium. J. Am. Chem. Soc. 1977, 99, 372-376.
27. Svec, H.J.; Junk, G.A. Electron-ImpactStudies of Substituted Alkanes. J. Am.Chem. Soc. 1967, 89, 790-796.
28. NIST NIST Chemistry Webbook.http://webbook. nist. gov/ 2002.
62 2 Gas Phase Ion Chemistry
29. Born, M.; Oppenheimer, J.R. Zur Quan-tentheorie der Molekeln. Annalen derPhysik 1927, 84, 457-484.
30. Seiler, R. Born-Oppenheimer Approxima-tion. Int. J. Quant. Chem. 1969, 3, 25-32.
31. Franck, J. Elementary Processes of Photo-chemical Reactions. Trans. Faraday Soc.1925, 21, 536-542.
32. Condon, E.U. Theory of Intensity Distri-bution in Band Systems. Phys. Rev. 1926,28, 1182-1201.
33. Dunn, G.H. Franck-Condon Factors forthe Ionization of H2 and D2. J. Chem.Phys. 1966, 44, 2592-2594.
34. McLafferty, F.W.; Wachs, T.; Lifshitz, C.;Innorta, G.; Irving, P. Substituent Effectsin Unimolecular Ion Decompositions. XV.Mechanistic Interpretations and the QET.J. Am. Chem. Soc. 1970, 92, 6867-6880.
35. Egger, K.W.; Cocks, A.T. Homopolar- andHeteropolar BDEs and Heats of Formationof Radicals and Ions in the Gas Phase. I.Data on Organic Molecules. Helv. Chim.Acta 1973, 56, 1516-1536.
36. Lossing, F.P.; Semeluk, G.P. Free Radi-cals by Mass Spectrometry. XLII. Ioni-zation Potentials and Ionic Heats of For-mation for C1-C4 Alkyl Radicals. Can. J.Chem. 1970, 48, 955-965.
37. Lossing, F.P.; Holmes, J.L. StabilizationEnergy and Ion Size in Carbocations in theGas Phase. J. Am. Chem. Soc. 1984, 106,6917-6920.
38. Cox, J.D.; Pilcher, G. Thermochemistry ofOrganic and Organometallic Compounds;Academic Press: London, 1970.
39. Chatham, H.; Hils, D.; Robertson, R.;Gallagher, A. Total and Partial ElectronCollisional Ionization Cross Sections forMethane, Ethane, Silane, and Disilane. J.Chem. Phys. 1984, 81, 1770-1777.
40. McAdoo, D.J.; Bente, P.F.I.; Gross, M.L.;McLafferty, F.W. Metastable Ion Charac-teristics. XXIII. Internal Energy of ProductIons Formed in Masspectral Reactions.Org. Mass Spectrom. 1974, 9, 525-535.
41. Meier, K.; Seibl, J. Measurement of IonResidence Times in a Commercial Elec-tron Impact Ion Source. Int. J. Mass Spec-trom. Ion Phys. 1974, 14, 99-106.
42. Chupka, W.A. Effect of Unimolecular De-cay Kinetics on the Interpretation of Ap-pearance Potentials. J. Chem. Phys. 1959,30, 191-211.
43. Hipple, J.A. Detection of Metastable IonsWith the Mass Spectrometer. Phys. Rev.1945, 68, 54-55.
44. Hipple, J.A.; Fox, R.E.; Condon, E.U.Metastable Ions Formed by Electron Im-pact in Hydrocarbon Gases. Phys. Rev.1946, 69, 347-356.
45. Beynon, J.H.; Saunders, R.A.; Williams,A.E. Formation of Metastable Ions inMass Spectrometers With Release of In-ternal Energy. Z. Naturforsch. 1965, 20A,180-183.
46. Rosenstock, H.M. The Measurement ofIPs and APs. Int. J. Mass Spectrom. IonPhys. 1976, 20, 139-190.
47. Holmes, J.L.; Terlouw, J.K. The Scope ofMetastable Peak Shape Observations. Org.Mass Spectrom. 1980, 15, 383-396.
48. Williams, D.H. A Transition State Probe.Acc. Chem. Res. 1977, 10, 280-286.
49. Williams, D.H.; Hvistendahl, G. KineticEnergy Release in Relation to Symmetry-Forbidden Reactions. J. Am. Chem. Soc.1974, 96, 6753-6755.
50. Williams, D.H.; Hvistendahl, G. KineticEnergy Release As a Mechanistic Probe.The Role of Orbital Symmetry. J. Am.Chem. Soc. 1974, 96, 6755-6757.
51. Hvistendahl, G.; Williams, D.H. Parti-tioning of Reverse Activation EnergyBetween Kinetic and Internal Energy inReactions of Organic Ions. J. Chem. Soc. ,Perkin Trans. 2 1975, 881-885.
52. Hvistendahl, G.; Uggerud, E. SecondaryIsotope Effect on Kinetic Energy Releaseand Reaction Symmetry. Org. Mass Spec-trom. 1985, 20, 541-542.
53. Kim, K.C.; Beynon, J.H.; Cooks, R.G. En-ergy Partitioning by Mass Spectrometry.Chloroalkanes and Chloroalkenes. J.Chem. Phys. 1974, 61, 1305-1314.
54. Haney, M.A.; Franklin, J.L. Correlation ofExcess Energies of Electron Impact Disso-ciations With the Translational Energies ofthe Products. J. Chem. Phys. 1968, 48,4093-4097.
55. Cooks, R.G.; Williams, D.H. The RelativeRates of Fragmentation of Benzoyl IonsGenerated Upon Electron Impact fromDifferent Precursors. Chem. Commun.1968, 627-629.
56. Lin, Y.N.; Rabinovitch, B.S. Degrees ofFreedom Effect and Internal Energy Parti-tioning Upon Ion Decomposition. J. Phys.Chem. 1970, 74, 1769-1775.
57. Bente III., P.F.; McLafferty, F.W.; McA-doo, D.J.; Lifshitz, C. Internal Energy ofProduct Ions Formed in Mass Spectral Re-actions. The Degrees of Freedom Effect. J.Phys. Chem. 1975, 79, 713-721.

Reference List 63
58. Gross, J.H.; Veith, H.J. UnimolecularFragmentations of Long-Chain AliphaticIminium Ions. Org. Mass Spectrom. 1993,28, 867-872.
59. Ottinger, C. Fragmentation Energies ofMetastable Organic Ions. Phys. Lett. 1965,17, 269-271.
60. Baldwin, M.A.; Derrick, P.J.; Morgan,R.P. Correction of Metastable Peak Shapesto Allow for Instrumental Broadening andthe Translational Energy Spread of theParent Ion. Org. Mass Spectrom. 1976, 11,440-442.
61. Bowen, R.D.; Wright, A.D.; Derrick, P.J.Unimolecular Reactions of Ionized MethylAllyl Ether. Org. Mass Spectrom. 1992,27, 905-915.
62. Cao, J.R.; George, M.; Holmes, J.L.Fragmentation of 1- and 3-Methoxypropene Ions. Another Part of the[C4H8O]+. Cation Radical Potential EnergySurface. J. Am. Chem. Soc. Mass Spec-trom. 1992, 3, 99-107.
63. Gross, J.H.; Veith, H.J. UnimolecularFragmentations of Long-Chain AliphaticIminium Ions. Org. Mass Spectrom. 1993,28, 867-872.
64. Todd, J.F.J. Recommendations for No-menclature and Symbolism for MassSpectroscopy Including an Appendix ofTerms Used in Vacuum Technology. Int.J. Mass Spectrom. Ion Proc. 1995, 142,211-240.
65. Robinson, P.J.; Holbrook, K.A. Uni-molecular Reactions, in Unimolecular Re-actions, John Wiley & Sons: London,1972; Chapter 9.
66. Ingemann, S.; Hammerum, S.; Derrick,P.J.; Fokkens, R.H.; Nibbering, N.M.M.Energy-Dependent Reversal of SecondaryIsotope Effects on Simple Cleavage Reac-tions: Tertiary Amine Radical CationsWith Deuterium at Remote Positions. Org.Mass Spectrom. 1989, 24, 885-889.
67. Lowry, T.H.; Schueller Richardson, K.Isotope Effects, in Mechanism and Theoryin Organic Chemistry, 1st ed.; Harper andRow: New York, 1976; Chapter 1.7.
68. Stringer, M.B.; Underwood, D.J.; Bowie,J.H.; Allison, C.E.; Donchi, K.F.; Derrick,P.J. Is the McLafferty Rearrangement ofKetones Concerted or Stepwise? The Ap-plication of Kinetic Isotope Effects. Org.Mass Spectrom. 1992, 27, 270-276.
69. Derrick, P.J. Isotope Effects in Fragmen-tation. Mass Spectrom. Rev. 1983, 2, 285-298.
70. Hvistendahl, G.; Uggerud, E. DeuteriumIsotope Effects and Mechanism of theGas-Phase Reaction [C3H7]+ [C3H5]+ +H2. Org. Mass Spectrom. 1986, 21, 347-350.
71. Howe, I.; McLafferty, F.W. UnimolecularDecomposition of Toluene and Cyclohep-tatriene Molecular Ions. Variation of theDegree of Scrambling and Isotope Effectwith Internal Energy. J. Am. Chem. Soc.1971, 93, 99-105.
72. Bertrand, M.; Beynon, J.H.; Cooks, R.G.Isotope Effects Upon Hydrogen AtomLoss from Molecular Ions. Org. MassSpectrom. 1973, 7, 193-201.
73. Lau, A.Y.K.; Solka, B.H.; Harrison, A.G.Isotope Effects and H/D Scrambling in theFragmentation of Labeled Propenes. Org.Mass Spectrom. 1974, 9, 555-557.
74. Benoit, F.M.; Harrison, A.G. HydrogenMigrations in Mass Spectrometry. I. TheLoss of Olefin From Phenyl-n-PropylEther Following EI and CI. Org. MassSpectrom. 1976, 11, 599-608.
75. Veith, H.J.; Gross, J.H. Alkene Loss FromMetastable Methyleneimmonium Ions:Unusual Inverse Secondary Isotope Effectin Ion-Neutral Complex IntermediateFragmentations. Org. Mass Spectrom.1991, 26, 1097-1105.
76. Ingemann, S.; Kluft, E.; Nibbering,N.M.M.; Allison, C.E.; Derrick, P.J.;Hammerum, S. Time-Dependence of theIsotope Effects in the Unimolecular Disso-ciation of Tertiary Amine Molecular Ions.Org. Mass Spectrom. 1991, 26, 875-881.
77. Nacson, S.; Harrison, A.G. Dependence ofSecondary Hydrogen/Deuterium IsotopeEffects on Internal Energy. Org. MassSpectrom. 1985, 20, 429-430.
78. Ingemann, S.; Hammerum, S.; Derrick,P.J. Secondary Hydrogen Isotope Effectson Simple Cleavage Reactions in the GasPhase: The -Cleavage of Tertiary AmineCation Radicals. J. Am. Chem. Soc. 1988,110, 3869-3873.
79. Urban, B.; Bondybey, V.E. MultiphotonPhotoelectron Spectroscopy: WatchingMolecules Dissociate. Phys. Chem. Chem.Phys. 2001, 3, 1942-1944.
80. Nicholson, A.J.C. Measurement of Ioniza-tion Potentials by Electron Impact. J.Chem. Phys. 1958, 29, 1312-1318.
81. Barfield, A.F.; Wahrhaftig, A.L. Determi-nation of Appearance Potentials by theCritical Slope Method. J. Chem. Phys.1964, 41, 2947-2948.
64 2 Gas Phase Ion Chemistry
82. Levin, R.D.; Lias, S.G. Ionization Poten-tial and Appearance Potential Measure-ments, 1971-1981. National Standard Ref-erence Data Series 1982, 71, 634 pp.
83. Harris, F.M.; Beynon, J.H. Photodissocia-tion in Beams: Organic Ions, in Gas PhaseIon Chemistry - Ions and Light; Bowers,M.T., editor; Academic Press: New York,1985; Vol. 3, Chapter 19, 99-128.
84. Dunbar, R.C. Ion Photodissociation, inGas Phase Ion Chemistry, 1st ed.; Bowers,M.T., editor; Academic Press: New York,1979; Vol. 2, Chapter 14, 181-220.
85. Maeda, K.; Semeluk, G.P.; Lossing, F.P.A Two-Stage Double-HemisphericalElectron Energy Selector. Int. J. MassSpectrom. Ion Phys. 1968, 1, 395-407.
86. Traeger, J.C.; McLoughlin, R.G. A PIStudy of the Energetics of the C7H7
+ IonFormed from C7H8 Precursors. Int. J. MassSpectrom. Ion Phys. 1978, 27, 319-333.
87. Turner, D.W.; Al Jobory, M.I. Determina-tion of IPs by Photoelectron EnergyMeasurement. J. Chem. Phys. 1962, 37,3007-3008.
88. Edqvist, O.; Lindholm, E.; Selin, L.E.;Åsbrink, L. Photoelectron Spectrum ofMolecular Oxygen. Phys. Scr. 1970, 1, 25-30.
89. Müller-Dethlefs, K.; Sander, M.; Schlag,E.W. Two-Color PI Resonance Spectros-copy of Nitric Oxide: Complete Separationof Rotational Levels of Nitrosyl Ion at theIonization Threshold. Chem. Phys. Lett.1984, 112, 291-294.
90. Müller-Dethlefs, K.; Sander, M.; Schlag,E.W. A Novel Method Capable of Re-solving Rotational Ionic States by the De-tection of Threshold Photoelectrons with aResolution of 1.2 cm-1. Z. Naturforsch.1984, 39a, 1089-1091.
91. Schlag, E.W. ZEKE Spectroscopy; Cam-bridge University Press: Cambridge, 1998.
92. Zhu, L.; Johnson, P. Mass AnalyzedThreshold Ionization Spectroscopy. J.Chem. Phys. 1991, 94, 5769-5771.
93. Weickhardt, C.; Moritz, F.; Grotemeyer, J.Time-of-Flight Mass Spectrometry: State-of-the-Art in Chemical Analysis and Mo-lecular Science. Mass Spectrom. Rev.1997, 15, 139-162.
94. Gunzer, F.; Grotemeyer, J. New Featuresin the Mass Analyzed Threshold Ioniza-tion (MATI) Spectra of Alkyl Benzenes.Phys. Chem. Chem. Phys. 2002, 4, 5966-5972.
95. Peng, X.; Kong, W. ZEKE and MATI ofNa(NH3)n Complexes. J. Chem. Phys.2002, 117, 9306-9315.
96. Haines, S.R.; Dessent, C.E.H.; Müller-Dethlefs, K. MATI of Phenol×CO: Inter-molecular Binding Energies of a Hydro-gen-Bonded Complex. J. Chem. Phys.1999, 111, 1947-1954.
97. Lavanchy, A.; Houriet, R.; Gäumann, T.The Mass Spectrometric Fragmentation ofn-Heptane. Org. Mass Spectrom. 1978, 13,410-416.
98. Meisels, G.G.; Chen, C.T.; Giessner, B.G.;Emmel, R.H. Energy-Deposition Func-tions in Mass Spectrometry. J. Chem.Phys. 1972, 56, 793-800.
99. Herman, J.A.; Li, Y.-H.; Harrison, A.G.Energy Dependence of the Fragmentationof Some Isomeric C6H12
+. Ions. Org. MassSpectrom. 1982, 17, 143-150.
100. Lias, S.G.; Liebman, J.F.; Levin, R.D.Evaluated Gas Phase Basicities and ProtonAffinities of Molecules; Heats of Forma-tion of Protonated Molecules. J. Phys.Chem. Ref. Data 1984, 13, 695-808.
101. Harrison, A.G. The GBs and PAs ofAmino Acids and Peptides. Mass Spec-trom. Rev. 1997, 16, 201-217.
102. Kukol, A.; Strehle, F.; Thielking, G.;Grützmacher, H.-F. Methyl Group Effecton the Proton Affinity of MethylatedAcetophenones Studied by Two MassSpectrometric Techniques. Org. MassSpectrom. 1993, 28, 1107-1110.
103. McMahon, T.B. Thermochemical Ladders:Scaling the Ramparts of Gaseous Ion En-ergetics. Int. J. Mass Spectrom. 2000, 200,187-199.
104. Cooks, R.G.; Kruger, T.L. Intrinsic Basic-ity Determination Using Metastable Ions.J. Am. Chem. Soc. 1977, 99, 1279-1281.
105. Cooks, R.G.; Wong, P.S.H. KineticMethod of Making Thermochemical De-terminations: Advances and Applications.Acc. Chem. Res. 1998, 31, 379-386.
106. Cooks, R.G.; Patrick, J.S.; Kotiaho, T.;McLuckey, S.A. Thermochemical Deter-minations by the Kinetic Method. MassSpectrom. Rev. 1994, 13, 287-339.
107. Bouchoux, G.; Salpin, J.Y. Gas-Phase Ba-sicity and Heat of Formation of SulfineCH2=S=O. J. Am. Chem. Soc. 1996, 118,6516-6517.
108. Bouchoux, G.; Salpin, J.Y.; Leblanc, D. ARelationship Between the Kinetics andThermochemistry of Proton Transfer Re-

Reference List 65
actions in the Gas Phase. Int. J. MassSpectrom. Ion Proc. 1996, 153, 37-48.
109. Witt, M.; Kreft, D.; Grützmacher, H.-F.Effects of Internal Hydrogen Bonds Be-tween Amide Groups: Protonation of Ali-cyclic Diamides. Eur. J. Mass Spectrom.2003, 9, 81-95.
110. Lias, S.G.; Bartmess, J.E.; Liebman, J.F.;Holmes, J.L.; Levin, R.D.; Mallard, W.G.Gas-Phase Ion and Neutral Thermochem-istry. J. Phys. Chem. Ref. Data 1988, 17,Supplement 1, 861 pp.
111. Tandem Mass Spectrometry; McLafferty,F.W., editor; John Wiley & Sons: NewYork, 1983.
112. Busch, K.L.; Glish, G.L.; McLuckey, S.A.Mass Spectrometry/Mass Spectrometry;Wiley VCH: New York, 1988.
113. McLafferty, F.W.; Bente, P.F.I.; Kornfeld,R.; Tsai, S.-C.; Howe, I. Collisional Acti-vation Spectra of Organic Ions. J. Am.Chem. Soc. 1973, 95, 2120-2129.
114. Levsen, K.; Schwarz, H. Collisional Acti-vation MS - a New Probe for StructureDetermination of Ions in the GaseousPhase. Angew. Chem. 1976, 88, 589-601.
115. Levsen, K.; Schwarz, H. Gas-PhaseChemistry of Collisionally Activated Ions.Mass Spectrom. Rev. 1983, 2, 77-148.
116. Bordas-Nagy, J.; Jennings, K.R. Collision-Induced Decomposition of Ions. Int. J.Mass Spectrom. Ion Proc. 1990, 100, 105-131.
117. McLuckey, S.A. Principles of CollisionalActivation in Analytical MS. J. Am. Chem.Soc. Mass Spectrom. 1992, 3, 599-614.
118. Shukla, A.K.; Futrell, J.H. Tandem MassSpectrometry: Dissociation of Ions byCollisional Activation. J. Mass Spectrom.2000, 35, 1069-1090.
119. Guevremont, R.; Boyd, R.K. Are DerrickShifts Real? An Investigation by TandemMS. Rapid. Commun. Mass Spectrom.1988, 2, 1-5.
120. Bradley, C.D.; Derrick, P.J. CID of Pep-tides. An Investigation into the Effect ofCollision Gas Pressure on TranslationalEnergy Losses. Org. Mass Spectrom.1991, 26, 395-401.
121. Bradley, C.D.; Derrick, P.J. CID of LargeOrganic Ions and Inorganic Cluster Ions.Effects of Pressure on Energy Losses.Org. Mass Spectrom. 1993, 28, 390-394.
122. Neumann, G.M.; Sheil, M.M.; Derrick,P.J. CID of Multiatomic Ions. Z. Natur-forsch. 1984, 39A, 584-592.
123. Alexander, A.J.; Thibault, P.; Boyd, R.K.Target Gas Excitation in CID: a Reinves-tigation of Energy Loss in CA of Molecu-lar Ions of Chlorophyll-a. J. Am. Chem.Soc. 1990, 112, 2484-2491.
124. Kim, B.J.; Kim, M.S. Peak Shape Analysisfor CID-MIKES. Int. J. Mass Spectrom.Ion Proc. 1990, 98, 193-207.
125. Vékey, K.; Czira, G. Translational EnergyLoss and Scattering in CID Processes.Org. Mass Spectrom. 1993, 28, 546-551.
126. Wysocki, V.H.; Kenttämaa, H.; Cooks,R.G. Internal Energy Distributions of Iso-lated Ions After Activation by VariousMethods. Int. J. Mass Spectrom. Ion Proc.1987, 75, 181-208.
127. Bradley, C.D.; Curtis, J.M.; Derrick, P.J.;Wright, B. Tandem MS of Peptides Usinga Magnetic Sector/Quadrupole Hybrid-theCase for Higher Collision Energy andHigher Radio-Frequency Power. Anal.Chem. 1992, 64, 2628-2635.
128. Mabud, Md.A.; Dekrey, M.J.; Cooks, R.G.SID of Molecular Ions. Int. J. Mass Spec-trom. Ion Proc. 1985, 67, 285-294.
129. Bier, M.E.; Amy, J.W.; Cooks, R.G.;Syka, J.E.P.; Ceja, P.; Stafford, G. A Tan-dem Quadrupole Mass Spectrometer forthe Study of SID. Int. J. Mass Spectrom.Ion Proc. 1987, 77, 31-47.
130. Wysocki, V.H.; Ding, J.-M.; Jones, J.L.;Callahan, J.H.; King, F.L. SID in TandemQuadrupole Mass Spectrometers: a Com-parison of Three Designs. J. Am. Chem.Soc. Mass Spectrom. 1992, 3, 27-32.
131. Dongré, A.R.; Somogyi, A.; Wysocki,V.H. SID: an Effective Tool to ProbeStructure, Energetics and FragmentationMechanisms of Protonated Peptides. J.Mass Spectrom. 1996, 31, 339-350.
132. Lammert, S.A.; Cooks, R.G. SID of Mo-lecular Ions in a Quadrupole Ion TrapMass Spectrometer. J. Am. Chem. Soc.Mass Spectrom. 1991, 2, 487-491.
133. Woodin, R.L.; Bomse, D.S.; Beauchamp,J.L. Multiphoton Dissociation of Mole-cules With Low Power Continuous WaveInfrared Laser Radiation. J. Am. Chem.Soc. 1978, 100, 3248-3250.
134. Håkansson, K.; Cooper, H.J.; Emmet,M.R.; Costello, C.E.; Marshall, A.G.;Nilsson, C.L. ECD and IRMP MS/MS ofan N-Glycosylated Tryptic Peptic to YieldComplementary Sequence Information.Anal. Chem. 2001, 73, 4530-4536.
135. Little, D.P.; Senko, M.W.; O'Conner, P.B.;McLafferty, F.W. IRMPD of Multiply-

66 2 Gas Phase Ion Chemistry
Charged Ions for Biomolecule Sequenc-ing. Anal. Chem. 1994, 66, 2809-2815.
136. Watson, C.H.; Baykut, G.; Eyler, J.R. La-ser Photodissociation of Gaseous IonsFormed by Laser Desorption. Anal. Chem.1987, 59, 1133-1138.
137. Zubarev, R.A.; Kelleher, N.L.; McLaf-ferty, F.W. ECD of Multiply ChargedProtein Cations. A Nonergodic Process. J.Am. Chem. Soc. 1998, 120, 3265-3266.
138. Axelsson, J.; Palmblad, M.; Håkansson,K.; Håkansson, P. ECD of Substance PUsing a Commercially Available FT-ICRMass Spectrometer. Rapid. Commun.Mass Spectrom. 1999, 13, 474-477.
139. Cerda, B.A.; Horn, D.M.; Breuker, K.;Carpenter, B.K.; McLafferty, F.W. Elec-tron Capture Dissociation of Multiply-Charged Oxygenated Cations. A Noner-godic Process. Eur. Mass Spectrom. 1999,5, 335-338.
140. Håkansson, K.; Emmet, M.R.; Hendrick-son, C.L.; Marshall, A.G. High-SensitivityECD Tandem FT-ICR-MS of Microelec-trosprayed Peptides. Anal. Chem. 2001,73, 3605-3610.
141. Leymarie, N.; Berg, E.A.; McComb, M.E.;O'Conner, P.B.; Grogan, J.; Oppenheim,F.G.; Costello, C.E. Tandem MS forStructural Characterization of Proline-RichProteins: Application to Salivary PRP-3.Anal. Chem. 2002, 74, 4124-4132.
142. Danis, P.O.; Wesdemiotis, C.; McLafferty,F.W. Neutralization-Reionization MassSpectrometry (NRMS). J. Am. Chem. Soc.1983, 105, 7454-7456.
143. Gellene, G.I.; Porter, R.F. Neutralized Ion-Beam Spectroscopy. Acc. Chem. Res.1983, 16, 200-207.
144. Terlouw, J.K.; Kieskamp, W.M.; Holmes,J.L.; Mommers, A.A.; Burgers, P.C. TheNeutralization and Reionization of Mass-Selected Positive Ions by Inert Gas Atoms.Int. J. Mass Spectrom. Ion Proc. 1985, 64,245-250.
145. Holmes, J.L.; Mommers, A.A.; Terlouw,J.K.; Hop, C.E.C.A. The Mass Spec-trometry of Neutral Species ProducedFrom Mass-Selected Ions by Collision andby Charge Exchange. Experiments WithTandem Collision Gas Cells. Int. J. MassSpectrom. Ion Proc. 1986, 68, 249-264.
146. Blanchette, M.C.; Holmes, J.L.; Hop,C.E.C.A.; Mommers, A.A. The Ionizationof Fast Neutrals by EI in the 2.FFR of aMass Spectrometer of Reversed Geometry.Org. Mass Spectrom. 1988, 23, 495-498.
147. McLafferty, F.W. Neutralization-Re-ionization MS. Int. J. Mass Spectrom. IonProc. 1992, 118/119, 221-235.
148. Blanchette, M.C.; Bordas-Nagy, J.;Holmes, J.L.; Hop, C.E.C.A.; Mommers,A.A.; Terlouw, J.K. NR-MS; a SimpleMetal Vapor Cell for VG ZAB-2F MassSpectrometers. Org. Mass Spectrom. 1988,23, 804-807.
149. Zang, M.Y.; McLafferty, F.W. OrganicNeutralization Agents for NR-MS. J. Am.Chem. Soc. Mass Spectrom. 1992, 3, 108-112.
150. Zhang, M.-Y.; McLafferty, F.W. Quanti-tative Analysis of Isomeric Ion Mixtures.Org. Mass Spectrom. 1992, 27, 991-994.
151. Zagorevskii, D.V.; Holmes, J.L. NR-MSApplied to Organometallic and Coordina-tion Chemistry. Mass Spectrom. Rev.1994, 13, 133-154.
152. Zagorevskii, D.V.; Holmes, J.L. NR-MSApplied to Organometallic and Coordina-tion Chemistry (Update: 1994-1998). MassSpectrom. Rev. 1999, 18, 87-118.
153. Weiske, T.; Wong, T.; Krätschmer, W.;Terlouw, J.K.; Schwarz, H. Proof of theExistence of an He@C60 Structure ViaGas-Phase Neutralization of [HeC60]+.
Angew. Chem., Int. Ed. 1992, 31, 183-185.154. Keck, H.; Kuchen, W.; Tommes, P.; Ter-
louw, J.K.; Wong, T. The PhosphoniumYlide CH2PH3 Is Stable in Gas Phase.Angew. Chem. , Int. Ed. 1992, 31, 86-87.
155. Schröder, D.; Schwarz, H.; Wulf, M.;Sievers, H.; Jutzi, P.; Reiher, M. Evidencefor the Existence of Neutral P6: A NewAllotrope of Phosphorus. Angew. Chem. ,Int. Ed. 1999, 38, 313-315.
156. Adlhart, C.; Hinderling, C.; Baumann, H.;Chen, P. Mechanistic Studies of OlefinMetathesis by Ruthenium Carbene Com-plexes Using ESI-MS/MS. J. Am. Chem.Soc. 2000, 122, 8204-8214.
157. Hinderling, C.; Adlhart, C.; Chen, P.Mechanism-Based High-ThroughputScreening of Catalysts. Chimia 2000, 54,232-235.
158. Volland, M.A.O.; Adlhart, C.; Kiener,C.A.; Chen, P.; Hofmann, P. CatalystScreening by ESI-MS/MS: Hofmann Car-benes for Olefin Metathesis. Chem. Eur. J.2001, 7, 4621-4632.

3 Isotopes
Mass spectrometry is based upon the separation of charged ionic species by theirmass-to-charge ratio, m/z. Within the general chemical context however, we arenot used to taking into concern the isotopes of the elemental species involved in areaction. The molecular mass of tribromomethane, CHBr3, would therefore be cal-culated to 252.73 g mol–1 using the relative atomic masses of the elements aslisted in most periodic tables. In mass spectrometry we have to leave this custombehind. Because the mass spectrometer does not separate by elements but by iso-topic mass, there is no signal at m/z 252.73 in the mass spectrum of tribromometh-ane. Instead, major peaks are present at m/z 250, 252, 254 and 256 accompaniedby some minor others.
In order to successfully interpret a mass spectrum, we have to know about theisotopic masses and their relation to the atomic weights of the elements, aboutisotopic abundances and the isotopic patterns resulting therefrom and finally,about high-resolution and accurate mass measurements. These issues are closelyrelated to each other, offer a wealth of analytical information, and are valid for anytype of mass spectrometer and any ionization method employed. (The kinetic as-pect of isotopic substitution are discussed in Chap. 2.9.)
3.1 Isotopic Classification of the Elements
An element is specified by the number of protons in its nucleus. This equals theatomic number of the respective element, and thus determines its place within theperiodic table of the elements. The atomic number is given as a subscript preced-ing the elemental symbol, e.g., 6C in case of carbon. Atoms with nuclei of thesame atomic number differing in the number of neutrons are termed isotopes. Oneisotope differs from another isotope of the same element in that it possesses a dif-ferent number of neutrons, i.e., by the mass number or nucleon number. The massnumber m is the sum of the total number of protons and neutrons in an atom,molecule, or ion. [1] The mass number of an isotope is given as superscript pre-ceding the elemental symbol, e.g., 12C.
Note: The mass number must not be confused with the atomic number of anelement. For the heavier atoms there can be isotopes of the same mass numberbelonging to different elements, e.g., the most abundant isotopes of both 18Arand 20Ca have mass number 40.
68 3 Isotopes
3.1.1. Monoisotopic Elements
Some elements do exist in only one naturally occurring stable isotope, and there-fore, they are termed monoisotopic elements. Among these, fluorine (19F), sodium(23Na), phosphorus (31P) and iodine (127I) belong to the more prominent examplesin organic mass spectrometry, but there are several more such as beryllium (9Be),aluminum (27Al), scandium (45Sc), manganese (55Mn), cobalt (59Co), arsenic(75As), yttrium (89Y), niobium (93Nb), rhodium (103Rh), cesium (133Cs), gold(197Au) and some heavier transition metals, too. The monoisotopic elements arealso referred to as A or X elements (see below). [2,3]
3.1.2 Di-isotopic Elements
Several elements naturally exist in two isotopes. Within the context of mass spec-trometry it is useful to deal with them as a class of their own. Nevertheless, theterm di-isotopic element is not an official one. These elements can even be sub-classified into those having one isotope that is 1 u heavier than the most abundantisotope and those having one isotope that is 2 u heavier than the most abundantisotope. (For the unit u cf. Chap. 3.1.4.2). The first group has been termed A+1 orX+1 elements, the latter ones have been termed A+2 or X+2 elements, respec-tively. [2,3] If we do not restrict our view to the elements typically encountered inorganic mass spectrometry, the class of X–1 elements with one minor isotope of1 u lower mass than the most abundant one should be added.
3.1.2.1 X+1 Elements
Prominent examples of X+1 elements are hydrogen (1H, 2H D), carbon (12C,13C) and nitrogen (14N, 15N). Deuterium (D) is of low abundance (0.0115 %) andtherefore, hydrogen is usually treated as monoisotopic or X element, which is avalid approximation, even if a hundred hydrogens are contained in a molecule.
3.1.2.2 X+2 Elements
Among the X+2 elements, chlorine (35Cl, 37Cl) and bromine (79Br, 81Br) are com-monly known, but copper (63Cu, 65Cu), gallium (69Ga, 71Ga), silver (107Ag, 109Ag),indium (113In, 115In) and antimony (121Sb, 123Sb) also belong to this group. Eventhough occurring in more than two isotopes, some additional elements such asoxygen, sulfur and silicon, can be regarded as X+2 elements for practical reasons.As long as there are only a few oxygen atoms present in an empirical formula,oxygen might alternatively be treated as an X element, because of the low abun-dances of 17O and 18O.
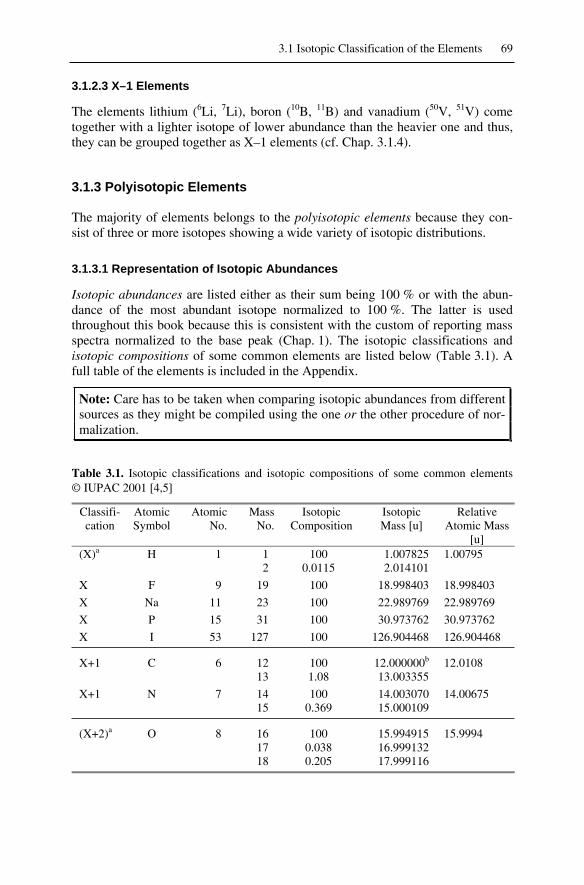
3.1 Isotopic Classification of the Elements 69
3.1.2.3 X–1 Elements
The elements lithium (6Li, 7Li), boron (10B, 11B) and vanadium (50V, 51V) cometogether with a lighter isotope of lower abundance than the heavier one and thus,they can be grouped together as X–1 elements (cf. Chap. 3.1.4).
3.1.3 Polyisotopic Elements
The majority of elements belongs to the polyisotopic elements because they con-sist of three or more isotopes showing a wide variety of isotopic distributions.
3.1.3.1 Representation of Isotopic Abundances
Isotopic abundances are listed either as their sum being 100 % or with the abun-dance of the most abundant isotope normalized to 100 %. The latter is usedthroughout this book because this is consistent with the custom of reporting massspectra normalized to the base peak (Chap. 1). The isotopic classifications andisotopic compositions of some common elements are listed below (Table 3.1). Afull table of the elements is included in the Appendix.
Note: Care has to be taken when comparing isotopic abundances from differentsources as they might be compiled using the one or the other procedure of nor-malization.
Table 3.1. Isotopic classifications and isotopic compositions of some common elements© IUPAC 2001 [4,5]
Classifi-cation
AtomicSymbol
AtomicNo.
MassNo.
IsotopicComposition
IsotopicMass [u]
RelativeAtomic Mass
[u](X)a H 1 1 100 1.007825 1.00795
2 0.0115 2.014101
X F 9 19 100 18.998403 18.998403
X Na 11 23 100 22.989769 22.989769
X P 15 31 100 30.973762 30.973762
X I 53 127 100 126.904468 126.904468
X+1 C 6 12 100 12.000000b 12.010813 1.08 13.003355
X+1 N 7 14 100 14.003070 14.0067515 0.369 15.000109
(X+2)a O 8 16 100 15.994915 15.999417 0.038 16.99913218 0.205 17.999116
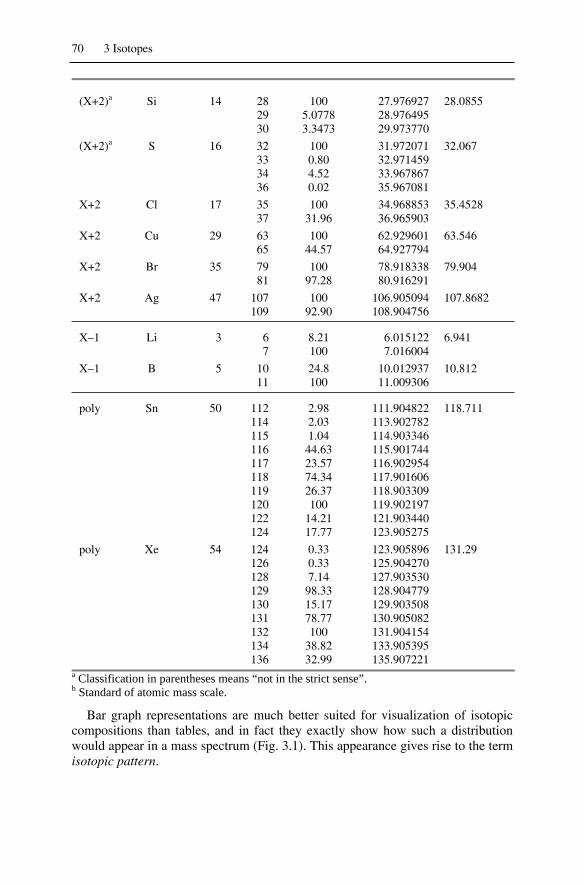
70 3 Isotopes
(X+2)a Si 14 28 100 27.976927 28.085529 5.0778 28.97649530 3.3473 29.973770
(X+2)a S 16 32 100 31.972071 32.06733 0.80 32.97145934 4.52 33.96786736 0.02 35.967081
X+2 Cl 17 35 100 34.968853 35.452837 31.96 36.965903
X+2 Cu 29 63 100 62.929601 63.54665 44.57 64.927794
X+2 Br 35 79 100 78.918338 79.90481 97.28 80.916291
X+2 Ag 47 107 100 106.905094 107.8682109 92.90 108.904756
X–1 Li 3 6 8.21 6.015122 6.9417 100 7.016004
X–1 B 5 10 24.8 10.012937 10.81211 100 11.009306
poly Sn 50 112 2.98 111.904822 118.711114 2.03 113.902782115 1.04 114.903346116 44.63 115.901744117 23.57 116.902954118 74.34 117.901606119 26.37 118.903309120 100 119.902197122 14.21 121.903440124 17.77 123.905275
poly Xe 54 124 0.33 123.905896 131.29126 0.33 125.904270128 7.14 127.903530129 98.33 128.904779130 15.17 129.903508131 78.77 130.905082132 100 131.904154134 38.82 133.905395136 32.99 135.907221
a Classification in parentheses means “not in the strict sense”.b Standard of atomic mass scale.
Bar graph representations are much better suited for visualization of isotopiccompositions than tables, and in fact they exactly show how such a distributionwould appear in a mass spectrum (Fig. 3.1). This appearance gives rise to the termisotopic pattern.

3.1 Isotopic Classification of the Elements 71
Note: Some authors use the term isotopic cluster, which is incorrect, as clusterrefers to an associate of more atoms, molecules or ions of the same species,sometimes associated to one other species, e.g., [Arn]
+•, [(H2O)nH]+, and[I(CsI)n]
– are cluster ions.
Fig. 3.1. Isotopic patterns of chlorine, bromine and xenon. The bar graph representations ofthe isotopic distributions have the same optical appearance as mass spectra.
3.1.4 Calculation of Atomic, Molecular, and Ionic Mass
3.1.4.1 Nominal Mass
In order to calculate the approximate mass of a molecule we are used to summingup integer masses of the elements encountered, e.g., for CO2 we calculate the massby 12 u + 2 16 u = 44 u. The result of this simple procedure is not particularlyprecise but provides acceptable values for simple molecules. This is called nomi-nal mass. [3]
The nominal mass is defined as the integer mass of the most abundant naturallyoccurring stable isotope of an element. [3] The nominal mass of an element is of-ten equal to the integer mass of the lowest mass isotope of that element, e.g., forH, C, N, O, S, Si, P, F, Cl, Br, I (Table 3.1). The nominal mass of an ion is thesum of the nominal masses of the elements in its empirical formula.
Example: To calculate the nominal mass of SnCl2, the masses of 120Sn and 35Clhave to be used, i.e., 120 u + 2 35 u = 190 u. While, the 35Cl isotope representsthe most abundant as well as the lowest mass isotope of chlorine, 120Sn is the mostabundant, but not the lowest mass isotope of tin which is 112Sn.
Note: When dealing with nominal mass, mass number and nominal mass bothhave the same numerical value. However, the mass number is dimensionlessand must not be confused with nominal mass in units of u (below).
3.1.4.2 Isotopic Mass
The isotopic mass is the exact mass of an isotope. It is very close to but not equalto the nominal mass of the isotope (Table 3.1). The only exception is the carbonisotope 12C which has an isotopic mass of 12.000000 u. The unified atomic mass
72 3 Isotopes
[u] is defined as 1/12 of the mass of one atom of nuclide 12C which has been as-signed to 12 u exactly by convention; 1 u = 1.66055 10–27 kg. [1,3,6,7] Thisconvention dates back to 1961. The issue of isotopic mass will be addressed indetail later in this chapter.
Note: Care has to be taken when mass values from dated literature are cited.Prior to 1961 physicists defined the atomic mass unit [amu] based on 1/16 of themass of one atom of nuclide 16O. The definition of chemists was based on therelative atomic mass of oxygen which is somewhat higher resulting from thenuclides 17O and 18O contained in natural oxygen.
3.1.4.3 Relative Atomic Mass
The relative atomic mass or the atomic weight as it is also often impreciselytermed is calculated as the weighted average of the naturally occurring isotopes ofan element. [3]The weighted average Mr is calculated from
i
ii
i
iii
r
A
mAM
1
1
(3.1)
with Ai being the abundances of the isotopes and mi their respective isotopicmasses. [8] For this purpose, the abundances can be used in any numerical form ornormalization as long as they are used consistently.
Example: The relative atomic mass of chlorine is 35.4528 u. However, there isno atom of this mass. Instead, chlorine is composed of 35Cl (34.968853 u) and 37Cl(36.965903 u) making up 75.78 % and 24.22 % of the total or having relativeabundances of 100 % and 31.96 %, respectively (cf. Table 3.1 and Fig 3.1). Ac-cording to Eq. 3.1, we can now calculate the relative atomic mass of chlorineMr = (100 34.968853 u + 31.96 36.965903 u)/(100 + 31.96) = 35.4528 u.
Note: The assumption of a 13C content of 1.1 % which is equal to a 13C/12C ra-tio of 0.0111 for carbon has proven to be useful for most mass-spectrometricapplications.
3.1.4.4 Monoisotopic Mass
The exact mass of the most abundant isotope of an element is termed monoiso-topic mass. [3] The monoisotopic mass of a molecule is the sum of the monoiso-topic masses of the elements in its empirical formula. As mentioned before, themonoisotopic mass is not necessarily the naturally occurring isotope of lowestmass. However, for the common elements in organic mass spectrometry themonoisotopic mass is obtained using the mass of the lowest mass isotope of that

3.1 Isotopic Classification of the Elements 73
element, because this is also the most abundant isotope of the respective element(Chap. 3.1.4.1).
3.1.4.5 Relative Molecular Mass
The relative molecular mass, Mr, or molecular weight is calculated from the rela-tive atomic masses of the elements contributing to the empirical formula. [3]
3.1.4.6 Exact Ionic Mass
The exact mass of a positive ion formed by the removal of one or more electronsfrom a molecule is equal to its monoisotopic mass minus the mass of the elec-tron(s), me. [1] For negative ions, the electron mass (0.000548 u) has to be addedaccordingly.
Example: The exact mass of the carbon dioxide molecular ion, CO2+•, is cal-
culated as 12.000000 u + 2 15.994915 u – 0.000548 u = 43.989282 u.
3.1.5 Natural Variations in Relative Atomic Mass
The masses of isotopes can be measured with accuracies better than parts per bil-lion (ppb), e.g., m40Ar = 39.9623831235 ± 0.000000005 u. Unfortunately, determi-nations of abundance ratios are less accurate, causing errors of several parts permillion (ppm) in relative atomic mass. The real limiting factor, however, comesfrom the variation of isotopic abundances from natural samples, e.g., in case oflead which is the final product of radioactive decay of uranium, the atomic weightvaries by 500 ppm depending on the Pb/U ratios in the lead ore. [8]
For organic mass spectrometry the case of carbon is of much greater impor-tance. Carbon is ubiquitous in metabolic processes and the most prominent exam-ple of variations in the 13C/12C isotopic ratio is presented by the different pathwaysof CO2 fixation during photosynthesis, causing 13C/12C ratios of 0.01085–0.01115.Petroleum, coal and natural gas yield very low 13C/12C ratios of 0.01068–0.01099and carbonate minerals on the other side define the upper limit at about 0.01125.[8] Even proteins of different origin (plants, fish, mammals) can be distinguishedby their 13C/12C ratios. [9]
Isotope ratio mass spectrometry (IR-MS) makes use of these facts to determinethe origin or the age of a sample. For convenience, the minor changes in isotopicratios are expressed using the delta notation stating the deviation of the isotopicratio from a defined standard in parts per thousand (‰). [8,10] The delta value ofcarbon, for example, is calculated from
13C (‰) = [(13C/12Csample)/(13C/12Cstandard) – 1] 1000 (3.2)
The internationally accepted value for 13C/12Cstandard is 0.0112372 from abelemnite fossil from the Pee Dee formation in South Carolina (PDB standard).Naturally occurring 13C/12C ratios range from about 13C = –50 to +5 ‰.

74 3 Isotopes
3.2 Calculation of Isotopic Distributions
As long as we are dealing with molecular masses in a range up to some 103 u, it ispossible to separate ions which differ by 1 u in mass. The upper mass limit fortheir separation depends on the resolution of the instrument employed. Conse-quently, the isotopic composition of the analyte is directly reflected in the massspectrum.
Even if the analyte is chemically perfectly pure it represents a mixture of dif-ferent isotopic compositions, provided it is not composed of monoisotopic ele-ments only. Therefore, a mass spectrum is normally composed of superimposi-tions of the mass spectra of all isotopic species involved. [11] The isotopicdistribution or isotopic pattern of molecules containing one chlorine or bromineatom is listed in Table 3.1. But what about molecules containing two or more di-isotopic or even polyisotopic elements? While it may seem, at the first glance, tocomplicate the interpretation of mass spectra, isotopic patterns are in fact an idealsource of analytical information.
3.2.1 X+1 Element Carbon
In the mass spectrum of methane (Fig. 1.2), there is a tiny peak at m/z 17 that hasnot been mentioned in the introduction. As one can infer from Table 3.1 thisshould result from the 13C content of natural carbon which belongs to the X+1elements in our classification.
Example: Imagine a total of 1000 CH4 molecules. Due to a content of 1.1 %13C, there will be 11 molecules containing 13C instead of 12C; the remaining 989molecules have the composition 12CH4. Therefore, the ratio of relative intensitiesof the peaks at m/z 16 and m/z 17 is defined by the ratio 989/11 or after the usualnormalization by 100/1.1.
In a more general way, carbon consists of 13C and 12C in a ratio r that can beformulated as r = c/(100 – c) where c is the abundance of 13C. Then, the probabil-ity to have only 12C in a molecular ion M consisting of w carbons, i.e., the prob-ability of monoisotopic ions PM is given by [12]
w
McP
100100 (3.3)
The probability of having exactly one 13C atom in an ion with w carbon atomsis therefore
w
Mc
ccwP
100100
1001
(3.4)
and the ratio PM+1/PM is given as

3.2 Calculation of Isotopic Distributions 75
ccw
PP
M
M
1001 (3.5)
In case of a carbon-only molecule such as the buckminster fullerene C60, theratio PM+1/PM becomes 60 1.1/98.9 = 0.667. If the monoisotopic peak at m/z 720due to 12C60 is assigned 100 %, the M+1 peak due to 12C59
13C will have 66.7 %relative intensity.
Note: As mentioned above, the exact abundances depend on the actual 13C/12Cratio. Without causing significant error, we can estimate the M+1 peak intensityin percent in a simplified manner by multiplying the number of carbon atomsby 1.1 %, e.g., 60 1.1 % = 66 %.
There is again a certain probability for one of the remaining 59 carbon atoms tobe 13C instead of 12C. After simplification of Beynon's approach [12] to be usedfor one atomic species only, the probability that there will be an ion containingtwo 13C atoms is expressed by
2
22
10021
1001
1002 ccww
ccw
ccw
PP
M
M(3.6)
For C60 the ratio PM+2/PM now becomes (60 59 1.12)/(2 98.92) = 0.219,i.e., the M+2 peak at m/z 722 due to 12C58
13C2 ions will have 21.9 % relative to theM peak, which definitely can not be neglected. By extension of the equation, thePM+3/PM ratio for the third isotopic peak becomes
3
3
3
100621
)1002
1001
1006
ccwww
ccw
ccw
ccw
PP
M
M(3.7)
The relative abundances obtained from Eq. 3.7 by using 1.1 % for the 13C con-tent are in good agreement with those tabulated, e.g., for the 12C57
13C3 ion atm/z 723 we obtain PM+3/PM = (60 59 58 1.13)/(6 98.93) = 0.047 (Table 3.2and Fig. 3.2). This tells us that the isotopic peaks due to 13C do contribute signifi-cantly to the appearance of a mass spectrum, if the number of carbon atoms in amolecule is not very small.
The calculation of isotopic patterns as just shown for the carbon-only moleculeC60 can be done analogously for any X+1 element. Furthermore, the application ofthis scheme is not restricted to molecular ions, but can also be used for fragmentions. Nevertheless, care has be taken to assure that the presumed isotopic peak isnot partially or even completely due to a different fragment ion, e.g., an ion con-taining one hydrogen more than the presumed X+1 composition.
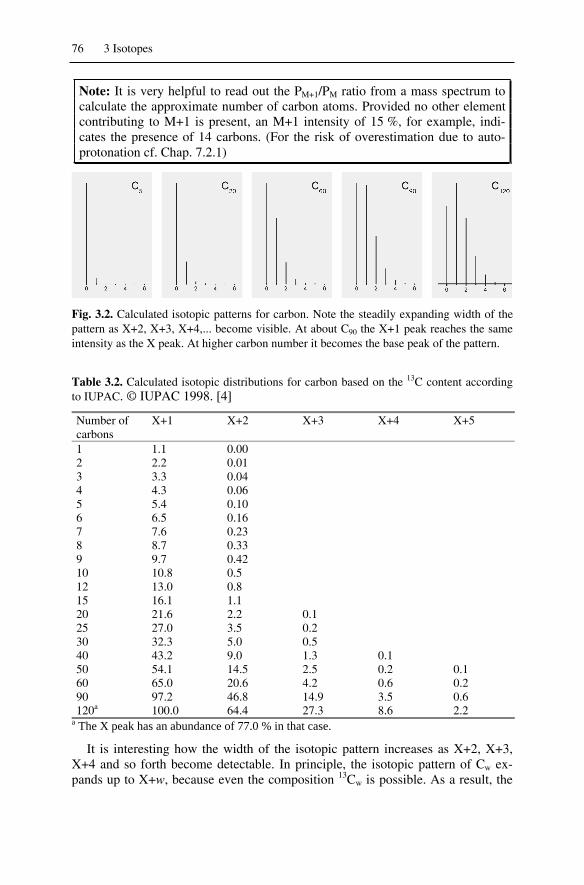
76 3 Isotopes
Note: It is very helpful to read out the PM+1/PM ratio from a mass spectrum tocalculate the approximate number of carbon atoms. Provided no other elementcontributing to M+1 is present, an M+1 intensity of 15 %, for example, indi-cates the presence of 14 carbons. (For the risk of overestimation due to auto-protonation cf. Chap. 7.2.1)
Fig. 3.2. Calculated isotopic patterns for carbon. Note the steadily expanding width of thepattern as X+2, X+3, X+4,... become visible. At about C90 the X+1 peak reaches the sameintensity as the X peak. At higher carbon number it becomes the base peak of the pattern.
Table 3.2. Calculated isotopic distributions for carbon based on the 13C content accordingto IUPAC. © IUPAC 1998. [4]
Number ofcarbons
X+1 X+2 X+3 X+4 X+5
1 1.1 0.002 2.2 0.013 3.3 0.044 4.3 0.065 5.4 0.106 6.5 0.167 7.6 0.238 8.7 0.339 9.7 0.4210 10.8 0.512 13.0 0.815 16.1 1.120 21.6 2.2 0.125 27.0 3.5 0.230 32.3 5.0 0.540 43.2 9.0 1.3 0.150 54.1 14.5 2.5 0.2 0.160 65.0 20.6 4.2 0.6 0.290 97.2 46.8 14.9 3.5 0.6120a 100.0 64.4 27.3 8.6 2.2
a The X peak has an abundance of 77.0 % in that case.
It is interesting how the width of the isotopic pattern increases as X+2, X+3,X+4 and so forth become detectable. In principle, the isotopic pattern of Cw ex-pands up to X+w, because even the composition 13Cw is possible. As a result, the

3.2 Calculation of Isotopic Distributions 77
isotopic pattern of w atoms of a di-isotopic element consists at least theoreticallyof w+1 peaks. However, the probability for the extreme combinations is negligibleand even somewhat more probable combinations are of no importance as longthey are below about 0.1 %. In practice, the interpretation of the carbon isotopicpattern is limited by experimental errors in relative intensities rather than by de-tection limits for peaks of low intensity. Such experimental errors can be due topoor signal-to-noise ratios (Chap. 5.2.2.3), autoprotonation (Chap.7) or interfer-ence with other peaks.
At about C90 the X+1 peak reaches the same intensity as the X peak and athigher carbon number w, it becomes the base peak of the pattern, because theprobability that an ion contains at least one 13C becomes larger than that for themonoisotopic ion. A further increase in w makes the X+2 signal stronger than theX and X+1 peak and so on.
3.2.1.1 Isotopic Molecular Ion
The isotopic molecular ion is a molecular ion containing one or more of the lessabundant naturally occurring isotopes of the atoms that make up the molecularstructure. [1] This term can be generalized for any non-monoisotopic ion. Thus,isotopic ions are those ions containing one or more of the less abundant naturallyoccurring isotopes of the atoms that make up the ion.
3.2.1.2 Most Abundant Mass
The position of the most intensive peak of an isotopic pattern is termed mostabundant mass. [3] For example, the most abundant mass in case of C120 is 1441 ucorresponding to M+1 (Fig. 3.2). The most abundant mass is of high relevance iflarge ions are concerned (Chap. 3.4.3).
3.2.2 Binomial Approach
The above stepwise treatment of X+1, X+2 and X+3 peaks has the advantage thatit can be followed easier, but it bears the disadvantage that an equation needs to besolved for each individual peak. Alternatively, one can calculate the relative abun-dances of the isotopic species for a di-isotopic element from a binomial expres-sion. [2,13,14] In the term (a + b)n the isotopic abundances of both isotopes aregiven as a and b, respectively, and n is the number of this species in the molecule.
...!3/21
!2/133
221
bannn
bannbnaaban
nnnn (3.8)
For n = 1 the isotopic distribution can of course be directly obtained from theisotopic abundance table (Table 3.1 and Fig. 3.1) and in case of n = 2, 3 or 4 theexpression can easily be solved by simple multiplication, e.g.,

78 3 Isotopes
4322344
32233
222
464
33
2
babbabaaba
babbaaba
bababa (3.9)
Again, we obtain w+1 terms for the isotopic pattern of w atoms. The binomialapproach works for any di-isotopic element, regardless of whether it belongs toX+1, X+2 or X–1 type. However, as the number of atoms increases above 4 it isalso no longer suitable for manual calculations.
3.2.3 Halogens
The halogens Cl and Br occur in two isotopic forms, each of them being of sig-nificant abundance, whereas F and I are monoisotopic (Table 3.1). In most casesthere are only a few Cl and/or Br atoms contained in a molecule and this predesti-nates the binomial approach for this purpose.
Example: The isotopic pattern of Cl2 is calculated from Eq. 3.9 with the abun-dances a = 100 and b = 31.96 as (100 + 31.96)2 = 10000 + 6392 + 1019. Afternormalization we obtain 100 : 63.9 : 10.2 as the relative intensities of the threepeaks. Any other normalization for the isotopic abundances would give the sameresult, e.g., a = 0.7578, b = 0.2422. The calculated isotopic pattern of Cl2 can beunderstood from the following practical consideration: The two isotopes 35Cl and37Cl can be combined in three different ways: i) 35Cl2 giving rise to the monoiso-topic composition, ii) 35Cl37Cl yielding the first isotopic peak which is here X+2,and finally iii) 37Cl2 giving the second isotopic peak X+4. The combinations witha higher number of chlorine atoms can be explained accordingly.
It proves helpful to have the more frequently found isotopic distributions athand. For some Clx, Bry and ClxBry combinations these are tabulated in the Ap-pendix. Tables are useful for the construction of isotopic patterns from “buildingblocks”. Nevertheless, as visual information is easier to compare with a plottedspectrum these patterns are also shown below (Fig. 3.3). In case of Cl and Br thepeaks are always separated from each other by 2 u, i.e., the isotopic peaks are lo-cated at X+2, 4, 6 and so on.
If there are two bromine or four chlorine atoms contained in the empirical for-mula, the isotopic peaks become more intensive than the monoisotopic peak, be-cause the second isotope is of much higher abundance than in case of the 13C iso-tope.
Note: For a rapid estimation of the isotopic patterns of chlorine and brominethe approximate isotope ratios 35Cl/37Cl = 3 : 1 and 79Br/81Br = 1 : 1 yield goodresults. Visual comparison to calculated patterns is also well suited (Fig. 3.3).

3.2 Calculation of Isotopic Distributions 79
For halogens theisotopic peaksare separated by2 u.
Fig. 3.3. Calculated isotopic patterns for combinations of bromine and chlorine. The peakshown at zero position corresponds to the monoisotopic ion at m/z X. The isotopic peaksare then located at m/z = X+2, 4, 6, ... The numerical value of X is given by the mass num-ber of the monoisotopic combination, e.g., 70 u for Cl2.
3.2.4 Combinations of Carbon and Halogens
So far we have treated the X+1 and the X+2 elements separately, which is not howthey are encountered in most analytes. The combination of C, H, N and O with thehalogens F, Cl, Br and I covers a large fraction of the molecules one usually has todeal with. When regarding H, O and N as X elements, which is a valid approxi-mation for not too large molecules, the construction of isotopic patterns can beconveniently accomplished. By use of the isotopic abundance tables of the ele-ments or of tables of frequent combinations of these as provided in this chapter or

80 3 Isotopes
in the Appendix, the building blocks can be combined to obtain more complexisotopic patterns.
Example: Let us construct the isotopic pattern of C9N3Cl3 restricting ourselvesto the isotopic contributions of C and Cl, i.e., with N as an X element. Here, theisotopic pattern of chlorine can be expected to be dominant over that of carbon.First, from the cubic form of Eq. 3.9 the Cl3 pattern is calculated as follows:(0.7578 + 0.2422)3 = 0.435 + 0.417 + 0.133 + 0.014 and after normalization thisbecomes 100 : 95.9 : 30.7 : 3.3. Of course, using the tabulated abundances of theCl3 distribution in the Appendix would be faster. The result is then plotted with2 u distance, beginning at the nominal mass of the monoisotopic ion, i.e.,9 12 u + 3 14 u + 3 35 u = 255 u. The contribution of C9 to the pattern ismainly at X+1 (9.7 %, Table 3.2), whereas its contribution to X+2 (0.4 %) is neg-ligible in this simple estimation and therefore is omitted here. Finally, the X+1contribution of C9 is placed into the gaps of the Cl3 pattern each with 9.7 % rela-tive to the preceding peak of the chlorine isotopic distribution (Fig. 3.4).
Fig. 3.4. The isotopic pattern of C9N3Cl3 as constructed in the example above. The first 13Cisotopic peaks are located between the X+2, 4 and 6 peaks of the dominant Cl3 pattern. Ni-trogen is treated as X element and has been omitted from the peak labels for clarity.
3.2.5 Polynomial Approach
The polynomial approach is the logical expansion of the binomial approach. It isuseful for the calculation of isotopic distributions of polyisotopic elements or forformulas composed of several non-monoisotopic elements. [2,14] In general, theisotopic distribution of a molecule can be described by a product of polynominals
............ 321321321onm cccbbbaaa (3.10)
where a1, a2, a3 etc. represent the individual isotopes of one element, b1, b2, b3
etc. represent those of another and so on until all elements are included. The expo-
3.2 Calculation of Isotopic Distributions 81
nents m, n, o etc. give the number of atoms of these elements as contained in theempirical formula.
Example: According to Eq. 3.10 the complete isotopic distribution of stearicacid trichloromethylester, C19H35O2Cl3, is obtained from the polynomial expres-sion
33735
2181716
3521
191312 ClClOOOHHCC AAAAAAAAA
with Ax representing the relative abundances of the isotopes involved for eachelement. The problem with the calculation of isotopic patterns resides in theenormous number of terms obtained for larger molecules. Even for this simple ex-ample, the number of terms would be (2)19 (2)35 (3)2 (2)3 = 1.297 1018. Thenumber is dramatically reduced if like terms are collected which describe the sameisotopic composition regardless where the isotopes are located in the molecule.However, manual calculations are prone to become tedious if not impractical;computer programs now simplify the process. [15,16]
Note: Mass spectrometers usually are delivered with the software for calculat-ing isotopic distributions. Such programs are also offered as internet-based orshareware solutions. While such software is freely accessible, it is still neces-sary to obtain a thorough understanding of isotopic patterns as a prerequisite forthe interpreting mass spectra.
3.2.6 Oxygen, Silicon and Sulfur
In a strict sense, oxygen, silicon, and sulfur are polyisotopic elements. Oxygenexists as isotopes 16O, 17O and 18O, sulfur as 32S, 33S, 34S and 36S and silicon as28Si, 29Si and 30Si.
For oxygen the abundances of 17O (0.038 %) and 18O (0.205 %) are so low thatthe occurrence of oxygen usually cannot be detected from the isotopic pattern inroutine spectra because the experimental error in relative intensities tends to belarger than the contribution of 18O. Therefore, oxygen is frequently treated as an Xtype element although X+2 would be a more appropriate but practically unusefulclassification. On the other hand, a substantial number of oxygen atoms as in oli-gosaccharides, for example, contributes to the X+2 signal.
Especially in the case of sulfur, the simplification to deal with it as an X+2element can be accepted as long as only a few sulfur atoms are present in a mole-cule. However, the contribution of 0.8 % from 33S to the X+1 is similar to that of13C (1.1 % per atom). If the X+1 peak is used for the estimation of the number ofcarbons present, 33S will cause an overestimation of the number of carbon atomsby roughly one carbon per sulfur.
The problem is more serious in the case of silicon: the 30Si isotope contributes“only” 3.4 % to the X+2 signal, whereas 29Si gives 5.1 % to X+1. Neglecting 29Siwould cause an overestimation of the carbon number by 5 per Si present, which isnot acceptable.

82 3 Isotopes
The isotopic patterns of sulfur and silicon are by far not as prominent as thoseof chlorine and bromine, but as pointed out, their contributions are sufficientlyimportant (Fig. 3.5).
The relevance of oxygen and sulfur isotopic patterns is nicely demonstrated bythe cluster ion series in fast atom bombardment (FAB) spectra of concentrated sul-furic acid, where the comparatively large number of sulfur and oxygen atomsgives rise to distinct isotopic patterns in the mass spectrum (Chap. 9).
Fig. 3.5. Calculated isotopic patterns for combinations of elemental silicon and sulfur. Thepeak shown at zero position corresponds to the monoisotopic ion at m/z X. The isotopicpeaks are then located at m/z = X+1, 2, 3, ...
Note: The preferred procedure to reveal the presence of S and Si in a massspectrum is to examine the X+2 intensity carefully: this signal's intensity willbe too high to be caused by the contribution of 13C2 alone, even if the numberof carbons has been obtained from X+1 without prior subtraction of the S or Sicontribution.
Example: The isotopic pattern related to the elemental composition of ethylpropyl thioether, C5H12S, (Chap. 6.12) is shown below. The contributions of 33Sand 13C to the M+1 and of 34S and 13C2 to the M+2 signal are indicated (Fig. 3.6).If the M+1 peak resulted from 13C alone, it would indicate rather the presence of 6carbon atoms, which in turn would require an M+2 intensity of only 0.1 % insteadof the observed 4.6 %. The introduction of Si to explain the isotopic pattern wouldstill fit the M+2 intensity with comparatively low accuracy. For M+1, the situationwould be quite different. As 29Si alone demands 5.1 % at M+1, there would be noor 1 carbon maximum allowed to explain the observed M+1 intensity.

3.2 Calculation of Isotopic Distributions 83
Fig. 3.6. Calculated isotopic pattern of the molecular ion of ethyl propyl thioether, C5H12Swith the respective contributions of 33S and 13C to the M+1 and of 34S and 13C2 to the M+2signal indicated.
Fig. 3.7. Calculated isotopic pattern of tetrabutyltin, C16H36Sn, with labels to indicate majorisotopic contributions.
3.2.7 Polyisotopic Elements
The treatment of polyisotopic elements does not require other techniques as far ascalculation or construction of isotopic patterns are concerned. However, the ap-pearance of isotopic patterns can differ largely from what has been considered sofar and it is worth mentioning their peculiarities.
Example: The presence or absence of the polyisotopic element tin (Table 3.1)can readily be detected from its characteristic isotopic pattern. In case of tetra-butyltin, C16H36Sn, the lowest mass isotopic composition is 12C16H36
112Sn, 340 u.Due to the 16 carbon atoms, the 13C isotopic abundance is about 17.5 %. This issuperimposed on the isotopic pattern of elemental Sn, which becomes especially
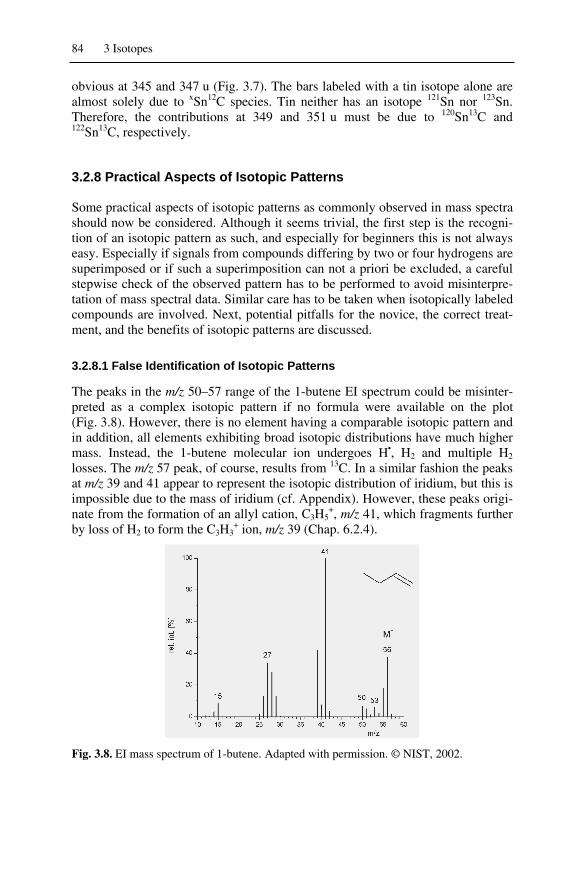
84 3 Isotopes
obvious at 345 and 347 u (Fig. 3.7). The bars labeled with a tin isotope alone arealmost solely due to xSn12C species. Tin neither has an isotope 121Sn nor 123Sn.Therefore, the contributions at 349 and 351 u must be due to 120Sn13C and122Sn13C, respectively.
3.2.8 Practical Aspects of Isotopic Patterns
Some practical aspects of isotopic patterns as commonly observed in mass spectrashould now be considered. Although it seems trivial, the first step is the recogni-tion of an isotopic pattern as such, and especially for beginners this is not alwayseasy. Especially if signals from compounds differing by two or four hydrogens aresuperimposed or if such a superimposition can not a priori be excluded, a carefulstepwise check of the observed pattern has to be performed to avoid misinterpre-tation of mass spectral data. Similar care has to be taken when isotopically labeledcompounds are involved. Next, potential pitfalls for the novice, the correct treat-ment, and the benefits of isotopic patterns are discussed.
3.2.8.1 False Identification of Isotopic Patterns
The peaks in the m/z 50–57 range of the 1-butene EI spectrum could be misinter-preted as a complex isotopic pattern if no formula were available on the plot(Fig. 3.8). However, there is no element having a comparable isotopic pattern andin addition, all elements exhibiting broad isotopic distributions have much highermass. Instead, the 1-butene molecular ion undergoes H•, H2 and multiple H2
losses. The m/z 57 peak, of course, results from 13C. In a similar fashion the peaksat m/z 39 and 41 appear to represent the isotopic distribution of iridium, but this isimpossible due to the mass of iridium (cf. Appendix). However, these peaks origi-nate from the formation of an allyl cation, C3H5
+, m/z 41, which fragments furtherby loss of H2 to form the C3H3
+ ion, m/z 39 (Chap. 6.2.4).
Fig. 3.8. EI mass spectrum of 1-butene. Adapted with permission. © NIST, 2002.

3.2 Calculation of Isotopic Distributions 85
3.2.8.2 Handling of Isotopic Patterns in Mass Spectra
Bearing in mind the knowledge on hydrogen losses, one now could try to fit thisscheme to the EI mass spectrum of tribromomethane (Fig. 3.9). Here, the situationis quite different and almost all we can see is the result of the bromine isotopicdistribution. By referring to Fig. 3.3 one can easily identify the patterns of Br3,Br2, and Br in this spectrum. As a matter of fact, the molecular ion must containthe full number of bromine atoms (m/z 250, 252, 254, 256). The primary fragmention due to Br• loss will then show a Br2 pattern (m/z 171, 173, 175). Subsequentelimination of HBr leads to CBr+ at m/z 91, 93. Alternatively, the molecular ioncan eliminate Br2 to form CHBr+•, m/z 92, 94, overlapping with the m/z 91, 93dublet, or it may loose CHBr to yield Br2
+•, causing the peaks at m/z 158, 160,162. The peaks at m/z 79, 81 are due to Br+ and those at m/z 80, 82 result fromHBr+• formed by CBr2 loss from the molecular ion.
At this point, there is no need to worry about why bromoform behaves like thisupon electron ionization. Instead it is sufficient to accept the occurrence of suchfragments and to focus on the consequences in the appearance of the mass spec-trum (Chap. 6.1.4).
Note: Proof of the identity of isotopic patterns requires careful comparison withthose theoretically expected. Furthermore, the mass differences must be con-sistent with the mass of the presumed neutral loss. In no case can the pattern beobserved in signals corresponding to lower mass than given by the sum of allisotopes included.
Fig. 3.9. EI mass spectrum of tribromomethane. Adapted with permission. © NIST, 2002.
Note: In order to calculate the mass difference between peaks belonging to dif-ferent isotopic patterns it is strongly recommended to proceed from the monoi-sotopic peak of one group to the monoisotopic peak of the next. Accordingly,the mass difference obtained also belongs to the loss of a monoisotopic frag-ment. Otherwise, there is a risk of erroneously omitting or adding hydrogens ina formula.
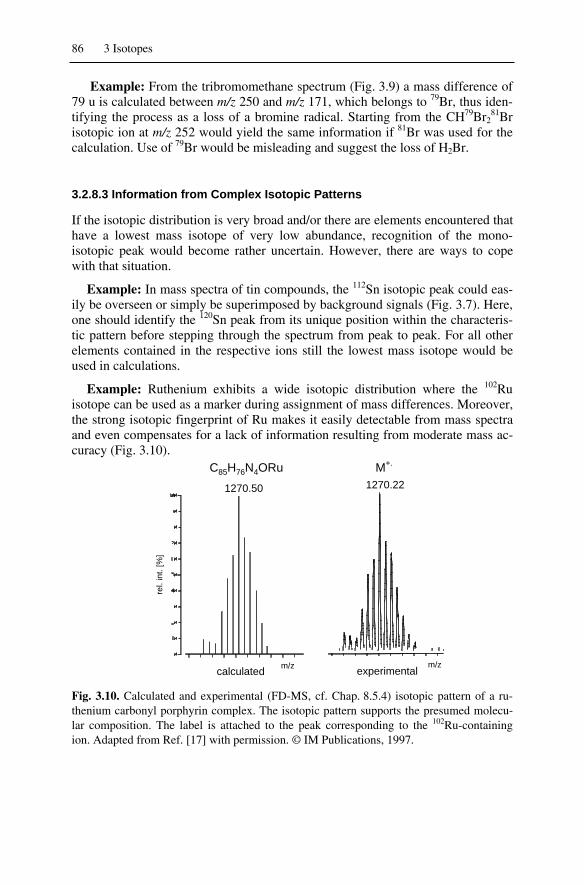
86 3 Isotopes
Example: From the tribromomethane spectrum (Fig. 3.9) a mass difference of79 u is calculated between m/z 250 and m/z 171, which belongs to 79Br, thus iden-tifying the process as a loss of a bromine radical. Starting from the CH79Br2
81Brisotopic ion at m/z 252 would yield the same information if 81Br was used for thecalculation. Use of 79Br would be misleading and suggest the loss of H2Br.
3.2.8.3 Information from Complex Isotopic Patterns
If the isotopic distribution is very broad and/or there are elements encountered thathave a lowest mass isotope of very low abundance, recognition of the mono-isotopic peak would become rather uncertain. However, there are ways to copewith that situation.
Example: In mass spectra of tin compounds, the 112Sn isotopic peak could eas-ily be overseen or simply be superimposed by background signals (Fig. 3.7). Here,one should identify the 120Sn peak from its unique position within the characteris-tic pattern before stepping through the spectrum from peak to peak. For all otherelements contained in the respective ions still the lowest mass isotope would beused in calculations.
Example: Ruthenium exhibits a wide isotopic distribution where the 102Ruisotope can be used as a marker during assignment of mass differences. Moreover,the strong isotopic fingerprint of Ru makes it easily detectable from mass spectraand even compensates for a lack of information resulting from moderate mass ac-curacy (Fig. 3.10).
M+.C85H76N4ORu
calculated experimental
1270.221270.50
rel.
int.
[%]
m/z m/z
Fig. 3.10. Calculated and experimental (FD-MS, cf. Chap. 8.5.4) isotopic pattern of a ru-thenium carbonyl porphyrin complex. The isotopic pattern supports the presumed molecu-lar composition. The label is attached to the peak corresponding to the 102Ru-containingion. Adapted from Ref. [17] with permission. © IM Publications, 1997.

3.2 Calculation of Isotopic Distributions 87
Note: If the isotopic distribution is broad and/or there are elements encounteredthat have a lowest mass isotope of very low abundance, it is recommended tobase calculations on the most abundant isotope of the respective element.
For those preferring monoisotopic spectra, a paper dealing with a least squaresanalysis to simplify multi-isotopic mass spectra is recommended. [18]
3.2.9 Isotopic Enrichment and Isotopic Labeling
3.2.9.1 Isotopic Enrichment
If the abundance of a particular nuclide is increased above the natural level in anion, the term isotopically enriched ion is used to describe any ion enriched in theisotope. [1] The degree of isotopic enrichment is best determined by mass spec-trometry.
Example: Isotopic enrichment is a standard means to enhance the response ofan analyte in nuclear magnetic resonance (NMR). Such measures gain importanceif extremely low solubility is combined with a large number of carbons, as is oftenthe case with [60]fullerene compounds. [19] The molecular ion signals, M+•, ofC60 with natural isotopic abundance and of 13C-enriched C60 are shown below(Fig. 3.11; for EI-MS of [60]fullerenes cf. Refs. [20-22]). From these mass spec-tra, the 13C enrichment can be determined by use of Eq. 3.1. For C60 of naturalisotopic abundance we obtain MrC60 = 60 12.0108 u = 720.65 u. Applying Eq.3.1 to the isotopically enriched compound yields Mr13C-C60 = (35 720 + 65 721+ 98 722 + 100 723 + 99 724 + 93 725 + ...)u/(35 + 65 + 98 + 100 + 99 +93 + ...) = 724.10 u. (Integer mass and intensity values are used here for clarity.)This result is equivalent to an average content of 4.1 13C atoms per [60]fullerenemolecule which on the average means 3.45 13C atoms more than the natural con-tent of 0.65 13C atoms per molecule.
m/z
100
50
rel.
int.
%
0
C60
720
721
722
720
721
722723
725
728
m/z
100
50
rel.
int.
%
0
13C-enriched C60
Fig. 3.11. Comparison of the molecular ion signals, M+•, of [60]fullerene with natural iso-topic abundance and of 13C-enriched C60. By courtesy of W. Krätschmer, Max Planck In-stitute for Nuclear Physics, Heidelberg.

88 3 Isotopes
3.2.9.2 Isotopic Labeling
If the abundance of a particular nuclide is increased above the natural level at oneor more (specific) positions within an ion, the term isotopically labeled ion is usedto describe such an ion. Among other applications, isotopic labeling is used in or-der to track metabolic pathways, to serve as internal standard for quantitativeanalysis, or to elucidate fragmentation mechanisms of ions in the gas phase. Inmass spectrometry, the non-radiating isotopes 2H (deuterium, D) and 13C are pref-erably employed and thus, a rich methodology to incorporate isotopic labels hasbeen developed. [23] Isotopic labeling is rather a mass spectrometric research toolthan mass spectrometry is a tool to control the quality of isotopic labeling. As a re-sult, isotopic labeling is used in many applications and thus many such exampleswill be found throughout the book.
3.3 High-Resolution and Accurate Mass
High-resolution and accurate mass measurements are closely related to each otherbecause the obtainable mass accuracy also depends on sufficiently resolved peaks.Nevertheless, they should not be confused, as performing a measurement at highresolution alone does not equally imply measuring the accurate mass.
Measurements at high resolution are more frequently being used to determineaccurate mass and to identify empirical formulas. While accurate mass measure-ments were limited to electron ionization up to the 1970s and early 1980s, newdevelopments such as high-resolving time-of-flight (TOF) and Fourier transformion cyclotron resonance (FT-ICR) analyzers have made it possible since the late1990s to obtain such information from any ionization method. [24] Nowadays, themore widespread application of such methodologies demand for a thorough under-standing of their potential and limitations.
3.3.1 Exact Mass
As we have already seen, the isotopic mass also is the exact mass of an isotope.The isotopic mass is very close but not equal to the nominal mass of that isotope(Table 3.1). Accordingly, the calculated exact mass of a molecule or of a mono-isotopic ion equals its monoisotopic mass (Chap. 3.1.4). The isotope 12C repre-sents the only exception from non-integer isotopic masses, because the unifiedatomic mass [u] is defined as 1/12 of the mass of one atom of nuclide 12C.
As a consequence of these individual non-integer isotopic masses, almost nocombination of elements in an empirical formula has the same calculated exactmass, or simply exact mass as it is often referred to, as another one. [25] In otherwords, at infinite mass accuracy it is possible to identify the empirical formula bymass spectrometry alone.

3.3 High-Resolution and Accurate Mass 89
Example: the molecular ions of nitrogen, N2+•, carbon monoxide, CO+•, and
ethene, C2H4+•, have the same nominal mass of 28 u, i.e., they are so-called iso-
baric ions. The isotopic masses of the most abundant isotopes of hydrogen, car-bon, nitrogen and oxygen are 1.007825 u, 12.000000 u, 14.003070 u and15.994915 u, respectively. Using these values, the calculated ionic masses are28.00559 u for N2
+•, 27.99437 u for CO+•, and 28.03075 u for C2H4+•. This means
they differ by some “millimass units” (mmu) from each other, and none of theseisobaric ions has precisely 28.00000 u (Chap. 3.3.4 and Chap. 6.9.6).
Terms related to exact mass:• Isobaric ions are ions having the same nominal mass. However, their
exact mass is different. Isomers are (almost) perfect isobars.• For historical reasons, 10–3 u is referred to as 1 millimass unit (mmu).
The use of mmu is widespread because of its convenience in dealing with small differences in mass, although the mmu is not an SI unit.
3.3.2 Deviations from Nominal Mass
As just demonstrated, exact mass values show some deviation from nominal massthat can be on either side, higher or lower, depending on the isotopes encountered.While the matter itself can be easily understood, existing terminology in this spe-cific field is comparatively vague.
Note: Commonly, the term mass defect, defined as the difference between theexact mass and the integer mass, is used to describe this deviation. [3] Applica-tion of this concept leads to positive and negative mass defects, respectively. Inaddition, the association of something being “defective” with certain isotopicmasses can be misleading.
3.3.2.1 Mass Deficiency
The term mass deficiency better describes the fact that the exact mass of an isotopeor a complete molecule is lower than the corresponding nominal mass. In case of16O, for example, the isotopic mass is 15.994915 u, being 5.085 mmu deficient ascompared to the nominal value.
Most isotopes are more or less mass deficient with a tendency towards largermass deficiencies for the heavier isotopes, e.g., M35Cl = 34.96885 u (–31.15 mmu),M79Br = 78.91834 u (–81.66 mmu) and M127I = 129.90447 u (–95.53 mmu). The in-creasing mass deficiency of the heavier isotopes is caused by the increasing nu-clear binding energy as explained by relativistic theory. This is consistent with thefact that the radioactive isotopes of thorium and uranium have isotopic massesabove the nominal value, thus reflecting their comparatively labile nuclei (see Ap-pendix). The numerical values of mass deficiency, however, are merely defined bythe “arbitrary” setting of 12C as the standard in the atomic mass scale.

90 3 Isotopes
3.3.2.2 Mass Sufficiency
Among the elements frequently encountered in mass spectrometry, only the iso-topes of the five elements preceding carbon in the Periodic Table plus nitrogen,i.e., H, He, Li, Be, B and N, exhibit isotopic masses larger than their nominalvalue. Such a negative mass deficiency is sometimes called mass sufficiency.Among the mass-sufficient isotopes, 1H is the most important one, because eachhydrogen adds 7.825 mmu. Thereby, it significantly contributes to the mass oflarger hydrocarbon molecules. In general, the ubiquitous occurrence of hydrogenin empirical formulas of organic molecules causes most of them to exhibit consid-erable mass sufficiency which again decreases with the number of mass-deficientisotopes, e.g., from halogens, oxygen or metals.
Example: If the deviations from nominal mass of different oligomers are plot-ted as a function of nominal mass, only pure carbon molecules as represented byfullerenes are always located on the x-axis. Hydrocarbons have the highest masssufficiency due to the large number of hydrogens causing roughly 1 u added per1000 u in molecular mass. Halogenated oligomers, on the other hand, are more orless mass deficient and those oligomers containing some oxygen are located inbetween (Fig. 3.12).
-0,50
-0,25
0,00
0,25
0,50
0,75
1,00
1,25
1,50
1,75
2,00
2,25
2,50
2,75
3,00
0 500 1000 1500 2000 2500 3000
nominal mass [u]
devi
atio
n fro
m n
omin
al m
ass
[u]
PEnylon-6,6PEGcarbonPTFEPVC
Fig. 3.12. Deviation from nominal mass for some oligomers as a function of nominal mass.PE: polyethylene, PEG: polyethyleneglycol, PTFE: polytetrafluoroethylene, PVC: poly-vinylchloride.
Note: The use of nominal mass is limited to the low mass range. Above about500 u the first decimal of isotopic mass can be larger than .5 causing it to berounded up to 501 u instead of the expected value of 500 u. This will in turnlead to severe misinterpretation of a mass spectrum (Chap. 6).
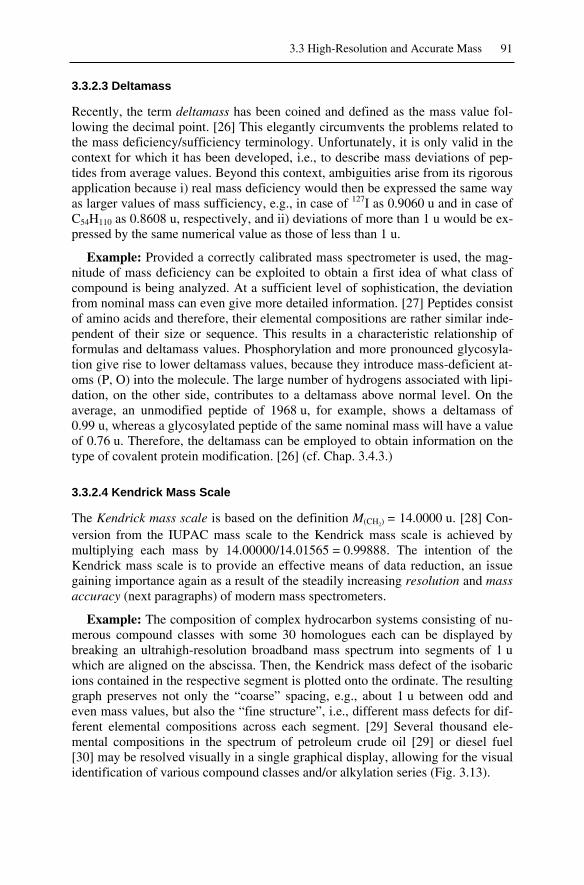
3.3 High-Resolution and Accurate Mass 91
3.3.2.3 Deltamass
Recently, the term deltamass has been coined and defined as the mass value fol-lowing the decimal point. [26] This elegantly circumvents the problems related tothe mass deficiency/sufficiency terminology. Unfortunately, it is only valid in thecontext for which it has been developed, i.e., to describe mass deviations of pep-tides from average values. Beyond this context, ambiguities arise from its rigorousapplication because i) real mass deficiency would then be expressed the same wayas larger values of mass sufficiency, e.g., in case of 127I as 0.9060 u and in case ofC54H110 as 0.8608 u, respectively, and ii) deviations of more than 1 u would be ex-pressed by the same numerical value as those of less than 1 u.
Example: Provided a correctly calibrated mass spectrometer is used, the mag-nitude of mass deficiency can be exploited to obtain a first idea of what class ofcompound is being analyzed. At a sufficient level of sophistication, the deviationfrom nominal mass can even give more detailed information. [27] Peptides consistof amino acids and therefore, their elemental compositions are rather similar inde-pendent of their size or sequence. This results in a characteristic relationship offormulas and deltamass values. Phosphorylation and more pronounced glycosyla-tion give rise to lower deltamass values, because they introduce mass-deficient at-oms (P, O) into the molecule. The large number of hydrogens associated with lipi-dation, on the other side, contributes to a deltamass above normal level. On theaverage, an unmodified peptide of 1968 u, for example, shows a deltamass of0.99 u, whereas a glycosylated peptide of the same nominal mass will have a valueof 0.76 u. Therefore, the deltamass can be employed to obtain information on thetype of covalent protein modification. [26] (cf. Chap. 3.4.3.)
3.3.2.4 Kendrick Mass Scale
The Kendrick mass scale is based on the definition M(CH2) = 14.0000 u. [28] Con-version from the IUPAC mass scale to the Kendrick mass scale is achieved bymultiplying each mass by 14.00000/14.01565 = 0.99888. The intention of theKendrick mass scale is to provide an effective means of data reduction, an issuegaining importance again as a result of the steadily increasing resolution and massaccuracy (next paragraphs) of modern mass spectrometers.
Example: The composition of complex hydrocarbon systems consisting of nu-merous compound classes with some 30 homologues each can be displayed bybreaking an ultrahigh-resolution broadband mass spectrum into segments of 1 uwhich are aligned on the abscissa. Then, the Kendrick mass defect of the isobaricions contained in the respective segment is plotted onto the ordinate. The resultinggraph preserves not only the “coarse” spacing, e.g., about 1 u between odd andeven mass values, but also the “fine structure”, i.e., different mass defects for dif-ferent elemental compositions across each segment. [29] Several thousand ele-mental compositions in the spectrum of petroleum crude oil [29] or diesel fuel[30] may be resolved visually in a single graphical display, allowing for the visualidentification of various compound classes and/or alkylation series (Fig. 3.13).

92 3 Isotopes
Fig. 3.13. Kendrick mass defect versus nominal Kendrick mass for odd-mass 12Cx ions([M–H]– ions). The compound classes (O, O2, O3S and O4S) and the different numbers ofrings plus double bonds (Chap. 6.4.4) are separated vertically. Horizontally, the points arespaced by CH2 groups along a homologous series. [29] By courtesy of A. G. Marshall,NHFL, Tallahassee.
3.3.3 Mass Accuracy
The mass accuracy is defined as the difference between measured accurate massand calculated exact mass. The mass accuracy can be stated as absolute units of u(or mmu) or as relative mass accuracy in ppm, i.e., absolute mass accuracy di-vided by the mass it is determined for. As mass spectrometers tend to have similarabsolute mass accuracies over a comparatively wide range, absolute mass accu-racy represents a more meaningful way of stating mass accuracies than the moretrendy use of ppm.
Note: Part per million (ppm) is simply a relative measure as are percent (%),permill (parts per thousand, ‰), or parts per billion (ppb).
Example: A magnetic sector mass spectrometer allows for an absolute massaccuracy of 2–5 mmu in scanning mode over a range of about m/z 50–1500. Atm/z 1200 an error of 3.5 mmu corresponds to inconspicuous 2.9 ppm, whereas thesame error yields 70 ppm at m/z 50 which seems to be unacceptably large.

3.3 High-Resolution and Accurate Mass 93
Fig. 3.14. Exact masses of isobaric ions of nominal mass 310 u. The m scale is plotted inmmu relative to the saturated hydrocarbon, C22H46, at 310.3599 u. Adapted from Ref. [13]with permission. © University Science Books, 1993.
Given infinite mass accuracy we should be able to identify the empirical for-mula of any ion from its exact mass. The emphasis is on infinite mass accuracy,however, and the meaning of “infinite” is perfectly illustrated by an example fromMcLafferty's book (Fig. 3.14). [13] Even though the compositions are restricted toCxHyN0–3O0–4, there is a considerable number of isobaric ions of nominal mass

94 3 Isotopes
310 u with the calculated exact mass of the saturated hydrocarbon C22H46 of310.3599 u at the upper limit. The exact masses of all other compositions are in-creasingly lower until the scale reaches the bottom line at 296.9 mmu less withC21H10O3 at 310.0630 u. While it is comparatively simple to distinguish these ex-tremes, there are other combinations just 1.5 mmu apart. The situation becomesdrastically worse as more elements and fewer limitations of their number must betaken into account. In practice, there is a strong need of restricting oneself to cer-tain elements and a maximum and/or minimum number of certain isotopes to as-sure a high degree of confidence in the assignment of formulas.
Isotopic patterns provide a prime source of such additional information. Com-bining the information from accurate mass data and experimental peak intensitieswith calculated isotopic patterns allows to significantly reduce the number of po-tential elemental compositions of a particular ion. [31] Otherwise, even at an ex-tremely high mass accuracy of 1 ppm the elemental composition of peptides, forexample, can only be uniquely identified up to about 800 u, i.e., an error of lessthan 0.8 mmu is required even if only C, H, N, O and S are allowed. [27,32,33]
3.3.3.1 Specification of Mass Accuracy
It has been stated that measured accurate masses when used to assign molecularformulae should always be accompanied by their mass accuracies. [34] Ideally,this can be done by giving the mean mass value and the corresponding error interms of standard deviation as obtained from several repeated measurements of thesame ion. [35] This is definitely not identical to the error which is usually pro-vided with the listing from mass spectrometer data systems, where an error isgiven as the difference of calculated and measured mass value.
The theoretically expected reduction of the average mass error with the squareroot of the number of determinations has experimentally been verified: [36] sin-gle-scan mass errors were significantly larger than those obtained from the aver-age of multiple measurements.
Example: The [M-Cl]+ ion, [CHCl2]+, represents the base peak in the EI spec-
trum of chloroform. The results of three subsequent determinations for the majorpeaks of the isotopic pattern are listed below (Fig. 3.15). The typical printout of amass spectrometer data system provides experimental accurate mass and relativeintensity of the signal and an error as compared to the calculated exact mass ofpossible compositions. For the [12CH35Cl2]
+ ion, the experimental accurate massvalues yield an average of 82.9442 ± 0.0006 u. The comparatively small absoluteerror of 0.6 mmu corresponds to a relative error of 7.5 ppm.

3.3 High-Resolution and Accurate Mass 95
Fig. 3.15. Printout of elemental compositions of [M–Cl]+ ions of chloroform as obtainedfrom three subsequent measurements (70 eV EI, R = 8000). The error for each proposal islisted in units of ppm and mmu. The column U.S. lists “unsaturation”, i.e., the number ofrings and/or double bonds (Chap. 6.4.4).
3.3.3.2 Technical Aspects of Exact Mass Calculations
On one side, the isotopic masses provided in this book are listed with six decimalplaces corresponding to an accuracy of 10–3 mmu (Tab. 3.1 and Appendix). On theother side, the realistic magnitude of usually encountered mass errors in organicmass spectrometry is in the order of 1 mmu.
The number of decimal places one should employ in mass calculations dependson the purpose they are used for. In the m/z range up to about 500 u, the use ofisotopic mass with four decimal places will provide sufficient accuracy. Above, atleast five decimal places are required, because the increasing number of atoms re-sults in an unacceptable multiplication of many small mass errors. Beyond 1000 u,even six decimal places should be employed. However, the final results of thesecalculations may be reported with only four decimal places, because this is suffi-cient for most applications. If mass accuracies of significantly less than 1 mmu areto be expected, the use of six decimal places becomes necessary in any case.

96 3 Isotopes
3.3.4 Resolution
Good mass accuracy can only be obtained from sufficiently sharp and evenlyshaped signals that are well separated from each other. The ability of an instru-ment to perform such a separation of neighboring peaks is called resolving power.It is obtained from the peak width expressed as a function of mass.
The term resolution essentially describes the same; the small difference beingthat its definition is based on the resulting signals. The resolution R is defined asthe ratio of the mass of interest, m, to the difference in mass, m, as defined by thewidth of a peak at a specific fraction of the peak height. [1]
mmR (3.11)
Two neighboring peaks are assumed to be sufficiently separated when the val-ley separating their maxima has decreased to 10 % of their intensity. Hence, this isknown as 10 % valley definition of resolution, R10%. The 10 % valley conditionsare fulfilled if the peak width at 5 % relative height equals the mass difference ofthe corresponding ions, because then the 5 % contribution of each peak to thesame point of the m/z axis adds up to 10 % (Fig. 3.16).
Fig. 3.16. Illustration of the 10 % valley and of the full width at half maximum (FWHM)definitions of resolution. Peak heights are not to scale.
With the advent of linear quadrupole analyzers the full width at half maximum(FWHM) definition of resolution became widespread especially among instru-ments manufacturers. It is also commonly used for time-of-flight and quadrupoleion trap mass analyzers. With Gaussian peak shapes, the ratio of RFWHM to R10% is1.8. The practical consequences of resolution for a pair of peaks at different m/zare illustrated below (Fig. 3.17).
Note: The attributive low-resolution (LR) is generally used to describe spectraobtained at R = 500–2000. High-resolution (HR) is appropriate for R > 5000.However, there is no exact definition of these terms.

3.3 High-Resolution and Accurate Mass 97
50 51 500 501 1000 1001
0.1 u 1 u
1 u1 u 1 u
R= 500
m/z
Fig. 3.17. Signals at m/z 50, 500 and 1000 as obtained at R = 500. At m/z 1000 the peakmaxima are shifted towards each other due to superimposing of the peaks; this also ap-proximates the result of RFWHM = 900.
Example: The changes in the electron ionization spectra of residual air are wellsuited to demonstrate the effect of increasing resolution (Fig. 3.18). SettingR = 1000 yields a peak width of 28 mmu for the m/z 28 signal. An increase toR = 7000 perfectly separates the minor contribution of CO+, m/z 27.995, from thepredominating N2
+• at m/z 28.006 (The CO+ ion rather results from fragmentingCO2
+• ions than from carbon monoxide in laboratory air.)
Fig. 3.18. EI mass spectra of residual air (a) at R = 1000 and (b) at R = 7000. The relativeintensities are not affected by the different settings of resolution. The decimal places of themass labels give an estimate of achievable mass accuracies under the respective conditions.

98 3 Isotopes
3.3.4.1 Influence of Resolution on Relative Peak Intensity
Increasing resolution does not affect the relative intensities of the peaks, i.e., theintensity ratios for m/z 28 : 32 : 40 : 44 in the spectrum of air basically remainconstant (Fig. 3.18). However, an increase of resolution is usually obtained at thecost of transmission of the analyzer, thereby reducing the absolute signal intensity(Chap. 4.3.4). Accordingly, isotopic patterns are not affected by increasing reso-lution up to R 10,000; beyond, there can be changes in isotopic patterns due tothe separation of different isotopic species of the same nominal mass (Chap. 3.4).
Note: If a peak is not present in the low-resolution mass spectrum, there is noreason why it should be detectable from the high-resolution spectrum as long asthe same ionization method is employed. Instead, use of a more suitable ioni-zation method is recommended. (And sometimes one has to accept the truththat the sample is not what it was expected to be.)
3.3.4.2 Experimental Determination of Resolution
In principle, resolution is always determined from the peak width of some signalat a certain relative height and therefore, any peak can serve this purpose. As theexact determination of a peak width is not always easy to perform, the use of somedublets of known m has been established.
The minimum resolution to separate CO+ from N2+• is 28/0.011 2500. The
dublet from pyridine molecular ion, C5H5N+•, m/z 79.0422, and from the first iso-
topic peak of benzene molecular ion, 13CC5H6+•, m/z 79.0503, demands R = 9750
to be separated. Finally, the dublet composed of the first isotopic ion of[M–CH3]
+• ion from xylene, 13CC6H7+, m/z 92.0581, and toluene molecular ion,
C7H8+•, m/z 92.0626, needs R = 20,600 for separation (Fig 3.19).
Note: There is no need to use a more accurate value of m than nominal massand likewise, there is no use of reporting R = 2522.52 exactly as obtained forthe CO+/N2
+• pair. It is fully sufficient to know that setting R = 3000 is suffi-cient for one specific task or that R = 10,000 is suitable for another.
With good magnetic sector instruments resolutions up to R = 10,000 can rou-tinely be employed, and R = 15,000 may still be used. Nevertheless, resolutionslarger than 10,000 are rarely employed in accurate mass measurements, and theseare of use only where interferences of ions of the same nominal m/z need to beavoided. With an instrument in perfect condition, it is possible to achieve higherresolutions up to the limits of specification (R 60,000) on intensive peaks.
Note: As the signals become noisy, mass accuracy may even suffer from toohigh settings of resolution. Often centroids are determined more accurate fromsmooth and symmetrically shaped peaks at moderate HR conditions. Oneshould also be aware of the fact that the position of a peak of 0.1 u width needsto be determined to 1/50 of its width to obtain 2 mmu accuracy.

3.3 High-Resolution and Accurate Mass 99
92.1 92.061 92.0626
92.0581
m/zR = 1000 R = 10.000 R = 20.000
rel.
int.
[%]
0.11 u1.1 u
Fig. 3.19. The m/z 92 peak from a mixture of xylene and toluene at different settings ofresolution. At R = 10,000 some separation of the lower mass ion can already be presumedfrom a slight asymmetry of the peak. R = 20,600 is needed to fully separate 13CC6H7
+,m/z 92.0581, from C7H8
+•, m/z 92.0626. The m/z scale is the same for all of the signals.
3.3.5 Mass Calibration
So far, the concepts of exact mass, mass accuracy and resolution have been intro-duced without considering the means by which accurate mass measurements canbe realized. The key to this problem is mass calibration. Resolution alone canseparate ions of different m/z value, but it does not automatically include the in-formation where on the m/z axis the respective signals precisely are located.
3.3.5.1 External Mass Calibration
Any mass spectrometer requires mass calibration before use. However, the proce-dures to perform it properly and the number of calibration points needed maylargely differ between different types of mass analyzers. Typically, several peaksof well-known m/z values evenly distributed over the mass range of interest arenecessary. These are supplied from a well-known mass calibration compound ormass reference compound. Calibration is then performed by recording a massspectrum of the calibration compound and subsequent correlation of experimentalm/z values to the mass reference list. Usually, this conversion of the mass refer-ence list to a calibration is accomplished by the mass spectrometer's data system.Thereby, the mass spectrum is recalibrated by interpolation of the m/z scale be-tween the assigned calibration peaks to obtain the best match. The mass calibra-tion obtained may then be stored in a calibration file and used for future meas-urements without the presence of a calibration compound. This procedure istermed external mass calibration.

100 3 Isotopes
Note: The numerous ionization methods and mass analyzers in use have cre-ated a demand for a large number of calibration compounds to suit their spe-cific needs. Therefore, mass calibration compounds will occasionally be ad-dressed later in the chapters on ionization methods. It is also not possible tospecify a general level of mass accuracy with external calibration. Dependingon the type of mass analyzer and on the frequency of recalibration, mass accu-racy can be as high as 1 mmu or as low as 0.5 u.
Example: Perfluorokerosene, PFK, is a well-established mass calibration stan-dard in electron ionization. It provides evenly spaced CxFy
+ fragment ions over awide mass range (Figs. 3.20 and 3.21). The major ions are all mass deficient withCHF2
+, m/z 51.0046, being the only exception. PFK is available from low-boilingto high-boiling grades which may be used up to m/z 700–1100. Apart from thehighest boiling grades, PFK is suitable for introduction by means of the referenceinlet system (Chap. 5.3.3), a property making it very attractive for internal cali-bration as well.
m/z
PFK
rela
tive
inte
nsity
[%]
Fig. 3.20. Partial 70 eV EI mass spectrum of perfluorokerosene, PFK. The peaks are evenlyspaced over a wide m/z range. In the low m/z range peaks from residual air do occur.
3.3.5.2 Internal Mass Calibration
If high-resolution measurements are performed in order to assign elemental com-positions, internal mass calibration is almost always required. The calibrationcompound can be introduced from a second inlet system or be mixed with theanalyte before the analysis. Mixing calibration compounds with the analyte re-quires some operational skills in order not to suppress the analyte by the referenceor vice versa. Therefore, a separate inlet to introduce the calibration compound isadvantageous. This can be achieved by introducing volatile standards such as PFKfrom a reference inlet system in electron ionization, by use of a dual-target probein fast atom bombardment, or by use of a second sprayer in electrospray ioniza-tion.

3.3 High-Resolution and Accurate Mass 101
Internal mass calibration typically yields mass accuracies as high as 0.1–0.5 mmu with Fourier transform ion cyclotron resonance, 0.5–5 mmu withmagnetic sector, and 2–10 mmu with time-of-flight analyzers.
Fig. 3.21. Reproduction of a PFK calibration table of a magnetic sector instrument coveringthe m/z 1–405 range. In order to expand the PFK reference peak list to the low m/z range,1H, 4He and peaks from residual air are included, but for intensity reasons 1H, 4He and CO2
have not been assigned in this particular case.
Note: Mass accuracy is highly dependent on many parameters such as resolv-ing power, scan rate, scanning method, signal-to-noise ratio of the peaks, peakshapes, overlap of isotopic peaks at same nominal mass, mass difference be-tween adjacent reference peaks etc. An error of ± 5 mmu for routine applica-tions is a conservative estimate and thus the experimental accurate mass shouldlie within this error range independent of the ionization method and the instru-ment used. [37] There is no reason that the correct (expected) composition hasto be the composition with the smallest error.
Example: The high-resolution spectrum in the molecular ion range of a zirco-nium complex is typified by the isotopic pattern of zirconium and chlorine(Fig. 3.22). 90Zr represents the most abundant isotope of zirconium which is ac-companied by 91Zr, 92Zr, 94Zr and 96Zr, all of them having considerable abun-
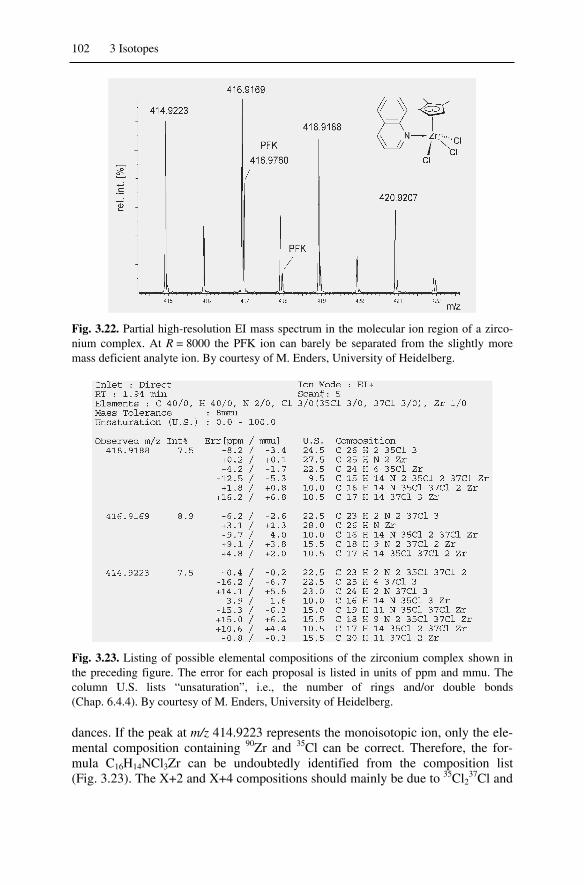
102 3 Isotopes
Fig. 3.22. Partial high-resolution EI mass spectrum in the molecular ion region of a zirco-nium complex. At R = 8000 the PFK ion can barely be separated from the slightly moremass deficient analyte ion. By courtesy of M. Enders, University of Heidelberg.
Fig. 3.23. Listing of possible elemental compositions of the zirconium complex shown inthe preceding figure. The error for each proposal is listed in units of ppm and mmu. Thecolumn U.S. lists “unsaturation”, i.e., the number of rings and/or double bonds(Chap. 6.4.4). By courtesy of M. Enders, University of Heidelberg.
dances. If the peak at m/z 414.9223 represents the monoisotopic ion, only the ele-mental composition containing 90Zr and 35Cl can be correct. Therefore, the for-mula C16H14NCl3Zr can be undoubtedly identified from the composition list(Fig. 3.23). The X+2 and X+4 compositions should mainly be due to 35Cl2
37Cl and

3.3 High-Resolution and Accurate Mass 103
35Cl37Cl2, respectively, and thus these can be identified in the next step. The num-bers of all other elements must remain the same, i.e., here C16H14N must be part ofany formula. In this example, R = 8000 is the minimum to separate the PFK refer-ence peak at m/z 417 from that of the analyte. If separation could not have beenachieved, the mass assignment would have been wrong because the m/z 417 peakwould then be centered at a weighted mass average of its two contributors. Alter-natively, such a peak may be omitted from both reference list and composition list.
Note: The assignment of empirical formulae from accurate mass measurementsalways must be in accordance with the experimentally observed and the calcu-lated isotopic pattern. Contradictions strongly point towards erroneous inter-pretation of the mass spectrum.
3.3.5.3 Compiling Mass Reference Lists
Once the mass spectrum of a calibration standard is known and the elementalcomposition of the ions that are to be included in the mass reference list are estab-lished by an independent measurement, a reference list may be compiled. For thispurpose, the listed reference masses should be calculated using six decimal places.Otherwise, there is a risk of erroneous reference values, especially when masses ofion series are calculated by multiplication of a subunit. Such a tasks are wellsuited for spreadsheet applications on a personal computer.
Example: Cesium iodide is frequently used for mass calibration in fast atombombardment (FAB) mass spectrometry (Chap. 9) because it yields cluster ions ofthe general formula [Cs(CsI)n]
+ in positive-ion and [I(CsI)n]– in negative-ion
mode. For the [Cs(CsI)10]+ cluster ion, m/z 2730.9 is calculated instead of the cor-
rect value m/z 2731.00405 by using only one decimal place instead of the exactvalues M133Cs = 132.905447 and M127I = 126.904468. The error of 0.104 u is ac-ceptable for LR work, but definitely not acceptable if accurate mass measurementshave to be performed.
3.3.5.4 Role of the Electron Mass
The question remains whether the mass of the electron me (0.548 mmu) has reallyto been taken into account in accurate mass work as demanded by the IUPACconvention (Chap. 3.1.4). This issue was almost only of academic interest as longas mass spectrometry never yielded mass accuracies better than several mmu.Nowadays, extremely accurate FT-ICR instruments become more widespread inuse, and thus, the answer depends on the intended application: The electron masshas to be included in calculations if the result is expected to report the accuratemass of the ion with highest accuracy. Here, neglecting the electron mass wouldcause an systematic error of the size of me. This cannot be tolerated when massmeasurement accuracies in the order of 1 mmu or better are to be achieved.

104 3 Isotopes
3.4 Interaction of Resolution and Isotopic Patterns
3.4.1 Multiple Isotopic Compositions at Very High Resolution
When starting our consideration of isotopic patterns, it was done in terms ofnominal mass, which makes it much easier to understand how isotopic patterns areformed. The procedure of summing up all isotopic abundances contributing to thesame nominal mass is correct as long as very high resolution is not employed. Inthat case, following such a simplified protocol is acceptable, because generallyisobaric ions resulting from different isotopic compositions of the same elementalcomposition are very similar in mass. [16]
During the introduction of resolution it should have become clear that very highresolution is capable of separating different isotopic compositions of the samenominal mass, thereby giving rise to multiple peaks on the same nominal m/z(Figs. 3.18, 3.19, 3.22). In molecules with masses of around 10,000 u, a single un-resolved isotopic peak may consist of as many as 20 different isotopic composi-tions. [38]
Fig. 3.24. Listing of the theoretical isotopic distribution of C16H20OSi at infinite resolution.The contribution of 2H is not considered, and isotopic peaks above m/z 260 are omitted dueto their minor intensities.
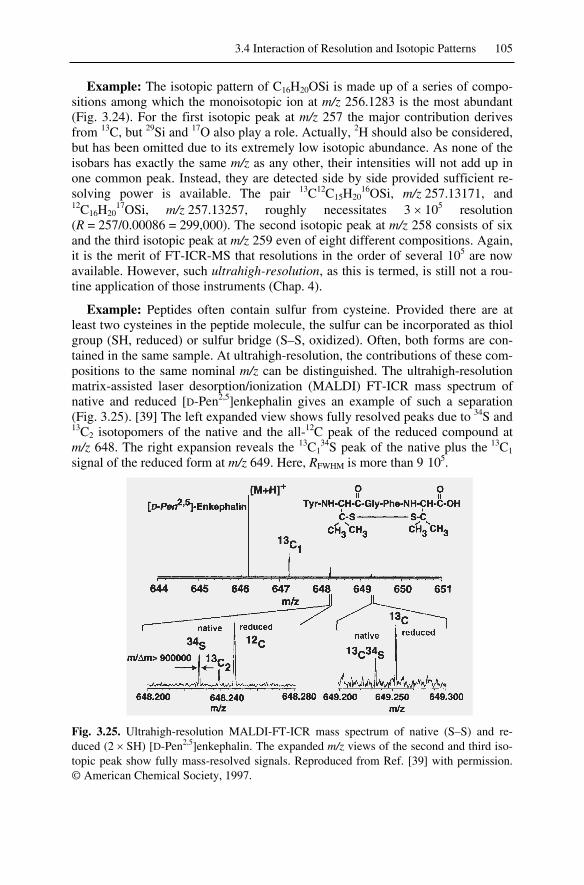
3.4 Interaction of Resolution and Isotopic Patterns 105
Example: The isotopic pattern of C16H20OSi is made up of a series of compo-sitions among which the monoisotopic ion at m/z 256.1283 is the most abundant(Fig. 3.24). For the first isotopic peak at m/z 257 the major contribution derivesfrom 13C, but 29Si and 17O also play a role. Actually, 2H should also be considered,but has been omitted due to its extremely low isotopic abundance. As none of theisobars has exactly the same m/z as any other, their intensities will not add up inone common peak. Instead, they are detected side by side provided sufficient re-solving power is available. The pair 13C12C15H20
16OSi, m/z 257.13171, and12C16H20
17OSi, m/z 257.13257, roughly necessitates 3 105 resolution(R = 257/0.00086 = 299,000). The second isotopic peak at m/z 258 consists of sixand the third isotopic peak at m/z 259 even of eight different compositions. Again,it is the merit of FT-ICR-MS that resolutions in the order of several 105 are nowavailable. However, such ultrahigh-resolution, as this is termed, is still not a rou-tine application of those instruments (Chap. 4).
Example: Peptides often contain sulfur from cysteine. Provided there are atleast two cysteines in the peptide molecule, the sulfur can be incorporated as thiolgroup (SH, reduced) or sulfur bridge (S–S, oxidized). Often, both forms are con-tained in the same sample. At ultrahigh-resolution, the contributions of these com-positions to the same nominal m/z can be distinguished. The ultrahigh-resolutionmatrix-assisted laser desorption/ionization (MALDI) FT-ICR mass spectrum ofnative and reduced [D-Pen2,5]enkephalin gives an example of such a separation(Fig. 3.25). [39] The left expanded view shows fully resolved peaks due to 34S and13C2 isotopomers of the native and the all-12C peak of the reduced compound atm/z 648. The right expansion reveals the 13C1
34S peak of the native plus the 13C1
signal of the reduced form at m/z 649. Here, RFWHM is more than 9�105.
Fig. 3.25. Ultrahigh-resolution MALDI-FT-ICR mass spectrum of native (S–S) and re-duced (2 SH) [D-Pen2,5]enkephalin. The expanded m/z views of the second and third iso-topic peak show fully mass-resolved signals. Reproduced from Ref. [39] with permission.© American Chemical Society, 1997.

106 3 Isotopes
3.4.2 Multiple Isotopic Compositions and Accurate Mass
It has been pointed out that routine accurate mass measurements are conducted atresolutions which are too low to separate isobaric isotopic compositions in mostcases. Unfortunately, coverage of multiple isotopic compositions under the samesignal distort the peak shape. This effect causes a loss of mass accuracy whenelemental compositions have to be determined from such multicomponent peaks,e.g., if the monoisotopic peak is too weak as the case with many transition metals.The observed decrease in mass accuracy is not dramatic and the loss of mass accu-racy is counterbalanced by the information derived from the isotopic pattern.However, it can be observed that mass accuracy decreases, e.g., from 2–3 mmu onmonoisotopic peaks to about 4–7 mmu on multicomponent signals.
3.4.3 Isotopic Patterns of Large Molecules
3.4.3.1 Isotopic Patterns of Large Molecules at Sufficient Resolution
Terms such as large molecules or high mass are subject to steady change in massspectrometry as new techniques for analyzing high-mass ions are being developedor improved. [40] Here, the focus is on masses in the range of 103–104 u.
With increasing m/z the center of the isotopic pattern, i.e., the average molecu-lar mass, is shifted to values higher than the monoisotopic mass. The center, i.e.,the average mass, may not be represented by a real peak, but it tends to be close tothe peak of most abundant mass (Fig. 3.26). The monoisotopic mass is of coursestill related to a real signal, but it may be of such a low intensity that it is difficultto recognize. Finally, the nominal mass becomes a mere number which is nolonger useful to describe the molecular weight. [38,41]
The calculation of isotopic patterns of molecules of several 103 u is not a trivialtask, because slight variations in the relative abundances of the isotopes encoun-tered gain relevance and may shift the most abundant mass and the average massup or down by 1 u. In a similar fashion the algorithm and the number of iterationsemployed to perform the actual calculation affect the final result. [16]
Note: The calculation of relative molecular mass, Mr, of organic molecules ex-ceeding 2000 u is significantly influenced by the basis it is performed on. Boththe atomic weights of the constituent elements and the natural variations inisotopic abundance contribute to the differences between monoisotopic- andrelative atomic mass-based Mr values. In addition, they tend to characteristi-cally differ between major classes of biomolecules. This is primarily because ofmolar carbon content, e.g., the difference between polypeptides and nucleicacids is about 4 u at Mr = 25,000 u. Considering terrestrial sources alone, varia-tions in the isotopic abundance of carbon lead to differences of about10–25 ppm in Mr which is significant with respect to mass measurement accu-racy in the region up to several 103 u. [41]

3.4 Interaction of Resolution and Isotopic Patterns 107
Fig. 3.26. Calculated isotopic patterns of large polystyrene ions. Adapted from Ref. [38]with permission. © American Chemical Society, 1983.
3.4.3.2 Isotopic Patterns of Large Molecules at Low Resolution
It is certainly desirable to have at least sufficient resolution to resolve isotopicpatterns to their nominal mass contributions. However, not every mass analyzer iscapable of doing so with any ion it can pass through. Such conditions often occurwhen ions of several thousand u are being analyzed by quadrupole, time-of-flightor quadrupole ion trap analyzers, and hence it is useful to know about the changesin spectral appearance and their effect on peak width and detected mass. [42]
Example: The isotopic pattern of the [M+H]+ ion, [C254H378N65O75S6]+, of bo-
vine insulin has been calculated for R10% = 1000, 4000 and 10,000. At R = 1000the isotopic peaks are not resolved (Fig. 3.27). An envelope smoothly covering theisotopic peaks is observed instead. It is even slightly wider than the real isotopicpattern. The maximum of this envelope is in good agreement with the calculatedaverage mass, i.e., the molecular weight (Eq. 3.1). At R = 4000 the isotopic peaksbecome sufficiently resolved to be recognized as such. The m/z values are very
Fig. 3.27. The isotopic pattern calculated for [M+H]+ of bovine insulin at different resolu-tions (R10%). Note that the envelope at R = 1000 is wider than the real isotopic pattern.

108 3 Isotopes
close to the corresponding isotopic masses; however, there can be some minorshifts due to their still significant overlap. Finally, at R = 10,000 the isotopic pat-tern is well resolved and interferences between isotopic peaks are avoided. Thenext step, i.e., to resolve the multiple isotopic contributions to each of the peakswould require R > 106.
3.5 Interaction of Charge State and Isotopic Patterns
Even though singly charged ions seem to be the dominant species in mass spec-trometry at first sight, there are many applications where doubly and multiplycharged ions are of utmost importance. In electrospray ionization (Chap. 11) evenextremely high charge states can be observed, e.g., up to 60-fold in case of pro-teins of about 60,000 u molecular weight. Doubly and triply charged ions are alsocommon in electron ionization (Chaps. 5, 6) and field desorption (Chap. 8).
The effect of higher charges state are worth a closer consideration. With z in-creasing from 1 to 2, 3 etc., the numerical value of m/z is reduced by a factor of 2,3 etc., i.e., the ion will be detected at lower m/z than the corresponding singlycharged ion of the same mass. In general, the entire m/z scale is compressed by afactor of z if z > 1. Consequently, the isotopic peaks are then located at 1/z u dis-tance. Vice versa, the charge state is obtained from the reciprocal value of thedistance between adjacent peaks, e.g., peaks at 1/3 u correspond to triply chargedions. The reasons for the compression of the m/z scale are discussed later(Chap. 4).
Fig. 3.28. The electron impact mass spectrum of [60]fullerene. The insets show the ex-panded signals of M+•, M2+ and M3+• ions. The signals of the patterns are at 1, 0.5 and0.33 u distance, respectively. The intensity scale has been normalized in the insets to allowfor easier comparison of the isotopic patterns. By courtesy of W. Krätschmer, Max PlanckInstitute for Nuclear Physics, Heidelberg.

Reference List 109
Example: The EI mass spectrum of C60 also shows an abundant doublycharged molecular ion, C60
2+, at m/z 360 with its isotopic peaks located at 0.5 udistance and a C60
3+• signal at m/z 240 of very low intensity (Fig. 3.28). [22] Theisotopic pattern remains the same for all of them. As a consequence of the com-pressed m/z scale, the doubly charged C58
2+ fragment ion is detected at m/z 348.More examples of multiply charged ions can be found throughout the book.
Note: Isotopic distributions remain unaffected by the charge state of an ion asfar as the relative intensities are concerned. However, the distance between thepeaks is reduced to 1/z u, thus allowing multiply charged ions to be easily dis-tinguished from singly charged ions and their charge state to be determined.
Reference List
1. Todd, J.F.J. Recommendations for No-menclature and Symbolism for MassSpectroscopy Including an Appendix ofTerms Used in Vacuum Technology. Int.J. Mass Spectrom. Ion Proc. 1995, 142,211-240.
2. Yergey, J.A. A General Approach to Cal-culating Isotopic Distributions for MassSpectrometry. Int. J. Mass Spectrom. IonPhys. 1983, 52, 337-349.
3. Sparkman, O.D. Mass Spec Desk Refer-ence; Global View Publishing: Pittsburgh,2000.
4. IUPAC Isotopic Composition of the Ele-ments 1997. Pure Appl. Chem. 1998, 70,217-235.
5. IUPAC; Coplen, T.P. Atomic Weights ofthe Elements 1999. Pure Appl. Chem.2001, 73, 667-683.
6. Price, P. Standard Definitions of TermsRelating to Mass Spectrometry. A ReportFrom the Committee on Measurementsand Standards of the Amercian Society forMass Spectrometry. J. Am. Soc. MassSpectrom. 1991, 2, 336-348.
7. Busch, K.L. Units in Mass Spectrometry.Spectroscopy 2001, 16, 28-31.
8. Platzner, I.T. Applications of Isotope Ra-tio Mass Spectrometry, in Modern IsotopeRatio Mass Spectrometry, John Wiley &Sons: Chichester, 1997; pp. 403-447.
9. Beavis, R.C. Chemical Mass of Carbon inProteins. Anal. Chem. 1993, 65, 496-497.
10. Carle, R. Isotopen-Massenspektrometrie:Grundlagen und An-wendungsmöglichkeiten. Chem. UnsererZeit 1991, 20, 75-82.
11. Busch, K.L. Isotopes and Mass Spec-trometry. Spectroscopy 1997, 12, 22-26.
12. Beynon, J.H. The Compilation of a Tableof Mass and Abundance Values, in Massspectrometry and its applications to or-ganic chemistry, 1st ed.; Elsevier: Amster-dam, 1960; Chapter 8.3, pp. 294-302.
13. McLafferty, F.W.; Turecek, F. Interpreta-tion of Mass Spectra; 4th ed.; UniversityScience Books: Mill Valley, 1993.
14. Margrave, J.L.; Polansky, R.B. RelativeAbundance Calculations for Isotopic Mo-lecular Species. J. Chem. Educ. 1962, 335-337.
15. Hsu, C.S. Diophantine Approach to Iso-topic Abundance Calculations. Anal.Chem. 1984, 56, 1356-1361.
16. Kubinyi, H. Calculation of Isotope Distri-butions in Mass Spectrometry. A TrivialSolution for a Non-Trivial Problem. Anal.Chim. Acta 1991, 247, 107-119.
17. Frauenkron, M.; Berkessel, A.; Gross, J.H.Analysis of Ruthenium Carbonyl-Porphyrin Complexes: a Comparison ofMatrix-Assisted Laser Desorp-tion/Ionization Time-of-Flight, Fast-AtomBombardment and Field Desorption MassSpectrometry. Eur. Mass Spectrom. 1997,3, 427-438.
18. Brauman, J.I. Least Squares Analysis andSimplification of Multi-Isotope MassSpectra. Anal. Chem. 1966, 38, 607-610.
19. Giesa, S.; Gross, J.H.; Hull, W.E.; Lebed-kin, S.; Gromov, A.; Krätschmer, W.;Gleiter, R. C120OS: the First Sulfur-Containing Dimeric [60]Fullerene Deriva-tive. Chem. Commun. 1999, 465-466.

110 3 Isotopes
20. Luffer, D.R.; Schram, K.H. Electron Ioni-zation Mass Spectrometry of SyntheticC60. Rapid Commun. Mass Spectrom.1990, 4, 552-556.
21. Srivastava, S.K.; Saunders, W. Ionizationof C60 (Buckminsterfullerene) by ElectronImpact. Rapid Commun. Mass Spectrom.1993, 7, 610-613.
22. Scheier, P.; Dünser, B.; Märk, T.D. Pro-duction and Stability of Multiply-ChargedC60. Electrochem. Soc. Proc. 1995, 95-10,1378-1394.
23. Thomas, A.F. Deuterium Labeling in Or-ganic Chemistry; Appleton-Century-Crofts: New York, 1971.
24. Busch, K.L. The Resurgence of ExactMass Measurement with FTMS. Spectros-copy 2000, 15, 22-27.
25. Beynon, J.H. Qualitative Analysis of Or-ganic Compounds by Mass Spectrometry.Nature 1954, 174, 735-737.
26. Lehmann, W.D.; Bohne, A.; von der Lieth,C.W. The Information Encrypted in Accu-rate Peptide Masses-Improved ProteinIdentification and Assistance in Glyco-peptide Identification and Characteriza-tion. J. Mass Spectrom. 2000, 35, 1335-1341.
27. Zubarev, R.A.; Håkansson, P.; Sundqvist,B. Accuracy Requirements for PeptideCharacterization by Monoisotopic Mo-lecular Mass Measurements. Anal. Chem.1996, 68, 4060-4063.
28. Kendrick, E. Mass Scale Based on CH2 =14.0000 for High-Resolution Mass Spec-trometry of Organic Compounds. Anal.Chem. 1963, 35, 2146-2154.
29. Hughey, C.A.; Hendrickson, C.L.; Rod-gers, R.P.; Marshall, A.G. Kendrick MassDefect Spectrum: A Compact VisualAnalysis for Ultrahigh-ResolutionBroadband Mass Spectra. Anal. Chem.2001, 73, 4676-4681.
30. Hughey, C.A.; Hendrickson, C.L.; Rod-gers, R.P.; Marshall, A.G. ElementalComposition Analysis of Processed andUnprocessed Diesel Fuel by ElectrosprayIonization Fourier Transform Ion Cyclo-tron Resonance Mass Spectrometry. En-ergy Fuels 2001, 15, 1186-1193.
31. Roussis, S.G.; Proulx, R. Reduction ofChemical Formulas from the Isotopic PeakDistributions of High-Resolution MassSpectra. Anal. Chem. 2003, 75, 1470-1482.
32. Zubarev, R.A.; Demirev, P.A.; Håkansson,P.; Sundqvist, B.U.R. Approaches andLimits for Accurate Mass Characterizationof Large Biomolecules. Anal. Chem. 1995,67, 3793-3798.
33. Clauser, K.R.; Baker, P.; Burlingame, A.Role of Accurate Mass Measurement (±10Ppm) in Protein Identification StrategiesEmploying MS or MS/MS and DatabaseSearching. Anal. Chem. 1999, 71, 2871-2882.
34. Gross, M.L. Accurate Masses for StructureConfirmation. J. Am. Soc. Mass Spectrom.1994, 5, Editorial.
35. Sack, T.M.; Lapp, R.L.; Gross, M.L.;Kimble, B.J. A Method for the StatisticalEvaluation of Accurate Mass Measure-ment Quality. Int. J. Mass Spectrom. IonProc. 1984, 61, 191-213.
36. Kilburn, K.D.; Lewis, P.H.; Underwood,J.G.; Evans, S.; Holmes, J.; Dean, M.Quality of Mass and Intensity Measure-ments From a High Performance MassSpectrometer. Anal. Chem. 1979, 51,1420-1425.
37. Bristow, A.W.T.; Webb, K.S. Intercom-parison Study on Accurate Mass Meas-urement of Small Molecules in MassSpectrometry. J. Am. Soc. Mass Spectrom.2003, 14, 1086-1098.
38. Yergey, J.; Heller, D.; Hansen, G.; Cotter,R.J.; Fenselau, C. Isotopic Distributions inMass Spectra of Large Molecules. Anal.Chem. 1983, 55, 353-356.
39. Solouki, T.; Emmet, M.R.; Guan, S.; Mar-shall, A.G. Detection, Number, and Se-quence Location of Sulfur-ContainingAmino Acids and Disulfide Bridges inPeptides by Ultrahigh-Resolution MALDI-FTICR Mass Spectrometry. Anal. Chem.1997, 69, 1163-1168.
40. Matsuo, T.; Sakurai, T.; Ito, H.; Wada, Y."High Masses". Int. J. Mass Spectrom. IonProc. 1991, 118/119, 635-659.
41. Pomerantz, S.C.; McCloskey, J.A. Frac-tional Mass Values of Large Molecules.Org. Mass Spectrom. 1987, 22, 251-253.
42. Werlen, R.C. Effect of Resolution on theShape of Mass Spectra of Proteins: SomeTheoretical Considerations. Rapid Com-mun. Mass Spectrom. 1994, 8, 976-980.

4 Instrumentation
“A modern mass spectrometer is constructed from elements which approach thestate-of-the-art in solid-state electronics, vacuum systems, magnet design, preci-sion machining, and computerized data acquisition and processing.” [1] This isand has ever been a fully valid statement about mass spectrometers.
Under the headline of instrumentation we shall mainly discuss the differenttypes of mass analyzers in order to understand their basic principles of operation,their specific properties and their performance characteristics. Of course, this isonly one aspect of instrumentation; hence topics such as ion detection and vacuumgeneration will be addressed in brief. As a matter of fact, sample introduction ismore closely related to particular ionization methods than to the type of massanalyzer employed, and therefore, this issue is treated in the corresponding chap-ters on ionization methods. The order of appearance of the mass analyzers in thischapter neither reflects the ever-changing percentage they are employed in massspectrometry nor does it strictly follow a time line of their invention. Instead, it isattempted to follow a trail of easiest understanding.
From its very beginnings to the present almost any physical principle rangingfrom time-of-flight to cyclotron motion has been employed to construct mass-analyzing devices (Fig 4.1). Some of them became extremely successful at thetime they were invented, for others it took decades until their potential had fullybeen recognized. The basic types of mass analyzers employed for analytical massspectrometry are summarized below (Tab. 4.1).
Table 4.1. Common mass analyzers
Type Acronym PrincipleTime-of-flight TOF Time dispersion of a pulsed ion beam; separation by
time-of-flightMagnetic sector B Deflection of a continuous ion beam; separation by mo-
mentum in magnetic field due to Lorentz forceLinear quadrupole Q Continuous ion beam in linear radio frequency quad-
rupole field; separation due to stability of trajectoriesLinear quadrupoleion trap
LIT Continuous ion beam and trapped ions; storage andeventually separation in linear radio frequency quad-rupole field due to stability of trajectories
Quadrupole ion trap QIT Trapped ions; separation in three-dimensional radio fre-quency quadrupole field due to stability of trajectories
Ion cyclotronresonance
ICR Trapped ions; separation by cyclotron frequency(Lorentz force) in magnetic field

112 4 Instrumentation
Fig. 4.1. Mass spectrometer islands. A cartoon by C. Brunnée. Reproduced from Ref. [2]with permission. © Elsevier Science, 1987.
The properties of an ideal mass analyzer are well described, [2] but despite thetremendous improvements made, still no mass analyzer is perfect. To reach adeeper insight into the evolution of mass spectrometers the articles by Beynon, [3]Habfast and Aulinger, [4,5] Brunnée [6,7], Chapman et al. [8] and McLuckey [9]are recommended for further reading. In recent years, miniature mass analyzershave gained interest for in situ analysis, [10] e.g., in environmental [11] or bio-chemical applications, [12] for process monitoring, for detection of chemical war-fare agents, for extraterrestrial applications, [13] and to improve Space Shuttlesafety prior to launch. [14]
4.1 Creating a Beam of Ions
Consider an ion that is brought into or generated within an electric field as realizedbetween two oppositely charged plates of a capacitor. Such an ion will be acceler-ated towards the plate of opposite charge sign. If the attracting plate has a hole or

4.2 Time-of-Flight Instruments 113
a slit, a ion beam is produced by this simple ion source. Assuming the spread inion kinetic energy to be small as compared to the total ion kinetic energy, i.e.,
Ekin << Ekin, the beam can be regarded monoenergetic. The actual charge of anion may be either positive or negative depending on the ionization method em-ployed. Changing the polarity of the plates switches from the extraction of posi-tive ions to negative ions or vice versa. For practical reasons, the attracting elec-trode is usually grounded and the pushing plate is set to high voltage. Doing soallows to keep the whole mass analyzer grounded, thereby contributing substan-tially to safety of operation (Fig. 4.2). The extraction of ions and the shape of theion beam can largely be improved if the acceleration voltage is applied in two ormore successive steps instead of a single step.
Fig. 4.2. Schematic of a simple ion source. The ionizing event is preferably located close tothe charged plate. After a neutral has been ionized (positive in this illustration), it is at-tracted by the opposite plate. Those ions passing through a hole of the grounded electrodecreate an ion beam emerging into the field-free region behind. The ion beam produced bysuch a primitive ion source is not parallel, but has some angular spread.
4.2 Time-of-Flight Instruments
4.2.1 Introduction to Time-of-Flight
The construction of a time-of-flight (TOF) analyzer has been published in 1946 byStephens. [15] The principle of TOF is quite simple: ions of different m/z are dis-persed in time during their flight along a field-free drift path of known length.Provided all the ions start their journey at the same time or at least within a suffi-ciently short time interval, the lighter ones will arrive earlier at the detector thanthe heavier ones. This demands that they emerge from a pulsed ion source whichcan be realized either by pulsing ion packages out of a continuous beam or moreconveniently by employing a true pulsed ionization method.
Soon, other groups shared Stephens' concept [16] and increasingly useful TOFinstruments were constructed [17-19] leading to their first commercialization byBendix in the mid 1950s. These first generation TOF instruments were designedfor gas chromatography-mass spectrometry (GC-MS) coupling. [20,21] Their per-formance was poor as compared to modern TOF analyzers, but the specific ad-

114 4 Instrumentation
vantage of TOF over the competing magnetic sector instruments was the rate ofspectra per second they were able to deliver (Fig. 4.3). In GC-MS the TOF ana-lyzer soon became superseded by linear quadrupole analyzers and it took until thelate 1980s for their revival [22,23] – the success of pulsed ionization methods, es-pecially of matrix-assisted laser desorption/ionization (MALDI), made it possible(Chap. 10).
MALDI generated a great demand for a mass analyzer ideally suited to be usedin conjunction with a pulsed ion source and capable of transmitting ions of ex-tremely high mass up to several 105 u. [24] Since then, the performance of TOFinstruments has tremendously increased. [25,26] TOF analyzers were adapted foruse with other ionization methods and are now even strong competitors to thewell-established magnetic sector instruments in many applications. [25,27]
The main advantages of TOF instruments are: i) in principle, the m/z range isunlimited; [28,29] ii) from each ionizing event, e.g., a single laser shot in MALDI,a complete mass spectrum is obtained within several tens of microseconds; iii) thetransmission of a TOF analyzer is very high, giving rise to high sensitivity; iv) theconstruction of a TOF instrument is comparatively straightforward and inexpen-sive; and v) recent instruments allow for accurate mass measurements and tandemMS experiments.
Fig. 4.3. Photograph of the oscillographic output of the electron ionization TOF spectrumof xenon on a Bendix TOF-MS. The dark lines are a grid on the oscillographic screen. (Forthe isotopic pattern of Xe cf. Fig. 3.1.) Adapted from Ref. [20] with permission.© Pergamon Press, 1959.
4.2.2 Basic Principle of TOF Instruments
4.2.2.1 Velocity of Ions
Independent of the ionization method, the electric charge q of an ion of mass mi isequal to an integer number z of electron charges e, and thus q = ez. The energyuptake Eel by moving through a voltage U is given by
UzeUqEel (4.1)

4.2 Time-of-Flight Instruments 115
Thereby, the former potential energy of a charged particle in an electric field isconverted into kinetic energy Ekin, i.e., into translational motion
kiniel EvmUzeE 2
21 (4.2)
Assuming the ion was at rest before, which is correct in a first approximation,the velocity attained is obtained by rearranging Eq. 4.2 into
imUzev 2 (4.3)
i.e., v is inversely proportional to the square root of mass.
Example: From Eq. 4.3 we obtain the velocity of the [60]fullerene molecularion, C60
+•, after acceleration by 19.5 kV as
124
19sm294,72
kg101956.1V500,19C106022.12v
An ion velocity of 72,294 m s–1 appears comparatively high, although it is only0.0024 % of the speed of light. The acceleration voltages and thus, the ion veloci-ties are the highest in TOF-MS, although magnetic sector instruments are operatedwith kiloelectron volt ion beams, too (Chap. 4.3). The other types of mass analyz-ers require ions to be entering at much lower kinetic energies.
Note: Equation 4.3 describes the velocity of any ion after acceleration in anelectric field, and therefore it is valid not only for TOF-MS, but for any part ofa mass spectrometer handling beams of ions.
4.2.2.2 Time-of-Flight
It does not take a great leap to the idea of measuring the time for an ion of un-known m/z to travel a distance s after having been accelerated by a voltage U. Therelationship between velocity and time t needed to travel the distance s is
vst (4.4)
which upon substitution of v with Eq. 4.3 becomes
imUze
st2
(4.5)
Equation 4.5 delivers the time needed for the ion to travel the distance s at con-stant velocity, i.e., in a field-free environment after the process of acceleration has

116 4 Instrumentation
been completed. Rearrangement of Eq. 4.5 reveals the relationship between the in-strumental parameters s and U, the experimental value of t and the ratio mi/z
2
22s
tUez
mi(4.6)
It is also obvious from Eq. 4.5 that the time to drift through a fixed length offield-free space is proportional to the square root of mi/z
zm
eUst i
2
(4.7)
and thus, the time interval t between the arrival times of ions of different m/zis proportional to s (mi/z1
½ – mi/z2½).
Note: Here, the ratio mi/z denotes ion mass [kg] per number of electroncharges. The index i at the mass symbol is used to avoid confusion with themass-to-charge ratio, m/z, as used to specify the position of a peak on the ab-scissa of a mass spectrum. There, m/z is mass number devided by the number ofelectron charges due to the current convention (Chap. 1.2.3). [30,31]
Example: According to Eq. 4.7 the C60+• ion, m/z 720, of the preceding exam-
ple will travel through a field-free flight path of 2.0 m in 27.665 µs. Its isotopomer13C12C59
+•, m/z 721, needs slightly longer. The proportionality to the square root ofm/z gives (use of mi/z values yields identical results as the dimension is cancelled)
000694.1720721
720
721
tt
Thus, t721 = 27.684 µs. This corresponds to a difference in time-of-flight of19 ns under these conditions (cf. Fig. 4.7).
The proportionality of time-of-flight to the square root of m/z causes t for agiven m/z to decrease with increasing m/z: under otherwise the same conditions
t per 1 u is calculated as 114 ns at m/z 20, 36 ns at m/z 200, and just 11 ns atm/z 2000. Therefore, the realization of a time-of-flight mass analyzer depends onthe ability to measure short time intervals with sufficient accuracy. [32-34] At thispoint it becomes clear that the performance of the early TOF analyzers – amongother reasons – suffered from the too slow electronics of their time. It took untilthe mid-1990s to overcome this barrier.
4.2.2.3 Time-of-Flight of Multiply Charged Ions
The effect of a charge state z > 1 on time-of-flight allows to explain the conse-quences of higher charge states for isotopic patterns (Chap. 3.5). As z increases to2, 3 etc., the numerical value of m/z is reduced by a factor of 2, 3 etc., i.e., the ionwill be detected at lower m/z than the corresponding singly-charged ion of the
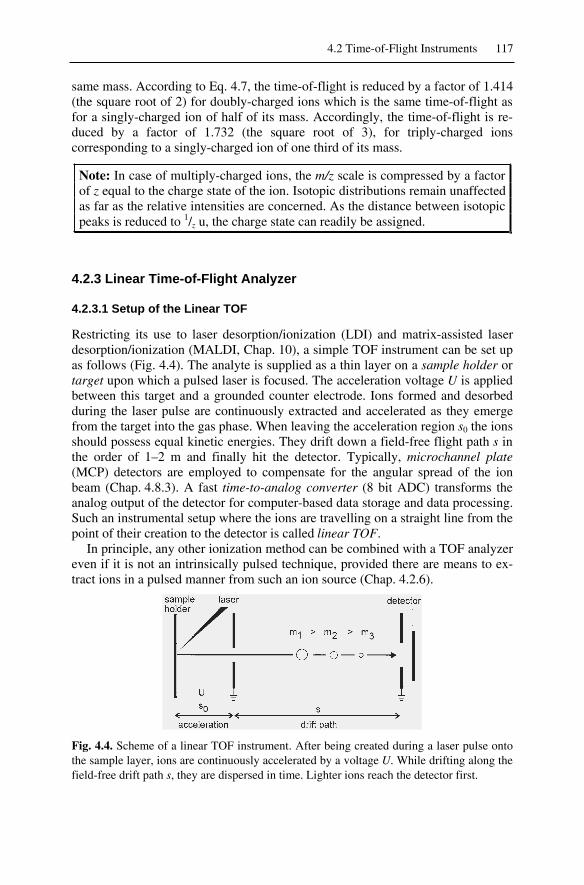
4.2 Time-of-Flight Instruments 117
same mass. According to Eq. 4.7, the time-of-flight is reduced by a factor of 1.414(the square root of 2) for doubly-charged ions which is the same time-of-flight asfor a singly-charged ion of half of its mass. Accordingly, the time-of-flight is re-duced by a factor of 1.732 (the square root of 3), for triply-charged ionscorresponding to a singly-charged ion of one third of its mass.
Note: In case of multiply-charged ions, the m/z scale is compressed by a factorof z equal to the charge state of the ion. Isotopic distributions remain unaffectedas far as the relative intensities are concerned. As the distance between isotopicpeaks is reduced to 1/z u, the charge state can readily be assigned.
4.2.3 Linear Time-of-Flight Analyzer
4.2.3.1 Setup of the Linear TOF
Restricting its use to laser desorption/ionization (LDI) and matrix-assisted laserdesorption/ionization (MALDI, Chap. 10), a simple TOF instrument can be set upas follows (Fig. 4.4). The analyte is supplied as a thin layer on a sample holder ortarget upon which a pulsed laser is focused. The acceleration voltage U is appliedbetween this target and a grounded counter electrode. Ions formed and desorbedduring the laser pulse are continuously extracted and accelerated as they emergefrom the target into the gas phase. When leaving the acceleration region s0 the ionsshould possess equal kinetic energies. They drift down a field-free flight path s inthe order of 1–2 m and finally hit the detector. Typically, microchannel plate(MCP) detectors are employed to compensate for the angular spread of the ionbeam (Chap. 4.8.3). A fast time-to-analog converter (8 bit ADC) transforms theanalog output of the detector for computer-based data storage and data processing.Such an instrumental setup where the ions are travelling on a straight line from thepoint of their creation to the detector is called linear TOF.
In principle, any other ionization method can be combined with a TOF analyzereven if it is not an intrinsically pulsed technique, provided there are means to ex-tract ions in a pulsed manner from such an ion source (Chap. 4.2.6).
Fig. 4.4. Scheme of a linear TOF instrument. After being created during a laser pulse ontothe sample layer, ions are continuously accelerated by a voltage U. While drifting along thefield-free drift path s, they are dispersed in time. Lighter ions reach the detector first.

118 4 Instrumentation
The drift time td as calculated by means of Eq. 4.7 is not fully identical to thetotal time-of-flight. Obviously, the time needed for acceleration of the ions ta hasto be added. Furthermore, a short period of time t0 may be attributed to the laserpulse width and the process of desorption/ionization, which is typically in the or-der of a few nanoseconds. Thus, the total time-of-flight ttotal is given by
datotal tttt 0 (4.8)
An exact mathematical treatment of the TOF analyzers as needed for the con-struction of such instruments of course has to include all contributions to the totaltime-of-flight. [32,33]
4.2.3.2 Properties of the Linear TOF
The transmittance of a linear TOF analyzer approaches 90 % because ion lossesare solely caused by collisional scattering due to residual gas or by poor spatial fo-cusing of the ion source. With a sufficiently large detector surface located in not atoo large distance from the ion source exit, a very high fraction of the ions will becollected by the detector.
Even metastable decompositions during the flight do not reduce the intensity ofa molecular ion signal, because the fragments formed conserve the velocity of thefragmenting ion and are therefore detected at the same time-of-flight as their intactprecursors. In such a case, the ionic and the neutral fragment cause a response atthe detector. These properties make the linear TOF analyzer the ideal device foranalysis of easily fragmenting and/or high mass analytes.
Note: The detection of neutrals formed by metastable fragmentation in linearTOF analyzers is one of the few exceptions where neutrals are handled and giverise to a signal in mass spectrometry.
The example in Chap. 4.2.2 demonstrates that the differences in time-of-flightof ions differing by 1 u in mass are in the order of about 10 ns at about m/z 1000.The time needed for desorption/ionization is roughly 100 ns in case of standardUV lasers, but depends on the duration of the laser pulse. Consequently, thespread in starting times for ions of the same m/z value is often larger than the dif-ference in time-of-flight of neighboring m/z values, thereby limiting the resolution.
Another effect is even worse: Laser-desorbed ions, for example, possess com-paratively large initial kinetic energies of some 10 eV that are superimposed onthe kinetic energy provided by the acceleration voltage, which is typically in theorder of 10–30 kV. Obviously, higher acceleration voltages are advantageous inthat they diminish the relative contribution of the energy spread caused by theionization process. The possible effects of deviations from the assumption thations initially are at rest on an equipotential surface have been illustrated (Fig. 4.5).[34] All these effects together limit resolution to R 500 for continuous extrac-tion linear TOF analyzers.
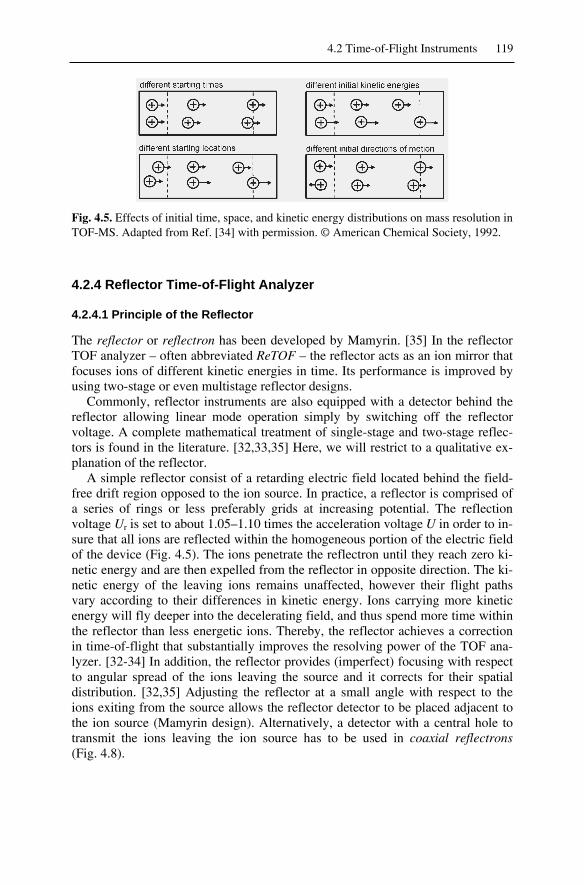
4.2 Time-of-Flight Instruments 119
Fig. 4.5. Effects of initial time, space, and kinetic energy distributions on mass resolution inTOF-MS. Adapted from Ref. [34] with permission. © American Chemical Society, 1992.
4.2.4 Reflector Time-of-Flight Analyzer
4.2.4.1 Principle of the Reflector
The reflector or reflectron has been developed by Mamyrin. [35] In the reflectorTOF analyzer – often abbreviated ReTOF – the reflector acts as an ion mirror thatfocuses ions of different kinetic energies in time. Its performance is improved byusing two-stage or even multistage reflector designs.
Commonly, reflector instruments are also equipped with a detector behind thereflector allowing linear mode operation simply by switching off the reflectorvoltage. A complete mathematical treatment of single-stage and two-stage reflec-tors is found in the literature. [32,33,35] Here, we will restrict to a qualitative ex-planation of the reflector.
A simple reflector consist of a retarding electric field located behind the field-free drift region opposed to the ion source. In practice, a reflector is comprised ofa series of rings or less preferably grids at increasing potential. The reflectionvoltage Ur is set to about 1.05–1.10 times the acceleration voltage U in order to in-sure that all ions are reflected within the homogeneous portion of the electric fieldof the device (Fig. 4.5). The ions penetrate the reflectron until they reach zero ki-netic energy and are then expelled from the reflector in opposite direction. The ki-netic energy of the leaving ions remains unaffected, however their flight pathsvary according to their differences in kinetic energy. Ions carrying more kineticenergy will fly deeper into the decelerating field, and thus spend more time withinthe reflector than less energetic ions. Thereby, the reflector achieves a correctionin time-of-flight that substantially improves the resolving power of the TOF ana-lyzer. [32-34] In addition, the reflector provides (imperfect) focusing with respectto angular spread of the ions leaving the source and it corrects for their spatialdistribution. [32,35] Adjusting the reflector at a small angle with respect to theions exiting from the source allows the reflector detector to be placed adjacent tothe ion source (Mamyrin design). Alternatively, a detector with a central hole totransmit the ions leaving the ion source has to be used in coaxial reflectrons(Fig. 4.8).

120 4 Instrumentation
Although the reflector almost doubles the flight path and hence the dispersionin time-of-flight, this effect is of lower importance than its capability to compen-sate for initial energy spread. Simple elongation of the flight path could also beachieved with longer flight tubes in linear instruments. However, too long flightpaths may even decrease the overall performance of TOF analyzers due to loss ofions by angular spread of the ion beam and scattering of ions after collisions withresidual gas. To compensate for the latter effects, ion guide wires have been in-corporated in some long TOF instruments. [36]
Fig. 4.6. Schematic of a ReTOF (a) and potentials along the instrument (b).
4.2.4.2 Comparison of Linear and Reflector TOF
The ability of the ReTOF to compensate for the initial energy spread of ionslargely increases the resolving power of TOF instruments. While a typical con-tinuous extraction TOF instrument in linear mode cannot resolve isotopic patternsof analytes above about m/z 500, it will do when operated in reflector mode(Fig. 4.7). At substantially higher m/z, the ReTOF still fails to resolve isotopicpatterns, even though its esolution is still better than that of a linear TOF analyzer.
In case of metastable fragmentations, the ReTOF behaves different from thelinear TOF. If fragmentation occurs between ion source and reflector, the ions willbe lost by the reflector due to their change in kinetic energy. Only fragments stillhaving kinetic energies close to that of the precursor, e.g., [M+H–NH3]
+ in case ofa peptide of about m/z 2000, are transmitted due to the energy tolerance of the re-flector. However, such ions are not detected at correct m/z thereby giving rise to a“tailing” of the signal. Ions fragmenting in transit from reflector to detector aretreated the same way as ions in the linear TOF. Thus, the elongated flight path of

4.2 Time-of-Flight Instruments 121
the ReTOF, which is equivalent to more time for fragmentation, and the aboveproperty complicate the detection of very labile analytes in the ReTOF.
RFWHM = 300 RFWHM = 1800
720720
m/z
721
721
722
linear reflector
RFWHM = 500RFWHM = 950
m/z
linearreflector
5734.6
5756.55774.3
5734.6
a
b
Fig. 4.7. The molecular ion signal of C60 at m/z 720 (a) and the quasimolecular ion signal ofbovine insulin, m/z 5734.6, (b) as obtained on a TOF instrument in linear mode (left) andreflector mode (right). All other experimental parameters remained unchanged.
4.2.4.3 Curved-Field Reflectron
The so-called curved-field reflectron offers advantages in speed and simplicity ofoperation when metastable fragmentations are to be studied [37-39] as in the caseof MALDI-TOF peptide sequencing (Chaps. 4.2.7 and 10). It provides a retardingfield that increases with its depth by steadily increasing the voltage differencebetween a comparatively large number of lenses (Fig. 4.8). The curved-field re-flectron acts as a divergent ion mirror causing some more ion losses than two-stage reflectors. Instruments with curved-field reflectrons are commercially avail-able (Shimadzu AXIMA series).
Example: The curved-field reflectron of a coaxial ReTOF instrument occupiesa large portion (D) of the total flight path (s = l1 + D) and uses 86 lens elements
Fig. 4.8. Coaxial curved-field reflectron TOF spectrometer. The total length is about 1 m.Adapted from Ref. [37] with permission. © John Wiley & Sons, 1995.
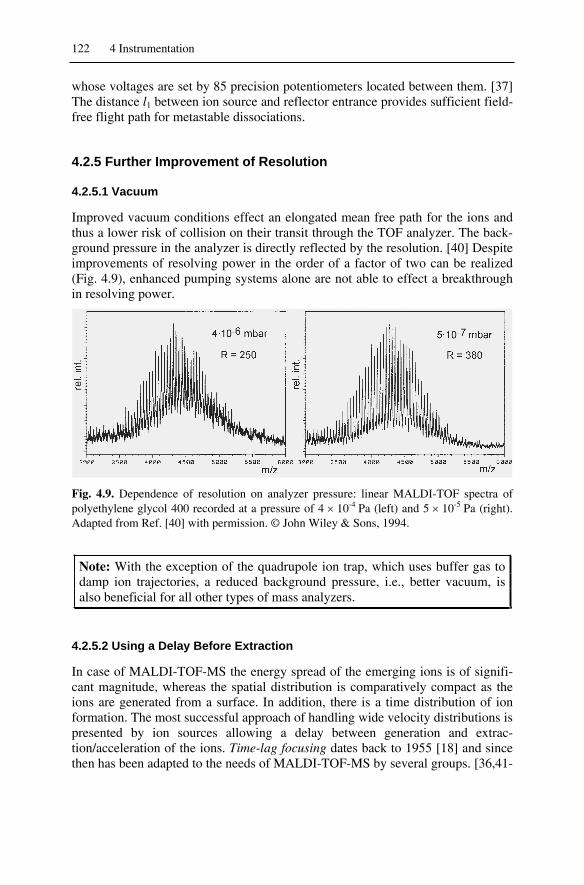
122 4 Instrumentation
whose voltages are set by 85 precision potentiometers located between them. [37]The distance l1 between ion source and reflector entrance provides sufficient field-free flight path for metastable dissociations.
4.2.5 Further Improvement of Resolution
4.2.5.1 Vacuum
Improved vacuum conditions effect an elongated mean free path for the ions andthus a lower risk of collision on their transit through the TOF analyzer. The back-ground pressure in the analyzer is directly reflected by the resolution. [40] Despiteimprovements of resolving power in the order of a factor of two can be realized(Fig. 4.9), enhanced pumping systems alone are not able to effect a breakthroughin resolving power.
Fig. 4.9. Dependence of resolution on analyzer pressure: linear MALDI-TOF spectra ofpolyethylene glycol 400 recorded at a pressure of 4 10-4 Pa (left) and 5 10-5 Pa (right).Adapted from Ref. [40] with permission. © John Wiley & Sons, 1994.
Note: With the exception of the quadrupole ion trap, which uses buffer gas todamp ion trajectories, a reduced background pressure, i.e., better vacuum, isalso beneficial for all other types of mass analyzers.
4.2.5.2 Using a Delay Before Extraction
In case of MALDI-TOF-MS the energy spread of the emerging ions is of signifi-cant magnitude, whereas the spatial distribution is comparatively compact as theions are generated from a surface. In addition, there is a time distribution of ionformation. The most successful approach of handling wide velocity distributions ispresented by ion sources allowing a delay between generation and extrac-tion/acceleration of the ions. Time-lag focusing dates back to 1955 [18] and sincethen has been adapted to the needs of MALDI-TOF-MS by several groups. [36,41-

4.2 Time-of-Flight Instruments 123
43] (The concept of using a time delay to separate charged species in space is alsoemployed in ZEKE-PES and MATI, Chap. 2.10.3.)
Note: Unfortunately, establishing patents and trademarks has caused redundantnames for almost the same thing: Time Lag Focusing (TLF, Micromass); De-layed Extraction (DE, Applied Biosystems); Pulsed Ion Extraction (PIE, Bru-ker Daltonik).
The principle of the method is to generate ions in a field-free environment,thereby allowing them to separate in space according to their different initial ve-locities. Then, after a variable delay of some hundreds of nanoseconds the accel-eration voltage is switched on with a fast pulse. This procedure also ensures thatlaser-induced reactions have terminated before ion acceleration begins. Using atwo-stage acceleration ion source allows the electric field between target (repeller)and extraction plate P1 to be varied. The remaining fraction of the accelerationvoltage is applied in the second stage. At the onset of extraction, ions with highinitial velocities have traveled farther than slower ones, and therefore experienceonly a fraction of the extraction voltage dV between target and extraction plate P1.The voltage of the second stage is the same for all ions. As a result, the fastest ionsreceive less energy from the accelerating field than the slowest. Thereby, such ionsources compensate for the initial energy distribution. [36]
The optimum settings of the delay time and of the ratio of pulsed to fixed volt-age (V1/V2) depend on m/z with a tendency towards longer delays and/or a largerV1/V2 ratio for heavier ions. In practice, the variation of potentials in pulsed ionextraction with time can be handled as follows (Fig. 4.10): target and extractionplate P1 are held at the same potential during the delay time, thereby creating afield-free region d1. After the delay has passed, P1 switches from V1 by a variablevalue dV to V2 causing extraction of the ions.
Fig. 4.10. Variation of potentials in pulsed ion extraction with time. The lens stack acts asangular focusing device for the ion beam. By courtesy of Bruker Daltonik, Bremen.

124 4 Instrumentation
Example: Regardless of the manufacturer of the hardware, the effect of a timelag on resolution is quite dramatic. The resolving power of linear instruments isimproved by a factor of 3–4 and reflector instruments become better by a factor ofabout 2–3. [36] The advantages are obvious by comparison of the molecular ionsignal of C60 as obtained from a ReTOF instrument with continuous extraction(Fig. 4.7) and from the same instrument after upgrading with PIE (Fig. 4.12), orby examination of MALDI-TOF spectra of substance P, a low mass peptide, asobtained in continuous extraction mode and after PIE upgrade of the same instru-ment (Fig. 4.11).
RFWHM = 3000 RFWHM = 8300
m/z
continuous PIE1347.651347.7
1348.7 1348.65
Fig. 4.11. MALDI-TOF spectra of substance P, a low mass peptide, as obtained from aBruker Biflex ReTOF in continuous extraction mode (left) and after PIE upgrade (right).
4.2.5.3 Analog-to-Digital Conversion
In a TOF analyzer, the ion packages hit the detector in very short time intervalsmaking the signal change extremely fast in time. This causes the analog-to-digitalconversion to become technically demanding. It can easily be shown that the finalpeak shape directly depends on the speed of the analog-to-digital converter(ADC), [40] or vice versa, the resolving power of advanced TOF analyzers createsa need for high-speed ADCs. In actual TOF instruments, 8-bit ADCs with a digiti-zation rate of 4 GHz are available to suit the resolving powers of their analyzers(Fig. 4.12). In case of 8-bit ADCs as typically used in MALDI-TOF instruments,the intensity of the detector output is converted into a numerical value of 0–255.
1 ns 2 ns 10 ns
RFWHM = 6300 RFWHM = 3800 RFWHM = 1000
720 720 720
m/z
Fig. 4.12. The molecular ion peak of [60]fullerene at different settings of the dwell time perdata point of the analog-to-digital converter. At 1 ns per datapoint (1 GHz) the peaks arewell resolved and resolution is limited by the analyzer, at 2 ns (500 MHz) some broadeningoccurs and at 10 ns (100 MHz) peak shapes are reduced to triangles.

4.2 Time-of-Flight Instruments 125
Note: The digitization rate or sampling rate may be reported as dwell time perdata point, e.g., 1 ns, or as sampling frequency, e.g., 1 GHz.
4.2.5.4 Dynamic Range
The dynamic range is the ratio obtained by deviding the intensity of the most in-tense signal by that of the weakest while both are correctly detected in the samespectrum. To improve the small dynamic range delivered by 8-bit ADCs (0–255)several tens to a few hundred single spectra are usually summed up. Slow scan-ning instruments are typically provided with 16–20-bit ADCs corresponding tointensity values of 0–65535 (216–1) and 0–1048575 (220–1), respectively.
Fig. 4.13. Bruker Reflex IV™ MALDI-ReTOF instrument. With kind permission of BrukerDaltonik, Bremen.
4.2.6 Orthogonal Acceleration TOF
Up to here, the discussion has focused on MALDI-TOF equipment, becauseMALDI is a pulsed ionization method. MALDI initiated tremendous improve-ments of TOF analyzers which makes it attractive to combine such compact butpowerful analyzers with any other non-pulsed ionization method desirable. Themajor breakthrough came from the design of the orthogonal acceleration TOFanalyzer (oaTOF), i.e., a TOF analyzer into which pulses of ions are extracted or-

126 4 Instrumentation
thogonally from a continuous ion beam (Fig. 4.14). [44,45] The oaTOF analyzercan be of ReTOF type as shown, or of linear type. Although different problemshave to be overcome for each ionization method, the oaTOF analyzer is in princi-ple suited for any of them. [23,46,47] Recently, an oaTOF analyzer has even beenadapted to a MALDI ion source. [48]
Fig. 4.14. Schematic of an orthogonal acceleration reflector TOF instrument. See text fordiscussion. Reproduced from Ref. [47] by permission. © John Wiley & Sons, 2000.
4.2.6.1 Operation of the oaTOF Analyzer
Ions leaving the ion source are focused to form an almost parallel ion beam, i.e., tominimize ion motion orthogonal to the ion beam axis. Then, the ion beam entersthe orthogonal accelerator (x-axis). The ion kinetic energy in this beam is only inthe range of 10–100 eV. A package of ions of length lp is pushed out orthogonallyfrom its initial direction by a sharp pulse, and is then accelerated into the TOFanalyzer (y-axis) by a voltage of 5–10 kV. The design of the TOF analyzer itself isanalogous to those discussed before, but its diameter is much wider because thevelocity of the ions in x-direction, vbeam, is not affected by the orthogonal push-outprocess. Therefore, the detector needs to be comparatively wide in x-direction toenable ions extracted anywhere from the whole path lp to hit its surface. In prac-tice, the detector needs to be several centimeters in length. The angle betweenthe x-direction and the flight axis into the TOF analyzer is given by

4.2 Time-of-Flight Instruments 127
beam
tof
beam
tof
vv
VV 11 tantan
(4.9)
where Vtof and Vbeam are the acceleration voltages for ion beam and orthogonalaccelerator, respectively, and vtof and vbeam are the corresponding ion velocities.
While one ion package travels through the TOF analyzer and is being dispersedin time, the accelerator is refilled with new ions from the ion source (the time-of-flight to cover an m/z range up to about 5000 by the oaTOF is about 100 µs).During the drift time of an ion through the oaTOF, it travels a distance lb. The ra-tio of the length of the orthogonal accelerator lp to lb determines the efficiency ofthe mass analyzer in terms of the ratio of ions used to ions created. This efficiencyis known as the duty cycle of an instrument. The duty cycle of an oaTOF instru-ment is at an optimum if the time-of-flight to pass the TOF analyzer is slightlylonger than the time needed for the continuous ion beam to refill the orthogonalaccelerator. As soon as the heaviest ions have reached the detector, the next pack-age is pulsed into the analyzer, giving rise to 10,000 complete mass spectra persecond. In order to reduce the amount of data and to improve the signal-to-noiseratio, summation of several single spectra is done by an acquisition processingunit before the spectra are passed to a computer for data storage and post-processing.
4.2.6.2 Time-to-Digital Conversion
Time-to-digital converters (TDC) are often employed in oaTOF instruments in-stead of analog-to-digital converters, because of the much higher speed of TDCs.Speed in terms of sampling rate is needed to make use of the high resolution ofsuch instruments (up to RFWHM = 20,000), and speed in terms of data flow is a pre-requisite to handle the enormous number of spectra per second. However, a TDCoffers only 1 bit dynamic range (value 0 or 1). Thus, summation of many singlespectra is also necessary to obtain a higher dynamic range via improved signalstatistics. Nevertheless, the result is still unsatisfactory for quantitative analysisand for correct isotopic patterns, because a TDC cannot distinguish whether one,two or many ions have hit the detector simultaneously to produce the actual signal.Some recently developed oaTOF instruments are therefore equipped with 8-bitADCs to provide dynamic range of up to 104 after summation of several singlespectra (JEOL AccuTOF, Bruker BioTOF series).
4.2.6.3 Applications of oaTOF Instruments
The advantages of oaTOF analyzers are: i) high sensitivity due to very good dutycycle and high transmission of TOF analyzers, ii) high rate of spectra per secondeven after pre-averaging, iii) high mass-resolving power, iv) mass accuracies up to5 ppm allowing for accurate mass measurements, and v) compact design. There-fore, it is not astonishing that oaTOF instruments are currently becoming wide-spread for a wide range of applications. Electrospray ionization (ESI) oaTOF in-

128 4 Instrumentation
struments represent the majority of these systems (for applications cf.Chaps. 10–12), [49] but gas chromatography-mass spectrometry (GC-MS) instru-ments are also available. In particular for fast GC applications [50,51] and for HR-GC-MS [52] oaTOF systems are advantageous.
4.2.7 Tandem MS on TOF Instruments
Tandem mass spectrometry or MS/MS summarizes the numerous techniques wheremass-selected ions (MS1) are subjected to a second mass spectrometric analysis(MS2). [53,54] Ion dissociations in transit through the mass analyzer may eitheroccur spontaneously (metastable, Chaps. 2.7.1, 2.8.2) or can result from intention-ally supplied additional activation, i.e., typically from collisions with neutrals. Themethods to activate or react otherwise stable ions in the field-free region (FFR)between MS1 and MS2 are discussed in Chap. 2.12 and applications of MS/MS onTOF instruments are shown in Chaps. 10–12.
In order to perform two consecutive mass-analyzing steps, two mass analyzersmay be mounted in tandem. This technique is applied with beam transmitting de-vices, i.e., TOF, sector and quadrupole analyzers can be combined that way (tan-dem-in-space, Fig. 4.15). Alternatively, a suitable mass analyzer may be operatedby combining selection, activation, and analysis in the very same place. Quad-rupole ion trap (QIT) and ion cyclotron resonance (ICR) instruments can performsuch tandem-in-time experiments.
Fig. 4.15. Tandem-in-space setups for different beam instruments: magnetic four-sector in-strument (a), magnetic sector–quadrupole hybrid (b), triple quadrupole (c), and ReTOF (d).The linestyles indicate ––– stable precursor ions, - - - transmitted ions, and ������� non-transmitted fragment ions. Shaded areas show the region of analytically useful ion disso-ciations. Reproduced from Ref. [55] with permission. © Elsevier Science, 1994.

4.2 Time-of-Flight Instruments 129
4.2.7.1 Tandem MS in a ReTOF Analyzer
Methods for the detection of metastable ion dissociations in ReTOF-MS in com-bination with secondary ion mass spectrometry (SIMS) and 252Cf plasma desorp-tion (252Cf-PD, Chap. 9.5.2) mass spectrometry were known before the advent ofMALDI. [56-59]
Consider an ion m1+ decomposing in transit through a field-free region. Its ki-
netic energy is then distributed among the product ion m2+ and the neutral frag-
ment n according to their relative contribution to the mass of the precursor ion
1
2)1()(
1
2)1()2( 1and
i
imkinnkin
i
imkinmkin m
mEE
mm
EE(4.10)
While the kinetic energy changes upon dissociation, the ion velocity remainsconstant, as already noted in the discussion of the linear TOF. This causes frag-ment ions generated on the flight to the reflector to have kinetic energies lowerthan intact ions. Fortunately, a reflector is capable to deal with ions of down to70–90 % of the energy it has been adjusted (0.7–0.9 Ekin(m1+)). By stepwise re-duction of the reflector potential, partial spectra each covering several percent ofthe precursor ion mass can be acquired. [55,60] Pasting these pieces togetheryields a spectrum of the product ions formed by metastable dissociation of m1
+. Tocover the range from m1 to 0.1 mi1 the reflector must be stepped down from itspotential V0 to 0.1 V0 in some 10–20 steps.
The ReTOF analyzer alone supplies only the field-free region and MS2, i.e., themetastable dissociations of all precursor ions leaving the ion source would be de-tected simultaneously. The precursor ion selection (MS1) – although technicallydemanding – follows a simple principle: first, ions below the selected precursorm/z value are electrostatically deflected, then the deflector is off to pass the pre-cursor ion through, and finally the high voltage is switched on again to deflectheavier ions. As the deflector is located comparatively close to the ion source itacts as a coarse TOF gate providing poor precursor ion resolution. A collision cellmay be placed near by to allow for CID.
Despite the comparatively poor precursor ion resolution and being a time- andsample-consuming procedure, MS/MS on the ReTOF works so well that thismethod has become established as one of the major tools of biomolecule se-quencing for ions in the m/z 500–3000 range (examples are shown in Chap. 10).
Note: In particular the MALDI-TOF community has coined some sort of anown terminology, e.g., in-source decay (ISD) for all fragmentations occurringwithin the ion source, post-source decay (PSD) instead of metastable ion disso-ciation and fragment analysis and structural TOF (FAST) for the specific modeof operation of a ReTOF to detect metastable ions.
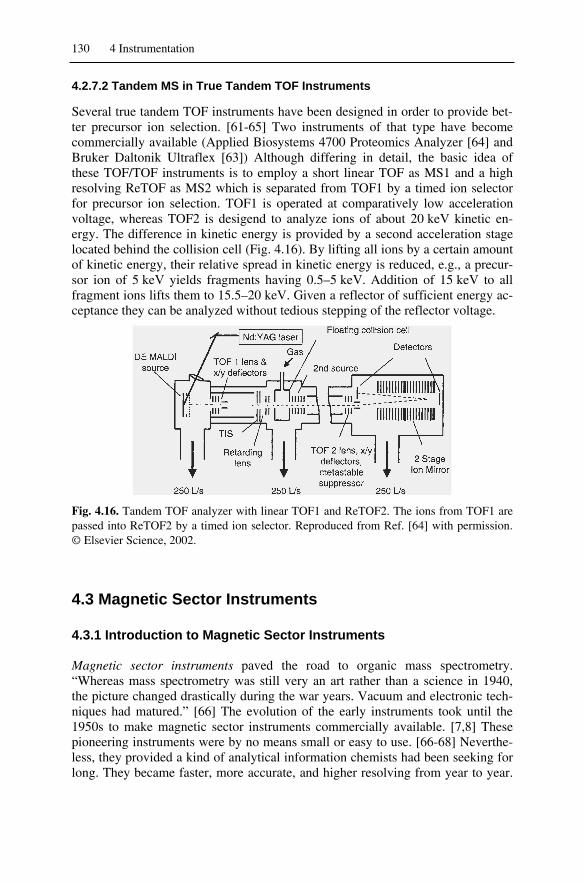
130 4 Instrumentation
4.2.7.2 Tandem MS in True Tandem TOF Instruments
Several true tandem TOF instruments have been designed in order to provide bet-ter precursor ion selection. [61-65] Two instruments of that type have becomecommercially available (Applied Biosystems 4700 Proteomics Analyzer [64] andBruker Daltonik Ultraflex [63]) Although differing in detail, the basic idea ofthese TOF/TOF instruments is to employ a short linear TOF as MS1 and a highresolving ReTOF as MS2 which is separated from TOF1 by a timed ion selectorfor precursor ion selection. TOF1 is operated at comparatively low accelerationvoltage, whereas TOF2 is desigend to analyze ions of about 20 keV kinetic en-ergy. The difference in kinetic energy is provided by a second acceleration stagelocated behind the collision cell (Fig. 4.16). By lifting all ions by a certain amountof kinetic energy, their relative spread in kinetic energy is reduced, e.g., a precur-sor ion of 5 keV yields fragments having 0.5–5 keV. Addition of 15 keV to allfragment ions lifts them to 15.5–20 keV. Given a reflector of sufficient energy ac-ceptance they can be analyzed without tedious stepping of the reflector voltage.
Fig. 4.16. Tandem TOF analyzer with linear TOF1 and ReTOF2. The ions from TOF1 arepassed into ReTOF2 by a timed ion selector. Reproduced from Ref. [64] with permission.© Elsevier Science, 2002.
4.3 Magnetic Sector Instruments
4.3.1 Introduction to Magnetic Sector Instruments
Magnetic sector instruments paved the road to organic mass spectrometry.“Whereas mass spectrometry was still very an art rather than a science in 1940,the picture changed drastically during the war years. Vacuum and electronic tech-niques had matured.” [66] The evolution of the early instruments took until the1950s to make magnetic sector instruments commercially available. [7,8] Thesepioneering instruments were by no means small or easy to use. [66-68] Neverthe-less, they provided a kind of analytical information chemists had been seeking forlong. They became faster, more accurate, and higher resolving from year to year.
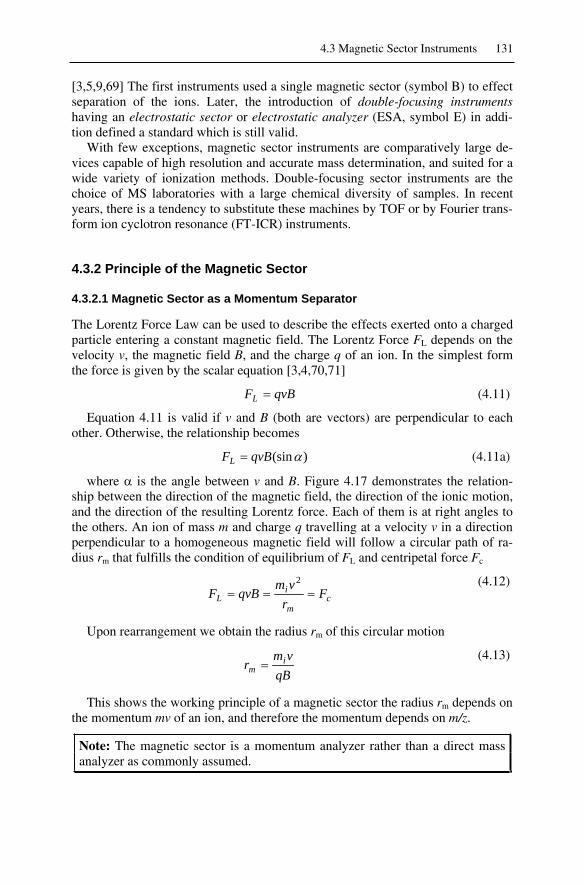
4.3 Magnetic Sector Instruments 131
[3,5,9,69] The first instruments used a single magnetic sector (symbol B) to effectseparation of the ions. Later, the introduction of double-focusing instrumentshaving an electrostatic sector or electrostatic analyzer (ESA, symbol E) in addi-tion defined a standard which is still valid.
With few exceptions, magnetic sector instruments are comparatively large de-vices capable of high resolution and accurate mass determination, and suited for awide variety of ionization methods. Double-focusing sector instruments are thechoice of MS laboratories with a large chemical diversity of samples. In recentyears, there is a tendency to substitute these machines by TOF or by Fourier trans-form ion cyclotron resonance (FT-ICR) instruments.
4.3.2 Principle of the Magnetic Sector
4.3.2.1 Magnetic Sector as a Momentum Separator
The Lorentz Force Law can be used to describe the effects exerted onto a chargedparticle entering a constant magnetic field. The Lorentz Force FL depends on thevelocity v, the magnetic field B, and the charge q of an ion. In the simplest formthe force is given by the scalar equation [3,4,70,71]
qvBFL (4.11)
Equation 4.11 is valid if v and B (both are vectors) are perpendicular to eachother. Otherwise, the relationship becomes
)(sinqvBFL (4.11a)
where is the angle between v and B. Figure 4.17 demonstrates the relation-ship between the direction of the magnetic field, the direction of the ionic motion,and the direction of the resulting Lorentz force. Each of them is at right angles tothe others. An ion of mass m and charge q travelling at a velocity v in a directionperpendicular to a homogeneous magnetic field will follow a circular path of ra-dius rm that fulfills the condition of equilibrium of FL and centripetal force Fc
cm
iL F
rvm
qvBF2 (4.12)
Upon rearrangement we obtain the radius rm of this circular motion
qBvm
r im
(4.13)
This shows the working principle of a magnetic sector the radius rm depends onthe momentum mv of an ion, and therefore the momentum depends on m/z.
Note: The magnetic sector is a momentum analyzer rather than a direct massanalyzer as commonly assumed.

132 4 Instrumentation
Finally, dispersion in momentum causes a dependence of rm on the square rootof mass becoming obvious by substitution of v from Eq. 4.3 and q = ez
eUm
zBmeU
ezBm
r i
i
im
212 (4.13a)
Alternatively, the ratio mi/q can be expressed by rearranging Eq. 4.13
vBr
qm mi (4.14)
which upon substitution of v as performed above becomes
UBr
qm
mqUBr
qm mi
i
mi
22
22 (4.14a)
For singly charged ions (z = 1, q = e) we obtain the more widespread form
UBr
em mi
2
22 (4.14b)
Note: Equation 4.14b has been known as the basic equation of mass spec-trometry. Nowadays, there is no more justification for a single basic equation ofmass spectrometry because of the various mass analyzers employed.
Fig. 4.17. The Right Hand Rule (I thumb, B index finger, FL middle finger) to determinethe direction of the Lorentz Force (a); the current corresponds to the direction where posi-tive charges move, i.e., the figure directly applies for positive ions. (b) A real magnet yokewithout coils and flight tube. With kind permission of Thermo Electron (Bremen) GmbH,(left) and Waters Corporation, MS Technologies, Manchester, UK (right).
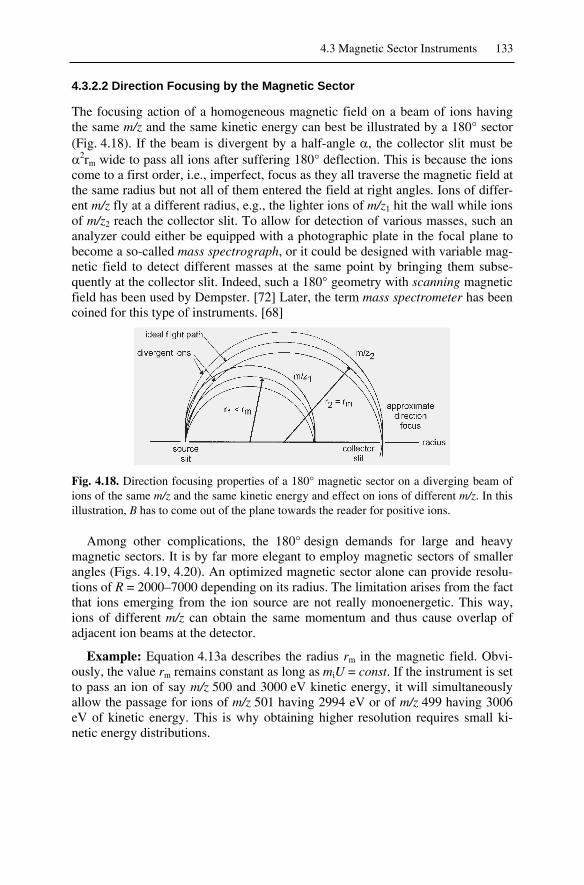
4.3 Magnetic Sector Instruments 133
4.3.2.2 Direction Focusing by the Magnetic Sector
The focusing action of a homogeneous magnetic field on a beam of ions havingthe same m/z and the same kinetic energy can best be illustrated by a 180° sector(Fig. 4.18). If the beam is divergent by a half-angle , the collector slit must be
2rm wide to pass all ions after suffering 180° deflection. This is because the ionscome to a first order, i.e., imperfect, focus as they all traverse the magnetic field atthe same radius but not all of them entered the field at right angles. Ions of differ-ent m/z fly at a different radius, e.g., the lighter ions of m/z1 hit the wall while ionsof m/z2 reach the collector slit. To allow for detection of various masses, such ananalyzer could either be equipped with a photographic plate in the focal plane tobecome a so-called mass spectrograph, or it could be designed with variable mag-netic field to detect different masses at the same point by bringing them subse-quently at the collector slit. Indeed, such a 180° geometry with scanning magneticfield has been used by Dempster. [72] Later, the term mass spectrometer has beencoined for this type of instruments. [68]
Fig. 4.18. Direction focusing properties of a 180° magnetic sector on a diverging beam ofions of the same m/z and the same kinetic energy and effect on ions of different m/z. In thisillustration, B has to come out of the plane towards the reader for positive ions.
Among other complications, the 180° design demands for large and heavymagnetic sectors. It is by far more elegant to employ magnetic sectors of smallerangles (Figs. 4.19, 4.20). An optimized magnetic sector alone can provide resolu-tions of R = 2000–7000 depending on its radius. The limitation arises from the factthat ions emerging from the ion source are not really monoenergetic. This way,ions of different m/z can obtain the same momentum and thus cause overlap ofadjacent ion beams at the detector.
Example: Equation 4.13a describes the radius rm in the magnetic field. Obvi-ously, the value rm remains constant as long as miU = const. If the instrument is setto pass an ion of say m/z 500 and 3000 eV kinetic energy, it will simultaneouslyallow the passage for ions of m/z 501 having 2994 eV or of m/z 499 having 3006eV of kinetic energy. This is why obtaining higher resolution requires small ki-netic energy distributions.

134 4 Instrumentation
Fig. 4.19. A 90° magnetic sector illustrating m/z separation and direction focusing in aplane (angles are shown exaggerated). Reprinted from Ref. [1] with permission. © Ameri-can Association for the Advancement of Science, 1979.
Fig. 4.20. Flight tube passing through the gap of the magnetic sector of a JEOL JMS-700instrument seen from the ESA side. The shapes of the pole pieces of the yoke and the addi-tional blocks around the tube are designed to minimize fringing fields. In addition the polefaces are rotated to increase the mass range.
4.3.3 Double-Focusing Sector Instruments
4.3.3.1 Principle of the Electrostatic Sector
The electrostatic sector or electrostatic analyzer (ESA) produces a radial electricfield between two oppositely charged plates extending over the ESA angle (Fig. 4.21). An ion passes the ESA midway on a circular path if
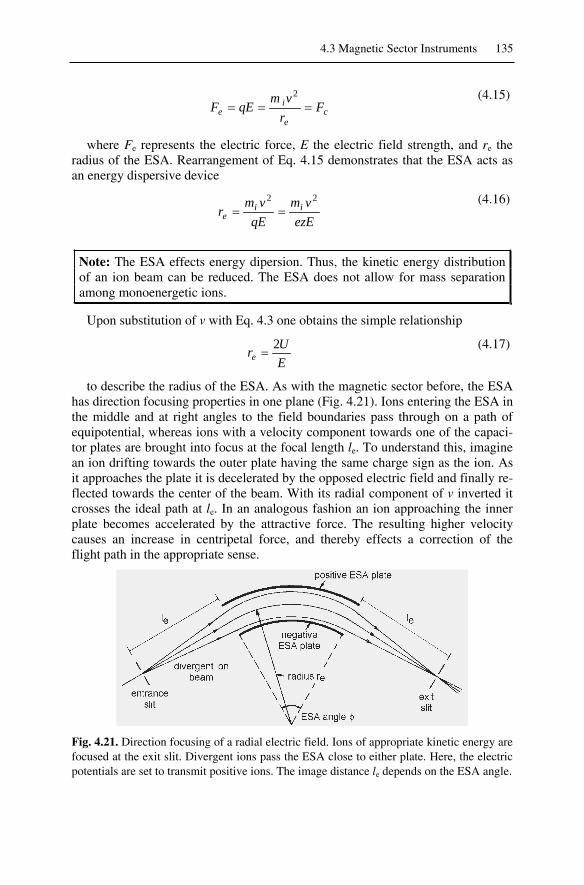
4.3 Magnetic Sector Instruments 135
ce
ie F
rvm
qEF2 (4.15)
where Fe represents the electric force, E the electric field strength, and re theradius of the ESA. Rearrangement of Eq. 4.15 demonstrates that the ESA acts asan energy dispersive device
ezEvm
qEvm
r iie
22 (4.16)
Note: The ESA effects energy dipersion. Thus, the kinetic energy distributionof an ion beam can be reduced. The ESA does not allow for mass separationamong monoenergetic ions.
Upon substitution of v with Eq. 4.3 one obtains the simple relationship
EUre
2 (4.17)
to describe the radius of the ESA. As with the magnetic sector before, the ESAhas direction focusing properties in one plane (Fig. 4.21). Ions entering the ESA inthe middle and at right angles to the field boundaries pass through on a path ofequipotential, whereas ions with a velocity component towards one of the capaci-tor plates are brought into focus at the focal length le. To understand this, imaginean ion drifting towards the outer plate having the same charge sign as the ion. Asit approaches the plate it is decelerated by the opposed electric field and finally re-flected towards the center of the beam. With its radial component of v inverted itcrosses the ideal path at le. In an analogous fashion an ion approaching the innerplate becomes accelerated by the attractive force. The resulting higher velocitycauses an increase in centripetal force, and thereby effects a correction of theflight path in the appropriate sense.
Fig. 4.21. Direction focusing of a radial electric field. Ions of appropriate kinetic energy arefocused at the exit slit. Divergent ions pass the ESA close to either plate. Here, the electricpotentials are set to transmit positive ions. The image distance le depends on the ESA angle.

136 4 Instrumentation
4.3.3.2 Double-Focusing
Energy focusing is achieved by combining a magnetic sector and an electric sectorin a way that the energy dispersion of the magnetic field is just compensated bythe energy dispersion of the electric field. Additional direction focusing is ob-tained, if the radii and angles of these fields and their mutual alignment does notdiminish the focusing properties of each of them. Then, an ion optical system isobtained that is able of focusing ions on a single image point, although these wereemerging from the ion source in (slightly) different directions and with (slightly)different kinetic energies. This is called double-focusing. Double-focusing canimprove the resolving power of a magnetic sector instrument more than ten times.The following passages present examples of double-focusing geometries that ei-ther have been milestones in instrument design [3,5] or still are incorporated inmodern mass spectrometers.
4.3.3.3 Forward Geometry
The EB design by Mattauch and Herzog combines a 31° 50' ESA with a 90° mag-netic sector producing an image plane that allows for simultaneous photographicdetection of a comparatively large m/z range. [73] This mass spectrograph attainsdouble-focusing over the total image plane resulting in resolving powers ofR > 10,000. Thus, it became the basis for numerous commercial instruments (Fig.4.22).
Fig. 4.22. Mattauch-Herzog double-focusing mass spectrograph providing direction andmomentum focusing of ions on a plane. [73] Reprinted from Ref. [1] with permission.© American Association for the Advancement of Science, 1979.
A different EB design to effect an image plane of 140 mm in length with a lin-ear mass scale for detection on a photographic plate has been published by Bain-bridge and Jordan. [74] Their paper is especially recommended, as it also nicelyillustrates the use of photoplates in these days.
Another famous type of EB arrangement has become known as Nier-Johnsongeometry (Fig. 4.23). [75] Here, the ion beam first passes through the electrostatic

4.3 Magnetic Sector Instruments 137
analyzer producing energy-resolved beams without mass dispersion in the plane ofan intermediate slit located at the focal point of the ESA. It then passes through amagnetic analyzer to achieve mass dispersion of the ions. Different from the Mat-tauch-Herzog mass spectrograph, the Nier-Johnson mass spectrometer was con-structed to be used in conjunction with a scanning magnet to focus one specificm/z after the other onto a point detector. This presented a major advantage for theuse of UV recorders or electronic data acquisition as well as for the achievementof better ion optics.
Note: Typically, on magnetic sector mass spectrometers a spectrum is producedby varying the strength of the magnetic field to successively pass through ionsof different m/z. This is termed magnetic field scan. [31]For scans linear in time, the scan rate is given in units of u s–1, e.g., 500 u s–1.For scans exponential in time, the scan rate is reported in units of s per decade,e.g., 10 s/decade means 10 s from m/z 30 to 300 or from m/z 100 to 1000.
Fig. 4.23. Nier-Johnson geometry (EB). [75] Direction and velocity focusing are shown ex-aggerated. Reprinted from Ref. [1] with permission. © American Association for theAdvancement of Science, 1979.
Nowadays, forward geometry instruments are often constructed to be used incombination with an (optional) array detector, e.g., the JEOL HX-110 (EB), theThermo Finnigan MAT 900 (EB) and the Micromass Autospec (EBE) instrumentscan be equipped in that way. The array detector is then located at the focus planeof the magnet, but different from the Mattauch-Herzog design it only covers acomparatively small m/z range simultaneously (Chap. 4.8).
4.3.3.4 Reversed Geometry
Successful constructions of reversed geometry, i.e., BE instead of forward EB de-sign, have been presented by the MAT 311 in the mid 1970s and shortly after bythe VG Analytical ZAB-2F instrument [76] based on a proposal by Hintenbergerand König. [77] The first generation ZABs were based on a magnetic sector of30 cm radius followed by an ESA of 38 cm radius. The specified resolving power(of a new instrument) was R > 70,000.

138 4 Instrumentation
Modern BE geometry instruments are presented by the Thermo Finnigan MAT90 and 95 series (Fig. 4.24), the JEOL JMS-700, the AMD Intectra AMD 403S,and basically, but not strictly as it has EBE geometry, [78] the Micromass Auto-spec.
Fig. 4.24. Schematic of the Finnigan MAT 90 double-focusing mass spectrometer with ro-tated pole faces of the magnetic sector. Reproduced from Ref. [2] with permission.© Elsevier Science, 1987.
4.3.4 Setting the Resolution of a Sector Instrument
The ion optics of a sector instrument are the analogue to a cylindrical lens in lightoptics. Accordingly, the reduction of an aperture can be used to obtain a sharperimage, i.e., to increase resolution (Chap 3.3.4). Slits are used instead of circularapertures to comply with the cylindrical properties of the ion optical system. Thesettings of the object slit (source slit, entrance slit) and the image slit (collectorslit, exit slit, detector slit) are most important. Intermediate slits may be used inaddition. Unfortunately, closing slits also means cutting off ions from the beam,and thus reduction of the transmission of the mass analyzer. In the ideal case, theimprovement of resolution by a factor of 10 goes along with a reduction in trans-mission to 10 %, in practice the effect is often even less.
Example: The influence of relative slit width on peak shape and resolution isdemonstrated on the second isotopic peak of toluene molecular ion, 13C2
12C5H8+•,
m/z 94 (Fig. 4.25). With the entrance slit at 50 µm and the exit slit at 500 µm thepeak is flat-topped (left), because a narrow beam from the entrance sweeps overthe wide open detector slit keeping the intensity constant as the scan proceeds un-til the beam passes over the other edge of the slit. Closing the exit slit to 100 µmincreases resolution to 2000 without affecting the peak height (middle), but re-duces the peak area by a factor of 4 in accordance with an increase in resolutionby the same factor. Further reduction of the exit slit width to 30 µm improves

4.3 Magnetic Sector Instruments 139
resolution at the cost of peak height (right). (Any sector instrument must behavealike, otherwise, cleaning or other maintenance are required.)
m/z
rel.
int.
[%]
R = 500 R = 2000 R = 4000
94 94
94
Fig. 4.25. The influence of relative slit width settings on peak shape and resolution on amagnetic sector instrument. The peak shape first changes from flat-topped (left) to Gaus-sian (middle) and finally resolution improves at cost of peak height (right).
Note: The ultimate resolution of a magnetic sector mass spectrometer isreached when the slits are closed to a width of a few micrometers. Often, theslit height is also reduced, e.g., from 5 to 1 mm. In daily work, the resolutionwill be set to fit the actual task, e.g., R = 1000–2000 for low resolution work,R = 3000–5000 if accurate mass determination at high scan rates is needed(GC-MS, Chap. 12) or isotopic patterns of high mass analytes have to be re-solved, or R = 7000–15,000 in slow-scanning accurate mass measurements.
4.3.5 Further Improvement of Sector Instruments
To further improve the performance of a sector instrument in terms of scan speed,resolution, transmission, and mass range, the construction, in particular that of themagnet, needs some additional refining.
The rapid change of a magnetic field suffers from hysteresis, i.e., the magneticflux does not exactly follow the change of the electric current through the coils intime, but lags behind due to the induction of eddy currents. On one side, thiscauses problems in creating a scan perfectly linear in time, on the other this pre-vents high scan rates as required for GC-MS. Lamination of the yoke substantiallyreduces these problems [79] and is part of all modern sector instruments.
Another problem is due to fringing fields. To reduce these defocusing effects atthe entrance and exit of the field, the pole pieces of the yoke of the electromagnetgenerally have specially shaped edges (Fig. 4.20).
In order to extend the mass range one either has to increase the field strength orthe radius of the magnet. However, there are limitations of the field strength withnon-superconducting magnets at about 2.4 T. Instead of simply enlarging the ra-dius, the pole faces of the magnet can be rotated to preserve a compact design byreduction of its focal length (Figs. 4.20, 4.24, 4.27, 4.28). Alternatively, inhomo-geneous fields can be applied. For details refer to the article by Brunnée. [2]

140 4 Instrumentation
Furthermore, pure EB and BE designs are somewhat limited concerning thetransmittance through a narrow magnet gap as compared to instrument designsusing some quadrupole (q) or hexapole (h) lenses to form the ion beam(Figs. 4.24, 4.26–28). [80,81] However, quadrupole and hexapole lenses do notalter the effective instrument geometry, i.e., a qqBqE analyzer behaves like a pureBE analyzer in any mode of operation.
Fig. 4.26. Types and shapes of ion optical elements used in magnetic sector instruments. Bycourtesy of Thermo Electron (Bremen) GmbH.
4.3.6 Tandem MS with Magnetic Sector Instruments
There are multiple ways of detecting metastable and collision-induced dissocia-tions with magnetic sector instruments. [82] In fact, the phenomenon was discov-ered with this particular type of mass analyzer (Chap. 2.7.1). [83,84]
4.3.6.1 Dissociations in the FFR Preceding the Magnetic Sector
Dissociation in a field-free region (FFR) not only causes partitioning of ion kineticenergy (Eq. 4.10), but also goes with partitioning of momentum p
1
2)1()2(
i
imm m
mpp
(4.18)
As we have conservation of velocity, i.e., v1 = v2 v, the momentum of a frag-ment ion m2
+ formed in a FFR preceding the magnetic sector is different from thatof such a fragment ion arising from the ion source. The ion formed by metastableion dissociation thus passes the magnet as if it had the virtual mass m*
1
22*
mm
m(4.19)

4.3 Magnetic Sector Instruments 141
Fig. 4.27. Photograph of a JEOL JMS-700 double focusing magnetic sector instrument.
Fig. 4.28. Schematic design of the above instrument. Horizontal (x) and vertical (y) trajec-tories are also shown. Quadrupole lenses are used to improve the transmission of the mag-netic sector, thus resulting in a qqBqE geometry. Adapted from Ref. [80] with permission.© Elsevier Science, 1985.
Note: This explains the occurence of “diffuse” peaks due to metastable ion dis-sociations at fractional m/z values in the B scan spectra of B and EB instru-ments (Chap. 2.7.1). [83,84] In turn, the mass spectra obtained from BE in-struments do not show any metastable ion peaks in normal operation.

142 4 Instrumentation
4.3.6.2 Mass-Analyzed Ion Kinetic Energy Spectra
Mass-analyzed ion kinetic energy spectra (MIKES) [85,86] can be measured onBE geometry instruments only. The precursor ion is selected by the magnet andthe fragments from dissociations of m1
+ in the 2.FFR are analyzed by the ESA dueto their kinetic energy. This is possible, because the kinetic energy of the precur-sor is distributed among the product ion and the neutral. Derived from Eq. 4.10 wehave
21
22
1
2
1
2
vmvm
mm
EE
i
i
i
i (4.20)
Thus, scanning of the electric field (E scan) yields an energy spectrum whichallows for the determination of the kinetic energy release (KER) from the peakwidth (Chap. 2.8.2). The MIKE technique provides good precursor ion resolution,but poor product ion resolution according to the influence of KER on peak shapes.
Note: In MIKES E1 represents the full electric field necessary to transmit theprecursor ion m1
+ through the ESA, and E1 is often denoted as starting value E0.Then, the abscissa of MIKE spectra is divided in units of E/E0 = m2/m1.
4.3.6.3 B/E = Constant Linked Scan
Ions decomposing in the 1.FFR of BE and EB instruments can be detected usingthe B/E = constant linked scan. [87] Due to the proportionality of B and p(Eq. 4.13) ions are transmitted through the magnet if
1
2
1
2
1
2
1
2
i
i
i
i
mm
pp
vmvm
BB (4.21)
For their subsequent passage through the ESA, Eq. 4.20 has to be satisfied.Therefore, we have for the passage through both fields
1
2
1
2
1
2
i
i
mm
EE
BB (4.22)
which defines the conditions for a scan as B/E = constant. Thus, B and E haveto be scanned together, i.e., in a linked fashion. The B/E = constant linked scanprovides good fragment ion resolution (R 1000) but poor precursor ion resolu-tion (R 200). As with all linked scans, there is a risk of artefact peaks [88-91]because linked scan techniques represent no true tandem MS where MS1 and MS2are clearly separate. The use of two complementary scan modes is therefore sug-gested to avoid ambiguities. [89]

4.3 Magnetic Sector Instruments 143
4.3.6.4 Additional Linked Scan Functions
Whereas TOF instruments solely allow for the detection of product ions of a se-lected precursor, sector instruments offer additional modes of operation: i) to ex-clusively identify product ions of a particular precursor ion, so-called precursorion scans, [92,93] or ii) to detect only ions formed by loss of a specific neutralmass, so-called constant neutral loss (CNL) scan. [94] This can be achieved bysome technically more demanding linked scans (Table 4.2). [95-98]
Table 4.2. Common scan laws for the detection of metastable ion dissociations on magneticsector mass spectrometersa)
SelectedMass
Scan Law KER fromPeakWidth?
Analyzerand FFR
Properties
m1 B = Bm1,and E/E0 = m2/m1
yes BE2.FFR
mass-analyzed ion kineticenergy spectrum (MIKES),E is scanned
m1 B/E = B0(1)/E0
i.e., B/E = const.no BE or EB
1.FFRlinked scan, poor precursorbut good product ionresolution
m2 B2/E = B22/E0
i.e., B2/E = const.yes BE or EB
1.FFRlinked scan, poor productbut good precursor ionresolution, demands pre-cise control of B
m2 B2�E = B0(2) E0
i.e., B2 E = const.no BE
2.FFRlinked scan, resolutioncontrolled by that of B,needs precise control of B
mn (B/E) [1–(E/E0)]1/2
i.e., E/E0 = m2/m1
= 1–(mn/m1)
no BE or EB1.FFR
constant neutral loss(CNL), linked scan
a) All scans listed use constant acceleration voltage U. Scanning of U offers additional scanmodes. However, scanning of U over a wide range causes detuning of the ion source.
Example: The B2E = const. linked scan [93] has been employed to quantify thecaffeine content of coffee, black tea, and caffeinated cola softdrinks. [99] Caf-feine, M+• = 194, was determined by spiking the sample with a known concentra-tion of [D3]caffeine, M+• = 197, as internal standard. Both molecular ions dissoci-ate to form a fragment ion at m/z 109 which was selected as m2
+. Then, theprecursor ion scan showed either molecular ion, m1
+ and [D3]m1+, as precursor of
the ion at m/z 109. The ratio of peak intensities was taken as a measure for therelative concentration of analyte and labeled standard (Fig. 4.29).

144 4 Instrumentation
Fig. 4.29. CID B2E spectrum of the ion m/z 109 of a caffeinated cola softdrink with[D3]caffeine as internal standard. Different Cola brands yielded 73–158 mg l–1. Adaptedfrom Ref. [99] with permission. © John Wiley & Sons, 1983.
Note: Precursor ion scanning suggests some sort of measuring into the past.One should be aware that also in precursor ion scans the product ions are de-tected, but this is accomplished in a way that only fragments of a selected pre-cursor ion mass can reach the detector, hence the term.
4.3.6.5 Multi-Sector Instruments
Multi-sector instruments, typically four-sector machines, have been developed inthe 1980s to combine high precursor ion resolution with high fragment ion resolu-tion. [100,101] Their major field of application was sequencing of biomoleculesby FAB-CID-MS/MS (Chap. 9.4.6).
Commercial representatives are the JEOL HX110/HX110A (EBEB, Fig. 4.30),the JEOL MStation-T (BEBE), or the Micromass AutospecT (EBEBE). As indus-trial laboratories are governed by high-throughput and other economic aspects,modern TOF/TOF, QqTOF and FT-ICR instruments have almost replaced theseimpressing “dinosaurs” weighing some 4–5 tons and having about 3 5 m foot-print. Numerous custom-built four-sector instruments are still operated in labora-tories devoted to gas phase ion chemistry. [102]
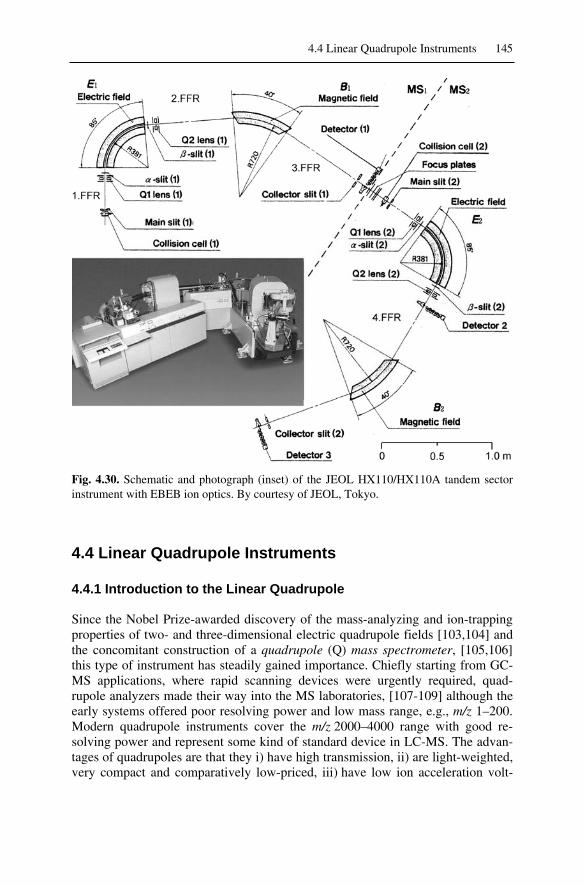
4.4 Linear Quadrupole Instruments 145
Fig. 4.30. Schematic and photograph (inset) of the JEOL HX110/HX110A tandem sectorinstrument with EBEB ion optics. By courtesy of JEOL, Tokyo.
4.4 Linear Quadrupole Instruments
4.4.1 Introduction to the Linear Quadrupole
Since the Nobel Prize-awarded discovery of the mass-analyzing and ion-trappingproperties of two- and three-dimensional electric quadrupole fields [103,104] andthe concomitant construction of a quadrupole (Q) mass spectrometer, [105,106]this type of instrument has steadily gained importance. Chiefly starting from GC-MS applications, where rapid scanning devices were urgently required, quad-rupole analyzers made their way into the MS laboratories, [107-109] although theearly systems offered poor resolving power and low mass range, e.g., m/z 1–200.Modern quadrupole instruments cover the m/z 2000–4000 range with good re-solving power and represent some kind of standard device in LC-MS. The advan-tages of quadrupoles are that they i) have high transmission, ii) are light-weighted,very compact and comparatively low-priced, iii) have low ion acceleration volt-

146 4 Instrumentation
ages, and iv) allow high scan speeds, since scanning is realized by solely sweepingelectric potentials.
4.4.2 Principle of the Linear Quadrupole
A linear quadrupole mass analyzer consists of four hyperbolically or cyclindricallyshaped rod electrodes extending in the z-direction and mounted in a square con-figuration (xy-plane, Figs. 4.31, 4.32). The pairs of opposite rods are each held atthe same potential which is composed of a DC and an AC component.
Fig. 4.31. Cross section of a quadrupole (a) for the cyclindrical approximation and (b) forthe hyperbolic profile of the rods. The electric field is zero along the dotted lines, i.e., alongthe asymptotes in (b). (a) Courtesy of Waters Corp., MS Technologies, Manchester, UK.
Fig. 4.32. Schematic (a) and photograph (b) of a linear quadrupole mass analyzer. Bycourtesy of JEOL, Tokyo (a) and Waters Corp., MS Technologies, Manchester, UK. (b).
As an ion enters the quadrupole assembly in z-direction, an attractive force isexerted on it by one of the rods with its charge actually opposite to the ioniccharge. If the voltage applied to the rods is periodic, attraction and repulsion inboth the x- and y-directions are alternating in time, because the sign of the electricforce also changes periodically in time. If the applied voltage is composed of a DC

4.4 Linear Quadrupole Instruments 147
voltage U and a radiofrequency (RF) voltage V with the frequency the total po-tential 0 is given by
tVU cos0 (4.23)
Thus, the equations of motion are
0)cos(
0)cos(
20
2
2
20
2
2
ytVUrme
dtyd
xtVUrme
dtxd
i
i
(4.24)
In case of an inhomogenous periodic field such as the above quadrupole field,there is a small average force which is always in the direction of the lower field.The electric field is zero along the dotted lines in Fig. 4.31, i.e., along the asymp-totes in case of the hyperbolic electrodes. It is therefore possible that an ion maytraverse the quadrupole without hitting the rods, provided its motion around the z-axis is stable with limited amplitudes in the xy-plane. Such conditions can be de-rived from the theory of the Mathieu equations, as this type of differential equa-tions is called. Writing Eq. 4.24 dimensionless yields
0)2cos2(
0)2cos2(
2
2
2
2
yqad
yd
xqad
xd
yy
xx(4.25)
The parameters a and q can now be obtained by comparison with Eq. 4.24
2,2,4
220
220
trmeVqq
rmeUaa
iyx
iyx
(4.26)
For a given set of U, V and the overall ion motion can result in a stable tra-jectory causing ions of a certain m/z value or m/z range to pass the quadrupole.Ions oscillating within the distance 2r0 between the electrodes will have stabletrajectories. These are transmitted through the quadrupole and detected thereafter.The path stability of a particular ion is defined by the magnitude of the RF voltageV and by the ratio U/V.
By plotting the parameter a (ordinate, time invariant field) versus q (abscissa,time variant field) one obtains the stability diagram of the two-dimensional quad-rupole field. This reveals the existence of regions where i) both x- and y-trajectories are stable, ii) either x- or y-trajectories are stable, and iii) no stable ionmotion occurs (Fig. 4.33). [109] Among the four stability regions of the first cate-gory, region I is of special interest for the normal mass-separating operation of thelinear quadrupole (Fig. 4.34). [103,104]

148 4 Instrumentation
Fig. 4.33. Stability diagram for a linear quadrupole analyzer showing four stability regions(I–IV) for x- and y-motion. Reproduced from Ref. [109] with permission. © John Wiley &Sons Inc., 1986.
Fig. 4.34. Detail of the upper half of region I of the stability diagram for a linear quad-rupole analyzer. Reproduced from Ref. [104] with permission. © World Scientific Pub-lishing, 1993.
If the ratio a/q is chosen so that 2U/V = 0.237/0.706 = 0.336, the xy-stabilityregion shrinks to one point, the apex, of the diagram (cf. Eq. 4.26, Fig. 4.34). Byreducing a at constant q, i.e., reducing U relative to V, an increasingly wider m/zrange can be transmitted simultaneously. Sufficient resolution is achieved as longas only a small m/z range remains stable, e.g., one specific m/z ± 0.5 for unitresolution (Chap. 4.4.3). Thus, the width ( q) of the stable region determines theresolution (Fig. 4.35). By varying the magnitude of U and V at constant U/V ratio

4.4 Linear Quadrupole Instruments 149
an U/V = constant linked scan is obtained allowing ions of increasingly higher m/zvalues to travel through the quadrupole.
Overall, the quadrupole analyzer rather acts as a mass filter than as a momen-tum (B sector) or energy (ESA) spectrometer; hence the widespread use of theterm quadrupole mass filter.
Fig. 4.35. Scanning of linear quadrupoles means performing a U/V = constant linked scan.Resolution is adjusted by variation of the a/q ratio: higher a/q ratio means higher resolu-tion, and is represented by a steeper “scan line”; R1 > R2 > R3.
Note: Scanning of any quadrupole means shifting the whole stability diagramalong a “scan line”, because each m/z value has a stability diagram of its own(Figs. 4.34, 4.35). The representation of a scan by a “scan line” would only becorrect in case of infinite resolution, i.e., if the apices were connected. Any realresolution is represented by a horizontal line across the stability region, whereonly ions falling in the region above that line are transmitted.
Fig. 4.36. Projection of a 3D trajectory simulation of a stable ion onto the x- and y-coordinate. Reproduced from Ref. [110] with permission. © Elsevier Science, 1998.
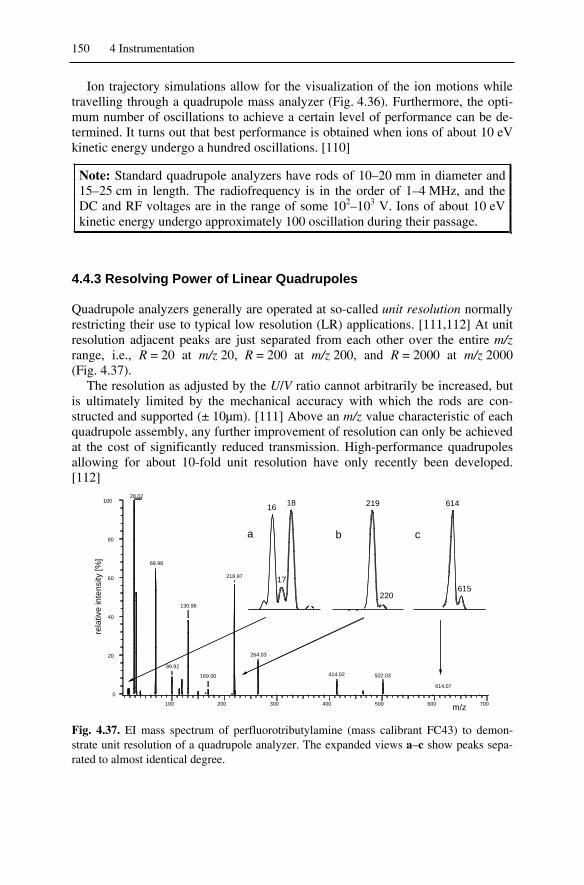
150 4 Instrumentation
Ion trajectory simulations allow for the visualization of the ion motions whiletravelling through a quadrupole mass analyzer (Fig. 4.36). Furthermore, the opti-mum number of oscillations to achieve a certain level of performance can be de-termined. It turns out that best performance is obtained when ions of about 10 eVkinetic energy undergo a hundred oscillations. [110]
Note: Standard quadrupole analyzers have rods of 10–20 mm in diameter and15–25 cm in length. The radiofrequency is in the order of 1–4 MHz, and theDC and RF voltages are in the range of some 102–103 V. Ions of about 10 eVkinetic energy undergo approximately 100 oscillation during their passage.
4.4.3 Resolving Power of Linear Quadrupoles
Quadrupole analyzers generally are operated at so-called unit resolution normallyrestricting their use to typical low resolution (LR) applications. [111,112] At unitresolution adjacent peaks are just separated from each other over the entire m/zrange, i.e., R = 20 at m/z 20, R = 200 at m/z 200, and R = 2000 at m/z 2000(Fig. 4.37).
The resolution as adjusted by the U/V ratio cannot arbitrarily be increased, butis ultimately limited by the mechanical accuracy with which the rods are con-structed and supported (± 10µm). [111] Above an m/z value characteristic of eachquadrupole assembly, any further improvement of resolution can only be achievedat the cost of significantly reduced transmission. High-performance quadrupolesallowing for about 10-fold unit resolution have only recently been developed.[112]
100 200 300 400 500 600 700
0
20
40
60
80
10028.02
68.98
99.92
130.96
169.00
218.97
264.03
414.02 502.03
614.07
16 18 614
61517
a c
rela
tive
i nte
nsity
[%]
m/z
219
220
b
Fig. 4.37. EI mass spectrum of perfluorotributylamine (mass calibrant FC43) to demon-strate unit resolution of a quadrupole analyzer. The expanded views a–c show peaks sepa-rated to almost identical degree.

4.4 Linear Quadrupole Instruments 151
4.4.3.1 Performance of Cylindrical versus Hyperbolic Rods
Theoretically, each electrode should have a hyperbolic cross section for optimizedgeometry of the resulting quadrupole field, and thus for optimized performance.[103,104] However, cyclindrical rods are often employed instead, for ease ofmanufacture. By adjusting the radius of the rods carefully (r = 1.1468r0), a hyper-bolic field may be approximated. [113] However, even slight distortions of theideal quadrupole field either from interference with external fields or due to lowmechanical precision or inadequate shape of the device cause severe losses oftransmission and resolution. [114] The expected advantages of hyperbolic rods[115] have been demonstrated by ion trajectory calculations: [110,116] circularrods cause a reduction in macromotion frequency because of an increased resi-dence time of the ions in close vicinity to the rods; this in turn means reducedresolution.
4.4.3.2 High-Resolution with Quadrupole Mass Analyzers
Besides optimization of mechanical accuracy, the resolving power of quadrupolescan be improved by innovative modes of operation. The operation as a multiplepass system with ion reflection at either end extends the flight path and thus thenumber of RF cycles. The same effect can be obtained from increased radiofre-quency and for ions travelling slower through the device. [111] Alternatively, thequadrupole may be operated in an other than the first stability region, e.g., in thesecond or fourth; [111,117] doing so requires higher ion kinetic energies of about750 eV.
4.4.4 RF-Only Quadrupoles
Upon setting the DC voltage U to zero, the quadrupole becomes a wide band passfor ions. In the stability diagram this mode of operation is represented by an op-eration line equivalent to the q-axis (Fig. 4.34). Such devices are commonlyknown as RF-only quadrupoles (q). Hexapoles and octopoles are used analo-gously, because these possess better wide band pass characteristics. This propertyled to the widespread application of electric quadrupoles, hexapoles, and octopolesas ion guides and collision cells.
Ion guides are needed to transfer ions of low kinetic energy from one region toanother without substantial losses, [118] e.g., from an atmospheric pressure ionsource (ESI, APCI) to the entrance of a mass analyzer (Chap. 11).
Collisional cooling of ions travelling slowly through RF-only multipoles can beeffected during transit if some collision gas is present. [119] Collisional coolingalso substantially reduces the axial motion of the ions causing a confinement ofthe ion beam toward the central axis of the quadrupole which in turn increases thetransmission efficiency through an exit aperture. This phenomenon is known ascollisional focusing. [120]
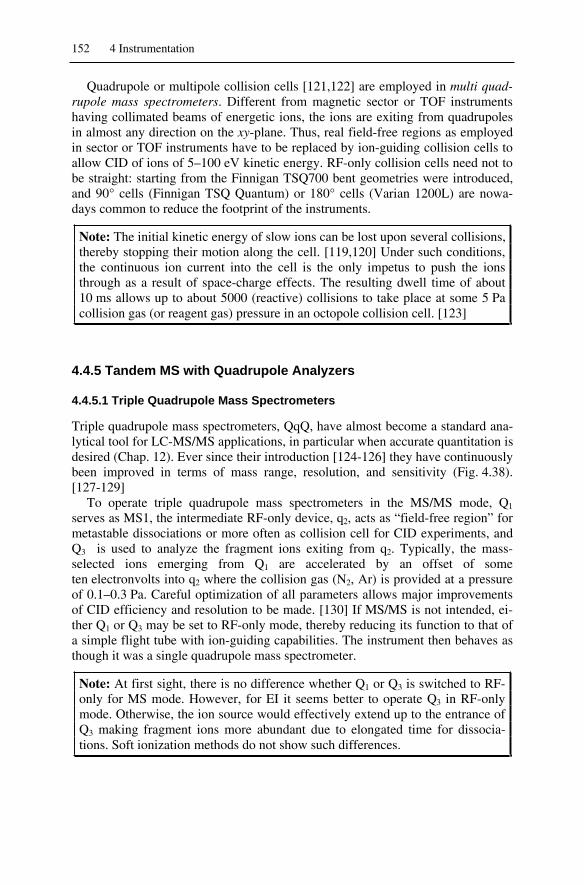
152 4 Instrumentation
Quadrupole or multipole collision cells [121,122] are employed in multi quad-rupole mass spectrometers. Different from magnetic sector or TOF instrumentshaving collimated beams of energetic ions, the ions are exiting from quadrupolesin almost any direction on the xy-plane. Thus, real field-free regions as employedin sector or TOF instruments have to be replaced by ion-guiding collision cells toallow CID of ions of 5–100 eV kinetic energy. RF-only collision cells need not tobe straight: starting from the Finnigan TSQ700 bent geometries were introduced,and 90° cells (Finnigan TSQ Quantum) or 180° cells (Varian 1200L) are nowa-days common to reduce the footprint of the instruments.
Note: The initial kinetic energy of slow ions can be lost upon several collisions,thereby stopping their motion along the cell. [119,120] Under such conditions,the continuous ion current into the cell is the only impetus to push the ionsthrough as a result of space-charge effects. The resulting dwell time of about10 ms allows up to about 5000 (reactive) collisions to take place at some 5 Pacollision gas (or reagent gas) pressure in an octopole collision cell. [123]
4.4.5 Tandem MS with Quadrupole Analyzers
4.4.5.1 Triple Quadrupole Mass Spectrometers
Triple quadrupole mass spectrometers, QqQ, have almost become a standard ana-lytical tool for LC-MS/MS applications, in particular when accurate quantitation isdesired (Chap. 12). Ever since their introduction [124-126] they have continuouslybeen improved in terms of mass range, resolution, and sensitivity (Fig. 4.38).[127-129]
To operate triple quadrupole mass spectrometers in the MS/MS mode, Q1
serves as MS1, the intermediate RF-only device, q2, acts as “field-free region” formetastable dissociations or more often as collision cell for CID experiments, andQ3 is used to analyze the fragment ions exiting from q2. Typically, the mass-selected ions emerging from Q1 are accelerated by an offset of someten electronvolts into q2 where the collision gas (N2, Ar) is provided at a pressureof 0.1–0.3 Pa. Careful optimization of all parameters allows major improvementsof CID efficiency and resolution to be made. [130] If MS/MS is not intended, ei-ther Q1 or Q3 may be set to RF-only mode, thereby reducing its function to that ofa simple flight tube with ion-guiding capabilities. The instrument then behaves asthough it was a single quadrupole mass spectrometer.
Note: At first sight, there is no difference whether Q1 or Q3 is switched to RF-only for MS mode. However, for EI it seems better to operate Q3 in RF-onlymode. Otherwise, the ion source would effectively extend up to the entrance ofQ3 making fragment ions more abundant due to elongated time for dissocia-tions. Soft ionization methods do not show such differences.

4.4 Linear Quadrupole Instruments 153
Fig. 4.38. Schematic of a triple quadrupole mass spectrometer. Reproduced from Ref. [125]with permission. © Elsevier Science, 1979.
4.4.5.2 Scan Modes for Tandem MS with Triple Quadrupole Instruments
In triple quadrupole instruments Q1 and Q3 are operated independently as MS1and MS2, respectively, making MS/MS a straightforward matter. The experimen-tal setups for product ion, precursor ion, and neutral loss scanning are summarizedin Table 4.3.
Table 4.3. Scan modes of triple quadrupole instruments.
Scan Modea) Operation of Q1 Operation of q2 Operation of Q3
product ion,define m1
no scan, select m1 metastable or CID scan up to m1 to col-lect its fragments
precursor ion,define m2
scan from m2 up-wards to cover po-tential precursors
metastable or CID no scan, select m2
constant neutral loss,define m
scan desired range metastable or CID scan range shifted bym to low mass
a) Masses for reaction m1+ m2
+ + n.
4.4.6 Linear Quadrupole Ion Traps
Collisional cooling may bring translational ion motion along the axis of an RF-only multipole to a halt, thereby enabling ion storage within that multipole. [119]Placing electrodes of higher potential near the front and back ends of RF-onlymultipoles creates a trapping potential within the multipole. [131] Such devicesare known as linear (quadrupole) ion traps (LIT).
Since a few years, LITs belong to a rapidly expanding area of instrument de-velopment. Recently, LITs have been established to collect ions externally beforeinjecting them in bunches into an FT-ICR [132] or TOF analyzer. [131,133] Evenextensive H/D exchange in the gas phase prior to mass analysis can be accom-plished this way.

154 4 Instrumentation
LITs capable of scanning, axial or radial excitation of ions, and precursor ionselection for MS/MS experiments [118,134-136] have lately been incorporated incommercial mass spectrometers (Fig. 4.39). The replacement of Q3 in a QqQ in-strument with a scanning LIT, for example, enhances its sensitivity and offers newmodes of operation (Applied Biosystems Q-Trap). Introduction of a scanning LIT[118,135] as MS1 in front of an FT-ICR instrument (Thermo Electron LTQ-FT)shields the ultrahigh vacuum of the FT-ICR from collision gas and decompositionproducts in order to operate under optimum conditions. In addition, the LIT accu-mulates and eventually mass-selects ions for the next cycle while the ICR cell isstill busy with the previous ion package.
Fig. 4.39. Schematic of a linear quadrupole ion trap with scanning capability. Applyinghigher potential to the front and back sections creates a trapping potential for ions in thecenter section. Ions are exiting through the slot in one of the four rods. Adapted from Ref.[135] by permission. © Elsevier Science, 2002.
Note: Here, we are going beyond the domain of the classical mass spectro-metric time scale (Chap. 2.7). In ion trapping devices, ions are stored for milli-seconds to seconds, i.e., 103–106 times longer than their lifetimes in beam in-struments.
4.5 Three-Dimensional Quadrupole Ion Trap
4.5.1 Introduction to the Quadrupole Ion Trap
The quadrupole ion trap (QIT) creates a three-dimensional RF quadrupole field tostore ions within defined boundaries. Its invention goes back to 1953, [103-105]however, it took until the mid-1980s to access the full analytical potential of quad-rupole ion traps. [137-140] The first commercial quadrupole ion traps were incor-porated in GC-MS benchtop instruments (Finnigan MAT ITD and ITMS). Elec-tron ionization was effected inside the trap by admitting the GC effluent and abeam of electrons directly into the storage volume of the trap. Later, external ionsources became available, and soon a large number of ionization methods could be

4.5 Three-Dimensional Quadrupole Ion Trap 155
fitted to the QIT analyzer. [141-143] Modern QITs cover ranges up to aboutm/z 3000 with fast scanning at unit resolution, and in addition, offer “zoom scans”over smaller m/z ranges at higher resolution. Accurate mass measurements withQITs are to be expected in the near future. [140] Moreover, the tandem-in-timecapabilities of QITs can be employed to conveniently perform MSn experiments,[138,139] and their compact size is ideal for field applications. [11]
Note: Paul himself preferred to call the device “Ionenkäfig” (ion cage) ratherthan the nowadays accepted term quadrupole ion trap because it does not ac-tively act to catch ions from outside. The acronym QUISTOR derived fromquadrupole ion store was also widespread in use.
4.5.2 Principle of the Quadrupole Ion Trap
The QIT consists of two hyperbolic electrodes serving as end caps and a ringelectrode that replaces two of the linear quadrupole rods, i.e., it could theoreticallybe obtained by rotating a linear quadrupole with hyperbolic rods through 360°(Fig. 4.40, 4.41). Thus, a section through the rz-plane of the QIT closely resem-bles that of the entrance of linear quadrupole with hyperbolic rods (cf. Fig. 4.31b).[107,141] However, the angle between the asymptotes enclosing the ring electrodeis 70.5° (2 arctan(1/ 2)) instead of 90°. The end caps are electrically connectedand the DC and RF potentials are applied between them and the ring electrode.The working principle of the QIT is based on creating stable trajectories for ionsof a certain m/z or m/z range while removing unwanted ions by colliding themwith the walls or by axial ejection from the trap due to their unstable trajectories.[137]
Fig. 4.40. Schematic of a quadrupole ion trap. (a) QIT with external ion source (illustrationstretched in z-direction) and (b) section in the rz-plane (in scale). (a) Reproduced from Ref.[144] by permission. © John Wiley & Sons, 2000.

156 4 Instrumentation
Fig. 4.41. Electrodes of the Finnigan MAT ITS40 quadrupole ion trap. By courtesy ofThermo Electron (Bremen) GmbH.
For the QIT, the electric field has to be considered in three dimensions. Let thepotential 0 be applied to the ring electrode (xy-plane) while – 0 is applied to thehyperbolic end caps. Then, the field can be described in cylindrical coordinates bythe expression [137,141]
)2sincos( 222222
0
0,, zrr
rzyx
(4.27)
Because of cos2 + sin2 = 1 this reduces to
)2( 222
0
0,, zr
rzyx
(4.28)
The equations of motion of an ion in such a field are
0)cos(2
0)cos(4
20
2
2
20
2
2
rtVUrme
dtrd
ztVUrme
dtzd
i
i
(4.29)
Solving these differential equations which are again of the Mathieu type yieldsthe parameters az and qz
220
220
82,162rmeVqq
rmeUaa
irz
irz
(4.30)
where = 2 f and f is the fundamental RF frequency of the trap ( 1 MHz).To remain stored in the QIT, an ion has to be simultaneously stable in the r and zdirections. The occurrence of stable ion trajectories is determined by the stability

4.5 Three-Dimensional Quadrupole Ion Trap 157
parameters r and z which depend on the parameters a and q. The borders of thefirst stability region are defined by 0 < r, z < 1. [145]
A stability diagram can be drawn where the stability region closest its origin isof greatest importance for the operation of the QIT (Fig. 4.42). At a given U/V ra-tio, ions of different m/z are found along a straight line crossing the stability re-gion. Ions of higher m/z are located nearer to the origin than lighter ones. The re-gions of stability as plotted in the a/q plane are represented as envelopes ofcharacteristic shape. Ions with their m/z value inside the boundaries are stored inthe QIT. The lower limit of the trapped m/z range is defined by qz = 0.908.
4.5.2.1 Visualization of Ion Motion in the Ion Trap
The way the three-dimensional quadrupole field acts to keep ions within a certainvolume, i.e., within a potential well some electron volts in depth, can be illustratedby a mechanical analogue: A ball has to be prevented from rolling from a saddleby rotating the saddle just right to bring the ball back to the middle before it canleave the surface via one of the steeply falling sides (Fig. 4.43). Paul demonstratedthe dynamic stabilization of up to three steel balls by such a device in his Noblelecture. [103,104]
The trajectories of low-mass ions in a QIT were shown to be similar to thoseobserved for charged aluminum dust particles. [146-149] Wuerker recorded Lis-sajous trajectories, superimposed by the RF drive frequency, as a photomicrograph(Fig. 4.44). [146] The complex motion of the ions is the result of the two superim-posed secular oscillations in r and z direction.
The use of a light buffer gas (0.1 Pa He) to dampen the ion motion towards thecenter of the trap significantly enhances resolution and sensitivity of the QIT.[150]
4.5.3 Operation of the Quadrupole Ion Trap
4.5.3.1 Mass-Selective Stability Mode
The whole range of ions is generated within or admitted to the QIT, but solely ionsof one particular m/z are trapped at a time by setting appropriate parameters of theQIT. Then, the stored ions are pulsed out of the storage volume by applying anegative pulse to one of the endcaps. [151,152] Thus, they hit the detector locatedbehind a hole in the center of one of the endcaps. A full-scan mass spectrum isobtained by addition of several hundred single steps, one for each nominal m/zvalue. This is the so-called mass-selective stability mode of the QIT. [153,154]The mass-selective stability mode is no longer in use, because it is too slow andprovides poor sensitivity as most ions are wasted.

158 4 Instrumentation
Fig. 4.42. Stability diagram for the quadrupole ion trap. The points collected on a commonline mark the a/q values of a set of ions. Each line results from different settings of the U/Vratio. Reproduced from Ref. [137] by permission. © John Wiley and Sons, 1989.
Fig. 4.43. Visualization of ion motion in the ion trap. (a) Mechanical analogue of the QIT.(b) Photograph of ion trajectories of charged aluminum particles in a quadrupole ion trap.(a) Reproduced from Ref. [104] with permission. © World Scientific Publishing, 1993.(b) Reproduced from Ref. [146] with permission. © American Institute of Physics, 1959.

4.5 Three-Dimensional Quadrupole Ion Trap 159
4.5.3.2 Mass-Selective Instability Mode
First, the full m/z range of interest is trapped within the QIT. The trapped ions mayeither be created inside the QIT or externally. Then, with the end caps groundedan RF-voltage scan (V) is applied to the ring electrode causing consecutive ejec-tion of ions in the order of their m/z values. This is known as mass-selective insta-bility (ejection) mode. [150,155] It can be represented in the stability diagram by ahorizontal line from the origin to the point of axial ejection at qz = 0.908. Thetiming sequence is shown in Fig. 4.44.
Fig. 4.44. Timing sequence used for mass-selective instability mode (about 1.5 cyclesshown). With an external ion source the ionization time is replaced by the ion injectionpulse. Reproduced from Ref. [150] by permission. © Elsevier Science, 1984.
4.5.3.3 Resonant Ejection
Modern QITs employ the effects of resonant ejection to remove ions of succes-sively increasing m/z value from the storage volume, i.e., to achive a scan. In anideal QIT, the motions of the ions in radial and axial directions are mutally inde-pendent. Their oscillations can be described by a radial and an axial secular fre-quency, each of them being a function of the Mathieu trapping parameters a and q.If a supplementary RF voltage which matches the axial secular frequency is ap-plied to the end caps, resonant ejection of ions occurs at q < 0.908 (Fig. 4.42).[156] Excitation occurs when the frequency of a supplementary RF signal matchesthe secular frequency of a trapped ion in z direction. The secular frequency com-ponents in axial direction ( z) are given by z = (n + z/2) , where representsthe angular frequency, n is an integer, and z is determined by the working pointof an ion within the stability diagram. [157] In the special case when z = 1 andn = 0, the fundamental secular frequency is exactly half of the RF drive frequencyapplied between ring electrode and end caps.
Example: To effect resonant ejection for the set of z = 0.5 and n = 0 we havez = (0 + 0.5/2) = 0.25 , i.e., 1/4 of the RF drive frequency has to be applied to
eject ions at the z = 0.5 borderline. By scanning the voltage of the RF drive fre-quency upwards, ions of inreasing m/z ratio are successively ejected.

160 4 Instrumentation
Scans based on resonant ejection may either be carried out in a forward, i.e.,from low to high mass, or a reverse manner. This allows for the selective storageof ions of a certain m/z value by elimination of ions below and above that m/zvalue from the trap. Thus, it can serve for precursor ion selection in tandem MSexperminents. [156,158] Axial excitation can also be used to cause collision-induced dissociation (CID) of the ions as a result of numerous low-energy colli-sions with the helium buffer gas that is present in the trap in order to dampen theion motion. [150,156] A substantial increase of the mass range is realized by re-duction of both the RF frequency of the modulation voltage and the physical sizeof the QIT. [154,159,160]
4.5.3.4 Axial Modulation
Ion trapping devices are sensitive to overload because of the detrimental effects ofcoulombic repulsion on ion trajectories. The maximum number of ions that can bestored in a QIT is about 106–107, but it reduces to about 103–104 if unit massresolution in an RF scan is desired. Axial modulation, a sub-type of resonant ejec-tion, allows to increase the number of ions stored in the QIT by one order of mag-nitude while maintaining unit mass resolution. [160,161] During the RF scan, themodulation voltage with a fixed amplitude and frequency is applied between theend caps. Its frequency is chosen slightly below 1/2 of the fundamental RF fre-quency, because for z 1, e.g., z = 0.98, we have z = (0 + 0.98/2) = 0.49 .At the stability boundary, ion motion is in resonance with this modulation voltage,and thus ion ejection is facilitated. Axial modulation basically improves the mass-selective instability mode of operation.
If resolution is not important, scanning of QITs can be very fast, a property thatcan be employed to make a pre-scan. Then, the result of the pre-scan is used toadjust the number of ions inside the QIT close to the optimum for the subsequentanalytical scan. Such an automatic gain control (AGC) [138,162] gives increasedsensitivity at low sample flow and avoids overload of the QIT at high sampleflow.
Provided sufficiently high scan rates are also available whilst resolution is pre-served, the pre-scan can be omitted. Instead, a trend analysis based on a set of twoor three preceding analytical scans can be performed. This procedure avoidswasting of ions and results in further optimization of the filling level of the QIT.The exploitation of the phenomenon of nonlinear resonances turned out to be ofkey importance for the realization of this method.
Example: Tandem mass spectrometric experiments in quadrupole ion traps areperformed by combining the techniques of resonant ejection, and forward and re-verse scanning to achieve an optimum in precursor ion selection, ion activation,and fragment ion scanning (Fig. 4.45). [156]
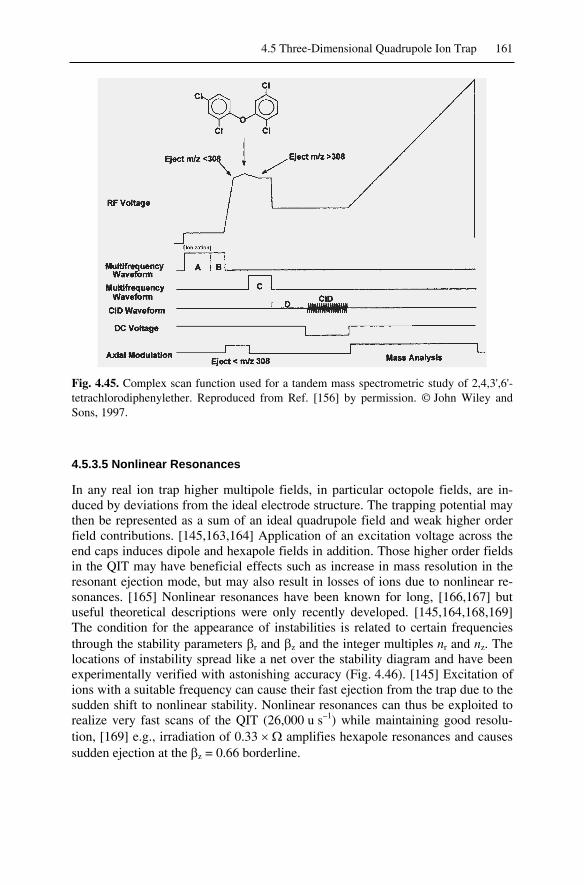
4.5 Three-Dimensional Quadrupole Ion Trap 161
Fig. 4.45. Complex scan function used for a tandem mass spectrometric study of 2,4,3',6'-tetrachlorodiphenylether. Reproduced from Ref. [156] by permission. © John Wiley andSons, 1997.
4.5.3.5 Nonlinear Resonances
In any real ion trap higher multipole fields, in particular octopole fields, are in-duced by deviations from the ideal electrode structure. The trapping potential maythen be represented as a sum of an ideal quadrupole field and weak higher orderfield contributions. [145,163,164] Application of an excitation voltage across theend caps induces dipole and hexapole fields in addition. Those higher order fieldsin the QIT may have beneficial effects such as increase in mass resolution in theresonant ejection mode, but may also result in losses of ions due to nonlinear re-sonances. [165] Nonlinear resonances have been known for long, [166,167] butuseful theoretical descriptions were only recently developed. [145,164,168,169]The condition for the appearance of instabilities is related to certain frequenciesthrough the stability parameters r and z and the integer multiples nr and nz. Thelocations of instability spread like a net over the stability diagram and have beenexperimentally verified with astonishing accuracy (Fig. 4.46). [145] Excitation ofions with a suitable frequency can cause their fast ejection from the trap due to thesudden shift to nonlinear stability. Nonlinear resonances can thus be exploited torealize very fast scans of the QIT (26,000 u s–1) while maintaining good resolu-tion, [169] e.g., irradiation of 0.33 amplifies hexapole resonances and causessudden ejection at the z = 0.66 borderline.

162 4 Instrumentation
Fig. 4.46. Plot of theoretical lines of instability corresponding to the relationnr/2 r + nz/2 z = 1 for different orders N = nr + nz. Strong resonances are represented bythick lines, weak ones by dashed lines. Reproduced from Ref. [145] by permission.© Elsevier Science, 1996.
4.5.4 External Ion Sources for the Quadrupole Ion Trap
Chemical ionization (CI) mass spectra were first obtained by using the mass-selective instability mode of the QIT. [154,155,170] The reagent gas was admittedinto the QIT, ionized and then allowed to react with the analyte.
With external ion sources it became feasible to interface any ionization methodto the QIT mass analyzer. [171] However, commercial QITs are chiefly offeredfor two fields of applications: i) GC-MS systems with EI and CI, because they areeither inexpensive or capable of MS/MS to improve selectivity of the analysis(Chap. 12); and ii) instruments equipped with atmospheric pressure ionization(API) methods (Chap. 11) offering higher mass range, and some 5-fold unit reso-lution to resolve isotopic patterns of multiply charged ions (Fig. 4.47).[149,162,172,173]

4.5 Three-Dimensional Quadrupole Ion Trap 163
Fig. 4.47. Schematic of a quadrupole ion trap instrument equipped with an external ESI ionsource. Reproduced from Ref. [173] by permission. © John Wiley & Sons, 2000.
4.5.6 Tandem MS with the Quadrupole Ion Trap
Ion traps are tandem-in-time instruments, i.e., they perform the steps of precursorion selection, ion activation and acquisition of fragment ion spectra in the verysame place. This advantageous property allows the multiple use of a single QIT toperform not only MS2 but also MS3 and higher order MSn experiments – indeed avery economic concept. Depending on the abundance of the initial precursor ion,its fragmentation behavior – and of course, on the performance of the QIT – MS6
experiments are possible. [138] However, in contrast to tandem-in-space instru-ments, tandem-in-time instruments do not support constant neutral loss and pre-cursor ion scans.
In the QIT, MSn is accomplished by using appropriate scan functions for thefundamental RF and the auxiliary modulation voltage. [138,154,162] At a suffi-cient level of sophistication, e.g., by combining slow and fast forward and reverseRF voltage scans with suitable settings of the auxiliary voltage, monoisotopic pre-cursor ions can even be isolated in case of triply charged ions. [174] The reso-nance excitation provided by moderate auxiliary voltages can be employed to ef-fect low-energy CID of the trapped ions due to activating collisions with thebuffer gas. A full description of the numerous approaches to continuously im-proving scans can be found in the literature. [159,174-177]
Example: MSn on a QIT was used for the identification of beauverolides, cy-clic peptides from the fermentation broth of Beauveria bassiana, a fungus of pa-thogenic activity on insects. [178] All MSn (ESI-CID-QIT) experiments startedfrom singly charged [M+H]+ precursor ions (Fig. 4.48).

164 4 Instrumentation
Fig. 4.48. Sequence of ESI-CID-QIT mass spectra of a beauverolide: (a) MS2 of [M+H]+,m/z 488, selected out of a full scan spectrum, (b) MS3 of m/z 375 selected from (a), and(c) MS4 of m/z 304 selected from (b). Adapted from Ref. [178] by permission. © JohnWiley & Sons, 2001.
4.6 Fourier Transform Ion Cyclotron Resonance
4.6.1 Introduction to Ion Cyclotron Resonance
The development that led to modern Fourier transform ion cyclotron resonance(FT-ICR) mass spectrometers began in 1932. [179,180] It was demonstrated thatthe angular frequency of the circular motion of ions moving perpendicular to ahomogeneous magnetic field is independent of the radius the ions are travellingon. Applying a transverse alternating electric field of the same frequency allows toachieve tremendous acceleration of the circulating ions while the radius of theirorbit increases. Later, the working principle of ICR accelerators was applied toconstruct an ICR mass spectrometer. [181,182] In the first ICR instruments, mag-netic field strength and frequency were fixed and the m/z value was obtained fromthe energy absorption, i.e., the number of half cycles, until the ions struck an elec-trometer plate. ICR mass spectrometers measuring the power absorption from theexciting oscillator followed and were commercialized in the mid 1960s by Varian.Starting from their application to gas phase ion chemistry, [183] ICR instrumentsmade their way in analytical mass spectrometry. [184] However, it was the intro-duction of FT-ICR in 1974 that initiated the major breakthrough. [185,186] Eversince, the performance of FT-ICR instruments has steadily improved [187,188] toreach unprecedented levels of resolution and mass accuracy when superconduct-ing magnets are employed. [189-192]

4.6 Fourier Transform Ion Cyclotron Resonance 165
Note: Modern FT-ICR mass spectrometers offer ultrahigh resolving power(R = 105–106) [193,194] and highest mass accuracy ( m = 10–4–10–3 u,cf. examples in Chaps. 3.3.2 and 3.4.1), attomol detection limits (with nanoESIor MALDI sources), high mass range and MSn capabilities. [195]
4.6.2 Principle of Ion Cyclotron Resonance
As we know from the discussion of magnetic sectors, an ion of velocity v enteringa uniform magnetic field B perpendicular to its direction will move on a circularpath by action of the Lorentz force (Chap. 4.3.2), the radius rm of which is deter-mined by Eq. 4.13:
qBvm
r im
(4.13)
Upon substitution with v = rm the angular frequency c becomes:
ic m
qB (4.31)
Hence, the cyclotron angular frequency c is independent of the ion's initialvelocity, but a function of its mass, charge, and the magnetic field. By applying atransverse electric field alternating at the cyclotron frequency fc ( c = 2 fc) theions are accelerated. Such a field can be applied by a pair of RF electrodes placedon opposite sides of the orbit. As the ions accelerate, the radius of their orbit in-creases, and the resulting overall motion is a spiral (Fig. 4.49). [180,188] Forlighter ions, the spiral reaches the same radius with fewer cycles than in case ofheavier ones, i.e., the spiral is steeper, because low-mass ions need less energythan high-mass ions to accelerate to a certain velocity. The working principle ofthe first-generation ICR instruments essentially was to perform an energy scan:the m/z value was obtained from the number of half cycles, until the ions struck anelectrometer plate at r = rcell. [181,182]
Fig. 4.49. Motion of positive ions in a uniform magnetic field B. (a) The radius is a func-tion of ion velocity, but the frequency fc of circulation is not. (b) Excitation of the ions byan RF electric field oscillating at their cyclotron resonance frequency. Adapted from Ref.[196] by permission. © John Wiley & Sons, 1986.

166 4 Instrumentation
The disadvantages of this concept are clear: i) mass accuracy and resolution arelimited to 1/Nc (Nc = number of half cycles); ii) the electric signal for ion detectionis solely due to neutralization of the ions, and there is no amplification as obtainedwith multiplier-type detectors used with all other analyzers; and iii) the ions areremoved from the cell upon detection making MS/MS impossible.
4.6.3 Fourier Transform Ion Cyclotron Resonance
FT-ICR circumvents the above disadvantages of scanning ICR instruments. TheFT-ICR experiment requires full temporal separation of excitation and subsequentdetection of the trapped ions. Detection is based on the measurement of image cur-rents in the detector plates. An image current is induced by each ion package whenrepeatedly passing the detector plates at its individual cyclotron frequency, i.e.,detection in FT-ICR means “listening to the circulating ions”. The transient freeinduction decay (FID) is recorded, and afterwards, the FID is converted from thetime domain to the frequency domain by means of Fourier transformation. Thismeans that the complex FID caused by superimposition of many single frequen-cies is deconvoluted to reveal the single contributing frequencies and their respec-tive amplitudes. Using Eq. 4.31, the frequencies are converted to m/z values; theiramplitudes now representing the abundances of the corresponding ions (Fig. 4.50).[180,185,188,197,198] Some advantages of FT-ICR-MS are obvious: i) the 1/Nc
limit vanishes because every ion makes some 104–108 cycles during the detectioninterval; ii) sensitivity improves because the ions give rise to a detectable imagecharge during each passage of a detector plate; and iii) ion detection is non-destructive, i.e., ions are not lost upon detection giving the opportunity to performMS/MS experiments. In addition, elongated recording of the FID allows for anextremely precise determination of all cyclotron frequencies, thereby yielding thehighest values of resolution and mass accuracy available. [193,194,199]
Fig. 4.50. Illustration of the effect of Fourier transformation. The longer the detection inter-val the more accurate the result will be. By courtesy of Bruker Daltonik, Bremen.

4.6 Fourier Transform Ion Cyclotron Resonance 167
Note: Occasionally, the acronym FTMS is used instead of FT-ICR-MS. Ofcourse, ICR without Fourier transformation would not have the tremendoussuccess it has, but Fourier transformation alone cannot separate ions accordingto m/z, and hence there is no FTMS.
4.6.4 Experimental Setup of FT-ICR-MS
For FT-ICR-MS, the ICR cell itself must not necessarily differ from one used inscanning ICR-MS (Fig. 4.51). Two of the four side walls (x-axis) of the ICR cellare connected to the RF power supply during the period of excitation. Then, theimage current induced in the detector plates (y-axis) is recorded as transient signalfor some period of time (0.5–30 s). The excitation of the ions within the ICR cellhas to stop at a level low enough to avoid wall collisions of the lightest ions to bemeasured. [191,200,201]
4.6.4.1 Cyclotron Motion in FT-ICR-MS
Regardless of whether the ions are created inside the cell or whether they comefrom an external ion source, they will not be at rest because of their thermal en-ergy. This gives rise to a circular micromotion of the ions in the xy-plane as theyare entering the magnetic field. Upon excitation, the circular micromotion is su-perimposed by the cyclotron motion, i.e., the RF excitation field forms coherention packages composing of ions of the same m/z value. As the initial kinetic en-ergy of the ions is small as compared to the energy uptake from the RF field, it isof minor importance for the experiment. [201] Nonetheless, the complexity of theoverall motion affects frequency-to-mass calibration if accurate results are re-quired. [202]
Example: Consider a singly charged ion of 100 u at thermal energy. Assuminga temperature of 300 K, its average velocity (Boltzmann distribution) is about230 m s–1. In a 3 T magnetic field it will circulate at rm 0.08 mm. To increasethe radius to 1 cm, Eq. 4.13 demands the velocity to rise by a factor of 125, i.e., to28,750 m s–1. Rearranging Eq. 4.3 delivers eU = v2mi/2, and thus we calculate akinetic energy of about 430 eV. Thus, the translational energy of ions in an ICRcell is definitely high enough to effect activating collisions for CID experiments.
Note: In ICR cells, the ions circulate like separate swarms of birds rather thanlike matter in the rings of Saturn. If ions of the same m/z non-coherently circu-lated at the same frequency and radius, but occupied the total orbit rather than asmall sector of it, there would be no image current induced upon their passageat the detector plates.

168 4 Instrumentation
Fig. 4.51. The sequence of excitation (a) and detection (b) in FT-ICR-MS. The ionic micro-motion is indicated by the small circle of ions. The cell is shown along the direction of themagnetic field.
4.6.4.2 Axial Trapping in FT-ICR Instruments
The z-dimension of the cell seems to be of no importance for the function of an(FT-)ICR mass spectrometer. However, the z-component of thermal energy andthe kinetic energy of ion injection into the ICR cell in case of an external ionsource both would lead to rapid loss of the trapped ions along that axis. It is there-fore important to establish a trapping potential in z-direction. The simplest way isto place DC trapping electrodes at the “open” sides of a cubic or cylindrical cell.[182] However, due to field imperfections other designs have been developed.[200,201] These include segmented end caps on cyclindrical cells (infinity cell[203]), cyclindrical cells devided into three segments along the z-axis [204] analo-gous to the LIT mass spectrometer (Fig. 4.39), and many others. [205]
4.6.4.3 Magnetic Field Strengths in FT-ICR-MS
FT-ICR instruments from any vendor (Bruker Daltonik, IonSpec, Thermo Elec-tron) are exclusively equipped with superconducting magnets, with 7 T and 9.4 Tbeing the favorite field strenghts. The advantages of increased field strength arenumerous: resolving power and scan speed, for example, increase linearly with B.Moreover, upper mass limit, ion trapping time, ion energy, and number of trappedions even increase with B2.
4.6.5 Excitation Modes in FT-ICR-MS
In the ICR cell, there is a stringent correlation of cyclotron frequency fc and m/zvalue. For simplicity, the very first FT-ICR experiment was therefore performedwith an excitation pulse of a fixed fc tailored to fit the model analyte, methanemolecular ion. [185] However, useful measurements require the simultaneous ex-citation of all ions in the cell, and this in turn demands for a large RF bandwidth.

4.6 Fourier Transform Ion Cyclotron Resonance 169
Example: Rewriting Eq. 4.31 to obtain the cyclotron frequency fc delivers:
ic m
qBf2
(4.31a)
We may now calculate fc for a singly charged ion of m/z 1500 (2.49 10–24 kg)in a 7 T magnet as fc = (1.66 10–19 C 7 T)/(2 2.49 10–24 kg) = 71,600 Hz.For an ion of m/z 15 (2.49 10–26 kg) we get a 100 times higher fc, i.e., to exciteions in the range m/z 15–1500, the ICR frequency band has to span from 72 kHzto 7.2 MHz.
Several excitation methods have been developed to cope with this technicallynon-trivial task. The differences between these methods can easily be judged fromthe shape of the frequency-domain excitation waveforms (Fig. 4.52). [188,201]The simplest approach is to irradiate a single frequency (narrow band) for sometime, i.e., as a rectangular pulse, but this selectively excites ions of a single mass.[185] Applying such a narrow band excitation as a short pulse yields some expan-sion of the range. The effect of a frequency sweep or “chirp” excitation is muchbetter, [186] however, it gives distortions close to the borders of the range. Thebest results are obtained from stored waveform inverse Fourier transform(SWIFT) excitations. [206] The ideal excitation waveform is tailored to the needsof the intended experiment and then produced by an RF generator. SWIFT excita-tion also allows to remove ions of predefined m/z ranges from the ICR cell. Thisresults in storage of a small m/z range, or after repeated SWIFT pulsing of a singlenominal mass out of a broad band spectrum. Those ions are then accessible for ul-trahigh resolution and accurate mass measurements.
Note: Although resolution and mass accuracy are already high in broadbandspectra (R = 3 104–105, m < 10–3 u), the performance of FT-ICR instrumentsimproves by at least one order of magnitude by storing only narrow m/z ranges,because fewer ions in the cell mean less distortion by coulombic interactions.
4.6.6 Detection in FT-ICR-MS
The ICR voltage signal strength at the detector plates is inversely proportional toion mass if the monitoring circuit is predominantly resistive, and is independent ofion mass if the circuit is predominantly capacitive. [198] Image current detectionat room temperature is typically less sensitive than ion counting techniques inbeam instruments. However, for a modern FT-ICR instrument equipped with typi-cal detection circuits, the detection limit to yield a signal-to-noise ratio of 3:1 cor-responds to roughly 200 ions, provided these are excited to travel at half of themaximum cyclotron radius. [200]
An interesting correlation exists between the transient signal and the pressure inthe ICR cell. [197,201] In a perfect vacuum, the orbiting motion would solely be

170 4 Instrumentation
Fig. 4.52. Time-domain (left) and frequency-domain (right) excitation waveforms: (a), (b)rectangular pulses; (c) “chirp” excitation; (d), (e) SWIFT excitations, with (e) formed toeject a certain mass range from the cell. Reproduced from Ref. [201] by permission. © JohnWiley & Sons, 1998.
Fig. 4.53. Simulated time-domain ICR signals (left) and frequency-domain spectra (right)for (a) low pressure, (b) medium pressure, and (c) high pressure. Reproduced from Ref.[201] by permission. © John Wiley & Sons, 1998.
dampened by induction, whereas in the presence of residual gas collisions will fi-nally slow down the ions to thermal energy. The simulated time-domain ICR sig-nals at i) low pressure (almost no collisions during acquisition time), ii) mediumpressure (single collision on the average), and iii) high pressure (several collisions
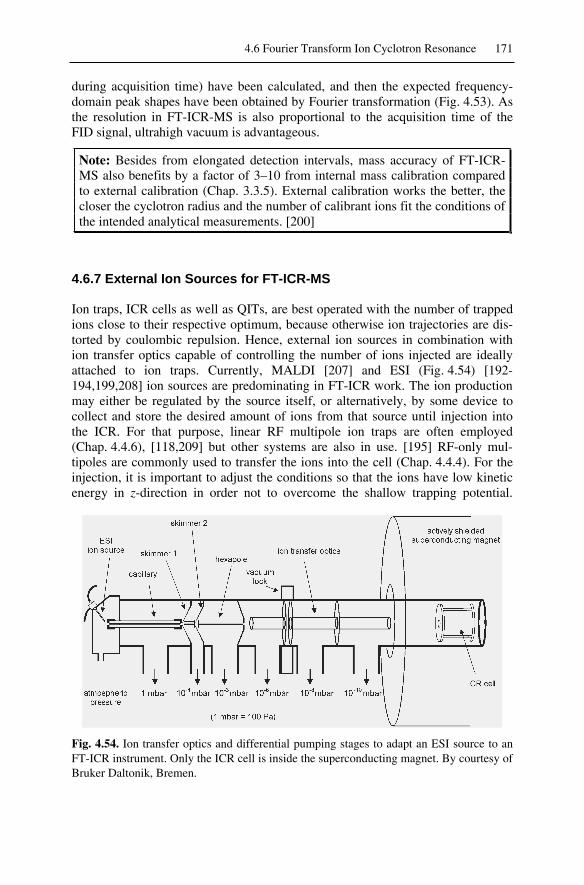
4.6 Fourier Transform Ion Cyclotron Resonance 171
during acquisition time) have been calculated, and then the expected frequency-domain peak shapes have been obtained by Fourier transformation (Fig. 4.53). Asthe resolution in FT-ICR-MS is also proportional to the acquisition time of theFID signal, ultrahigh vacuum is advantageous.
Note: Besides from elongated detection intervals, mass accuracy of FT-ICR-MS also benefits by a factor of 3–10 from internal mass calibration comparedto external calibration (Chap. 3.3.5). External calibration works the better, thecloser the cyclotron radius and the number of calibrant ions fit the conditions ofthe intended analytical measurements. [200]
4.6.7 External Ion Sources for FT-ICR-MS
Ion traps, ICR cells as well as QITs, are best operated with the number of trappedions close to their respective optimum, because otherwise ion trajectories are dis-torted by coulombic repulsion. Hence, external ion sources in combination withion transfer optics capable of controlling the number of ions injected are ideallyattached to ion traps. Currently, MALDI [207] and ESI (Fig. 4.54) [192-194,199,208] ion sources are predominating in FT-ICR work. The ion productionmay either be regulated by the source itself, or alternatively, by some device tocollect and store the desired amount of ions from that source until injection intothe ICR. For that purpose, linear RF multipole ion traps are often employed(Chap. 4.4.6), [118,209] but other systems are also in use. [195] RF-only mul-tipoles are commonly used to transfer the ions into the cell (Chap. 4.4.4). For theinjection, it is important to adjust the conditions so that the ions have low kineticenergy in z-direction in order not to overcome the shallow trapping potential.
Fig. 4.54. Ion transfer optics and differential pumping stages to adapt an ESI source to anFT-ICR instrument. Only the ICR cell is inside the superconducting magnet. By courtesy ofBruker Daltonik, Bremen.

172 4 Instrumentation
While some buffer gas is beneficial in case of QITs, ICR cells are preferably oper-ated at the lowest pressure available. The typical path from an external ion sourceinto the ICR cell is therefore characterized by multistep differential pumping toachieve some 10–8–10–7 Pa in the cell.
Note: The need for almost perfect vacuum, i.e., extremely long mean freepaths, in FT-ICR mass spectrometers arises from the combination of high ionvelocities of several 103 m s–1, observation intervals in the order of seconds,and the effect of collisions on peak shape.
4.6.8 Tandem MS with FT-ICR Instruments
FT-ICR mass spectrometers belong to the tandem-in-time category of instruments.The stage of precursor ion selection (MS1) is accomplished by selectively storingthe ions of interest, whereas all others are ejected by means of a suitably tailoredexcitation pulse, e.g., using the SWIFT technique. [206] FT-ICR mass spec-trometers are also capable of MSn.
Collision-induced dissociation (CID) requires sufficiently fast ions to collidewith some gas atoms in order to cause dissociation. The collision gas is admittedto the ICR cell through a rapid pulsed valve. The increase in ion kinetic energy iseffected by short (0.2–0.5 ms) irradiation at or close to the cyclotron frequency ofthe precursor ion. [210,211] Nowadays, sustained off-resonance irradiation(SORI) has established as the standard CID method in FT-ICR, [212,213] al-though there are others of comparable effect. [214,215] Irradiating slightly off theresonance frequency makes ions undergo acceleration–deceleration cyclesthroughout the duration of the RF pulse. As a consequence, only small incrementsof internal energy are transferred to the ion during the RF pulse. The ions cantherefore be irradiated for a sustained period (0.5-1 s) without causing ejection,that otherwise at fc was unavoidable. SORI-CID results in sequential activation ofions by multiple collisions of low (<10 eV) kinetic energy ions with the collisiongas. Nonetheless, the use of collision gas is in contradiction to the high vaccumrequirements of the ICR cell.
The activation step can alternatively be performed without gas by means of in-frared multiphoton dissociation (IRMPD) or electron capture dissociation (ECD)(Chap. 2.12.2). Both IRMPD and ECD, solely require storage of the ions duringtheir excitation by photons or electrons, respectively. It is one of the most charm-ing properties of FT-ICR-MS/MS that even the accurate mass of the fragment ionscan be determined. [216,217]

4.7 Hybrid Instruments 173
Fig. 4.55. Bruker Daltonics ApexIII FT-ICR-MS. By courtesy of Bruker Daltonik, Bremen.
4.7 Hybrid Instruments
As indicated in the section on linear ion traps (Chap. 4.4.6), mass spectrometersmay be constructed by combining different types of mass analyzers in a single so-called hybrid instrument. [86,100] The driving force to do so is the desire to obtainmass spectrometers ideally combining the advantagous properties of each massanalyzer they are composed of in order to have powerful, but still affordable ma-chines for tandem MS. The development of hybrid instruments started from mag-netic sector-quadrupole hybrids, either BqQ, [218,219] EBqQ, [220] or BEqQ.[221-223] Numerous other systems such as magnetic sector-QIT, [224] magneticsector-oaTOF, [225,226] QIT-TOF, [147,227,228] Qq-TOF, [47,229-231] Qq-LIT, [134] LIT-ICR, and Qq-ICR followed (Table 4.4).
The adaptation of different mass analyzers to each other demands for sophisti-cated interfaces, because of the largely differing requirements concerning ion ki-netic energies. The magnetic sector-quadrupole or magnetic sector-QIT hybrids,for example, require keV ions exiting the sector to be decelerated to some 10 eVbefore entering the qQ section, or to be slowed down and pulsed into the QIT, re-spectively.
Geometries composing of an oaTOF as MS2 bear the advantage that advancedTOFs offer accurate mass measurements close the the accuracy of magnetic sectorinstruments. Currently, QqTOF systems can be regarded as the commercially mostsuccessful hybrid. While the linear quadrupole serves as MS1 in MS/MS experi-ments, it is operated in RF-only mode when tandem MS is not intended, because

174 4 Instrumentation
this allows to acquire full-range spectra at high resolution using the TOF analyzer(Fig. 4.56).
The next higher level of performance can be achieved by replacing the oaTOFMS2 with an FT-ICR analyzer while employing a linear ion trap (Thermo ElectronLTQ-FT) or a quadrupole as MS1 (Bruker Daltonik APEX-Q).
Note: Besides accommodating to their versatility, there is nothing new to un-derstand with hybrid instruments. Though exotic at a first glance, hybrids aregoverning today's market of mass spectrometers.
Fig. 4.56. Schematic of the Q-TOF Ultima with ESI ion source in MS/MS mode. The TOFanalyzer has a double reflector for higher resolution. Courtesy of Waters Corporation, MSTechnologies, Manchester, UK.
Table 4.4. Hybrid mass analyzers
MS1 Properties of MS1 MS2 Properties of MS2BE or EB LR and HR Q LR, low energy CIDBE or EB LR and HR QIT LR, low energy CID, MSn
EB orEBE
LR and HR oaTOF LR, low energy CID, highsensitivity
Q LR, low energy CID oaTOF HR, high sensitivityQ LR, low energy CID LIT LR, higher sensitivity than
QqQQIT LR, low energy CID, MSn TOF HR, high sensitivityLIT LR, low energy CID, MSn ICR ultrahigh resolution and mass
accuracy

4.8 Detectors 175
4.8 Detectors
The simplest detector is a Faraday cup, i.e., an electrode where the ions deposittheir charge. The electric current flowing away from that electrode results in avoltage when passing through a resistor of high impedance. Faraday cups are stillin use to measure abundance ratios with highest accuracy in isotope ratio massspectrometry (IR-MS). [232] In the era of Mattauch-Herzog type instruments, thephotographic plate has been the standard detection system (Chap. 4.3.3). With theadvent of scanning mass spectrometers, secondary electron multipliers (SEM) be-came predominant. [233] These rely on the emission of secondary electrons fromsurfaces upon impact of energetic ions. Progress has been made to employ cryo-genic detectors, a rather special type of an ion counting detector for high-massions in TOF-MS. [234] The first commercial cryogenic detector TOF instrumenthas only recently been released (Comet Macromizer, Flamatt, Switzerland). Ioncounting detectors are not used in FT-ICR-MS where image current detectionyields superior results (Chap. 4.6.6).
Note: Ion counting detectors also give signals upon impact of energetic neu-trals, electrons, or photons. Therefore, care has to be taken, not to allow otherparticles than the mass-analyzed ions to hit the detector.
4.8.1 Discrete Dynode Electron Multipliers
When an energetic particle impinges on the surface of a metal or a semiconductor,secondary electrons are emitted from that surface. The ease of such an emission isdetermined by the electron(ic) work function of the respective material, e.g., BeCualloy oxide (we 2.4 eV). [235] The higher the velocity of the impacting particle[233,236] and the lower the electron work function of the surface, the larger thenumber of secondary electrons. If an electrode opposite to the location of emissionis held at more positive potential, all emitted electrons will be accelerated towardsand hit that surface where they in turn cause the release of several electrons each.The avalanche of electrons produced over 12–18 discrete dynode stages held atabout 100 V more positive potential each causes an electric current large enoughto be detected by a sensitive preamplifier. Such a detector is called secondaryelectron multiplier (SEM, Fig. 4.57). [237] The dynodes are normally cup-shaped,but stacks of Venetian blind-like dynodes have also been in use. Due to a certainair sensitivity of the emissive layer and in order to prevent arcing due to the highvoltage, electron multipliers require operation in high vacuum.
The ion currents actually reaching the first dynode are chiefly in the picoam-pere range, but may span over a 10–18–10–9 A range. Depending on the appliedvoltage, SEMs provide a gain of 106–108. [237] The resulting current at the elec-tron trap is the input of a nearby preamplifier providing another 106–109 gain. Itsoutput current is then converted to a voltage signal which finally can be translated
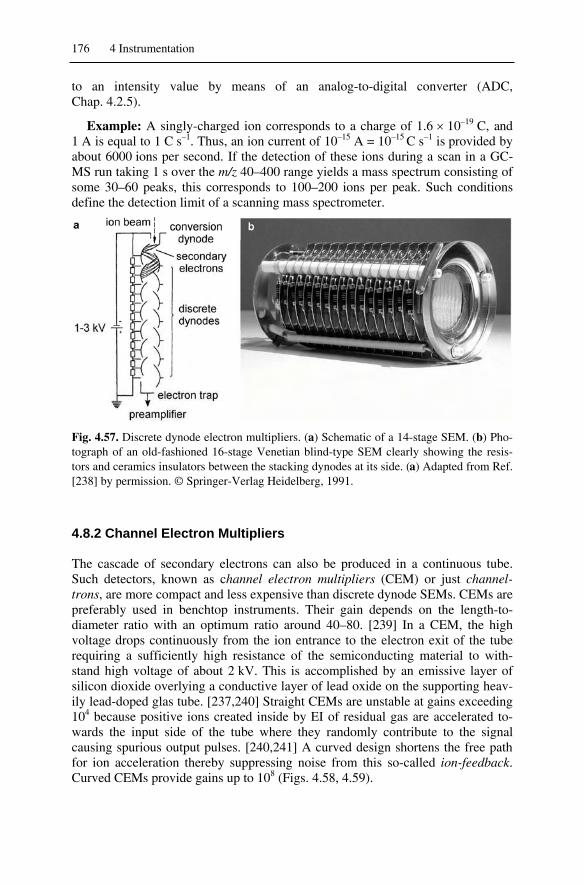
176 4 Instrumentation
to an intensity value by means of an analog-to-digital converter (ADC,Chap. 4.2.5).
Example: A singly-charged ion corresponds to a charge of 1.6 10–19 C, and1 A is equal to 1 C s–1. Thus, an ion current of 10–15 A = 10–15 C s–1 is provided byabout 6000 ions per second. If the detection of these ions during a scan in a GC-MS run taking 1 s over the m/z 40–400 range yields a mass spectrum consisting ofsome 30–60 peaks, this corresponds to 100–200 ions per peak. Such conditionsdefine the detection limit of a scanning mass spectrometer.
Fig. 4.57. Discrete dynode electron multipliers. (a) Schematic of a 14-stage SEM. (b) Pho-tograph of an old-fashioned 16-stage Venetian blind-type SEM clearly showing the resis-tors and ceramics insulators between the stacking dynodes at its side. (a) Adapted from Ref.[238] by permission. © Springer-Verlag Heidelberg, 1991.
4.8.2 Channel Electron Multipliers
The cascade of secondary electrons can also be produced in a continuous tube.Such detectors, known as channel electron multipliers (CEM) or just channel-trons, are more compact and less expensive than discrete dynode SEMs. CEMs arepreferably used in benchtop instruments. Their gain depends on the length-to-diameter ratio with an optimum ratio around 40–80. [239] In a CEM, the highvoltage drops continuously from the ion entrance to the electron exit of the tuberequiring a sufficiently high resistance of the semiconducting material to with-stand high voltage of about 2 kV. This is accomplished by an emissive layer ofsilicon dioxide overlying a conductive layer of lead oxide on the supporting heav-ily lead-doped glas tube. [237,240] Straight CEMs are unstable at gains exceeding104 because positive ions created inside by EI of residual gas are accelerated to-wards the input side of the tube where they randomly contribute to the signalcausing spurious output pulses. [240,241] A curved design shortens the free pathfor ion acceleration thereby suppressing noise from this so-called ion-feedback.Curved CEMs provide gains up to 108 (Figs. 4.58, 4.59).

4.8 Detectors 177
Fig. 4.58. Schematic of linear channel electron multiplier (a) and curved channel electronmultiplier (b). By courtesy of Waters Corporation, MS Technologies, Manchester, UK..
Fig. 4.59. Photograph of a channeltron multiplier.
4.8.3 Microchannel Plates
An extreme reduction of the size of a linear channeltron tube to some micrometersin diameter can be achieved. The cross section of such a single tube is by far toosmall to be of any use, however, millions of these tubes put together in a “bundle”yield a channel electron multiplier array; more common terms are microchannelplate or multichannel plate (MCP, Fig. 4.60). To avoid that the ions enter themicrochannels parallel to their axis, these are inclined by some degrees from theperpendicular to the plate's surface. The gain of an MCP is 103–104, i.e., muchlower than that of a SEM or CEM. Instead of a single MCP, two MCPs are oftensandwiched together in such a way that the small angles oppose each other (Chev-ron plate, Fig. 4.61) to obtain gains of 106–107. Occasionally, even three MCPsare stacked analogously (z-stack, gain up to 108). [241,242]
MCPs are produced as round plates of various sizes. Those of 2–5 cm in di-ameter are typically employed in mass spectrometers. An MCP may either be op-erated to give an integral output for all incident ions during a certain time interval,or the location of the impact may be conserved by connecting sectors of the MCPto individual registration channels. The first setup is more widespread, e.g., in

178 4 Instrumentation
TOF-MS to detect the electron current every nanosecond while the ions are arriv-ing at the detector. The second setup can be used for imaging purposes, e.g., toconstruct an array detector (below).
Fig. 4.60. MCP detector (shimmering surface) mounted on top of a flange (a) and SEM mi-crograph of a high resolving MCP showing channels of 2 µm diameter (b). By courtesy of(a) R.M. Jordan Company, Grass Valley, CA and of (b) Burle Industries, Baesweiler.
Fig. 4.61. Stacking of MCPs to increase gain. From left: single MCP, Chevron plate, and z-stack configuration. Note the loss of spacial resolution upon stacking.
4.8.4 Post-Acceleration and Conversion Dynode
Discrimination of slower ions as compared to faster ions is observed with SEMs,[243] CEMs, and MCPs as well. [239,244,245] This means a reduction in sensi-tivity upon reduction of the acceleration voltage of a mass spectrometer, and ofcourse, with increasing ion mass (Eq. 4.3). In order to reduce such effects and es-pecially to improve sensitivity for high-mass ions, post-acceleration detectorshave been developed. [236,245] In post-acceleration detectors the ions are accel-erated immediatly in front of the detector by a voltage of 10–30 kV before they hitthe first dynode or the first MCP.
The electron output of ion counting detectors is usually measured with refer-ence to ground potential, i.e., the first dynode is set to negative high voltage toachieve acceleration of the electrons down the dynode assembly. In case of sectoror TOF instruments, the deceleration of keV negative ions by the detector voltageis of comparatively minor importance. However, the slow ions exiting from quad-
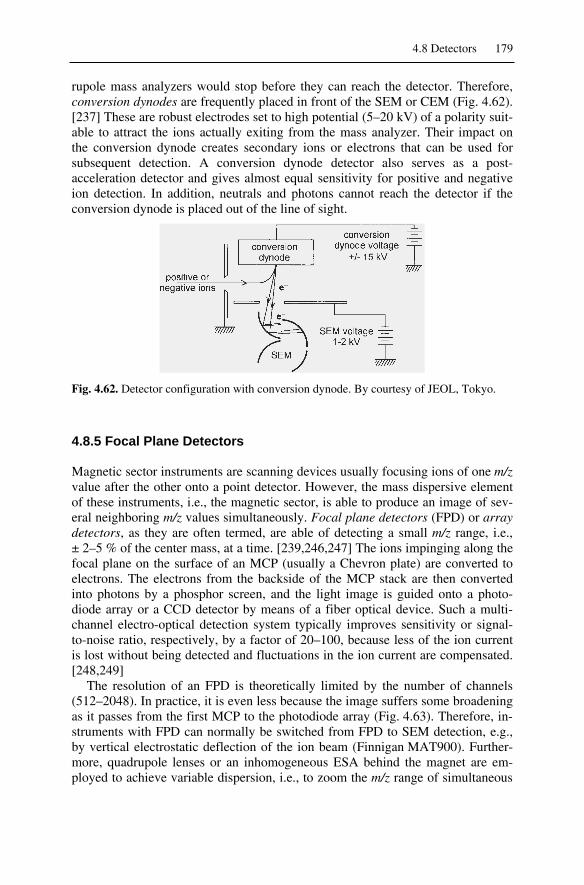
4.8 Detectors 179
rupole mass analyzers would stop before they can reach the detector. Therefore,conversion dynodes are frequently placed in front of the SEM or CEM (Fig. 4.62).[237] These are robust electrodes set to high potential (5–20 kV) of a polarity suit-able to attract the ions actually exiting from the mass analyzer. Their impact onthe conversion dynode creates secondary ions or electrons that can be used forsubsequent detection. A conversion dynode detector also serves as a post-acceleration detector and gives almost equal sensitivity for positive and negativeion detection. In addition, neutrals and photons cannot reach the detector if theconversion dynode is placed out of the line of sight.
Fig. 4.62. Detector configuration with conversion dynode. By courtesy of JEOL, Tokyo.
4.8.5 Focal Plane Detectors
Magnetic sector instruments are scanning devices usually focusing ions of one m/zvalue after the other onto a point detector. However, the mass dispersive elementof these instruments, i.e., the magnetic sector, is able to produce an image of sev-eral neighboring m/z values simultaneously. Focal plane detectors (FPD) or arraydetectors, as they are often termed, are able of detecting a small m/z range, i.e.,± 2–5 % of the center mass, at a time. [239,246,247] The ions impinging along thefocal plane on the surface of an MCP (usually a Chevron plate) are converted toelectrons. The electrons from the backside of the MCP stack are then convertedinto photons by a phosphor screen, and the light image is guided onto a photo-diode array or a CCD detector by means of a fiber optical device. Such a multi-channel electro-optical detection system typically improves sensitivity or signal-to-noise ratio, respectively, by a factor of 20–100, because less of the ion currentis lost without being detected and fluctuations in the ion current are compensated.[248,249]
The resolution of an FPD is theoretically limited by the number of channels(512–2048). In practice, it is even less because the image suffers some broadeningas it passes from the first MCP to the photodiode array (Fig. 4.63). Therefore, in-struments with FPD can normally be switched from FPD to SEM detection, e.g.,by vertical electrostatic deflection of the ion beam (Finnigan MAT900). Further-more, quadrupole lenses or an inhomogeneous ESA behind the magnet are em-ployed to achieve variable dispersion, i.e., to zoom the m/z range of simultaneous

180 4 Instrumentation
detection. Recent developments point towards fully integrated FPDs on a siliconchip. [250]
Fig. 4.63. Array detector in the focal plane of a magnetic sector to detect a small massrange simultanously. By courtesy of Thermo Electron (Bremen) GmbH.
4.9 Vacuum Technology
Vacuum systems are integral parts of any mass spectrometer, but vacuum technol-ogy definitely is a field of its own. [251-255] Thus, the discussion of mass spec-trometer vacuum systems will be restricted to the very basics.
Table 4.5. Pressure ranges in vacuum technology
Pressure Range[Pa]
Pressure Range[mbar]
Pressure Range[mtorr]
Vacuum Gas Flow
105 – 102 1 bar – 1 mbar 750 torr –750 mtorr
rough vacuum(RV)
viscous flow
102 – 10–1 1 – 10–3 750 – 0.75 medium vacuum(MV)
Knudsen flow
10–1 – 10–5 10–3 – 10–7 0.75 – 7.5 10–5 high vacuum(HV)
molecular flow
< 10–5 < 10–7 < 7.5 10–5 ultrahigh vacuum(UHV)
molecular flow
4.9.1 Basic Mass Spectrometer Vacuum System
Generally, two pumping stages are employed to generate the high vacuum of amass spectrometer. Usually, rotary vane pumps having pumping speeds of about4–16 m3 h–1 are used to generate a medium vacuum of several Pascal. They arethen connected to high vacuum pumps in a way that their high pressure side ex-

4.9 Vacuum Technology 181
hales into the medium vacuum of the rotary vane pumps, i.e., they are operated asbacking pumps. This way, each pumping stage contributes a compression of some104–105 to the total factor of 109–1010 between atmospheric pressure and the highvacuum of 10–4–10–5 Pa (Table 4.5). The high vacuum pumps can either be turbo-molecular pumps, oil diffusion pumps, or cryopumps. [256,257]
Example: The vacuum system of non-benchtop mass spectrometers consists ofone to three rotary vane pumps and two or three turbo pumps. Rotary vane pumpsare used for the inlet system(s) and as backing pumps for the turbo pumps. Oneturbo pump is mounted to the ion source housing, another one or two are operatedat the analyzer. Thereby, a differentially pumped system is provided where localchanges in pressure, e.g., from reagent gas in CI or collision gas in CID, do nothave a noteworthy effect on the whole vacuum chamber.
4.9.2 High Vacuum Pumps
Turbomolecular pumps or turbo pumps having pumping speeds of 200–500 l s–1
are currently the standard high vacuum pumps in mass spectrometry. A high speedrotor (50,000–60,000 rpm) is employed to transport the molecules out of the vac-uum manifold (vacuum chamber). Turbo pumps can be switched on and off inminutes, have low power consumption (about 100 W), and thus can be operatedeither air- or water cooled. Furthermore, they provide clean, in particular oil-free,high vacuum, are compact and can be mounted either vertically below or hori-zontally at the sides of the vacuum manifold. Their disadvantages are the risk ofsudden damage (similar to hard disk drives) and potential high frequency noise.Fortunately, modern turbo pumps run for many years and their noise is negligible.
Oil diffusion pumps offer high pumping speeds (600–2000 l s–1) at the cost ofhigh power consumption (0.4–2 kW) and the need for a strong cooling water flow.The oil (perfluoropolypropylene glycols; Fomblin™, Santovac™) is thermallyevaporated and the oil vapor supplies transport of gas molecules that enter it bydiffusion. The gas-loaded oil vapor is condensed and the gas is removed from theliquid by the action of the backing pump. As diffusion pumps have no movingmechanical parts they are highly reliable and extremely silent. However, elongateduse as well as sudden venting causes severe oil contaminations of the vacuummanifold. Diffusion pumps have almost been abandoned from modern mass spec-trometers.
Cryopumps adsorb (freeze) residual gas to a surface cooled to the temperatureof liquid nitrogen. They are highly efficient and silent and provide clean vacuum,but cannot be operated without interruptions to recover the adsorber. Cryopumpsare typically operated in combination with turbo pumps because they are onlystarted after high vacuum conditions are reached. Otherwise, the adsorber wouldsoon be saturated.

182 4 Instrumentation
4.10 Buying an Instrument
To some of us it can unexpectedly happen that we are faced with the task of hav-ing to buy a mass spectrometer, eventually for ourselves or on behalf of someoneelse. References to certain commercial instruments made in this chapter were inno way intended to preclude such a 100,000–600,000 € decision. The below guidemay be useful in selecting an instrument that meets your requirements best:
Define the tasks the mass spectrometer is to be acquired for: i) Need for one orseveral ionization methods? ii) GC-MS or LC-MS required? iii) High resolu-tion and accurate mass desirable? iv) Is tandem MS an issue? v) What sensi-tivity is needed? vi) Is quantitative work important?Check your budget. A powerful and versatile second-hand machine from aproven company can be better than a toy-like single-purpose benchtop system.Get into contact with sales persons of all manufacturers offering suitable sys-tems. Compare prices and modalities of customer training and support.Use independent information from the published literature and ask currrent us-ers of your top-choice mass spectrometers for the special strengths and short-comings of those systems.Modern instruments form a unit with their data system. Does this offer thefeatures you want? Does it allow for “manual” settings or corrections?Make appointments for demonstration of those instruments that are likely to beacquired, e.g., for the top three of your ranking. Do not use completely un-known samples for this purpose. Otherwise, problems associated with youranalyte might erroneously be regarded as a lack of instrumental performance.
Reference List
1. Ligon, W.V., Jr. Molecular Analysis byMass Spectrometry. Science 1979, 205,151-159.
2. Brunnée, C. The Ideal Mass Analyzer:Fact or Fiction? Int. J. Mass Spectrom.Ion Proc. 1987, 76, 125-237.
3. Beynon, J.H. Instruments, in MassSpectrometry and its Applications to Or-ganic Chemistry, 1st ed.; Elsevier: Am-sterdam, 1960; pp. 4-27.
4. Habfast, K.; Aulinger, F. Massenspek-trometrische Apparate, in Massenspek-trometrie, Kienitz, H., editor; VerlagChemie: Weinheim, 1968; pp. 29-124.
5. Aulinger, F. MassenspektroskopischeGeräte, in Massenspektrometrie,Kienitz, H., editor; Verlag Chemie:Weinheim, 1968; 125-154.
6. Brunnée, C. New Instrumentation inMass Spectrometry. Int. J. Mass Spec-trom. Ion Phys. 1982, 45, 51-86.
7. Brunnée, C. 50 Years of MAT in Bre-men. Rapid Commun. Mass Spectrom.1997, 11, 694-707.
8. Chapman, J.R.; Errock, G.A.; Race, J.A.Science and Technology in Manchester:the Nuture of Mass Spectrometry. RapidCommun. Mass Spectrom. 1997, 11,1575-1586.
9. McLuckey, S.A. Intrumentation forMass Spectrometry: 1997, Adv. MassSpectrom., 1998, 14, 153-196.
10. Badman, E.R.; Cooks, R.G. MiniatureMass Analyzers. J. Mass Spectrom.2000, 35, 659-671.
11. Baykut, G.; Franzen, J. Mobile MassSpectrometry; a Decade of Field Appli-cations. Trends Anal. Chem. 1994, 13,267-275.
12. Prieto, M.C.; Kovtoun, V.V.; Cotter, R.J.Miniaturized Linear TOF Mass Spec-
Reference List 183
trometer With Pulsed Extraction. J. MassSpectrom. 2002, 37, 1158-1162.
13. Fenselau, C.; Caprioli, R. Mass Spec-trometry in the Exploration of Mars. J.Mass Spectrom. 2003, 38, 1-10.
14. Arkin, C.R.; Griffin, T.P.; Ottens, A.K.;Diaz, J.A.; Follistein, D.W.; Adams,F.W.; Helms, W.R. Evaluation of SmallMass Spectrometer Systems for Perma-nent Gas Analysis. J. Am. Soc. MassSpectrom. 2002, 13, 1004-1012.
15. Stephens, W.E. A Pulsed Mass Spec-trometer With Time Dispersion. Phys.Rev. 1946, 69, 691.
16. Cameron, A.E.; Eggers, D.F. An Ion"Velocitron". Rev. Sci. Instrum. 1948,19, 605-607.
17. Wolff, M.M.; Stephens, W.E. A PulsedMass Spectrometer With Time Disper-sion. Rev. Sci. Instrum. 1953, 24, 616-617.
18. Wiley, W.C.; McLaren, I.H. Time-of-Flight Mass Spectrometer With Im-proved Resolution. Rev. Sci. Instrum.1955, 26, 1150-1157.
19. Wiley, W.C.; McLaren, I.H. Reprint of:Time-of-Flight Mass Spectrometer WithImproved Resolution. J. Mass Spectrom.1997, 32, 4-11.
20. Harrington, D.B. The Time-of-FlightMass Spectrometer, in Advances in MassSpectrometry, Waldron, J.D., editor;Pergamon Press: Oxford, 1959; 249-265.
21. Gohlke, R.S.; McLafferty, F.W. EarlyGas Chromatography/Mass Spectrome-try. J. Am. Soc. Mass Spectrom. 1993, 4,367-371.
22. Guilhaus, M. The Return of Time-of-Flight to Analytical Mass Spectrometry.Adv. Mass Spectrom. 1995, 13, 213-226.
23. Guilhaus, M.; Mlynski, V.; Selby, D.Perfect Timing: TOF-MS. Rapid Com-mun. Mass Spectrom. 1997, 11, 951-962.
24. Karas, M.; Hillenkamp, F. Laser De-sorption Ionization of Proteins WithMolecular Masses Exceeding 10,000Daltons. Anal. Chem. 1988, 60, 2299-2301.
25. Weickhardt, C.; Moritz, F.; Grotemeyer,J. TOF-MS: State-of-the-Art in Chemi-cal Analysis and Molecular Science.Mass Spectrom. Rev. 1997, 15, 139-162.
26. Cotter, R.J. Time-of-Flight Mass Spec-trometry: Instrumentation and Applica-tions in Biological Research; ACS:Washington, DC, 1997.
27. Enke, C.G. The Unique Capabilities ofTime-of-Flight Mass Analyzers. Adv.Mass Spectrom. 1998, 14, 197-219.
28. Fuerstenau, S.D.; Benner, W.H. Mo-lecular Weight Determination ofMegadalton DNA Electrospray IonsUsing Charge Detection Time-of-FlightMass Spectrometry. Rapid Commun.Mass Spectrom. 1995, 9, 1528-1538.
29. Fuerstenau, S.D.; Benner, W.H.; Tho-mas, J.J.; Brugidou, C.; Bothner, B.;Suizdak, G. Mass Spectrometry of anIntact Virus. Angew. Chem. , Int. Ed.2001, 40, 541-544.
30. Price, P. Standard Definitions of TermsRelating to Mass Spectrometry. A Re-port From the Committee on Measure-ments and Standards of the AmercianSociety for Mass Spectrometry. J. Am.Soc. Mass Spectrom. 1991, 2, 336-348.
31. Todd, J.F.J. Recommendations for No-menclature and Symbolism for MassSpectroscopy Including an Appendix ofTerms Used in Vacuum Technology. Int.J. Mass Spectrom. Ion. Proc. 1995, 142,211-240.
32. Guilhaus, M. Principles and Instrumen-tation in TOF-MS. Physical and Instru-mental Concepts. J. Mass Spectrom.1995, 30, 1519-1532.
33. Ioanoviciu, D. Ion-Optical Solutions inTime-of-Flight Mass Spectrometry.Rapid Commun. Mass Spectrom. 1995,9, 985-997.
34. Cotter, R.J. Time-of-Flight Mass Spec-trometry for the Analysis of BiologicalMolecules. Anal. Chem. 1992, 64,1027A-1039A.
35. Mamyrin, B.A. Laser Assisted Reflec-tron Time-of-Flight Mass Spectrometry.Int. J. Mass Spectrom. Ion Proc. 1994,131, 1-19.
36. Vestal, M.L.; Juhasz, P.; Martin, S.A.Delayed Extraction MALDI-TOF-MS.Rapid Commun. Mass Spectrom. 1995,9, 1044-1050.
37. Cordero, M.M.; Cornish, T.J.; Cotter,R.J.; Lys, I.A. Sequencing PeptidesWithout Scanning the Reflectron: Post-Source Decay With a Curved-Field Re-flectron TOF Spectrometer. RapidCommun. Mass Spectrom. 1995, 9,1356-1361.
38. Cornish, T.J.; Cotter, R.J. A Curved-Field Reflectron for Improved EnergyFocusing of Product Ions in TOF-MS.
184 4 Instrumentation
Rapid Commun. Mass Spectrom. 1993,7, 1037-1040.
39. Cornish, T.J.; Cotter, R.J. A CurvedField Reflection TOF Mass Spectrome-ter for the Simultaneous Focusing ofMetastable Product Ions. Rapid Com-mun. Mass Spectrom. 1994, 8, 781-785.
40. Schuerch, S.; Schaer, M.; Boernsen,K.O.; Schlunegger, U.P. Enhanced MassResolution in MALDI Linear Time-of-Flight Mass Spectrometry. Biol. MassSpectrom. 1994, 23, 695-700.
41. Brown, R.S.; Lennon, J.J. Mass Resolu-tion Improvement by Incorporation ofPulsed Ion Extraction in a MALDI Lin-ear Time-of-Flight Mass Spectrometer.Anal. Chem. 1995, 67, 1998-2003.
42. Colby, S.M.; King, T.B.; Reilly, J.P. Im-proving the Resolution of MALDI-TOF-MS by Exploiting the Correlation Be-tween Ion Position and Velocity. RapidCommun. Mass Spectrom. 1994, 8, 865-868.
43. Whittal, R.M.; Li, L. High-ResolutionMALD in Linear TOF-MS. Anal. Chem.1995, 67, 1950-1954.
44. Dawson, J.H.J.; Guilhaus, M. Orthogo-nal-Acceleration Time-of-Flight MassSpectrometer. Rapid Commun. MassSpectrom. 1989, 3, 155-159.
45. Mirgorodskaya, O.A.; Shevchenko,A.A.; Chernushevich, I.V.; Dodonov,A.F.; Miroshnikov, A.I. Electrospray-Ionization TOF-MS in Protein Chemis-try. Anal. Chem. 1994, 66, 99-107.
46. Coles, J.; Guilhaus, M. Orthogonal Ac-celeration - a New Direction for TOF-MS: Fast, Sensitive Mass Analysis forContinuous Ion Sources. Trends Anal.Chem. 1993, 12, 203-213.
47. Guilhaus, M.; Selby, D.; Mlynski, V.Orthogonal Acceleration TOF-MS. MassSpectrom. Rev. 2000, 19, 65-107.
48. Selby, D.S.; Mlynski, V.; Guilhaus, M.A 20 KV Orthogonal Acceleration TOFMass Spectrometer for MALDI. Int. J.Mass Spectrom. 2001, 210/211, 89-100.
49. Selditz, U.; Nilsson, S.; Barnidge, D.;Markides, K.E. ESI/TOF-MS Detectionfor Microseparation Techniques. Chimia1999, 53, 506-510.
50. Prazen, B.J.; Bruckner, C.A.; Synovec,R.E.; Kowalski, B.R. Enhanced Chemi-cal Analysis Using Parallel Column GasChromatography With Single-DetectorTOF-MS and Chemometric Analysis.Anal. Chem. 1999, 71, 1093-1099.
51. Hirsch, R.; Ternes, T.A.; Bobeldijk, I.;Weck, R.A. Determination of Environ-mentally Relevant Compounds UsingFast GC/TOF-MS. Chimia 2001, 55, 19-22.
52. Hsu, C.S.; Green, M. Fragment-Free Ac-curate Mass Measurement of ComplexMixture Components by Gas Chroma-tography/Field Ionization-oaTOF-MS:an Unprecedented Capability for MixtureAnalysis. Rapid Commun. Mass Spec-trom. 2001, 15, 236-239.
53. Tandem Mass Spectrometry; McLaf-ferty, F.W., editor; John Wiley & Sons:New York, 1983.
54. Busch, K.L.; Glish, G.L.; McLuckey,S.A. Mass Spectrometry/Mass Spec-trometry; Wiley VCH: New York, 1988.
55. Kaufmann, R.; Kirsch, D.; Spengler, B.Sequencing of Peptides in a TOF MassSpectrometer: Evaluation of PostsourceDecay Following MALDI. Int. J. MassSpectrom. Ion Proc. 1994, 131, 355-385.
56. Brunelle, A.; Della-Negra, S.; Depauw,J.; Joret, H.; LeBeyec, Y. TOF-MS Witha Compact Two-Stage Electrostatic Mir-ror: Metastable-Ion Studies With HighMass Resolution and Ion Emission FromThick Insulators. Rapid Commun. MassSpectrom. 1991, 5, 40-43.
57. Schueler, B.; Beavis, R.; Ens, W.; Main,D.E.; Tang, X.; Standing, K.G. Uni-molecular Decay Measurements of Sec-ondary Ions From Organic Molecules byTOF-MS. Int. J. Mass Spectrom. IonProc. 1989, 92, 185-194.
58. Tang, X.; Ens, W.; Mayer, F.; Standing,K.G.; Westmore, J.B. Measurement ofUnimolecular Decay in Peptides ofMasses Greater Than 1200 Units by aReflecting TOF-MS. Rapid Commun.Mass Spectrom. 1989, 3, 443-448.
59. Tang, X.; Ens, W.; Standing, K.G.;Westmore, J.B. Daughter Ion MassSpectra From Cationized Molecules ofSmall Oligopeptides in a ReflectingTime-of-Flight Mass Spectrometer.Anal. Chem. 1988, 60, 1791-1799.
60. Boesl, U.; Weinkauf, R.; Schlag, E. Re-flectron TOF-MS and Laser Excitationfor the Analysis of Neutrals, IonizedMolecules and Secondary Fragments.Int. J. Mass Spectrom. Ion Proc. 1992,112, 121-166.
61. Cornish, T.J.; Cotter, R.J. Collision-Induced Dissociation in a Tandem Time-of-Flight Mass Spectrometer With Two
Reference List 185
Single-Stage Reflectrons. Org. MassSpectrom. 1993, 28, 1129-1134.
62. Medzihradszky, K.F.; Campbell, J.M.;Baldwin, M.A.; Falick, A.M.; Juhasz, P.;Vestal, M.L.; Burlingame, A.L. TheCharacteristics of Peptide Collision-Induced Dissociation Using a High-Performance MALDI-TOF/TOF Tan-dem Mass Spectrometer. Anal. Chem.2000, 72, 552-558.
63. Schnaible, V.; Wefing, S.; Resemann,A.; Suckau, D.; Bücker, A.; Wolf-Kümmeth, S.; Hoffmann, D. Screeningfor Disulfide Bonds in Proteins byMALDI in-Source Decay and LIFT-TOF/TOF-MS. Anal. Chem. 2002, 74,4980-4988.
64. Yergey, A.L.; Coorssen, J.R.; Backlund,P.S.; Blank, P.S.; Humphrey, G.A.;Zimmerberg, J.; Campbell, J.M.; Vestal,M.L. De Novo Sequencing of PeptidesUsing MALDI/TOF-TOF. J. Am. Soc.Mass Spectrom. 2002, 13, 784-791.
65. Giannakopulos, A.E.; Thomas, B.; Col-burn, A.W.; Reynolds, D.J.; Raptakis,E.N.; Makarov, A.A.; Derrick, P.J. Tan-dem Time-of-Flight Mass SpectrometerWith a Quadratic-Field Ion Mirror. Rev.Sci. Instrum. 2002, 73, 2115-2123.
66. Nier, A.O. The Development of a HighResolution Mass Spectrometer: a Remi-niscence. J. Am. Soc. Mass Spectrom.1991, 2, 447-452.
67. Nier, A.O. Some Reminiscences of MassSpectrometry and the Manhattan Project.J. Chem. Educ. 1989, 66, 385-388.
68. Nier, A.O. Some Reflections on theEarly Days of Mass Spectrometry at theUniversity of Minnesota. Int. J. MassSpectrom. Ion Proc. 1990, 100, 1-13.
69. Duckworth, H.E.; Barber, R.C.;Venkatasubramanian, V.S. Mass Spec-troscopy; 2nd ed.; Cambridge UniversityPress: Cambridge, 1986.
70. Cooks, R.G.; Beynon, J.H.; Caprioli,R.M. Instrumentation, in MetastableIons, Elsevier: Amsterdam, 1973; 5-18.
71. Morrison, J.D. Ion Focusing, MassAnalysis, and Detection, in Gaseous IonChemistry and Mass Spectrometry, Fu-trell, J.H., editor; John Wiley & Sons:New York, 1986; pp. 107-125.
72. Dempster, A.J. A New Method of Posi-tive Ray Analysis. Phys. Rev. 1918, 11,316-325.
73. Mattauch, J.; Herzog, R. Über EinenNeuen Massenspektrographen. Z. Phys.1934, 89, 786-795.
74. Bainbridge, K.T.; Jordan, E.B. Mass-Spectrum Analysis. 1. The Mass Spec-trograph. 2. The Existence of Isobars ofAdjacent Elements. Phys. Rev. 1936, 50 ,282-296.
75. Johnson, E.G.; Nier, A.O. Angular Aber-rations in Sector Shaped Electromag-netic Lenses for Focusing Beams ofCharged Particles. Phys. Rev. 1953, 91,10-17.
76. Morgan, R.P.; Beynon, J.H.; Bateman,R.H.; Green, B.N. The MM-ZAB-2FDouble-Focussing Mass Spectrometerand MIKE Spectrometer. Int. J. MassSpectrom. Ion Phys. 1978, 28, 171-191.
77. Hintenberger, H.; König, L.A. ÜberMassenspektrometer mit vollständigerDoppelfokussierung zweiter Ordnung. Z.Naturforsch. 1957, 12A, 443.
78. Guilhaus, M.; Boyd, R.K.; Brenton,A.G.; Beynon, J.H. Advantages of aSecond Electric Sector on a Double-Focusing Mass Spectrometer of Re-versed Configuration. Int. J. Mass Spec-trom. Ion Proc. 1985, 67, 209-227.
79. Bill, J.C.; Green, B.N.; Lewis, I.A.S. AHigh Field Magnet With Fast ScanningCapabilities. Int. J. Mass Spectrom. IonPhys. 1983, 46, 147-150.
80. Matsuda, H. High-Resolution High-Transmission Mass Spectrometer. Int. J.Mass Spectrom. Ion Proc. 1985, 66, 209-215.
81. Matsuda, H. Double-Focusing MassSpectrometers of Short Path Length. Int.J. Mass Spectrom. Ion Proc. 1989, 93,315-321.
82. Cooks, R.G.; Beynon, J.H.; Caprioli,R.M. Metastable Ions; Elsevier: Am-sterdam, 1973.
83. Hipple, J.A. Detection of MetastableIons With the Mass Spectrometer. Phys.Rev. 1945, 68, 54-55.
84. Hipple, J.A.; Fox, R.E.; Condon, E.U.Metastable Ions Formed by Electron Im-pact in Hydrocarbon Gases. Phys. Rev.1946, 69, 347-356.
85. Beynon, J.H.; Cooks, R.G.; Amy, J.W.;Baitinger, W.E.; Ridley, T.Y. Designand Performance of a Mass-AnalyzedIon Kinetic Energy (MIKE) Spectrome-ter. Anal. Chem. 1973, 45, 1023A.
86. Amy, J.W.; Baitinger, W.E.; Cooks,R.G. Building Mass Spectrometers and a

186 4 Instrumentation
Philosophy of Research. J. Am. Soc.Mass Spectrom. 1990, 1, 119-128.
87. Millington, D.S.; Smith, J.A. Fragmen-tation Patterns by Fast Linked Electricand Magnetic Field Scanning. Org. MassSpectrom. 1977, 12, 264-265.
88. Morgan, R.P.; Porter, C.J.; Beynon, J.H.On the Formation of Artefact Peaks inLinked Scans of the Magnet and ElectricSector Fields in a Mass Spectrometer.Org. Mass Spectrom. 1977, 12, 735-738.
89. Lacey, M.J.; Macdonald, C.G. The Useof Two Linked Scanning Modes in Al-ternation to Analyze Metastable Peaks.Org. Mass Spectrom. 1980, 15, 134-137.
90. Lacey, M.J.; Macdonald, C.G. Inter-preting Metastable Peaks From DoubleFocusing Mass Spectrometers. Org.Mass Spectrom. 1980, 15, 484-485.
91. Mouget, Y.; Bertrand, M.J. GraphicalMethod for Artefact Peak Interpretation,and Methods for Their Rejection, UsingDouble and Triple Sector Magnetic MassSpectrometers. Rapid Commun. MassSpectrom. 1995, 9, 387-396.
92. Evers, E.A.I.M.; Noest, A.J.; Akkerman,O.S. Deconvolution of Composite Me-tastable Peaks: a New Method for theDetermination of Metastable TransitionsOccurring in the First Field Free Region.Org. Mass Spectrom. 1977, 12, 419-420.
93. Boyd, R.K.; Porter, C.J.; Beynon, J.H. ANew Linked Scan for Reversed Geome-try Mass Spectrometers. Org. MassSpectrom. 1981, 16, 490-494.
94. Lacey, M.J.; Macdonald, C.G. ConstantNeutral Spectrum in Mass Spectrometry.Anal. Chem. 1979, 51, 691-695.
95. Boyd, R.K.; Beynon, J.H. Scanning ofSector Mass Spectrometers to Observethe Fragmentations of Metastable Ions.Org. Mass Spectrom. 1977, 12, 163-165.
96. Jennings, K. R. Scanning Methods forDouble-Focusing Mass Spectrometers.Almoster Ferreira, M. A. [118], 7-21.1984. Dordrecht, D. Reidel Publishing.NATO ASI Series C: Mathematical andPhysical Sciences: Ionic Processes GasPhase.
97. Fraefel, A.; Seibl, J. Selective Analysisof Metastable Ions. Mass Spectrom. Rev.1984, 4, 151-221.
98. Boyd, R.K. Linked-Scan Techniques forMS/MS Using Tandem-in-Space Instru-ments. Mass Spectrom. Rev. 1994, 13,359-410.
99. Walther, H.; Schlunegger, U.P.; Friedli,F. Quantitative Determination of Com-pounds in Mixtures by B2E = Const.Linked Scans. Org. Mass Spectrom.1983, 18, 572-575.
100. Futrell, J.H. Development of TandemMS. One Perspective. Int. J. Mass Spec-trom. 2000, 200, 495-508.
101. Fenselau, C. Tandem MS: the Competi-tive Edge for Pharmacology. Annu. Rev.Pharmacol. Toxicol. 1992, 32, 555-578.
102. Srinivas, R.; Sülzle, D.; Weiske, T.;Schwarz, H. Generation and Characteri-zation of Neutral and Cationic 3-Silacyclopropenylidene in the GasPhase. Description of a New BEBE Tan-dem Mass Spectrometer. Int. J. MassSpectrom. Ion Proc. 1991, 107, 369-376.
103. Paul, W. Elektromagnetische Käfige fürneutrale und geladene Teilchen. Angew.Chem. 1990, 102, 780-789.
104. Paul, W. Electromagnetic Traps forCharged and Neutral Particles, in NobelPrize Lectures in Physics 1981-1990,World Scientific Publishing: Singapore,1993; pp. 601-622.
105. Paul, W.; Steinwedel, H. A New MassSpectrometer Without Magnetic Field. Z.Naturforsch. 1953, 8A, 448-450.
106. Paul, W.; Raether, M. Das elektrischeMassenfilter. Z. Phys. 1955, 140, 262-273.
107. Lawson, G.; Todd, J.F.J. Radio-Frequency Quadrupole Mass Spec-trometers. Chem. Brit. 1972, 8, 373-380.
108. Dawson, P.H. Quadrupole Mass Spec-trometry and Its Applications; 1st ed.;Elsevier: New York, 1976.
109. Dawson, P.H. Quadrupole Mass Analyz-ers: Performance, Design and Some Re-cent Applications. Mass Spectrom. Rev.1986, 5, 1-37.
110. Blaum, K.; Geppert, C.; Müller, P.;Nörtershäuser, W.; Otten, E.W.; Schmitt,A.; Trautmann, N.; Wendt, K.; Bushaw,B.A. Properties and Performance of aQuadrupole Mass Filter Used for Reso-nance Ionization Mass Spectrometry. Int.J. Mass Spectrom. 1998, 181, 67-87.
111. Amad, M.H.; Houk, R.S. High-Resolution Mass Spectrometry With aMultiple Pass Quadrupole Mass Ana-lyzer. Anal. Chem. 1998, 70, 4885-4889.
112. Liyu, Y.; Amad, M.H.; Winnik, W.M.;Schoen, A.E.; Schweingruber, H.; Myl-chreest, I.; Rudewicz, P.J. Investigationof an Enhanced Resolution Triple Quad-

Reference List 187
rupole Mass Spectrometer for High-Throughput LC-MS/MS Assays. RapidCommun. Mass Spectrom. 2002, 16,2060-2066.
113. Denison, D.R. Operating Parameters of aQuadrupole in a Grounded CylindricalHousing. J. Vac. Sci. Technol. 1971, 8,266-269.
114. Dawson, P.H.; Whetten, N.R. NonlinearResonances in Quadrupole Mass Spec-trometers Due to Imperfect Fields. II.Quadrupole Mass Filter and the Mono-pole Mass Spectrometer. Int. J. MassSpectrom. Ion Phys. 1969, 3, 1-12.
115. Brubaker, W.M. Comparison of Quad-rupole Mass Spectrometers With Roundand Hyperbolic Rods. J. Vac. Sci. Tech-nol. 1967, 4, 326.
116. Gibson, J.R.; Taylor, S. Prediction ofQuadrupole Mass Filter Performance forHyperbolic and Circular Cross SectionElectrodes. Rapid Commun. MassSpectrom. 2000, 14, 1669-1673.
117. Chen, W.; Collings, B.A.; Douglas, D.J.High-Resolution Mass SpectrometryWith a Quadrupole Operated in theFourth Stability Region. Anal. Chem.2000, 72, 540-545.
118. Huang, Y.; Guan, S.; Kim, H.S.; Mar-shall, A.G. Ion Transport Through aStrong Magnetic Field Gradient by Ra-dio Frequency-Only Octupole IonGuides. Int. J. Mass Spectrom. Ion Proc.1996, 152, 121-133.
119. Tolmachev, A.V.; Udseth, H.R.; Smith,R.D. Radial Stratification of Ions As aFunction of Mass to Charge Ratio inCollisional Cooling Radio FrequencyMultipoles Used As Ion Guides or IonTraps. Rapid Commun. Mass Spectrom.2000, 14, 1907-1913.
120. Thomson, B.A. 1997 McBryde MedalAward Lecture Radio Frequency Quad-rupole Ion Guides in Modern MassSpectrometry. Can. J. Chem. 1998, 76,499-505.
121. Lock, C.M.; Dyer, E. Characterization ofHigh Pressure Quadrupole CollisionCells Possessing Direct Current AxialFields. Rapid Commun. Mass Spectrom.1999, 13, 432-448.
122. Lock, C.M.; Dyer, E. Simulation of IonTrajectories Through a High PressureRF-only Quadrupole Collision Cell bySIMION 6.0. Rapid Commun. MassSpectrom. 1999, 13, 422-431.
123. Adlhart, C.; Hinderling, C.; Baumann,H.; Chen, P. Mechanistic Studies of Ole-fin Metathesis by Ruthenium CarbeneComplexes Using ESI-MS/MS. J. Am.Chem. Soc. 2000, 122, 8204-8214.
124. Yost, R.A.; Enke, C.G. Selected IonFragmentation With a Tandem Quad-rupole Mass Spectrometer. J. Am. Chem.Soc. 1978, 100, 2274-2275.
125. Yost, R.A.; Enke, C.G.; McGilvery,D.C.; Smith, D.; Morrison, J.D. High Ef-ficiency Collision-Induced Dissociationin an Rf-Only Quadrupole. Int. J. MassSpectrom. Ion Phys. 1979, 30, 127-136.
126. Yost, R.A.; Enke, C.G. Triple Quad-rupole Mass Spectrometry for DirectMixture Analysis and Structure Elucida-tion. Anal. Chem. 1979, 51, 1251A-1262A.
127. Hunt, D.F.; Shabanowitz, J.; Giordani,A.B. Collision Activated Decomposi-tions in Mixture Analysis With a TripleQuadrupole Mass Spectrometer. Anal.Chem. 1980, 52, 386-390.
128. Dawson, P.H.; French, J.B.; Buckley,J.A.; Douglas, D.J.; Simmons, D. TheUse of Triple Quadrupoles for Sequen-tial Mass Spectrometry: The InstrumentParameters. Org. Mass Spectrom. 1982,17, 205-211.
129. Dawson, P.H.; French, J.B.; Buckley,J.A.; Douglas, D.J.; Simmons, D. TheUse of Triple Quadrupoles for Sequen-tial Mass Spectrometry: A Detailed CaseStudy. Org. Mass Spectrom. 1982, 17,212-219.
130. Thomson, B.A.; Douglas, D.J.; Corr,J.J.; Hager, J.W.; Jolliffe, C.L. ImprovedCID Efficiency and Mass Resolution ona Triple Quadrupole Mass Spectrometer.Anal. Chem. 1995, 67, 1696-1704.
131. Mao, D.; Douglas, D.J. H/D Exchange ofGas Phase Bradykinin Ions in a LinearQuadrupole Ion Trap. J. Am. Soc. MassSpectrom. 2003, 14, 85-94.
132. Hofstadler, S.A.; Sannes-Lowery, K.A.;Griffey, R.H. Enhanced Gas-Phase Hy-drogen-Deuterium Exchange of Oligo-nucleotide and Protein Ions Stored in anExternal Multipole Ion Reservoir. J.Mass Spectrom. 2000, 35, 62-70.
133. Collings, B.A.; Campbell, J.M.; Mao,D.; Douglas, D.J. A Combined LinearIon Trap TOF System With ImprovedPerformance and MSn Capabilities.Rapid Commun. Mass Spectrom. 2001,15, 1777-1795.

188 4 Instrumentation
134. Hager, J.W. A New Linear Ion TrapMass Spectrometer. Rapid Commun.Mass Spectrom. 2002, 16, 512-526.
135. Schwartz, J.C.; Senko, M.W.; Syka,J.E.P. A Two-Dimensional QuadrupoleIon Trap Mass Spectrometer. J. Am. Soc.Mass Spectrom. 2002, 13, 659-669.
136. Collings, B.A.; Scott, W.R.; Londry,F.A. Resonant Excitation in a Low-Pressure Linear Ion Trap. J. Am. Soc.Mass Spectrom. 2003, 14, 622-634.
137. March, R.E.; Hughes, R.J. QuadrupoleStorage Mass Spectrometry; John Wiley& Sons: Chichester, 1989.
138. March, R.E. Quadrupole Ion Trap MassSpectrometry: Theory, Simulation, Re-cent Developments and Applications.Rapid Commun. Mass Spectrom. 1998,12, 1543-1554.
139. March, R.E. Quadrupole Ion Trap MassSpectrometry. A View at the Turn of theCentury. Int. J. Mass Spectrom. 2000,200, 285-312.
140. Stafford, G., Jr. Ion Trap Mass Spec-trometry: a Personal Perspective. J. Am.Soc. Mass Spectrom. 2002, 13, 589-596.
141. Practical Aspects of Ion Trap MassSpectrometry; March, R.E.; Todd, J.F.J.,editors; CRC Press: Boca Raton, 1995;Vol. 1 - Fundamentals of Ion Trap MassSpectrometry.
142. Practical Aspects of Ion Trap MassSpectrometry; March, R.E.; Todd, J.F.J.,editors; CRC Press: Boca Raton, 1995;Vol. 2 - Ion Trap Instrumentation.
143. Practical Aspects of Ion Trap MassSpectrometry; March, R.E.; Todd, J.F.J.,editors; CRC Press: Boca Raton, 1995;Vol. 3 - Chemical, Environmental, andBiomedical Applications.
144. Yoshinari, K. Theoretical and NumericalAnalysis of the Behavior of Ions Injectedinto a Quadrupole Ion Trap Mass Spec-trometer. Rapid Commun. Mass Spec-trom. 2000, 14, 215-223.
145. Alheit, R.; Kleinadam, S.; Vedel, F.;Vedel, M.; Werth, G. Higher Order Non-Linear Resonances in a Paul Trap. Int. J.Mass Spectrom. Ion Proc. 1996, 154,155-169.
146. Wuerker, R.F.; Shelton, H.; Langmuir,R.V. Electrodynamic Containment ofCharged Particles. J. Appl. Phys. 1959,30, 342-349.
147. Ehlers, M.; Schmidt, S.; Lee, B.J.; Gro-temeyer, J. Design and Set-Up of anExternal Ion Source Coupled to a Quad-
rupole-Ion-Trap Reflectron-Time-of-Flight Hybrid Instrument. Eur. J. MassSpectrom. 2000, 6, 377-385.
148. Forbes, M.W.; Sharifi, M.; Croley, T.;Lausevic, Z.; March, R.E. Simulation ofIon Trajectories in a Quadrupole IonTrap: a Comparison of Three SimulationPrograms. J. Mass Spectrom. 1999, 34,1219-1239.
149. Coon, J.J.; Steele, H.A.; Laipis, P.;Harrison, W.W. LD-APCI: a Novel IonSource for the Direct Coupling of GelElectrophoresis to Mass Spectrometry. J.Mass Spectrom. 2002, 37, 1163-1167.
150. Stafford, G.C., Jr.; Kelley, P.E.; Syka,J.E.P.; Reynolds, W.E.; Todd, J.F.J. Re-cent Improvements in and AnalyticalApplications of Advanced Ion TrapTechnology. Int. J. Mass Spectrom. IonProc. 1984, 60, 85-98.
151. Dawson, P.H.; Hedman, J.W.; Whetten,N.R. Mass Spectrometer. Rev. Sci. In-strum. 1969, 40, 1444-1450.
152. Dawson, P.H.; Whetten, N.R. MiniatureMass Spectrometer. Anal. Chem. 1970,42, 103A-108A.
153. Griffiths, I.W.; Heesterman, P.J.L.Quadrupole Ion Store (QUISTOR) MassSpectrometry. Int. J. Mass Spectrom. IonProc. 1990, 99, 79-98.
154. Griffiths, I.W. Recent Advances in Ion-Trap Technology. Rapid Commun. MassSpectrom. 1990, 4, 69-73.
155. Kelley, P. E.; Stafford, G. C., Jr.; Syka,J. E. P.; Reynolds, W. E.; Louris, J. N.;Todd, J. F. J. New advances in the op-eration of the ion trap mass spectrome-ter. Adv. Mass Spectrom. 1986, 10B,869-870.
156. Splendore, M.; Lausevic, M.; Lausevic,Z.; March, R.E. Resonant Excitationand/or Ejection of Ions Subjected to DCand RF Fields in a Commercial Quad-rupole Ion Trap. Rapid Commun. MassSpectrom. 1997, 11, 228-233.
157. Creaser, C.S.; Stygall, J.W. A Compari-son of Overtone and Fundamental Reso-nances for Mass Range Extension byResonance Ejection in a Quadrupole IonTrap Mass Spectrometer. Int. J. MassSpectrom. 1999, 190/191, 145-151.
158. Williams, J.D.; Cox, K.A.; Cooks, R.G.;McLuckey, S.A.; Hart, K.J.; Goeringer,D.E. Resonance Ejection Ion Trap MassSpectrometry and Nonlinear Field Con-tributions: The Effect of Scan Direction

Reference List 189
on Mass Resolution. Anal. Chem. 1994,66, 725-729.
159. Cooks, R. G.; Amy, J. W.; Bier, M.;Schwartz, J. C.; Schey, K. New massspectrometers. Adv Mass Spec-trom. 1989, 11A, 33-52.
160. Kaiser, R.E., Jr.; Louris, J.N.; Amy,J.W.; Cooks, R.G. Extending the MassRange of the Quadrupole Ion Trap UsingAxial Modulation. Rapid Commun. MassSpectrom. 1989, 3, 225-229.
161. Weber-Grabau, M.; Kelley, P.; Brad-shaw, S.; Hoekman, D.; Evans, S.;Bishop, P. Recent advances in ion-traptechnology. Adv Mass Spectrom. 1989,11A., 152-153
162. Siethoff, C.; Wagner-Redeker, W.;Schäfer, M.; Linscheid, M. HPLC-MSWith an Ion Trap Mass Spectrometer.Chimia 1999, 53, 484-491.
163. Eades, D.M.; Johnson, J.V.; Yost, R.A.Nonlinear Resonance Effects During IonStorage in a Quadrupole Ion Trap. J. Am.Soc. Mass Spectrom. 1993, 4, 917-929.
164. Makarov, A.A. Resonance EjectionFrom the Paul Trap: A TheoreticalTreatment Incorporating a Weak Octa-pole Field. Anal. Chem. 1996, 68, 4257-4263.
165. Doroshenko, V.M.; Cotter, R.J. Lossesof Ions During Forward and ReverseScans in a QIT Mass Spectrometer andHow to Reduce Them. J. Am. Soc. MassSpectrom. 1997, 8, 1141-1146.
166. von Busch, F.; Paul, W. NonlinearResonances in Electric Mass-Filters As aConsequence of Field Irregularities. Z.Phys. 1961, 164, 588-594.
167. Dawson, P.H.; Whetten, N.R. NonlinearResonances in Quadrupole Mass Spec-trometers Due to Imperfect Fields. I.Quadrupole Ion Trap. Int. J. Mass Spec-trom. Ion Phys. 1969, 2, 45-59.
168. Wang, Y.; Franzen, J. The Non-LinearIon Trap. Part 3. Multipole Componentsin Three Types of Practical Ion Trap. Int.J. Mass Spectrom. Ion Proc. 1994, 132,155-172.
169. Franzen, J. The Non-Linear Ion Trap.Part 5. Nature of Non-Linear Resonancesand Resonant Ion Ejection. Int. J. MassSpectrom. Ion Proc. 1994, 130, 15-40.
170. Brodbelt, J.S.; Louris, J.N.; Cooks, R.G.Chemical Ionization in an Ion Trap MassSpectrometer. Anal. Chem. 1987, 59,1278-1285.
171. Doroshenko, V.M.; Cotter, R.J. Injectionof Externally Generated Ions into an In-creasing Trapping Field of a QIT MassSpectrometer. J. Mass Spectrom. 1997,31, 602-615.
172. Van Berkel, G.J.; Glish, G.L.;McLuckey, S.A. ESI Combined WithQIT Mass Spectrometry. Anal. Chem.1990, 62, 1284-1295.
173. Wang, Y.; Schubert, M.; Ingendoh, A.;Franzen, J. Analysis of Non-CovalentProtein Complexes up to 290 kDa UsingElectrospray Ionization and Ion TrapMass Spectrometry. Rapid Commun.Mass Spectrom. 2000, 14, 12-17.
174. Schwartz, J.C.; Jardine, I. High-Resolution Parent-Ion Selection/-Isolation Using a QIT Mass Spectrome-ter. Rapid Commun. Mass Spectrom.1992, 6, 313-317.
175. Louris, J.N.; Cooks, R.G.; Syka, J.E.P.;Kelley, P.E.; Stafford, G.C., Jr.; Todd,J.F.J. Instrumentation, Applications, andEnergy Deposition in Quadrupole Ion-Trap Tandem Mass Spectrometry. Anal.Chem. 1987, 59, 1677-1685.
176. McLuckey, S.A.; Glish, G.L.; Kelley,P.E. CID of Negative Ions in an Ion TrapMass Spectrometer. Anal. Chem. 1987,59, 1670-1674.
177. Hashimoto, Y.; Hasegawa, H.; Yoshi-nari, K. Collision-Activated InfraredMultiphoton Dissociation in a Quad-rupole Ion Trap Mass Spectrometer.Anal. Chem. 2003, 75, 420-425.
178. Kuzma, M.; Jegorov, A.; Kacer, P.;Havlícek, V. Sequencing of New Beau-verolides by HPLC and MS. J. MassSpectrom. 2001, 36, 1108-1115.
179. Lawrence, E.O.; Livingston, M.S. TheProduction of High-Speed Light IonsWithout the Use of High Voltages. Phys.Rev. 1932, 40, 19-35.
180. Comisarow, M.B.; Marshall, A.G. TheEarly Development of Fourier Trans-form Ion Cyclotron Resonance (FT-ICR)Spectroscopy. J. Mass Spectrom. 1996,31, 581-585.
181. Smith, L.G. New Magnetic Period MassSpectrometer. Rev. Sci. Instrum. 1951,22, 115-116.
182. Sommer, H.; Thomas, H.A.; Hipple, J.A.Measurement of E/M by CyclotronResonance. Phys. Rev. 1951, 82, 697-702.

190 4 Instrumentation
183. Baldeschwieler, J.D. Ion CyclotronResonance Spectroscopy. Science 1968,159, 263-273.
184. Fourier Transform Ion Cyclotron Reso-nance Mass Spectrometry: AnalyticalApplications; Asamoto, B., editor; JohnWiley & Sons: New York, 1991.
185. Comisarow, M.B.; Marshall, A.G. Fou-rier Transform Ion Cyclotron ResonanceSpectroscopy. Chem. Phys. Lett. 1974,25, 282-283.
186. Comisarow, M.B.; Marshall, A.G. Fre-quency-Sweep FT-ICR Spectroscopy.Chem. Phys. Lett. 1974, 26, 489-490.
187. Wanczek, K.-P. ICR Spectrometry - AReview of New Developments in The-ory, Instrumentation and Applications. I.1983-1986. Int. J. Mass Spectrom. IonProc. 1989, 95, 1-38.
188. Marshall, A.G.; Grosshans, P.B. FT-ICR-MS: the Teenage Years. Anal.Chem. 1991, 63, 215A-229A.
189. Amster, I.J. Fourier Transform MassSpectrometry. J. Mass Spectrom. 1996,31, 1325-1337.
190. Dienes, T.; Salvador, J.P.; Schürch, S.;Scott, J.R.; Yao, J.; Cui, S.; Wilkins,C.L. FTMS - Advancing Years (1992-Mid. 1996). Mass Spectrom. Rev. 1996,15, 163-211.
191. Marshall, A.G. Milestones in FT-ICRTechnique Development. Int. J. MassSpectrom. 2000, 200, 331-356.
192. Smith, R.D. Evolution of ESI-MS andFT-ICR for Proteomics and Other Bio-logical Applications. Int. J. Mass Spec-trom. 2000, 200, 509-544.
193. He, F.; Hendrickson, C.L.; Marshall,A.G. Baseline Mass Resolution of Pep-tide Isobars: A Record for MolecularMass Resolution. Anal. Chem. 2001, 73,647-650.
194. Bossio, R.E.; Marshall, A.G. BaselineResolution of Isobaric Phosphorylatedand Sulfated Peptides and Nucleotidesby ESI-FT-ICR-MS: Another Step To-ward MS-Based Proteomics. Anal.Chem. 2002, 74, 1674-1679.
195. White, F.M.; Marto, J.A.; Marshall, A.G.An External Source 7 T FT-ICR MassSpectrometer With Electrostatic IonGuide. Rapid Commun. Mass Spectrom.1996, 10, 1845-1849.
196. Castleman Jr., A.W.; Futrell, J.H.;Lindinger, W.; Märk, T.D.; Morrison,J.D.; Shirts, R.B.; Smith, D.L.;Wahrhaftig, A.L. Gaseous Ion Chemistry
and Mass Spectrometry; Futrell, J.H.,editor; John Wiley and Sons: New York,1986.
197. Comisarow, M.B.; Marshall, A.G. The-ory of FT-ICR-MS. I. FundamentalEquations and Low-Pressure Line Shape.J. Chem. Phys. 1976, 64, 110-119.
198. Comisarow, M.B. Signal Modeling forIon Cyclotron Resonance. J. Chem.Phys. 1978, 69, 4097-4104.
199. Hughey, C.A.; Rodgers, R.P.; Marshall,A.G. Resolution of 11,000 Composition-ally Distinct Components in a SingleESI-FT-ICR Mass Spectrum of CrudeOil. Anal. Chem. 2002, 74, 4145-4149.
200. Marshall, A.G.; Hendrickson, C.L. FT-ICR Detection: Principles and Experi-mental Configurations. Int. J. MassSpectrom. 2002, 215, 59-75.
201. Marshall, A.G.; Hendrickson, C.L.;Jackson, G.S. FT-ICR-MS: a Primer.Mass Spectrom. Rev. 1998, 17, 1-35.
202. Shi, S.D.H.; Drader, J.J.; Freitas, M.A.;Hendrickson, C.L.; Marshall, A.G.Comparison and Interconversion of theTwo Most Common Frequency-to-MassCalibration Functions for FT-ICR-MS.Int. J. Mass Spectrom. 2000, 195/196,591-598.
203. Caravatti, P.; Allemann, M. The InfinityCell: a New Trapped-Ion Cell With Ra-diofrequency Covered Trapping Elec-trodes for FT-ICR-MS. Org. MassSpectrom. 1991, 26, 514-518.
204. Huang, Y.; Li, G.-Z.; Guan, S.; Mar-shall, A.G. A Combined Linear Ion Trapfor Mass Spectrometry. J. Am. Soc. MassSpectrom. 1997, 8, 962-969.
205. Guan, S.; Marshall, A.G. Ion Traps forFT-ICR-MS: Principles and Design ofGeometric and Electric Configurations.Int. J. Mass Spectrom. Ion Proc. 1995,146/147, 261-296.
206. Guan, S.; Marshall, A.G. Stored Wave-form Inverse Fourier Transform(SWIFT) Ion Excitation in Trapped-IonMass Spectrometry: Theory and Appli-cations. Int. J. Mass Spectrom. Ion Proc.1996, 157/158, 5-37.
207. Solouki, T.; Emmet, M.R.; Guan, S.;Marshall, A.G. Detection, Number, andSequence Location of Sulfur-ContainingAmino Acids and Disulfide Bridges inPeptides by Ultrahigh-ResolutionMALDI-FT-ICR-MS. Anal. Chem. 1997,69, 1163-1168.

Reference List 191
208. Wu, Z.; Hendrickson, C.L.; Rodgers,R.P.; Marshall, A.G. Composition ofExplosives by ESI-FT-ICR-MS. Anal.Chem. 2002, 74, 1879-1883.
209. Wang, Y.; Shi, S.D.H.; Hendrickson,C.L.; Marshall, A.G. Mass-Selective IonAccumulation and Fragmentation in aLinear Octopole Ion Trap External to aFT-ICR Mass Spectrometer. Int. J. MassSpectrom. 2000, 198, 113-120.
210. Cody, R.B.; Freiser, B.S. CID in a FT-ICR Mass Spectrometer. Int. J. MassSpectrom. Ion Phys. 1982, 41, 199-204.
211. Cody, R.B.; Burnier, R.C.; Freiser, B.S.Collision-Induced Dissociation WithFTMS. Anal. Chem. 1982, 54, 96-101.
212. Gauthier, J.W.; Trautman, T.R.; Jacob-son, D.B. Sustained Off-Resonance Irra-diation for Collision-Activated Disso-ciation Involving FT-ICR-MS. CIDTechnique That Emulates Infrared Mul-tiphoton Dissociation. Anal. Chim. Acta1991, 246, 211-225.
213. Senko, M.W.; Speir, J.P.; McLafferty,F.W. Collisional Activation of LargeMultiply Charged Ions Using FT-MS.Anal. Chem. 1994, 66, 2801-2808.
214. Boering, K.A.; Rolfe, J.; Brauman, J.I.Control of Ion Kinetic Energy in Ion Cy-clotron Resonance Spectrometry: Very-Low-Energy CID. Rapid Commun. MassSpectrom. 1992, 6, 303-305.
215. Lee, S.A.; Jiao, C.Q.; Huang, Y.; Freiser,B.S. Multiple Excitation Collisional Ac-tivation in FTMS. Rapid Commun. MassSpectrom. 1993, 7, 819-821.
216. Cody, R.B.; Freiser, B.S. High-Resolution Detection of Collision-Induced Dissociation Fragments by FT-MS. Anal. Chem. 1982, 54, 1431-1433.
217. Cody, R.B. Accurate Mass Measure-ments on Daughter Ions From Colli-sional Activation in FTMS. Anal. Chem.1988, 60, 917-923.
218. McLuckey, S.A.; Glish, G.L.; Cooks,R.G. Kinetic Energy Effects in MassSpectrometry/Mass Spectrometry Usinga Sector/Quadrupole Tandem Instru-ment. Int. J. Mass Spectrom. Ion Phys.1981, 39, 219-230.
219. Glish, G.L.; McLuckey, S.A.; Ridley,T.Y.; Cooks, R.G. A New "Hybrid"Sector/Quadrupole Mass Spectrometerfor MS/MS. Int. J. Mass Spectrom. IonPhys. 1982, 41, 157-177.
220. Bradley, C.D.; Curtis, J.M.; Derrick,P.J.; Wright, B. Tandem Mass Spec-
trometry of Peptides Using a MagneticSector/Quadrupole Hybrid-the Case forHigher Collision Energy and Higher Ra-dio-Frequency Power. Anal. Chem.1992, 64, 2628-2635.
221. Schoen, A.E.; Amy, J.W.; Ciupek, J.D.;Cooks, R.G.; Dobberstein, P.; Jung, G. AHybrid BEQQ Mass Spectrometer. Int.J. Mass Spectrom. Ion Proc. 1985, 65,125-140.
222. Ciupek, J.D.; Amy, J.W.; Cooks, R.G.;Schoen, A.E. Performance of a HybridMass Spectrometer. Int. J. Mass Spec-trom. Ion Proc. 1985, 65, 141-157.
223. Louris, J.N.; Wright, L.G.; Cooks, R.G.New Scan Modes Accessed With a Hy-brid Mass Spectrometer. Anal. Chem.1985, 57, 2918-2924.
224. Loo, J.A.; Münster, H. Magnetic Sector-Ion Trap Mass Spectrometry With Elec-trospray Ionization for High SensitivityPeptide Sequencing. Rapid Commun.Mass Spectrom. 1999, 13, 54-60.
225. Strobel, F.H.; Solouki, T.; White, M.A.;Russell, D.H. Detection of Femtomoleand Sub-Femtomole Levels of Peptidesby Tandem Magnetic Sector/ReflectronTOF Mass Spectrometry and MALDI. J.Am. Soc. Mass Spectrom. 1991, 2, 91-94.
226. Bateman, R.H.; Green, M.R.; Scott, G.;Clayton, E. A Combined Magnetic Sec-tor-Time-of-Flight Mass Spectrometerfor Structural Determination Studies byTandem MS. Rapid Commun. MassSpectrom. 1995, 9, 1227-1233.
227. Aicher, K.P.; Müller, M.; Wilhelm, U.;Grotemeyer, J. Design and Setup of anIon Trap-Reflectron-TOF Mass Spec-trometer. Eur. Mass Spectrom. 1995, 1,331-340.
228. Wilhelm, U.; Aicher, K.P.; Grotemeyer,J. Ion Storage Combined With Reflec-tron TOF Mass Spectrometry: Ion CloudMotions As a Result of Jet-CooledMolecules. Int. J. Mass Spectrom. IonProc. 1996, 152, 111-120.
229. Morris, H.R.; Paxton, T.; Dell, A.;Langhorne, J.; Berg, M.; Bordoli, R.S.;Hoyes, J.; Bateman, R.H. High Sensitiv-ity CID Tandem MS on a Novel Quad-rupole-oaTOF Mass Spectrometer.Rapid Commun. Mass Spectrom. 1996,10, 889-896.
230. Shevchenko, A.; Chernushevich, I.V.;Ens, W.; Standing, K.G.; Thompson, B.;Wilm, M.; Mann, M. Rapid 'De Novo'Peptide Sequencing by a Combination of

192 4 Instrumentation
nanoESI, Isotopic Labeling and a Quad-rupole-TOF Mass Spectrometer. RapidCommun. Mass Spectrom. 1997, 11,1015-1024.
231. Hopfgartner, G.; Chernushevich, I.V.;Covey, T.; Plomley, J.B.; Bonner, R.Exact Mass Measurement of ProductIons for the Structural Elucidation ofDrug Metabolites With a Tandem Quad-rupole oaTOF Mass Spectrometer. J.Am. Soc. Mass Spectrom. 1999, 10,1305-1314.
232. Platzner, I.T.; Habfast, K.; Walder, A.J.;Goetz, A. Modern Isotope Ratio MassSpectrometry; 1st ed.; John Wiley &Sons: Chichester, 1997.
233. Stanton, H.E.; Chupka, W.A.; Inghram,M.G. Electron Multipliers in MassSpectrometry; Effect of MolecularStructure. Rev. Sci. Instrum. 1956, 27,109.
234. Frank, M. Mass Spectrometry WithCryogenic Detectors. Nucl. Instrum.Methods Phys. Res. ,A 2000, 444, 375-384.
235. Allen, J.S. An Improved Electron-Multiplier Particle Counter. Rev. Sci. In-strum. 1947, 18, 739-749.
236. Wang, G.H.; Aberth, W.; Falick, A.M.Evidence Concerning the Identity ofSecondary Particles in Post-AccelerationDetectors. Int. J. Mass Spectrom. IonProc. 1986, 69, 233-237.
237. Busch, K.L. The Electron Multiplier.Spectroscopy 2000, 15, 28-33.
238. Schröder, E. Massenspektrometrie - Be-griffe und Definitionen; Springer-Verlag:Heidelberg, 1991.
239. Boerboom, A.J.H. Array Detection ofMass Spectra, a Comparison With Con-ventional Detection Methods. Org. MassSpectrom. 1991, 26, 929-935.
240. Kurz, E.A. Channel Electron Multipliers.Am. Laboratory 1979, 11, 67-82.
241. Wiza, J.L. Microchannel Plate Detectors.Nucl. Instrum. Methods 1979, 162, 587-601.
242. Laprade, B.N.; Labich, R.J. Microchan-nel Plate-Based Detectors in Mass Spec-trometry. Spectroscopy 1994, 9, 26-30.
243. Alexandrov, M.L.; Gall, L.N.; Krasnov,N.V.; Lokshin, L.R.; Chuprikov, A.V.Discrimination Effects in Inorganic Ion-Cluster Detection by SEM in MassSpectrometry Experiments. Rapid Com-mun. Mass Spectrom. 1990, 4, 9-12.
244. Geno, P.W.; Macfarlane, R.D. Secon-dary Electron Emission Induced by Im-pact of Low-Velocity Molecular Ions ona MCP. Int. J. Mass Spectrom. Ion Proc.1989, 92, 195-210.
245. Hedin, H.; Håkansson, K.; Sundqvist,B.U.R. On the Detection of Large Or-ganic Ions by Secondary Electron Pro-duction. Int. J. Mass Spectrom. Ion Proc.1987, 75, 275-289.
246. Hill, J.A.; Biller, J.E.; Martin, S.A.;Biemann, K.; Yoshidome, K.; Sato, K.Design Considerations, Calibration andApplications of an Array Detector for aFour-Sector Tandem Mass Spectrometer.Int. J. Mass Spectrom. Ion Proc. 1989,92, 211-230.
247. Birkinshaw, K. Fundamentals of FocalPlane Detectors. J. Mass Spectrom.1997, 32, 795-806.
248. Cottrell, J.S.; Evans, S. The Applicationof a Multichannel Electro-Optical De-tection System to the Analysis of LargeMolecules by FAB-MS. Rapid Commun.Mass Spectrom. 1987, 1, 1-2.
249. Cottrell, J.S.; Evans, S. Characteristicsof a Multichannel Electrooptical Detec-tion System and Its Application to theAnalysis of Large Molecules by FAB-MS. Anal. Chem. 1987, 59, 1990-1995.
250. Birkinshaw, K.; Langstaff, D.P. TheIdeal Detector. Rapid Commun. MassSpectrom. 1996, 10, 1675-1677.
251. Hucknall, D.J. Vacuum Technology andApplications; 1st ed.; Butterworth-Heinemann: Oxford, 1991.
252. Pupp, W.; Hartmann, H.K. Vakuum-Technik - Grundlagen und Anwendun-gen; Fachbuchverlag Leipzig: Leipzig,1991.
253. Wutz, M.; Adam, H.; Walcher, W. The-ory and Practice of Vacuum Technology;5th ed.; Vieweg: Braunschweig/-Wiesbaden, 1992.
254. Foundations of Vacuum Science andTechnology; Lafferty, J.M., editor; JohnWiley & Sons: New York, 1998.
255. Leybold Vacuum Products and Refer-ence Book; Umrath, W., editor; LeyboldVacuum GmbH: Köln, 2001.
256. Busch, K.L. Vacuum in Mass Spectros-copy. Nothing Can Surprise You. Spec-troscopy 2000, 15, 22-25.
257. Busch, K.L. High-Vacuum Pumps inMass Spectrometers. Spectroscopy 2001,16, 14-18.

5 Electron Ionization
The use of electron ionization (EI) [1] dates back to the infancy of mass spec-trometry in the early 20th century. Ionization is effected by shooting energeticelectrons onto a neutral that must have been transferred into the gas phase before.EI definitely is the classical approach to ionization in organic mass spectrometry,and only the production of ions in electrical discharges and by thermal ionization(TI) of inorganic salts have earlier been in use. [2] Nevertheless, EI still representsan important technique for the analysis of low- to medium-polarity, non-ionic or-ganic compounds in the range of molecular weights up to Mr 1000. Until recentyears, EI has been termed electron impact ionization or simply electron impact(EI).
The physicochemical aspects of the ionization process in general, ion internalenergy, and the principles determining the reaction pathways of excited ions havealready been addressed (Chap. 2). After a brief repetition of some of these issueswe will go more deeply into detail from the analytical point of view. Next, we willdiscuss technical and practical aspects concerning the construction of EI ionsources and sample introduction systems. Finally, this chapter directly leads overto the interpretation of EI mass spectra (Chap. 6).
Note: Sample introduction systems such as reservoir inlets, chromatographs,and various types of direct probes (Chap. 5.3) are of equal importance to otherionization methods. The same holds valid for the concepts of sensitivity, detec-tion limit, and signal-to-noise ratio (Chap. 5.2.4) and finally to all sorts of ionchromatograms (Chap. 5.4).
5.1 Behavior of Neutrals Upon Electron Impact
5.1.1 Formation of Ions
If an electron carrying several tens of electronvolts is impacting on a neutralmolecule, some of this energy is transferred to the neutral. Even though part ofthis energy will contribute to translational or rotational energy of the molecule as awhole, the major fraction has to be stored in internal modes. Among the internalmodes rotational excitation cannot store significant amounts of energy, whereasvibration and especially electronic excitation are capable of an uptake of severalelectronvolts each (Chap. 2.2 to 2.7). [3,4]
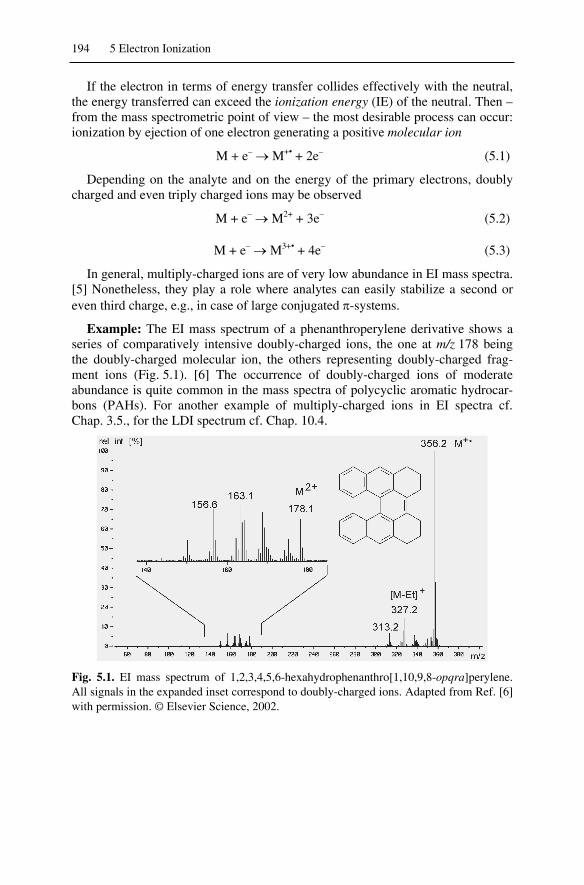
194 5 Electron Ionization
If the electron in terms of energy transfer collides effectively with the neutral,the energy transferred can exceed the ionization energy (IE) of the neutral. Then –from the mass spectrometric point of view – the most desirable process can occur:ionization by ejection of one electron generating a positive molecular ion
M + e– M+• + 2e– (5.1)
Depending on the analyte and on the energy of the primary electrons, doublycharged and even triply charged ions may be observed
M + e– M2+ + 3e– (5.2)
M + e– M3+• + 4e– (5.3)
In general, multiply-charged ions are of very low abundance in EI mass spectra.[5] Nonetheless, they play a role where analytes can easily stabilize a second oreven third charge, e.g., in case of large conjugated -systems.
Example: The EI mass spectrum of a phenanthroperylene derivative shows aseries of comparatively intensive doubly-charged ions, the one at m/z 178 beingthe doubly-charged molecular ion, the others representing doubly-charged frag-ment ions (Fig. 5.1). [6] The occurrence of doubly-charged ions of moderateabundance is quite common in the mass spectra of polycyclic aromatic hydrocar-bons (PAHs). For another example of multiply-charged ions in EI spectra cf.Chap. 3.5., for the LDI spectrum cf. Chap. 10.4.
Fig. 5.1. EI mass spectrum of 1,2,3,4,5,6-hexahydrophenanthro[1,10,9,8-opqra]perylene.All signals in the expanded inset correspond to doubly-charged ions. Adapted from Ref. [6]with permission. © Elsevier Science, 2002.

5.1 Behavior of Neutrals Upon Electron Impact 195
5.1.2 Processes Accompanying Electron Ionization
In addition to the desired generation of molecular ions, several other events canresult from electron-neutral interactions (Fig. 5.2). A less effective interactionbrings the neutral into an electronically excited state without ionizing it. As theenergy of the primary electrons increases, the abundance and variety of the ion-ized species will also increase, i.e., electron ionization may occur via differentchannels, each of which gives rise to characteristic ionized and neutral products.This includes the production of the following type of ions: molecular ions, frag-ment ions, multiply charged ions, metastable ions, rearrangement ions, and ionpairs. [7]
Fig. 5.2. Processes under electron ionization conditions. Under certain conditions, Penningionization could also play a role (Chap. 2.2.1.). Adapted from Ref. [8] with permission.© Springer-Verlag Heidelberg, 1991.
Most of these processes are very fast. Ionization happens on the low femto-second timescale, direct bond cleavages require between some picoseconds toseveral tens of nanoseconds, and rearrangement fragmentations usually proceed inmuch less than a microsecond (Fig. 5.3 and Chap. 2.7). Finally, some fragmentions may even be formed after the excited species has left the ion source givingrise to metastable ion dissociation (Chap. 2.7). The ion residence time within anelectron ionization ion source is about 1 µs. [9]
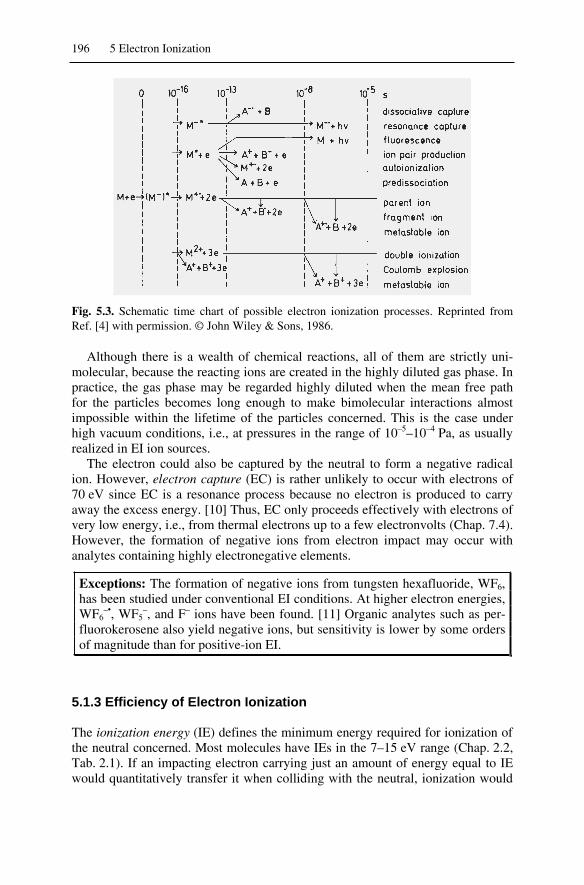
196 5 Electron Ionization
Fig. 5.3. Schematic time chart of possible electron ionization processes. Reprinted fromRef. [4] with permission. © John Wiley & Sons, 1986.
Although there is a wealth of chemical reactions, all of them are strictly uni-molecular, because the reacting ions are created in the highly diluted gas phase. Inpractice, the gas phase may be regarded highly diluted when the mean free pathfor the particles becomes long enough to make bimolecular interactions almostimpossible within the lifetime of the particles concerned. This is the case underhigh vacuum conditions, i.e., at pressures in the range of 10–5–10–4 Pa, as usuallyrealized in EI ion sources.
The electron could also be captured by the neutral to form a negative radicalion. However, electron capture (EC) is rather unlikely to occur with electrons of70 eV since EC is a resonance process because no electron is produced to carryaway the excess energy. [10] Thus, EC only proceeds effectively with electrons ofvery low energy, i.e., from thermal electrons up to a few electronvolts (Chap. 7.4).However, the formation of negative ions from electron impact may occur withanalytes containing highly electronegative elements.
Exceptions: The formation of negative ions from tungsten hexafluoride, WF6,has been studied under conventional EI conditions. At higher electron energies,WF6
–•, WF5–, and F– ions have been found. [11] Organic analytes such as per-
fluorokerosene also yield negative ions, but sensitivity is lower by some ordersof magnitude than for positive-ion EI.
5.1.3 Efficiency of Electron Ionization
The ionization energy (IE) defines the minimum energy required for ionization ofthe neutral concerned. Most molecules have IEs in the 7–15 eV range (Chap. 2.2,Tab. 2.1). If an impacting electron carrying just an amount of energy equal to IEwould quantitatively transfer it when colliding with the neutral, ionization would

5.1 Behavior of Neutrals Upon Electron Impact 197
take place. Such an event is of low probability and therefore, the ionization effi-ciency is close to zero with such electrons. However, a slight increase in electronenergy brings about a steady increase in ionization efficiency.
Strictly speaking, every species has an ionization efficiency curve of its own.The overall efficiency of EI depends on the intrinsic properties of the ionizationprocess as well as on the ionization cross section of the analyte (Chap. 2.4). Fortu-nately, the curves of ionization cross section versus electron energy are all of thesame type, exhibiting a maximum at electron energies around 70 eV (Fig. 5.4).This explains why EI spectra are almost exclusively acquired at 70 eV.
Reasons for measuring EI spectra at 70 eV:• There is no atom or molecule that cannot be ionized at 70 eV, whereas at
15 eV gases such as He, Ne, Ar, H2, and N2 would not.• The plateau of the ionization efficiency curve around 70 eV makes small
variations in electron energy negligible; in practice EI works equally well at60–80 eV.
• This assures better reproducibility of spectra, and therefore allows comparison of spectra obtained from different mass spectrometers or from mass spectral databases (Chap 5.7).
Fig. 5.4. Generalized ionization efficiency curve for EI. The onset of ionization is markedby the IE of the respective compound. The curve shows a plateau around 70 eV. Adaptedfrom Ref. [8] with permission. © Springer-Verlag Heidelberg, 1991.
5.1.4 Practical Consequences of Internal Energy
Even comparatively small molecular ions can exhibit a substantial collection offirst, second, and higher generation fragmentation pathways. The activation en-ergy for those reactions is provided by their excess energy in the order of severalelectronvolts received upon 70 eV EI. Typically, ion dissociations are endother-mic, and thus each fragmentation step consumes some ion internal energy. Highlyexcited ions may carry enough internal energy to allow for several consecutivecleavages, whereas others may just undergo one or even none. The latter reach the

198 5 Electron Ionization
detector as still intact molecular ions. The fragmentation pathways of the samegeneration are competing with each other, their products being potential precur-sors for the next generation of fragmentation processes.
Example: Imagine the hypothetical molecular ion ABXY+• undergoing threecompeting first generation fragmentations, two of them rearrangements, one ahomolytic bond cleavage (Fig. 5.5). Next, three first generation fragment ionshave several choices each, and thus the second generation fragment ions Y+• andYZ+ are both formed on two different pathways. The formation of the same highergeneration fragment ion on two or more different pathways is a widespread phe-nomenon. A closer look reveals that Y+• and Y+ are different although havingidentical empirical formulas, because one of them is an odd-electron and the otheran even-electron species. Nevertheless, they would both contribute to one com-mon peak at the same nominal m/z in a mass spectrum of ABXY (Chap. 3.1.4).
In an EI mass spectrum of ABXY, all ionic species formed as a result of nu-merous competing and consecutive reactions would be detected, but there is nosimple rule which of them should give rise to intensive peaks and which of themwould be almost overlooked.
Obviously, the first generation fragment ions should be more closely related tothe initial structure of ABXY than those of the second or even third generation.Fortunately, such higher generation (and therefore low-mass) fragment ions canalso reveal relevant information on the constitution of the analyte. In particular,they yield reliable information on the presence of functional groups (Chap. 6).
- Z- B
- A
- Z- BZ- B
- A- AZ
- Y
- A
- AB ..
.
ABY+. AYZ+. BYZ+
AB+. BY+ Y+. YZ+ Y+ BY+
ABYZ+.
Fig. 5.5. Possible fragmentation pathways for hypothetical molecular ions ABXY+• havinginternal energies in the range typical for EI.
5.1.5 Low-Energy Electron Ionization Mass Spectra
The excess energy deposited onto a molecular ion can obviously be decreased atlow electron energy. The use of 12–15 eV electrons instead of the routinely em-ployed 70 eV electrons still allows to ionize most analytes while reducing disad-vantageous fragmentation, e.g., the EI mass spectra of large hydrocarbons benefitfrom such measures. [12] Especially in conjunction with low ion source tempera-

5.1 Behavior of Neutrals Upon Electron Impact 199
ture, e.g., 70 °C instead of 200 °C, the effect is convincing (Fig 5.6). The approachof recording low-energy, low-temperature EI mass spectra has been published fora long time, [13] and has been extensively investigated since then. [14-16]
Low-energy, low-temperature mass spectra are usually much easier to interpretthan their conventional 70 eV counterparts, for three reasons: i) the relative inten-sity of the molecular ion peak is enhanced, thus permitting this important peak tobe identified more readily, ii) the overall appearance of the spectrum is simplerbecause the extent to which fragmentation occurs is greatly reduced, and iii) thefragmentation pattern is dominated by a few characteristic primary fragmentationscarrying the largest portion of structural information.
Unfortunately, there are also some disadvantages: i) the decreased ionizationefficiency at 12–15 eV also means a significant loss of sensitivity (Fig. 5.4),ii) low ion source temperatures cause long-lasting “memory” of previous samplesdue to slow desorption from the surfaces that have been in contact with the samplevapor, and iii) a weak molecular ion peak may well be enhanced, however, aspectrum showing no molecular ion peak at 70 eV will not turn into a spectrumexhibiting a strong molecular ion peak at 12 eV.
Nonetheless, during the first decades of analytical mass spectrometry low en-ergy EI spectra have been the only way to minimize fragmentation, and thereby toincrease the relative intensity of a weak molecular ion peak. Nowadays, EI massspectra are preferably complemented with spectra obtained from so-called softionization methods (Chaps. 7–11).
Fig. 5.6. Comparison of 70 eV (a) and 12 eV EI mass spectra (b) of undecan-1-ol,C11H24O, Mr = 172. The molecular ion peak is absent in both spectra, but the [M–H2O]+•
peak and the primary fragments become more prominent at 12 eV. (The detailed fragmen-tation pathways of aliphatic alcohols are discussed in Chaps. 6.2.5, 6.10.3) Reproducedfrom Ref. [15] with permission. © John Wiley & Sons, 1988.

200 5 Electron Ionization
Note: The detection of signals from previously measured samples in the massspectrum of the actual analyte is usually termed memory or memory effect. It iscaused by contaminations of ion source or sample introduction system. Thebest way to reduce memory effects is to use the lowest amount of sample nec-essary to produce good spectra, to keep ion source and ion source housing atelevated temperature, and to allow some minutes for pumping between subse-quent measurements.
5.2 Electron Ionization Ion Sources
5.2.1 Layout of an Electron Ionization Ion Source
The basic layout of any ion source has already been introduced (Chap. 4.1). Thedesign is arranged so that an ion generated within an electric field as realized be-tween two oppositely charged plates, will be accelerated towards the plate of op-posite charge sign. If the attracting plate has a hole or a slit, a beam of approxi-mately monoenergetic ions is produced. For practical reasons, the attractingelectrode is usually grounded and the location of ion generation is set to high po-tential. Doing so allows to keep the whole mass analyzer grounded, thereby con-tributing substantially to safety of operation (Fig. 5.7).
The beam of neutral gaseous analyte molecules enters the ionization chamberor ion volume, i.e., the actual region of ionization within the ion source block, in aline vertical to the paper plane and crosses the electron beam in the center. In or-der to reduce loss of ions by neutralizing collisions with the walls, the ions arepushed out immediately after generation by action of a low voltage applied to therepeller electrode. [17,18] They are then accelerated and focused towards themass analyzer. Efficient ionization and ion extraction are of key importance forthe construction of ion sources producing focusable ion currents in the nanoam-pere range. [19]
Fig. 5.7. Schematic layout of a typical EI ion source. Adapted from Ref. [8] with permis-sion. © Springer-Verlag Heidelberg, 1991.

5.2 Electron Ionization Ion Sources 201
Fig. 5.8. EI/CI/FAB combination ion source of a JEOL JMS-700 sector instrument.
Modern ion sources are of compact design to simplify the handling during ex-change and cleaning (Fig. 5.8). They are usually constructed as combination ionsources, that can be switched from EI to chemical ionization (CI), fast atom bom-bardment (FAB), or field ionization/field desorption (FI/FD). Frequently,EI/CI/FAB and EI/FI/FD [20,21] ion sources are offered. Some instruments areequipped with ion sources having ion volumes that are exchangeable via a (sepa-rate) vacuum lock to allow for their exchange without breaking the high vacuum,e.g., Micromass Autospec, Finnigan MAT 95 and MAT 900 series. Unfortunately,more recent developments of EI ion sources are mainly communicated in patents.
Note: For a high vacuum system and for the ion source in particular any sampleintroduction also means introduction of contamination. Even though ionsources are operated at 150–250 °C, decomposition products of low volatilitycannot be removed by pumping. Instead, they form semiconducting layers onthe surfaces which in turn cause defocusing due to badly defined potentials.Therefore, cleaning of an ion source is necessary on a regular basis. This in-cludes disassembling, use of fine abrasives to polish the lenses, baking of theinsulating ceramics, and thorough washing of the parts.

202 5 Electron Ionization
5.2.2 Generation of Primary Electrons
The beam of ionizing electrons is produced by thermionic emission from a resis-tively heated metal wire or filament typically made of rhenium or tungsten. Thefilament reaches up to 2000 °C during operation. Some reduction of the workingtemperature without loss of electron emission (1–10 mA mm–2) can be achievedby use of thoriated iridium or thoriated rhenium filaments. [22] There is a widevariety of filaments available from different manufactures working almost equallywell, e.g., the filament can be a straight wire, a ribbon, or a small coil (Fig. 5.9).
The potential for acceleration of the primary electrons has to be carefullyshielded from the acceleration voltage for the ions. Otherwise, badly defined ionkinetic energies cause substantial loss of resolution and mass accuracy. In addi-tion, a pair of permanent magnets with their field aligned in parallel to the electronbeam is attached above the filament and below the electron trap, thus preventingthe electrons from spreading all over the ion volume (Fig. 5.8). This is achievedby action of the Lorentz force on divergent electrons which are forced to travel onhelical paths; the resulting electron beam is about 1 mm in diameter. These fea-tures developed by Bleakney, [23] and refined by Nier [24] were destined to directthe design of EI ion sources ever since [2,18,25] (the basic EI ion source is some-times referred to as “Nier-type” ion source). Further improvements can be ob-tained by i) more efficient shielding of the ion volume from the filament, a meas-ure also reducing thermal decomposition of the analyte, and ii) by use of strongerion source magnets. [17] Nevertheless, for quadrupole mass analyzers with a tol-erance of several electronvolts in energy spread, EI ion sources without magnetshave also been constructed successfully. [26]
Fig. 5.9. Filaments for EI/CI ion sources. A coiled filament of the VG ZAB-2F (left) and astraight wire filament of the JEOL JMS-700 (right). The shields behind the filament are atthe same potential as the wire itself and the white parts are made of ceramics for insulation.
5.2 Electron Ionization Ion Sources 203
To achieve a more stable mode of operation, in modern instruments the heatingcurrent for the filament is emission-controlled, i.e., the current of the electron trapis used to keep emission comparatively independent from actual ion source condi-tions. Typical emission currents are in the range of 50–400 µA.
Note: The lifetime of a filament is several weeks under proper operating con-ditions. However, harsh conditions such as aggressive analytes or reagent gasesin chemical ionization, too high emission current, and in particular suddenbreakdown of the high vacuum have devastating consequences.
5.2.3 Overall Efficiency of an Electron Ionization Ion Source
The overall efficiency of an EI ion source depends on the intrinsic properties ofthe ionization process, the ion source design, and the actual operation parameters.However, the most astonishing fact is the extremely low ionization probability fora neutral entering the EI ion source. Only a very minor fraction of the sample in-troduced becomes ionized, whereas the vast majority gets lost via the vacuumpumps. This poor ionization probability is caused by the disadvantageous combi-nation of long mean free paths for ions and electrons and the low collision crosssection of the electron itself. Remember, the path through the effective ionizationvolume is merely about 1 mm. Even though, EI provides high sensitivity as com-pared to other ionization methods and does not really suffer from such low figures.
5.2.3.1 Sensitivity
The term sensitivity specifies the overall response of any analytical system for acertain analyte when run under well-defined conditions of operation.
Definition: The sensitivity is the slope of a plot of analyte amount versus signalstrength. In mass spectrometry, sensitivity is reported as ionic charge of aspecified m/z reaching the detector per mass of analyte used. The sensitivity isgiven in units of C µg–1 for solids. [27] For gaseous analytes, it can be specifiedas the ratio of ion current to analyte partial pressure in units of A Pa–1. [28,29]
According to the above definition, sensitivity does not only depend on the ioni-zation efficiency of EI or any other ionization method. Also relevant are the ex-traction of ions from the ion source, the mass range acquired during the experi-ment, and the transmission of the mass analyzer. Therefore, the completeexperimental conditions have to be stated with sensitivity data.
Example: Modern magnetic sector instruments are specified to have a sensi-tivity of about 4 10-7 C µg–1 for the molecular ion of methylstearate, m/z 298, atR = 1000 in 70 eV EI mode. The charge of 4 10-7 C corresponds to 2.5 1012
electron charges. One microgram of methylstearate is equivalent to 3.4 10-9 molor 2.0 1015 molecules. For a molecule entering the ionization volume one there-

204 5 Electron Ionization
fore calculates a chance of 1 : 800 to become ionized and to reach the detector as amolecular ion. The fraction of the neutrals that become ionized is definitely larger,maybe 1 : 100, because a significant fraction of them will dissociate to form frag-ment ions of other m/z values. Even then, a ratio of about 1 : 100 indicates an al-most perfect ion source design as compared to 1 : 104–105 in the 1970s.
5.2.3.2 Detection Limit
The term detection limit is almost self-explanatory, yet it is often confused withsensitivity.
Definition: The detection limit defines the smallest flow or the lowest amountof analyte necessary to obtain a signal that can be distinguished from the back-ground noise. The detection limit is valid for one well-specified analyte upontreatment according to a certain analytical protocol. [27-29]
Of course, the sensitivity of an instrumental setup is of key importance to lowdetection limits; nevertheless, the detection limit is a clearly different quantity.The detection limit may either be stated as a relative measure in trace analysis,e.g., 1 ppb of dioxin in waste oil samples (equivalent to 1 µg kg–1 of sample), or asan absolute measure, e.g., 10 femtomol of substance P with a certain MALDI in-strument.
5.2.3.3 Signal-to-Noise Ratio
The signal-to-noise ratio (S/N) describes the uncertainty of an intensity measure-ment and provides a quantitative measure of a signal's quality.
Definition: The signal-to-noise ratio (S/N) quantifies the ratio of the intensityof a signal relative to noise.
Noise results from the electronics of an instrument, and thus noise is not onlypresent between the signals but also on the signals. Consequently, intensity meas-urements are influenced by noise. Real and very numerous background signals ofvarious origin, e.g., FAB or MALDI matrices, GC column bleed and impurities,can appear as if they were electronic noise, so-called “chemical” noise. In thestrict sense, this should be separated from electronic noise and should be reportedas signal-to-background ratio (S/B) [29]. In practice, doing so can be difficult.
Noise is statistical in nature, and therefore can be reduced by elongated dataacquisition and subsequent summing or averaging of the spectra, respectively. Ac-cordingly, an intensive peak has a better S/N than a low intensity peak within thesame spectrum. The reduction of noise is proportional to the square root of acqui-sition time or number of single spectra that are averaged, [30] e.g., the noise is re-duced by a factor of 3.16 by averaging 10 spectra or by a factor of 10 by averaging100 spectra, respectively.
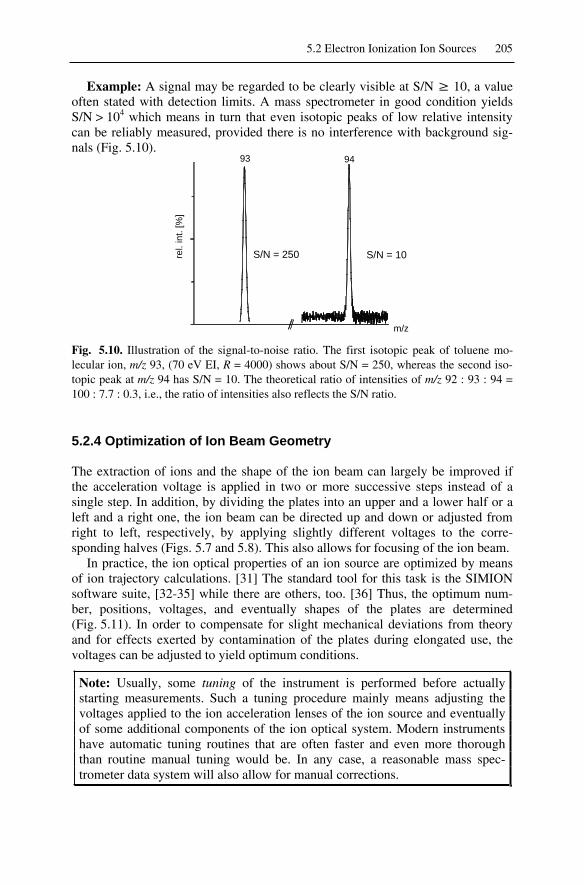
5.2 Electron Ionization Ion Sources 205
Example: A signal may be regarded to be clearly visible at S/N 10, a valueoften stated with detection limits. A mass spectrometer in good condition yieldsS/N > 104 which means in turn that even isotopic peaks of low relative intensitycan be reliably measured, provided there is no interference with background sig-nals (Fig. 5.10).
rel.
int.
[%]
S/N = 10S/N = 250
93 94
m/z
Fig. 5.10. Illustration of the signal-to-noise ratio. The first isotopic peak of toluene mo-lecular ion, m/z 93, (70 eV EI, R = 4000) shows about S/N = 250, whereas the second iso-topic peak at m/z 94 has S/N = 10. The theoretical ratio of intensities of m/z 92 : 93 : 94 =100 : 7.7 : 0.3, i.e., the ratio of intensities also reflects the S/N ratio.
5.2.4 Optimization of Ion Beam Geometry
The extraction of ions and the shape of the ion beam can largely be improved ifthe acceleration voltage is applied in two or more successive steps instead of asingle step. In addition, by dividing the plates into an upper and a lower half or aleft and a right one, the ion beam can be directed up and down or adjusted fromright to left, respectively, by applying slightly different voltages to the corre-sponding halves (Figs. 5.7 and 5.8). This also allows for focusing of the ion beam.
In practice, the ion optical properties of an ion source are optimized by meansof ion trajectory calculations. [31] The standard tool for this task is the SIMIONsoftware suite, [32-35] while there are others, too. [36] Thus, the optimum num-ber, positions, voltages, and eventually shapes of the plates are determined(Fig. 5.11). In order to compensate for slight mechanical deviations from theoryand for effects exerted by contamination of the plates during elongated use, thevoltages can be adjusted to yield optimum conditions.
Note: Usually, some tuning of the instrument is performed before actuallystarting measurements. Such a tuning procedure mainly means adjusting thevoltages applied to the ion acceleration lenses of the ion source and eventuallyof some additional components of the ion optical system. Modern instrumentshave automatic tuning routines that are often faster and even more thoroughthan routine manual tuning would be. In any case, a reasonable mass spec-trometer data system will also allow for manual corrections.

206 5 Electron Ionization
Fig. 5.11. Schematic of the EI ion source of a quadrupole mass spectrometer with equipo-tentials as calculated by the computer simulation program SIMION three-dimensional ver-sion 6.0. Reproduced from Ref. [33] with permission. © Elsevier Science, 1998.
5.3 Sample Introduction
For the purpose of sample introduction, any sample introduction system (alsosample inlet system or inlet) suitable for the respective compound can be em-ployed. Hence, direct probes, reservoir inlets, gas chromatographs and even liq-uid chromatographs can be attached to an EI ion source. Which of these inletsystems is to be preferred depends on the type of sample going to be analyzed.Whatever type the inlet system may be, it has to manage the same basic task, i.e.,the transfer of the analyte from atmospheric conditions into the high vacuum ofthe EI ion source; Table 5.1 provides an overview.
5.3.1 Direct Insertion Probe
5.3.1.1 Design of Direct Insertion Probes
The oldest but obviously old-fashioned way to introduce solids into a mass spec-trometer ion source is by directly placing them inside an ion source which ismounted to the instrument thereafter and heated. [37] The use of a micro samplevial or crucible containing some 0.1–2 µg of the analyte that can be directly

5.3 Sample Introduction 207
Table 5.1. Sample introduction systems for EI-MS
Inlet System Principle Analytes
direct insertion probe, DIP sample in heated/cooledglass/metal vial as particlesor film of analyte
solids, waxes or high boilingliquids
direct exposure probe, DEP sample particles or film ofanalyte on resistively heatedmetal filament
solids of extremely lowvolatility, especially ifthermally labile
reservoir/reference inlet heated reservoir with samplevapor
low to medium boilingliquids
gas chromatograph, GC elutes directly into ionsource
volatile components ofmixtures
liquid chromatograph, LC connected via particle beaminterface
analytes suitable for EI thatcannot be separated by GCdue to high polarity
Fig. 5.12. DIP of a JEOL JMS-700 sector instrument for use with EI, chemical ionization(CI) and field ionization (FI). The copper probe tip holds the glass sample vial and is fittedto a temperature-controlled heater (left). The heater, a thermocouple, and circulation watercooling are provided inside. The (white) ceramics insulator protects the operator from thehigh voltage of the ion source.

208 5 Electron Ionization
brought into the proximity of the ion source by means of a direct insertion probe(DIP) is much more convenient (Fig. 5.12). DIPs have been described since thelate 1950s and slowly became widespread in use in the mid-1960s. [38-40]
A DIP basically consists of a stainless steel shaft with a tip suitable to insert thesample vial. The shaft is polished to provide a proper vacuum seal against the O-rings of a vacuum lock. Being transferred into the high vacuum of the ion sourcehousing through the vacuum lock, [40] the probe is pushed in until it contacts theion source block (Fig. 5.13). Spectra are then acquired while the analyte evapo-rates or sublimes from the vial directly into the ionization volume of the ionsource. Typically, heating of the sample holder up to about 500 °C can be appliedto enforce evaporation of the sample, which sometimes is accompanied by de-composition prior to evaporation. Special high-temperature probes reaching up to1000 °C are also available. Modern direct probes have temperature programedheaters [41] allowing to set rates of 5–150 °C min–1 or are equipped with ion cur-rent-controlled heaters. [42]
To prevent more volatile samples from sudden evaporation a circulation watercooling is often incorporated in the DIP, and refrigerated probes for more volatilesamples have also been developed. [43] Sometimes, glass wool is placed into thesample vial to increase the surface for adsorption, and thus to slow down evapora-tion of the sample. Sudden evaporation causes distorted spectra and may even re-sult in a temporary breakdown of the high vacuum.
Fig. 5.13. Ion source housing of a Autospec magnetic sector instrument. The ion source canbe accessed from several directions to allow for simultaneous connection to DIP/DEP, GCand reference inlet system. By courtesy of Waters Corporation, MS Technologies, Man-chester, UK.

5.3 Sample Introduction 209
5.3.1.2 Sample Vials
Sample vials for use with DIPs usually are about 2 mm in outer diameter and 10–20 mm in length. They are made from borosilicate glass or aluminum (Fig. 5.14).In general, the vials are disposed after use. However, although bearing the risk ofmemory effects or adsorption of analyte to residual pyrolysis products from previ-ous samples, reusable quartz vials have also been employed in the past. The ana-lyte may either be loaded in solution into the vial or as a tiny piece if it is of solidor waxy consistence (Fig. 5.15). Using solutions of known concentration allowsfor more reproducible loading of the vials which is usually not a prerequisite. Thesolvent should then be evaporated before insertion of the probe into the vacuumlock, but it may also be removed by carefully opening the rough evacuation valve.
Fig. 5.14. Sample vials for different DIPs. From left: VG ZAB-2F, Finnigan TSQ700 glassand aluminum version, and JEOL JMS-700. The match illustrates the scale.
Fig. 5.15. Sample vial filled with analyte. The bright spot halfway between the tip of thetweezers and upper rim of the vial is the piece of solid material to be analyzed. Use of moresample does not have any advantage; it only causes ion source contamination.

210 5 Electron Ionization
Note: Disposable vials are free of memory effects. Glass vials bear the addi-tional advantage of showing how much sample is placed at which position inthe vial. Afterwards, it is also possible whether the analyte decomposed duringthe measurement to yield some black residue.
5.3.2 Direct Exposure Probe
Employing a direct exposure probe (DEP) may be helpful in case of analytes thatcannot be evaporated from a sample vial without complete decomposition. [44]Here, the analyte is applied from solution or suspension to the outside of a thinwire loop or pin which is then directly exposed to the ionizing electron beam. Thismethod has also been termed in-beam electron ionization. Early work describingthe direct exposure of a sample to the electron beam came from Ohashi, [45,46]Constantin, [47] and Traldi. [48,49]
The idea behind the rapid heating of a DEP is to achieve evaporation faster thanthermal degradation of the sample. [50,51] This principle is realized in perfectionwith energy-sudden methods (Chaps. 9, 10).
If the analyte is exposed to energetic electrons the method is called direct elec-tron ionization (DEI) or desorption electron ionization (DEI), and accordingly it istermed direct or desorption chemical ionization (DCI) if the analyte is immersedinto the reagent gas under conditions of chemical ionization (Chap. 7).
There are different types of DEPs in that some of them rely on conductiveheating from the ion source block and/or the heated tip of a modified DIP, [49]and others – now widespread in use – that are capable of rapid resistive heating ofa little loop made of chemically inert metal wire (rhenium). Resistively heatedprobes allow rates of several hundred °C s–1 and temperatures up to about 1500 °C(Fig. 5.16). As a consequence of rapid heating, fast scanning, e.g., 1 s per scanover the m/z range of interest, is required to follow the evaporation of the analyte.
Fig. 5.16. Tip of a direct exposure probe of a GC-oaTOF mass spectrometer for EI, CI, FI).By courtesy of Waters Corporation, MS Technologies, Manchester, UK.
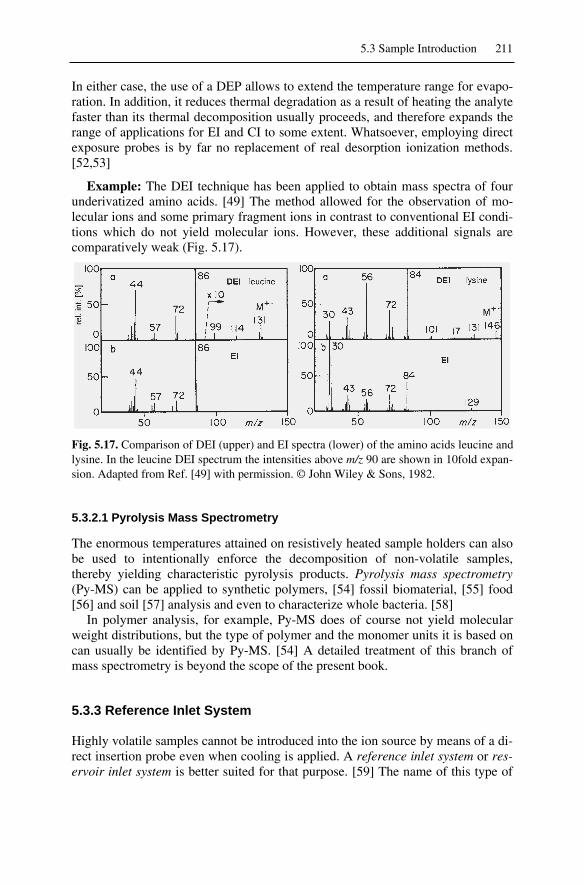
5.3 Sample Introduction 211
In either case, the use of a DEP allows to extend the temperature range for evapo-ration. In addition, it reduces thermal degradation as a result of heating the analytefaster than its thermal decomposition usually proceeds, and therefore expands therange of applications for EI and CI to some extent. Whatsoever, employing directexposure probes is by far no replacement of real desorption ionization methods.[52,53]
Example: The DEI technique has been applied to obtain mass spectra of fourunderivatized amino acids. [49] The method allowed for the observation of mo-lecular ions and some primary fragment ions in contrast to conventional EI condi-tions which do not yield molecular ions. However, these additional signals arecomparatively weak (Fig. 5.17).
Fig. 5.17. Comparison of DEI (upper) and EI spectra (lower) of the amino acids leucine andlysine. In the leucine DEI spectrum the intensities above m/z 90 are shown in 10fold expan-sion. Adapted from Ref. [49] with permission. © John Wiley & Sons, 1982.
5.3.2.1 Pyrolysis Mass Spectrometry
The enormous temperatures attained on resistively heated sample holders can alsobe used to intentionally enforce the decomposition of non-volatile samples,thereby yielding characteristic pyrolysis products. Pyrolysis mass spectrometry(Py-MS) can be applied to synthetic polymers, [54] fossil biomaterial, [55] food[56] and soil [57] analysis and even to characterize whole bacteria. [58]
In polymer analysis, for example, Py-MS does of course not yield molecularweight distributions, but the type of polymer and the monomer units it is based oncan usually be identified by Py-MS. [54] A detailed treatment of this branch ofmass spectrometry is beyond the scope of the present book.
5.3.3 Reference Inlet System
Highly volatile samples cannot be introduced into the ion source by means of a di-rect insertion probe even when cooling is applied. A reference inlet system or res-ervoir inlet system is better suited for that purpose. [59] The name of this type of

212 5 Electron Ionization
inlet has been coined by the fact that reference inlets have been intended – andoften are used for – the introduction of a mass calibrant (or reference) independentof the analyte in order to achieve internal mass calibration in accurate mass meas-urements (Chap. 3.3). Fluorocarbons such as perfluorotributylamine (FC43) orperfluorokerosene (PFK) can be admitted to the ion source in this way.
Reference inlets serve equally well for the analysis of gases, solvents, andsimilar volatile samples. They are especially convenient when a continuous signalis desired for instrument tuning or long-lasting MS/MS experiments in ion chem-istry. In addition, the components of a mixture are admitted to the ion sourcewithout fractionation, i.e., without affecting their partial pressures. This propertyof reservior inlets has extensively been used in the petroleum industry.
A reference inlet system basically consists of a vessel heated to 80–200 °C thati) can be filled via a septum port, ii) can be connected to the ion source via a tog-gle valve and a needle valve to adjust the partial pressure in the ion source hous-ing, and iii) can be connected to some vacuum pump to remove the sample aftercompletion of the measurement. Typically, reference inlets have volumes of 30–100 ml and are filled with a few microliters of liquid sample by means of a micro-liter syringe. Heating is applied to suppress adsorption of the analytes to the wallsand thus, to speed up the final removal of sample (Fig. 5.17). As the analyte is ex-posed to elongated heating, the application of reference inlet systems should be re-stricted to thermally stable analytes. To reduce the risks of catalytic degradationand selective adsorption of components of mixtures on the walls of the reservior,an all-glass heated inlet system (AGHIS) [60,61] and a teflon-coated reservoir
Fig. 5.18. Reservior inlet of a JEOL JMS-700 sector instrument with the septum injectionport opened. The “operation valve” switches between evacuation, isolation and admissionof the sample; a needle valve allows regulation of the sample flow. The GC transfer linecrosses in the upper background from the GC (left) to the ion source housing (upper right).

5.3 Sample Introduction 213
inlet systems have been commercially available as an alternative to stainless steelsystems. To this end, dynamic batch inlet systems (DBIS) have been developed,where the analyte is transferred from the reservoir into the ion source by means ofa capillary and where a carrier gas (H2, He) can be used to reduce fractionation ofmixtures having an extremely wide range of boiling points. [61]
The liquid introduction system represents another variation of reservoir inlets.Here, the ion source housing serves as the reservoir into which a few microlitersof liquid are introduced by means of a kind of “micro DIP”. [62]
5.3.4 Gas Chromatograph
A gas chromatograph (GC) can be used for the chromatographic separation ofvolatile analytes in complex mixtures prior to mass spectrometric analysis. Thisbecomes especially advantageous if the GC elutes directly (“online”) into the ionsource of a mass spectrometer, so-called GC-MS coupling. [63-65] Packed GCcolumns with a high flow can be connected via a jet-separator, but these are al-most out of use at present. [66] Capillary columns provide flow rates in the orderof a few milliliters per minute, therefore their back end can be connected directlyat the entrance of the ion volume.
EI is well suited as an ionization method for GC-MS applications. The specificproperties of GC-MS are discussed later (Chap. 12). For the moment, it is suffi-cient to notice that proper coupling of a GC to an EI ion source neither exerts sub-stantial effects on the EI process nor does it alter the fragmentation pathways ofthe ions.
5.3.5 Liquid Chromatograph
A liquid chromatograph (LC) can be used for the chromatographic separation ofpolar analytes of low volatility prior to mass spectrometric analysis. Usually, at-mospheric pressure ionization methods are employed when direct coupling of aliquid chromatograph to a mass spectrometer is required, so-called LC-MS cou-pling. However, it can be desirable to obtain EI spectra of LC-separated analytesor of dissolved analytes in general, e.g., where the analyte is only accessible by EIor where EI spectra are required for searching spectral databases. For this purpose,a particle beam interface (PBI) may be employed. [67,68] A particle beam inter-face provides removal of the solvent by nebulization into an evacuated desolvationchamber, and thereby produces a beam of microscopic sample particles that areintroduced into an EI ion source. Designs different from PBI have also been de-veloped [69] (Chap. 12).
214 5 Electron Ionization
5.4 Ion Chromatograms
It is obvious from the working principle of gas and liquid chromatographs that dif-ferent components of a mixture are eluted at different retention time from thechromatographic column. As the mass spectrometer serves as the chromatographicdetector in GC-MS and LC-MS experiments, its output must somehow representthe chromatogram. In contrast to the chromatograms obtained with simple chro-matographic detectors (FID, WLD, UV), the chromatogram as produced by themass spectrometer is built up from a large set of consecutively acquired massspectra, each of them containing qualitative information on the eluting species.Thus, continuously changing mass spectra are obtained during the chroma-tographic elution, as one component after the other yields a mass spectrum of itsown, i.e., the number of final mass spectra extracted at least equals the number ofcomponents separated. Because mass spectral chromatograms represent ionicabundances as a function of retention time, these are termed ion chromatograms.
Fractionation to a certain degree is also observed during evaporation of mix-tures from a DIP. The separation can by far not be compared to that of chroma-tographic systems, nonetheless it often reveals valuable information on impuritiesaccompanying the main product, e.g., remaining solvents, plasticizers, vacuumgrease, or synthetic by-products.
Note: The terms ion profile and ion pherogram have been suggested to replaceion chromatogram when DIPs or electrophoresis are used, respectively, asthese cannot produce chromatograms in the strict sense. [29] However, thiswould add yet more terms to one of the rather vague areas of our terminologywhich is even insufficiently covered by official recommendations. [27-29]
5.4.1 Total Ion Current
The total ion current (TIC) can either be measured by a hardware TIC monitor be-fore mass analysis, or it can be reconstructed by the data system from the spectraafter mass analysis. [27] Thus, the TIC represents a measure of the overall inten-sity of ion production or of mass spectral output as a function of time, respec-tively. The TIC obtained by means of data reduction, [28] i.e., by mathematicalconstruction from the mass spectra as successively acquired while the sampleevaporates, is also termed total ion chromatogram (TIC). For this purpose, thesum of all ion intensities belonging to each of the spectra is plotted as a functionof time or scan number, respectively.
Note: Modern instruments usually do not support hardware TIC measurements,but including the mass spectrometers of the 1970s, there used to be a hardwareTIC monitor, i.e., an ampere meter on the electronics panel. The TIC was ob-tained by measuring the ion current caused by those ions hitting the ion sourceexit plate instead of passing through its slit.

5.4 Ion Chromatograms 215
5.4.2 Reconstructed Ion Chromatogram
The term reconstructed ion chromatogram (RIC) is used to describe the intensityof a given m/z or m/z range plotted as a function of time or scan number. PlottingRICs is especially useful to identify a target compound of known m/z from com-plex DIP measurements or more often from GC-MS or LC-MS data. In otherwords, the RIC allows to extract at what time during a measurement the targetcompound is eluted. RICs can also be used to uncover the relationship of certainm/z values to different mass spectra obtained from the measurement of a single(impure) sample (Fig. 5.19).
Fig. 5.19. Ion chromatograms from a DIP measurement. The TIC (upper trace) shows abump during early scans that is also reflected in the RICs of m/z 179.0 and 194.1. Spectrum(a) belongs to volatile impurities, whereas the RICs of m/z 382.2 and 453.3 are related tothe target compound (b) that evaporates upon heating (cf. Fig. 5.20). By courtesy ofR. Gleiter, Organisch-Chemisches Institut, Universität Heidelberg.
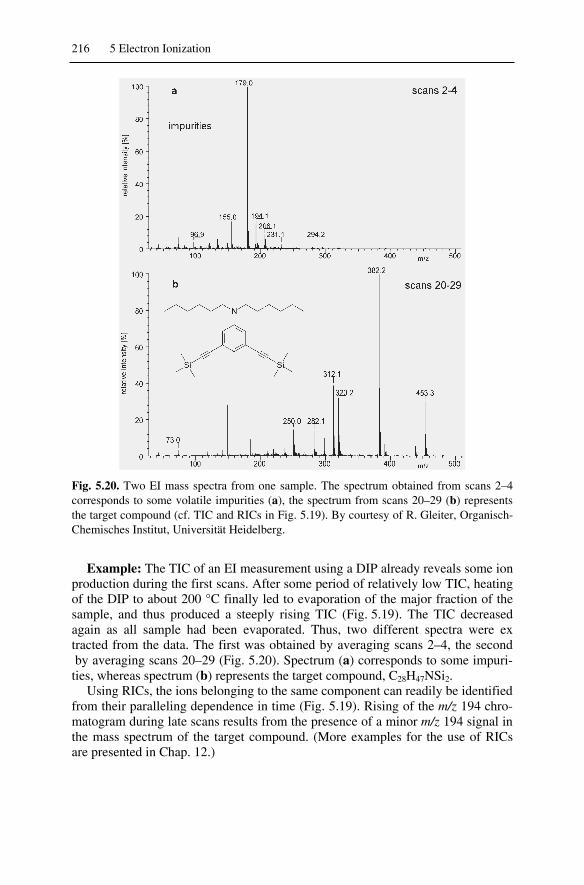
216 5 Electron Ionization
Fig. 5.20. Two EI mass spectra from one sample. The spectrum obtained from scans 2–4corresponds to some volatile impurities (a), the spectrum from scans 20–29 (b) representsthe target compound (cf. TIC and RICs in Fig. 5.19). By courtesy of R. Gleiter, Organisch-Chemisches Institut, Universität Heidelberg.
Example: The TIC of an EI measurement using a DIP already reveals some ionproduction during the first scans. After some period of relatively low TIC, heatingof the DIP to about 200 °C finally led to evaporation of the major fraction of thesample, and thus produced a steeply rising TIC (Fig. 5.19). The TIC decreasedagain as all sample had been evaporated. Thus, two different spectra were extracted from the data. The first was obtained by averaging scans 2–4, the second by averaging scans 20–29 (Fig. 5.20). Spectrum (a) corresponds to some impuri-ties, whereas spectrum (b) represents the target compound, C28H47NSi2.
Using RICs, the ions belonging to the same component can readily be identifiedfrom their paralleling dependence in time (Fig. 5.19). Rising of the m/z 194 chro-matogram during late scans results from the presence of a minor m/z 194 signal inthe mass spectrum of the target compound. (More examples for the use of RICsare presented in Chap. 12.)

5.6 Analytes for EI 217
5.5 Mass Analyzers for EI
In case of EI, there is no restriction to a certain type of mass analyzer (Chap. 4).As EI is an old method, magnetic sector instruments have been dominating EI ap-plications in the early days of mass spectrometry. With the increasing importanceof GC-MS, single quadrupole instruments were gaining importance due to theirsignificantly higher scan speeds. The demand for MS/MS capability to improveanalytical selectivity made triple quadrupole instruments and quadrupole ion trapsbecome widespread in use. In recent years, the value of accurate mass measure-ments has been rediscovered, thereby donating a significant advantage to oaTOFand magnetic sector analyzers in contrast to quadrupole systems of either type.ICR analyzers may also be used in conjunction with EI, but they rarely are be-cause of their high cost.
5.6 Analytes for EI
Classical organic chemistry provides a wide variety of potential analytes for elec-tron ionization, the only limitation being that the analyte should be accessible toevaporation or sublimation without significant thermal decomposition. These re-quirements are usually met by saturated and unsaturated aliphatic and aromatichydrocarbons and their derivatives such as halides, ethers, acids, esters, amines,amides etc. Heterocycles generally yield useful EI spectra, and flavones, steroids,terpenes and comparable compounds can successfully be analyzed by EI, too.Therefore, EI represents the standard method for such kind of samples.
GC-EI-MS permits the direct analysis of mixtures, e.g., to analyze synthetic by-products; an advantage that made GC-EI-MS benchtop instruments become wide-spread in modern synthetic laboratories. The GC-EI-MS combination is especiallysuccessful in monitoring environmental pollutants such as polycyclic aromatic hy-drocarbons (PAHs), polychlorinated biphenyls (PCBs), polychlorinated dibenzo-dioxins (PCDDs), polychlorinated dibenzofuranes (PCDFs), or other volatile or-ganic compounds (VOCs).
Whereas low and medium polarity analytes are usually well suited for EI,highly polar or even ionic compounds, e.g., diols or polyalcohols, amino acids,nucleosides, peptides, sugars, and organic salts should not be subject to EI unlessproperly derivatized prior to EI-MS. [70-75]
There is – as with any other ionization method – no strict upper limit for mo-lecular mass, nevertheless a range of up to 800–1000 u is a realistic estimate. Ex-ceptions up to 1300 u are observed, if the analyte is extremely unpolar, e.g., fromnumerous fluoroalkyl or trialkylsilyl groups which also significantly contribute tomolecular mass.
218 5 Electron Ionization
5.7 Mass Spectral Databases for EI
Provided EI spectra have been measured under some sort of standard conditions(70 eV, ion source at 150–250 °C, pressure in the order of 10-4 Pa), they exhibitvery good reproducibility. This is not only the case for repeated measurements onthe same instrument, but also between mass spectrometers having different typesof mass analyzers, and/or coming from different manufacturers. This propertysoon led to the collection of large EI mass spectral libraries, either printed [76-78]or computerized. [79] The best established EI mass spectral databases are theNIST/EPA/NIH Mass Spectral Database and the Wiley/NBS Mass Spectral Data-base, each of them giving access to about 120,000 evaluated spectra. [80-83]
Often, EI spectral databases are (optionally) included in the software packageof new mass spectrometers. Thus, the EI spectra measured are directly searchablein the database by similarity search typically yielding a list of several hits. Alter-natively, stand-alone solutions allow sophisticated search algorithms and strate-gies [84-86] to be used. Although the coverage of these databases is enormous,and an easy-to-use user interface is provided, one should be aware of potential pit-falls: even the highest score hit can be wrong, perhaps simply because the spec-trum of the actual compound is still not included. Even though the unknown cangenerally not be perfectly identified by simple comparison with a library spec-trum, mass spectral databases are highly useful, e.g., to find spectra of similarcompounds or isomers for comparison, to get an idea of the spectra of an expectedcompound class, to yield examples for teaching etc.
Note: Although similarity searches generally provide useful search results, it isalways necessary to cross check the hits from the database. Even the highestscore hit can be wrong. Some interpretational skills will be advantageous ...
Reference List
1. Field, F.H.; Franklin, J.L. Electron ImpactPhenomena and the Properties of GaseousIons; 1st ed.; Academic Press: New York,1957.
2. Nier, A.O. Some Reflections on the EarlyDays of Mass Spectrometry at the Univer-sity of Minnesota. Int. J. Mass Spectrom.Ion Proc. 1990, 100, 1-13.
3. Märk, T.D. Fundamental Aspects of Elec-tron Impact Ionization. Int. J. Mass Spec-trom. Ion Phys. 1982, 45, 125-145.
4. Märk, T.D. Electron Impact Ionization, inGaseous ion Chemistry and Mass Spec-trometry, Futrell, J.H., editor; John Wileyand Sons: New York, 1986; pp. 61-93.
5. Meyerson, S.; Van der Haar, R.W. Multi-ply Charged Organic Ions in Mass Spectra.J. Chem. Phys. 1962, 37, 2458-2462.
6. Wolkenstein, K.; Gross, J.H.; Oeser, T.;Schöler, H.F. Spectroscopic Characteriza-tion and Crystal Structure of the1,2,3,4,5,6-Hexahydrophenanthro[1,10,9,8-Opqra]Perylene. Tetrahedron Lett. 2002,43, 1653-1655.
7. Selby, D.S.; Mlynski, V.; Guilhaus, M. A20 KV Orthogonal Acceleration Time-of-Flight Mass Spectrometer for Matrix-Assisted Laser Desorption/Ionization. Int.J. Mass Spectrom. 2001, 210/211, 89-100.
Reference List 219
8. Schröder, E. Massenspektrometrie - Be-griffe und Definitionen; 1st ed.; Springer-Verlag: Heidelberg, 1991.
9. Meier, K.; Seibl, J. Measurement of IonResidence Times in a Commercial Elec-tron Impact Ion Source. Int. J. Mass Spec-trom. Ion Phys. 1974, 14, 99-106.
10. Harrison, A.G. Fundamentals of GasPhase Ion Chemistry, in Chemical Ioniza-tion Mass Spectrometry, 2nd ed.; CRCPress: Boca Raton, 1992; Chapter 2, pp.26.
11. De Wall, R.; Neuert, H. The Formation ofNegative Ions From Electron Impact WithTungsten Hexafluoride. Z. Naturforsch. ,A.1977, 32A, 968-971.
12. Ludányi, K.; Dallos, A.; Kühn, Z.; Vékey,D. Mass Spectrometry of Very Large Satu-rated Hydrocarbons. J. Mass Spectrom.1999, 34, 264-267.
13. Remberg, G.; Remberg, E.; Spiteller-Friedmann, M.; Spiteller, G. Massenspek-tren schwach angeregter Moleküle. 4.Mitteilung. Org. Mass Spectrom. 1968, 1,87-113.
14. Bowen, R.D.; Maccoll, A. Low-Energy,Low-Temperature Mass Spectra. I. Se-lected Derivatives of Octane. Org. MassSpectrom. 1983, 18, 576-581.
15. Brophy, J.J.; Maccoll, A. Low-Energy,Low-Temperature Mass Spectra. 9. TheLinear Undecanols. Org. Mass Spectrom.1988, 23, 659-662.
16. Melaku, A.; Maccoll, A.; Bowen, R.D.Low-Energy, Low-Temperature MassSpectra. Part 17: Selected Aliphatic Am-ides. Eur. Mass Spectrom. 1997, 3, 197-208.
17. Schaeffer, O.A. An Improved Mass Spec-trometer Ion Source. Rev. Sci. Instrum.1954, 25, 660-662.
18. Fock, W. Design of a Mass SpectrometerIon Source Based on Computed Ion Tra-jectories. Int. J. Mass Spectrom. Ion Phys.1969, 3, 285-291.
19. Koontz, S.L.; Denton, M.B. A Very HighYield Electron Impact Ion Source forAnalytical Mass Spectrometry. Int. J.Mass Spectrom. Ion Phys. 1981, 37, 227-239.
20. Hogg, A.M.; Payzant, J.D. Design of aField Ionization/Field Desorption/ElectronImpact Ion Source and its Performance ona Modified AEIMS9 Mass Spectrometer.Int. J. Mass Spectrom. Ion Phys. 1978, 27,291-303.
21. Brunnée, C. A Combined Field Ionisation-Electron Impact Ion Source for High Mo-lecular Weight Samples of Low Volatility.Z. Naturforsch. ,B 1967, 22 , 121-123.
22. Habfast, K. MassenspektrometrischeFunktionselemente: Ionenquellen, in Mas-senspektrometrie, 1st ed.; Kienitz, H.,editor; Verlag Chemie: Weinheim, 1968;Chapter B 1.2, pp. 43-74.
23. Bleakney, W. A New Method of Positive-Ray Analysis and its Application to theMeasurement of Ionization Potentials inMercury Vapor. Physical Review 1929,34, 157-160.
24. Nier, A.O. Mass Spectrometer for Isotopeand Gas Analysis. Rev. Sci. Instrum. 1947,18, 398-411.
25. Nier, A.O. The Development of a HighResolution Mass Spectrometer: a Remi-niscence. J. Am. Soc. Mass Spectrom.1991, 2, 447-452.
26. Swingler, D.L. Mass Spectrometer IonSource with High Yield. J. Appl. Phys.1970, 41, 1496-1499.
27. Price, P. Standard Definitions of TermsRelating to Mass Spectrometry. A ReportFrom the Committee on Measurementsand Standards of the Amercian Society forMass Spectrometry. J. Am. Chem. Soc.Mass Spectrom. 1991, 2, 336-348.
28. Todd, J.F.J. Recommendations for No-menclature and Symbolism for MassSpectroscopy Including an Appendix ofTerms Used in Vacuum Technology. Int.J. Mass Spectrom. Ion Proc. 1995, 142,211-240.
29. Sparkman, O.D. Mass Spec Desk Refer-ence; 1st ed.; Global View Publishing:Pittsburgh, 2000.
30. Kilburn, K.D.; Lewis, P.H.; Underwood,J.G.; Evans, S.; Holmes, J.; Dean, M.Quality of Mass and Intensity Measure-ments From a High Performance MassSpectrometer. Anal. Chem. 1979, 51,1420-1425.
31. Morrison, J.D. Ion Focusing, Mass Analy-sis, and Detection, in Gaseous Ion Chem-istry and Mass Spectrometry, Futrell, J.H.,editor; John Wiley & Sons: New York,1986; pp. 107-125.
32. Dahl, D.A.; Delmore, J.E.; Appelhans,A.D. SIMION PC/PS2 Electrostatic LensDesign Program. Rev. Sci. Instrum. 1990,61, 607-609.
33. Blaum, K.; Geppert, C.; Müller, P.;Nörtershäuser, W.; Otten, E.W.; Schmitt,A.; Trautmann, N.; Wendt, K.; Bushaw,

220 5 Electron Ionization
B.A. Properties and Performance of aQuadrupole Mass Filter Used for Reso-nance Ionization Mass Spectrometry. Int.J. Mass Spectrom. 1998, 181, 67-87.
34. Ehlers, M.; Schmidt, S.; Lee, B.J.; Grote-meyer, J. Design and Set-Up of an Exter-nal Ion Source Coupled to a Quadrupole-Ion-Trap Reflectron-Time-of-Flight Hy-brid Instrument. Eur. J. Mass Spectrom.2000, 6, 377-385.
35. Dahl, D.A. SIMION for the PersonalComputer in Reflection. Int. J. MassSpectrom. 2000, 200, 3-25.
36. Forbes, M.W.; Sharifi, M.; Croley, T.;Lausevic, Z.; March, R.E. Simulation ofIon Trajectories in a Quadrupole Ion Trap:a Comparison of Three Simulation Pro-grams. J. Mass Spectrom. 1999, 34, 1219-1239.
37. Cameron, A.E. Electron-BombardmentIon Source for Mass Spectrometry of Sol-ids. Rev. Sci. Instrum. 1954, 25, 1154-1156.
38. Reed, R.I. Electron Impact and MolecularDissociation. Part I. Some Steroids andTriterpenoids. J. Chem. Soc. 1958, 3432-3436.
39. Gohlke, R.S. Obtaining the Mass Spectraof Non-Volatile or Thermally UnstableCompounds. Chem. Industry 1963, 946-948.
40. Junk, G.A.; Svec, H.J. A Vacuum Lock forthe Direct Insertion of Samples into aMass Spectrometer. Anal. Chem. 1965, 37,1629-1630.
41. Kankare, J.J. Simple Temperature Pro-grammer for a Mass Spectrometer DirectInsertion Probe. Anal. Chem. 1974, 46,966-967.
42. Franzen, J.; Küper, H.; Riepe, W.; Henne-berg, D. Automatic Ion Current Control ofa Direct Inlet System. Int. J. Mass Spec-trom. Ion Phys. 1973, 10, 353-357.
43. Sawdo, R.M.; Blumer, M. RefrigeratedDirect Insertion Probe for Mass Spec-trometry. Anal. Chem. 1976, 48, 790-791.
44. Cotter, R.J. Mass Spectrometry of Non-volatile Compounds by Desorption FromExtended Probes. Anal. Chem. 1980, 52,1589A-1602A.
45. Ohashi, M.; Nakayama, N. In-Beam Elec-tron Impact Mass Spectrometry of Ali-phatic Alkohols. Org. Mass Spectrom.1978, 13, 642-645.
46. Ohashi, M.; Tsujimoto, K.; Funakura, S.;Harada, K.; Suzuki, M. Detection of Pseu-domolecular Ions of Tetra- and Pentasac-
charides by in-Beam Electron IonizationMass Spectrometry. Spectroscopy Int. J.1983, 2, 260-266.
47. Constantin, E.; Nakatini, Y.; Ourisson, G.;Hueber, R.; Teller, G. Spectres De MasseDe Phospholipides Et Polypeptides NonProteges. Une Méthode Simple D'Obten-tion Du Spectre Complet. TetrahedronLett. 1980, 21, 4745-4746.
48. Traldi, P.; Vettori, U.; Dragoni, F. Instru-ment Parameterization for Optimum Useof Commercial Direct Inlet Systems. Org.Mass Spectrom. 1982, 17, 587-592.
49. Traldi, P. Direct Electron Impact - a NewIonization Technique? Org. Mass Spec-trom. 1982, 17, 245-246.
50. Udseth, H.R.; Friedman, L. Analysis ofStyrene Polymers by Mass SpectrometryWith Filament-Heated Evaporation. Anal.Chem. 1981, 53, 29-33.
51. Daves, G.D., Jr. Mass Spectrometry of In-volatile and Thermally Unstable Mole-cules. Accounts of Chemical Research1979, 12, 359-365.
52. Peltier, J.M.; MacLean, D.B.; Szarek,W.A. Determination of the GlycosidicLinkage in Peracetylated DisaccharidesComprised of D-Glucopyranose Units byUse of Desorption Electron-IonizationMass Spectrometry. Rapid Commun.Mass Spectrom. 1991, 5, 446-449.
53. Kurlansik, L.; Williams, T.J.; Strong, J.M.;Anderson, L.W.; Campana, J.E. Desorp-tion Ionization Mass Spectrometry ofSynthetic Porphyrins. Biomed. MassSpectrom. 1984, 11, 475-481.
54. Qian, K.; Killinger, W.E.; Casey, M.;Nicol, G.R. Rapid Polymer Identificationby In-Source Direct Pyrolysis Mass Spec-trometry and Library Searching Tech-niques. Anal. Chem. 1996, 68, 1019-1027.
55. Meuzelaar, H.L.C.; Haverkamp, J.; Hile-man, F.D. Pyrolysis Mass Spectrometry ofRecent and Fossil Biomaterials; 1st ed.;Elsevier: Amsterdam, 1982.
56. Guillo, C.; Lipp, M.; Radovic, B.; Reniero,F.; Schmidt, M.; Anklam, E. Use of Py-rolysis-Mass Spectrometry in Food Analy-sis: Applications in the Food AnalysisLaboratory of the European Commissions'Joint Research Center. J. Anal. Appl. Py-rolysis 1999, 49, 329-335.
57. Schulten, H.-R.; Leinweber, P. Characteri-zation of Humic and Soil Particles byAnalytical Pyrolysis and Computer Mod-eling. J. Anal. Appl. Pyrolysis 1996, 38, 1-53.
Reference List 221
58. Basile, F.; Beverly, M.B.; Voorhees, K.J.Pathogenic Bacteria: Their Detection andDifferentiation by Rapid Lipid ProfilingWith Pyrolysis Mass Spectrometry. TrendsAnal. Chem. 1998, 17, 95-109.
59. Caldecourt, V.J. Heated Sample InletSystem for Mass Spectrometry. Anal.Chem. 1955, 27, 1670.
60. Peterson, L. Mass Spectrometer All-GlassHeated Inlet. Anal. Chem. 1962, 34, 1850-1851.
61. Roussis, S.G.; Cameron, A.S. SimplifiedHydrocarbon Compound Type AnalysisUsing a Dynamic Batch Inlet SystemCoupled to a Mass Spectrometer. Energy& Fuels 1997, 11, 879-886.
62. Pattillo, A.D.; Young, H.A. Liquid SampleIntroduction System for a Mass Spec-trometer. Anal. Chem. 1963, 35, 1768.
63. Message, G.M. Practical Aspects of GasChromatography/Mass Spectrometry; 1sted.; John Wiley & Sons: New York, 1984.
64. Hübschmann, H.-J. Handbuch der GC-MS- Grundlagen und Anwendungen; 1st ed.;Verlag Chemie: Weinheim, 1996.
65. Budde, W.L. Analytical Mass Spectrome-try; 1st ed.; ACS and Oxford UniversityPress: Washington, D.C. and Oxford,2001.
66. Gohlke, R.S.; McLafferty, F.W. Early GasChromatography/Mass Spectrometry. J.Am. Soc. Mass Spectrom. 1993, 4, 367-371.
67. Willoughby, R.C.; Browner, R.F. Mono-disperse Aerosol Generation Interface forCombining Liquid Chromatography withMass Spectroscopy. Anal. Chem. 1984, 56,2625-2631.
68. Winkler, P.C.; Perkins, D.D.; Williams,D.K.; Browner, R.F. Performance of anImproved Monodisperse Aerosol Genera-tion Interface for Liquid Chromatogra-phy/Mass Spectrometry. Anal. Chem.1988, 60, 489-493.
69. Brauers, F.; von Bünau, G. Mass Spec-trometry of Solutions: a New Simple Inter-face for the Direct Introduction of LiquidSamples. Int. J. Mass Spectrom. Ion Proc.1990, 99, 249-262.
70. Handbook of Derivates for Chromatogra-phy; 1st ed.; Blau, G.; King, G.S., editors;Heyden & Son: London, 1977.
71. Poole, C.F. Recent Advances in the Si-lylation of Organic Compounds for GasChromatography, in Handbook of de-rivates for chromatography, 1st ed.; Blau,
G.; King, G.S., editors; Heyden & Son:London, 1977; Chapter 4, pp. 152-200.
72. Svendsen, J.S.; Sydnes, L.K.; Whist, J.E.Mass Spectrometric Study of DimethylEsters of Trimethylsilyl Ether Derivativesof Some 3-Hydroxy Dicarboxylic Acids.Org. Mass Spectrom. 1987, 22, 421-429.
73. Svendsen, J.S.; Whist, J.E.; Sydnes, L.K.A Mass Spectrometric Study of the Di-methyl Ester Trimethylsilyl Enol EtherDerivatives of Some 3-OxodicarboxylicAcids. Org. Mass Spectrom. 1987, 22,486-492.
74. Scribe, P.; Guezennec, J.; Dagaut, J.; Pepe,C.; Saliot, A. Identification of the Positionand the Stereochemistry of the DoubleBond in Monounsaturated Fatty AcidMethyl Esters by Gas Chromatogra-phy/Mass Spectrometry of Dimethyl Di-sulfide Derivatives. Anal. Chem. 1988,60, 928-931.
75. Pepe, C.; Sayer, H.; Dagaut, J.; Couffig-nal, R. Determination of Double Bond Po-sitions in Triunsaturated Compounds byMeans of Gas Chromatography/MassSpectrometry of Dimethyl Disulfide De-rivatives. Rapid Commun. Mass Spectrom.1997, 11, 919-921.
76. Abrahamsson, S.; Stenhagen, E.; McLaf-ferty, F.W. Atlas of Mass Spectral Data;1st ed.; John Wiley & Sons: New York,1969; Vol. 1-3.
77. Eight Peak Index of Mass Spectra; 3rd ed.;Royal Society of Chemistry: London,1983; Vol. 1-3.
78. McLafferty, F.W.; Stauffer, D.B. TheWiley/NBS Registry of Mass SpectralData; 2nd ed.; Wiley-Interscience: NewYork, 1989; Vol. 1-7.
79. McLafferty, F.W.; Gohlke, R.S. Mass-Spectrometric Analysis: Spectral-Data FileUtilizing Machine Filing and ManualSearching. Anal. Chem. 1959, 31, 1160-1163.
80. Stein, S.E.; Ausloos, P.; Lias, S.G. Com-parative Evaluations of Mass SpectralDatabases. J. Am. Soc. Mass Spectrom.1991, 2, 441-443.
81. McLafferty, F.W.; Stauffer, D.B.; Twiss-Brooks, A.B.; Loh, S.Y. An Enlarged DataBase of Electron-Ionization Mass Spectra.J. Am. Soc. Mass Spectrom. 1991, 2, 432-437.
82. McLafferty, F.W.; Stauffer, D.B.; Loh,S.Y. Comparative Evaluations of MassSpectral Data Bases. J. Am. Soc. MassSpectrom. 1991, 2, 438-440.

222 5 Electron Ionization
83. Henneberg, D.; Weimann, B.; Zalfen, U.Computer-Aided Interpretation of MassSpectra Using Databases with Spectra andStructures. I. Structure Searches. Org.Mass Spectrom. 1993, 28, 198-206.
84. Stein, S.; Scott, D.R. Optimization andTesting of Mass Spectral Library SearchAlgorithms for Compound Identification.J. Am. Soc. Mass Spectrom. 1994, 5, 859-866.
85. Stein, S.E. Estimating Probabilities ofCorrect Identification From Results of
Mass Spectral Library Searches. J. Am.Soc. Mass Spectrom. 1994, 5, 316-323.
86. Lebedev, K.S.; Cabrol-Bass, D. NewComputer Aided Methods for RevealingStructural Features of Unknown Com-pounds Using Low Resolution MassSpectra. J. Chem. Inf. Comput. Sci. 1998,38, 410-419.

6 Fragmentation of Organic Ions andInterpretation of EI Mass Spectra
The following chapter introduces one of the key disciplines of organic mass spec-trometry: the common fragmentation pathways of organic ions and the resultingmethodology for the interpretation of electron ionization (EI) mass spectra. Ofcourse, a single chapter cannot be comprehensive and thus, further reading may bedesirable. [1-6] Applications of mass spectrometry to organic stereochemistry aretreated in a monograph, [7] and in addition, there is a vast number of originalpublications dealing with classes of compounds or fragmentation pathways: theseshould be consulted to solve a particular problem. This chapter is an attempt topresent a systematic introduction to the topic rather by emphasizing the most im-portant fragmentation pathways than by dwelling on countless compounds. It is anattempt to teach the basic skills and to provide a guideline for further “learning bydoing”. Throughout the chapter we will keep an eye on the relationship betweenfragmentation patterns and gas phase ion chemistry. In order to successfully workthrough these pages, some knowledge of the general concept of mass spectrometry(Chap. 1) and of the basics of electron ionization (Chap. 5) are prerequisite. In ad-dition, you should be familiar with the fundamentals of gas phase ion chemistry(Chap. 2) as well as with isotopic mass and isotopic distributions (Chap. 3).
Note: Although the discussion of common fragmentation pathways of organicions is embedded here in the context of EI mass spectrometry, their occurrenceis not restricted to this technique. The reactions of isolated gaseous ions do notdirectly depend on the ionization method, but are almost exclusively governedby intrinsic properties of the respective ion and by its internal energy (Chap. 2).
6.1 Cleavage of a Sigma-Bond
6.1.1 Writing Conventions for Molecular Ions
Electron ionization mainly creates singly charged positive ions by ejection of oneelectron out of the neutral. If the precursor was a molecule, M, it will have an evennumber of electrons, i.e., an even-electron or closed-shell species. The molecularion formed upon EI must then be a positive radical ion, M+•, (odd-electron oropen-shell) ion.

224 6 Fragmentation of Organic Ions and Interpretation of EI Mass Spectra
Definition: The molecular ion has the same empirical formula as the corre-sponding neutral molecule. The neutral and its molecular ion only differ by one(or more) electron(s). A singly charged molecular ion can either be a positiveradical ion, M+•, or a negative radical ion, M–• (not in case of EI). The mass ofthis ion corresponds to the sum of the masses of the most abundant isotopes ofthe various atoms that make up the molecule (with a correction for the elec-tron(s) lost or gained, Chap. 3.1.4). [8,9]
Table 6.1. Symbolism for indication of charge and radical state
State of Species Symbol Exampleseven-electron ion +, – CH3
+, NH4+, EtO–, CF3
–
odd-electron ion +•, –• CH4+•, C60
+•, C60–•, CCl4
–•
radical, no charge • CH3•, OH•, H•, Br•
Note: The symbolism M+• does not mean one added electron. The radical sym-bol is added to the molecular ion only to indicate a remaining unpaired elec-tron after ionization. Addition of one electron to a neutral would make it anegative radical ion, M–• (electron capture).
When initially formulating the ionization process, we did not consider wherethe charge would reside (Chap. 2.2.1), e.g., for methane we wrote:
CH4 + e– CH4+• + 2e– (6.1)
The tremendous changes in electronic structure and bonding that arise with theloss of an electron are by far better visualized by a formula representation includ-ing the -bonding electrons of the C–H bond. In small non-functionalized mole-cules such as methane, it is not possible to avoid the loss of a valence electronfrom a -bond upon electron ionization. The same is true for all other saturatedhydrocarbons or a hydrogen molecule, for example. The resulting methane mo-lecular ion may formally be represented either as a species resembling a combina-tion of a methyl cation plus a hydrogen radical or a methyl radical plus a proton.Nevertheless, one may still assume that it resembles more the intact molecule thanthe evolving fragments – a statement being also in accordance with the basic as-sumptions of the QET (Chap. 2.1). Otherwise, fragmentation would proceed al-most spontaneously, thereby excluding the detection of the molecular ion.
HCH HH
+.
HCHH
. . HEI
H.HCHH
+ +HCHH
. H
[CH4] CH4+. +.equivalents for M :+.
Scheme 6.1.
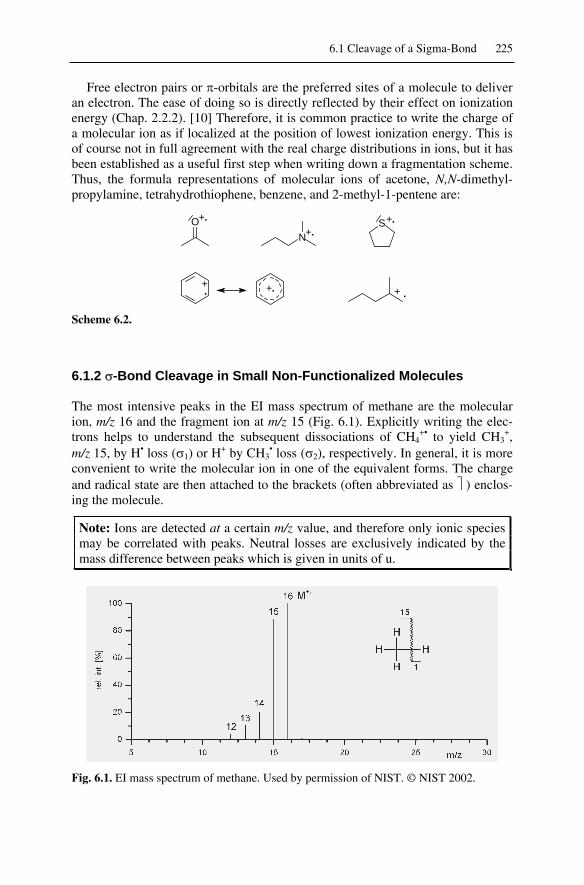
6.1 Cleavage of a Sigma-Bond 225
Free electron pairs or -orbitals are the preferred sites of a molecule to deliveran electron. The ease of doing so is directly reflected by their effect on ionizationenergy (Chap. 2.2.2). [10] Therefore, it is common practice to write the charge ofa molecular ion as if localized at the position of lowest ionization energy. This isof course not in full agreement with the real charge distributions in ions, but it hasbeen established as a useful first step when writing down a fragmentation scheme.Thus, the formula representations of molecular ions of acetone, N,N-dimethyl-propylamine, tetrahydrothiophene, benzene, and 2-methyl-1-pentene are:
ON
S
+.
+.+.
+.
++ ..
Scheme 6.2.
6.1.2 -Bond Cleavage in Small Non-Functionalized Molecules
The most intensive peaks in the EI mass spectrum of methane are the molecularion, m/z 16 and the fragment ion at m/z 15 (Fig. 6.1). Explicitly writing the elec-trons helps to understand the subsequent dissociations of CH4
+• to yield CH3+,
m/z 15, by H• loss ( 1) or H+ by CH3• loss ( 2), respectively. In general, it is more
convenient to write the molecular ion in one of the equivalent forms. The chargeand radical state are then attached to the brackets (often abbreviated as ) enclos-ing the molecule.
Note: Ions are detected at a certain m/z value, and therefore only ionic speciesmay be correlated with peaks. Neutral losses are exclusively indicated by themass difference between peaks which is given in units of u.
Fig. 6.1. EI mass spectrum of methane. Used by permission of NIST. © NIST 2002.
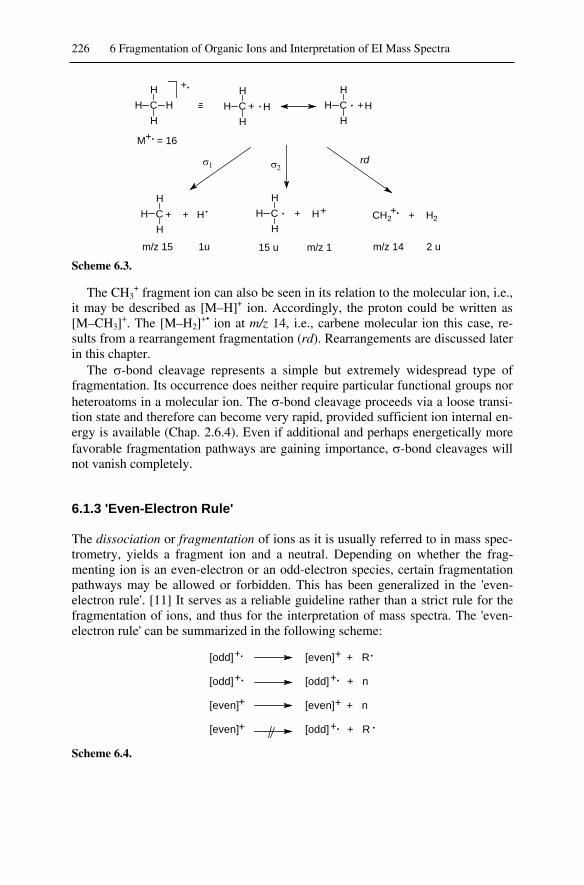
226 6 Fragmentation of Organic Ions and Interpretation of EI Mass Spectra
HCH HH
+.
H.HCHH
+HCHH
H CH2 + H2+ + +. +.
M = 16+.
m/z 15 1u 15 u m/z 1 m/z 14 2 u
H.HCHH
+ +HCHH
. H
rd
Scheme 6.3.
The CH3+ fragment ion can also be seen in its relation to the molecular ion, i.e.,
it may be described as [M–H]+ ion. Accordingly, the proton could be written as[M–CH3]
+. The [M–H2]+• ion at m/z 14, i.e., carbene molecular ion this case, re-
sults from a rearrangement fragmentation (rd). Rearrangements are discussed laterin this chapter.
The -bond cleavage represents a simple but extremely widespread type offragmentation. Its occurrence does neither require particular functional groups norheteroatoms in a molecular ion. The -bond cleavage proceeds via a loose transi-tion state and therefore can become very rapid, provided sufficient ion internal en-ergy is available (Chap. 2.6.4). Even if additional and perhaps energetically morefavorable fragmentation pathways are gaining importance, -bond cleavages willnot vanish completely.
6.1.3 'Even-Electron Rule'
The dissociation or fragmentation of ions as it is usually referred to in mass spec-trometry, yields a fragment ion and a neutral. Depending on whether the frag-menting ion is an even-electron or an odd-electron species, certain fragmentationpathways may be allowed or forbidden. This has been generalized in the 'even-electron rule'. [11] It serves as a reliable guideline rather than a strict rule for thefragmentation of ions, and thus for the interpretation of mass spectra. The 'even-electron rule' can be summarized in the following scheme:
[odd]
[odd]
[even]
[even]
[even] + R
[odd] + n
[even] + n
[odd] + R+.
+.+.
+. .
.+
+
+
+
Scheme 6.4.

6.1 Cleavage of a Sigma-Bond 227
'Even-electron rule': Odd-electron ions (such as molecular ions and fragmentions formed by rearrangements) may eliminate either a radical or an even-electron neutral species, but even electron ions (such as protonated moleculesor fragments formed by a single bond cleavage) will not usually lose a radicalto form an odd-electron cation. In other words, the successive loss of radicals isforbidden. [12]
Example: According to the 'even-electron rule' the molecular ion of methaneshould undergo the following dissociations:
CH4+• CH3
+ + H• (6.2)
CH4+• CH2
+• + H2 (6.3)
Despite that it might initially be generated in a different electronic state and/orconformation, the CH2
+• fragment ion can be expected to decompose further in away identical to the molecular ion of carbene:
CH2+• C+• + H2 (6.4)
CH2+• CH+ + H• (6.5)
Loss of a radical from a radical ion creates an even-electron fragment ion,CH3
+ in this case, which preferably may undergo subsequent loss of a molecule:
CH3+ CH+ + H2 (6.6)
Subsequent loss of H• from CH3+ should not occur. It is noteworthy that even
such a simple fragmentation scheme offers two independent pathways for the gen-eration of CH+ (reactions 6.5 and 6.6).
Note: It is important to assign the correct charge and radical state to all speciesencountered and to carefully track them through a fragmentation scheme. Oth-erwise, “impossible” fragmentation pathways may be formulated, thereby mis-leading the assignment of elemental composition and molecular constitution.
Numerous exceptions of the even-electron rule have been described. [12-15]Violations tend to occur where the loss of a radical from an even-electron ionleads to the formation of an exceptionally stable ionic species or where highly ex-cited ions are involved. Representatives of highly excited ions are small molecularions having only a few degrees of freedom to randomize internal energy [13] orions being subject to high-energy collisional activation [15,16] (Chap. 12). Therule and some exceptions will be mentioned where appropriate.
Note: In chemistry, there usually is no strict “either ... or”; instead the ions be-have like “more ... than ...”.

228 6 Fragmentation of Organic Ions and Interpretation of EI Mass Spectra
6.1.4 -Bond Cleavage in Small Functionalized Molecules
The introduction of a charge-localizing heteroatom into a molecule is accompa-nied by obvious changes in the appearance of the mass spectrum. Withdrawal ofan electron upon EI must not necessarily affect a -bond, because the electron canbe supplied from one of the free electron pairs of the heteroatom.
In the EI mass spectrum of iodomethane the molecular ion, CH3–I+•, is detectedas the base peak at m/z 142 (Fig. 6.2). However, the most important characteristicof the spectrum is the [M–CH3]
+ peak at m/z 127. This signal is due to formationof I+ by a process that can also be classified as a -bond cleavage. Here, a singleelectron shifts from the intact C–I bond to the radical-site, thereby rupturing thebond. The peak is accompanied by a much less intense one at m/z 128 due to for-mation of HI+• by rearrangement. (The m/z 128 peak must not be interpreted as anisotopic peak of m/z 127, because iodine is monoisotopic!) The remaining peakscan be explained as for methane before, i.e., peaks can be assigned as [M–H]+, m/z141, [M–H2]
+•, m/z 140, and [M–H–H2]+, m/z 139. Analogous to H• loss, I• loss
also occurs generating the CH3+ ion, m/z 15.
Fig. 6.2. EI mass spectrum of iodomethane. The molecular ion mainly decomposes to yieldionic fragments representing its major constituent groups, i.e., I+, m/z 127 and CH3
+, m/z 15.Spectrum used by permission of NIST. © NIST 2002.
HCH IH
+.
I.HCHH
+HCHH
I CH2 + HI+ + +. +.
M = 142+.
m/z 15 127 u 15 u m/z 127 14 u m/z 128
rd
IIHCHH
+.
Scheme 6.5.
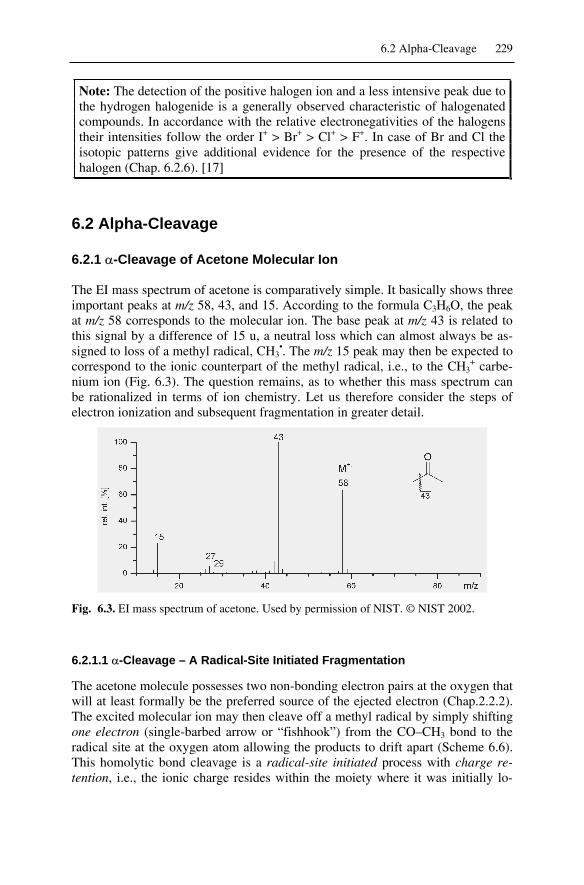
6.2 Alpha-Cleavage 229
Note: The detection of the positive halogen ion and a less intensive peak due tothe hydrogen halogenide is a generally observed characteristic of halogenatedcompounds. In accordance with the relative electronegativities of the halogenstheir intensities follow the order I+ > Br+ > Cl+ > F+. In case of Br and Cl theisotopic patterns give additional evidence for the presence of the respectivehalogen (Chap. 6.2.6). [17]
6.2 Alpha-Cleavage
6.2.1 -Cleavage of Acetone Molecular Ion
The EI mass spectrum of acetone is comparatively simple. It basically shows threeimportant peaks at m/z 58, 43, and 15. According to the formula C3H6O, the peakat m/z 58 corresponds to the molecular ion. The base peak at m/z 43 is related tothis signal by a difference of 15 u, a neutral loss which can almost always be as-signed to loss of a methyl radical, CH3
•. The m/z 15 peak may then be expected tocorrespond to the ionic counterpart of the methyl radical, i.e., to the CH3
+ carbe-nium ion (Fig. 6.3). The question remains, as to whether this mass spectrum canbe rationalized in terms of ion chemistry. Let us therefore consider the steps ofelectron ionization and subsequent fragmentation in greater detail.
Fig. 6.3. EI mass spectrum of acetone. Used by permission of NIST. © NIST 2002.
6.2.1.1 -Cleavage – A Radical-Site Initiated Fragmentation
The acetone molecule possesses two non-bonding electron pairs at the oxygen thatwill at least formally be the preferred source of the ejected electron (Chap.2.2.2).The excited molecular ion may then cleave off a methyl radical by simply shiftingone electron (single-barbed arrow or “fishhook”) from the CO–CH3 bond to theradical site at the oxygen atom allowing the products to drift apart (Scheme 6.6).This homolytic bond cleavage is a radical-site initiated process with charge re-tention, i.e., the ionic charge resides within the moiety where it was initially lo-

230 6 Fragmentation of Organic Ions and Interpretation of EI Mass Spectra
cated. The process is also known as -cleavage. The neutral fragment, CH3•, is not
detected by the mass spectrometer, whereas the charged fragment, C2H3O+, gives
rise to the base peak m/z 43:..
O+
H3C+ .
H3C CH3
O+
H3C CH3
OEI
CH3
m/z 43 15 uM = 58+.
-cleavage
Scheme 6.6.
Note: The term -cleavage for this widespread radical-site initiated processwith charge retention can be misleading, because the bond cleaved is not di-rectly attached to the radical site, but to the next neighboring atom.
Including the ionization process, the free electron pairs, and single-barbed ar-rows for each moving electron in the scheme is not necessary but presents a valu-able aid. Alternatively, the -cleavage may be indicated in a simplified manner:
O
H3C+ .
H3C CH3
O
H3C CH3
O
CH3
m/z 43 15 uM = 58+. 43
+.+. +
or
Scheme 6.7.
The first abbreviated form only shows the decisive electron shift, but it still ex-plicitly gives the structures of the products. The second is useful to indicate whichbond will be cleaved and what m/z the ionic product will have. Such a writingconvention can of course be used for any other fragmentation pathway. The ionicproduct of the -cleavage, an acyclium ion, will not exactly have the angularstructure as shown, however drawing it this way helps to identify the fragment asa part of the initial molecular ion. The charge in acylium ions can be substantiallyresonance-stabilized:
O
H3C
+ O
H3C +
Scheme 6.8.
6.2.2 Stevenson's Rule
The origin of the m/z 43 peak in the EI mass spectrum of acetone should be quiteclear now and we may examine the formation of the CH3
+ ion, m/z 15, next. Inprinciple the ionic charge may reside on either fragment, the acyclium or the alkyl.In case of acetone, the formation of the acylium ion, CH3CO+, m/z 43, is preferred

6.2 Alpha-Cleavage 231
over the formation of the small carbenium ion, CH3+, m/z 15. The question which
of the two incipient fragments will preferably keep the charge can be answered bymeans of Stevenson's Rule.
Stevenson's rule: When a fragmentation takes place, the positive charge re-mains on the fragment with the lowest ionization energy.
This criterion was originally established for the fragmentation of alkanes byStevenson [18] and was later demonstrated to be generally valid. [19,20] The rulecan be rationalized on the basis of some ion thermochemical considerations (Fig.6.4). Assuming no reverse activation barrier, the difference in thermodynamic sta-bility as expressed in terms of the difference of heats of formation of the respec-tive products determines the preferred dissociation pathway:
Hf(B+;A•) – Hf(A+;B•) = Hf(Prod) = E0 (6.7)
This can also be expressed in relation to the ionization potentials of the radicalsformed by both dissociations:
E0 = IEB• – IEA• = E02 – E01 (6.8)
Therefore, the radical having the lower ionization energy will dominate amongthe products. [19,21] For example, in case of the -cleavage of acetone, CH3C
•=Ohas a by 2.8 eV lower IE than •CH3 (Tab. 6.2). As ion internal energies are subjectto a wide distribution, there is a substantial fraction of ions that may also dissoci-ate to form the energetically more demanding pair of fragments. This is the reasonfor the “soft” character of the rule.
Fig. 6.4. Thermochemical description of Stevenson's rule; DAB homolytic bond dissocia-tion energy of bond A–B, IE ionization energy.

232 6 Fragmentation of Organic Ions and Interpretation of EI Mass Spectra
Note: The homolytic dissociation of a C–C bond always proceeds to yield bothproduct pairs, their relative abundances being basically governed by Steven-son's rule.
Without having the thermochemistry data at hand, it is not trivial to decidewhich pair of products will be preferred over the other. In general, the formationof the higher substituted and/or larger carbenium ion is preferred, because it canmore easily stabilize a charge. However, the tendency is the same for the radicalsand one may expect loss of ethyl to be favored over loss of methyl, for example.Thus, the formation of both the ionic and the radical fragments are of decisive in-fluence on the final distribution of products.
Table 6.2. Ionization energies of some radicals.a
Radical IEb [eV] Radical IEb [eV]H• 13.6 CH3O
• 10.7•CH3 9.8 •CH2OH 7.6•C2H5 8.4 CH3C
•=O 7.0n-•C3H7 8.2 C2H5C
•=O 5.7i-•C3H7 7.6 •CH2Cl 8.8n-•C4H9 8.0 •CCl3 8.1i-•C4H9 7.9 C6H5
• 8.3s-•C4H9 7.3 C6H5CH2
• 7.2t-•C4H9 6.8 •CH2NH2 6.3a IE data extracted from Ref. [22] with permission. © NIST 2002.b All values rounded to one decimal place.
Note: The validity of Stevenson's rule requires no reverse activation energybarrier to exist for the fragmentation pathway. This requirement is usually ful-filled for simple bond cleavages, but not in case of rearrangement fragmenta-tions.
6.2.3 -Cleavage of Non-Symmetrical Aliphatic Ketones
When a ketone grows larger it does not necessarily imply that it has two identicalalkyl groups at the carbonyl. In case of different alkyls at the carbonyl, Steven-son's rule may also be applied to decide which of them will dominantly be de-tected as part of the acylium ion and which should preferably give rise to a carbe-nium ion. Overall, a nonsymmetrical ketone will yield four primary fragment ionsin its EI mass spectrum.
Example: The 70 eV EI mass spectrum of butanone shows an ethyl loss,m/z 43, which is largely preferred over methyl loss, m/z 57 (Fig. 6.5). Further-more, the C2H5
+ ion, m/z 29, is more abundant than the less stable CH3+ ion,

6.2 Alpha-Cleavage 233
m/z 15. If the alkyls become larger than ethyl, another pathway of ion dissociationwill occur in addition (Chap. 6.7).
Fig. 6.5. EI mass spectrum of butanone. Used by permission of NIST. © NIST 2002.
. O+
+
..
O+
+ .
+
.
+
. O
O
+
+
.
.
O+
O+
CH3
CH3
C2H5
C2H5
m/z 57
m/z 43
m/z 15
m/z 29
Scheme 6.9.
Different from ketones [23] the mass spectra of aliphatic aldehydes [24,25] re-veal that -cleavage is one of the less important primary fragmentations. This isbecause -cleavage of aldehyde molecular ions leads to the formation of energeti-cally unfavorable products, i.e., loss of H• or formation of the formyl ion, CHO+,m/z 29. It was demonstrated by means of high-resolution mass spectrometry(Chap. 3.3), that only a minor portion of the m/z 29 peak originates from CHO+
ions, but the major fraction of about 65–75 % is due to C2H5+ ions from -
cleavage. [26]

234 6 Fragmentation of Organic Ions and Interpretation of EI Mass Spectra
6.2.4 Acylium Ions and Carbenium Ions
6.2.4.1 Series of Homologous Ions
Upon extrapolation to larger ketones one can expect to observe larger acylium andalkyl fragments. The occurrence of series of homologous ions is a feature that canbe very helpful to deduce structural information from mass spectra. Ions such asthe acylium ion series and the carbenium ion series are also known as character-istic ions. Learning the nominal masses of the first members of each series byheart is useful (Tables 6.2 and 6.3).
Table 6.3. Carbenium ions
m/z(1 + 14n)
Carbenium Ions[CnH2n+1]
+Accurate Mass [u]a
15 CH3+ 15.0229
29 C2H5+ 29.0386
43 n-C3H7+, i-C3H7
+ 43.054257 n-C4H9
+, i-C4H9+, sec-C4H9
+, tert-C4H9+ 57.0699
71 C5H11+ isomers 71.0855
85 C6H13+ isomers 85.1011
99 C7H15+ isomers 99.1168
113 C8H17+ isomers 113.1325
a Values rounded to four decimal places.
Table 6.4. Acylium ions
m/z(15 + 14n)
Acylium Ions[CnH2n–1O]+
Accurate Mass [u]a
29 HCO+ 29.002243 CH3CO+ 43.017857 C2H5CO+ 57.033571 C3H7CO+ 71.049185 C4H9CO+ 85.064899 C5H11CO+ isomers 99.0804113 C6H13CO+ isomers 113.0961127 C7H15CO+ isomers 127.1117a Values rounded to four decimal places.
Note: The acylium ions and the saturated carbenium ions are isobaric, i.e., theyhave the same nominal mass. However, their exact masses are different, i.e.,CH3CO+, m/z 43.0178, and C3H7
+, m/z 43.0542.

6.2 Alpha-Cleavage 235
6.2.4.2 Differentiation Between Carbenium Ions and Acylium Ions
Besides having different accurate mass, carbenium ions and acylium ions fortu-nately exhibit different dissociation pathways allowing their differentiation fromthe appearance of a mass spectrum. Acylium ions undergo CO loss (–28 u),thereby forming carbenium ions, but they do not eliminate hydrogen molecules:
O
R
++R
- CO
Scheme 6.10.
Example: The dissociation CH3CO+ CH3+ + CO presents a second pathway
for the generation of the m/z 15 peak in the mass spectra of acetone (Fig. 6.3) andbutanone (Fig. 6.5), and accordingly the process CH3CH2CO+ C2H5
+ + CO alsoyields an m/z 29 ion. Thus, this pathway competes with the one-step formation ofcarbenium ions from ketone molecular ions by charge migration.
Carbenium ions, especially from ethyl to butyl show remarkable dehydrogena-tion that gives rise to a characteristic accompanying pattern of peaks at m/z–2 andm/z–4, i.e., at the low-mass side of the corresponding peak:
C3H7 C3H5 C3H3+ + +
- H2 -H2m/z 43 m/z 41 m/z 39
Scheme 6.11.
Example: The mass spectra of both acetone and butanone show typicalacylium ion peaks at m/z 43, whereas the signals in the spectra of isopropyl ethylthioether (Fig. 6.9), of 1-bromo-octane, (Fig. 6.10), and of isomeric decanes(Fig. 6.18) may serve as examples for carbenium ion signals. The superimpositionof both classes of ions causes signals representing an average pattern. The proper-ties of larger carbenium ions are discussed in the section on alkanes (Chaps. 6.6.1and 6.6.3).
6.2.5 -Cleavage of Amines, Ethers, and Alcohols
The charge-localizing heteroatom can also be part of the aliphatic chain as it is thecase with amines, ethers, and alcohols. The mechanism of the -cleavage remainsunaffected by this change, i.e., still the bond second to the charge site is cleaved.Nevertheless, the structure of the charged fragments is quite changed, and conse-quently their further fragmentation pathways are also different.
In case of amine molecular ions the -cleavage is the absolutely dominatingprimary fragmentation pathway. The strong charge-stabilizing properties of thenitrogen atom keeps the fraction of charge migration fragments very low. Theproduct ions are termed immonium ions, because these can formally be obtained

236 6 Fragmentation of Organic Ions and Interpretation of EI Mass Spectra
by electrophilic addition of a proton or carbenium ion to imines. Immonium ionsrepresent the most stable [CnH2n+2N]+ isomers [27] and preferably undergo furtherdecomposition on two widespread and thus highly important pathways for alkeneloss [28,29] (Chap. 6.11). Oxonium ions are the oxygen analogs to immoniumions. As oxygen is somewhat less charge-stabilizing than nitrogen, the competingformation of carbenium ions is more pronounced among the primary fragmenta-tions of aliphatic ethers [30,31] and alcohols [32], but still the -cleavage repre-sents the favored dissociation channel.
+ . ++ CH3
.
.+ CH3+.+
RO
R N
R
RNR
R O
R = H alcoholsR = CH3, C2H5, ... ethers
R = H, CH3, C2H5, ...
oxonium ions
iminium ions
Scheme 6.12.
6.2.5.1 -Cleavage of Aliphatic Amines
The intensity of the molecular ion of aliphatic amines decreases regularly with in-creasing molecular weight. [33] Analogous general behavior has also early beennoted for other compound types such as the aliphatic ethers [31], hydrocarbons[34] and aldehydes [24], and others. The reason for the low stability of aminemolecular ions is their predisposition to -cleavage.
A comparison of the relative strength of functional groups to cause -cleavageis summarized in Table 6.5. [6] This also corresponds to a rough measure of rela-tive charge-stabilizing capability of the respective substituent, e.g., the ratioH2C=OH+/H2C=NH2
+ from 2-amino ethanol molecular ion is 2.3/100 and the ratioof H2C=OH+/H2C=SH+ from 2-thio ethanol molecular ion is 42/70. [20]
The mass spectrum of N-ethyl-N-methyl-propanamine, C6H15N, shows the mo-lecular ion peak at m/z 101 (Fig. 6.6). The primary fragmentations of the molecu-lar ion may well be explained in terms of the -cleavage and accordingly, thepeaks at m/z 72 and 86 can be assigned as immonium fragment ions due to ethyland methyl loss, respectively. However, there are five instead of two channels forthe -cleavage possible! In order to identify the missing three dissociation chan-nels, we have to write down the fragmentation scheme carefully checking everypossibility. And of course, we have to examine the mass spectrum with sufficientcare in order not to overlook an indicative peak.
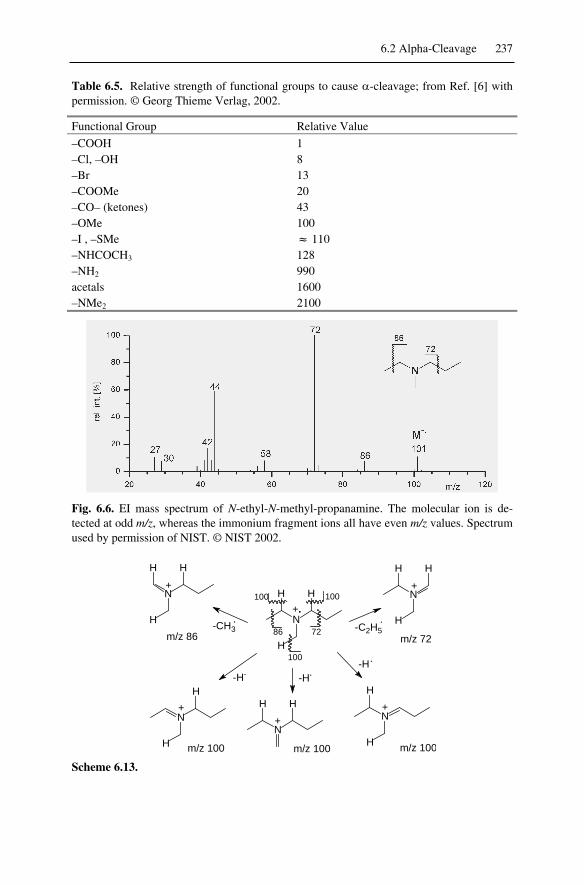
6.2 Alpha-Cleavage 237
Table 6.5. Relative strength of functional groups to cause -cleavage; from Ref. [6] withpermission. © Georg Thieme Verlag, 2002.
Functional Group Relative Value–COOH 1–Cl, –OH 8–Br 13–COOMe 20–CO– (ketones) 43–OMe 100–I , –SMe 110–NHCOCH3 128–NH2 990acetals 1600–NMe2 2100
Fig. 6.6. EI mass spectrum of N-ethyl-N-methyl-propanamine. The molecular ion is de-tected at odd m/z, whereas the immonium fragment ions all have even m/z values. Spectrumused by permission of NIST. © NIST 2002.
+.100 100
7286
100
+
N
H
H
H N
HH
H
N
H
H
+
N
HH+
N
HH
H
+
N
H
H
+
-H..-H
-H.
-CH3.
-C2H5.
m/z 100
m/z 86
m/z 100 m/z 100
m/z 72
Scheme 6.13.

238 6 Fragmentation of Organic Ions and Interpretation of EI Mass Spectra
The peak at m/z 100 belongs to H• loss and is also due to -cleavage as can beeasily recognized (Scheme 6.13). There are three different positions to cleave offthe radical, and even seven almost equivalent hydrogens are available in total (forclarity only one them has been shown at any position in the scheme). Despite thismultiple chance, the peak at m/z 100 is very weak, the reason for this being the un-favorable thermodynamics of H• loss as compared to methyl loss (Table 2.2).
As with acylium ions and carbenium ions before, the series of homologous im-monium ions is part of the mass spectrometrist's tool box. They can easily be rec-ognized in the mass spectra and have even-numbered m/z values (Tab. 6.6). In theEI spectrum of N-ethyl-N-methyl-propanamine the series is completely presentfrom m/z 30 up to m/z 100.
Table 6.6. Aliphatic immonium ions
m/z(16 + 14n)
Immonium Ions[CnH2n+2N]+
Accurate Mass [u]a
30 CH4N+ 30.0338
44 C2H6N+ 44.0495
58 C3H8N+ 58.0651
72 C4H10N+ 72.0808
86 C5H12N+ 86.0964
100 C6H14N+ 100.1120
114 C7H16N+ 114.1277
128 C8H18N+ 128.1434
a Values rounded to four decimal places.
Note: In the EI mass spectra of primary amines the methylene immonium ion,CH2=NH+, m/z 30, resulting from -cleavage either represents the base peak orat least is the by far most abundant of the immonium ion series.
Even though -cleavage seems to be a purely electronic process at first sight,the influence of ion internal energy and of the alkyl chain should not be neglected.Whereas CH2=NH+, m/z 30, is the predominating ionic product of fragmentationsof highly excited primary amine molecular ions within the ion source, the me-tastable decompositions of such molecular ions yield CH2CH+NH2, m/z 44, andCH2CH2CH+NH2, m/z 58. This has been attributed to isomerization via H• shiftsprior to dissociation. [35]
6.2.5.2 Nitrogen Rule
Restricting to the more common elements in organic mass spectrometry (H, B, C,N, O, Si, S, P, F, Cl, Br, I, etc.), a simple rule holds valid: With the exception ofN, all of the above elements having an odd number of valences also possess anodd mass number and those having an even number of valences have even massnumbers. This adds up to molecular masses fulfilling the nitrogen rule (Tab. 6.7).
6.2 Alpha-Cleavage 239
Nitrogen rule: If a compound contains an even number of nitrogen atoms (0, 2,4, ...), its monoisotopic molecular ion will be detected at an even-numbered m/z(integer value). Vice versa, an odd number of nitrogens (1, 3, 5, ...) is indicatedby an odd-numbered m/z.
Table 6.7. Demonstration of the nitrogen rule
Number ofNitrogens
Examples M+• at m/z
0 methane, CH4 160 acetone, C3H6O 580 chloroform, CHCl3 1180 [60]fullerene, C60 7201 ammonia, NH3 171 acetonitrile, C2H3N 411 pyridine, C5H5N 791 N-ethyl-N-methyl-propanamine, C6H15N 1012 urea, CH4N2O 602 pyridazine, C4H4N2 803 triazole, C2H3N3 693 hexamethylphosphoric triamide, HMPTA, C6H18N3OP 179
The rule may also be extended for use with fragment ions. This makes a practi-cal tool to distinguish even-electron from odd-electron fragment ions and thussimple bond cleavages from rearrangements. However, some additional care hasto be taken when applying the extended rule, because nitrogen might also be con-tained in the neutral, e.g., loss of NH3, 17 u, or of CONH2
•, 44 u.
Rule: Cleaving off a radical (that contains no nitrogen) from any ion changesthe integer m/z value from odd to even or vice versa. Loss of a molecule (thatcontains no nitrogen) from an ion produces even mass fragments from evenmass ions and odd mass fragments from odd mass ions.
Examples: To rationalize the mass spectrum of methane, reactions 6.2–6.6were proposed. They all obey the rule. You should check the mass spectra andfragmentation schemes throughout this chapter for additional examples of the ni-trogen rule:
CH4+• CH3
+ + H•; m/z 16 m/z 15 (6.2)
CH4+• CH2
+• + H2; m/z 16 m/z 14 (6.3)
CH2+• C+• + H2; m/z 14 m/z 12 (6.4)
CH2+• CH+ + H•; m/z 14 m/z 13 (6.5)
CH3+ CH+ + H2; m/z 15 m/z 13 (6.6)

240 6 Fragmentation of Organic Ions and Interpretation of EI Mass Spectra
6.2.5.3 -Cleavage of Aliphatic Ethers and Alcohols
The molecular ions of aliphatic ethers do not behave much different from those ofamines. [30,31] In constrast, oxygen is not directing their primary dissociations asstrongly to the -cleavage as nitrogen does in amines. Although -cleavage is stilldominant, there is a stronger tendency towards formation of carbenium ion frag-ments by charge migration. As can be expected, the structure of the alkyls also ex-erts a significant influence on the selection of a cleavage pathway.
Example: The 70 eV EI mass spectra of methyl propyl ether and diethyl etherare shown below (Fig. 6.7). Although being isomers, their spectra are clearly dif-ferent. In case of methyl propyl ether, -cleavage can occur by H• loss, m/z 73,and definitely preferable by C2H5
• loss, m/z 45, which gives rise to the base peak.The advantage of C2H5
• loss over CH3• loss becomes evident from the diethyl
Fig. 6.7. EI mass spectra of methylpropylether and diethyl ether. Spectra used by permis-sion of NIST. © NIST 2002.
ether spectrum. In accordance with Stevenson's rule, even two ethyl groups causemuch less CH3
• loss. It is tempting, although not trivial, to quantify the relative“ease” of fragmentation from the ratio of peak intensities. However, the primaryfragment will undergo further fragmentation at an unknown rate, e.g., ethene lossfrom the m/z 59 oxonium ion to yield the m/z 31 oxonium ion. Generally, oxonium

6.2 Alpha-Cleavage 241
ions are highly indicative for aliphatic ethers and alcohols. In the EI spectrum ofdiethyl ether the series from m/z 31 to m/z 73 is present (Table 6.8).
In case of alkanols, the methylene oxonium ion, CH2=OH+, m/z 31, deservesspecial attention. Resulting from -cleavage, it undoubtedly marks spectra of pri-mary alkanols, where it either represents the base peak or at least is the by farmost abundant of the oxonium ion series (Fig. 6.8). [32] The second importantfragmentation route of aliphatic alcohols, loss of H2O, is discussed in Chap. 6.10.
Fig. 6.8. EI mass spectrum of 1-propanol. Used by permission of NIST. © NIST 2002.
Table 6.8. Aliphatic oxonium ions
m/z(17 + 14n)
Oxonium Ions[CnH2n+1O]+
Accurate Mass [u]a
31 CH3O+ 31.0178
45 C2H5O+ 45.0335
59 C3H7O+ 59.0491
73 C4H9O+ 73.0648
87 C5H11O+ 87.0804
101 C6H13O+ 101.0961
115 C7H15O+ 115.1117
129 C8H17O+ 129.1274
a Values rounded to four decimal places.
6.2.5.4 Charge Retention at the Heteroatom
The peak at m/z 45 in the spectrum of diethyl ether can neither be explained by -cleavage nor by -cleavage plus a subsequent cleavage, because the latter woulddemand carbene loss to occur, which is almost never observed (one of the rare ex-amples is presented by formation of HI+• from CH3I
+•). Obviously, the C–O bondcan access a direct pathway for cleavage. Although some C–N bond cleavage canbe observed in EI spectra of aliphatic amines, the cleavage of the C–O bond isgaining importance for the molecular ions of aliphatic ethers. It is a simple -bondcleavage as discussed for methane molecular ions, the only difference being the

242 6 Fragmentation of Organic Ions and Interpretation of EI Mass Spectra
fact that one of the atoms connected by the -bond is not a carbon atom. As theheteroatom can stabilize the charge better than a primary carbon, the RX+ frag-ment is preferably formed in such a case ( 1). The product ion may then rearrangeby 1,2-hydride shift to form an oxonium ion. [36] The formation of C2H5
+ frag-ment ions, m/z 29, directly competes with 1.
O59
45
+.O+
m/z 45- C2H5
.
- C2H5O.
+
+
O- CH3
.
- O.C2H5
m/z 59
m/z 29m/z 15CH3
+
15
291,2-H-
HO+
Scheme 6.14.
6.2.5.5 -Cleavage of Thioethers
The EI mass spectra of thiols and thioethers also show a series of onium ions gen-erated by -cleavage of the molecular ion (Table 6.9). Sulfonium ions can easilybe recognized from the isotopic pattern of sulfur (Fig. 6.9). The fragmentationpatterns of thioethers will be discussed in greater detail later (Chap. 6.5.2 and6.12.4).
Table 6.9. Aliphatic sulfonium ions
m/z(33 + 14n)
Sulfonium Ions[CnH2n+1S]+
Accurate Mass [u]a
47 CH3S+ 46.9950
61 C2H5S+ 61.0106
75 C3H7S+ 75.0263
89 C4H9S+ 89.0419
103 C5H11S+ 103.0576
117 C6H13S+ 117.0732
131 C7H15S+ 131.0889
145 C8H17S+ 145.1045
a Values rounded to four decimal places.

6.2 Alpha-Cleavage 243
Fig. 6.9. EI mass spectrum of ethylisopropylthioether. Due to the isotopic composition ofsulfur, the intensity of the [M+2]+• ion is increased. The corresponding contributions canalso be recognized for the sulfonium ions at m/z 47, 61, 75, and 89. The m/z 35 peak is dueto H3S
+ ions; also compare the spectrum of ethylpropylthioether (Fig. 6.45). Spectrum usedby permission of NIST. © NIST 2002.
6.2.6 -Cleavage of Halogenated Hydrocarbons
Aliphatic halogenated hydrocarbons do not show abundant fragment ions due to-cleavage. [17] As was found with aliphatic amines and ethers before, the mo-
lecular ion peak decreases in intensity as the molecular weight and branching ofthe alkyl chain increase. In general, the relative intensity of the molecular ion peakfalls in the order I > Br > Cl > F (Chap. 6.1.4). For bromine the molecular ions arealmost of the same relative intensity as for hydrogen, i.e., for the correspondinghydrocarbon. This corresponds to the inverse order of halogen electronegativities.Higher electronegativity of the halogen also causes a higher ionization energy ofthe RX molecule and a rise of -cleavage products.
Example: The 70 eV EI mass spectrum of 1-bromo-octane incorporates thecharacteristic fragmentations of aliphatic halogenated hydrocarbons (Fig. 6.10).All bromine-containing fragments are readily recognized from their bromine iso-topic pattern (Chap. 3.1, 3.2). The product of the -cleavage, [CH2Br]+, m/z 91,93, is of minor intensity, whereas a [M–57]+ ion, m/z 135, 137, dominates thespectrum. Obviously, there is preference to form this specific fragment ion, butnot its homologues. This preference for the [M–57]+ ion, [C4H8Br]+, has been at-tributed to the possibility to yield a five-membered cyclic bromonium ion of lowring strain. This reaction differs from the preceding bond cleavages in that it is adisplacement of an alkyl group, but it shares the common property of being a one-step process. [37] Analogous behavior is observed for the chlorohydrocarbonsfrom hexyl through octadecyl that show the [C4H8Cl]+ ion, m/z 91, 93. Fortu-nately, the isotopic patterns of Br and Cl are clearly different, thereby avoidingconfusion of the isobaric [C4H8Cl]+ and [CH2Br]+ ions. Iodo- and fluorohydrocar-bons do not exhibit such cyclic halonium ions in their EI spectra. The remaining
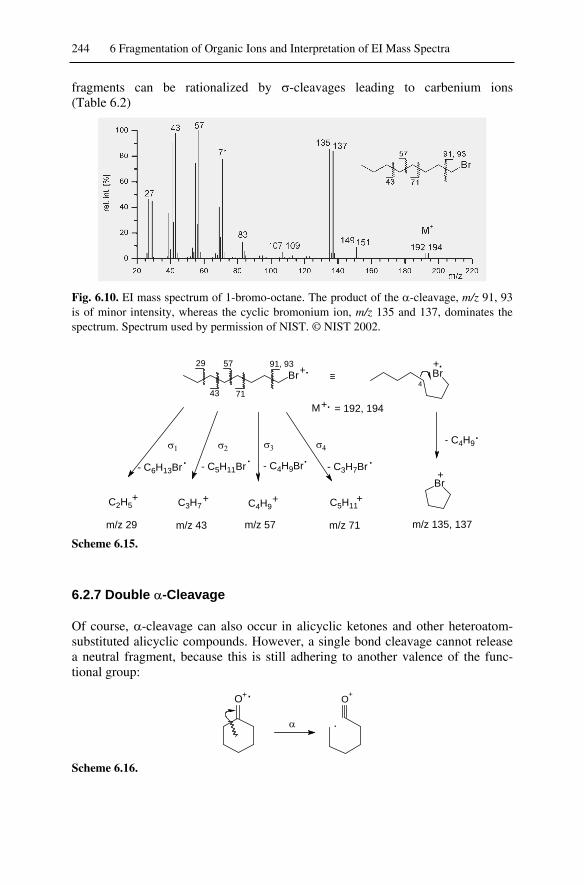
244 6 Fragmentation of Organic Ions and Interpretation of EI Mass Spectra
fragments can be rationalized by -cleavages leading to carbenium ions(Table 6.2)
Fig. 6.10. EI mass spectrum of 1-bromo-octane. The product of the -cleavage, m/z 91, 93is of minor intensity, whereas the cyclic bromonium ion, m/z 135 and 137, dominates thespectrum. Spectrum used by permission of NIST. © NIST 2002.
Br Br
Br
+. +.
- C4H9.
+
m/z 135, 137
M+. = 192, 194
C5H11+
- C3H7Br
C4H9+C3H7
+
- C5H11Br.
m/z 43 m/z 57 m/z 71
- C4H9Br.
91, 93
- C6H13Br.
C2H5+
m/z 29
29 57
71434
.
Scheme 6.15.
6.2.7 Double -Cleavage
Of course, -cleavage can also occur in alicyclic ketones and other heteroatom-substituted alicyclic compounds. However, a single bond cleavage cannot releasea neutral fragment, because this is still adhering to another valence of the func-tional group:
O+ .
.
O+
Scheme 6.16.

6.2 Alpha-Cleavage 245
6.2.7.1 Propyl Loss of Cyclohexanone Molecular Ion
The mass spectrum of cyclohexanone has been examined by deuterium-labeling toreveal the mechanism effective for propyl loss, [M–43]+, m/z 55, from the mo-lecular ion, M+• = 98. [38,39] The corresponding signal represents the base peak ofthe spectrum (Fig. 6.11). Obviously, one deuterium atom is incorporated in thefragment ion that is shifted to m/z 56 in case of the [2,2,6,6-D4]isotopomer. Thesefindings are consistent with a three-step mechanism for propyl loss, i.e., with adouble -cleavage and an intermediate 1,5-H• shift.
Fig. 6.11. 70 eV EI mass spectra of cyclohexanone (a) and its deuterated isotopomer[2,2,6,6-D4] (b). Adapted from Ref. [38] with permission. © Springer-Verlag Wien, 1964.
O+
H
.
.
O+
H
O+
.1,5-H
O+
+.
.
M = 98 43 u m/z 55+.
1 2
Scheme 6.17.
Note: Care should be taken when trying to formulate complex fragmentationprocesses in a concerted manner as it often was the case in early publications.There are strong arguments that gas phase ionic reactions are generally step-wise processes; i.e., it is more probable that such a fragmentation consists ofseveral discrete steps instead of one that demands simultaneous breaking andmaking of several bonds. [37]

246 6 Fragmentation of Organic Ions and Interpretation of EI Mass Spectra
6.2.7.2 Double -Cleavage for the Identification of Regioisomers
Following the logic of the deuterium labeling, regioisomers of cyclohexanones,cyclohexylamines, cyclohexylalcohols and others can be identified by strict appli-cation of the above mechanism. Regardless of some limitations of the method,e.g., that it is impossible to distinguish a 2,3-dimethyl from a 2-ethyl or 3-ethyl de-rivative, the method provides a valuable aid in structure elucidation.
Example: Propyl and pentyl loss from 2-ethyl-cyclohexylamine molecular ion,M+• = 127 (odd m/z) are competitive (Fig. 6.12). Pentyl loss, m/z 56 (even m/z), isfavored over propyl loss, m/z 84 (even m/z), in accordance with Stevenson's Rule.The peak at m/z 98 may be rationalized in terms of ethyl loss due to a minor con-tribution of 1,4-H• shift, i.e., from position 3 instead of the predominant 1,5-H•
shift from position 2. The [M–CH3]+ peak, m/z 112, is accompanied by a [M–
NH3]+• signal, m/z 110, which is typical of primary – and to a lower extend also
secondary – amines.
Fig. 6.12. EI mass spectrum of 2-ethyl-cyclohexylamine. Double -cleavage allows toidentify the C2-substitution on one side of the ring. Spectrum used by permission of NIST.© NIST 2002.
, 1,5-H , NH2+.
56 84
.
NH2
NH2
+
+
m/z 84
m/z 56
+
+
43 u
71 u
., 1,5-H ,
M = 127+.
.
.
Scheme 6.18.
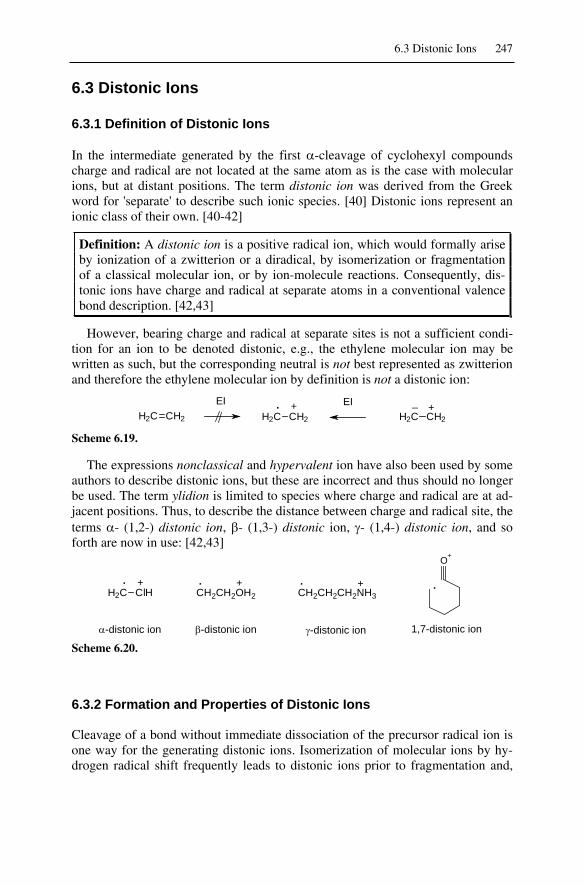
6.3 Distonic Ions 247
6.3 Distonic Ions
6.3.1 Definition of Distonic Ions
In the intermediate generated by the first -cleavage of cyclohexyl compoundscharge and radical are not located at the same atom as is the case with molecularions, but at distant positions. The term distonic ion was derived from the Greekword for 'separate' to describe such ionic species. [40] Distonic ions represent anionic class of their own. [40-42]
Definition: A distonic ion is a positive radical ion, which would formally ariseby ionization of a zwitterion or a diradical, by isomerization or fragmentationof a classical molecular ion, or by ion-molecule reactions. Consequently, dis-tonic ions have charge and radical at separate atoms in a conventional valencebond description. [42,43]
However, bearing charge and radical at separate sites is not a sufficient condi-tion for an ion to be denoted distonic, e.g., the ethylene molecular ion may bewritten as such, but the corresponding neutral is not best represented as zwitterionand therefore the ethylene molecular ion by definition is not a distonic ion:
H2C CH2
. +H2C CH2 H2C CH2
EI EI _ +
Scheme 6.19.
The expressions nonclassical and hypervalent ion have also been used by someauthors to describe distonic ions, but these are incorrect and thus should no longerbe used. The term ylidion is limited to species where charge and radical are at ad-jacent positions. Thus, to describe the distance between charge and radical site, theterms - (1,2-) distonic ion, - (1,3-) distonic ion, - (1,4-) distonic ion, and soforth are now in use: [42,43]
H2C ClH. +
CH2CH2OH2 CH2CH2CH2NH3
O+
.++. .
-distonic ion -distonic ion -distonic ion 1,7-distonic ion
Scheme 6.20.
6.3.2 Formation and Properties of Distonic Ions
Cleavage of a bond without immediate dissociation of the precursor radical ion isone way for the generating distonic ions. Isomerization of molecular ions by hy-drogen radical shift frequently leads to distonic ions prior to fragmentation and,
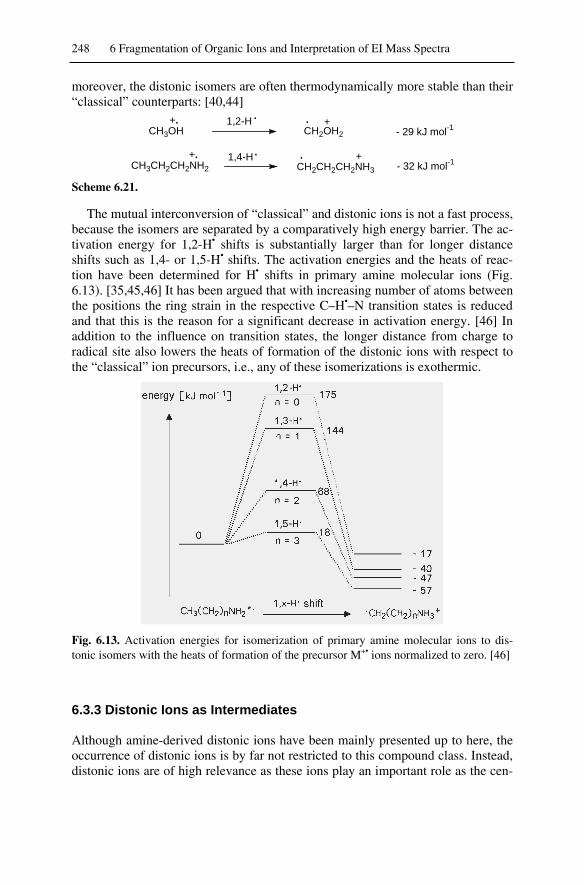
248 6 Fragmentation of Organic Ions and Interpretation of EI Mass Spectra
moreover, the distonic isomers are often thermodynamically more stable than their“classical” counterparts: [40,44]
CH2OH2
CH2CH2CH2NH3+
+.
.CH3CH2CH2NH2
+. 1,4-H .- 32 kJ mol-1
1,2-HCH3OH
+. .- 29 kJ mol-1
Scheme 6.21.
The mutual interconversion of “classical” and distonic ions is not a fast process,because the isomers are separated by a comparatively high energy barrier. The ac-tivation energy for 1,2-H• shifts is substantially larger than for longer distanceshifts such as 1,4- or 1,5-H• shifts. The activation energies and the heats of reac-tion have been determined for H• shifts in primary amine molecular ions (Fig.6.13). [35,45,46] It has been argued that with increasing number of atoms betweenthe positions the ring strain in the respective C–H•–N transition states is reducedand that this is the reason for a significant decrease in activation energy. [46] Inaddition to the influence on transition states, the longer distance from charge toradical site also lowers the heats of formation of the distonic ions with respect tothe “classical” ion precursors, i.e., any of these isomerizations is exothermic.
Fig. 6.13. Activation energies for isomerization of primary amine molecular ions to dis-tonic isomers with the heats of formation of the precursor M+• ions normalized to zero. [46]
6.3.3 Distonic Ions as Intermediates
Although amine-derived distonic ions have been mainly presented up to here, theoccurrence of distonic ions is by far not restricted to this compound class. Instead,distonic ions are of high relevance as these ions play an important role as the cen-

6.4 Benzylic Bond Cleavage 249
tral intermediates and products in the dissociation reactions of many ionizedmolecules. Further, it seems now likely that the long-lived molecular ions of manyorganic compounds may exist as their distonic forms. [43] It has been shown, forexample, that the long-lived radical ions of simple organophosphates spontane-ously isomerize to distonic isomers, [47] and that the ring-opening product of cy-clopropane molecular ion is also distonic. [48] The next distonic ions we are goingto learn about are the intermediates of the McLafferty rearrangement (Chap. 6.7).
6.4 Benzylic Bond Cleavage
The -cleavage in molecular ions of ketones, amines, ethers and similar function-alized compounds yields specific cleavage products of high importance for struc-ture elucidation. Analogous behavior is observed in the mass spectra of phenylal-kanes. [49]
6.4.1 Cleavage of the Benzylic Bond in Phenylalkanes
Molecular ions of phenylalkanes are comparatively stable due to the good chargestabilizing properties of the aromatic ring and thus, they normally give rise to in-tense peaks. Those molecular ions, possessing a benzylic bond preferably show
- C2H5.
+
+ +
m/z 91+.
.
M = 120
benzylic+
Scheme 6.22.
Fig. 6.14. EI mass spectrum of n-propylbenzene. The molecular ion peak and the primaryfragment ion have significant intensity, whereas low-mass fragments are less abundant.Spectrum used by permission of NIST. © NIST 2002.

250 6 Fragmentation of Organic Ions and Interpretation of EI Mass Spectra
cleavage of that bond as compared to the phenylic or homobenzylic position. Aswith the -cleavage, the process is radical-initiated and follows the same basicscheme, i.e., dissociation of the bond second to the radical-site after transfer of asingle electron towards the radical-site. The mass spectrum of n-propylbenzene isan example (Fig. 6.14). The cleavages of the phenylic and homobenzylic bond aremuch less emphasized as can be seen from the minor m/z 77 and m/z 105 peak inthe mass spectrum of propylbenzene. Nevertheless, phenylic bond cleavage doesalso occur and gives rise to further fragments. Due to its high thermodynamic sta-bility, the [C7H7]
+ ion is not only formed by benzylic cleavage, but it is also ob-tained from many other fragmentation processes of phenylalkanes. Almost anymass spectrum of such compounds clearly exhibits the corresponding peak atm/z 91.
M = 120
.
+. m/z 77
+
+.- C3H7
C6H5
phenylic+
Scheme 6.23.
Example: In the mass spectrum of tert-butylbenzene, C10H14, Mr = 134, the[C7H7]
+ ion is formed by C2H4 loss from the product of benzylic cleavage, m/z119, despite such a rearrangement would not be expected at first sight (Fig. 6.15).
- CH3.
+
+
m/z 91+.
.
M = 134
benzylic
m/z 119
re
- C2H4
+
+
+
Scheme 6.24.
Fig. 6.15. EI spectrum of tert-butylbenzene. Again, molecular ion and primary fragmention are dominating the spectrum. Spectrum used by permission of NIST. © NIST 2002.

6.4 Benzylic Bond Cleavage 251
Note: The mere occurrence of the [C7H7]+ ion – especially when it is of low
intensity – is not sufficient to prove that the analyte belongs to the phenylal-kanes. This ion and its characteristic fragments may also be observed if there issome way at all to generate a [C7H7]
+ fragment ion.
6.4.2 The Further Fate of [C6H5]+ and [C7H7]+
As already indicated in the preceding schemes, the resonance-stabilized benzylion, [C7H7]
+, initially formed by benzylic bond cleavage reversibly isomerizes tothe tropylium and tolyl ion isomers. The isomerization of [C7H7]
+ ions has beenthe subject of numerous studies, [50] revealing the tropylium ion as the thermody-namically most stable isomer. [51,52]
+
+CH3 CH3 CH3
+
+
+Hf = 866 kJ mol-1 887 kJ mol-1 971 kJ mol-1 987 kJ mol-1 992 kJ mol-1
CH2
Scheme 6.25.
Provided sufficient lifetime, the process of benzyl/tropylium isomerization canbe reversible (E0 = 167 kJ mol–1 [50]), and then it necessarily goes along with ascrambling of hydrogens and of carbons as can be demonstrated by use of isotopi-cally labeled compounds. [53] The degree of scrambling also depends on ion in-ternal energy and on ion lifetime. In addition, it has been shown that the benzyl-to-tropylium ratio depends on the structure of the precursor molecular ion. Thus,[C7H7]
+ ions from benzyl chloride yield 57 % benzyl and 43 % tropylium upon70 eV EI, but basically remain benzyl at low ion internal energies as realized by12 eV EI (Table 6.10).
Table 6.10. Benzyl-to-tropylium ratios from various precursors
Precursor Conditions % Benzyl of [C7H7]+
benzyl fluoride 12 eV EI 100benzyl fluoride methane CI 64benzyl chloride 12 eV EI 92benzyl chloride 70 eV EI 571,2-diphenylethane 11.5 eV EI > 90benzyl acetate isobutane CI 90
252 6 Fragmentation of Organic Ions and Interpretation of EI Mass Spectra
Note: The pictorial term scrambling is used in mass spectrometry to describerapid processes of (intramolecular) positional interchange of atoms. Scramblingmay occur with hydrogens or may involve the complete carbon skeleton of anion. Aryl radical ions and protonated aryl compounds are well known for theirnumerous scrambling processes. [54,55]
6.4.2.1 Formation of Characteristic Fragments from [C7H7]+ and [C6H5]+ Ions
Whatever the initial or preferred structure, the [C7H7]+ ions dissociate by loss of
ethine, C2H2, to yield the cyclopentadienyl ion, [C5H5]+, m/z 51, which fragments
to yield [C3H3]+, m/z 39, upon repeated ethine loss:
+
m/z 91
[C7H7]+
m/z 65
+
- C2H2 26 u
[C3H3]
m/z 39
- C2H2 26 u
+
Scheme 6.26.
The phenyl ion [C6H5]+, m/z 77, also undergoes C2H2 loss, thereby generating
the cyclobutadienyl ion, [C4H3]+, m/z 51:
+[C4H3]
- C2H2 26 u
m/z 51
+
[C6H5]+
+
m/z 77
Scheme 6.27.
Note: Overall, this gives the typical appearance of the ion series m/z 39, 51, 65,77, 91 in the EI mass spectra of phenylalkanes. However, one needs to keepaware of the fact, that there are two competing reaction sequences leading tothis series: (i) M+• 91 65 39 and (ii) M+• 77 51; the latter usuallybeing of lower intensity.
6.4.3 Isomerization of [C7H8]+• and [C8H8]+•Ions
The molecular ions of toluene and cycloheptatriene are capable of mutual isomeri-zation prior to dissociation. [49,53,56] It has been known for long that hydrogenloss from toluene molecular ions takes place as if all eight positions within theseions were equivalent, and this has been interpreted in terms of complete hydrogenscrambling prior to dissociation. [57] The extent of isomerization becomes appar-ent from the close similarity of the toluene and cycloheptatriene EI mass spectra

6.4 Benzylic Bond Cleavage 253
(Fig. 6.16). Loss of H• from [C7H8]+• leads to the formation of [C7H7]
+ ions, pref-erably of tropylium structure, [54] and thus, to the typical fragment ion series de-scribed above.
[C7H8] , m/z 92
+.H
H
CH3+.
+.
Scheme 6.28.
Fig. 6.16. Close similarity of the 70 eV EI mass spectra of toluene (left) and cyclohepta-triene (right). Spectra used by permission of NIST. © NIST 2002.
Extensive isomerizations prior to dissociation are also observed for other ionshaving similar structural features. Deuterium labeling of some bicyclic aromaticsystems has established that complete or partial randomization of the aromatic hy-drogens prior to dissociation can occur upon electron impact. [58] In detail, suchobservations were made in molecular ions of i) biphenyl prior to loss of CH3
•,C2H2, or C3H3
•, ii) 1- and 2-cyanonaphthalenes before HCN expulsion, andiii) benzothiophene before C2H2 expulsion. Cyclooctatetraene and styrene mo-lecular ions, [C8H8]
+•, m/z 104, interconvert prior to loss of ethine to yield benzenemolecular ion, m/z 78. Because of the substantially lower overall activation en-ergy, most of the [C6H6]
+• ions formed result from dissociation of cyclooctatet-raene molecular ion although this has the higher heat of formation. [59]
[C6H6]+.+.[C6H6]- C2H2 - C2H2
+. +.
Hf = 257 kJ mol-1 Hf = 232 kJ mol-1
Scheme 6.29.
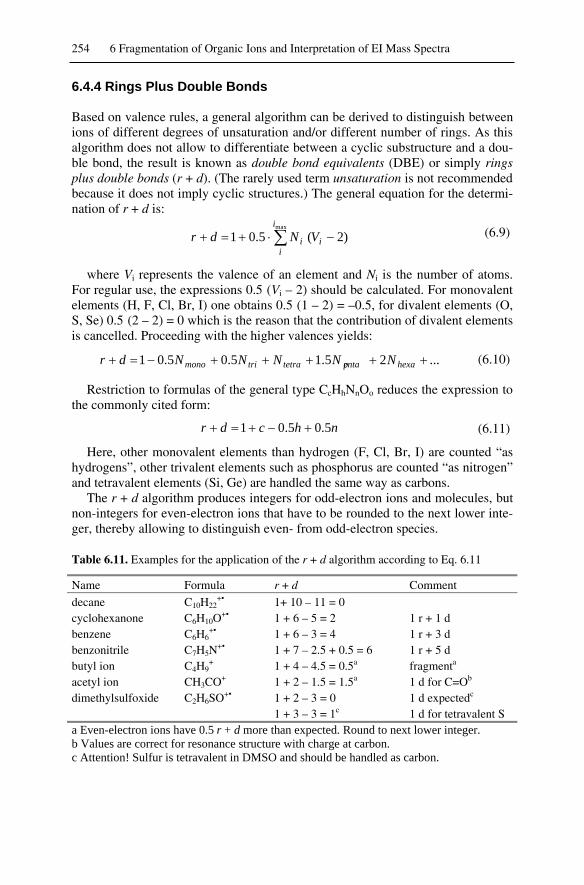
254 6 Fragmentation of Organic Ions and Interpretation of EI Mass Spectra
6.4.4 Rings Plus Double Bonds
Based on valence rules, a general algorithm can be derived to distinguish betweenions of different degrees of unsaturation and/or different number of rings. As thisalgorithm does not allow to differentiate between a cyclic substructure and a dou-ble bond, the result is known as double bond equivalents (DBE) or simply ringsplus double bonds (r + d). (The rarely used term unsaturation is not recommendedbecause it does not imply cyclic structures.) The general equation for the determi-nation of r + d is:
max
)2(5.01i
iii VNdr (6.9)
where Vi represents the valence of an element and Ni is the number of atoms.For regular use, the expressions 0.5�(Vi – 2) should be calculated. For monovalentelements (H, F, Cl, Br, I) one obtains 0.5�(1 – 2) = –0.5, for divalent elements (O,S, Se) 0.5�(2 – 2) = 0 which is the reason that the contribution of divalent elementsis cancelled. Proceeding with the higher valences yields:
...25.15.05.01 hexapentatetratrimono NNNNNdr (6.10)
Restriction to formulas of the general type CcHhNnOo reduces the expression tothe commonly cited form:
nhcdr 5.05.01 (6.11)
Here, other monovalent elements than hydrogen (F, Cl, Br, I) are counted “ashydrogens”, other trivalent elements such as phosphorus are counted “as nitrogen”and tetravalent elements (Si, Ge) are handled the same way as carbons.
The r + d algorithm produces integers for odd-electron ions and molecules, butnon-integers for even-electron ions that have to be rounded to the next lower inte-ger, thereby allowing to distinguish even- from odd-electron species.
Table 6.11. Examples for the application of the r + d algorithm according to Eq. 6.11
Name Formula r + d Commentdecane C10H22
+• 1+ 10 – 11 = 0cyclohexanone C6H10O
+• 1 + 6 – 5 = 2 1 r + 1 dbenzene C6H6
+• 1 + 6 – 3 = 4 1 r + 3 dbenzonitrile C7H5N
+• 1 + 7 – 2.5 + 0.5 = 6 1 r + 5 dbutyl ion C4H9
+ 1 + 4 – 4.5 = 0.5a fragmenta
acetyl ion CH3CO+ 1 + 2 – 1.5 = 1.5a 1 d for C=Ob
dimethylsulfoxide C2H6SO+• 1 + 2 – 3 = 01 + 3 – 3 = 1c
1 d expectedc
1 d for tetravalent Sa Even-electron ions have 0.5 r + d more than expected. Round to next lower integer.b Values are correct for resonance structure with charge at carbon.c Attention! Sulfur is tetravalent in DMSO and should be handled as carbon.

6.5 Allylic Bond Cleavage 255
Care has to be taken when elements of changing valence are encountered, e.g.,S in sulfoxides and sulfones or P in phosphates. In such a case, Eqs. 6.9 or 6.10have to be used, whereas Eq. 6.11 yields erroneous results.
Note: It is good practice to apply the r + d algorithm as soon as the empiricalformula of a molecular ion or a fragment ion seems to be apparent. This yieldsvaluable information on possible substructures.
6.5 Allylic Bond Cleavage
6.5.1 Cleavage of the Allylic Bond in Aliphatic Alkenes
The mass spectra of alkenes are governed by the alkyl part of the molecule and bythe specific reactions characteristic for the double bond. Molecular ions are gener-ally of low intensity – as is the case with all other purely aliphatic compounds dis-cussed so far – and may even be fully absent. [2,4,30] There is some preferencefor the cleavage of the allylic bond in the alkene molecular ions which can betreated analogously to -cleavage and benzylic cleavage, but the double bond isthe weakest cleavage-directing functional group:
+.+. .
+allylicRR R
m/z 4141
+
Scheme 6.30.
6.5.1.1 Isomerization Prior to Allylic Bond Cleavage
As hydrogen rearrangements prior to dissociation are prevalent in alkenes, theradical site migrates along the chain, thereby obscuring the location of the doublebond. [60]
The radical or non-radical character of alkene molecular and fragment ions, re-spectively, determines the extent to which these ions equilibrate to a mixture ofinterconverting structures prior to decomposition. Odd-electron ions have lowerthresholds for decomposition and higher barriers for isomerization than even-electron ions, thus explaining the reduced tendency for isomerization of [CnH2n]
+•
molecular ions as compared to [CnH2n–1]+ fragment ions. [61] Moreover, the mo-
lecular size seems to be a major factor for the isomerization of unsaturated hydro-carbon ions. Decreasing molecular size leads to more isomerization prior to de-composition. [62]
2H- and 13C-labeling revealed that the decomposing molecular ions of 1-, 2-, 3-,and 4-octene isomerize to a mixture of interconverting structures within 10-9 s af-ter ionization. The equilibration of double bond isomers is mainly due to radical-

256 6 Fragmentation of Organic Ions and Interpretation of EI Mass Spectra
site migration accompanied by hydrogen rearrangements, which do not involvethe terminal hydrogens to a larger extent. [63]
Note: Extensive isomerization prior to or between single steps of fragmentationmakes the mass spectra of isomeric alkenes become very similar.
Example: The spectra of 1-decene, (E)-5-decene, and (Z)-5-decene are shownbelow (Fig. 6.17). Whereas in the spectrum of 1-decene the basepeak at m/z 41can easily be explained as a result of allylic cleavage, the base peak of both
Fig. 6.17. EI mass spectra of isomeric decenes. The differences between 1-decene (a), 5(E)-decene (b), and 5(Z)-decene (c) are visible, but without reference spectra the isomers can-not be identified. Spectra used by permission of NIST. © NIST 2002.

6.5 Allylic Bond Cleavage 257
stereoisomeric 5-decenes is at m/z 55 and therefore, cannot be the result of directallylic cleavage. Nonetheless, without having reference spectra at hand, it is notpossible to find clear evidence for a certain isomer. At m/z 97, there is only a mi-nor signal from allylic cleavage, and unfortunately such a peak is also observed inthe spectrum of 1-decene. Consecutive fragmentations of the primary cleavageproduct give one reason for this close similarity, another being the influence of H•
migrations prior to dissociation of the alkene molecular ions. The differences be-tween the stereoisomers are negligible and even comparison to reference spectradoes not permit their proper identification.
6.5.2 Methods for the Localization of the Double Bond
The localization of a double bond is an important step in structure elucidation andtherefore, it is not astonishing that numerous approaches have been made to over-come the above limitations. The methods “to freeze” isomerization includei) epoxidation [64], ii) iron and copper ion chemical ionization [65,66], iii) fieldionization [67], iv) collision-induced dissociation [60], v) formation of thioetherderivatives, [68,69] and others.
Example: The oxidative addition of dimethyl disulfide (DMDS) transforms thedouble bond to its 1,2-bis-thiomethyl derivative (a). Induced by charge localiza-tion at either sulfur atom, the molecular ions of DMDS adducts are prone to -cleavage at the former double bond position (b). This gives rise to sulfonium ionsthat are readily identified from the mass spectrum (Chap. 6.2.5). The method canbe extended to dienes, trienes, and alkynes. [70,71] (For the mass spectral frag-mentation of thioethers cf. Chap. 6.12.4).
DMDS, I2
48 h, 50 °C SMe
SMe
SMe
SMe +.
M = 248
SMe
SMe
SMe
SMe+.
+
+
.
.
a
b
145 103
m/z 145
m/z 103145 u
103 u
+
+
Scheme 6.31.

258 6 Fragmentation of Organic Ions and Interpretation of EI Mass Spectra
6.6. Cleavage of Non-Activated Bonds
6.6.1 Saturated Hydrocarbons
In a molecular ion of a straight-chain n-alkane there is no preferred position to lo-calize the charge. Consequently, as in the case of methane, longer chain alkanesalso suffer from substantial weakening of bonds upon electron ionization. The -cleavage is not observed anymore. As expected, the primary step of dissociation isunspecific -bond cleavage at any but C1–C2 bonds, provided there are others.Methyl loss is negligible due to the unfavorable thermodynamics of this process.The resulting carbenium ions subsequently dissociate by loss of alkene molecules,preferably propene to pentene. [72] This process can occur repeatedly as long asthe chain length of the fragment ion suffices. [73,74] As a result of these compet-ing and consecutive ion dissociations, low-mass carbenium ions, typically propyl,m/z 43, or butyl, m/z 57 give rise to the base peak of aliphatic hydrocarbon spectra(Table 6.2). As with the alkenes before, it has been shown that saturated alkylfragments [CnH2n+1]
+ (n = 3–7) isomerize to common structures before decompo-sition, whereas the molecular ions retain their structure. [75] The molecular ionpeak is usually visible, but never as strong as in spectra of aromatic compounds.[34] For highly branched hydrocarbons it may even be absent:
+.
+
- C4H9
.
+ - C3H7
+- C2H5
M = 142+.
- C4H8
+
+- C5H11
.
.
.
m/z 113
m/z 85
m/z 57
m/z 99
m/z 71
997185 113
Scheme 6.32.
Example: The EI mass spectrum of n-decane is typical for this class of hydro-carbons (Fig. 6.18a). Branching of the aliphatic chain supports cleavage of thebonds adjacent to the branching point, because then secondary or tertiary carbe-nium ions and/or alkyl radicals are obtained (Fig. 6.18b,c). This allows for theidentification of isomers to a certain degree. Unfortunately, hydrocarbon molecu-lar ions may undergo skeletal rearrangements prior to dissociations, thereby ob-scuring structural information.

6.6. Cleavage of Non-Activated Bonds 259
Fig. 6.18. EI mass spectra of n-decane (a), 2,7-dimethyloctane (b), and 2,5,5-trimethyl-heptane (c). Spectra used by permission of NIST. © NIST 2002.
A closer look at the spectrum of n-decane also reveals fragment ions at m/z 84,98, and 112, i.e., rearrangement ions at even mass number. The origin by loss ofH• from the accompanying carbenium ions at m/z 85, 99, and 113, respectively,can be excluded by application of the even-electron rule. Instead, alkane molecu-lar ions may undergo alkane loss, [76] e.g.,
+.. +
- C3H8M = 142+. m/z 112
rH
Scheme 6.33.

260 6 Fragmentation of Organic Ions and Interpretation of EI Mass Spectra
Theoretical and experimental studies revealed a common intermediate for theelimination of CH3
• and CH4 from isobutane and other alkanes of similar size. Theadditional hydrogen needed may originate from either terminal position of thepropyl moiety: [77,78]
+.
. +M = 58+.
H3C .+
+ CH3
+ CH4
+
m/z 43
m/z 42
.H
Scheme 6.34.
6.6.2 Carbenium Ions
As pointed out, carbenium ions make up the largest portion of alkane mass spectraand dissociate further by alkene loss. This type of fragmentation is rather specific,nevertheless isomerizations of the carbenium ion can happen before. Generally,such processes will yield a more stable isomer, e.g., the tert-butyl ion instead ofother [C4H9]
+ isomers (Fig. 6.19).Among the [C4H9]
+ isomers, only the n-butyl isomer can undergo fragmenta-tions. It either yields an allyl ion, m/z 41, by loss of methane or an ethyl ion,m/z 29, by elimination of ethene. This is the reason why tert-butyl compounds ex-hibit strong m/z 41 and m/z 57 signals in their EI spectra (Figs. 6.20, 6.23). In caseof metastable [C4H9]
+ ions, methane loss is about 20fold stronger than ethane lossbecause of the by 1 eV higher activation energy in case of ethene loss. [79]
Fig. 6.19. Energetics of the isomerization and fragmentation pathways of [C4H9]+ ions.
Heat of formations are in kJ mol–1. Redrawn from Ref. [79] with permission. © AmericanChemical Society, 1977.

6.6. Cleavage of Non-Activated Bonds 261
Example: In the EI mass spectrum of tert-butylchloride the molecular ion peakis absent and the highest m/z signal is due to [M-CH3]
+; note the Cl isotopic pat-tern of this signal (Fig. 6.20). The remaining portion of the spectrum is determinedby the tert-butyl group, causing the base peak at m/z 57. The tert-butyl ion directlyoriginates from -cleavage of the C–Cl bond. The ratio of the [C3H5]
+, m/z 41, and[C2H5]
+, m/z 29, fragments correlates well with the energetically favorable CH4
loss from [C4H9]+ ions (Fig. 6.19).
Fig. 6.20. EI mass spectrum of tert-butylchloride. Spectrum used by permission of NIST.© NIST 2002.
Other typical reactions of carbenium ions are alkene loss, provided sufficientchain length is available (Chap. 6.6.1), and dehydrogenation in case of the smallerions such as ethyl, propyl, or butyl ion (Chap. 6.2.4.).
Carbenium ions, especially from ethyl to butyl show remarkable dehydrogena-tion that gives rise to a characteristic accompanying pattern of peaks at m/z–2 andm/z–4, i.e., at the low-mass side of the corresponding peak:
C3H7 C3H5 C3H3+ + +
- H2 -H2m/z 43 m/z 41 m/z 39
Scheme 6.35.
Dirarylmethyl and triarylmethyl ions (trityl ions) are even more stable than thetert-butyl ion which is impressively demonstrated by the commercial availabilityof solid [Ph3C]+[BF4]
– and similar salts. Triphenylchloromethane dissociates inpolar, inert solvents such as SO2, and therefore, it is not surprising that EI spectraof triphenylmethyl compounds almost exclusively exhibit this ion together withsome of its fragments, whereas the molecular ion peak is usually absent. Field de-sorption allows to circumvent this problem (Chap. 8.5).
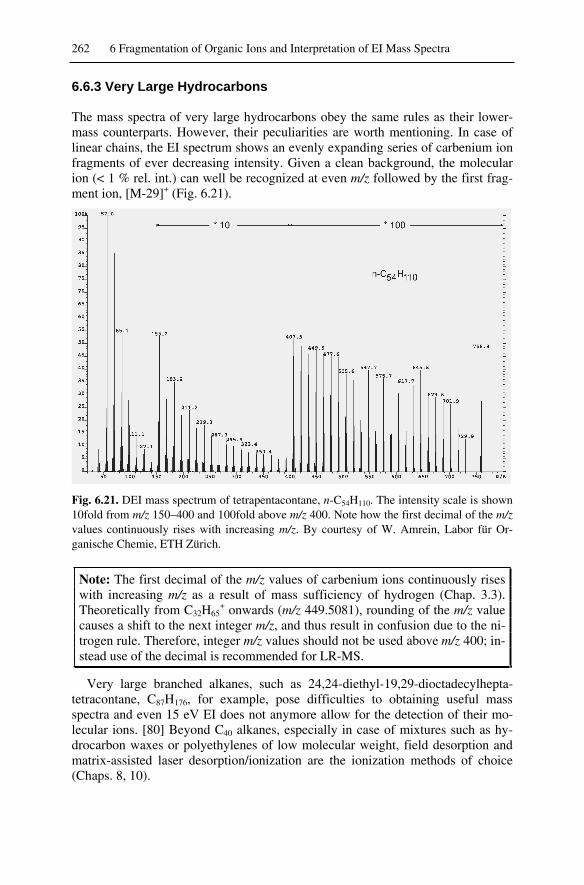
262 6 Fragmentation of Organic Ions and Interpretation of EI Mass Spectra
6.6.3 Very Large Hydrocarbons
The mass spectra of very large hydrocarbons obey the same rules as their lower-mass counterparts. However, their peculiarities are worth mentioning. In case oflinear chains, the EI spectrum shows an evenly expanding series of carbenium ionfragments of ever decreasing intensity. Given a clean background, the molecularion (< 1 % rel. int.) can well be recognized at even m/z followed by the first frag-ment ion, [M-29]+ (Fig. 6.21).
Fig. 6.21. DEI mass spectrum of tetrapentacontane, n-C54H110. The intensity scale is shown10fold from m/z 150–400 and 100fold above m/z 400. Note how the first decimal of the m/zvalues continuously rises with increasing m/z. By courtesy of W. Amrein, Labor für Or-ganische Chemie, ETH Zürich.
Note: The first decimal of the m/z values of carbenium ions continuously riseswith increasing m/z as a result of mass sufficiency of hydrogen (Chap. 3.3).Theoretically from C32H65
+ onwards (m/z 449.5081), rounding of the m/z valuecauses a shift to the next integer m/z, and thus result in confusion due to the ni-trogen rule. Therefore, integer m/z values should not be used above m/z 400; in-stead use of the decimal is recommended for LR-MS.
Very large branched alkanes, such as 24,24-diethyl-19,29-dioctadecylhepta-tetracontane, C87H176, for example, pose difficulties to obtaining useful massspectra and even 15 eV EI does not anymore allow for the detection of their mo-lecular ions. [80] Beyond C40 alkanes, especially in case of mixtures such as hy-drocarbon waxes or polyethylenes of low molecular weight, field desorption andmatrix-assisted laser desorption/ionization are the ionization methods of choice(Chaps. 8, 10).
6.6. Cleavage of Non-Activated Bonds 263
6.6.4 Recognition of the Molecular Ion Peak
The molecular ion peak directly provides valuable information on the analyte.Provided the peak being of sufficient intensity, in addition to mere molecularmass, the accurate mass can reveal the molecular formula of the analyte, and theisotopic pattern may be used to derive limits of elemental composition (Chaps. 3.2and 3.3). Unfortunately, the peak of highest m/z in a mass spectrum must not nec-essarily represent the molecular ion of the analyte. This is often the case with EIspectra either as a result of rapidly fragmenting molecular ions or due to thermaldecomposition of the sample (Chaps. 6.9 and 6.10.3)
6.6.4.1 Improving the Detection of the Molecular Ion
In general, the stability of the molecular ion increases if -bonding electrons forthe delocalization of the charge are available and it decreases in the presence ofpreferred sites for bond cleavage, e.g., by -cleavage.
Rule of thumb: The stability of molecular ions roughly decreases in the fol-lowing order: aromatic compounds > conjugated alkenes > alkenes > alicycliccompounds > carbonyl compounds > linear alkanes > ethers > esters > amines> carboxylic acids > alcohols > branched alkanes. [81]
In EI mass spectrometry, the molecular ion peak can be increased to a certaindegree by application of reduced electron energy and lower ion source tempera-ture (Chap. 5.1.5). However, there are compounds that thermally decompose priorto evaporation or where a stable molecular ion does not exist. The use of soft ioni-zation methods is often the best way to cope with these problems.
Note: Even for the softest ionization method, there is no guarantee that thehighest m/z ion must correspond to molecular mass.
6.6.4.2. Criteria for the Identification of the Molecular Ion
In order to derive reliable analytical information, it is therefore important to havesome criteria at hand to identify the molecular ion.1. The molecular ion must be the ion of highest m/z in the mass spectrum (be-
sides the corresponding isotopic peaks).2. It has to be an odd-electron ion, M+•.3. The peaks at the next lowest m/z must be explicable in terms of reasonable
losses, i.e., of common radicals or molecules. Signals at M–5 to M–14 and atM–21 to M–25 point towards a different origin of the presumed M+•.
4. Fragment ions may not show isotopic patterns due to elements that are not pre-sent in the presumed molecular ion.
5. No fragment ion may contain a larger number of atoms of any particular ele-ment than the molecular ion does.

264 6 Fragmentation of Organic Ions and Interpretation of EI Mass Spectra
Example: The EI mass spectrum of 2,5,5-trimethyl-heptane (Fig. 6.18) showsno molecular ion peak. The highest m/z peak is at m/z 113, demanding a nitrogento be present; otherwise it must be interpreted as a fragment ion. The remainingmass spectrum does not reveal any hint for nitrogen-containing ions, e.g., immo-nium ions are not present. Instead, the spectrum suggest that there are carbeniumions and their accompanying fragments only. Thus, m/z 113 should be a fragmention, most probably created by loss of CxHy
•. Here, it is explained as [M–Et]+.However, [M–Me]+ and other alkyl losses should also be taken into account.
Table 6.12. Commonly observed neutral losses from molecular ions
[M–X]+ Radicals [M–XY]+• Molecules–1 H• –2 H2
–15 CH3• –4 2�H2
–17 OH• –18 H2O–19 F• –20 HF–29 C2H5
• –27 HCN–31 OCH3
• –28 CO, C2H4, (N2)–33 SH• –30 H2C=O, NO–35 Cl• –32 CH3OH–43 C3H7
•, CH3CO• –34 H2S–45 OC2H5
•, COOH• –36 HCl–57 C4H9
• –42 C3H6, H2C=C=O–79 Br• –44 CO2
–91 C7H7• –46 C2H5OH, NO2
–127 I• –60 CH3COOH
6.7 McLafferty Rearrangement
Up to here, we have mainly discussed mass spectral fragmentations along theguideline of radical loss by simple cleavages, occasionally making some stepsaside to learn about compound-specific reactions where appropriate. Next, weshall examine some pathways of alkene loss from molecular ions. Any loss of anintact molecule belongs to the rearrangement type of fragmentations. Amongthese, the -H shift with -cleavage, commonly known as McLafferty rearrange-ment, surely is the most prominent.
6.7.1 McLafferty Rearrangement of Aldehydes and Ketones
The loss of alkenes from molecular ions of carbonyl compounds has early beennoted. [23,82] Soon, a mechanism involving -H shift and -cleavage has beenproposed and studied in detail. [24-26,83,84] Strictly speaking, the term McLaf-ferty rearrangement only describes an alkene loss from molecular ions of satu-

6.7 McLafferty Rearrangement 265
rated aliphatic aldehydes, ketones, and carboxylic acids, the mechanism of whichis analogous to the Norrish type-II photo-fragmentation in condensed-phasechemistry. However, a more generous use of the term to include all alkene lossesessentially following this mechanism is useful for the recognition of analogiesfrom a wide variety of molecular ions. Below, any fragmentation that can be de-scribed as a transfer of a -hydrogen to a double-bonded atom through a six-membered transition state with -bond cleavage is regarded as McLafferty rear-rangement (McL): [85,86]
HB
AD
HB
AD
McL+
+. +.
-bond
Scheme 6.36.
Example: The EI mass spectrum of butanal mainly shows carbenium fragmentions due to simple bond cleavage that can be easily recognized from their odd-numbered m/z values. However, the base peak is represented by a [M–28]+• ion,m/z 44, obviously resulting from rearrangement. A closer look reveals that thecharge-migration product, C2H4
+•, m/z 28, is also present in the spectrum.
Fig. 6.22. 70 eV EI mass spectrum of butanal. The base peak at m/z 44 is caused by theproduct of McLafferty rearrangement. Note that here the peak at m/z 57 cannot result from[C4H9]
+, but is due to [M–CH3]+. Spectrum used by permission of NIST. © NIST 2002.
Requirements for the McLafferty rearrangement in a broad sense: i) the at-oms A, B, and D can be carbons or heteroatoms, ii) A and B must be connectedby a double bond, iii) at least one -hydrogen is available that iv) is selectivelytransferred to B via a six-membered transition state, v) causing alkene lossupon cleavage of the -bond.

266 6 Fragmentation of Organic Ions and Interpretation of EI Mass Spectra
In addition to these general requirements, the distance between the -hydrogenand the double-bonded atom must be less than 1.8 10–10 m [87,88] and the C –Hbond must be in plane with the acceptor group. [89]
The McLafferty rearrangement itself proceeds via charge retention, i.e., asalkene loss from the molecular ion, but depending on the relative ionization ener-gies of the respective enol and alkene products, the charge migration product, i.e.,the corresponding alkene molecular ion is also observed. This is in accordancewith Stevenson's rule (Chap. 6.2.2).
6.7.1.1 Is the McLafferty Rearrangement Concerted or Stepwise?
Following the above general description of the McLafferty rearrangement, thepeak at m/z 44 in the mass spectrum of butanal can be explained by C2H4 lossfrom the molecular ion. The process may either be formulated in a concerted man-ner (a) or as a stepwise process (b):
OH
H
+.O
H
H+ .1,5-H
H
OH+.
.-cleavage
+. m/z 44M = 72
+.
H
OH+.O
H
H
a
b
concerted
+
H
OH
.
- C2H4
- C2H4
Scheme 6.37.
While the concerted pathway has been preferred in early publications on thesubject, evidence for a stepwise mechanism involving distonic ion intermediates ispresented in more recent work taking kinetic isotope effects into account. [90]This is also in agreement with the postulation that reactions involving multiplebonds are generally stepwise processes. [37,91] Nevertheless, this question is stilla matter of debate. [90]
In principle, the enolic fragment ion may or may not tautomerize to the ketoform before further fragmentation takes place:
H
OH+. +.
H
O
Scheme 6.38.
The gas-phase heats of formation of several enol positive ions of aliphatic alde-hydes, ketones, acids, and esters were measured and compared with those of thecorresponding keto ions. The enolic ions were found to be thermodynamicallymore stable by 58–129 kJ mol–1. This is in marked contrast to the neutral tau-

6.7 McLafferty Rearrangement 267
tomers, in which the keto forms are generally more stable. [92] The experimentalfindings also are in good agreement with MNDO calculations, [93] and supportthe hypothesis that reketonization does not play a major role for further fragmen-tation. Anyway, it is helpful to remind the possible tautomerization when seekingfor subsequent decomposition pathways.
6.7.1.2 The Role of the -Hydrogen for the McLafferty Rearrangement
The occurrence of the McLafferty rearrangement is strictly limited to molecularions possessing at least one -hydrogen for transfer to the terminal atom at thedouble bond. Thus, blocking the -position, e.g., by introduction of alkyl or halo-gen substituents, effectively hinders this dissociation pathway.
Example: In the EI mass spectrum of 3,3-dimethyl-2-butanone no fragment iondue to McLafferty rearrangement can be observed, because there is no -hydrogenavailable (Fig. 6.23). Instead, the products are exclusively formed by simplecleavages as evident from their odd-numbered m/z values. The highly stable tert-butyl ion, m/z 57, predominates over the acylium ion at m/z 43 (Chap. 6.6.2).
Fig. 6.23. EI spectrum of 3,3-dimethyl-2-butanone. The McLafferty rearrangement issup-pressed, because there is no -hydrogen. Spectrum by permission of NIST. © NIST 2002.
6.7.2 Fragmentation of Carboxylic Acids and Their Derivatives
The mass spectra of carboxylic acids and their derivatives are governed by both -cleavage and McLafferty rearrangement. As expected, -cleavage may occur ateither side of the carbonyl group causing OH• loss, [M–17]+, or alternatively alkylloss. Whereas the -cleavages can even be observed for formic acid where theyare leading to [M–OH]+•, m/z 29, [M–H]+•, m/z 45, and the respective charge mi-gration products (Fig. 6.24), the McLafferty rearrangement can only occur frombutanoic acid and its derivatives onwards. [82,84] Analogous to aliphatic alde-hydes, the same fragment ions are obtained for a homologous series of carboxylicacids, provided they are not branched at the -carbon. Thus, highly characteristicfragment ions make their recognition straightforward.

268 6 Fragmentation of Organic Ions and Interpretation of EI Mass Spectra
110 4
OR
O
87
101
115
129
1745
+.73
COOR+
- C9H19McL- C8H16- C7H15
OR
O+
.
m/z 73
OH
OR
+.
m/z 60R = H
R = Me
R = Et
m/z 87
m/z 101
m/z 74
m/z 88
m/z 45
m/z 59
m/z 73
.
mass labels atstructure are forthe carboxylicacid only
[M-17]
[M-31]
[M-45]R = Et
R = Me
R = H +
+
+
Scheme 6.39.
Fig. 6.24. EI mass spectrum of formic acid. Used by permission of NIST. © NIST 2002.
Fig. 6.25. EI mass spectrum of decanoic acid. Used by permission of NIST. © NIST 2002.

6.7 McLafferty Rearrangement 269
Example: The molecular ion of decanoic acid, C10H20O2+•, preferably exhibits
octene loss via McLafferty rearrangement yielding C2H4O2+•, m/z 60, as the base
peak of the spectrum (Fig. 6.25). This process is accompanied by several -bondcleavages among which -cleavage is clearly favored. Resulting from -cleavage,OH• loss can be expected, but is often represented by a very minor peak in thespectra of carboxylic acids. The other product, [M–R]+, COOH+, m/z 45, is almostalways observed, however together with the complementary [M–45]+ ion it nor-mally also belongs to the ions of low abundance.
In aliphatic esters the fragments typical for carboxylic acids are shifted by 14 uto higher mass upon transition from the free acid to the methyl ester and by further14 u for the ethyl ester. [85,86,94,95]
Examples: The mass spectrum of methyl heptanoate perfectly meets the stan-dard, and thus all peaks may be explained by following Scheme 6.39 (Fig. 6.26a).In principle, the same is true for the isomeric methyl 2-methylhexanoate, but herecare has to be taken not to interpret the mass spectrum as belonging to an ethylester. This is because the 2-methyl substituent resides on the ionic products ofMcLafferty rearrangement and -cleavage, shifting both of them 14 u upwards.Nevertheless, a look at the -cleavage products, [M–OMe]+, and [COOMe]+,m/z 59, reveals the methyl ester.
Fig. 6.26. EI mass spectra of methyl heptanoate (a) and methyl 2-methylhexanoate (b).Spectra used by permission of NIST. © NIST 2002.

270 6 Fragmentation of Organic Ions and Interpretation of EI Mass Spectra
For carboxylic acid ethyl and longer aliphatic chain esters the McLafferty rear-rangement can also occur on the alkoxy branch (R2) of the molecular ion. It thencompetes as a second alkene loss with the reaction at R1:
O
O
H
R1
R2+.O
OR1
H R2+ .1,5-H
R1 O
OH
R2.
.+ + .
R1 O
OH
-
Scheme 6.40.
Table 6.13. Frequent product ions of the McLafferty rearrangement
Precursor Product Structure Formula Accurate Mass [u]a
aldehyde
H
OH+.
C2H4O+• 44.0257
alkyl methyl ketone+.
Me
OH
C3H6O+• 58.0413
carboxylic acid+.
HO
OH
C2H4O2+• 60.0206
carboxylic acid amide+.
H2N
OH
C2H5NO+• 59.0366
methyl carboxylates+.
MeO
OH
C3H6O2+• 74.0362
ethyl carboxylates+.
EtO
OH
C4H8O2+• 88.0519
a Values rounded to four decimal places.
Example: In the case of ethyl hexanoate, butene is eliminated from the mo-lecular ion, M+•, m/z 144, via McLafferty rearrangement thereby giving rise to thebase peak at m/z 88. This product ion may then undergo ethene loss to yield thefragment ion at m/z 60. The remaining fragments can be rationalized by -cleavage, [M–Pr]+, m/z 101, and -cleavage products, [M–OEt]+, m/z 99, respec-tively. The carbenium ions representing the alkyl portion of the molecule resultfrom several -bond cleavages.
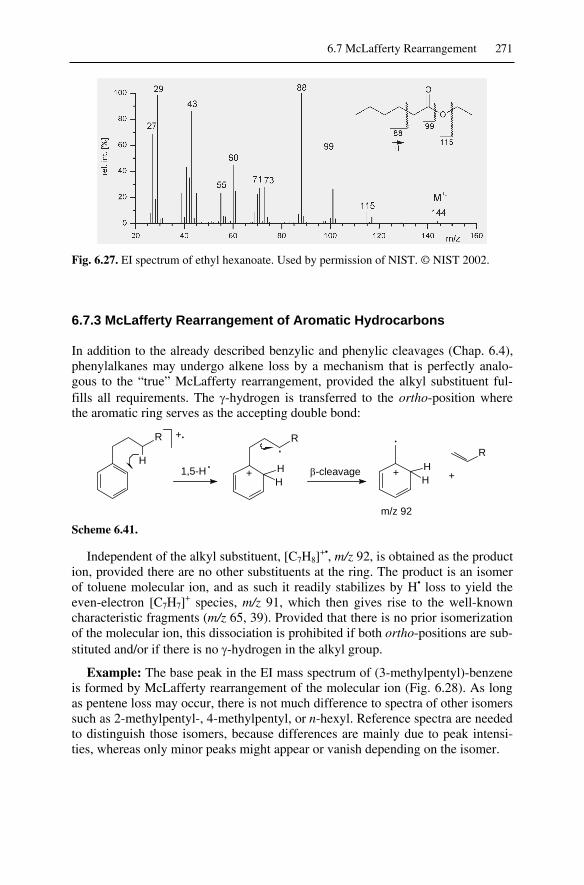
6.7 McLafferty Rearrangement 271
Fig. 6.27. EI spectrum of ethyl hexanoate. Used by permission of NIST. © NIST 2002.
6.7.3 McLafferty Rearrangement of Aromatic Hydrocarbons
In addition to the already described benzylic and phenylic cleavages (Chap. 6.4),phenylalkanes may undergo alkene loss by a mechanism that is perfectly analo-gous to the “true” McLafferty rearrangement, provided the alkyl substituent ful-fills all requirements. The -hydrogen is transferred to the ortho-position wherethe aromatic ring serves as the accepting double bond:
+. R
HH
.
+ HH
+
.
m/z 92
+
R
1,5-H .-cleavage
H
R
Scheme 6.41.
Independent of the alkyl substituent, [C7H8]+•, m/z 92, is obtained as the product
ion, provided there are no other substituents at the ring. The product is an isomerof toluene molecular ion, and as such it readily stabilizes by H• loss to yield theeven-electron [C7H7]
+ species, m/z 91, which then gives rise to the well-knowncharacteristic fragments (m/z 65, 39). Provided that there is no prior isomerizationof the molecular ion, this dissociation is prohibited if both ortho-positions are sub-stituted and/or if there is no -hydrogen in the alkyl group.
Example: The base peak in the EI mass spectrum of (3-methylpentyl)-benzeneis formed by McLafferty rearrangement of the molecular ion (Fig. 6.28). As longas pentene loss may occur, there is not much difference to spectra of other isomerssuch as 2-methylpentyl-, 4-methylpentyl, or n-hexyl. Reference spectra are neededto distinguish those isomers, because differences are mainly due to peak intensi-ties, whereas only minor peaks might appear or vanish depending on the isomer.

272 6 Fragmentation of Organic Ions and Interpretation of EI Mass Spectra
Fig. 6.28. EI mass spectrum of (3-methylpentyl)-benzene. McLafferty rearrangement andbenzylic cleavage are clearly dominating. In the low-mass range carbenium ions and the“aromatic fragments” are present. Spectrum used by permission of NIST. © NIST 2002.
In case of alkyl benzylethers, aldehyde loss can occur following the same reac-tion pathway. For example, acetaldehyde is eliminated from the molecular ions ofbenzylethylether, thus producing [C7H8]
+• fragment ions. Again, evidence hasbeen presented for a stepwise mechanism involving a distonic intermediate. [96]
From the above mechanism, non-hydrogen substitutents at the ortho positionsof the aryl are expected to suppress the McLafferty rearrangement from alkyl-benzenes. However, the site-specific -H rearrangement is even observed in alkyl-benzenes in which both ortho positions are methyl substituted. Studies of a seriesof trimethyl- and tetramethylisopentylbenzenes showed that this rearrangement isonly suppressed to a significant degree in those compounds where hydrogens areabsent ortho and para to the isopentyl group. D-labeling confirmed the -site-specific origin of the migrating hydrogen. [97]
6.7.4 McLafferty Rearrangement with Double Hydrogen Transfer
Alkene loss via McLafferty rearrangement at the alkoxy group of aliphatic andaromatic carboxylic acid esters competes with yet another reaction path, wheretwo hydrogens instead of one as in the “normal McLafferty product” are trans-ferred to the charge site. This second pathway leading to alkenyl loss has earlybeen noticed [94] and became known as McLafferty rearrangement with doublehydrogen transfer (r2H):
[R1COOR2] r2H [R1C(OH)2] + [R2-2H]+. + .
Scheme 6.42.
Labeling studies indicate that this process is by far not as site specific as itsbetter known counterpart, however even this pathway lacks the high -specificitywhen occurring at the alkoxy group [95,98,99] Interestingly, both McLafferty re-arrangement with single and with double hydrogen transfer remain unaffected

6.7 McLafferty Rearrangement 273
even if the ester molecule serves as ligand in a transition-metal complex such as6-benzoic acid n-propyl ester tricarbonylchromium, for example. [99]
Based on thermochemical data, evidence has been presented for a two-stepmechanism that finally yields a protonated carboxylic acid and the radical. How-ever, while the final products are well described, the second step has not fullybeen elucidated: [100,101]
+O
OR1
H R2
H
+.O
O
H
R1
R2
H
C2H2R2+ .
O
OH
R1
H
+
1,5-H. .1,3-H.
.
O
OR1
H
H
+ R2
+
Scheme 6.43.
Studying the competition of McLafferty rearrangement either with charge re-tention or charge migration and double hydrogen transfer has revealed that ion-neutral complex intermediates (Chap. 6.12) can also play a role for the latter twoprocesses. [102]
Example: The competition of alkene and alkenyl loss is demonstrated by thepresence of peaks at m/z 122 (McL) and 123 (r2H) in the EI mass spectrum of iso-propyl benzoate (Fig. 6.29). [101] Of course, both primary fragmentations arecompeting with the predominating -cleavage at the carbonyl group yielding thehighly characteristic benzoyl ion, [C7H5O]+, m/z 105. [103] The benzoyl ion, es-sentially an aromatic acylium ion, dissociates by CO loss to yield the phenyl ion,m/z 77, and finally by C2H2 loss the cyclobutadienyl ion, m/z 51 (Chap. 6.4.2).
Fig. 6.29. EI spectrum of isopropyl benzoate. Used by permission of NIST. © NIST 2002.

274 6 Fragmentation of Organic Ions and Interpretation of EI Mass Spectra
O
O
OH
O O
O
OH
H
McL
-C3H6 - OH
r2H
- C3H5
rH
- H2O
- OC3H7
m/z 122 m/z 105
m/z 77
m/z 51m/z 123
M = 164
+. +.+
+
+.
- CO
- C2H2
[C6H5]
[C4H3]
+
+
.
.
.
Scheme 6.44.
Note: The ion series m/z 51, 77, 105 is a reliable indicator for benzoyl sub-structures, e.g., from benzaldehyde, benzoic acid and its derivatives, acetophe-none, benzophenone etc. Different from benzylic compounds, the peaks atm/z 39, 65, and 91 are almost absent. If a peak at m/z 105 and the complete se-ries m/z 39, 51, 65, 77, 91 are present, this strongly points towards the compo-sition [C8H9]
+, and thus to phenylalkanes. In case of doubt, HR-MS is themethod of choice for their differentiation.
Fig. 6.30. EI mass spectra of dipentyl terephthalate (a) and a deuterated isotopomer (b).Adapted from Ref. [86] with permission. © John Wiley & Sons, 1985.

6.7 McLafferty Rearrangement 275
Example: The molecular ion of dipentyl terephthalate either fragments by -cleavage to yield the [M–RO]+ fragment ion, m/z 219, or by double hydrogentransfer causing the m/z 237 peak (Fig. 6.30). It is worth noting that there is nosignal due to McLafferty rearrangement as might be expected at first sight. Evenmore interestingly, both of the above fragments are capable of pentene loss whichis detected at m/z 149 and 167, respectively. This indicates that they may undergoMcLafferty rearrangement although being even-electron ions. [86] The spectrumof the deuterium-labeled isotopomer reveals that there is no hydrogen scramblingpreceding the -cleavage, because the peak is completely shifted by 2 u to highermass, m/z 221. The rearrangement, on the other hand, causes two peaks, one cor-responding to r2H , m/z 239, and one corresponding to rHD, m/z 240.
6.7.4.1 Double Hydrogen Transfer of Phthalates
The fragment ions at m/z 149, [C8H5O3]+, and 167, [C8H7O4]
+, are especiallyprominent in the EI spectra of phthalates. The formation of the [C8H5O3]
+ ion hasinitially been attributed to a McLafferty rearrangement followed by loss of an alk-oxy radical and final stabilization to a cyclic oxonium ion. [104] However, it hasbeen revealed that four other pathways in total lead to its formation excluding theabove one. [105,106] The two most prominent fragmentation pathways are:
O
O
OR
O
H R'OH
OH
OR
O
- OCH2CH2R'
OH
O
O
r2H
-
+.
m/z 149
+
+
.C2H2R'
+O
OH
O
HO
R
O
O
R
O
+
+O
OR
O
Oncycl.
cycl.
.
- (R-H)
m/z 167
+
On-(R-H)
- H2O
OH
OH
O
OH
-H2O
Scheme 6.45.
Note: Phthalates, especially di-2-ethylhexyl phthalate (also known as dioctylphthalate, DOP), are commonly used plasticizers in synthetic polymers. Un-fortunately, they are extracted from the polymer upon exposure to solvents suchas dichloromethane, chloroform or toluene, e.g., from syringes, tubing, vialsetc. Therefore, they are often detected as impurities. They are easily recognizedfrom their peaks at m/z 149 (often base peak), m/z 167, and [M–(R–2H)]+
(m/z 279 in case of DOP). The molecular ion is often absent in their EI spectra.

276 6 Fragmentation of Organic Ions and Interpretation of EI Mass Spectra
6.8 Retro-Diels-Alder Reaction
6.8.1 Properties of the Retro-Diels-Alder Reaction
Molecular ions containing a cyclohexene unit may fragment to form conjugateddi-olefinic (diene) and mono-olefinic (ene) products. This fragmentation pathwaywas first recognized by Biemann as formally analogous to the retro-Diels-Alder(RDA) reaction of neutrals in the condensed phase. [81] The fragmentation can inprinciple proceed in a concerted manner (a) or stepwise, i.e., it can be regarded asa double -cleavage with the first being an allylic cleavage (b):
+.
+
.
+ . +
.+
a
b
concerted
M = 82 m/z 54 28 u+.
+ .+
Scheme 6.46.
Note: The McLafferty rearrangement and the RDA reaction have several fea-tures in common: i) both belong to the rearrangement type of fragmentations,although the name conceals this fact in case of the latter, ii) both representpathways for alkene loss from molecular ions, and iii) both are highly versatilein structure elucidation.
Fig. 6.31. EI mass spectrum of 3,5,5-trimethylcyclohexene. The molecular ion undergoesisobutene loss, 56 u, via RDA reaction yielding the base peak at m/z 68, which is also theonly significant peak at even-numbered m/z. The charge migration product at m/z 42 is oflow intensity. Spectrum used by permission of NIST. © NIST 2002.

6.8 Retro-Diels-Alder Reaction 277
As most ion dissociations, the RDA reaction is endothermic, e.g., by185 kJ mol–1 in case of ethene loss from cyclohexene molecular ion. [107] Thecharge usually resides at the diene fragment, but the ene fragment is also fre-quently observed in the mass spectra (Fig. 6.31). The fraction of charge retentionand charge migration products has been studied. [108] As may be expected, com-petition for the charge is greatly influenced by the substitution pattern of the cy-clohexene derivative and by the presence or absence of heteroatoms in the respec-tive fragments.
RDA+.+.
+
+
+.
56 u m/z 68
m/z 56 68 u
RDA
M = 124+.
Scheme 6.47.
Provided the double bond does not migrate prior to RDA reaction, the alkeneloss is perfectly regiospecific, and it does not really suffer from extensive substi-tution at the cyclohexene unit. Thus, substitution patterns can be revealed from themass spectrum (a). The RDA reaction also proceeds independent of whether thesix-membered ring contains heteroatoms or not (b):
R6
R3
R1
R2 R4
R5
+.+.
+RDA B
AD
B
AD
+. +.
RDA
R6
R3
R1
R2 R4
R5
+
a
b
Scheme 6.48.
Obviously, the RDA reaction has the potential needed for a widespread massspectral fragmentation, and consequently, its analytical and mechanistical aspectshave repeatedly been reviewed. [107,109,110]
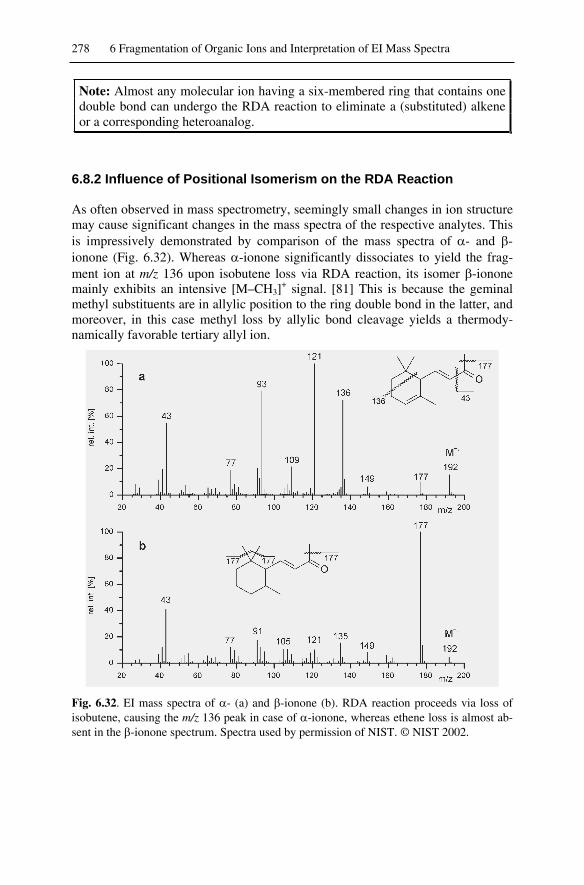
278 6 Fragmentation of Organic Ions and Interpretation of EI Mass Spectra
Note: Almost any molecular ion having a six-membered ring that contains onedouble bond can undergo the RDA reaction to eliminate a (substituted) alkeneor a corresponding heteroanalog.
6.8.2 Influence of Positional Isomerism on the RDA Reaction
As often observed in mass spectrometry, seemingly small changes in ion structuremay cause significant changes in the mass spectra of the respective analytes. Thisis impressively demonstrated by comparison of the mass spectra of - and -ionone (Fig. 6.32). Whereas -ionone significantly dissociates to yield the frag-ment ion at m/z 136 upon isobutene loss via RDA reaction, its isomer -iononemainly exhibits an intensive [M–CH3]
+ signal. [81] This is because the geminalmethyl substituents are in allylic position to the ring double bond in the latter, andmoreover, in this case methyl loss by allylic bond cleavage yields a thermody-namically favorable tertiary allyl ion.
Fig. 6.32. EI mass spectra of - (a) and -ionone (b). RDA reaction proceeds via loss ofisobutene, causing the m/z 136 peak in case of -ionone, whereas ethene loss is almost ab-sent in the -ionone spectrum. Spectra used by permission of NIST. © NIST 2002.

6.8 Retro-Diels-Alder Reaction 279
6.8.3 Is the RDA Reaction Stepwise or Concerted?
It has been shown that certain unsaturated cyclic diketones readily decompose viaRDA reaction if they are cis at the central ring junction, but not if trans (Sche-me 6.49a) It was pointed out that this behavior would be expected if the massspectral RDA reaction is concerted and follows symmetry rules analogous to thoseestablished for thermal reactions. [111]
On the other hand, the extent to which RDA reactions occur among various ste-reoisomeric bicyclic 2-alkenes does not much depend on the stereochemistry ofthe ring juncture (Scheme 6.49b). These results were interpreted in terms of RDAreactions that do not follow orbital symmetry rules established for thermal reacti-ons, and therefore rather proceed in a step-wise fashion. [112]
In summary, the actual structure of the molecular ion seems to exert strong ef-fects on the RDA process in that it may be rather stepwise than concerted or viceversa. A detailed discussion of this issue taking thermochemical and theoreticalchemistry data into account has been published by Ture ek and Hanuš. [107]
O
O
O
Ocis trans
RDA
+.O
O
+.+.
+
+
+. +.R RR
R
RDA
+.
RDA
transcis
R
R
RR
RR
R
R
a
b
Scheme 6.49.
6.8.4 RDA Reaction in Natural Products
The RDA reaction is often observed from steroid molecular ions, and it can bevery indicative of steroidal structure. [107,110,113,114] The extent of the RDAreaction depends on whether the central ring junction is cis or trans. The massspectra of 7-steroidal olefins, for example, showed a marked dependence uponthe stereochemistry of the A/B ring juncture, in accordance with orbital symmetryrules for a thermal concerted process. In the trans isomer the RDA is much re-duced as compared to the cis isomer. The effect was shown to increase at 12 eV,and as typical for a rearrangement, the RDA reaction became more pronounced,whereas simple cleavages almost vanished. This represented the first example ofsuch apparent symmetry control in olefinic hydrocarbons. [114].

280 6 Fragmentation of Organic Ions and Interpretation of EI Mass Spectra
The RDA reaction is also a typical process of flavones, naphthoflavones, andmethoxynaphthoflavones. [115] In many cases it provides intact A- and B-ringfragments, and therefore, it is of high relevance for structure elucidation. The in-tensity ratio of A- to B-ring fragments was found to be strongly influenced by thesubstituent position, i.e., to be very sensitive to the charge distribution within themolecular ion. [116]
+.
HO
RDA
HO
+.
+
A B
C
A B
C
[M-124] 124 u+.
D
E
E
Scheme 6.50.
6.8.5 Widespread Occurrence of the RDA Reaction
Any molecule that can at least formally be synthesized by a Diels-Alder reactionis a potential candidate for the mass spectral RDA reaction. In addition, the RDAreaction is not restricted to positive radical ions, but it may also occur from even-electron ions as well as from negative radical ions, M–•. These findings remind usof the fact that ionic reactions are determined by the intrinsic properties and theinternal energy of the ions, and thus only indirectly by the ionization techniqueused for their creation.
Example: Certain [60]fullerene derivatives can be regarded as formal Diels-Alder adducts of [60]fullerene with cyclopentadienes. Their positive as well asnegative radical ions undergo RDA reaction at extremely high rates making thedetection of a molecular ion very difficult. Instead, C60
+• and C60–• are detected, re-
spectively. [117,118] However, using negative-ion FAB or MALDI under care-
RDAC60 +
C58
C58 RDA
X = Br, OH
m/z 720
_ .
_ .
_ .
Xa
b
X
X
Scheme 6.51.

6.9 Elimination of Carbon Monoxide 281
fully controlled conditions allows for the detection of M–• and the RDA prod-uct (a). Removal of the double bond by hydration causes this fragmentation path-way to vanish (b) and allows for the detection of intense molecular anions. [117]
6.9 Elimination of Carbon Monoxide
As we know by now, the elimination of small stable molecules represents a fre-quent fragmentation route of odd- and even-electron ions. Second to alkene loss,we shall consider some of the numerous pathways for loss of carbon monoxide,CO. Here, the situation is quite different from that in the preceding sections, be-cause there is no single mechanism for the elimination of CO. Instead, a wide va-riety of molecular and fragment ions can undergo loss of CO. Therefore, the fol-lowing section is rather a compound-specific view in the general context of COloss than a collection of compounds exhibiting a certain reaction mechanism incommon. In retrospect, we have already encountered some cases of CO loss(Chap. 6.2.4.2 and 6.7.4).
6.9.1 CO Loss from Phenols
Phenols exhibit a strong molecular ion peak which often represents the base peakin their spectra. The most characteristic fragment ions of phenols are caused byloss of carbon monoxide, CO, from the molecular ion, [119] and subsequent H•
loss, thereby giving rise to [M–28]+• and [M–29]+ ions, respectively (Fig. 6.33).To these ions the compositions [M–CO]+• and [M–CHO]+ have been assigned byHR-MS. [120] This at first sight unexpected fragmentation proceeds via ketoniza-tion of the molecular ion prior to elimination of CO. The mechanism that can berationalized in analogy to the behavior of neutral phenol, e.g., in the Reimer-Tiemann condensation, [121] has been verified by D-labeling. These experimentsalso revealed that only about one third of the H• cleaved off from the cyclopenta-diene ion, m/z 66, originates from the former OH, whereas the majority comesfrom the ring. [122]
+. OH
H
+.
- CO
M = 94 m/z 66
+.
+
m/z 65
- H .
OH
+.
Scheme 6.52.

282 6 Fragmentation of Organic Ions and Interpretation of EI Mass Spectra
Fig. 6.33. EI mass spectrum of phenol showing an intensive peak due to CO loss at m/z 66.Spectrum used by permission of NIST. © NIST 2002.
Note: The above mechanism of CO loss from phenols is perfectly analogous toHCN loss from aniline and other aminoarenes (Chap. 6.14.2).
6.9.1.1 Substituted Phenols
Alkylphenol molecular ions preferably dissociate by benzylic bond cleavage, e.g.,[M–H]+ ions are observed in case of methylphenols. Provided a -hydrogen isavailable in alkyl substituents of sufficient chain length, the benzyclic bond cleav-age competes with the McLafferty rearrangement, [123] the product ion of thisbeing an isomer of methylphenol molecular ion. Loss of H• from the latter yields a[C7H7O]+ ion, m/z 107, that may dissociate further by CO loss, thus forming aprotonated benzene ion, [C6H7]
+, m/z 79. This tells us that CO loss occurs equallywell from even-electron phenolic ions.
R
OH OH
CH2H
H
OH
CH2
- R
- R.
- H .
+
+. +.
benzylic
McL
C6H7+
- CO
m/z 107 m/z 79
+.CH3
OH
.- H
benzylic
C6H5+
- H2
m/z 77
Scheme 6.53.

6.9 Elimination of Carbon Monoxide 283
Example: Ethyl loss clearly predominates methyl loss in the EI mass spectrumof 2-(1-methylpropyl)-phenol. It proceeds via benzylic bond cleavage, the prod-ucts of which are detected as the base peak at m/z 121 and m/z 135 (3 %), respec-tively (Fig. 6.34a). The McLafferty rearrangement does not play a role, as thepeak at m/z 122 (8.8 %) is completely due to the 13C isotopic contribution to thepeak at m/z 121. From the HR-EI spectrum (Fig. 6.34b) the alternative pathwayfor the formation of a [M–29]+ peak, i.e., [M–CO–H]+, can be excluded, becausethe measured accurate mass of this singlet peak indicates C8H9O
+. HR-MS dataalso reveal that the peak at m/z 107 corresponds to [M–CH3–CO]+ and that the oneat m/z 103 corresponds to [M–C2H5–H2O]+. Although perhaps unexpected, theloss of H2O from phenolic fragment ions is not unusual.
Fig. 6.34. LR- (a) and HR-EI (b) mass spectra of 2-(1-methylpropyl)-phenol. The elemen-tal compositions as obtained from accurate mass measurement are directly attached to thecorresponding peaks. Peaks with small-lettered labels belong to PFK and residual air usedfor internal mass calibration (Chap. 3.3).
6.9.2 CO and C2H2 Loss from Quinones
Quinones [124] and aromatic ketones such as flavones, [116] fluorenone, anthra-quinone, and similar compounds [121] dissociate by competing and consecutivelosses of CO and C2H2. Multiple CO losses may also occur subsequent to theRDA reaction of flavones. [116,125] As these molecules all have large -electron

284 6 Fragmentation of Organic Ions and Interpretation of EI Mass Spectra
systems to stabilize the charge, they all show intensive molecular ion peaks thatoften represent the base peak in those spectra. Typically any available carbonylgroup is expelled as CO in the course of complete dissociation of the molecularion; sometimes CO first, sometimes alternating with C2H2 loss. This gives rise tocharacteristic fragment ions resulting from sequences such as [M–28–26–28]+• or[M–28–26–26]+•.
Example: 1,4-Benzoquinone represents the perfect prototype of this fragmen-tation pattern. The subsequent eliminations of intact molecules causes a seriescomprising of odd-electron fragment ions only (Fig. 6.35).
+.
+.
- CO
m/z 82 m/z 54 m/z 26
M = 108 m/z 80 m/z 52
+.+.
+.
+.
+.
- C2H2- C2H2- C2H2
C2H2- CO
- CO- CO
OO
O
O
O
O
Scheme 6.54.
Fig. 6.35. EI mass spectrum of 1,4-benzoquinone. Spectrum used by permission of NIST.© NIST 2002.
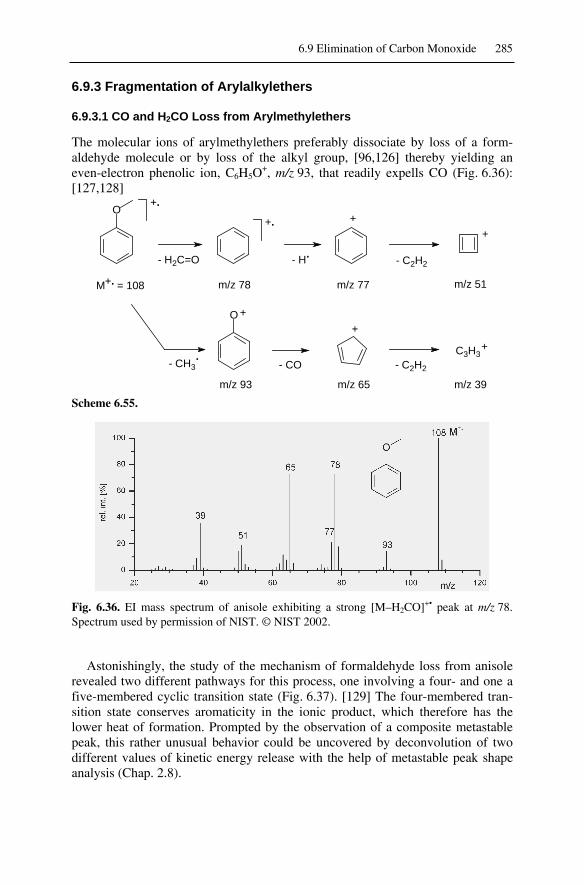
6.9 Elimination of Carbon Monoxide 285
6.9.3 Fragmentation of Arylalkylethers
6.9.3.1 CO and H2CO Loss from Arylmethylethers
The molecular ions of arylmethylethers preferably dissociate by loss of a form-aldehyde molecule or by loss of the alkyl group, [96,126] thereby yielding aneven-electron phenolic ion, C6H5O
+, m/z 93, that readily expells CO (Fig. 6.36):[127,128]
O
O
+.
- H2C=O
+.
- H
m/z 65
- CO
+
- C2H2
+
m/z 78 m/z 77 m/z 51M = 108+.
- CH3.
+
- C2H2
C3H3+
m/z 39m/z 93
.
+
Scheme 6.55.
Fig. 6.36. EI mass spectrum of anisole exhibiting a strong [M–H2CO]+• peak at m/z 78.Spectrum used by permission of NIST. © NIST 2002.
Astonishingly, the study of the mechanism of formaldehyde loss from anisolerevealed two different pathways for this process, one involving a four- and one afive-membered cyclic transition state (Fig. 6.37). [129] The four-membered tran-sition state conserves aromaticity in the ionic product, which therefore has thelower heat of formation. Prompted by the observation of a composite metastablepeak, this rather unusual behavior could be uncovered by deconvolution of twodifferent values of kinetic energy release with the help of metastable peak shapeanalysis (Chap. 2.8).

286 6 Fragmentation of Organic Ions and Interpretation of EI Mass Spectra
Fig. 6.37. Energetics of formaldehyde loss from anisole. The inset shows the compositemetastable peak due to two different amounts of kinetic energy release. Adapted from Ref.[129] with permission. © American Chemical Society, 1973.
6.9.3.1 CO and Alkene Loss from Arylalkylethers
In case of longer chain alkyl substituents, alkene loss can occur analogous to theMcLafferty rearrangement as is observed from suitably substituted phenylalkanes(Chap. 6.7.3), e.g., ethene loss from phenetole and its derivatives (Fig. 6.38). [126]
Fig. 6.38. EI mass spectrum of 4-chlorophenetole. The chlorine isotopic pattern is found inthe signals corresponding to M+•, m/z 156, [M–C2H4]
+•, m/z 128, [M–OEt]+, m/z 111, and[M–C2H4–CO]+•, m/z 100. Spectrum used by permission of NIST. © NIST 2002.

6.9 Elimination of Carbon Monoxide 287
O
H
Cl
HH
O
Cl
+.
m/z 100/102
- CO
H H+.+.
Cl
M = 156/158 m/z 128/130 m/z 65
- C2H4
McL
- Cl .
+.
Cl- OC2H5
.
+
m/z 111/113
C6H3+
- HCl
m/z 75
phenylic
+
Scheme 6.56.
6.9.4 CO Loss from Transition Metal Carbonyl Complexes
Transition metal carbonyl complexes successively eliminate all CO ligands uponelectron ionization until the bare metal remains. Pure carbonyl complexes as wellas many other complexes with carbonyl ligands can therefore be readily identifiedfrom their characteristic CO losses which are – dependent on the metal – often ob-served in combination with the eye-catching isotopic pattern of the respectivemetal (Fig. 6.39). According to 13C-labeling experiments, extensive isomerizationmay precede the dissociation of the carbonyl complexes. [130] Furthermore, thedifferent bond strength of the M–CO bond in heterometallic transition-metal di-mers can be deduced from the mass spectral fragmentation pattern of the carbonylcomplexes, e.g., selective 12CO loss from Mn in [Mn(CO)5Re(13CO)5] has beeninterpreted in terms of stronger Re–CO bonds. [131]
Fig. 6.39. EI mass spectrum of hexacarbonylchromium. All six CO ligands are eliminateduntil the bare metal ion, m/z 52, remains. The isotopic pattern of chromium can well be rec-ognized from the more intensive signals. Used by permission by NIST. © NIST 2002.

288 6 Fragmentation of Organic Ions and Interpretation of EI Mass Spectra
6.9.5 CO Loss from Carbonyl Compounds
A molecule of CO may also be eliminated from malonates, [132] -keto esters,[133] phenoxyacetates, [134] and many other compounds containing similarstructural features.
Loss of CO from the molecular ions of anisoyl fluorides, [CH3OC6H4COF]+•,involves fluorine atom migration from the carbonyl group to the benzene ring.[135,136] In o- and p-anisoyl fluorides, the fluorine atom migrates via a three-membered transition state to form molecular ions of o- and p-fluoroanisoles,[CH3OC6H4F]+•, respectively. In the case of m-anisoyl fluoride, the fluorine atommigrates to the benzene ring via a three- or four-membered transition state.
Whatever the mechanism of CO loss might be, in none of the above cases COloss proceeds by a simple bond cleavage. Instead, multistep rearrangements arenecessary to “cut” the CO moiety out of the precursor ion.
Note: The detection of CO loss from molecular or fragment ions usually indi-cates the presence of carbonyl groups. However, it is less indicative of mo-lecular structure than the highly specific reactions discussed before, because amultitude of rearrangement processes can be effective. These might even leadto CO loss in cases where no carbonyl group exists, e.g., from phenols.
6.9.6 Differentiation Between Loss of CO, N2, and C2H4
Carbon monoxide, CO, 27.9949 u, is a nominal isobar of ethene, C2H4, 28.0313 u,and nitrogen, N2, 28.0061 u, and the separation of these gases themselves bymeans of HR-MS has already been described (Chaps. 3.3.1 and 3.3.4). Accord-ingly, the difference in accurate mass for a given pair of peaks can be used to de-cide which of these neutrals has been eliminated, e.g., we employed HR-MS touniquely identify the [M–29]+ peak from 2-(1-methylpropyl)-phenol as [M–C2H5]
+
(Chap. 6.9.1). The elimination of N2, CO, and/or C2H4 can even occur on con-secutive and competing fragmentation pathways from the very same analyte. [137]
Example: The molecular ion of ethyl-trans-3-methyltetrazole-5-acrylate,[C7H10O2N4]
+•, m/z 182.0798, exhibits two fragmentation sequences involving lossof N2, C2H4, and/or CO, in different order. This way, isobaric fragment ions atm/z 98 and 126 are formed that could not be distinguished by LR-MS. HR-MS re-veals both signals are doublets and allows the deconvolution of the two competingpathways (Table 6.14). [137]
Note: In case of doubt which neutral loss(es) are effective, it is highly recom-mended to obtain HR-MS data to avoid ambiguities. Moreover, the differencesin accurate mass for a given pair of peaks can be used to identify the neutralloss even though the composition of the ions themselves might still be un-known.

6.10 Thermal Degradation Versus Ion Fragmentation 289
Table 6.14. Example of the differentiation of isobaric neutral losses
Peak Sequence a) Sequence b)
singlet
M+• = 182.0798 – N2
154.0737 – N2 – C2H4
doublet 126.0675 (10 %) 126.0424 (90 %) – C2H4 – CO
doublet 98.0362 (61 %) 98.0475 (39 %)
6.10 Thermal Degradation Versus Ion Fragmentation
Processes such as decarbonylation, decarboxylation, elimination of water, andseveral other reactions may also occur prior to ionization, i.e., as non-mass spec-tral reactions, typically as a result of thermal degradation upon heating of the sam-ple to enforce evaporation. In such a case, the mass spectrum obtained is not thatof the analyte itself, but of its decomposition product(s). Sometimes, those thermalreactions are difficult to recognize, because the same neutral loss may also occurby a true mass spectral fragmentation of the corresponding molecular ion.
In even more disadvantageous circumstances, the thermal decomposition doesnot yield a single defined product, but a complex mixture that results in almostuseless spectra, e.g., in case of highly polar natural products such as saccharides,nucleotides, and peptides or in case of ionic compounds such as organic salts ormetal complexes.
6.10.1 Decarbonylation and Decarboxylation
Thermal degradation prior to ionization can cause decarbonylation or decarboxy-lation of the analyte. Decarbonylation, for example, is observed from -ketocarboxylic acids and -ketocarboxylic acid esters, whereas decarboxylation istypical behavior of -oxocarboxylic acids such as malonic acid and its derivativesand di-, tri-, or polycarboxylic acids.
6.10.2 Retro-Diels-Alder Reaction
The Diels-Alder reaction is reversible at elevated temperature, and therefore itsproducts can decompose prior to evaporation by RDA reaction of the neutral inthe condensed phase. The mass spectral RDA reaction has already been discussedin detail (Chap. 6.8).

290 6 Fragmentation of Organic Ions and Interpretation of EI Mass Spectra
6.10.3 Loss of H2O from Alkanols
6.10.3.1 Thermal H2O Loss
Aliphatic alcohols show a strong tendency to thermally eliminate a water mole-cule. This is of special relevance if volatile alkanols are introduced via the refer-ence inlet system or by means of a gas chromatograph. Then, the mass spectra cor-respond to the respective alkenes rather than to the alkanols that were intended tobe analyzed. The water is often not detected, simply because mass spectra are fre-quently acquired starting from m/z 40 to omit background from residual air.
6.10.3.2 Loss of H2O from Alkanol Molecular Ions
Interestingly, the molecular ions of alkanols also exhibit a strong tendency to H2Oloss, [32,138-140] which is their second important fragmentation route in additionto -cleavage (Chap. 6.2.5). It has been demonstrated that the large majority ofH2O loss from the molecular ion proceeds by 1,4-elimination, whereas only somepercent of H2O loss are due to other 1,x-eliminations. Following the labeling re-sults, a cyclic intermediate can be assumed that decomposes further by loss of eth-ene. [139] These findings are not only supported by deuterium labeling studies butalso by the fact that H2O loss does play a less important role in the mass spectra ofmethanol, ethanol, and the propanols:
ROH
H R R R
- H2O - C2H4
M [M-18] [M-46]
or
+. +. +.
+.4
1
+.4 1
+. +.4
4 13
Scheme 6.57.
Example: The EI mass spectra of 1-hexanol, Mr = 102, and 1-hexene, Mr = 84,show close similarity because the molecular ion peak is absent in the mass spec-trum of hexanol (Fig. 6.40). However, a more careful examination of the hexanolspectrum reveals peaks at m/z 18, 19, 31, and 45 that are absent in the hexenespectrum. These are due to H2O
+•, H3O+, and to oxonium ions (H2C=OH+ and
H3CCH=OH+ in this case) which are reliable indicators of aliphatic alcohols andethers (Table 6.8).
In addition to the observation of oxonium ions, alkanols may occasionally beidentified from the occurrence of a seemingly [M–3] peak while the molecular ionis absent (Fig. 6.41). The unusual difference of 3 u results from neighboring [M–CH3]
+ and [M–H2O]+• peaks. In these cases, a [M–33] peak indicates consecutivelosses of CH3
• and H2O in either order, i.e., [M-H2O-CH3]+ and [M-CH3-H2O]+.
(Chap. 6.6.4). Alternatively, the sequence of [M–H2O]+• and [M–H2O–C2H4]+•
may occur.

6.10 Thermal Degradation Versus Ion Fragmentation 291
Fig. 6.40. Comparison of the EI mass spectra of 1-hexanol, Mr = 102 (a) and 1-hexene,Mr = 84 (b). Spectra used with permission by NIST. © NIST 2002.
Fig. 6.41. EI mass spectrum of 2-hexanol, Mr = 102. Spectrum used with permission byNIST. © NIST 2002.
6.10.4 EI Mass Spectra of Organic Salts
Ammonium, phosphonium, oxonium salts and the like cannot be evaporated with-out substantial or complete decomposition, and thus it is not useful to employ EI-

292 6 Fragmentation of Organic Ions and Interpretation of EI Mass Spectra
MS for their characterization. Nevertheless, if a sample that happens to be an or-ganic salt has incidentally been analyzed by EI-MS, it is helpful to know abouttheir recognition. The EI mass spectra usually appear to result from the corre-sponding amines, phosphines, or ethers, but fortunately, the anion cannot hide per-fectly from us.
Example: The EI mass spectrum of tetrabutylammonium iodide shows a peakof low intensity (0.6 %) for the [Bu4N]+ ion, m/z 242. A “molecular ion” of the saltthat eventually might occur at m/z 369 is not observed. The majority of the sampledecomposes and the spectrum closely resembles that of pure tributylamine show-ing its molecular ion peak at m/z 185 (the fragmentation of which is explained inChap. 6.11.1). A closer look, however, reveals the existence of peaks at m/z 127and 128 corresponding to I+ and HI+•, respectively (Fig. 6.42).
57100
142
185
184242
4129
86
m/z
rela
tive
inte
nsit y
[%]
* 20
127
[Bu4N]+ I-
Bu4N+
Bu3N+.
Fig. 6.42. EI mass spectrum of tetrabutylammonium iodide. The intensity scale is 20foldabove m/z 220, i.e., disregarding the peaks at m/z 127 and 128 this spectrum is very similarto the mass spectrum of pure tributylamine (Fig. 6.43b; for the field desorption mass spec-trum cf. Chap. 8.5.3).
6.11 Alkene Loss from Onium Ions
Aliphatic onium ions such as immonium, oxonium, and sulfonium ions have beenintroduced as even-electron ionic products of the -cleavage occurring from mo-lecular ions of amines, alcohols, and ethers or thiols and thioethers, respectively(Chap. 6.2.5). All these and analogous onium ions are capable of further frag-mentation reactions, the majority of which are alkene losses [141] yielding frag-ments of high relevance for structure elucidation.
The first of these reactions requires a -hydrogen, and thus at least one C3-alkylsubstitutent. It may either be regarded as the even-electron analogy of the McLaf-ferty rearrangement (McL, Chap. 6.7) as it will be treated here, [85,86,142] or al-ternatively, as a retro-ene reaction. [143,144]
The second alkene loss can occur from any onium ion bearing at least one C2-alkyl moiety, which obviously is the least demanding prerequisite for an alkene

6.11 Alkene Loss from Onium Ions 293
loss (ethene) to proceed. By this process, the whole substituent is cleaved off theheteroatom with concomitant non-specific hydrogen transfer from the leavinggroup to the heteroatom. [30,33] In accordance with its occurrence from oniumions, this alkene loss is sometimes termed onium reaction (On). [4,6,145-148]Thus, we obtain the following general fragmentation scheme for alkene lossesfrom suitably substituted onium ions:
XR2
R1 R3
H
R1, R2, R3 = H, alkyl, aryl
X = N, P
R1, R2 = H, alkyl, aryl
X = O, S, (Se)
- C2H4
On1X
HR2
R1 R3
+
+
McL
-R3
R3
On2
-
+X
R2
R1 H
+X
R2
R1
-
On2
R2
R2-
McL
- C2H4
X R2
R1
H
+
+
+
+
X R2
R1 H
XH
R1
X
R1
H
H
On1
Scheme 6.58.
6.11.1 McLafferty Rearrangement of Onium Ions
The McLafferty rearrangement of onium ions is accompanied by the same 100 %regioselectivity for -H transfer as is observed for odd-electron ions which has re-peatedly been demonstrated by deuterium labeling experiments.[142,145,147,149] This -selectivity also supports the general findings that immo-nium ions neither undergo random hydrogen nor carbon skeleton rearrangementsprior to fragmentation. [27,142,150] The generally observed inertness of oniumions towards isomerization which is in contrast to [CnH2n+1]
+ (Chap. 6.6.1) and[C2H2n–1]
+ ions (Chap. 6.5.1) can be attributed to the preferred charge localizationat the heteroatom. [151]

294 6 Fragmentation of Organic Ions and Interpretation of EI Mass Spectra
Although the origin of the moving hydrogen and the structures of the productions of the McLafferty rearrangement are well known, it is still a matter of debatewhether it is concerted (a) [144] or heterolytic stepwise (b) [142,145,149,152-154] or even might be stepwise involving homolytic bond cleavages (c): [146]
NR
H R
+
+N
R
H R
+N
R
H R1,5-H.
1,5-H-
concerted
+
NR
H R
R
+N
R
H
NR
H R
+
.
.
+
+NR
H
+
R
+NR
H
+
Ra
b
c
Scheme 6.59.
Whereas calculations seem to favor the concerted pathway, a large body of ex-perimental data is in perfect agreement with the heterolytic stepwise mecha-nism (b). The first step of this, a 1,5-hydride shift, can be understood in terms ofthe onium-carbenium ion resonance:
NR
H R
+N
R
H R+
Scheme 6.60.
The carbenium ion intermediate then eliminates the alkene by charge-inducedcleavage of a C–C bond. However, the most striking argument for a carbenium ionintermediate is presented by the influence of the -substituent R on the competi-tion of onium reaction and McLafferty rearrangement. If R = H, i.e., for propyl-substituted iminum ions, the products of both reactions exhibit similar abundance.If R = Me or larger or if even two alkyls are present, the McLafferty rearrange-ment becomes extremely dominant, because then its intermediate is a secondary ortertiary carbenium ion, respectively, in contrast to a primary carbenium ion inter-mediate in case of R = H. The importance of relative carbenium ion stability foronium ion fragmentations (Chap. 6.11.2) will become more apparent when dealingwith the mechanism of the onium reaction.
Note: Regardless of whatever the exact mechanism and regardless of whateverthe correct name, the McLafferty rearrangement of onium ions is one of thoseprocesses allowing to reliably track ionic structures through a mass spectrum.
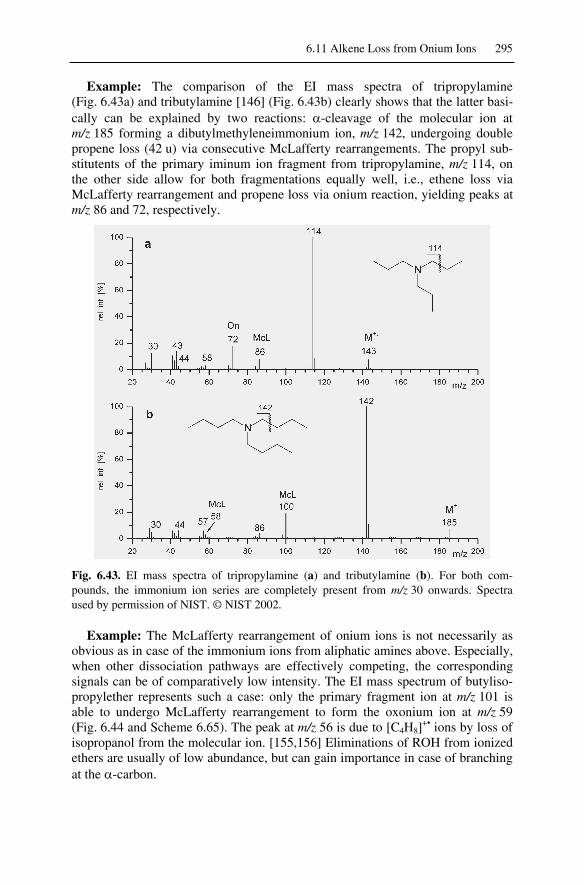
6.11 Alkene Loss from Onium Ions 295
Example: The comparison of the EI mass spectra of tripropylamine(Fig. 6.43a) and tributylamine [146] (Fig. 6.43b) clearly shows that the latter basi-cally can be explained by two reactions: -cleavage of the molecular ion atm/z 185 forming a dibutylmethyleneimmonium ion, m/z 142, undergoing doublepropene loss (42 u) via consecutive McLafferty rearrangements. The propyl sub-stitutents of the primary iminum ion fragment from tripropylamine, m/z 114, onthe other side allow for both fragmentations equally well, i.e., ethene loss viaMcLafferty rearrangement and propene loss via onium reaction, yielding peaks atm/z 86 and 72, respectively.
Fig. 6.43. EI mass spectra of tripropylamine (a) and tributylamine (b). For both com-pounds, the immonium ion series are completely present from m/z 30 onwards. Spectraused by permission of NIST. © NIST 2002.
Example: The McLafferty rearrangement of onium ions is not necessarily asobvious as in case of the immonium ions from aliphatic amines above. Especially,when other dissociation pathways are effectively competing, the correspondingsignals can be of comparatively low intensity. The EI mass spectrum of butyliso-propylether represents such a case: only the primary fragment ion at m/z 101 isable to undergo McLafferty rearrangement to form the oxonium ion at m/z 59(Fig. 6.44 and Scheme 6.65). The peak at m/z 56 is due to [C4H8]
+• ions by loss ofisopropanol from the molecular ion. [155,156] Eliminations of ROH from ionizedethers are usually of low abundance, but can gain importance in case of branchingat the -carbon.
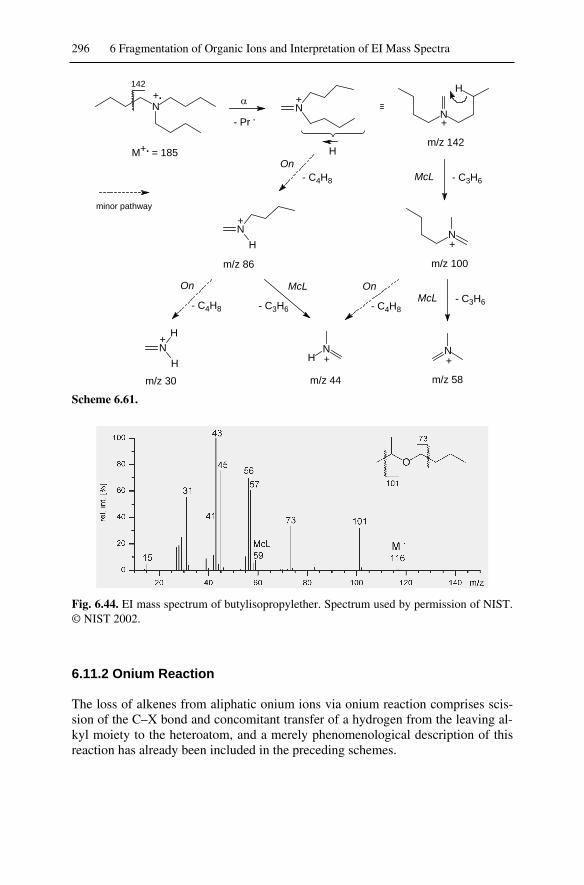
296 6 Fragmentation of Organic Ions and Interpretation of EI Mass Spectra
+N
N
H
+
142
N+.
H
+N
M = 185+. m/z 142
- Pr .
- C3H6
NH
+
- C4H8
m/z 100m/z 86
- C3H6
m/z 58
N+
m/z 44
NH +
m/z 30
+N
H
H
On
On On
McL
McLMcL
- C4H8 - C3H6 - C4H8
minor pathway
Scheme 6.61.
Fig. 6.44. EI mass spectrum of butylisopropylether. Spectrum used by permission of NIST.© NIST 2002.
6.11.2 Onium Reaction
The loss of alkenes from aliphatic onium ions via onium reaction comprises scis-sion of the C–X bond and concomitant transfer of a hydrogen from the leaving al-kyl moiety to the heteroatom, and a merely phenomenological description of thisreaction has already been included in the preceding schemes.

6.11 Alkene Loss from Onium Ions 297
Initially, the onium reaction was described to occur via -hydrogen transferfrom the leaving moiety to the nitrogen through a four-membered cyclic transitionstate. This assumption was mainly based on the reasoning that it could be ob-served for ethyl and larger substitutents. [33] Later, it was demonstrated by meansof deuterium labeling that in case of pentyl-substituted oxonium ions this hydro-gen does not exclusively originate from the -position, but also comes from -, -,and to lesser extent from -, and even -position. These results were interpreted interms of competing reaction pathways through cyclic transition states of variousring sizes. [30]
6.11.2.1 Mechanism of the Onium Reaction
The simple concepts of cyclic transition states cannot appropriately describe theonium reaction. Instead, this appearingly simple reaction has to be broken up intoa multi step process that involves ion-neutral complex (INC) intermediates. Theproperties of ion-neutral complexes are discussed in detail below (Chap. 6.12).Here, we restrict ourselves to the application of this concept to achieve a full andconsistent explanation of the behavior of onium ions. The onium reaction of im-monium ions [145,147,148,152,154,157-159] and oxonium ions [36,143,160-163]has been studied exhaustively. Imagine an isopropyl-propylmethyleneimmoniumion, m/z 114, where the reaction is initiated by heterolytic elongation of the C–Nbond (Scheme 6.62). Having passed the transition state, the reaction would nor-mally be expected to proceed by direct dissociation to yield a C3H7
+ ion, m/z 43(imine loss). Alternatively, the incipient propyl ion might stay with the imine, thusforming an ion-neutral complex INC1. The decision which of these channels willbe followed depends on the ion internal energy, i.e., the less energetic ions willprefer INC formation, whereas the highly excited ones are prone to dissociation.An INC can be regarded as the gas phase analog to solvation of ions in the con-densed phase. Here, the lone pair of the imine acts as a donor for the carbeniumion. As ion and neutral are mutually free and mainly held together by coulombicattraction, isomerization of the incipient 1-propyl ion to a 2-propyl ion via 1,2-hydride shift can take place. This goes along with a stabilization of about60 kJ mol–1 (Table 2.3). The stabilization energy must of course be stored in inter-nal degrees of freedom, thereby contributing to some further excitation of INC1.Direct dissociation of INC1 is also detected as imine loss. By considering the pro-pyl ion as a protonated propene molecule it becomes reasonable that within theINC, a proton may be attracted by the imine having a by 100–140 kJ mol–1 higherproton affinity (PA, Chap. 2.11) than the leaving alkene. [142,164-166] Therefore,the proton is almost quantitatively transferred to the imine, and the heat of reactionof 140 kJ mol–1 causes additional excitation. Thus, INC2, also called proton-bridged complex (PBC), finally decomposes to give an immonium ion, m/z 72,and propene, 42 u.
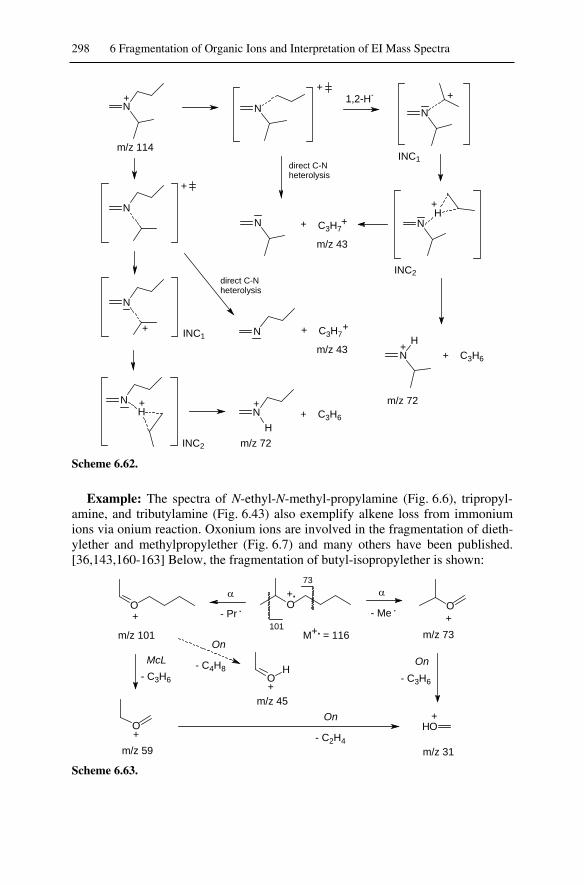
298 6 Fragmentation of Organic Ions and Interpretation of EI Mass Spectra
N+
+N
H
+
N
+
N
N
+
+H
N+N +
+N
H+ C3H6
C3H7
1,2-H-
INC1
INC2
+H
N
N + C3H7+
direct C-Nheterolysis
direct C-Nheterolysis
+ C3H6
INC2
m/z 43
m/z 43
m/z 72
m/z 72
m/z 114
N
+ INC1
Scheme 6.62.
Example: The spectra of N-ethyl-N-methyl-propylamine (Fig. 6.6), tripropyl-amine, and tributylamine (Fig. 6.43) also exemplify alkene loss from immoniumions via onium reaction. Oxonium ions are involved in the fragmentation of dieth-ylether and methylpropylether (Fig. 6.7) and many others have been published.[36,143,160-163] Below, the fragmentation of butyl-isopropylether is shown:
O
73
101
OO+.
+ +M = 116+.m/z 101 m/z 73
McL OnOn
+O
+O
H
HO+
m/z 59
m/z 45
m/z 31
- C3H6
- C4H8- C3H6
- C2H4
On
- Pr . - Me .
Scheme 6.63.

6.11 Alkene Loss from Onium Ions 299
6.11.2.2 Competition of Onium Reaction and McLafferty Rearrangement
The onium reaction and the McLafferty rearrangement of onium ions are closelyrelated to each other in so far that they often occur from the very same ion. How-ever, the knowledge of the above mechanisms reveals significant differences inthe way they proceed and it sheds light on the competition of onium reaction andMcLafferty rearrangement: During the onium reaction alkyl substituents with nobranch at C (adjacent to the heteroatom) have to be cleaved off via a transitionstate resembling a primary carbenium ion. Branching at C will effect dramaticchange on the ease of bond heterolysis. As pointed out, analogous effects are ob-served for the McLafferty rearrangement in case of substitution at C(Chap. 6.11.1 and Fig. 6.43). It becomes clear that the reaction pathway passingthrough the higher branched carbenium ion intermediate will be observed as thepredominating process.
6.11.2.3 Aldehyde Loss from Oxonium Ions
In case of immonium ion fragmentations, the large difference of proton affinities,PA, between imine and alkene clearly favors the formation of immonium ion
plus neutral alkene, whereas imine loss is restricted to highly energetic precursors.In decomposing oxonium ions the situation is quite different, i.e., the prefer-
ence for alkene loss is much less emphasized and aldehyde (ketone) loss is gainingimportance. The observed changes are in good agreement with the postulatedmechanism of the onium reaction. [143,167] The alternative pairs of oxonium ionplus alkene and aldehyde plus carbenium ion may be formed with a preference forthe first one, because PA is comparatively small (20–60 kJ mol–1) or even zero,e.g., for the acetone/isobutene pair: [143,166,167]
+
O O+ + O
OH
+
1,2-H-
HO
O
+
+
+
+
m/z 31
m/z 43 30 u
42 u
m/z 73
PA = Hf = 20 kJ mol-1
Scheme 6.64.

300 6 Fragmentation of Organic Ions and Interpretation of EI Mass Spectra
6.12 Ion-Neutral Complexes
During the above discussion of the mechanism of the onium reaction we encoun-tered another type of reactive intermediates of unimolecular ion fragmentations:ion-neutral complexes (INC). [29,41,141,168-171] Different from distonic ions(Chap. 6.3) ion-neutral complex intermediates add some bimolecular reactioncharacteristics to fragmentation pathways of isolated ions. This is effected by al-lowing an incipient neutral fragment to remain some time with the ionic part, bothderived from the same precursor ion, thus enabling processes that otherwise couldonly occur from bimolecular ion-molecule reactions. The final products of suchfragmentations are governed by the properties of the species involved, e.g., by therelative proton affinities of the partners as was the case with the onium reaction.
6.12.1 Evidence for the Existence of Ion-Neutral Complexes
Perhaps the first suggestion of INCs came from Rylander and Meyerson.[172,173] The concept that the decomposition of oxonium and immonium ions in-volve INCs (Chap. 6.11.2) was successfully put forth by Bowen and Williams,[143,157,158,167,174] and the analogies to solvolysis were described by Morton.[168] Nonetheless, mass spectrometrist were too much used to strictly uni-molecular reactions to assimilate such a concept without stringent proof.
Conclusive evidence for INCs was first presented by Longevialle and Botter[175,176] who demonstrated the transfer of a proton from an imine fragment to anamino group located on the opposite side of the rigid skeleton of bifunctional ster-oidal amines. [176] Such a proton transfer cannot proceed without the interme-diacy of an INC; otherwise, a conventional hydrogen shift would have bridged thedistance of about 10–9 m between the respective groups which is about five timestoo far.
The occurrence of this unexpected reaction chiefly depends on the ion internalenergy: energetic molecular ions undergo -cleavage leading to an immonium ion,[C2H6N]+, m/z 44, less energetic ions and especially metastable ions show imineloss. Obviously, mutual rotation of the reacting partners has to precede the finalacid-base reaction preferably causing imine loss, i.e., an [M–C2H5N]+• fragment,[M–43]+•. This is possible because the attractive forces between the radical and theion are strong enough to prevent spontaneous dissociation by forming an INC.Now, mutual rotation of the reacting partners allows additional dissociation chan-nels to be explored. Finally, the proton transfer to the amine is thermodynamicallyfavorable, because the proton affinity of ethylideneimine, 891 kJ mol–1, is pre-sumably lower than that of the steroidal amine radical (as estimated from the pro-ton affinity of cyclohexylamine, [164] this is about 920 kJ mol–1, i.e.,
PA 29 kJ mol–1).Proton transfer will be prevented when the initial fragments separate too rapidly
for the partners to rotate into a suitable configuration. Here, the lower limit for theintermediate's lifetime can be estimated to be 10–11 s. The competition between the

6.12 Ion-Neutral Complexes 301
-cleavage and the INC-mediated reaction is therefore governed by the amount ofion internal energy.
+.NH2
H2N H2N
+NH2
.m/z 44
.NH2+
H2N .
NH2
HN
H +
+NH3
.HN
[M-43]+.
43 u[M-43-CH3]
[M-43-NH3]
+
+.
+
44
17
3
3
3
17
3
17
3
17
17
freemutualrotation
energetic ions
low internalenergy
dissociation
Scheme 6.65.
6.12.2 Attractive Forces in Ion-Neutral Complexes
The term ion-neutral complex is applied to species in which an ion and a neutralare held in association mainly by electrostatic attraction. [171] Instead, by actionof covalent bonds, the INC must be held together by the attraction between apositive or negative charge and an electron-donating or -accepting group, respec-tively, e.g., by ion-dipole and ion-induced dipole interactions. The formation of anINC can be compared to solvolysis reactions in the condensed phase [168] withsubsequent mutual solvation of the partners. Typically, stabilization energy Vr is inthe range of 20–50 kJ mol–1.
Consider the dissociation of an ion AM+ that may either dissociate to form thefragments A+ and M or the INC [A+, M] allowing free mutual rotation and thusreorientation of the particles. Within the INC, A+ and M can recombine only ifthey attain a well-defined mutual orientation, i.e., the system has to freeze rota-tional degrees of freedom. Such a configuration allowing covalent bonds to beformed is termed locked-rotor critical configuration [169-171,177] and any reac-

302 6 Fragmentation of Organic Ions and Interpretation of EI Mass Spectra
tion channel, e.g., proton transfer or recombination, has to pass this entropicbottleneck. The INC [A+, M] can in principle undergo multiple isomerizations andmay dissociate at any of these isomeric states:
AM [A , M] [A, M ] [A, M' ]
A + M A + M A + M'
+ + + +
+ ++
H+ isom.
dissociations
etc.
Scheme 6.66.
Note: Any reaction depending on a certain configuration to be attained, i.e.,“classical” rearrangement fragmentations and especially INC-mediated proc-esses, exhibit comparatively low rate constants that are in part due to entropicbottlenecks to be passed (cf. tight transition states, Chap. 2.6.4). Therefore,high ion internal energies tend to discriminate INC-mediated reactions, but fa-vor direct bond cleavages.
6.12.3 Criteria for Ion-Neutral Complexes
A species can be considered as an INC if its lifetime is long enough to allow forother chemical reactions than the mere dissociation of the incipient particles. Thisis the minimum criterion that has to be fulfilled to term a reactive intermediate anion-neutral complex, because otherwise any transition state would also representan INC. [171,178] In addition, the reorientation criterion [29,169] should be met,i.e., free reorientation of the particles involved must be possible. Although still re-garded provisional by the authors, McAdoo and Hudson have provided a usefulcollection of additional characteristics of ion-neutral complex-mediated decompo-sitions: [179,180]1. Complete dissociation by the bond cleavage that forms the INC will be ob-
served and will increase in importance relative to the INC-mediated pathway asinternal energy increases.
2. INC-mediated processes will be among the lowest energy reactions of an ion.3. Reactions within and between partners may occur below the dissociation
thresholds for simple dissociations.4. Alternative mechanisms consistent with the observations would require much
higher energy transition states – transition states in which multiple bondbreakings and makings occur simultaneously, or even transition states of im-possible geometries.
5. The observed kinetic isotope effects are usually large (because of low excessenergy in the transition states).
6. The kinetic energy releases in corresponding metastable decompositions maybe very small.

6.12 Ion-Neutral Complexes 303
6.12.4 Ion-Neutral Complexes of Radical Ions
The intermediacy of ion-neutral complexes is neither restricted to even-electronfragmentations nor to complexes that consist of a neutral molecule and an ion. Inaddition, radical-ion complexes and radical ion-neutral complexes occur that maydissociate to yield the respective fragments or can even reversibly interconvert byhydride, proton or hydrogen radical shifts. Many examples are known from ali-phatic alcohols, [180-183] alkylphenylethers, [184-187] and thioethers. [188]
Example: The unimolecular reactions of the molecular ion of ethyl-propyl-thioether (Fig. 6.45, Scheme 6.67) [188] chiefly are i) loss of a methyl radical,CH3
•, from the ethyl or the propyl group, ii) loss of an ethyl radical, C2H5•, from
the propyl group, both leading to sulfonium ions [189] (Chap. 6.2.5), andiii) elimination of propene or an allyl radical by transfer of one or two hydrogenatoms, respectively, from the propyl group to the sulfur. On the microsecond timescale, the loss of CH3
• involves only the propyl entity and is preceded by an iso-merization of this group. Partial loss of the positional identity of the hydrogenatoms of the propyl group occurs, but incorporation of hydrogen or carbon atomsfrom the ethyl group into the formed neutral species does not occur. Cleavage of aC–S bond assisted by a 1,2-hydride shift in the incipient carbenium ion leads to anINC of a thioethoxy radical and a 2-propyl ion. The INC may recombine to formthe molecular ion of ethylisopropylthioether (cf. Fig. 6.9) prior to CH3
• loss, or re-act by proton transfer to give another INC, which may dissociate or undergo hy-drogen atom transfer, followed by elimination of an allyl radical. The partial lossof positional identity of the hydrogen atoms during the decomposition of the meta-stable ions is mainly a result of reversible proton transfer between the constituents,which competes favorably with 1,2-hydride shifts within the carbenium ion entityof the complex.
Fig. 6.45. EI mass spectrum of ethylpropylthioether. (Also compare to the spectrum of eth-ylisopropylthioether, Fig. 6.9. The isotopic pattern is discussed in Chap. 3.2.6) Spectrumused by permission of NIST. © NIST 2002.

304 6 Fragmentation of Organic Ions and Interpretation of EI Mass Spectra
S+.
+S.
.S +
+.S S
+
SH+. +.
SH
+SH2 . .SH2
+
H -transfer
H -transfer
1,2-H-
CH3.
+
.
M = 104+.Hf = 715 kJ mol-1
Hf = 689 kJ mol-1+.M' = 104
m/z 62
m/z 63
42 u
41 u
+S.
m/z 4361 u
+
+
+
+
Hf = 899 kJ mol-1
Hf = 870 kJ mol-1
Hf = 853 kJ mol-1
Hf = 883 kJ mol-1m/z 89 15 u
Hf values of productsrefer to the sum of both fragments.
Scheme 6.67.
6.13 Ortho Elimination (Ortho Effect)
The ortho elimination (ortho effect) has been stated to belong to the diagnosticallymost important mass spectral fragmentations. [190] Indeed, from the first reporton this process [104] until the present, there is a continuing interest in this topicconcerning a wide range of compounds. [191-200] The driving force for these re-search activities stems from a strict relation of this process to the substitution pat-tern of aryl compounds. The existence of a suitably 1,2-disubstituted cis-doublebond presents an essential structural requirement for this rearrangement-typefragmentation, and this double bond is usually part of an aromatic system, hencethe name.
Note: Although not being correct to describe a reaction, the term ortho effect iswell established, and another occasionally used term, retro-1,4-addition, is re-dundant; 1,4-elimination would describe the same. Unfortunately, this might beconfused with 1,4-H2O-eliminations from aliphatic alcohols, for example.Therefore, the term ortho elimination is suggested and used here.

6.13 Ortho Elimination (Ortho Effect) 305
6.13.1 Ortho Elimination from Molecular Ions
Commonly, ortho elimination refers to a hydrogen transfer via a six-memberedtransition state at ortho-disubstituted aromatic compounds. In practice, the react-ing entities are almost in position to form this six-membered transition state. Thegeneral mechanism of the ortho elimination is as follows:
AZ
BH
+. +.A
B+ HZ
ortho
Scheme 6.68.
The charge can reside on either product, but charge retention at the diene prod-uct is generally predominant. As the 1,2-disubstituted cis-double bond must notnecessarily belong to an aryl group, the optional part of the molecule has beendrawn in dashed style in the above scheme. In addition to the substitution pattern,the ortho elimination requires substituent A to bear a hydrogen-accepting leavinggroup, Z, and substituent B to be a hydrogen donor, e.g., hydroxyl, amino, thiol, oreven alkyl. [201]
Fig. 6.46. EI mass spectra of 2-hydroxy-acetophenone (a) and 2-methyl-benzoic acid (b).Spectra used by permission of NIST. © NIST 2002.
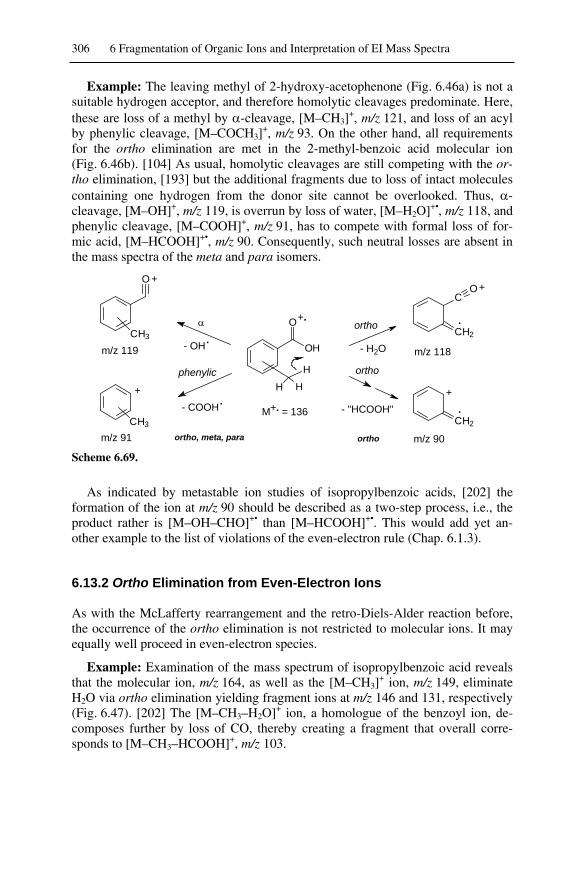
306 6 Fragmentation of Organic Ions and Interpretation of EI Mass Spectra
Example: The leaving methyl of 2-hydroxy-acetophenone (Fig. 6.46a) is not asuitable hydrogen acceptor, and therefore homolytic cleavages predominate. Here,these are loss of a methyl by -cleavage, [M–CH3]
+, m/z 121, and loss of an acylby phenylic cleavage, [M–COCH3]
+, m/z 93. On the other hand, all requirementsfor the ortho elimination are met in the 2-methyl-benzoic acid molecular ion(Fig. 6.46b). [104] As usual, homolytic cleavages are still competing with the or-tho elimination, [193] but the additional fragments due to loss of intact moleculescontaining one hydrogen from the donor site cannot be overlooked. Thus, -cleavage, [M–OH]+, m/z 119, is overrun by loss of water, [M–H2O]+•, m/z 118, andphenylic cleavage, [M–COOH]+, m/z 91, has to compete with formal loss of for-mic acid, [M–HCOOH]+•, m/z 90. Consequently, such neutral losses are absent inthe mass spectra of the meta and para isomers.
O
OH
+.
O
CO
CH2
CH2
+
+
.
.
+
+
m/z 119
m/z 91
M = 136+.
m/z 118
m/z 90orthoortho, meta, para
ortho
orthoH
HH
- H2O
- "HCOOH"
- OH
- COOH
.
.
CH3
CH3
phenylic
Scheme 6.69.
As indicated by metastable ion studies of isopropylbenzoic acids, [202] theformation of the ion at m/z 90 should be described as a two-step process, i.e., theproduct rather is [M–OH–CHO]+• than [M–HCOOH]+•. This would add yet an-other example to the list of violations of the even-electron rule (Chap. 6.1.3).
6.13.2 Ortho Elimination from Even-Electron Ions
As with the McLafferty rearrangement and the retro-Diels-Alder reaction before,the occurrence of the ortho elimination is not restricted to molecular ions. It mayequally well proceed in even-electron species.
Example: Examination of the mass spectrum of isopropylbenzoic acid revealsthat the molecular ion, m/z 164, as well as the [M–CH3]
+ ion, m/z 149, eliminateH2O via ortho elimination yielding fragment ions at m/z 146 and 131, respectively(Fig. 6.47). [202] The [M–CH3–H2O]+ ion, a homologue of the benzoyl ion, de-composes further by loss of CO, thereby creating a fragment that overall corre-sponds to [M–CH3–HCOOH]+, m/z 103.
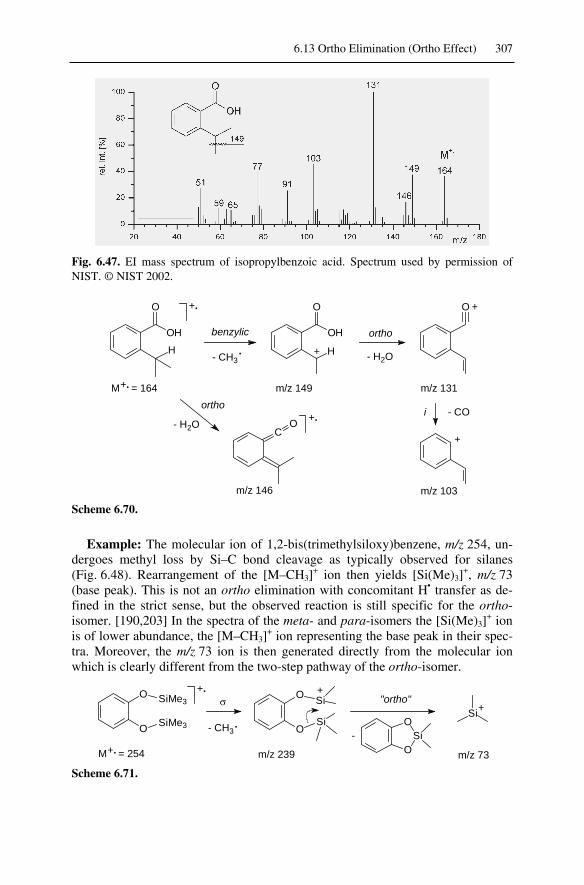
6.13 Ortho Elimination (Ortho Effect) 307
Fig. 6.47. EI mass spectrum of isopropylbenzoic acid. Spectrum used by permission ofNIST. © NIST 2002.
O
OH
H
+.
CO
m/z 146
+.
- CH3
benzylic
O
OH
H+
ortho
- H2O
+O
+
- COi
.
M = 164 m/z 149 m/z 131
m/z 103
+.
ortho
- H2O
Scheme 6.70.
Example: The molecular ion of 1,2-bis(trimethylsiloxy)benzene, m/z 254, un-dergoes methyl loss by Si–C bond cleavage as typically observed for silanes(Fig. 6.48). Rearrangement of the [M–CH3]
+ ion then yields [Si(Me)3]+, m/z 73
(base peak). This is not an ortho elimination with concomitant H• transfer as de-fined in the strict sense, but the observed reaction is still specific for the ortho-isomer. [190,203] In the spectra of the meta- and para-isomers the [Si(Me)3]
+ ionis of lower abundance, the [M–CH3]
+ ion representing the base peak in their spec-tra. Moreover, the m/z 73 ion is then generated directly from the molecular ionwhich is clearly different from the two-step pathway of the ortho-isomer.
O
O
SiMe3
SiMe3
+.
- CH3.
O Si
OSi
+
OSi
OSi
-
M = 254 m/z 239 m/z 73
"ortho"
+.
+
Scheme 6.71.

308 6 Fragmentation of Organic Ions and Interpretation of EI Mass Spectra
Fig. 6.48. EI mass spectrum of 1,2-bis(trimethylsiloxy)benzene. The isotopic pattern ofsilicon is clearly visible in the signals at m/z 73, 239, and 254 (Chap. 3.2.6). Spectrum usedby permission of NIST. © NIST 2002.
Note: Trimethylsilylether (TMS) derivatives are frequently employed to vola-tize alcohols, [14,203] carboxylic acids, [204,205] and other compounds[206,207] for mass spectrometry, and for GC-MS applications in particular.The EI mass spectra of TMS derivatives exhibit weak molecular ion peaks,clearly visible [M–CH3]
+ signals and often [Si(Me)3]+, m/z 73, as the base peak.
6.13.3 Ortho Elimination in the Fragmentation of Nitroarenes
6.13.3.1 Fragmentation of Nitroarenes
NOO + -
EI
+N
OO . .+
M+.
ONO
zwitterion 1,2-distonic ion
- O- NO2 - NO.
ONO
+.
+. +. +
++ .
[M-NO2] [M-O] [M-NO]
46 u 16 u 30 u
nitrite
NO
O +
30 u
.- NO
.
Scheme 6.72.

6.13 Ortho Elimination (Ortho Effect) 309
Fig. 6.49. EI mass spectra of isomeric nitrophenols. The fragment ion [M–OH]+ , m/z 122,instead of [M–O]+•, m/z 123, is only observed for the ortho isomer. Spectra used by permis-sion of NIST. © NIST 2002.
Nitroarenes are recognized from their characteristic neutral losses due to the NO2
substituent. Normally, all theoretically possible fragment ions, the plausible [M–NO2]
+• and [M–O]+• ions as well as the unexpected [M–NO]+ ion, are observed. Itis worth noting that molecular ions are 1,2-distonic by definition, becausenitroarene molecules are best represented as zwitterion (Chap. 6.3). The molecularion may either dissociate directly by loss of an oxygen atom or a NO2 molecule orit may rearrange prior to loss of NO•. For the latter process, two reaction pathwayshave been uncovered, one of them involving intermediate formation of a nitrite,and the other proceeding via a three-membered cyclic intermediate. [208]

310 6 Fragmentation of Organic Ions and Interpretation of EI Mass Spectra
Fragmentation of the nitrite then yields a phenolic-type ion that can decomposefurther by elimination of CO. Thus, the characteristic series of [M–16]+• (generallyweak signal), [M–30]+ and [M–46]+• ions is obtained (Fig. 6.49a,b).
6.13.3.2 Ortho Elimination from Nitroarenes
Ortho-substituted nitroarenes can be distinguished from meta- or para-substitutedisomers due to a characteristic change in their mass spectra. In precence of a hy-drogen-donating ortho subtituent, [M–OH]+ replaces the [M–O]+• the fragmention, e.g., in case of the above nitrophenols, the ion at m/z 123 is replaced by one atm/z 122 (Fig. 6.49c). The mechanism of this OH• loss is not quite clear, [209] be-cause different proposals [210-212] are in good accordance with the experimentaldata. Here, the mechanism which resembles the previously discussed ortho elimi-nations is shown: [212]
+N
OO
O
H.
M = 139+.
.
+
.
.N
OHO
O
+N
O
O
+
- OH
[M-OH] m/z 122
1,5-H
Scheme 6.73.
Ortho eliminations find widespread application in the structure elucidation ofaromatic nitro compounds, e.g., nitroanilines, [200] dinitrophenols, [213] trini-troaromatic explosives, [214] and nitrophenyl-methanesulfonamides. [199](Scheme 6.75 reproduced from Ref. [199] with permission. © IM Publications1997):
Scheme 6.74.

6.14 Heterocyclic Compounds 311
6.14 Heterocyclic Compounds
As mentioned in the beginning of this chapter, there is by far no chance for acomprehensive treatment of the fragmentations of organic ions in this context.Nevertheless, we should not finish without having briefly addressed the massspectrometry of heterocyclic compounds, an issue filling a book of its own. [215]
6.14.1 Saturated Heterocyclic Compounds
The molecular ions of small saturated heterocyclic compounds exhibit a strongtendency for transannular cleavages that often give rise to the base peak. Thesetransannular cleavages can formally be regarded as clean cuts across the ring.Other fragmentation pathways including ring-opening bond scissions followed byconsecutive cleavages and -cleavage also play a role and start to compete effec-tively with the characteristic ring cleavage as the number of substituents at thering increases. [216-218]
XX
X X X = O, S, NH
+.
+.+.
+.
Scheme 6.75.
6.14.1.1 Three- and Four-Membered Saturated Heterocycles
The methyloxirane molecular ion, m/z 58, easily fragments by -cleavage prefera-bly yielding a [M–CH3]
+ ion, m/z 43, and a [M–H]+ ion, m/z 57 (Fig. 6.50). Themore characteristic transannular ring cleavage leads to loss of formaldehyde, thusexplaining the base peak at m/z 28 as a C2H4
+• ion. Ring opening and consecutivefragmentation give rise to fragment ions such as [CH2OH]+, m/z 31, [CHO]+,m/z 29, and [CH3]
+, m/z 15:
O+.
C2H4
m/z 28- H2CO
O
O
+.- H
m/z 57 M = 58+..
+
+
- CH3.
1
2
m/z 43 - C2H3.
+O
+HO
.m/z 31
Scheme 6.76.

312 6 Fragmentation of Organic Ions and Interpretation of EI Mass Spectra
Fig. 6.50. EI mass spectrum of methyloxirane. Spectrum used by permission of NIST.
Example: Comparing the spectra of methyloxirane and its isomer oxetane re-veals a clear difference in that the [M–CH3]
+ ion, m/z 43, is almost absent becauseof the missing methyl group, whereas the [M–H]+ ion, m/z 57, remains unaffected.(Fig. 6.51a). The transannular ring cleavage, however, benefits from this reducednumber of competing channels and thus, the [M–H2CO]+• ion, m/z 28, is definitelydominant. The better charge-localizing capability of nitrogen as in azetidinemakes radical-induced cleavages become more pronounced as compared to theoxetane spectrum, i.e., a [M–CH3]
+ ion, m/z 42, is observed due to ring openingand the [M–H]+ ion, m/z 56, from -cleavage (Chap. 6.2) is also more prominent(Fig. 6.51b). Here, transannular ring cleavage of the N-heterocycle effects loss ofmethyleneimine, and the [M–HCNH]+• ion gives rise to the base peak:
+.
C2H4
m/z 28- H2CO
+.- H
m/z 57 M = 58+..
+ OO
NH+
.+.M = 57m/z 56
- H+.
- HCNHm/z 28
C2H4
+.NH
a
b
Scheme 6.77.
Note: Methyloxirane and oxetane are C3H6O isomers, but acetone, propanal,methyl vinylether, and 2-propenol also belong to this group. This reminds us tobe careful when assigning structures to empirical formulas and when deducingstructural information from r + d values (Chap. 6.4.4).
Example: More extensive substitution at the oxirane system brings additionaldissociation pathways for the molecular ions. Nevertheless, one of the main reac-tion paths of molecular ions of glycidols gives rise to enol radical ions by loss of aaldehyde (R = H) or ketone molecule. [218] The reaction mechanism can be ra-tionalized by the assumption of a distonic intermediate (Scheme 6.78):
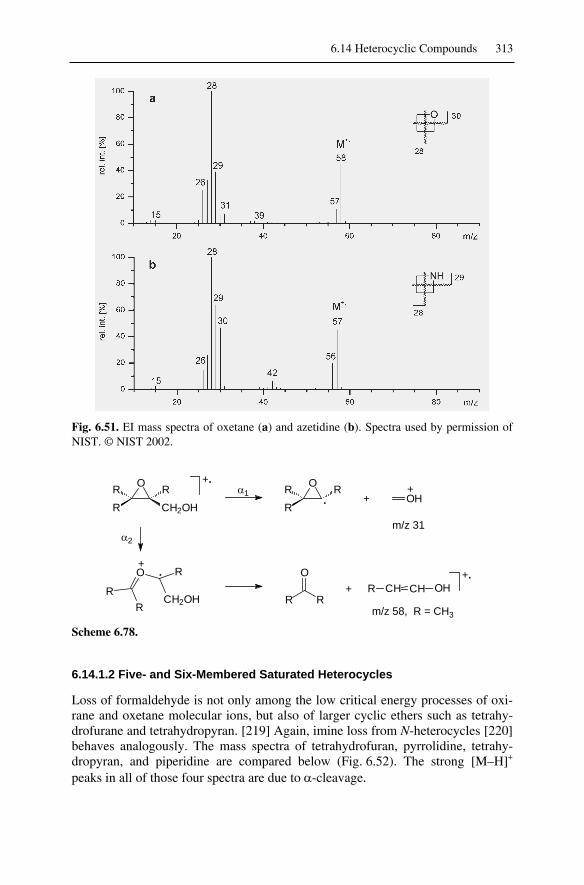
6.14 Heterocyclic Compounds 313
Fig. 6.51. EI mass spectra of oxetane (a) and azetidine (b). Spectra used by permission ofNIST. © NIST 2002.
ORR
RCH2OH
ORR
ROH++
.
+.
O
RR
R
CH2OH
+.
R R
OR CH CH OH
+.+
m/z 31
m/z 58, R = CH3
1
2
Scheme 6.78.
6.14.1.2 Five- and Six-Membered Saturated Heterocycles
Loss of formaldehyde is not only among the low critical energy processes of oxi-rane and oxetane molecular ions, but also of larger cyclic ethers such as tetrahy-drofurane and tetrahydropyran. [219] Again, imine loss from N-heterocycles [220]behaves analogously. The mass spectra of tetrahydrofuran, pyrrolidine, tetrahy-dropyran, and piperidine are compared below (Fig. 6.52). The strong [M–H]+
peaks in all of those four spectra are due to -cleavage.

314 6 Fragmentation of Organic Ions and Interpretation of EI Mass Spectra
Fig. 6.52. EI mass spectra of tetrahydrofuran (a), pyrrolidine (b), tetrahydropyran (c), andpiperidine (d). Spectra used by permission of NIST. © NIST 2002.
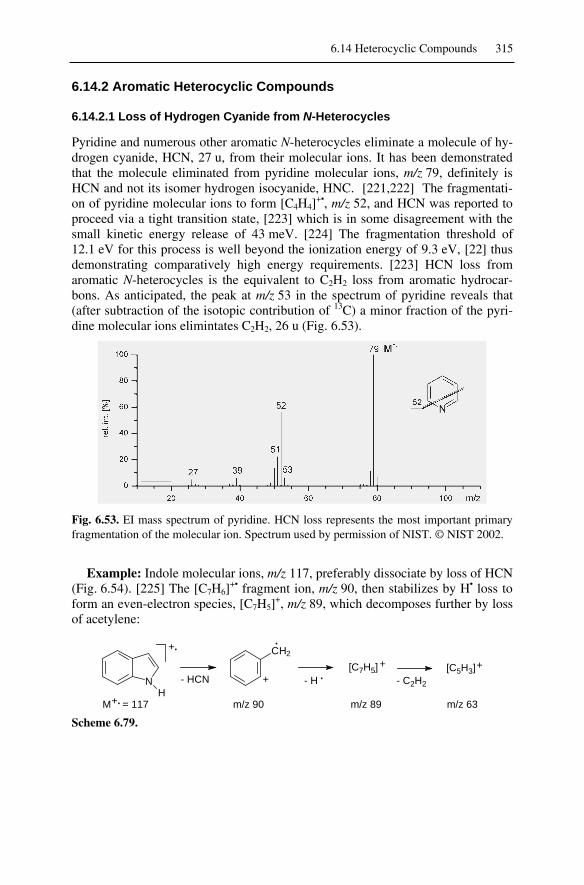
6.14 Heterocyclic Compounds 315
6.14.2 Aromatic Heterocyclic Compounds
6.14.2.1 Loss of Hydrogen Cyanide from N-Heterocycles
Pyridine and numerous other aromatic N-heterocycles eliminate a molecule of hy-drogen cyanide, HCN, 27 u, from their molecular ions. It has been demonstratedthat the molecule eliminated from pyridine molecular ions, m/z 79, definitely isHCN and not its isomer hydrogen isocyanide, HNC. [221,222] The fragmentati-on of pyridine molecular ions to form [C4H4]
+•, m/z 52, and HCN was reported toproceed via a tight transition state, [223] which is in some disagreement with thesmall kinetic energy release of 43 meV. [224] The fragmentation threshold of12.1 eV for this process is well beyond the ionization energy of 9.3 eV, [22] thusdemonstrating comparatively high energy requirements. [223] HCN loss fromaromatic N-heterocycles is the equivalent to C2H2 loss from aromatic hydrocar-bons. As anticipated, the peak at m/z 53 in the spectrum of pyridine reveals that(after subtraction of the isotopic contribution of 13C) a minor fraction of the pyri-dine molecular ions elimintates C2H2, 26 u (Fig. 6.53).
Fig. 6.53. EI mass spectrum of pyridine. HCN loss represents the most important primaryfragmentation of the molecular ion. Spectrum used by permission of NIST. © NIST 2002.
Example: Indole molecular ions, m/z 117, preferably dissociate by loss of HCN(Fig. 6.54). [225] The [C7H6]
+• fragment ion, m/z 90, then stabilizes by H• loss toform an even-electron species, [C7H5]
+, m/z 89, which decomposes further by lossof acetylene:
NH
+. CH2
- HCN - H
.
+ .[C7H5] [C5H3]
- C2H2
+ +
M = 117 m/z 90 m/z 89 m/z 63+.
Scheme 6.79.
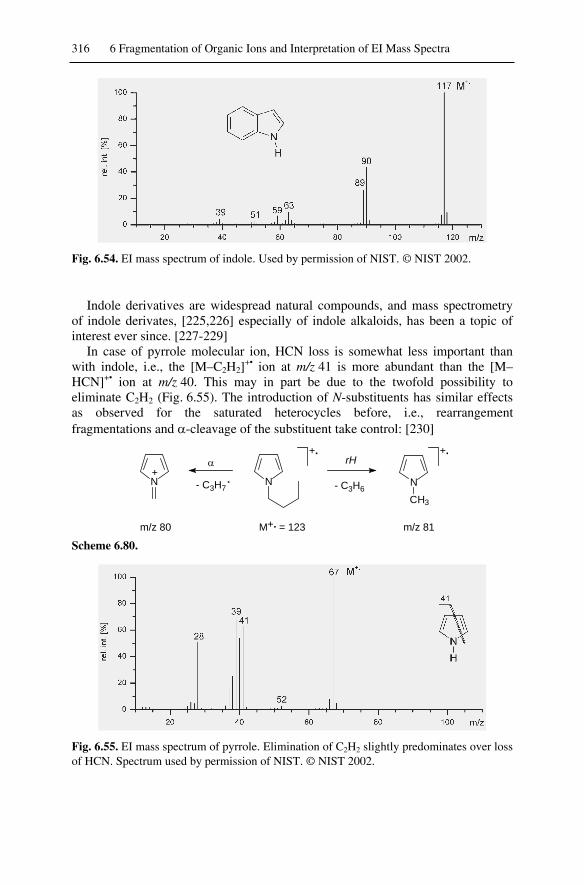
316 6 Fragmentation of Organic Ions and Interpretation of EI Mass Spectra
Fig. 6.54. EI mass spectrum of indole. Used by permission of NIST. © NIST 2002.
Indole derivatives are widespread natural compounds, and mass spectrometryof indole derivates, [225,226] especially of indole alkaloids, has been a topic ofinterest ever since. [227-229]
In case of pyrrole molecular ion, HCN loss is somewhat less important thanwith indole, i.e., the [M–C2H2]
+• ion at m/z 41 is more abundant than the [M–HCN]+• ion at m/z 40. This may in part be due to the twofold possibility toeliminate C2H2 (Fig. 6.55). The introduction of N-substituents has similar effectsas observed for the saturated heterocycles before, i.e., rearrangementfragmentations and -cleavage of the substituent take control: [230]
N- C3H7 - C3H6N N
CH3
+. +.
+rH
M = 123m/z 80 m/z 81+.
.
Scheme 6.80.
Fig. 6.55. EI mass spectrum of pyrrole. Elimination of C2H2 slightly predominates over lossof HCN. Spectrum used by permission of NIST. © NIST 2002.

6.14 Heterocyclic Compounds 317
6.14.2.2 Loss of Hydrogen Isocyanide from Aromatic Amines
The mass spectrum of aniline has been known since the early days of mass spec-trometry. [122] Initially, the observed [M–27]+• ion has been interpreted in termsof HCN loss (Fig. 6.56a). The mechanism for loss of the elements of [H, N, C]from aminoarenes is perfectly analogous to CO loss from phenols (Chap. 6.9.1).[231] More recently, it could be demonstrated that loss of hydrogen isocyanide,HNC, occurs rather than losing the more stable neutral species HCN, a behaviortypical of ionized pyridine. [222]
Interestingly, the three isomeric aminopyridine molecular ions display ionchemistry similar to aniline molecular ions, i.e., metastable HNC loss, [222] in-stead of HCN loss which should also be possible due to the pyridine core of themolecule (Fig. 6.56b).
+. HNH
H
+.
- HNC
M = 93 m/z 66
+.
m/z 65
- H .
NH2
+.
+
Scheme 6.81.
Fig. 6.56. EI mass spectra of aniline (a) and 2-aminopyridine (b). Different in mechanismfrom the N-heterocycles, but very similar in appearance: the aromatic amine molecular ionseliminate HNC. Spectra used by permission of NIST. © NIST 2002.

318 6 Fragmentation of Organic Ions and Interpretation of EI Mass Spectra
6.14.2.3 Fragmentation of Furane and Thiophene
The mass spectra of furanes are governed by a strong [M–HCO]+ signal and thecorresponding, but weaker peak at m/z 29 belonging to the formyl ion. [232]Analogous behavior is observed for thiophene, i.e., the spectrum shows a [M–HCS]+ peak, m/z 39, and the thioformyl ion, [HCS]+, at m/z 45 (Fig. 6.57). Massspectra of [2-13C]thiophene and of [2-D]thiophene showed that the thioformyl ionis generated after carbon skeleton rearrangement, whereas hydrogen scramblingseemed to be absent. [233] In addition to this marked fragmentation route, themolecular ions of furanes and thiophenes preferably decompose by C2H2 loss,[234] a behavior resembling that of pyrroles and quinones (Chap. 6.9.2). Massspectra of substituted furanes and thiophenes are discussed in the literature.[232,235,236]
X
- HCX[C3H3] +
m/z 39
- C3H3
[HCX]+
X = O m/z 29
X = S m/z 45
M = 68
M = 84
+.
+.
+..
.
- C2H2
[C2H2X]
m/z 42
m/z 58
+.
Scheme 6.82.
Fig. 6.57. EI mass spectrum of thiophene. The isotopic pattern of sulfur directly reveals itspresence in the ions detected at m/z 45, 58, (69), and 84. Spectrum used by permission ofNIST. © NIST 2002.

6.15 Guidelines for the Interpretation of Mass Spectra 319
6.15 Guidelines for the Interpretation of Mass Spectra
6.15.1 Summary of Rules
1. Identify the molecular ion! This is an important inital step, because it isneeded to derive the molecular composition (Chap. 6.6.4). If the EI spectrumdoes not allow for the identification of the molecular ion, soft ionizationmethods should be employed in addition.
2. The mass differences between the presumed molecular ion and primary frag-ments must correspond to realistic chemical compositions (Chap. 6.6.4, Ta-ble 6.12).
3. The calculated and experimental isotopic patterns have to agree with the mo-lecular formula postulated (Chap. 3.2).
4. The derived molecular formula must obey the nitrogen rule (Chap. 6.2.5). Anodd-numbered m/z value of the molecular ion requires 1, 3, 5, ... nitrogens tobe contained, whereas an even m/z value belongs to 0, 2, 4, ... nitrogens.
5. Homolytic cleavages cause odd-numbered mass differences between fragmentand molecular ion (Chap. 6.2.5). Rearrangement fragmentations cause even-numbered mass differences. This rule toggles if odd numbers of nitrogen arecontained in the neutral loss.
6. In general, fragmentations obey the even-electron rule (Chap. 6.1.3). Odd-electron fragments from rearrangement fragmentations behave as if they weremolecular ions of the respective smaller molecule.
7. The competition of homolytic cleavages is governed by Stevenson's rule(Chap. 6.2.2). Thermodynamic stability of the pairs of products formed is de-cisive in selecting the preferred fragmentation channel.
8. Calculate r + d to check formula proposals and to derive some structural char-acteristics (Chap. 6.4.4).
9. Write down a fragmentation scheme, thereby carefully tracking the origin ofprimary fragment ions and of characteristic ions used for structure assign-ment. From the purely analytical point of view this is very useful. However,one should keep in mind that any proposed fragmentation scheme remains aworking hypothesis unless experimental confirmation is available.
10. Employ additional techniques, such as measurement of accurate mass(Chap. 3.3), tandem mass spectrometry, or other spectroscopic methods tocrosscheck and to refine your assignments.

320 6 Fragmentation of Organic Ions and Interpretation of EI Mass Spectra
6.15.2 Systematic Approach to Mass Spectra
1. Collect background information such as origin of the sample, presumed com-pound class, solubility, thermal stability, or other spectroscopic information.
2. Write m/z labels to all relevant peaks and calculate mass differences betweenprominent peaks. Do you recognize characteristic ion series or mass differ-ences that point to common neutral losses?
3. Check which ionization method was used and examine the general appear-ance of the mass spectrum. Is the molecular ion peak intensive (as with aro-matic, heterocyclic, polycyclic compounds) or weak (as with aliphatic andmultifunctional compounds)? Are there typical impurities (solvent, grease,plasticizers) or background signals (residual air, column bleed in GC-MS)?
4. Is accurate mass data available for some of the peaks?
5. Now, follow the above rules to proceed.
6. Derive information on the presence/absence of functional groups.
7. Be careful when using collections of common neutral losses and m/z-to-structure relationship tables. They can never be comprehensive. Moreover,one tends to get fixed to the first proposal.
8. Put together the known structural features and try to assign the structure to theunknown sample. Sometimes, only partial structures of the analyte can be de-rived or isomers cannot be distinguished.
9. Crosscheck proposed molecular structure and mass spectral data. This is alsorecommended between the single steps of mass spectral interpretation.
10. Are there reference spectra available (at least of similar compounds) eitherfrom the literature or from mass spectral data bases (Chap. 5.7)?
11. Never rigidly follow this scheme! Sometimes, a step back or forth may accel-erate the process or help to avoid pitfalls.
12. Good luck!
Reference List
1. Biemann, K.; Dibeler, V.H.; Grubb, H.M.;Harrison, A.G.; Hood, A.; Knewstubb,P.F.; Krauss, M.; McLafferty, F.W.; Mel-ton, C.E.; Meyerson, S.; Reed, R.I.; Ro-senstock, H.M.; Ryhage, R.; Saunders,R.A.; Stenhagen, E.; Williams, A.E. MassSpectrometry of Organic Ions; 1st ed.;McLafferty, F.W., editor; Academic Press:London, 1963.
2. Budzikiewicz, H.; Djerassi, C.; Williams,D.H. Mass Spectrometry of Organic Com-pounds; 1st ed.; Holden-Day: San Fran-cisco, 1967.
3. Smith, R.M.; Busch, K.L. UnderstandingMass Spectra - A Basic Approach; 1st ed.;John Wiley & Sons: New York, 1999.
4. Budzikiewicz, H. Massenspektrometrie -eine Einführung; 4th ed.; Wiley-VCH:Weinheim, 1998.

Reference List 321
5. McLafferty, F.W.; Turecek, F. Interpreta-tion of Mass Spectra; 4th ed.; UniversityScience Books: Mill Valley, 1993.
6. Hesse, M.; Meier, H.; Zeeh, B. Massen-spektren, in Spektroskopische Methodenin der Organischen Chemie, 6th ed.;Georg Thieme Verlag: Stuttgart, 2002;Chapter 4, pp. 243.
7. Applications of Mass Spectrometry to Or-ganic Stereochemistry; 1st ed.; Splitter,J.S.; Turecek, F., editors; Verlag Chemie:Weinheim, 1994.
8. Price, P. Standard Definitions of TermsRelating to Mass Spectrometry. A ReportFrom the Committee on Measurementsand Standards of the Amercian Society forMass Spectrometry. J. Am. Chem. Soc.Mass Spectrom. 1991, 2, 336-348.
9. Todd, J.F.J. Recommendations for No-menclature and Symbolism for MassSpectroscopy Including an Appendix ofTerms Used in Vacuum Technology. Int.J. Mass Spectrom. Ion Proc. 1995, 142,211-240.
10. Svec, H.J.; Junk, G.A. Electron-ImpactStudies of Substituted Alkanes. J. Am.Chem. Soc. 1967, 89, 790-796.
11. Friedman, L.; Long, F.A. Mass Spectra ofSix Lactones. J. Am. Chem. Soc. 1953, 75,2832-1836.
12. Karni, M.; Mandelbaum, A. The 'Even-Electron Rule'. Org. Mass Spectrom. 1980,15, 53-64.
13. Bowen, R.D.; Harrison, A.G. Loss ofMethyl Radical From Some Small Immo-nium Ions: Unusual Violation of the Even-Electron Rule. Org. Mass Spectrom. 1981,16, 180-182.
14. Krauss, D.; Mainx, H.G.; Tauscher, B.;Bischof, P. Fragmentation of Trimethyl-silyl Derivatives of 2-Alkoxyphenols: aFurther Violation of the 'Even-ElectronRule'. Org. Mass Spectrom. 1985, 20, 614-618.
15. Nizigiyimana, L.; Rajan, P.K.; Haemers,A.; Claeys, M.; Derrick, P.J. MechanisticAspects of High-Energy Collision-InducedDissociation Proximate to the Charge inSaturated Fatty Acid n-Butyl Esters Ca-tionized With Lithium. Evidence for Hy-drogen Radical Removal. Rapid Commun.Mass Spectrom. 1997, 11, 1808-1812.
16. Veith, H.J.; Gross, J.H. Alkane Loss FromCollisionally Activated Alkylmethyle-neimmonium Ions. Org. Mass Spectrom.1991, 26, 1061-1064.
17. McLafferty, F.W. Mass SpectrometricAnalysis. I. Aliphatic Halogenated Com-pounds. Anal. Chem. 1962, 34, 2-15.
18. Stevenson, D.P. Ionization and Dissocia-tion by Electronic Impact. Ionization Po-tentials and Energies of Formation of Sec-Propyl and Tert-Butyl Radicals. SomeLimitations on the Method. Discuss.Faraday Soc. 1951, 10, 35-45.
19. Audier, H.E. Ionisation et fragmentationen spectrometrie de masse I. sur la réparti-tion de la charge positive entre fragmentprovenant des mêmes ruptures. Org. MassSpectrom. 1969, 2, 283-298.
20. Harrison, A.G.; Finney, C.D.; Sherk, J.A.Factors Determining Relative Ionic Abun-dances in Competing Fragmentation Re-actions. Org. Mass Spectrom. 1971, 5,1313-1320.
21. Levsen, K. Reaction Mechanisms, in Fun-damental Aspects of Organic Mass Spec-trometry, 1st ed.; Verlag Chemie: Wein-heim, 1978; pp. 152-208.
22. NIST NIST Chemistry Webbook.http://webbook. nist. gov/ 2002.
23. Sharkey, A.G., Jr.; Shultz, J.L.; Friedel,R.A. Mass Spectra of Ketones. Anal.Chem. 1956, 28, 934-940.
24. Gilpin, J.A.; McLafferty, F.W. MassSpectrometric Analysis: Aliphatic Alde-hydes. Anal. Chem. 1957, 29, 990-994.
25. Liedtke, R.J.; Djerassi, C. Mass Spec-trometry in Structural and StereochemicalProblems. CLXXXIII. A Study of theElectron Impact Induced Fragmentation ofAliphatic Aldehydes. J. Am. Chem. Soc.1969, 91, 6814-6821.
26. Harrison, A.G. The High-Resolution MassSpectra of Aliphatic Aldehydes. Org.Mass Spectrom. 1970, 3, 549-555.
27. Levsen, K.; McLafferty, F.W. MetastableIon Characteristics. XXVII. Structure andUnimolecular Reactions of [C2H6N]+ and[C3H8N]+ Ions. J. Am. Chem. Soc. 1974,96, 139-144.
28. Bowen, R.D. The Chemistry of[CnH2n+2N]+ Ions. Mass Spectrom. Rev.1991, 10, 225-279.
29. Bowen, R.D. Ion-Neutral Complexes. Ac-counts of Chemical Research 1991, 24,364-371.
30. Djerassi, C.; Fenselau, C. Mass Spec-trometry in Structural and StereochemicalProblems. LXXXIV. The Nature of theCyclic Transition State in Hydrogen Rear-rangements of Aliphatic Ethers. J. Am.Chem. Soc. 1965, 87, 5747-5762.

322 6 Fragmentation of Organic Ions and Interpretation of EI Mass Spectra
31. McLafferty, F.W. Mass SpectrometricAnalysis of Aliphatic Ethers. Anal. Chem.1957, 29, 1782-1789.
32. Friedel, R.A.; Shultz, J.L.; Sharkey, A.G.,Jr. Mass Spectra of Alcohols. Anal. Chem.1956, 28, 927-934.
33. Gohlke, R.S.; McLafferty, F.W. MassSpectrometric Analysis of AliphaticAmines. Anal. Chem. 1962, 34, 1281-1287.
34. O'Nier, M.J., Jr.; Wier, T.P., Jr. MassSpectrometry of Heavy Hydrocarbons.Anal. Chem. 1951, 830-843.
35. Audier, H.E.; Milliet, A.; Sozzi, G.; Den-hez, J.P. The Isomerization Mechanismsof Alkylamines: Structure of [C2H6N]+ and[C3H8N]+ Fragment Ions. Org. MassSpectrom. 1984, 19, 79-81.
36. Phillips, G.R.; Russell, M.E.; Solka, B.H.Structure of the [C2H5O]+ Ion in the MassSpectrum of Diethyl Ether. Org. MassSpectrom. 1975, 10, 819-823.
37. McAdoo, D.J.; Hudson, C.E. Gas PhaseIonic Reactions Are Generally StepwiseProcesses. Int. J. Mass Spectrom. IonProc. 1984, 62, 269-276.
38. Williams, D.H.; Budzikiewicz, H.; Pelah,Z.; Djerassi, C. Mass Spectroscopy and ItsApplication to Structural and Stereo-chemical Problems. XLIV. FragmentationBehavior of Monocyclic Ketones.Monatsh. Chem. 1964, 95, 166-177.
39. Seibl, J.; Gäumann, T. MassenspektrenOrganischer Verbindungen. 2. Mitteilung:Cyclohexanone. Helv. Chim. Acta 1963,46, 2857-2872.
40. Yates, B.F.; Bouma, W.J.; Radom, L. De-tection of the Prototype Phosphonium(CH2PH3), Sulfonium (CH2SH2), andChloronium (CH2ClH) Ylides by Neutrali-zation-Reionization Mass Spectrometry: aTheoretical Prediction. J. Am. Chem. Soc.1984, 106, 5805-5808.
41. Grützmacher, H.-F. Unimolecular Reac-tion Mechanisms: the Role of ReactiveIntermediates. Int. J. Mass Spectrom. IonProc. 1992, 118/119, 825-855.
42. Hammerum, S. Distonic Radical Cationsin the Gaseous and Condensed Phase.Mass Spectrom. Rev. 1988, 7, 123-202.
43. Stirk, K.M.; Kiminkinen, M.L.K.;Kenttämaa, H.I. Ion-Molecule Reactionsof Distonic Radical Cations. Chem. Rev.1992, 92, 1649-1665.
44. Yates, B.F.; Bouma, W.J.; Radom, L.Distonic Radical Cations. Guidelines for
the Assessment of Their Stability. Tetra-hedron 1986, 42, 6225-6234.
45. Hammerum, S.; Derrick, P.J. Thermody-namics of Intermediate Ion-MoleculeComplexes or Kinetics of Competing Re-actions? The Reactions of Low-EnergyIsobutylamine and Neopentylamine Mo-lecular Ions. J. Chem. Soc. ,Perkin Trans.2 1986, 1577-1580.
46. Yates, B.F.; Radom, L. IntramolecularHydrogen Migration in Ionized Amines: aTheoretical Study of the Gas-Phase Ana-logues of the Hofmann-Löffler and Re-lated Rearrangements. J. Am. Chem. Soc.1987, 109, 2910-2915.
47. Zeller, L.; Farrell, J., Jr.; Vainiotalo, P.;Kenttämaa, H.I. Long-Lived Radical Ca-tions of Simple Organophosphates Iso-merize Spontaneously to Distonic Struc-tures in the Gas Phase. J. Am. Chem. Soc.1992, 114, 1205-1214.
48. Sack, T.M.; Miller, D.L.; Gross, M.L. TheRing Opening of Gas-Phase CyclopropaneRadical Cations. J. Am. Chem. Soc. 1985,107, 6795-6800.
49. Grubb, H.M.; Meyerson, S. Mass Spectraof Alkylbenzenes, in Mass spectrometry oforganic ions, 1st ed.; McLafferty, F.W.,editor; Academic Press: New York, 1963;pp. 453-527.
50. McLafferty, F.W.; Bockhoff, F.M. Colli-sional Activation and Metastable IonCharacteristics. 67. Formation and Sta-bility of Gaseous Tolyl Ions. Org. MassSpectrom. 1979, 14, 181-184.
51. Cone, C.; Dewar, M.J.S.; Landman, D.Gaseous Ions. 1. MINDO/3 Study of theRearrangement of Benzyl Cation to Tro-pylium. J. Am. Chem. Soc. 1977, 99, 372-376.
52. Traeger, J.C.; McLoughlin, R.G. Thresh-old Photoionization and Dissociation ofToluene and Cycloheptatriene. J. Am.Chem. Soc. 1977, 99, 7351-7352.
53. Howe, I.; McLafferty, F.W. UnimolecularDecomposition of Toluene and Cyclohep-tatriene Molecular Ions. Variation of theDegree of Scrambling and Isotope EffectWith Internal Energy. J. Am. Chem. Soc.1971, 93, 99-105.
54. Kuck, D. Half a Century of Scrambling inOrganic Ions: Complete, Incomplete, Pro-gressive and Composite Atom Inter-change. Int. J. Mass Spectrom. 2002, 213,101-144.
55. Grützmacher, H.-F. Intra- and Intermo-lecular Reactions of Aromatic Radical Ca-

Reference List 323
tions: an Account of Mechanistic Conceptsand Methods in Mass Spectrometry. Org.Mass Spectrom. 1993, 28, 1375-1387.
56. Mormann, M.; Kuck, D. Protonated 1,3,5-Cycloheptatriene and 7-Alkyl-1,3,5-Cycloheptatrienes in the Gas Phase: RingContraction to the Isomeric Alkylben-zenium Ions. J. Mass Spectrom. 1999, 34,384-394.
57. Rylander, P.N.; Meyerson, S.; Grubb,H.M. Organic Ions in the Gas Phase. II.The Tropylium Ion. J. Am. Chem. Soc.1957, 79, 842-846.
58. Cooks, R.G.; Howe, I.; Tam, S.W.; Wil-liams, D.H. Studies in Mass Spectrometry.XXIX. Hydrogen Scrambling in Some Bi-cyclic Aromatic Systems. RandomizationOver Two Rings. J. Am. Chem. Soc. 1968,90, 4064-4069.
59. Borchers, F.; Levsen, K. Isomerization ofHydrocarbon Ions. III. [C8H8]+, [C8H8]2+,[C6H6]+, and [C6H5]+ Ions. Org. MassSpectrom. 1975, 10, 584-594.
60. Nishishita, T.; McLafferty, F.W. Metasta-ble Ion Characteristics. XXXXVII. Colli-sional Activation Mass Spectra of Penteneand Hexene Molecular Ions. Org. MassSpectrom. 1977, 12, 75-77.
61. Levsen, K. Isomerization of HydrocarbonIons. II. Octenes and Isomeric Cycloal-kanes. Collisional Activation Study. Org.Mass Spectrom. 1975, 10, 55-63.
62. Levsen, K.; Heimbrecht, J. Isomerizationof Hydrocarbon Ions. VI. Parameters De-termining the Isomerization of AliphaticHydrocarbon Ions. Org. Mass Spectrom.1977, 12, 131-135.
63. Borchers, F.; Levsen, K.; Schwarz, H.;Wesdemiotis, C.; Winkler, H.U. Isomeri-zation of Linear Octene Cations in the GasPhase. J. Am. Chem. Soc. 1977, 99, 6359-6365.
64. Schneider, B.; Budzikiewicz, H. A FacileMethod for the Localization of a DoubleBond in Aliphatic Compounds. RapidCommun. Mass Spectrom. 1990, 4, 550-551.
65. Peake, D.A.; Gross, M.L. Iron(I) ChemicalIonization and Tandem Mass Spectrome-try for Locating Double Bonds. Anal.Chem. 1985, 57, 115-120.
66. Fordham, P.J.; Chamot-Rooke, J.;Guidice, E.; Tortajada, J.; Morizur, J.-P.Analysis of Alkenes by Copper IonChemical Ionization Gas Chromatogra-phy/Mass Spectrometry and Gas Chro-
matography/Tandem Mass Spectrometry.J. Mass Spectrom. 1999, 34, 1007-1017.
67. Levsen, K.; Weber, R.; Borchers, F.;Heimbach, H.; Beckey, H.D. Determina-tion of Double Bonds in Alkenes by FieldIonization Mass Spectrometry. Anal.Chem. 1978, 50, 1655-1658.
68. Buser, H.-R.; Arn, H.; Guerin, P.;Rauscher, S. Determination of DoubleBond Position in Mono-Unsaturated Ace-tates by Mass Spectrometry of DimethylDisulfide Adducts. Anal. Chem. 1983, 55,818-822.
69. Scribe, P.; Guezennec, J.; Dagaut, J.; Pepe,C.; Saliot, A. Identification of the Positionand the Stereochemistry of the DoubleBond in Monounsaturated Fatty AcidMethyl Esters by Gas Chromatogra-phy/Mass Spectrometry of Dimethyl Di-sulfide Derivatives. Anal. Chem. 1988,60, 928-931.
70. Pepe, C.; Dif, K. The Use of Ethanethiolto Locate the Triple Bond in Alkynes andthe Double Bond in Substituted Alkenesby Gas Chromatography/Mass Spec-trometry. Rapid Commun. Mass Spectrom.2001, 15, 97-103.
71. Pepe, C.; Sayer, H.; Dagaut, J.; Couffig-nal, R. Determination of Double Bond Po-sitions in Triunsaturated Compounds byMeans of Gas Chromatography/MassSpectrometry of Dimethyl Disulfide De-rivatives. Rapid Commun. Mass Spectrom.1997, 11, 919-921.
72. Levsen, K.; Heimbach, H.; Shaw, G.J.;Milne, G.W.A. Isomerization of Hydro-carbon Ions. VIII. The Electron Impact In-duced Decomposition of n-Dodecane.Org. Mass Spectrom. 1977, 12, 663-670.
73. Lavanchy, A.; Houriet, R.; Gäumann, T.The Mass Spectrometric Fragmentation ofn-Heptane. Org. Mass Spectrom. 1978, 13,410-416.
74. Lavanchy, A.; Houriet, R.; Gäumann, T.The Mass Spectrometric Fragmentation ofn-Alkane. Org. Mass Spectrom. 1979, 14,79-85.
75. Levsen, K. Isomerization of HydrocarbonIons. I. Isomeric Octanes. Collisional Ac-tivation Study. Org. Mass Spectrom. 1975,10, 43-54.
76. Traeger, J.C.; McAdoo, D.J.; Hudson,C.E.; Giam, C.S. Why Are Alkane Elimi-nations From Ionized Alkanes So Abun-dant? J. Am. Chem. Soc. Mass Spectrom.1998, 9, 21-28.
324 6 Fragmentation of Organic Ions and Interpretation of EI Mass Spectra
77. McAdoo, D.J.; Bowen, R.D. AlkaneEliminations From Ions in the Gas Phase.Eur. Mass Spectrom. 1999, 5, 389-409.
78. Olivella, S.; Solé, A.; McAdoo, D.J.; Grif-fin, L.L. Unimolecular Reactions of Ion-ized Alkanes: Theoretical Study of thePotential Energy Surface for CH3
• and CH4
Losses From Ionized Butane and Isobu-tane. J. Am. Chem. Soc. 1994, 94, 11078-11088.
79. Williams, D.H. A Transition State Probe.Accounts of Chemical Research 1977, 10,280-286.
80. Ludányi, K.; Dallos, A.; Kühn, Z.; Vékey,D. Mass Spectrometry of Very Large Satu-rated Hydrocarbons. J. Mass Spectrom.1999, 34, 264-267.
81. Biemann, K. Application of Mass Spec-trometry in Organic Chemistry, Especiallyfor Structure Determination of NaturalProducts. Angew. Chem. 1962, 74, 102-115.
82. Happ, G.P.; Stewart, D.W. RearrangementPeaks in the Mass Spectra of Certain Ali-phatic Acids. J. Am. Chem. Soc. 1952, 74,4404-4408.
83. McLafferty, F.W. Mass SpectrometricAnalysis. Broad Applicability to ChemicalResearch. Anal. Chem. 1956, 28, 306-316.
84. McLafferty, F.W. Mass SpectrometricAnalysis: Molecular Rearrangements.Anal. Chem. 1965, 31, 82-87.
85. Kingston, D.G.I.; Bursey, J.T.; Bursey,M.M. Intramolecular Hydrogen Transferin Mass Spectra. II. McLafferty Rear-rangement and Related Reactions. Chem.Industry 1974, 74, 215-245.
86. Zollinger, M.; Seibl, J. McLafferty Reac-tions in Even-Electron Ions? Org. MassSpectrom. 1985, 11, 649-661.
87. Djerassi, C.; Tökés, L. Mass Spectrometryin Structural and Stereochemical Prob-lems. XCIII. Further Observations on theImportance of Interatomic Distance in theMcLafferty Rearrangement. Synthesis andFragmentation Behavior of Deuterium-Labeled 12-Oxo Steroids. J. Am. Chem.Soc. 1966, 88, 536-544.
88. Djerassi, C.; von Mutzenbecher, G.; Fa-jkos, J.; Williams, D.H.; Budzikiewicz, H.Mass Spectrometry in Structural andStereochemical Problems. LXV. Synthesisand Fragmentation Behavior of 15-OxoSteroids. The Importance of Inter-AtomicDistance in the McLafferty Rearrange-ment. J. Am. Chem. Soc. 1965, 87, 817-826.
89. Henion, J.D.; Kingston, D.G.I. MassSpectrometry of Organic Compounds. IX.McLafferty Rearrangements in Some Bi-cyclic Ketones. J. Am. Chem. Soc. 1974,96, 2532-2536.
90. Stringer, M.B.; Underwood, D.J.; Bowie,J.H.; Allison, C.E.; Donchi, K.F.; Derrick,P.J. Is the McLafferty Rearrangement ofKetones Concerted or Stepwise? The Ap-plication of Kinetic Isotope Effects. Org.Mass Spectrom. 1992, 27, 270-276.
91. Dewar, M.J.S. Multibond Reactions Can-not Normally Be Synchronous. J. Am.Chem. Soc. 1984, 106, 209-219.
92. Holmes, J.L.; Lossing, F.P. Gas-PhaseHeats of Formation of Keto and Enol Ionsof Carbonyl Compounds. J. Am. Chem.Soc. 1980, 102, 1591-1595.
93. Hrušák, J. MNDO Calculations on theNeutral and Cationic [CH3-CO-R] Systemsin Relation to Mass Spectrometric Frag-mentations. Z. Phys. Chem. 1991, 172,217-226.
94. Beynon, J.H.; Saunders, R.A.; Williams,A.E. The High Resolution Mass Spectra ofAliphatic Esters. Anal. Chem. 1961, 33,221-225.
95. Harrison, A.G.; Jones, E.G. Rearrange-ment Reactions Following Electron Impacton Ethyl and Isopropyl Esters. Can. J.Chem. 1965, 43, 960-968.
96. Wesdemiotis, C.; Feng, R.; McLafferty,F.W. Distonic Radical Ions. StepwiseElimination of Acetaldehyde From IonizedBenzyl Ethyl Ether. J. Am. Chem. Soc.1985, 107, 715-716.
97. Kingston, E.E.; Eichholzer, J.V.; Lyndon,P.; McLeod, J.K.; Summons, R.E. An Un-expected -Hydrogen Rearrangement inthe Mass Spectra of Di-Ortho-SubstitutedAlkylbenzenes. Org. Mass Spectrom.1988, 23, 42-47.
98. Benoit, F.M.; Harrison, A.G. HydrogenMigrations in Mass Spectrometry. II. Sin-gle and Double Hydrogen Migrations inthe Electron Impact Fragmentation of Pro-pyl Benzoate. Org. Mass Spectrom. 1976,1056-1062.
99. Müller, J.; Krebs, G.; Lüdemann, F.;Baumgartner, E. Wasserstoff-Umlagerungen Beim Elektronenstoß-Induzierten Zerfall Von Benzoesäure-n-Propylester-Tricarbonylchrom. J. Or-ganomet. Chem. 1981, 218, 61-68.
100. Benoit, F.M.; Harrison, A.G.; Lossing,F.P. Hydrogen Migrations in Mass Spec-trometry. III. Energetics of Formation of

Reference List 325
[R'CO2H2]+ in the Mass Spectra ofR'CO2R. Org. Mass Spectrom. 1977, 12,78-82.
101. Tajima, S.; Azami, T.; Shizuka, H.; Tsu-chiya, T. An Investigation of the Mecha-nism of Single and Double HydrogenAtom Transfer Reactions in Alkyl Benzo-ates by the Ortho Effect. Org. Mass Spec-trom. 1979, 14, 499-502.
102. Meyerson, S. Formation of [C18H36]+. and[C7H7O2]+ in the Mass Spectrum of n-Octadecyl Benzoate. Org. Mass Spectrom.1989, 24, 652-662.
103. Elder, J.F., Jr.; Beynon, J.H.; Cooks, R.G.The Benzoyl Ion. Thermochemistry andKinetic Energy Release. Org. Mass Spec-trom. 1976, 11, 415-422.
104. McLafferty, F.W.; Gohlke, R.S. MassSpectrometric Analysis-Aromatic Acidsand Esters. Anal. Chem. 1959, 31, 2076-2082.
105. Yinon, J. Mass Spectral FragmentationPathways in Phthalate Esters. A TandemMass Spectrometric Collision-InducedDissociation Study. Org. Mass Spectrom.1988, 23, 755-759.
106. Djerassi, C.; Fenselau, C. Mass Spec-trometry in Structural and StereochemicalProblems. LXXXVI. The Hydrogen-Transfer Reactions in Butyl Propionate,Benzoate, and Phthalate. J. Am. Chem.Soc. 1965, 87, 5756-5762.
107. Turecek, F.; Hanus, V. Retro-Diels-AlderReaction in Mass Spectrometry. MassSpectrom. Rev. 1984, 3, 85-152.
108. Turecek, F.; Hanuš, V. Charge Distribu-tion Between Formally Identical Frag-ments: the Retro-Diels-Alder Cleavage.Org. Mass Spectrom. 1980, 15, 4-7.
109. Kühne, H.; Hesse, M. The Mass SpectralRetro-Diels-Alder Reaction of 1,2,3,4-Tetrahydronaphthalene, Its Derivativesand Related Heterocyclic Compounds.Mass Spectrom. Rev. 1982, 1, 15-28.
110. Budzikiewicz, H.; Brauman, J.I.; Djerassi,C. Mass Spectrometry and Its Applicationto Structural and Stereochemical Prob-lems. LXVII. Retro-Diels-Alder Frag-mentation of Organic Molecules UnderElectron Impact. Tetrahedron 1965, 21,1855-1879.
111. Karpati, A.; Rave, A.; Deutsch, J.; Man-delbaum, A. Stereospecificity of Retro-Diels-Alder Fragmentation Under ElectronImpact. J. Am. Chem. Soc. 1973, 90, 4244.
112. Hammerum, S.; Djerassi, C. Mass Spec-trometry in Structural and Stereochemical
Problems. CCXXXIII. StereochemicalDependence of the Retro-Diels-Alder Re-action. J. Am. Chem. Soc. 1973, 95, 5806-5807.
113. Djerassi, C. Steroids Made It Possible:Organic Mass Spectrometry. Org. MassSpectrom. 1992, 27, 1341-1347.
114. Dixon, J.S.; Midgley, I.; Djerassi, C. MassSpectrometry in Structural and Stereo-chemical Problems. 248. StereochemicalEffects in Electron Impact Induced Retro-Diels-Alder Fragmentations. J. Am. Chem.Soc. 1977, 99, 3432-3441.
115. Barnes, C.S.; Occolowitz, J.L. MassSpectra of Some Naturally OccurringOxygen Heterocycles and Related Com-pounds. Aust. J. Chem. 1964, 17, 975-986.
116. Ardanaz, C.E.; Guidugli, F.H.; Catalán,C.A.N.; Joseph-Nathan, P. Mass SpectralStudies of Methoxynaphthoflavones.Rapid Commun. Mass Spectrom. 1999, 13,2071-2079.
117. Ballenweg, S.; Gleiter, R.; Krätschmer, W.Chemistry at Cyclopentene Addends on[60]Fullerene. Matrix-Assisted Laser De-sorption-Ionization Time-of-Flight MassSpectrometry As a Quick and FacileMethod for the Characterization ofFullerene Derivatives. Synth. Met. 1996,77, 209-212.
118. Ballenweg, S.; Gleiter, R.; Krätschmer, W.Unusual Functionalization of C60 Via Hy-drozirconation: Reactivity of the C60-Zr(IV) Complex Vs. Alkyl-Zr(IV) Com-plexes. J. Chem. Soc., Chem. Commun.1994, 2269-2270.
119. Aczel, T.; Lumpkin, H.E. Correlation ofMass Spectra With Structure in AromaticOxygenated Compounds. Aromatic Alco-hols and Phenols. Anal. Chem. 1960, 32,1819-1822.
120. Beynon, J.H. Correlation of MolecularStructure and Mass Spectra, in MassSpectrometry and its Applications to Or-ganic Chemistry, 1st ed.; Elsevier: Am-sterdam, 1960; pp. 352.
121. Beynon, J.H.; Lester, G.R.; Williams, A.E.Specific Molecular Rearrangements in theMass Spectra of Organic Compounds. J.Phys. Chem. 1959, 63, 1861-1869.
122. Momigny, J. The Mass Spectra of Mono-substituted Benzene Derivatives. Phenol,Monodeuteriophenol, Thiophenol, andAniline. Bull. Soc. RoyalSci. Liège 1953,22, 541-560.
123. Occolowitz, J.L. Mass Spectrometry ofNaturally Occurring Alkenyl Phenols and

326 6 Fragmentation of Organic Ions and Interpretation of EI Mass Spectra
Their Derivatives. Anal. Chem. 1964, 36,2177-2181.
124. Stensen, W.G.; Jensen, E. Structural De-terminationof 1,4-Naphthoquinones byMass Spectrometry/Mass Spectrometry. J.Mass Spectrom. 1995, 30, 1126-1132.
125. Guigugli, F.H.; Kavka, J.; Garibay, M.E.;Santillan, R.L.; Joseph-Nathan, P. MassSpectral Studies of Naphthoflavones. Org.Mass Spectrom. 1987, 22, 479-485.
126. Pelah, Z.; Wilson, J.M.; Ohashi, M.; Bud-zikiewicz, H.; Djerassi, C. Mass Spec-trometry in Structural and StereochemicalProblems. XXXIV. Aromatic Methyl andEthyl Ethers. Tetrahedron 1963, 19, 2233-2240.
127. Molenaar-Langeveld, T.A.; Ingemann, S.;Nibbering, N.M.M. Skeletal Rearrange-ments Preceding Carbon Monoxide LossFrom Metastable Phenoxymethylene IonsDerived From Phenoxyacetic Acid andAnisole. Org. Mass Spectrom. 1993, 28,1167-1178.
128. Zagorevskii, D.V.; Régimbal, J.-M.;Holmes, J.L. The Heat of Formation of the[C6,H5,O]+ Isomeric Ions. Int. J. MassSpectrom. Ion Proc. 1997, 160 , 211-222.
129. Cooks, R.G.; Bertrand, M.; Beynon, J.H.;Rennekamp, M.E.; Setser, D.W. EnergyPartitioning Data As an Ion StructureProbe. Substituted Anisoles. J. Am. Chem.Soc. 1973, 95, 1732-1739.
130. Alexander, J.J. Mechanism of Photo-chemical Decarbonylation of Acetyldicar-bonyl- 5-Cyclopentadienyliron. J. Am.Chem. Soc. 1975, 97, 1729-1732.
131. Coville, N.J.; Johnston, P. A Mass-Spectral Investigation of Site-SelectiveCarbon Monoxide Loss From IsotopicallyLabeled [MnRe(CO)10]+. J. Organomet.Chem. 1989, 363, 343-350.
132. Tobita, S.; Ogino, K.; Ino, S.; Tajima, S.On the Mechanism of Carbon MonoxideLoss From the Metastable Molecular Ionof Dimethyl Malonate. Int. J. Mass Spec-trom. Ion Proc. 1988, 85, 31-42.
133. Moldovan, Z.; Palibroda, N.; Mercea, V.;Mihailescu, G.; Chiriac, M.; Vlasa, M.Mass Spectra of Some -Keto Esters. AHigh Resolution Study. Org. Mass Spec-trom. 1981, 16, 195-198.
134. Vairamani, M.; Mirza, U.A. Mass Spectraof Phenoxyacetyl Derivatives. Mechanismof Loss of CO From Phenyl Phenoxyace-tates. Org. Mass Spectrom. 1987, 22, 406-409.
135. Tajima, S.; Siang, L.F.; Fuji-Shige, M.;Nakajima, S.; Sekiguchi, O. Collision-Induced Dissociation Spectra Versus Col-lision Energy Using a Quadrupole IonTrap Mass Spectrometer. II. Loss of COFrom Ionized o-, m- and p-Anisoyl Fluo-ride, CH3OC6H4COF+. J. Mass Spectrom.2000, 35, 1144-1146.
136. Tajima, S.; Tobita, S.; Mitani, M.; Aku-zawa, K.; Sawada, H.; Nakayama, M. Lossof CO From the Molecular Ions of o-, m-and p-Anisoyl Fluorides, CH3OC6H4COF,With Fluorine Atom Migration. Org. MassSpectrom. 1991, 26, 1023-1026.
137. Tou, J.C. Competitive and ConsecutiveEliminations of Molecular Nitrogen andCarbon Monoxide (or Ethene) From Het-erocyclics Under Electron Impact. J. Het-erocycl. Chem. 1974, 11, 707-711.
138. McFadden, W.H.; Lounsbury, M.;Wahrhaftig, A.L. The Mass Spectra ofThree Deuterated Butanols. Can. J. Chem.1958, 36, 990-998.
139. Bukovits, G.J.; Budzikiewicz, H. MassSpectroscopic Fragmentation Reactions.XXVIII. The Loss of Water From n-Alkan-1-ols. Org. Mass Spectrom. 1983,18, 219-220.
140. Meyerson, S.; Leitch, L.C. Organic Ions inthe Gas Phase. XIV. Loss of Water FromPrimary Alcohols Under Electron Impact.J. Am. Chem. Soc. 1964, 86, 2555-2558.
141. Bowen, R.D. The Role of Ion-NeutralComplexes in the Reactions of OniumIons and Related Species. Org. MassSpectrom. 1993, 28, 1577-1595.
142. Bowen, R.D. Potential Energy Profiles forUnimolecular Reactions of Isolated Or-ganic Ions: Some Isomers of [C4H10N]+
and [C5H12N]+. J. Chem. Soc., PerkinTrans. 2 1980, 1219-1227.
143. Bowen, R.D.; Derrick, P.J. UnimolecularReactions of Isolated Organic Ions: theChemistry of the Oxonium Ions[CH3CH2CH2CH2O=CH2]+ and[CH3CH2CH2CH=OCH3]+. Org. MassSpectrom. 1993, 28, 1197-1209.
144. Solling, T.I.; Hammerum, S. The Retro-Ene Reaction of Gaseous Immonium IonsRevisited. J. Chem. Soc., Perkin Trans. 22001, 2324-2428.
145. Veith, H.J.; Gross, J.H. Alkene Loss FromMetastable Methyleneimmonium Ions:Unusual Inverse Secondary Isotope Effectin Ion-Neutral Complex IntermediateFragmentations. Org. Mass Spectrom.1991, 26, 1097-1105.
Reference List 327
146. Budzikiewicz, H.; Bold, P. A McLaffertyRearrangement in an Even-Electron Sys-tem: C3H6 Elimination From the -Cleavage Product of Tributylamine. Org.Mass Spectrom. 1991, 26, 709-712.
147. Bowen, R.D.; Colburn, A.W.; Derrick, P.J.Unimolecular Reactions of Isolated Or-ganic Ions: Reactions of the ImmoniumIons [CH2=N(CH3)CH(CH3)2]+,[CH2=N(CH3)CH2CH2CH3]+ and[CH2=N(CH2CH2CH3)2]+. J. Chem. Soc.,Perkin Trans. 2 1993, 2363-2372.
148. Gross, J.H.; Veith, H.J. Propene LossFrom PhenylpropylmethyleneiminiumIons. Org. Mass Spectrom. 1994, 29, 153-154.
149. Gross, J.H.; Veith, H.J. UnimolecularFragmentations of Long-Chain AliphaticIminium Ions. Org. Mass Spectrom. 1993,28, 867-872.
150. Uccella, N.A.; Howe, I.; Williams, D.H.Structure and Isomerization of Gaseous[C3H8N]+ Metastable Ions. J. Chem. Soc.,B 1971, 1933-1939.
151. Levsen, K.; Schwarz, H. Influence ofCharge Localization on the Isomerizationof Organic Ions. Tetrahedron 1975, 31,2431-2433.
152. Bowen, R.D. Unimolecular Reactions ofIsolated Organic Ions: Olefin EliminationFrom Immonium Ions [R1R2N=CH2]+. J.Chem. Soc., Perkin Trans. 2 1982, 409-413.
153. Bowen, R.D. Reactions of Isolated Or-ganic Ions. Alkene Loss From the Immo-nium Ions [CH3CH=NHC2H5]+ and[CH3CH=NHC3H7]+. J. Chem. Soc., Per-kin Trans. 2 1989, 913-918.
154. Bowen, R.D.; Colburn, A.W.; Derrick, P.J.Unimolecular Reactions of the IsolatedImmonium Ions [CH3CH=NHC4H9]+,[CH3CH2CH=NHC4H9]+ and[(CH3)2C=NHC4H9]+. Org. Mass Spec-trom. 1990, 25, 509-516.
155. Bowen, R.D.; Maccoll, A. UnimolecularReactions of Ionized Ethers. J. Chem.Soc., Perkin Trans. 2 1990, 147-155.
156. Traeger, J.C.; Hudson, C.E.; McAdoo,D.J. Energy Dependence of Ion-InducedDipole Complex-Mediated Alkane Elimi-nations From Ionized Ethers. J. Phys.Chem. 1990, 94, 5714-5717.
157. Bowen, R.D.; Williams, D.H. Non-Concerted Unimolecular Reactions of Ionsin the Gas-Phase: the Importance of Ion-Dipole Interactions in Carbonium Ion
Isomerizations. Int. J. Mass Spectrom. IonPhys. 1979, 29, 47-55.
158. Bowen, R.D.; Williams, D.H. Uni-molecular Reactions of Isolated OrganicIons. The Importance of Ion-Dipole Inter-actions. J. Am. Chem. Soc. 1980, 102,2752-2756.
159. Bowen, R.D. Potential Energy Profiles forUnimolecular Reactions of Isolated Or-ganic Ions: [EtCH=NHMe]+ and[Me2C=NHMe]+. J. Chem. Soc., PerkinTrans. 2 1982, 403-408.
160. Bowen, R.D.; Derrick, P.J. The Mecha-nism of Ethylene Loss From the OxoniumIon [CH3CH2O=CHCH2CH3]+. J. Chem.Soc., Chem. Commun. 1990, 1539-1541.
161. Bowen, R.D.; Colburn, A.W.; Derrick, P.J.Unimolecular Reactions of Isolated Or-ganic Ions: Chemistry of the UnsaturatedOxonium Ion [CH2=CHCH=OCH3] +. Org.Mass Spectrom. 1992, 27, 625-632.
162. Bowen, R.D.; Derrick, P.J. The Mecha-nism of Ethylene Elimination From theOxonium Ions [CH3CH2CH=OCH2CH3]+
and [(CH3)2C=OCH2CH3]+. J. Chem. Soc.,Perkin Trans. 2 1992, 1033-1039.
163. Nguyen, M.T.; Vanquickenborne, L.G.;Bouchoux, G. On the Energy Barrier for1,2-Elimination of Methane From Di-methyloxonium Cation. Int. J. Mass Spec-trom. Ion Proc. 1993, 124, R11-R14.
164. Lias, S.G.; Liebman, J.F.; Levin, R.D.Evaluated Gas Phase Basicities and ProtonAffinities of Molecules; Heats of Forma-tion of Protonated Molecules. J. Phys.Chem. Ref. Data 1984, 13, 695-808.
165. Lias, S.G.; Bartmess, J.E.; Liebman, J.F.;Holmes, J.L.; Levin, R.D.; Mallard, W.G.Gas-Phase Ion and Neutral Thermo-chemistry. J. Phys. Chem. Ref. Data 1988,17, Supplement 1, 861 pp.
166. Hunter, E.P.L.; Lias, S.G. Evaluated GasPhase Basicities and Proton Affinities ofMolecules: An Update. J. Phys. Chem.Ref. Data 1998, 27, 413-656.
167. Bowen, R.D.; Stapleton, B.J.; Williams,D.H. Nonconcerted Unimolecular Reac-tions of Ions in the Gas Phase: Isomeriza-tion of Weakly Coordinated CarboniumIons. J. Chem. Soc. ,Chem. Commun.1978, 24-26.
168. Morton, T.H. Gas Phase Analogues ofSolvolysis Reactions. Tetrahedron 1982,38, 3195-3243.
169. Morton, T.H. The Reorientation Criterionand Positive Ion-Neutral Complexes. Org.Mass Spectrom. 1992, 27, 353-368.

328 6 Fragmentation of Organic Ions and Interpretation of EI Mass Spectra
170. Longevialle, P. Ion-Neutral Complexes inthe Unimolecular Reactivity of OrganicCations in the Gas Phase. Mass Spectrom.Rev. 1992, 11, 157-192.
171. McAdoo, D.J. Ion-Neutral Complexes inUnimolecular Decompositions. MassSpectrom. Rev. 1988, 7, 363-393.
172. Rylander, P.N.; Meyerson, S. Organic Ionsin the Gas Phase. I. The Cationated Cyclo-propane Ring. J. Am. Chem. Soc. 1956, 78,5799-5802.
173. Meyerson, S. Cationated CyclopropanesAs Reaction Intermediates in Mass Spec-tra: an Earlier Incarnation of Ion-NeutralComplexes. Org. Mass Spectrom. 1989,24, 267-270.
174. Bowen, R.D.; Williams, D.H.; Hvisten-dahl, G.; Kalman, J.R. Potential EnergyProfiles for Unimolecular Reactions ofOrganic Ions: [C3H8N]+ and [C3H7O]+.Org. Mass Spectrom. 1978, 13, 721-728.
175. Longevialle, P.; Botter, R. Electron ImpactMass Spectra of Bifunctional Steroids.The Interaction Between Ionic and NeutralFragments Derived From the Same ParentIon. Org. Mass Spectrom. 1983, 18, 1-8.
176. Longevialle, P.; Botter, R. The InteractionBetween Ionic and Neutral FragmentsFrom the Same Parent Ion in the MassSpectrometer. Int. J. Mass Spectrom. IonPhys. 1983, 47, 179-182.
177. Redman, E.W.; Morton, T.H. Product-Determining Steps in Gas-Phase Broen-sted Acid-Base Reactions. Deprotonationof 1-Methylcyclopentyl Cation by AmineBases. J. Am. Chem. Soc. 1986, 108, 5701-5708.
178. Filges, U.; Grützmacher, H.-F. Fragmen-tations of Protonated Benzaldehydes ViaIntermediate Ion/Molecule Complexes.Org. Mass Spectrom. 1986, 21, 673-680.
179. Hudson, C.E.; McAdoo, D.J. AlkaneEliminations From Radical CationsThrough Ion-Radical Complexes. Int. J.Mass Spectrom. Ion Proc. 1984, 59, 325-332.
180. McAdoo, D.J.; Hudson, C.E. Ion-NeutralComplex-Mediated Hydrogen Exchange inIonized Butanol: a Mechanism for Non-specific Hydrogen Migration. Org. MassSpectrom. 1987, 22, 615-621.
181. Hammerum, S. Formation and Stabiliza-tion of Intermediate Ion-Neutral Com-plexes in Radical Cation Dissociation Re-actions. J. Chem. Soc., Chem. Commun.1988, 858-859.
182. Hammerum, S.; Audier, H.E. Experimen-tal Verification of the Intermediacy andInterconversion of Ion-Neutral ComplexesAs Radical Cations Dissociate. J. Chem.Soc., Chem. Commun. 1988, 860-861.
183. Traeger, J.C.; Hudson, C.E.; McAdoo,D.J. Isomeric Ion-Neutral ComplexesGenerated From Ionized 2-Methyl-propanol and n-Butanol: the Effect of thePolarity of the Neutral Partner on Com-plex-Mediated Reactions. J. Am. Chem.Soc. Mass Spectrom. 1991, 3, 409-416.
184. Sozzi, G.; Audier, H.E.; Mourgues, P.;Milliet, A. Alkyl Phenyl Ether RadicalCations in the Gas Phase: a ReactionModel. Org. Mass Spectrom. 1987, 22,746-747.
185. Morton, T.H. Ion-Molecule Complexes inUnimolecular Fragmentations of GaseousCations. Alkyl Phenyl Ether MolecularIons. J. Am. Chem. Soc. 1980, 102 , 1596-1602.
186. Blanchette, M.C.; Holmes, J.L.; Lossing,F.P. The Fragmentation of Ionized AlkylPhenyl Ethers. Org. Mass Spectrom. 1989,24, 673-678.
187. Harnish, D.; Holmes, J.L. Ion-RadicalComplexes in the Gas Phase: Structureand Mechanism in the Fragmentation ofIonized Alkyl Phenyl Ethers. J. Am. Chem.Soc. 1991, 113, 9729-9734.
188. Zappey, H.W.; Ingemann, S.; Nibbering,N.M.M. Isomerization and Fragmentationof Aliphatic Thioether Radical Cations inthe Gas Phase: Ion-Neutral Complexes inthe Reactions of Metastable Ethyl PropylThioether Ions. J. Chem. Soc., PerkinTrans. 2 1991, 1887-1892.
189. Broer, W.J.; Weringa, W.D. Potential En-ergy Profiles for the Unimolecular Reac-tions of [C3H7S]+ Ions. Org. Mass Spec-trom. 1980, 229-234.
190. Schwarz, H. Some Newer Aspects of MassSpectrometric Ortho Effects. Top. Curr.Chem. 1978, 73, 231-263.
191. Meyerson, S.; Drews, H.; Field, E.K. MassSpectra of Ortho-Substituted Diaryl-methanes. J. Am. Chem. Soc. 1964, 86,4964-4967.
192. Laseter, J.L.; Lawler, G.C.; Griffin, G.W.Influence of Methyl Substitution on MassSpectra of Diphenylmethanes. AnalyticalApplications. Anal. Lett. 1973, 6, 735-744.
193. Martens, J.; Praefcke, K.; Schwarz, H.Spectroscopic Investigations. IX. Analyti-cal Importance of the Ortho Effect in MassSpectrometry. Benzoic and Thiobenzoic

Reference List 329
Acid Derivatives. Z. Naturforsch., B 1975,30, 259-262.
194. Grützmacher, H.-F. Mechanisms of MassSpectrometric Fragmentation Reactions.XXXII. The Loss of Ortho Halo Substitu-ents From Substituted ThiobenzamideIons. Org. Mass Spectrom. 1981, 16, 448-450.
195. Ramana, D.V.; Sundaram, N. Ortho Ef-fects in Organic Molecules on ElectronImpact. X. Unusual Ortho Effects of theMethyl Group in o-Picolinotoluidide. Org.Mass Spectrom. 1982, 17, 465-469.
196. Ramana, D.V.; Sundaram, N.; George, N.Ortho Effects in Organic Molecules onElectron Impact. 14. Concerted and Step-wise Ejections of SO2 and N2 From N-Arylidene-2-nitrobenzenesulfenamides.Org. Mass Spectrom. 1987, 22, 140-144.
197. Sekiguchi, O.; Noguchi, T.; Ogino, K.;Tajima, S. Fragmentation of MetastableMolecular Ions of Acetylanisoles. Int. J.Mass Spectrom. Ion Proc. 1994, 132, 172-179.
198. Barkow, A.; Pilotek, S.; Grützmacher, H.-F. Ortho Effects: a Mechanistic Study.Eur. Mass Spectrom. 1995, 1, 525-537.
199. Danikiewicz, W. Ortho Interactions Dur-ing Fragmentation of N-(2-Nitrophenyl)methanesulfonamide and ItsN-Alkyl Derivatives Upon Electron Ioni-zation. Eur. Mass Spectrom. 1997, 3, 209-216.
200. Danikiewicz, W. Electron Ionization-Induced Fragmentation of N-Alkyl-o-Nitroanilines: Observation of New Typesof Ortho Effects. Eur. Mass Spectrom.1998, 4, 167-179.
201. Spiteller, G. The Ortho Effect in the MassSpectra of Aromatic Compounds.Monatsh. Chem. 1961, 92, 1147-1154.
202. Smith, J.G.; Wilson, G.L.; Miller, J.M.Mass Spectra of Isopropyl Benzene De-rivatives. A Study of the Ortho Effect.Org. Mass Spectrom. 1975, 10, 5-17.
203. Schwarz, H.; Köppel, C.; Bohlmann, F.Electron Impact-Induced Fragmentation ofAcetylene Compounds. XII. Rearrange-ment of Bis(Trimethylsilyl) Ethers of Un-saturated , -Diols and Mass Spectromet-ric Identification of Isomeric Phenols.Tetrahedron 1974, 30, 689-693.
204. Svendsen, J.S.; Sydnes, L.K.; Whist, J.E.Mass Spectrometric Study of DimethylEsters of Trimethylsilyl Ether Derivativesof Some 3-Hydroxy Dicarboxylic Acids.Org. Mass Spectrom. 1987, 22, 421-429.
205. Svendsen, J.S.; Whist, J.E.; Sydnes, L.K.A Mass Spectrometric Study of the Di-methyl Ester Trimethylsilyl Enol EtherDerivatives of Some 3-OxodicarboxylicAcids. Org. Mass Spectrom. 1987, 22,486-492.
206. Poole, C.F. Recent Advances in the Si-lylation of Organic Compounds for GasChromatography, in Handbook of de-rivates for chromatography, 1st ed.; Blau,G.; King, G.S., editors; Heyden & Son:London, 1977; Chapter 4, pp. 152-200.
207. Halket, H.M.; Zaikin, V.G. Derivatizationin Mass Spectrometry -1. Silylation. Eur.J. Mass Spectrom. 2003, 9, 1-21.
208. Beynon, J.H.; Bertrand, M.; Cooks, R.G.Metastable Loss of Nitrosyl Radical FromAromatic Nitro Compounds. J. Am. Chem.Soc. 1973, 95, 1739-1745.
209. McLuckey, S.A.; Glish, G.L. The Effect ofCharge on Hydroxyl Loss From Ortho-Substituted Nitrobenzene Ions. Org. MassSpectrom. 1987, 22, 224-228.
210. Beynon, J.H.; Saunders, R.A.; Topham,A.; Williams, A.E. The Dissociation of o-Nitrotoluene Under Electron Impact. J.Chem. Soc. 1965, 6403-6405.
211. Herbert, C.G.; Larka, E.A.; Beynon, J.H.The Elimination of Masses 27 and 28From the [M-OH]+ Ion of 2-Nitrotoluene.Org. Mass Spectrom. 1984, 19, 306-310.
212. Meyerson, S.; Puskas, I.; Fields, E.K. Or-ganic Ions in the Gas Phase. XVIII. MassSpectra of Nitroarenes. J. Am. Chem. Soc.1966, 88, 4974-4908.
213. Riley, J.S.; Baer, T.; Marbury, G.D. Se-quential Ortho Effects: Characterizationof Novel [M-35]+ Fragment Ions in theMass Spectra of 2-Alkyl-4,6-Dinitrophenols. J. Am. Chem. Soc. MassSpectrom. 1991, 2, 69-75.
214. Yinon, J. Mass Spectral FragmentationPathways in 2,4,6-Trinitroaromatic Com-pounds. A Tandem Mass SpectrometricCollision-Induced Dissociation Study.Org. Mass Spectrom. 1987, 22, 501-505.
215. Porter, Q.N.; Baldas, J. Mass Spectrometryof Heterocyclic Compounds; 1st ed.;Wiley Interscience: New York, 1971.
216. Schwarz, H.; Bohlmann, F. Mass Spec-trometric Investigation of Amides. II.Electron-Impact Induced Fragmentation of(Phenylacetyl)Aziridine, -Pyrrolidine, and-Piperidine. Tetrahedron Lett. 1973, 38,3703-3706.
217. Nakano, T.; Martin, A. Mass Spectromet-ric Fragmentation of the Oxetanes of 3,5-
330 6 Fragmentation of Organic Ions and Interpretation of EI Mass Spectra
Dimethylisoxazole, 2,4-Dimethylthiazole,and 1-Acetylimidazole. Org. Mass Spec-trom. 1981, 16, 55-61.
218. Grützmacher, H.-F.; Pankoke, D. Rear-rangement Reactions of the MolecularIons of Some Substituted Aliphatic Oxira-nes. Org. Mass Spectrom. 1989, 24 , 647-652.
219. Collin, J.E.; Conde-Caprace, G. Ionizationand Dissociation of Cyclic Ethers byElectron Impact. Int. J. Mass Spectrom.Ion Phys. 1968, 1, 213-225.
220. Duffield, A.M.; Budzikiewicz, H.; Wil-liams, D.H.; Djerassi, C. Mass Spec-trometry in Structural and StereochemicalProblems. LXIV. A Study of the Frag-mentation Processes of Some CyclicAmines. J. Am. Chem. Soc. 1965, 87, 810-816.
221. Burgers, P.C.; Holmes, J.L.; Mommers,A.A.; Terlouw, J.K. Neutral Products ofIon Fragmentations: Hydrogen Cyanideand Hydrogen Isocyanide (HNC) Identi-fied by Collisionally Induced DissociativeIonization. Chem. Phys. Lett. 1983, 102, 1-3.
222. Hop, C.E.C.A.; Dakubu, M.; Holmes, J.L.Do the Aminopyridine Molecular IonsDisplay Aniline- or Pyridine-Type Be-havior? Org. Mass Spectrom. 1988, 23,609-612.
223. Rosenstock, H.M.; Stockbauer, R.; Parr,A.C. Unimolecular Kinetics of PyridineIon Fragmentation. Int. J. Mass Spectrom.Ion Phys. 1981, 38, 323-331.
224. Burgers, P.C.; Holmes, J.L. Kinetic En-ergy Release in Metastable-Ion Fragmen-tations. Rapid Commun. Mass Spectrom.1989, 2, 279-280.
225. Cardoso, A.M.; Ferrer, A.J. FragmentationReactions of Molecular Ions and Dicationsof Indoleamines. Eur. Mass Spectrom.1999, 5, 11-18.
226. Rodríguez, J.G.; Urrutia, A.; Canoira, L.Electron Impact Mass Spectrometry of In-dole Derivatives. Int. J. Mass Spectrom.Ion Proc. 1996, 152, 97-110.
227. Hesse, M. Indolalkaloide, Teil 1: Text; 1sted.; VCH: Weinheim, 1974.
228. Hesse, M. Indolalkaloide, Teil 2: Spek-tren; 1st ed.; VCH: Weinheim, 1974.
229. Biemann, K. Four Decades of StructureDetermination by Mass Spectrometry:From Alkaloids to Heparin. J. Am. Chem.Soc. Mass Spectrom. 2002, 13, 1254-1272.
230. Duffield, A.M.; Beugelmans, R.; Bud-zikiewicz, H.; Lightner, D.A.; Williams,
D.H.; Djerassi, C. Mass Spectrometry inStructural and Stereochemical Problems.LXIII. Hydrogen Rearrangements Inducedby Electron Impact on N-n-Butyl- and N-n-Pentylpyrroles. J. Am. Chem. Soc. 1965,87, 805-810.
231. Aubagnac, J.L.; Campion, p. Mass Spec-trometry of Nitrogen Heterocycles. X.Contribution to the Behavior of the Ani-line Ion and Aminopyridine Ions Prior toFragmentation by Loss of Hydrogen Cya-nide. Org. Mass Spectrom. 1979, 14, 425-429.
232. Heyns, K.; Stute, R.; Scharmann, H. MassSpectrometric Investigations. XII. MassSpectra of Furans. Tetrahedron 1966, 22,2223-2235.
233. De Jong, F.; Sinnige, H.J.M.; Janssen,M.J. Carbon Scrambling in ThiopheneUnder Electron Impact. Rec. Trav. Chim.Pays-Bas 1970, 89, 225-226.
234. Williams, D.H.; Cooks, R.G.; Ronayne, J.;Tam, S.W. Studies in Mass Spectrometry.XXVII. The Decomposition of Furan,Thiophene, and Deuterated Analogs UnderElectron Impact. Tetrahedron Lett. 1968,14, 1777-1780.
235. Riepe, W.; Zander, M. The Mass Spec-trometric Fragmentation Behavior ofThiophene Benzologs. Org. Mass Spec-trom. 1979, 14, 455-456.
236. Rothwell, A.P.; Wood, K.V.; Gupta, A.K.;Prasad, J.V.N.V. Mass Spectra of Some 2-and 3-Cycloalkenylfurans and -Cyclo-alkenylthiophenes and Their Oxy Deriva-tives. Org. Mass Spectrom. 1987, 22, 790-795.

7 Chemical Ionization
Mass spectrometrists have ever been searching for ionization methods softer thanEI, because molecular weight determination is of key importance for structure elu-cidation. Chemical ionization (CI) is the first of the soft ionization methods we aregoing to discuss. Historically, field ionization (FI, Chap. 8) has been applied someyears earlier, and thus CI can be regarded as the second soft ionization method in-troduced to analytical mass spectrometry. Several aspects of CI possess ratherclose similarity to EI making its discussion next to EI more convenient. CI goesback to experiments of Talrose in the early 1950s [1] and was developed to ananalytically useful technique by Munson and Field in the mid-1960s. [2-5] Sincethen, the basic concept of CI has been extended and applied in numerous differentways, meanwhile providing experimental conditions for a wide diversity of ana-lytical tasks. [5,6] The monograph by Harrison is especially recommended forfurther reading. [7]
Note: When a positive ion results from CI, the term may be used without quali-fication; nonetheless positive-ion chemical ionization (PICI) is frequently foundin the literature. When negative ions are formed, the term negative-ion chemi-cal ionization (NICI) should be used. [8]
7.1 Basics of Chemical Ionization
7.1.1 Formation of Ions in Chemical Ionization
In chemical ionization new ionized species are formed when gaseous moleculesinteract with ions. Chemical ionization may involve the transfer of an electron,proton, or other charged species between the reactants. [8] These reactants arei) the neutral analyte M and ii) ions from a reagent gas.
CI differs from what we have encountered in mass spectrometry so far becausebimolecular processes are used to generate analyte ions. The occurrence of bimol-ecular reactions requires a sufficiently large number of ion-molecule collisionsduring the dwelltime of the reactants in the ion source. This is achieved by signifi-cantly increasing the partial pressure of the reagent gas. Assuming reasonable col-lision cross sections and an ion source residence time of 1 µs, [9] a molecule willundergo 30–70 collisions at an ion source pressure of about 2.5 102 Pa. [10] The103–104-fold excess of reagent gas also shields the analyte molecules effectively

332 7 Chemical Ionization
from ionizing primary electrons which is important to suppress competing directEI of the analyte. There are four general pathways to form ions from a neutralanalyte M in CI:
M + [BH]+ [M+H]+ + B proton transfer (7.1)
M + X+ [M+X]+ electrophilic addition (7.2)
M + X+ [M–A]+ + AX anion abstraction (7.3)
M + X+• M+• + X charge exchange (7.4)
Although proton transfer is generally considered to yield protonated analytemolecules, [M+H]+, acidic analytes may also form abundant [M–H]– ions by pro-tonating some other neutral. Electrophilic addition chiefly occurs by attachment ofcomplete reagent ions to the analyte molecule, e.g., [M+NH4]
+ in case of ammoniareagent gas. Hydride abstractions are abundant representatives of anion abstrac-tion, e.g., aliphatic alcohols rather yield [M–H]+ ions than [M+H]+ ions. [11,12]Whereas reactions 7.1–7.3 result in even electron ions, charge exchange (Eq. 7.4)yields radical ions of low internal energy which behave similar to molecular ionsin low-energy electron ionization (Chap. 5.1.5).
Note: It is commonplace to denote [M+H]+ and [M–H]+ ions as quasimolecularions because these ions comprise the otherwise intact analyte molecule and aredetected instead of a molecular ion when CI or other soft ionization methodsare employed. Usually, the term is also applied to [M+alkali]+ ions created byother soft ionization methods.
7.1.2 Chemical Ionization Ion Sources
CI ion sources exhibit close similarity to EI ion sources (Chap. 5.2.1). In fact,modern EI ion sources can usually be switched to CI operation in seconds, i.e.,they are constructed as EI/CI combination ion sources. Such a change requires theEI ion source to be modified according to the needs of holding a comparativelyhigh pressure of reagent gas (some 102 Pa) without allowing too much leakageinto the ion source housing. [13] This is accomplished by axially inserting someinner wall, e.g., a small cylinder, into the ion volume leaving only narrow holesfor the entrance and exit of the ionizing primary electrons, the inlets and the exit-ing ion beam. The ports for the reference inlet, the gas chromatograph (GC) andthe direct probe (DIP) need to be tightly connected to the respective inlet systemduring operation, i.e., an empty DIP is inserted even when another inlet actuallyprovides the sample flow into the ion volume. The reagent gas is introduced di-rectly into the ion volume to ensure maximum pressure inside at minimum lossesto the ion source housing (Fig. 7.1). During CI operation, the pressure in the ionsource housing typically rises by a factor of 20–50 as compared to the backgroundpressure of the instrument, i.e., to 5 10–4–10–3 Pa. Thus, sufficient pumping

7.2 Chemical Ionization by Protonation 333
speed ( 200 l s–1) is necessary to maintain stable operation in CI mode. The en-ergy of the primary electrons is preferably adjusted to some 200 eV, because elec-trons of lower energy experience difficulties in penetrating the reagent gas.
Fig. 7.1. Schematic layout of a chemical ionization ion source. Adapted from Ref. [14] bypermission. © Springer-Verlag Heidelberg, 1991.
7.1.3 Sensitivity of Chemical Ionization
Ionization in CI is the result of one or several competing chemical reactions.Therefore, the sensitivity in CI strongly depends on the conditions of the experi-ment. In addition to primary electron energy and electron current, the reagent gas,the reagent gas pressure, and the ion source temperature have to be stated with thesensitivity data to make a comparison. Modern magnetic sector instruments arespecified to have a sensitivity of about 4 10-8 C µg–1 for the [M+H]+ quasi-molecular ion of methylstearate, m/z 299, at R = 1000 in positive-ion CI mode.This is approximately one order of magnitude less than for EI.
7.2 Chemical Ionization by Protonation
7.2.1 Source of Protons
The occurrence of [M+H]+ ions due to bimolecular processes between ions andtheir neutral molecular counterparts is called autoprotonation or self-CI. Usually,autoprotonation is an unwanted phenomenon in EI-MS. [M+1] ions from auto-protonation become more probable with increasing pressure and with decreasingtemperature in the ion source. Furthermore, the formation of [M+1] ions is pro-moted if the analyte is of high volatility or contains acidic hydrogens. Thus, self-CI can mislead mass spectral interpretation either by leading to an overestimationof the number of carbon atoms from the 13C isotopic peak (Chap. 3.2.1) or by

334 7 Chemical Ionization
indicating a by 1 u higher molecular mass (Fig. 7.6 and cf. nitrogen ruleChap. 6.2.5). However, in CI-MS with methane or ammonia reagent gas, for ex-ample, the process of autoprotonation is employed to generate the reactant ions.
Note: The process M* + X MX+• + e–, i.e., ionization of internally excitedmolecules upon interaction with other neutrals is known as chemi-ionization.Chemi-ionization is different from CI in that there is no ion-molecule reactioninvolved [8,15] (cf. Penning ionization, Chap. 2.2.1).
7.2.2 Methane Reagent Gas Plasma
The EI mass spectrum of methane has already been discussed (Chap. 6.1). Risingthe partial pressure of methane from the standard value in EI of about 10–4 Pa to102 Pa significantly alters the resulting mass spectrum. [1] The molecular ion,CH4
+•, m/z 16, almost vanishes and a new species, CH5+, is detected at m/z 17 in-
stead. [16] In addition some ions at higher mass occur, the most prominent ofwhich may be assigned as C2H5
+, m/z 29, [17,18] and C3H5+, m/z 41 (Fig. 7.2). The
positive ion CI spectrum of methane can be explained as the result of competingand consecutive bimolecular reactions in the ion source: [4,6,10]
CH4 + e– CH4+•, CH3
+, CH2+•, CH+, C+•, H2
+•, H+ (7.5)
CH4+• + CH4 CH5
+ + CH3• (7.6)
CH3+ + CH4 C2H7
+ C2H5+ + H2 (7.7)
CH2+• + CH4 C2H4
+• + H2 (7.8)
CH2+• + CH4 C2H3
+ + H2 + H• (7.9)
C2H3+ + CH4 C3H5
+ + H2 (7.10)
C2H5+ + CH4 C3H7
+ + H2 (7.11)
The relative abundances of these product ions change dramatically as the ionsource pressure increases from EI conditions to 25 Pa. Above 100 Pa, the relativeconcentrations stabilize at the levels represented by the CI spectrum of methanereagent gas (Fig. 7.3). [4,19] Fortunately, the ion source pressure of some 102 Pain CI practice is in the plateau region of Fig. 7.3, thereby ensuring reproducible CIconditions. The influence of the ion source temperature is more pronounced thanin EI because the high collision rate rapidly effects a thermal equilibrium.
Note: Although the temperature of the ionized reagent gas is by far below thatof a plasma, the simultaneous presence of free electrons, protons, numerousions and radicals lead to its description as a reagent gas plasma.

7.2 Chemical Ionization by Protonation 335
Fig. 7.2. Comparison of the methane spectrum upon electron ionization at different ionsource pressures: (a) approx. 10–4 Pa, (b) approx. 102 Pa. The latter represents the typicalmethane reagent gas spectrum in positive-ion CI.
Fig. 7.3. Percentage of total ionization above m/z 12 (% 12) of (a) CH4+•, m/z 16, and
CH5+, m/z 17, and (b) CH3
+, m/z 15, and C2H5+, m/z 29, as a function of CH4 pressure at
100 eV electron energy and at ion source temperatures 50 °C (_____) and 175 °C (-----);100 mTorr = 13.33 Pa. Adapted from Ref. [19] by permission. © Elsevier Science, 1990.
7.2.2.1 CH5+ and Related Ions
The protonated methane ion, CH5+, represents a reactive as well as fascinating
species in the methane reagent gas plasma. Its structure has been calculated andexperimentally verified. [16] The chemical behavior of the CH5
+ ion appears to becompatible with a stable structure, involving a three-center two-electron bond as-sociating 2 hydrogens and the carbon atom. Rearrangement of this structure due toexchange between one of these hydrogens and one of the three remaining hydro-gens appears to be a fast process that is induced by interactions with the chemicalionization gas. In case of the C2H7
+ intermediate during C2H5+ ion formation sev-

336 7 Chemical Ionization
eral isomerizing structures are discussed. [17,18] In protonated fluoromethane, theconditions are quite different, promoting a weak C–F and a strong F–H bond. [20]
H
C
HH
H
H
40°
°
°
1.24A
0.85 A
H
C
HH
FH
Scheme 7.1.
7.2.3 Energetics of Protonation
The tendency of a (basic) molecule B to accept a proton is quantitatively describedby its proton affinity PA (Chap. 2.11). For such a protonation we have: [3]
Bg + Hg+ [BH]g
+; – Hr0 = PA(B) (7.12)
In case of an intended protonation under the conditions of CI one has to com-pare the PAs of the neutral analyte M with that of the complementary base B ofthe proton-donating reactant ion [BH]+ (Brønsted acid). Protonation will occur aslong as the process is exothermic, i.e., if PA(B) < PA(M). The heat of reaction hasbasically to be distributed among the degrees of freedom of the [M+H]+ analyteion. [12,21] This means in turn, that the minimum internal energy of the [M+H]+
ions is determined by:
Eint(M+H) = – PA = PA(M) – PA(B) (7.13)
Some additional thermal energy will also be contained in the [M+H]+ ions.Having PA data at hand (Table 2.6) one can easily judge whether a reagent ionwill be able to protonate the analyte of interest and how much energy will be putinto the [M+H]+ ion.
Example: The CH5+ reactant ion will protonate C2H6 because Eq. 7.13 gives
PA = PA(CH4) – PA(C2H6) = 552 – 601 = –49 kJ mol–1. The product, protonatedethane, C2H7
+, immediately stabilizes by H2 loss to yield C2H5+. [17,18] In case of
tetrahydrofurane, protonation is more exothermic: PA = PA(CH4) – PA(C4H8O) = 552 – 831 = –279 kJ mol–1.
7.2.3.1 Impurities of Higher PA than the Reagent Gas
Due to the above energetic considerations, impurities of the reagent gas having ahigher PA than the neutral reagent gas are protonated by the reactant ion. [3] Re-sidual water is a frequent source of contamination. Higher concentrations of waterin the reagent gas may even alter its properties completely, i.e., H3O
+ becomes thepredominant species in a CH4/H2O mixture under CI conditions (Fig. 7.4). [22]
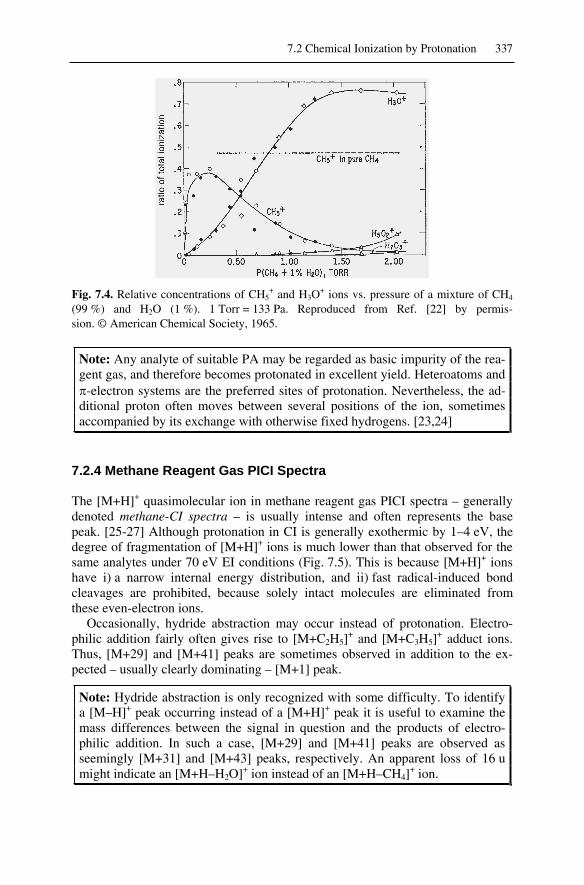
7.2 Chemical Ionization by Protonation 337
Fig. 7.4. Relative concentrations of CH5+ and H3O
+ ions vs. pressure of a mixture of CH4
(99 %) and H2O (1 %). 1 Torr = 133 Pa. Reproduced from Ref. [22] by permis-sion. © American Chemical Society, 1965.
Note: Any analyte of suitable PA may be regarded as basic impurity of the rea-gent gas, and therefore becomes protonated in excellent yield. Heteroatoms and
-electron systems are the preferred sites of protonation. Nevertheless, the ad-ditional proton often moves between several positions of the ion, sometimesaccompanied by its exchange with otherwise fixed hydrogens. [23,24]
7.2.4 Methane Reagent Gas PICI Spectra
The [M+H]+ quasimolecular ion in methane reagent gas PICI spectra – generallydenoted methane-CI spectra – is usually intense and often represents the basepeak. [25-27] Although protonation in CI is generally exothermic by 1–4 eV, thedegree of fragmentation of [M+H]+ ions is much lower than that observed for thesame analytes under 70 eV EI conditions (Fig. 7.5). This is because [M+H]+ ionshave i) a narrow internal energy distribution, and ii) fast radical-induced bondcleavages are prohibited, because solely intact molecules are eliminated fromthese even-electron ions.
Occasionally, hydride abstraction may occur instead of protonation. Electro-philic addition fairly often gives rise to [M+C2H5]
+ and [M+C3H5]+ adduct ions.
Thus, [M+29] and [M+41] peaks are sometimes observed in addition to the ex-pected – usually clearly dominating – [M+1] peak.
Note: Hydride abstraction is only recognized with some difficulty. To identifya [M–H]+ peak occurring instead of a [M+H]+ peak it is useful to examine themass differences between the signal in question and the products of electro-philic addition. In such a case, [M+29] and [M+41] peaks are observed asseemingly [M+31] and [M+43] peaks, respectively. An apparent loss of 16 umight indicate an [M+H–H2O]+ ion instead of an [M+H–CH4]
+ ion.

338 7 Chemical Ionization
Fig. 7.5. Comparison of (a) 70 eV EI spectrum and (b) methane reagent gas CI spectrum ofthe amino acid methionine. Fragmentation is strongly reduced in the CI mass spectrum.
7.2.5 Other Reagent Gases in PICI
As pointed out, the value of PA determines whether a particular analyte can beprotonated by a certain reactant ion and how exothermic the protonation will be.Considering other reagent gases than methane therefore allows some tuning of thePICI conditions. The systems employed include molecular hydrogen and hydro-gen-containing mixtures, [12,21,28] isobutane, [29-33] ammonia, [30,34-40] di-methylether, [41] diisopropylether, [42] acetone, [11] acetaldehyde, [11], benzene,[43] and iodomethane. [44] Even transition metal ions such as Cu+ [45] and Fe+
[46] can be employed as reactant ions to locate double bonds. However, nitrousoxide reagent gas better serves that purpose. [39,47,48] The most common reagentgases are summarized in Table 7.1. The EI and CI spectra of ammonia and isobu-tane are compared in Fig. 7.6.
Isobutane is an especially versatile reagent gas, because i) it provides low-fragmentation PICI spectra of all but the most unpolar analytes, ii) gives almostexclusively one well-defined adduct ([M+C4H9]
+, [M+57]) if any (Fig. 7.7), andiii) can also be employed for electron capture (Chap. 7.4).

7.2 Chemical Ionization by Protonation 339
Fig. 7.6. Standard EI versus positive-ion CI spectra of isobutane (upper) and ammonia(lower part). Ammonia forms abundant cluster ions upon CI.
Fig. 7.7. Comparison of (a) 70 eV EI and (b) isobutane-CI spectrum of glycerol. Instead ofa molecular ion, an [M+H]+ quasimolecular ion is observed in EI mode, too. In addition to[M+H]+, the CI spectrum shows few fragment ions and a weak [2M+H]+ cluster ion signal.
Example: In an overdose case where evidence was available for the ingestionof Percodan (a mixture of several common drugs) the isobutane-CI mass spectrumof the gastric extract was obtained (Fig. 7.8). [29] All drugs give rise to an[M+H]+ ion. Due to the low exothermicity of protonation by the tert-C4H9
+ ion,most [M+H]+ ions do not show fragmentation. Solely that of aspirin shows intense

340 7 Chemical Ionization
fragment ion peaks that can be assigned as [M+H–H2O]+, m/z 163; [M+H–H2C=CO]+, m/z 139; and [M+H–CH3COOH]+, m/z 121. In addition to the[M+H]+ ion at m/z 180, phenacetin forms a [2M+H]+ cluster ion, m/z 359. Such[2M+H]+ cluster ions are frequently observed in CI-MS.
Fig. 7.8. Isobutane CI mass spectrum of gastric contents in an overdose case. Reproducedfrom Ref. [29] by permission. © American Chemical Society, 1970.
Table 7.1. Common PICI reagent gases
Reagent Gas Reactant Ions Neutral fromReactant Ions
PA of NeutralProduct
Analyte Ions
H2 H3+ H2 424 [M+H]+, [M–H]+
CH4 CH5+,
(C2H5+ and
C3H5+)
CH4 552 [M+H]+ ([M+C2H5]+
and [M+C3H5]+)
i-C4H10 t-C4H9+ i-C4H8 820 [M+H]+, ([M+C4H9]
+,eventually [M+C3H3]
+,[M+C3H5]
+ and[M+C3H7]
+)NH3 NH4
+ NH3 854 [M+H]+, [M+NH4]+
Note: Resulting from the large excess of the reagent gas, its spectrum is ofmuch higher intensity than that of the analyte. Therefore, CI spectra are usuallyacquired starting above the m/z range occupied by reagent ions, e.g., abovem/z 50 for methane or above m/z 70 for isobutane.
7.3 Charge Exchange Chemical Ionization 341
7.3 Charge Exchange Chemical Ionization
Charge exchange (CE) or charge transfer ionization occurs when an ion-neutralreaction takes place in which the ionic charge is transferred to the neutral. [8] Inprinciple, any of the reagent systems discussed so far is capable to effect CE be-cause the respective reagent molecular ions X+• are also present in the plasma:
X+• + M M+• + X (7.14)
However, other processes, in particular proton transfer, are prevailing withmethane, isobutane, and ammonia, for example. Reagent gases suitable for CEshould exhibit abundant molecular ions even under the conditions of CI, whereaspotentially protonating species have to be absent or at least of minor abundance.
Note: The acronym CE is also used for capillary electrophoresis, a separationmethod. CE may be coupled to a mass spectrometer via an electrospray inter-face (Chaps. 11, 12), and thus CE-CI and CE-ESI-MS must not be confused.
7.3.1 Energetics of CE
The energetics of CE are determined by the ionization energy (IE) of the neutralanalyte, IE(M), and the recombination energy of the reactant ion, RE(X+•). Recom-bination of an atomic or molecular ion with a free electron is the inverse of itsionization. RE(X+•) is defined as the exothermicity of the gas phase reaction: [7]
X+• + e– X; – Hr = RE(X+•) (7.15)
For monoatomic ions, the RE has the same numerical value as the IE of theneutral; for diatomic or polyatomic species differences due to storage of energy ininternal modes or electronic excitation may occur. Ionization of the analyte via CEis effected if: [49]
RE(X+•) – IE(M) > 0 (7.16)
Now, the heat of reaction, and thus the minimum internal energy of the analytemolecular ion, is given by: [50]
Eint(M+•) RE(X+•) – IE(M) (7.17)
(The sign indicates the additional contribution of thermal energy.) In sum-mary, no CE is expected if RE(X+•) is less than IE(M); predominantly M+• ions areexpected if RE(X+•) is slightly above IE(M); and extensive fragmentation will be ob-served if RE(X+•) is notably greater than IE(M). [50] Accordingly, the “softness” ofCE-CI can be adjusted by choosing a reagent gas of suitable RE. Fortunately, thedifferences between REs and IEs are small, and unless highest accuracy is re-quired, IE data may be used to estimate the effect of a CE reagent gas (Table 2.1).

342 7 Chemical Ionization
7.3.2 Reagent Gases for CE-CI
The gases employed for CE-CI are numerous. Reagent gases such as hydrogen[21] or methane can also affect CE. Typically, pure compounds are employed asCE reagent gases, but occasionally they are diluted with nitrogen to act as an inertor sometimes reactive buffer gas (Table 7.2). Compared to protonating CI condi-tions, the reagent gas is typically admitted at somewhat lower pressure (15–80 Pa).Primary electron energies are reported in the 100–600 eV range. The major rea-gent gases include chlorobenzene, [51] benzene, [43,52,53] carbon disulfide,[54,55] xenon, [54,56] carbon oxysulfide, [54-58] carbon monoxide, [50,54,56]nitrogen oxide, [50,59] dinitrogen oxide, [55,59] nitrogen, [54] and argon. [54]
Example: The CE-CI spectra of cyclohexene are compared to the 70 eV EIspectrum. Different CE reagent gases show different degrees of fragmentation(Fig. 7.9). [61] The relative intensity of the molecular ion increases as the RE ofthe reagent gas decreases. CE-CI mass spectra closely resemble low-energy EIspectra (Chap. 5.1.5) because molecular ions are formed upon CE. As the sensi-tivity of CE-CI is superior to low-energy EI [49], CE-CI may be preferred overlow-energy EI.
Fig. 7.9. Comparison of 70 eV EI mass spectrum and CE mass spectra of cyclohexene re-corded with different reagent gases. Adapted from Ref. [61] by permission. © John Wiley& Sons, 1976.
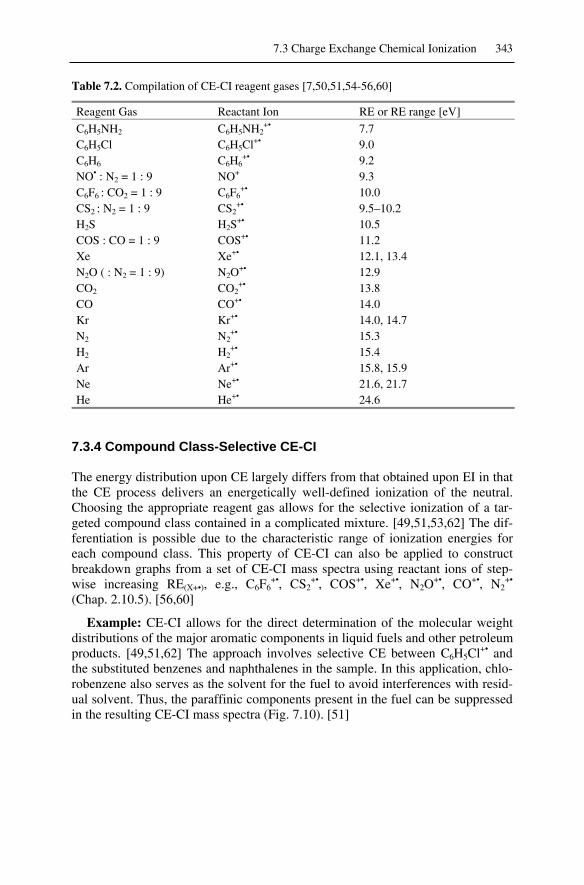
7.3 Charge Exchange Chemical Ionization 343
Table 7.2. Compilation of CE-CI reagent gases [7,50,51,54-56,60]
Reagent Gas Reactant Ion RE or RE range [eV]C6H5NH2 C6H5NH2
+• 7.7C6H5Cl C6H5Cl+• 9.0C6H6 C6H6
+• 9.2NO• : N2 = 1 : 9 NO+ 9.3C6F6 : CO2 = 1 : 9 C6F6
+• 10.0CS2 : N2 = 1 : 9 CS2
+• 9.5–10.2H2S H2S
+• 10.5COS : CO = 1 : 9 COS+• 11.2Xe Xe+• 12.1, 13.4N2O ( : N2 = 1 : 9) N2O
+• 12.9CO2 CO2
+• 13.8CO CO+• 14.0Kr Kr+• 14.0, 14.7N2 N2
+• 15.3H2 H2
+• 15.4Ar Ar+• 15.8, 15.9Ne Ne+• 21.6, 21.7He He+• 24.6
7.3.4 Compound Class-Selective CE-CI
The energy distribution upon CE largely differs from that obtained upon EI in thatthe CE process delivers an energetically well-defined ionization of the neutral.Choosing the appropriate reagent gas allows for the selective ionization of a tar-geted compound class contained in a complicated mixture. [49,51,53,62] The dif-ferentiation is possible due to the characteristic range of ionization energies foreach compound class. This property of CE-CI can also be applied to constructbreakdown graphs from a set of CE-CI mass spectra using reactant ions of step-wise increasing RE(X+•), e.g., C6F6
+•, CS2+•, COS+•, Xe+•, N2O
+•, CO+•, N2+•
(Chap. 2.10.5). [56,60]
Example: CE-CI allows for the direct determination of the molecular weightdistributions of the major aromatic components in liquid fuels and other petroleumproducts. [49,51,62] The approach involves selective CE between C6H5Cl+• andthe substituted benzenes and naphthalenes in the sample. In this application, chlo-robenzene also serves as the solvent for the fuel to avoid interferences with resid-ual solvent. Thus, the paraffinic components present in the fuel can be suppressedin the resulting CE-CI mass spectra (Fig. 7.10). [51]

344 7 Chemical Ionization
Fig. 7.10. (a) Ionization energies of certain classes of organic molecules as a function oftheir molecular weight, and (b) relative sensitivities for ( ) alkylbenzenes,( ) polyolefines, and ( ) substituted naphthalenes in chlorobenzene CE-CI. Adaptedfrom Ref. [51] by permission. © American Chemical Society, 1983.
7.3.5 Regio- and Stereoselectivity in CE-CI
Small differences in activation energy (AE) as existing for fragmentations of re-gioisomers [54,55,57,58] or stereoisomers do not cause significant differences in70 eV EI spectra. Pathways leading to fragments F1 and F1' cannot be distin-guished, because minor differences in the respective AEs are overridden by theexcess energy of the fragmenting ions (Chap. 2.5). The situation changes if an en-ergy-tunable ionization method is applied which in addition offers a narrow en-ergy distribution. If the appearance energies AE(F1) and AE(F1') of the fragments F1
and F1' from isomeric precursor are just below RE(x+•), a significant alteration ofrelative intensities of F1 and F1' would be effected.
Example: In epimeric 4-methylcyclohexanols the methyl and the hydroxylgroup can either both reside in axial position (cis) or one is equatorial while theother is axial (trans). In the trans isomer, stereospecific 1,4–H2O eliminationshould proceed easily (Chap. 6.10.3), whereas H2O loss from the cis isomer ismore demanding. CE-CI using C6F6
+• reactant ions clearly distinguishes thesestereoisomers by their M+•/[M–H2O]+• ratio (trans : cis = 0.09 : 2.0 = 23). [60]
H
H3C
OH
H
+.
-H2O[C7H12]+.fast
trans
cisslow
+.[C7H12]-H2O
+.CH3
H
OH
H
14
[M-H20]
M+.
+.
+.
+.M
[M-H20]
Scheme 7.2.

7.4 Electron Capture 345
7.4 Electron Capture
In any CI plasma, both positive and negative ions are formed simultaneously, e.g.,[M+H]+ and [M–H]– ions, and it is just a matter of the polarity of the accelerationvoltage which ions are extracted from the ion source. [63] Thus, negative-ionchemical ionization (NICI) mass spectra are readily obtained by deprotonation ofacidic analytes like phenols or carboxylic acids or by anion attachment. [64-67]
However, one process of negative-ion formation is of special interest, becauseit provides superior sensitivity with many toxic and/or environmentally relevantsubstances: [68-72] this is electron capture (EC) or electron attachment. [73] ECis a resonance process whereby an external electron is incorporated into an orbitalof an atom or molecule. [8] Strictly speaking, EC is not a sub-type of CI becausethe electrons are not provided by a reacting ion, but are freely moving through thegas at thermal energy. Nonetheless, the ion source conditions to achieve EC aresimilar to PICI. [74]
7.4.1 Ion Formation by Electron Capture
When a neutral molecule interacts with an electron of high kinetic energy, thepositive radical ion is generated by EI. If the electrons have less energy than the IEof the respective neutral, EI is prohibited. As the electrons approach thermal en-ergy, EC can occur instead. Under EC conditions, there are three different mecha-nisms of ion formation: [65,75-77]
M + e– M–•; resonance electron capture (7.18)
M + e– [M–A]– + A• dissociative electron capture (7.19)
M + e– [M–B]– + B+ + e– ion-pair formation (7.20)
Resonance electron capture directly yields the negative molecular ion, M–•,whereas even-electron fragment ions are formed by dissociative electron captureand ion-pair formation. Molecular ions are generated by capture of electrons with0–2 eV kinetic energy, whereas fragment ions are generated by capture of elec-trons from 0 to 15 eV. Ion-pair formation tends to occur when electron energiesexceed 10 eV. [77]
7.4.3 Energetics of EC
The potential energy curves of a neutral molecule AB and the potential ionicproducts from processes 7.18–7.20 are compared below (Fig. 7.11). These graphsreveal that the formation of negative molecular ions, AB–•, is energetically muchmore favorable than homolytic bond dissociation of AB and that the AB–• ionshave internal energies close to the activation energy for dissociation. [65,73,75]

346 7 Chemical Ionization
The negative molecular ions from EC are therefore definitely less excited thantheir positive counterparts from 70 eV EI.
Fig. 7.11. Energetics of (a) resonance electron capture, (b) dissociative electron capture,and (c) ion-pair formation. Adapted from Ref. [75] by permission. © John Wiley & Sons,1981.
Example: The EC mass spectrum of benzo[a]pyrene, C20H12, exclusivelyshows the negative molecular ion at m/z 252 (Fig. 7.12). The two additional minorsignals correspond to impurities of the sample.
Fig. 7.12. EC spectrum of benzo[a]pyrene; isobutane buffer gas, ion source 200 °C.
The energetics of EC are determined by the electron affinity (EA) of the neu-tral. The EA is the negative of the enthalpy of reaction of the attachment of a zerokinetic energy electron to a neutral molecule or atom:
M + e– M–•, – Hr = EA(M) (7.21)
As the IE of a molecule is governed by the atom of lowest IE within that neu-tral (Chap. 2.2.2), the EA of a molecule is basically determined by the atom ofhighest electronegativity. This is why the presence of halogens, in particular F andCl, and nitro groups make analytes become attractive candidates for EC(Table 7.3). [78] If EC occurs with a neutral of negative EA, the electron–mole-cule complex will have a short lifetime (autodetachment), but in case of positiveEA a negative molecular ion can persist.

7.4 Electron Capture 347
Example: Consider the dissociative EC process CF2Cl2 + e– F– + CFCl2•.
Let the potential energy of CF2Cl2 be zero. The homolytic bond dissociation en-ergy D(F–CFCl2) has been calculated as 4.93 eV. Now, the potential energy of theproducts is 4.93 eV less the electron affinity of a fluorine atom (EA(F•) = 3.45 eV),i.e., the process is endothermic by 1.48 eV. The experimental AE of the fragmentsis 1.8 eV. This yields a minimum excess energy of 0.32 eV (Fig. 7.13). [79]
Fig. 7.13. Potential energy diagram of dissociative EC process CF2Cl2 + e– F– + CFCl2•.
Table 7.3. Selected electron affinities [80]
Compound EA [eV] Compound EA [eV]carbon dioxide –0.600 pentachlorobenzene 0.729naphthalene –0.200 carbon tetrachloride 0.805acetone 0.002 biphenylene 0.8901,2-dichlorobenzene 0.094 nitrobenzene 1.006benzonitrile 0.256 octafluorocyclobutane 1.049molecular oxygen 0.451 pentafluorobenzonitrile 1.084carbon disulfide 0.512 2-nitronaphthalene 1.184benzo[e]pyrene 0.534 1-bromo-4-nitrobenzene 1.292tetrachloroethylene 0.640 antimony pentafluoride 1.300
7.4.4 Creating Thermal Electrons
Thermionic emission from a heated metal filament is the standard source of freeelectrons. However, those electrons usually are significantly above thermal energyand need to be decelerated for EC. Buffer gases such as methane, isobutane, orcarbon dioxide serve well for that purpose, but others have also been used.[64,74,81] The gases yield almost no negative ions themselves while moderatingthe energetic electrons to thermal energy. [69] Despite inverse polarity of the ex-traction voltage, the same conditions as for PICI can usually be applied(Fig. 7.12). However, EC is comparatively sensitive to ion source conditions.[67,82] The actual ion source temperature, the buffer gas, the amount of sample

348 7 Chemical Ionization
introduced, and ion source contaminations play important roles each. Regularcleaning of the ion source is important. [70] Lowering the ion source temperatureprovides lower-energy electrons, e.g., assuming Maxwellian energy distributionthe mean electron energy is 0.068 eV at 250 °C and 0.048 eV at 100 °C. [69] Al-ternatively, electrons of well-defined low energy can be provided by an electronmonochromator. [79,82-84]
7.4.5 Appearance of EC Spectra
EC spectra generally exhibit strong molecular ions and some primary fragmentions. As M–• is an odd-electron species, homolytic bond cleavages as well as rear-rangement fragmentations may occur (Fig. 7.14) Apart from the changed chargesign, there are close similarities to the fragmentation pathways of positive mo-lecular ions (Chap. 6.). [67,76,77]
Fig. 7.14. Methane EC spectrum of 2,3,4,5-tetrachloronitrobenzene. Redrawn from Ref.[77] by permission. © John Wiley & Sons, 1988.
7.4.6 Applications of EC
EC, especially when combined with GC-MS, is widespread in monitoring envi-ronmental pollutants such as toxaphene, [72] dioxins, [74,79,82,84] pesticides,[79] halogenated metabolites, [71] DNA adducts, [78] explosives, [66,85,86] andothers. [68,69,87,88]
7.5 Sample Introduction in CI
In CI, the analyte is introduced into the ion source the same way as described forEI, i.e., via direct insertion probe (DIP), direct exposure probe (DEP), gas chro-matograph (GC), or reservoir inlet (Chap. 5.3).

7.5 Sample Introduction in CI 349
7.5.1 Desorption Chemical Ionization
CI in conjunction with a direct exposure probe is known as desorption chemicalionization (DCI). [30,89,90] In DCI, the analyte is applied from solution or sus-pension to the outside of a thin resistively heated wire loop or coil. Then, the ana-lyte is directly exposed to the reagent gas plasma while being rapidly heated atrates of several hundred °C s–1 and to temperatures up to about 1500 °C(Chap. 5.3.2 and Fig. 5.16). The actual shape of the wire, the method how exactlythe sample is applied to it, and the heating rate are of importance for the analyticalresult. [91,92] The rapid heating of the sample plays an important role in promot-ing molecular species rather than pyrolysis products. [93] A laser can be used toeffect extremely fast evaporation from the probe prior to CI. [94] In case of non-availability of a dedicated DCI probe, a field emitter on a field desorption probe(Chap. 8) might serve as a replacement. [30,95] Different from desorption elec-tron ionization (DEI), DCI plays an important role. [92] DCI can be employed todetect arsenic compounds present in the marine and terrestrial environment [96],to determine the sequence distribution of -hydroxyalkanoate units in bacterialcopolyesters [97], to identify additives in polymer extracts [98] and more. [99]Provided appropriate experimental setup, high resolution and accurate mass meas-urements can also be achieved in DCI mode. [100]
Example: DCI requires fast scanning of the mass analyzer because of therather sudden evaporation of the analyte. The pyrolysis (Py) DCI mass spectrumof cellulose, H(C6H10O5)nOH, acquired using NH3 reagent gas, 100 eV electronenergy, and scanning m/z 140–700 at 2 s per cycle shows a series of distinct sig-nals. The peaks are separated by 162 u, i.e., by C6H10O5 saccharide units. Themain signals are due to ions from anhydro-oligosaccharides, [(C6H10O5)n+NH4]
+,formed upon heating of the cellulose in the ammonia CI plasma (Fig. 7.15). [91]
Fig. 7.15. Ammonia-Py-DCI mass spectrum of cellulose and total ion current. Adaptedfrom Ref. [91] by permission. © Research Council of Canada, 1994.
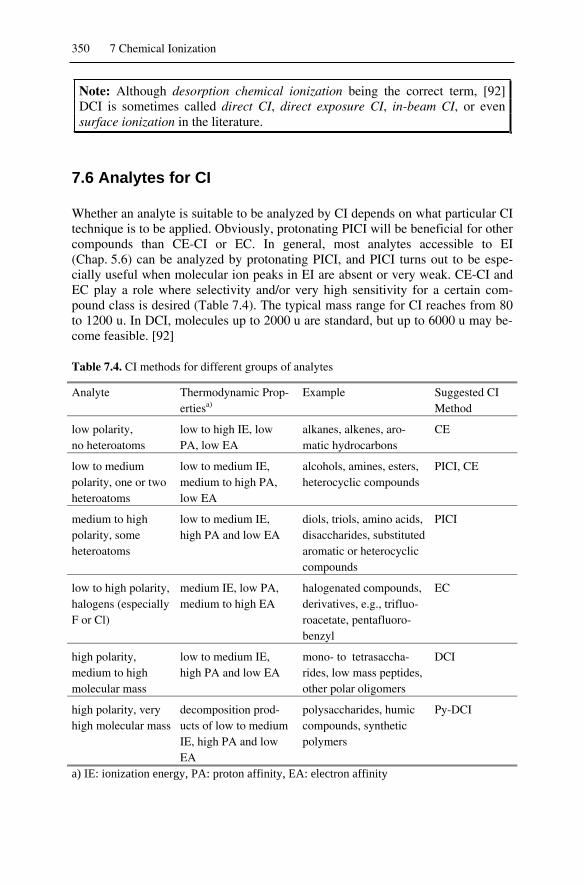
350 7 Chemical Ionization
Note: Although desorption chemical ionization being the correct term, [92]DCI is sometimes called direct CI, direct exposure CI, in-beam CI, or evensurface ionization in the literature.
7.6 Analytes for CI
Whether an analyte is suitable to be analyzed by CI depends on what particular CItechnique is to be applied. Obviously, protonating PICI will be beneficial for othercompounds than CE-CI or EC. In general, most analytes accessible to EI(Chap. 5.6) can be analyzed by protonating PICI, and PICI turns out to be espe-cially useful when molecular ion peaks in EI are absent or very weak. CE-CI andEC play a role where selectivity and/or very high sensitivity for a certain com-pound class is desired (Table 7.4). The typical mass range for CI reaches from 80to 1200 u. In DCI, molecules up to 2000 u are standard, but up to 6000 u may be-come feasible. [92]
Table 7.4. CI methods for different groups of analytes
Analyte Thermodynamic Prop-ertiesa)
Example Suggested CIMethod
low polarity,no heteroatoms
low to high IE, lowPA, low EA
alkanes, alkenes, aro-matic hydrocarbons
CE
low to mediumpolarity, one or twoheteroatoms
low to medium IE,medium to high PA,low EA
alcohols, amines, esters,heterocyclic compounds
PICI, CE
medium to highpolarity, someheteroatoms
low to medium IE,high PA and low EA
diols, triols, amino acids,disaccharides, substitutedaromatic or heterocycliccompounds
PICI
low to high polarity,halogens (especiallyF or Cl)
medium IE, low PA,medium to high EA
halogenated compounds,derivatives, e.g., trifluo-roacetate, pentafluoro-benzyl
EC
high polarity,medium to highmolecular mass
low to medium IE,high PA and low EA
mono- to tetrasaccha-rides, low mass peptides,other polar oligomers
DCI
high polarity, veryhigh molecular mass
decomposition prod-ucts of low to mediumIE, high PA and lowEA
polysaccharides, humiccompounds, syntheticpolymers
Py-DCI
a) IE: ionization energy, PA: proton affinity, EA: electron affinity

Reference List 351
7.7 Mass Analyzers for CI
For the choice of a mass analyzer to be operated with a CI ion source the samecriteria as for EI apply (Chap. 5.5). As mentioned before, sufficient pumpingspeed at the ion source housing is a prerequisite.
Reference List
1. Talrose, V.L.; Ljubimova, A.K. SecondaryProcesses in the Ion Source of a MassSpectrometer (Reprint From 1952). J.Mass Spectrom. 1998, 33, 502-504.
2. Munson, M.S.B.; Field, F.H. Reactions ofGaseous Ions. XV. Methane + 1% Ethaneand Methane + 1% Propane. J. Am. Chem.Soc. 1965, 87, 3294-3299.
3. Munson, M.S.B. Proton Affinities and theMethyl Inductive Effect. J. Am. Chem.Soc. 1965, 87, 2332-2336.
4. Munson, M.S.B.; Field, F.H. ChemicalIonization Mass Spectrometry. I. GeneralIntroduction. J. Am. Chem. Soc. 1966, 88,2621-2630.
5. Munson, M.S.B. Development of Chemi-cal Ionization Mass Spectrometry. Int. J.Mass Spectrom. 2000, 200, 243-251.
6. Richter, W.J.; Schwarz, H. Chemical Ioni-zation - a Highly Important ProductiveMass Spectrometric Analysis Method.Angew. Chem. 1978, 90, 449-469.
7. Harrison, A.G. Chemical Ionization MassSpectrometry; 2nd ed.; CRC Press: BocaRaton, 1992.
8. Todd, J.F.J. Recommendations for No-menclature and Symbolism for MassSpectroscopy Including an Appendix ofTerms Used in Vacuum Technology. Int.J. Mass Spectrom. Ion. Proc. 1995, 142,211-240.
9. Griffith, K.S.; Gellene, G.I. A SimpleMethod for Estimating Effective IonSource Residence Time. J. Am. Soc. MassSpectrom. 1993, 4, 787-791.
10. Field, F.H.; Munson, M.S.B. Reactions ofGaseous Ions. XIV. Mass SpectrometricStudies of Methane at Pressures to 2 Torr.J. Am. Chem. Soc. 1965, 87, 3289-3294.
11. Hunt, D.F.; Ryan, J.F.I. Chemical Ioniza-tion Mass Spectrometry Studies. I. Identi-fication of Alcohols. Tetrahedron Lett.1971, 47, 4535-4538.
12. Herman, J.A.; Harrison, A.G. Effect ofReaction Exothermicity on the Proton
Transfer Chemical Ionization Mass Spec-tra of Isomeric C5 and C6 Alkanols. Can.J. Chem. 1981, 59, 2125-2132.
13. Beggs, D.; Vestal, M.L.; Fales, H.M.;Milne, G.W.A. Chemical Ionization MassSpectrometer Source. Rev. Sci. Inst. 1971,42, 1578-1584.
14. Schröder, E. Massenspektrometrie - Be-griffe und Definitionen; Springer-Verlag:Heidelberg, 1991.
15. Price, P. Standard Definitions of TermsRelating to Mass Spectrometry. A ReportFrom the Committee on Measurementsand Standards of the ASMS. J. Am. Chem.Soc. Mass Spectrom. 1991, 2, 336-348.
16. Heck, A.J.R.; de Koning, L.J.; Nibbering,N.M.M. Structure of Protonated Methane.J. Am. Soc. Mass Spectrom. 1991, 2, 454-458.
17. Mackay, G.I.; Schiff, H.I.; Bohme, K.D. ARoom-Temperature Study of the Kineticsand Energetics for the Protonation of Eth-ane. Can. J. Chem. 1981, 59, 1771-1778.
18. Fisher, J.J.; Koyanagi, G.K.; McMahon,T.B. The C2H7
+ Potential Energy Surface:a Fourier Transform Ion Cyclotron Reso-nance Investigation of the Reaction ofMethyl Cation with Methane. Int. J. MassSpectrom. 2000, 195/196, 491-505.
19. Drabner, G.; Poppe, A.; Budzikiewicz, H.The Composition of the Methane Plasma.Int. J. Mass Spectrom. Ion Proc. 1990, 97,1-33.
20. Heck, A.J.R.; de Koning, L.J.; Nibbering,N.M.M. On the Structure and Unimolecu-lar Chemistry of Protonated Ha-lomethanes. Int. J. Mass Spectrom. IonProc. 1991, 109, 209-225.
21. Herman, J.A.; Harrison, A.G. Effect ofProtonation Exothermicity on the CI MassSpectra of Some Alkylbenzenes. Org.Mass Spectrom. 1981, 16, 423-427.
22. Munson, M.S.B.; Field, F.H. Reactions ofGaseous Ions. XVI. Effects of Additives

352 7 Chemical Ionization
on Ionic Reactions in Methane. J. Am.Chem. Soc. 1965, 87, 4242-4247.
23. Kuck, D.; Petersen, A.; Fastabend, U. Mo-bile Protons in Large Gaseous Alkylben-zenium Ions. The 21-Proton Equilibrationin Protonated Tetrabenzylmethane andRelated "Proton Dances". Int. J. MassSpectrom. 1998, 179/180, 129-146.
24. Kuck, D. Half a Century of Scrambling inOrganic Ions: Complete, Incomplete, Pro-gressive and Composite Atom Inter-change. Int. J. Mass Spectrom. 2002, 213,101-144.
25. Fales, H.M.; Milne, G.W.A.; Axenrod, T.Identification of Barbiturates by CI-MS.Anal. Chem. 1970, 42, 1432-1435.
26. Milne, G.W.A.; Axenrod, T.; Fales, H.M.CI-MS of Complex Molecules. IV. AminoAcids. J. Am. Chem. Soc. 1970, 92, 5170-5175.
27. Fales, H.M.; Milne, G.W.A. CI-MS ofComplex Molecules. II. Alkaloids. J. Am.Chem. Soc. 1970, 92, 1590-1597.
28. Herman, J.A.; Harrison, A.G. Energeticsand Structural Effects in the Fragmenta-tion of Protonated Esters in the Gas Phase.Can. J. Chem. 1981, 59, 2133-2145.
29. Milne, G.W.A.; Fales, H.M.; Axenrod, T.Identification of Dangerous Drugs by Iso-butane CI-MS. Anal. Chem. 1970, 42,1815-1820.
30. Takeda, N.; Harada, K.-I.; Suzuki, M.;Tatematsu, A.; Kubodera, T. Applicationof Emitter CI-MS to Structural Characteri-zation of Aminoglycoside Antibiotics.Org. Mass Spectrom. 1982, 17, 247-252.
31. McGuire, J.M.; Munson, B. Comparisonof Isopentane and Isobutane as ChemicalIonization Reagent Gases. Anal. Chem.1985, 57, 680-683.
32. McCamish, M.; Allan, A.R.; Roboz, J.Poly(Dimethylsiloxane) As Mass Refer-ence for Accurate Mass Determination inIsobutane CI-MS. Rapid Commun. MassSpectrom. 1987, 1, 124-125.
33. Maeder, H.; Gunzelmann, K.H. Straight-Chain Alkanes As Reference Compoundsfor Accurate Mass Determination in Iso-butane CI-MS. Rapid Commun. MassSpectrom. 1988, 2, 199-200.
34. Hunt, D.F.; McEwen, C.N.; Upham, R.A.CI-MS II. Differentiation of Primary, Sec-ondary, and Tertiary Amines. TetrahedronLett. 1971, 47, 4539-4542.
35. Keough, T.; DeStefano, A.J. Factors Af-fecting Reactivity in Ammonia CI-MS.Org. Mass Spectrom. 1981, 16, 527-533.
36. Hancock, R.A.; Hodges, M.G. A SimpleKinetic Method for Determining Ion-Source Pressures for Ammonia CI-MS.Int. J. Mass Spectrom. Ion Phys. 1983, 46,329-332.
37. Rudewicz, P.; Munson, B. Effect of Am-monia Partial Pressure on the Sensitivitiesfor Oxygenated Compounds in AmmoniaCI-MS. Anal. Chem. 1986, 58, 2903-2907.
38. Lawrence, D.L. Accurate Mass Measure-ment of Positive Ions Produced by Am-monia Chemical Ionization. Rapid Com-mun. Mass Spectrom. 1990, 4, 546-549.
39. Busker, E.; Budzikiewicz, H. Studies inCI-MS. 2. Isobutane and Nitric OxideSpectra of Alkynes. Org. Mass Spectrom.1979, 14, 222-226.
40. Brinded, K.A.; Tiller, P.R.; Lane, S.J.Triton X-100 As a Reference Compoundfor Ammonia High-Resolution CI-MS andas a Tuning and Calibration Compound forThermospray. Rapid Commun. MassSpectrom. 1993, 7, 1059-1061.
41. Wu, H.-F.; Lin, Y.-P. Determination of theSensitivity of an External Source Ion TrapTandem Mass Spectrometer Using Di-methyl Ether Chemical Ionization. J. MassSpectrom. 1999, 34, 1283-1285.
42. Barry, R.; Munson, B. Selective Reagentsin CI-MS: Diisopropyl Ether. Anal. Chem.1987, 59, 466-471.
43. Allgood, C.; Lin, Y.; Ma, Y.C.; Munson,B. Benzene as a Selective Chemical Ioni-zation Reagent Gas. Org. Mass Spectrom.1990, 25, 497-502.
44. Srinivas, R.; Vairamani, M.; Mathews,C.K. Gase-Phase Halo Alkylation of C60-Fullerene by Ion-Molecule Reaction Un-der Chemical Ionization. J. Am. Soc. MassSpectrom. 1993, 4, 894-897.
45. Fordham, P.J.; Chamot-Rooke, J.;Guidice, E.; Tortajada, J.; Morizur, J.-P.Analysis of Alkenes by Copper IonChemical Ionization Gas Chromatogra-phy/Mass Spectrometry and Gas Chro-matography/Tandem Mass Spectrometry.J. Mass Spectrom. 1999, 34, 1007-1017.
46. Peake, D.A.; Gross, M.L. Iron(I) ChemicalIonization and Tandem Mass Spectrome-try for Locating Double Bonds. Anal.Chem. 1985, 57, 115-120.
47. Budzikiewicz, H.; Blech, S.; Schneider, B.Studies in Chemical Ionization. XXVI. In-vestigation of Aliphatic Dienes by Chemi-cal Ionization With Nitric Oxide. Org.Mass Spectrom. 1991, 26, 1057-1060.
Reference List 353
48. Schneider, B.; Budzikiewicz, H. A FacileMethod for the Localization of a DoubleBond in Aliphatic Compounds. RapidCommun. Mass Spectrom. 1990, 4, 550-551.
49. Hsu, C.S.; Qian, K. Carbon Disulfide CE-MS as a Low-Energy Ionization Tech-nique for Hydrocarbon Characterization.Anal. Chem. 1993, 65, 767-771.
50. Einolf, N.; Munson, B. High-Pressure CE-MS. Int. J. Mass Spectrom. Ion Phys.1972, 9, 141-160.
51. Sieck, L.W. Determination of MolecularWeight Distribution of Aromatic Compo-nents in Petroleum Products by CI-MSwith Chlorobenzene As Reagent Gas.Anal. Chem. 1983, 55, 38-41.
52. Allgood, C.; Ma, Y.C.; Munson, B. Quan-titation Using Benzene in Gas Chromatog-raphy/CI-MS. Anal. Chem. 1991, 63, 721-725.
53. Subba Rao, S.C.; Fenselau, C. Evaluationof Benzene As a Charge Exchange Rea-gent. Anal. Chem. 1978, 50, 511-515.
54. Li, Y.H.; Herman, J.A.; Harrison, A.G. CEMass Spectra of Some C5H10 Isomers.Can. J. Chem. 1981, 59, 1753-1759.
55. Abbatt, J.A.; Harrison, A.G. Low-EnergyMass Spectra of Some Aliphatic Ketones.Org. Mass Spectrom. 1986, 21, 557-563.
56. Herman, J.A.; Li, Y.-H.; Harrison, A.G.Energy Dependence of the Fragmentationof Some Isomeric C6H12
+. Ions. Org. MassSpectrom. 1982, 17, 143-150.
57. Chai, R.; Harrison, A.G. Location of Dou-ble Bonds by CI-MS. Anal. Chem. 1981,53, 34-37.
58. Keough, T.; Mihelich, E.D.; Eickhoff, D.J.Differentiation of Monoepoxide Isomersof Polyunsaturated Fatty Acids and FattyAcid Esters by Low-Energy CE-MS. Anal.Chem. 1984, 56, 1849-1852.
59. Polley, C.W., Jr.; Munson, B. NitrousOxide As Reagent Gas for Positive IonChemical Ionization Mass Spectrometry.Anal. Chem. 1983, 55, 754-757.
60. Harrison, A.G.; Lin, M.S. StereochemicalApplications of Mass Spectrometry. 3. En-ergy Dependence of the Fragmentation ofStereoisomeric Methylcyclohexanols. Org.Mass Spectrom. 1984, 19, 67-71.
61. Hsu, C.S.; Cooks, R.G. CE-MS at HighEnergy. Org. Mass Spectrom. 1976, 11,975-983.
62. Roussis, S. Exhaustive Determination ofHydrocarbon Compound Type Distribu-tions by High Resolution Mass Spec-
trometry. Rapid Commun. Mass Spectrom.1999, 13, 1031-1051.
63. Hunt, D.F.; Stafford, G.C., Jr.; Crow, F.W.Pulsed Positive- and Negative-Ion CI-MS.Anal. Chem. 1976, 48, 2098-2104.
64. Dougherty, R.C.; Weisenberger, C.R.Negative Ion Mass Spectra of Benzene,Naphthalene, and Anthracene. A NewTechnique for Obtaining Relatively In-tense and Reproducible Negative Ion MassSpectra. J. Am. Chem. Soc. 1968, 90,6570-6571.
65. Dillard, J.G. Negative Ion Mass Spec-trometry. Chem. Rev. 1973, 73, 589-644.
66. Bouma, W.J.; Jennings, K.R. Negative CI-MS of Explosives. Org. Mass Spectrom.1981, 16, 330-335.
67. Budzikiewicz, H. Studies in Negative IonMass Spectrometry. XI. Negative Chemi-cal Ionization (NCI) of Organic Com-pounds. Mass Spectrom. Rev. 1986, 5,345-380.
68. Hunt, D.F.; Crow, F.W. Electron CaptureNegative-Ion CI-MS. Anal. Chem. 1978,50, 1781-1784.
69. Ong, V.S.; Hites, R.A. Electron CaptureMass Spectrometry of Organic Environ-mental Contaminants. Mass Spectrom.Rev. 1994, 13, 259-283.
70. Oehme, M. Quantification of fg-pgAmounts by Electron Capture NegativeIon Mass Spectrometry - Parameter Opti-mization and Practical Advice. FreseniusJ. Anal. Chem. 1994, 350, 544-554.
71. Bartels, M.J. Quantitation of the Tetra-chloroethylene Metabolite N-Acetyl-S-(trichlorovinyl)cysteine in Rat Urine ViaNegative Ion Chemical Ionization GasChromatography/Tandem Mass Spec-trometry. Biol. Mass Spectrom. 1994, 23,689-694.
72. Fowler, B. The Determination ofToxaphene in Environmental Samples byNegative Ion Electron Capture (EC) HR-MS. Chemosphere 2000, 41, 487-492.
73. von Ardenne, M.; Steinfelder, K.;Tümmler, R. Elektronenanlagerungs-Massenspektrographie Organischer Sub-stanzen; Springer-Verlag: Heidelberg,1971.
74. Laramée, J.A.; Arbogast, B.C.; Deinzer,M.L. EC Negative Ion CI-MS of 1,2,3,4-Tetrachlorodibenzo-p-dioxin. Anal. Chem.1986, 58, 2907-2912.
75. Budzikiewicz, H. Mass Spectrometry ofNegative Ions. 3. Mass Spectrometry of
354 7 Chemical Ionization
Negative Organic Ions. Angew. Chem.1981, 93, 635-649.
76. Bowie, J.H. The Formation and Fragmen-tation of Negative Ions Derived From Or-ganic Molecules. Mass Spectrom. Rev.1984, 3, 161-207.
77. Stemmler, E.A.; Hites, R.A. The Frag-mentation of Negative Ions Generated byEC Negative Ion Mass Spectrometry: aReview With New Data. Biomed. Environ.Mass Spectrom. 1988, 17, 311-328.
78. Giese, R.W. Detection of DNA Adductsby Electron Capture Mass Spectrometry.Chem. Res. Toxicol. 1997, 10, 255-270.
79. Laramée, J.A.; Mazurkiewicz, P.; Berkout,V.; Deinzer, M.L. Electron Monochroma-tor-Mass Spectrometer for Negative IonAnalysis of Electronegative Compounds.Mass Spectrom. Rev. 1996, 15, 15-42.
80. NIST, NIST Chemistry Webbook.http://webbook. nist. gov/ 2002.
81. Williamson, D.H.; Knighton, W.B.;Grimsrud, E.P. Effect of Buffer Gas Al-terations on the Thermal Electron Attach-ment and Detachment Reactions of Azu-lene by Pulsed High Pressure MassSpectrometry. Int. J. Mass Spectrom.2000, 195/196, 481-489.
82. Carette, M.; Zerega, Y.; Perrier, P.; Andre,J.; March, R.E. Rydberg EC-MS of1,2,3,4-Tetrachlorodibenzo-p-dioxin. Eur.Mass Spectrom. 2000, 6, 405-408.
83. Wei, J.; Liu, S.; Fedoreyev, S.A.; Vionov,V.G. A Study of Resonance ElectronCapture Ionization on a Quadrupole Tan-dem Mass Spectrometer. Rapid Commun.Mass Spectrom. 2000, 14, 1689-1694.
84. Zerega, Y.; Carette, M.; Perrier, P.; Andre,J. Rydberg EC-MS of Organic Pollutants.Organohal. Comp. 2002, 55, 151-154.
85. Yinon, J. Mass Spectrometry of Explo-sives: Nitro Compounds, Nitrate Esters,and Nitramines. Mass Spectrom. Rev.1982, 1, 257-307.
86. Cappiello, A.; Famiglini, G.; Lombar-dozzi, A.; Massari, A.; Vadalà, G.G. ECIonization of Explosives With a MicroflowRate Particle Beam Interface. J. Am. Soc.Mass Spectrom. 1996, 7, 753-758.
87. Knighton, W.B.; Grimsrud, E.P. High-Pressure EC-MS. Mass Spectrom. Rev.1995, 14, 327-343.
88. Aubert, C.; Rontani, J.-F. PerfluoroalkylKetones: Novel Derivatization Productsfor the Sensitive Determination of FattyAcids by Gas GC-MS in EI and NICI
Modes. Rapid Commun. Mass Spectrom.2000, 14, 960-966.
89. Cotter, R.J. Mass Spectrometry of Non-volatile Compounds by Desorption FromExtended Probes. Anal. Chem. 1980, 52,1589A-1602A.
90. Kurlansik, L.; Williams, T.J.; Strong, J.M.;Anderson, L.W.; Campana, J.E. DCI-MSof Synthetic Porphyrins. Biomed. MassSpectrom. 1984, 11, 475-481.
91. Helleur, R.J.; Thibault, P. Optimization ofPyrolysis-Desorption CI-MS and TandemMass Spectrometry of Polysaccharides.Can. J. Chem. 1994, 72, 345-351.
92. Vincenti, M. The Renaissance of DCI-MS:Characterization of Large Involatile Mole-cules and Nonpolar Polymers. Int. J. MassSpectrom. 2001, 212, 505-518.
93. Beuhler, R.J.; Flanigan, E.; Greene, L.J.;Friedman, L. Proton Transfer MS of Pep-tides. Rapid Heating Technique for Un-derivatized Peptides Containing Arginine.J. Am. Chem. Soc. 1974, 96, 3990-3999.
94. Cotter, R.J. Laser Desorption CI-MS.Anal. Chem. 1980, 52, 1767-1770.
95. Hunt, D.F.; Shabanowitz, J.; Botz, F.K.CI-MS of Salts and Thermally Labile Or-ganics With Field Desorption Emitters asSolids Probes. Anal. Chem. 1977, 49,1160-1163.
96. Cullen, W.R.; Eigendorf, G.K.; Pergantis,S.A. DCI-MS of Arsenic Compounds Pre-sent in the Marine and Terrestrial Envi-ronment. Rapid Commun. Mass Spectrom.1993, 7, 33-36.
97. Abate, R.; Garozzo, D.; Rapisardi, R.;Ballistreri, A.; Montaudo, G. SequenceDistribution of -Hydroxyalkanoate Unitsin Bacterial Copolyesters Determined by-DCI-MS. Rapid Commun. Mass Spectrom.1992, 6, 702-706.
98. Juo, C.G.; Chen, S.W.; Her, G.R. MassSpectrometric Analysis of Additives inPolymer Extracts by DCI and CID withB/E Linked Scanning. Anal. Chim. Acta1995, 311, 153-164.
99. Chen, G.; Cooks, R.G.; Jha, S.K.; Green,M.M. Microstructure of Alkoxy and AlkylSubstituted Isocyanate Copolymers De-termined by DCI-MS. Anal. Chim. Acta1997, 356, 149-154.
100. Pergantis, S.A.; Emond, C.A.; Madilao,L.L.; Eigendorf, G.K. Accurate MassMeasurements of Positive Ions in the DCIMode. Org. Mass Spectrom. 1994, 29,439-444.
8 Field Ionization and Field Desorption
The first observation of the desorption of positive ions from surfaces by highelectrostatic fields was made by means of a field ion microscope. [1,2] The massspectrometric analysis of some field-ionized gases followed. [2-4] However, itwas Beckey putting forth the development of a focusing field ionization ionsource. [5] In these early experiments electric field strengths of about 108 V cm–1
(1 VÅ–1) were generated at sharp tungsten tips. [2,4,5] The method of field ioniza-tion (FI) was soon extended to analyze volatile liquids [6-11] and solids intro-duced by evaporation from a sample vial in close proximity to the ionizing tip orwire electrode. [12]. FI, still immature in the mid-1960s, had soon to compete withchemical ionization (CI, Chap. 7). [13] The major breakthrough came from itsfurther development to field desorption (FD), because FD circumvents the evapo-ration of the analyte prior to ionization. [14,15] Instead, the processes of ioniza-tion and subsequent desorption of the ions formed are united on the surface of thefield emitter. The specific charm of FI-MS and of FD-MS in particular arises fromtheir extraordinary softness of ionization yielding solely intact molecular ions inmost cases, and from the capability of FD to handle neutral as well as ionic ana-lytes. [16-25] FD-MS had its flourishing period from the mid-1970s to the mid-1980s and suffered from the advent of fast-atom bombardment (FAB) and laterelectrospray ionization (ESI) mass spectrometry. [21] However, it appears that theunique capabilities of FD-MS are currently being re-discovered. [26-29]
8.1 Field Ionization Process
Inghram and Gomer explained the process of field ionization for a hydrogen atom.[3,4,30] If a hydrogen atom resides on a metal surface, e.g., tungsten, its protonelectron potential is only slightly distorted. However, in the presence of a strongelectric field, e.g., 2 VÅ–1 with the metal at positive polarity, this distortion be-comes remarkable (Fig. 8.1). As a result, the electron can leave the proton by tun-neling into the bulk metal through a potential barrier that is only a few angstromswide and some electronvolts high. [18,31] Thereby, the former hydrogen atom isionized, and the resulting proton is immediately driven away by action of thestrong electric field. Interestingly, the situation is quite similar for an isolated hy-drogen atom. Here, the electric field causes analogous distortion of the potential,and with sufficient field strength, the atom is field ionized, too. This means thatatoms or molecules can be ionized by action of a strong electric field independent

356 8 Field Ionization and Field Desorption
of whether they have been adsorbed to the anodic surface or whether they aremoving freely through the space between the electrodes.
Field ionization essentially is a process of the autoionization type, i.e., an inter-nally supra-excited atom or molecular moiety loses an electron spontaneouslywithout further interaction with an energy source. [32] Different from electronionization, there is no excess energy transferred onto the incipient ion, and thus,dissociation of the ions is reduced to minimum.
M M+• + e– (8.1)
In practice, electric fields sufficient to effect field ionization are only obtainedin close proximity to sharp tips, edges, or thin wires. The smaller the radius of thecurvature of the anode, the further away (1–10 nm) the field suffices to cause ioni-zation. The importance of sufficient electric field strength is reflected by the half-life calculated for a hydrogen atom: it is in the order of 10–1 s at 0.5 VÅ–1, 10–10 sat 1.0 VÅ–1, and 10–16 s at 2.5 VÅ–1. [18]
Fig. 8.1. Field ionization of a hydrogen atom (H). (a) close to a tungsten surface (W), (b)isolated. Conditions and symbols: electric field 2 V Å–1, PW image potential of W distortedby the field, PH potential of the hydrogen atom distorted by the field, X work function,µ Fermi level. Broken lines represent potentials in absence of the electric field. Adaptedfrom Ref. [4] by permission. © Verlag der Zeitschrift für Naturforschung, 1955.
Note: The field anode is usually referred to as field emitter, FI emitter, or FDemitter. The properties of the field emitter are of key importance for FI- andFD-MS. The electrode on the opposite side is called field cathode or simplycounter electrode.

8.2 FI and FD Ion Source 357
8.2 FI and FD Ion Source
In FI- and FD-MS, a high voltage of 8–12 kV is normally applied between fieldemitter (field anode) and counter electrode (field cathode) usually located 2–3 mmin front of the emitter. Consequently, the desorbing ions are accelerated to8–12 keV kinetic energy. This usually exceeds the tolerance even of the double-focusing magnetic sector mass analyzers which are typically used in conjunctionwith FI/FD ion sources. Thus, the counter electrode is set to negative potential toestablish the high voltage for ion generation while the difference between emitterpotential and ground potential at the entrance slit defines the lower accelerationvoltage of 5–10 kV (Fig. 8.2). [33]
In FI mode, the analyte is introduced via external inlet systems, i.e., from a di-rect probe, a reservoir inlet or a gas chromatograph (Chap. 5.3). In FD mode, the
Fig. 8.2. FI/FD ion source with potentials applied to emitter and lenses. Reproduced fromRef. [33] by permission. © American Association for the Advancement of Science, 1979.
Fig. 8.3. Schematic of an FI/FD ion source (a) in FI mode, (b) in FD mode. The distancebetween emitter and counter electrode is shown exaggerated for clarity. Adapted from Ref.[34] by permission. © Springer-Verlag, Heidelberg, 1991.

358 8 Field Ionization and Field Desorption
analyte is supplied directly on the surface of the field emitter. This does not onlyguarantee a more effective usage of the sample, it also combines the steps of ioni-zation and desorption, thereby minimizing the risk of thermal decomposition priorto ionization (Fig. 8.3). This is especially important in case of highly polar or ionicanalytes that cannot be evaporated without thermal degradation.
8.3 Field Emitters
8.3.1 Blank Metal Wires as Emitters
In the first FI experiments, the high electric field strength was obtained at sharptungsten tips. [2,4,5] Later, edges of sharp blades [35] and wires of a few mi-crometers in diameter came into use. Wires are advantageous because the emittingsurface of a smooth blade is approximately two orders of magnitude smaller thanthat of a smooth wire at the same field strength under normal working conditions(Fig. 8.4). Simple wire emitters can be used for field desorption of unpolar [36] orelectrolytic analytes. [37] However, thin wires are rather fragile and break duringelectric discharges. Sharp edges in the vicinity of the wire should therefore beavoided by polishing the respective parts, e.g., the counter electrode. [38]
Fig. 8.4. Schematic of a wire emitter. High voltage is supplied via the emitter-holding pins.These also serve to pass a current for resistive heating through the wire.
8.3.2 Activated Emitters
The electric field strength on the emitter can greatly be enhanced by creation ofdendritic microneedles (whiskers) on its surface, the corresponding process beingknown as emitter activation. FI- and FD-MS require emitters of reproducible highquality, and therefore the activation procedure has received much attention. Thehigh-temperature activation of 10 µm tungsten wires with pure benzonitrile vaportakes 3–7 h, [39] but it may be accelerated by reversal of the polarity of the highvoltage during activation. [40] Using indane, indene, indole, or naphthalene as theactivating agent, the activation times are also much shorter. [41] An extremelysimple and fast activation of carbon fiber, tungsten, and platinum wire emitters isperformed in the presence of benzene vapor by heating to 600–900 °C in a highexternal field for a few seconds. [36,42] The activation procedures with pure ben-zonitrile and with indene are employed commercially to produce carbon whiskers

8.3 Field Emitters 359
on emitters with customized properties (Fig. 8.5). Microneedle growth is alterna-tively achieved by decomposition of hexacarbonyltungsten, W(CO)6, on a cathodeproducing an electric discharge. [43] A self-controlling mechanism which drawsions preferably to the top of the growing tungsten needles has been suggested. [43]SEM pictures of activated emitter surfaces and single whiskers exhibit an im-pressing beauty of their own. [40,41,43-46]
Alternatives to activated tungsten wire emitters are also known, but less wide-spread in use. Cobalt and nickel [44,47] as well as silver [48] can be electrochemi-cally deposited on wires to produce activated FD emitters. Mechanically strongand efficient emitters can be made by growing fine silicon whiskers from silanegas on gold-coated tungsten or tantalum wires of 60 µm diameter. [45] Finally, onthe fracture-surface of graphite rods fine microcrystallites are exposed, the sharp-ness of which provides field strengths sufficient for ionization. [49]
Fig. 8.5. SEM pictures of activated tungsten wire emitters; (a) overview showing the thintungsten wire close to the holders and the whisker-bearing middle section, (b) detail of themiddle with the whiskers resolved. By courtesy of Carbotec, Bergisch Gladbach, Germany.
8.3.3 Emitter Temperature
Emitters can be heated by passing through an electric current supplied via theemitter holders. It is not trivial to establish a precise calibration of emitter tem-perature versus emitter heating current (EHC). [50,51] The actual temperature notonly depends on the emitter material, but also on diameter and length of the emit-ter, and on length and area density of the whiskers. A useful estimate for tungstenemitters with carbon whiskers is given below (Fig. 8.6). For the purpose of clean-ing, baking is usually performed at 50–60 mA in case of activated tungsten emit-ters of 10 µm diameter and at 80–100 mA for otherwise identical emitters of13 µm diameter.
In practice, moderate heating of the emitter at constant current serves to reduceadsorption to its surface during FI measurements. Heating at a constant rate(1–8 mA min–1) is frequently employed to enforce desorption of analytes from theemitter in FD-MS. To avoid electric discharges resulting from too massive ion de-

360 8 Field Ionization and Field Desorption
sorption, emission-controlled emitter heating can be advantageous. [52-54] Fur-thermore, baking of the emitter (2–5 s to 800–1000 °C) is used to clean it for sub-sequent measurements.
Fig. 8.6. Calibration of EHC vs. temperature for emitters activated with carbon needles on10 µm and 13 µm tungsten wire. By courtesy of Carbotec, Bergisch Gladbach, Germany.
8.3.4 Handling of Activated Emitters
Activated wire emitters are extremely fragile, because after activation the materialrather behaves like ceramics than like a metal wire. The slightest touch with a sy-ringe needle as well as electric discharges during operation cause immediate de-struction of the emissive wire. Proper handling of the emitter is therefore a pre-requisite; [21] it includes i) manipulation by grasping it at the robust ceramicssocket or at both pins simultaneously using tweezers, ii) baking it before first usein order to outgas and clean the emitter, iii) application of analytes by transfer of adrop of solution whereby only the liquid surface may contact the emitter wire(Fig. 8.7), iv) evaporation of the solvent usually before insertion into the vacuumlock (Fig. 8.8), v) switching on the high voltage only after the high vacuum hasfully recovered, and finally after the measurement has been completed vi) bakingto remove residual sample only after switching off the high voltage. Under condi-tions of proper handling, an emitter can last for about 20 measurements.
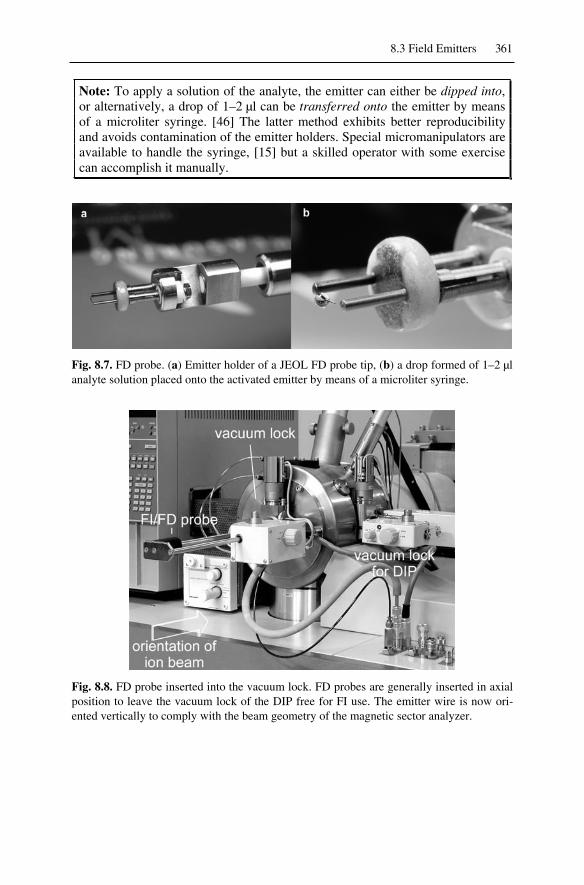
8.3 Field Emitters 361
Note: To apply a solution of the analyte, the emitter can either be dipped into,or alternatively, a drop of 1–2 µl can be transferred onto the emitter by meansof a microliter syringe. [46] The latter method exhibits better reproducibilityand avoids contamination of the emitter holders. Special micromanipulators areavailable to handle the syringe, [15] but a skilled operator with some exercisecan accomplish it manually.
Fig. 8.7. FD probe. (a) Emitter holder of a JEOL FD probe tip, (b) a drop formed of 1–2 µlanalyte solution placed onto the activated emitter by means of a microliter syringe.
Fig. 8.8. FD probe inserted into the vacuum lock. FD probes are generally inserted in axialposition to leave the vacuum lock of the DIP free for FI use. The emitter wire is now ori-ented vertically to comply with the beam geometry of the magnetic sector analyzer.

362 8 Field Ionization and Field Desorption
8.3.5 Liquid Injection Field Desorption Ionization
Numerous analytes could be good candidates for FD-MS, but undergo immediatedecomposition by reacting with ambient air and/or water under the conditions ofconventional emitter loading. Inert conditions such as emitter loading in a glovebox does not really avoid the problem, because the emitter still needs to bemounted to the probe before insertion into the vacuum lock. Furthermore, thetuning of an FD ion source usually has to be optimized for the emitter actually inuse which is not practicable with the sample already loaded onto its surface.
Liquid injection field desorption ionization (LIFDI) – initially introduced as in-source liquid injection (ISLI) FD – presents a major breakthrough for FD-MS ofreactive analytes. [55] There is no risk of decomposition prior to starting themeasurement, because the solution of the analyte can be handled under inert con-ditions. It is transported through a fused silica capillary merely by the sucking ac-tion of the ion source vacuum and then spreads out over the entire emitter drivenby capillary forces and adsorption. The small volume of solvent (ca. 40 nl) evapo-rates within seconds. As the sample is supplied from the “backside” to the emitter,there neither is a need to remove the capillary during the measurement, no tochange the adjustment of the emitter in the ion source (Fig. 8.9). Thus, the emittercan be used repeatedly without breaking the vacuum between successive meas-urements and without repeated focusing of the ion source. LIFDI also speeds upthe measurements which can be about ten times faster than in conventional FD-MS. In addition, the use of LIFDI is not restricted to sensitive samples [29] and itsimplifies the delicate procedure of emitter loading.
Fig. 8.9. Probe for LIFDI. A fused silica capillary delivers the sample to the “backside” ofthe activated emitter. Here, the counter electrode is part of the FD probe. By courtesy ofLinden CMS, Leeste, Germany.
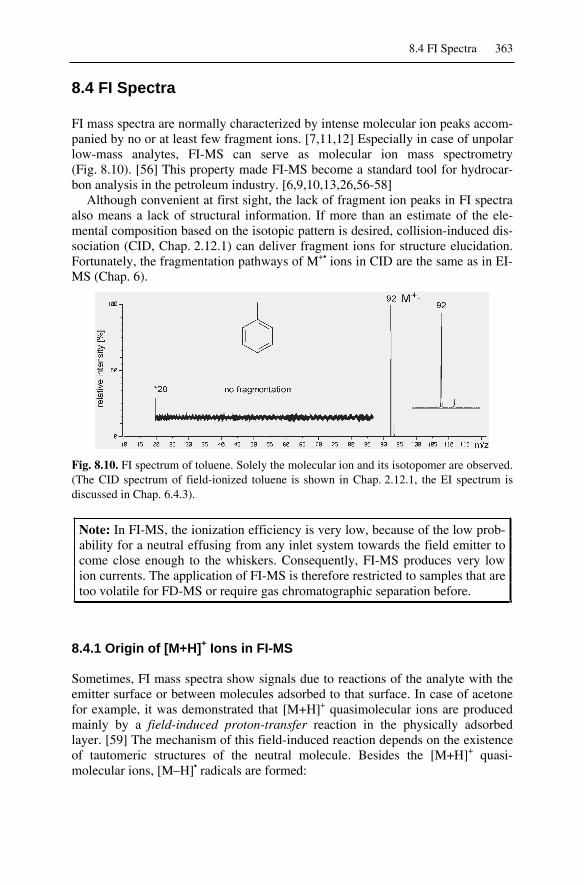
8.4 FI Spectra 363
8.4 FI Spectra
FI mass spectra are normally characterized by intense molecular ion peaks accom-panied by no or at least few fragment ions. [7,11,12] Especially in case of unpolarlow-mass analytes, FI-MS can serve as molecular ion mass spectrometry(Fig. 8.10). [56] This property made FI-MS become a standard tool for hydrocar-bon analysis in the petroleum industry. [6,9,10,13,26,56-58]
Although convenient at first sight, the lack of fragment ion peaks in FI spectraalso means a lack of structural information. If more than an estimate of the ele-mental composition based on the isotopic pattern is desired, collision-induced dis-sociation (CID, Chap. 2.12.1) can deliver fragment ions for structure elucidation.Fortunately, the fragmentation pathways of M+• ions in CID are the same as in EI-MS (Chap. 6).
Fig. 8.10. FI spectrum of toluene. Solely the molecular ion and its isotopomer are observed.(The CID spectrum of field-ionized toluene is shown in Chap. 2.12.1, the EI spectrum isdiscussed in Chap. 6.4.3).
Note: In FI-MS, the ionization efficiency is very low, because of the low prob-ability for a neutral effusing from any inlet system towards the field emitter tocome close enough to the whiskers. Consequently, FI-MS produces very lowion currents. The application of FI-MS is therefore restricted to samples that aretoo volatile for FD-MS or require gas chromatographic separation before.
8.4.1 Origin of [M+H]+ Ions in FI-MS
Sometimes, FI mass spectra show signals due to reactions of the analyte with theemitter surface or between molecules adsorbed to that surface. In case of acetonefor example, it was demonstrated that [M+H]+ quasimolecular ions are producedmainly by a field-induced proton-transfer reaction in the physically adsorbedlayer. [59] The mechanism of this field-induced reaction depends on the existenceof tautomeric structures of the neutral molecule. Besides the [M+H]+ quasi-molecular ions, [M–H]• radicals are formed:

364 8 Field Ionization and Field Desorption
M+• + M [M+H]+ + [M–H]• (8.2)
Furthermore, the radicals formed upon field-induced hydrogen abstraction canlead to polymerization products on the emitter surface. The mechanism of this“field polymerization” helped to elucidate the phenomenon of activation of fieldemitters, i.e., the growth of microneedles on the emitter surface under the condi-tions of field ionization of certain polar organic compounds. [59]
Note: Analytes possessing exchangeable hydrogens also tend to form [M+H]+
ions in FI-MS. Occasionally, the quasimolecular ion occurs in favor of the mo-lecular ion that can be of lower intensity or almost be absent (Fig. 8.13). Crite-ria to distinguish M+• from [M+H]+ ions have been published. [60]
8.4.2 Field-Induced Dissociation
In certain cases, the advantageous property of the strong electric field to effect softionization can be accompanied by field-induced dissociation, i.e., another type offield-induced reactions. [61,62] For example, the fragment ions in the FI spectraof low-mass aliphatic amines, ketones and hydrocarbons are formed by field-induced dissociation. [59] Field-induced dehydrogenation [63,64] presents a se-vere problem to the FI and FD analysis of saturated hydrocarbon mixtures reach-ing beyond C40, because signals from unsaturated compounds at low levels are su-perseded by [M–H2]
+• peaks. [65-68] A reduction of the emitter potential canreduce field-induced dehydrogenation to some degree.
8.4.3 Multiply-Charged Ions in FI-MS
Multiply charged ions of minor abundance are frequently observed in FI and FDmass spectra. Their increased abundance as compared to EI spectra can be ration-alized by either of the following two-step processes: i) Post-ionization of gaseousM+• ions can occur due to the probability for an M+• ion to suffer a second or eventhird ionization while drifting away from the emitter surface. [69,70] Especiallyions generated in locations not in line-of-sight to the counter electrode pass nu-merous whiskers on their first 10–100 µm of flight:
M M+• + e– (8.3)
M+• M2+ + e– (8.4)
ii) Alternatively, a surface-bound ion, M+•(surf), is formed and ionized for a second
time before leaving the surface: [71-73]
M M+•(surf) + e– (8.5)
M+•(surf) M2+ + e– (8.6)
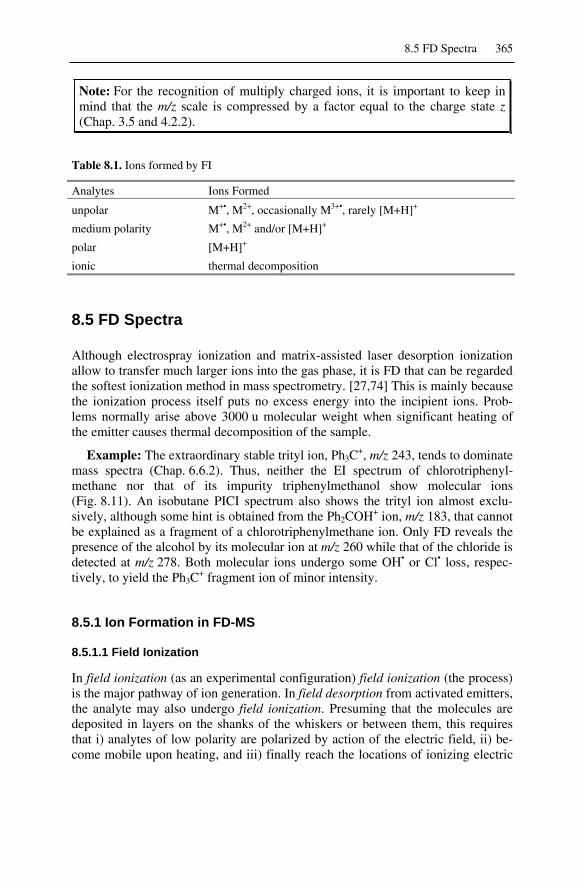
8.5 FD Spectra 365
Note: For the recognition of multiply charged ions, it is important to keep inmind that the m/z scale is compressed by a factor equal to the charge state z(Chap. 3.5 and 4.2.2).
Table 8.1. Ions formed by FI
Analytes Ions Formed
unpolar M+•, M2+, occasionally M3+•, rarely [M+H]+
medium polarity M+•, M2+ and/or [M+H]+
polar [M+H]+
ionic thermal decomposition
8.5 FD Spectra
Although electrospray ionization and matrix-assisted laser desorption ionizationallow to transfer much larger ions into the gas phase, it is FD that can be regardedthe softest ionization method in mass spectrometry. [27,74] This is mainly becausethe ionization process itself puts no excess energy into the incipient ions. Prob-lems normally arise above 3000 u molecular weight when significant heating ofthe emitter causes thermal decomposition of the sample.
Example: The extraordinary stable trityl ion, Ph3C+, m/z 243, tends to dominate
mass spectra (Chap. 6.6.2). Thus, neither the EI spectrum of chlorotriphenyl-methane nor that of its impurity triphenylmethanol show molecular ions(Fig. 8.11). An isobutane PICI spectrum also shows the trityl ion almost exclu-sively, although some hint is obtained from the Ph2COH+ ion, m/z 183, that cannotbe explained as a fragment of a chlorotriphenylmethane ion. Only FD reveals thepresence of the alcohol by its molecular ion at m/z 260 while that of the chloride isdetected at m/z 278. Both molecular ions undergo some OH• or Cl• loss, respec-tively, to yield the Ph3C
+ fragment ion of minor intensity.
8.5.1 Ion Formation in FD-MS
8.5.1.1 Field Ionization
In field ionization (as an experimental configuration) field ionization (the process)is the major pathway of ion generation. In field desorption from activated emitters,the analyte may also undergo field ionization. Presuming that the molecules aredeposited in layers on the shanks of the whiskers or between them, this requiresthat i) analytes of low polarity are polarized by action of the electric field, ii) be-come mobile upon heating, and iii) finally reach the locations of ionizing electric
366 8 Field Ionization and Field Desorption
Fig. 8.11. Comparison of EI, PICI, and FD mass spectra of chlorotriphenylmethane con-taining some triphenylmethanol. By courtesy of C. Limberg, Humboldt University, Berlin.
field strength at the tips of the whiskers (Fig. 8.12). The requirement of mobilityof the polarized molecules can either be fulfilled via gas phase transport or surfacediffusion. [46] As the level of mobility to travel some ten micrometers along awhisker is much lower than that needed for evaporation from a separate inlet sys-tem, thermal decomposition of the field-ionized analyte in FD-MS is much re-duced as compared to FI-MS.
The relevance of the FI mechanism of ionization decreases as the polarity of theanalyte increases. In certain cases such as sucrose, for example, it is delicate todecide whether gas phase mobility of the neutral and molecular ions jointlyformed by FI still play a role [75,76] or not. [77]

8.5 FD Spectra 367
Fig. 8.12. Schematic representation of the transport of neutrals to the tips of the field-enhancing whiskers. Reproduced from Ref. [46] by permission. © Elsevier Science, 1981.
Fig. 8.13. D-Glucose mass spectra: (a) EI yields only ions due to decomposition and frag-mentation, (b) FI still produces several fragments, and (c) FD almost exclusively gives ionsrelated to the intact molecule. Adapted from Ref. [14] by permission. © Elsevier Science,1969.
Example: D-Glucose may be evaporated into the ion source without completedecomposition as demonstrated by its FI spectrum (Fig. 8.13). FD yields a spec-trum with a very low degree of fragmentation that is most probably caused by theneed for slight heating of the emitter. The occurrence of M+• ions, m/z 180, and[M+H]+ ions, m/z 181, in the FD spectrum suggests that ion formation occurs viafield ionization and field-induced proton transfer, respectively. However, thermal

368 8 Field Ionization and Field Desorption
energy plus a hard ionization method such as EI effect extreme fragmentation. Bycomparison of the EI and FI spectra, the effects of thermal energy may roughly beseparated from those of EI itself.
8.5.1.2 Desorption of Ions
Analytes of very high polarity are not anymore ionized by field ionization. Here,the prevailing pathways are protonation or cationization, i.e., the attachment ofalkali ions to molecules. [78] The subsequent desorption of the ions from the sur-face is effected by the action of the electric field. As [M+Na]+ and [M+K]+ quasi-molecular ions are already present in the condensed phase, the field strength re-quired for their desorption is lower than that for field ionization or field-induced[M+H]+ ion formation. [37,79] The desorption of ions is also effective in case ofionic analytes.
Example: FD from untreated wire emitters in the presence of intentionallyadded alkali metal salts was used to obtain mass spectra of tartaric acid, arginine,pentobarbital and other compounds. [78,80] Besides [M+H]+ quasimolecular ions,m/z 175, the FD mass spectrum of arginine exhibits [M+Na]+, m/z 197, and[M+K]+, m/z 213, ions due to alkali metal cationization as well as [2M+H]+, m/z349, cluster ions (Fig. 8.14). [37]
Fig. 8.14. The FD mass spectrum of arginine, Mr = 174, desorbed from an untreated metalwire emitter in the presence of alkali ions. Adapted from Ref. [37] by permission. © JohnWiley & Sons, 1977.
Two major concepts of ion formation and desorption have been suggested, butit has remained a matter of debate whether the concept of field-induced desolva-tion [81-83] or that of ion evaporation [84,85] more appropriately describes theevent. Although different in several aspects, the models are in agreement that ionsare created in the condensed phase and subsequently desorbed into the gas phase.Both accept the electric field as the driving force to effect extraction of ionic spe-cies after charge separation in the surface layer on the emitter. Protuberances areassumed to develop from where ions can escape into the gas phase as a result ofthe field-enhancing effect of these protrusions. The differences of the models mayin part be attributed to the different experimental and theoretical approaches. Themodel of the Röllgen group is much based on microscopic observation of protu-berances from glassy sample layers (Fig. 8.15), [81,82] whereas the Derrick groupassumes their size to be a thousand-fold smaller (Fig. 8.16). [84] Thus, the latter

8.5 FD Spectra 369
emphasizes the role of mobility on the molecular scale instead of microscopic vis-cous flow of the surface layer.
Fig. 8.15. Illustration of the desolvation of ions. (a) Charge separation inside a protuber-ance, (b) continuous reconstruction of the surface allows for successive rupture of inter-molecular bonds and stepwise desolvation of the ions. Reproduced from Ref. [83] by per-mission. © Elsevier Science, 1984.
Fig. 8.16. Schematic model for ion evaporation. rsolv is the radius of the solvation sphere,rsi the radius of the separating ion, and h1 the height of the protuberance when the radius ofits parabolic tip equals rsi. Reproduced from Ref. [85] by permission. © Elsevier Science,1987.
8.5.2 Cluster Ion Formation in FD-MS
Analytes of high polarity exhibit a strong tendency towards cationization. Besidesthe aforementioned quasimolecular ions, [nM+H]+ and [nM+alkali]+ cluster ionsare frequently found. A priori, there is no reason why these ions should not be in-terpreted as resulting from additional components of a mixture. However, the se-quence of events can serve as a reliable criterion to distinguish components ofhigher molecular weight from cluster ions. Cluster ions are preferably formedwhen the coverage of the emitter surface is still high, i.e., in the beginning of de-sorption. As desorption proceeds, the probability for cluster ion formation de-creases, because the surface layer is diminished. In addition, a continuously risingemitter heating current assists thermal decomposition of clusters. Whereas cluster
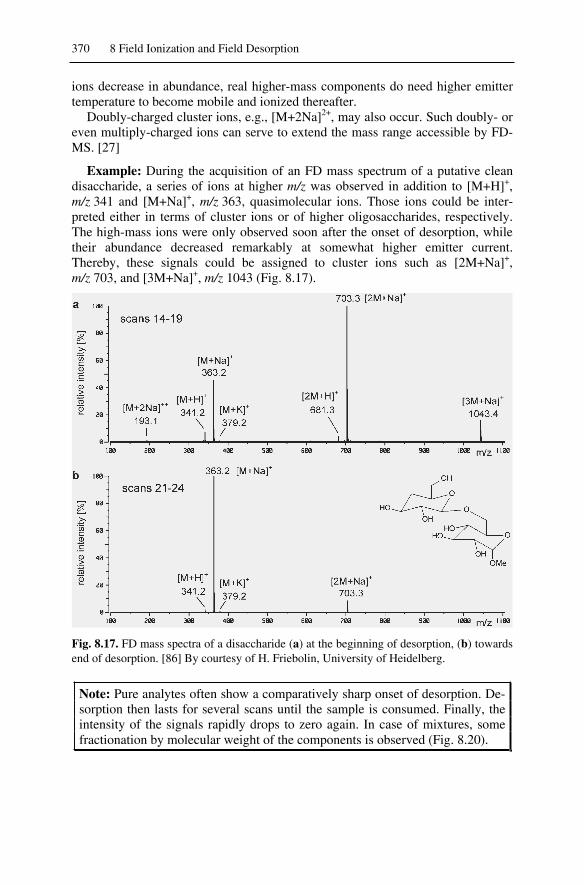
370 8 Field Ionization and Field Desorption
ions decrease in abundance, real higher-mass components do need higher emittertemperature to become mobile and ionized thereafter.
Doubly-charged cluster ions, e.g., [M+2Na]2+, may also occur. Such doubly- oreven multiply-charged ions can serve to extend the mass range accessible by FD-MS. [27]
Example: During the acquisition of an FD mass spectrum of a putative cleandisaccharide, a series of ions at higher m/z was observed in addition to [M+H]+,m/z 341 and [M+Na]+, m/z 363, quasimolecular ions. Those ions could be inter-preted either in terms of cluster ions or of higher oligosaccharides, respectively.The high-mass ions were only observed soon after the onset of desorption, whiletheir abundance decreased remarkably at somewhat higher emitter current.Thereby, these signals could be assigned to cluster ions such as [2M+Na]+,m/z 703, and [3M+Na]+, m/z 1043 (Fig. 8.17).
Fig. 8.17. FD mass spectra of a disaccharide (a) at the beginning of desorption, (b) towardsend of desorption. [86] By courtesy of H. Friebolin, University of Heidelberg.
Note: Pure analytes often show a comparatively sharp onset of desorption. De-sorption then lasts for several scans until the sample is consumed. Finally, theintensity of the signals rapidly drops to zero again. In case of mixtures, somefractionation by molecular weight of the components is observed (Fig. 8.20).
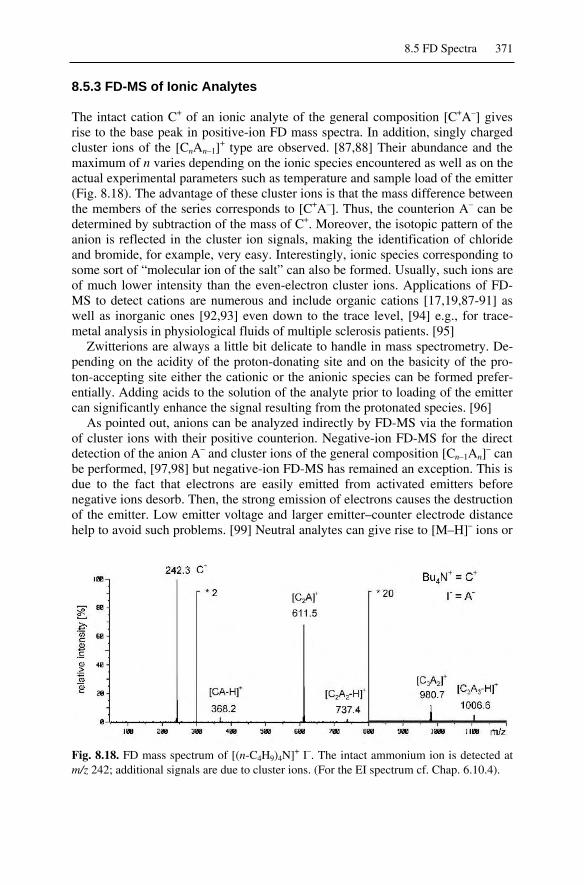
8.5 FD Spectra 371
8.5.3 FD-MS of Ionic Analytes
The intact cation C+ of an ionic analyte of the general composition [C+A–] givesrise to the base peak in positive-ion FD mass spectra. In addition, singly chargedcluster ions of the [CnAn–1]
+ type are observed. [87,88] Their abundance and themaximum of n varies depending on the ionic species encountered as well as on theactual experimental parameters such as temperature and sample load of the emitter(Fig. 8.18). The advantage of these cluster ions is that the mass difference betweenthe members of the series corresponds to [C+A–]. Thus, the counterion A– can bedetermined by subtraction of the mass of C+. Moreover, the isotopic pattern of theanion is reflected in the cluster ion signals, making the identification of chlorideand bromide, for example, very easy. Interestingly, ionic species corresponding tosome sort of “molecular ion of the salt” can also be formed. Usually, such ions areof much lower intensity than the even-electron cluster ions. Applications of FD-MS to detect cations are numerous and include organic cations [17,19,87-91] aswell as inorganic ones [92,93] even down to the trace level, [94] e.g., for trace-metal analysis in physiological fluids of multiple sclerosis patients. [95]
Zwitterions are always a little bit delicate to handle in mass spectrometry. De-pending on the acidity of the proton-donating site and on the basicity of the pro-ton-accepting site either the cationic or the anionic species can be formed prefer-entially. Adding acids to the solution of the analyte prior to loading of the emittercan significantly enhance the signal resulting from the protonated species. [96]
As pointed out, anions can be analyzed indirectly by FD-MS via the formationof cluster ions with their positive counterion. Negative-ion FD-MS for the directdetection of the anion A– and cluster ions of the general composition [Cn–1An]
– canbe performed, [97,98] but negative-ion FD-MS has remained an exception. This isdue to the fact that electrons are easily emitted from activated emitters beforenegative ions desorb. Then, the strong emission of electrons causes the destructionof the emitter. Low emitter voltage and larger emitter–counter electrode distancehelp to avoid such problems. [99] Neutral analytes can give rise to [M–H]– ions or
Fig. 8.18. FD mass spectrum of [(n-C4H9)4N]+ I–. The intact ammonium ion is detected atm/z 242; additional signals are due to cluster ions. (For the EI spectrum cf. Chap. 6.10.4).
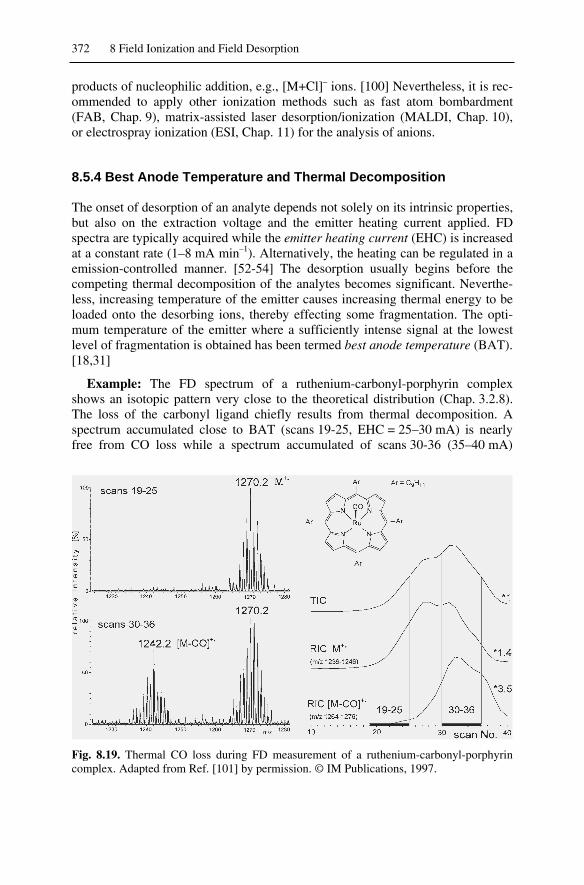
372 8 Field Ionization and Field Desorption
products of nucleophilic addition, e.g., [M+Cl]– ions. [100] Nevertheless, it is rec-ommended to apply other ionization methods such as fast atom bombardment(FAB, Chap. 9), matrix-assisted laser desorption/ionization (MALDI, Chap. 10),or electrospray ionization (ESI, Chap. 11) for the analysis of anions.
8.5.4 Best Anode Temperature and Thermal Decomposition
The onset of desorption of an analyte depends not solely on its intrinsic properties,but also on the extraction voltage and the emitter heating current applied. FDspectra are typically acquired while the emitter heating current (EHC) is increasedat a constant rate (1–8 mA min–1). Alternatively, the heating can be regulated in aemission-controlled manner. [52-54] The desorption usually begins before thecompeting thermal decomposition of the analytes becomes significant. Neverthe-less, increasing temperature of the emitter causes increasing thermal energy to beloaded onto the desorbing ions, thereby effecting some fragmentation. The opti-mum temperature of the emitter where a sufficiently intense signal at the lowestlevel of fragmentation is obtained has been termed best anode temperature (BAT).[18,31]
Example: The FD spectrum of a ruthenium-carbonyl-porphyrin complexshows an isotopic pattern very close to the theoretical distribution (Chap. 3.2.8).The loss of the carbonyl ligand chiefly results from thermal decomposition. Aspectrum accumulated close to BAT (scans 19-25, EHC = 25–30 mA) is nearlyfree from CO loss while a spectrum accumulated of scans 30-36 (35–40 mA)
Fig. 8.19. Thermal CO loss during FD measurement of a ruthenium-carbonyl-porphyrincomplex. Adapted from Ref. [101] by permission. © IM Publications, 1997.

8.5 FD Spectra 373
shows significant CO loss (Fig. 8.19). This is demonstrated by comparison of thetotal ion chromatogram (TIC) with the reconstructed ion chromatogram (RIC) ofM+• and [M–CO]+• (Chap. 5.4). The FD spectrum of a lower mass complex wasessentially free from signals belonging to CO loss because lower emitter currentswere sufficient to effect desorption. [101]
8.5.5 FD-MS of Polymers
FD-MS is perfectly suited for the analysis of synthetic oligomers and polymers.[27,28,61,65-67,102-104] In advantageous cases, polymer molecules beyond mo-lecular weights of 10,000 u can be measured. [105] Besides the mass analyzerused, limiting factors for the mass range are thermal decomposition of polymerand presence or absence of charge-stabilizing groups. The combination of aro-matic rings and low polarity in polystyrene, for example, is almost ideal for FD-MS. Heteroatoms are also useful because of their general capability to serve asproton- or metal ion-accepting sites. The worst case for mass spectrometry is pre-sented by polyethylene (PE). [65-67] The FD mass spectra of PE oligomers can beobtained up to m/z 3500. However, starting at around C40 hydrocarbons, field-induced and thermally induced dehydrogenation can no longer be suppressed.Thermal decomposition of the hydrocarbon chain plays a role above 2000 u.
Example: The FD mass spectrum of polyethylene of nominal average molecu-lar weight 1000 u (PE 1000) was obtained by summing of all scans where desorp-tion occurred, i.e., from the 4–45 mA range of emitter heating current (Fig. 8.20).[67] The result represents the molecular weight distribution of the polymer. Theexperimental average molecular weight can be calculated thereof by means ofEq. 3.1 (Chap. 3.1.4). The fractionating effect of emitter heating and the signifi-cant changes in spectral appearance are demonstrated by the spectra in the lowerpart of Fig. 8.20 showing fractions of the total ion desorption.
8.5.6 Sensitivity of FI-MS and FD-MS
In FD mode, the sensitivity (Chap. 5.2.4) of actual magnetic sector instruments isabout 4 10-11 C µg–1 for the quasimolecular ion of cholesterol, m/z 387, atR = 1000. This is 104 times less than specified for those instruments in EI modeand 103 times less than for CI mode.
In FI mode, the sensitivity of such instruments is about 4 10-9 A Pa–1 for themolecular ion of acetone, m/z 58, at R = 1000. This corresponds to an ion currentof 4 10-13 A at a realistic ion source pressure of 10–4 Pa.
Although the ion currents produced by FI/FD ion sources are by orders of mag-nitude smaller than those from EI or CI ion sources, the detection limits are quitegood. In general, about 0.1 ng of sample yield a sufficient signal-to-noise ratio(S/N 10) in FD-MS. This is because most of the ion current is collected in asingle ionic species (including the isotopomers). Furthermore, the background ofFI/FD ion sources is very clean, providing a good signal-to-background ratio.
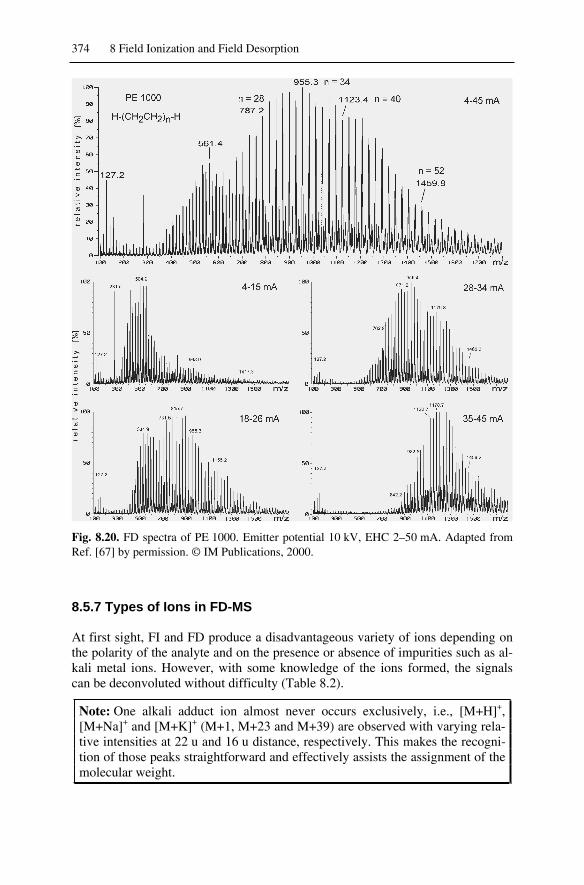
374 8 Field Ionization and Field Desorption
Fig. 8.20. FD spectra of PE 1000. Emitter potential 10 kV, EHC 2–50 mA. Adapted fromRef. [67] by permission. © IM Publications, 2000.
8.5.7 Types of Ions in FD-MS
At first sight, FI and FD produce a disadvantageous variety of ions depending onthe polarity of the analyte and on the presence or absence of impurities such as al-kali metal ions. However, with some knowledge of the ions formed, the signalscan be deconvoluted without difficulty (Table 8.2).
Note: One alkali adduct ion almost never occurs exclusively, i.e., [M+H]+,[M+Na]+ and [M+K]+ (M+1, M+23 and M+39) are observed with varying rela-tive intensities at 22 u and 16 u distance, respectively. This makes the recogni-tion of those peaks straightforward and effectively assists the assignment of themolecular weight.
8.6 Analytes for FI and FD 375
Table 8.2. Ions formed by FD
Method Analytes Ions Formed
FD unpolar M+•, M2+, occasionally M3+•
FD medium polarity M+•, M2+ and/or [M+H]+, [M+alkali]+,occasionally [2M]+• and/or [2M+H]+,[2M+alkali]+,rarely [M+2H]2+, [M+2 alkali]2+
FD polar [M+H]+, [M+alkali]+,often [2M+H]+, [2M+alkali]+,occasionally [nM+H]+, [nM+alkali]+,rarely [M+2H]2+, [M+2 alkali]2+
FD ionica C+, [Cn+An–1]+, rarely [CA]+•
a Comprising of cation C+ and anion A–.
8.6 Analytes for FI and FD
Analytes for FI have to be evaporated prior to ionization, and thus any samplesuitable for EI (Chap. 5.6) or CI (Chap. 7.6) yields low-fragmentation FI massspectra. For FD, the analyte should be soluble to at least 0.01 mg ml–1 in somesolvent. Concentrations of 0.1–2 mg ml–1 are ideal, whereas significantly higherconcentrations result in overloading the emitter, and in turn cause destruction dueto electric discharge. In case of extremely low solubility, repeated application ofsolution to the emitter is also possible. Fine suspensions or dispersions can be usedif necessary. Pure water tends not to wet the emitter surface; a problem that can becircumvented by addition of some methanol before transferring the solution to theemitter. Whatever the solvent, it should be volatile enough to evaporate prior tointroduction of the probe into the vacuum lock, while small volumes of dimethyl-formamide or dimethylsulfoxide, for example, can also be evaporated in the roughvacuum of the vacuum lock.
The analyte may be neutral or ionic. However, anions are usually detectedsolely in an indirect manner, i.e., from corresponding cluster ions. Solutions con-taining metal salts, e.g., from buffers or excess of non-complexed metals, are to beavoided, because sudden desorption of the metal ions at higher emitter current of-ten leads to rupture of the emitter. A mass range up to 3000 u is easily covered byFD, examples reaching up to 10,000 u have been presented.

376 8 Field Ionization and Field Desorption
8.7 Mass Analyzers for FI and FD
In FI and FD, ions of 10–12 keV kinetic energy are generated as a continuous ioncurrent. Compared to EI or CI the ion current is weak and exhibits a tendency tofluctuations. The voltage drop across the whiskers (roughly proportional to thewhisker length) causes an energy spread of the ions which results in poor resolu-tion with single-focusing magnetic sector instruments. [38] Therefore, double-focusing magnetic sector instruments are the standard in FD-MS. Although linearquadrupoles have been adapted to FI/FD ion sources rather successfully, [106,107]they never became widespread with FI/FD. Mass analyzers that require a pulsedsupply of ions (oaTOF, QIT) are also not easily fitted to FI/FD ion sources. Theability to externally accumulate ions before injection can compensate for fluctua-tion to some degree. This makes FT-ICR analyzers with an external FD ion sourcevery attractive [29] due to the unique resolving power and mass accuracy of FT-ICR instruments.
Reference List
1. Müller, E.W. Feldemission. Ergebnisseder exakten Naturwissenschaften 1953, 27,290-360.
2. Gomer, R.; Inghram, M.G. Applications ofField Ionization to Mass Spectrometry. J.Am. Chem. Soc. 1955, 77, 500.
3. Inghram, M.G.; Gomer, R. Mass-Spectrometric Analysis of Ions From theField Microscope. J. Chem. Phys. 1954,22, 1279-1280.
4. Inghram, M.G.; Gomer, R. Mass-Spectrometric Investigation of the FieldEmission of Positive Ions. Z. Naturforsch.1955, 10A, 863-872.
5. Beckey, H.D. Mass Spectrographic Inves-tigations, Using a Field Emission IonSource. Z. Naturforsch. 1959, 14A, 712-721.
6. Beckey, H.D. Field-Ionization MassSpectra of Organic Molecules. Normal C1
to C9 Paraffins. Z. Naturforsch. 1962, 17A,1103-1111.
7. Beckey, H.D. Molecule Dissociation byHigh Electric Fields. Z. Naturforsch. 1963,19A, 71-83.
8. Beckey, H.D. Mass Spectrometric Analy-sis with a New Source for the Productionof Ion Fields at Thin Wires or MetalEdges. Fresenius Z. Anal. Chem. 1963,197, 80-90.
9. Beckey, H.D.; Wagner, G. Analytical Useof an Ion Field Mass Spectrometer. Fre-senius Z. Anal. Chem. 1963, 197, 58-80.
10. Beckey, H.D.; Schulze, P. Field IonizationMass Spectra of Organic Molecules. III. n-Paraffins Up to C16 and Branched Paraf-fins. Z. Naturforsch. 1965, 20A, 1329-1335.
11. Beckey, H.D.; Wagner, G. Field IonizationMass Spectra of Organic Molecules. II.Amines. Z. Naturforsch. 1965, 20A, 169-175.
12. Beckey, H.D. Analysis of Solid OrganicNatural Products by Field Ionization MassSpectrometry. Fresenius Z. Anal. Chem.1965, 207, 99-104.
13. Beckey, H.D. Comparison of Field Ioni-zation and Chemical Ionization MassSpectra of Decane Isomers. J. Am. Chem.Soc. 1966, 88, 5333-5335.
14. Beckey, H.D. Field Desorption MassSpectrometry: a Technique for the Studyof Thermally Unstable Substances of LowVolatility. Int. J. Mass Spectrom. IonPhys. 1969, 2, 500-503.
15. Beckey, H.D.; Heindrichs, A.; Winkler,H.U. New Field Desorption Techniques.Int. J. Mass Spectrom. Ion Phys. 1970, 3,A9-A11.
16. Beckey, H.D. Field-Ionization MassSpectrometry; Pergamon: Elmsford, 1971.

Reference List 377
17. Sammons, M.C.; Bursey, M.M.; White,C.K. Field Desorption Mass Spectrometryof Onium Salts. Anal. Chem. 1975, 47,1165-1166.
18. Beckey, H.D. Principles of Field Desorp-tion and Field Ionization Mass Spec-trometry; Pergamon Press: Oxford, 1977.
19. Larsen, E.; Egsgaard, H.; Holmen, H.Field Desorption Mass Spectrometry of1-Methylpyridinium Salts. Org. MassSpectrom. 1978, 13, 417-424.
20. Schulten, H.-R. Ion Formation From Or-ganic Solids: Analytical Applications ofField Desorption Mass Spectrometry;Springer Series in Chemical Physics [25],Benninghoven, A., editor; Springer-Verlag: Heidelberg, 1983; pp. 14-29.
21. Lattimer, R.P.; Schulten, H.-R. Field Ioni-zation and Field Desorption Mass Spec-trometry: Past, Present, and Future. Anal.Chem. 1989, 61, 1201A-1215A.
22. Beckey, H.D.; Schulten, H.-R. Field De-sorption Mass Spectrometry. Angew.Chem. 1975, 87, 425-438.
23. Lehmann, W.D.; Schulten, H.-R. Physika-lische Methoden in der Chemie: Massen-spektrometrie II. CI-, FI- und FD-MS.Chem. Unserer Zeit. 1976, 10, 163-174.
24. Wood, G.W. Field Desorption MassSpectrometry: Applications. Mass Spec-trom. Rev. 1982, 1, 63-102.
25. Olson, K.L.; Rinehart, K.L. Field Desorp-tion, Field Ionization, and Chemical Ioni-zation Mass Spectrometry. Methods Car-bohyd. Chem. 1993, 9, 143-164.
26. Del Rio, J.C.; Philp, R.P. Field IonizationMass Spectrometric Study of High Mo-lecular Weight Hydrocarbons in a CrudeOil and a Solid Bitumen. Org. Geochem.1999, 30, 279-286.
27. Guo, X.; Fokkens, R.H.; Peeters, H.J.W.;Nibbering, N.M.M.; de Koster, C.G. Mul-tiple Cationization of Polyethylene Gly-cols in Field Desorption Mass Spectrome-try: a New Approach to Extend the MassScale on Sector Mass Spectrometers.Rapid Commun. Mass Spectrom. 1999, 13,2223-2226.
28. Lattimer, R.P. Field Ionization (FI-MS)and Field Desorption (FD-MS), in MassSpectrometry of Polymers, Montaudo, G.;Lattimer, R.P., editors; CRC Press: BocaRaton, 2001; pp. 237-268.
29. Schaub, T.M.; Hendrickson, C.L.; Qian,K.; Quinn, J.P.; Marshall, A.G. High-Resolution Field Desorption/IonizationFourier Transform Ion Cyclotron Reso-
nance Mass Analysis of Nonpolar Mole-cules. Anal. Chem. 2003, 75, 2172-2176.
30. Gomer, R. Field Emission, Field Ioniza-tion, and Field Desorption. Surf. Sci. 1994,299/300, 129-152.
31. Prókai, L. Field Desorption Mass Spec-trometry; Marcel Dekker: New York,1990.
32. Todd, J.F.J. Recommendations for No-menclature and Symbolism for MassSpectroscopy Including an Appendix ofTerms Used in Vacuum Technology. Int.J. Mass Spectrom. Ion. Proc. 1995, 142,211-240.
33. Ligon, W.V., Jr. Molecular Analysis byMass Spectrometry. Science 1979, 205,151-159.
34. Schröder, E. Massenspektrometrie - Be-griffe und Definitionen; Springer-Verlag:Heidelberg, 1991.
35. Derrick, P.J.; Robertson, A.J.B. FieldIonization Mass Spectrometry With Con-ditioned Razor Blades. Int. J. Mass Spec-trom. Ion Phys. 1973, 10, 315-321.
36. Giessmann, U.; Heinen, H.J.; Röllgen,F.W. Field Desorption of NonelectrolytesUsing Simply Activated Wire Emitters.Org. Mass Spectrom. 1979, 14, 177-179.
37. Heinen, H.J.; Giessmann, U.; Röllgen,F.W. Field Desorption of Electrolytic So-lutions Using Untreated Wire Emitters.Org. Mass Spectrom. 1977, 12, 710-715.
38. Beckey, H.D.; Krone, H.; Röllgen, F.W.Comparison of Tips, Thin Wires, andSharp Metal Edges As Emitters for FieldIonization Mass Spectrometry. J. Sci. In-strum. 1968, 1, 118-120.
39. Beckey, H.D.; Hilt, E.; Schulten, H.-R.High Temperature Activation of Emittersfor Field Ionization and Field DesorptionSpectrometry. J. Phys. E: Sci. Instrum.1973, 6, 1043-1044.
40. Linden, H.B.; Hilt, E.; Beckey, H.D. High-Rate Growth of Dendrites on Thin WireAnodes for Field Desorption Mass Spec-trometry. J. Phys. E: Sci. Instrum. 1978,11, 1033-1036.
41. Rabrenovic, M.; Ast, T.; Kramer, V. Al-ternative Organic Substances for Genera-tion of Carbon Emitters for Field Desorp-tion Mass Spectrometry. Int. J. MassSpectrom. Ion Phys. 1981, 37, 297-307.
42. Okuyama, F.; Hilt, E.; Röllgen, F.W.;Beckey, H.D. Enhancement of Field Ioni-zation Efficiency of 10-µm TungstenFilaments Caused by the Nucleation of

378 8 Field Ionization and Field Desorption
Carbide Particles. J. Vac. Sci. Technol.1977, 14, 1033-1035.
43. Linden, H.B.; Beckey, H.D.; Okuyama, F.On the Mechanism of Cathodic Growth ofTungsten Needles by Decomposition ofHexacarbonyltungsten Under High-FieldConditions. Appl. Phys. 1980, 22, 83-87.
44. Bursey, M.M.; Rechsteiner, C.E.; Sam-mons, M.C.; Hinton, D.M.; Colpitts, T.;Tvaronas, K.M. Electrochemically Depos-ited Cobalt Emitters for Field Ionizationand Field Desorption Mass Spectrometry.J. Phys. E: Sci. Instrum. 1976, 9, 145-147.
45. Matsuo, T.; Matsuda, H.; Katakuse, I. Sili-con Emitter for Field Desorption MassSpectrometry. Anal. Chem. 1979, 51, 69-72.
46. Okuyama, F.; Shen, G.-H. Ion FormationMechanisms in Field-Desorption MassSpectrometry of Semirefractory MetalElements. Int. J. Mass Spectrom. Ion Phys.1981, 39, 327-337.
47. Rechsteiner, C.E., Jr.; Mathis, D.E.; Bur-sey, M.M.; Buck, R.P. A Novel Inexpen-sive Device for the Electrochemical Gen-eration of Metallic Emitters for FieldDesorption. Biomed. Mass Spectrom.1977, 4, 52-54.
48. Goldenfeld, I.V.; Veith, H.J. A NewEmitter for Field-Desorption Mass Spec-trometry with Silver-Electroplated Micro-needles. Int. J. Mass Spectrom. Ion Phys.1981, 40, 361-363.
49. Kosevich, M.V.; Shelkovsky, V.S. A NewType of Graphite Emitter for Field Ioniza-tion/Field Desorption Mass Spectrometry.Rapid Commun. Mass Spectrom. 1993, 7,805-811.
50. Kümmler, D.; Schulten, H.-R. CorrelationBetween Emitter Heating Current andEmitter Temperature in Field DesorptionMass Spectrometry. Org. Mass Spectrom.1975, 10, 813-816.
51. Winkler, H.U.; Linden, B. On the Deter-mination of Desorption Temperatures inField Desorption Mass Spectrometry. Org.Mass Spectrom. 1976, 11, 327-329.
52. Schulten, H.-R.; Lehmann, W.D. High-Resolution Field Desorption Mass Spec-trometry. Part VII. Explosives and Explo-sive Mixtures. Anal. Chim. Acta 1977, 93,19-31.
53. Schulten, H.-R.; Nibbering, N.M.M. AnEmission-Controlled Field Desorption andElectron Impact Spectrometry Study ofSome N-Substituted Propane and Butane
Sultams. Biomed. Mass Spectrom. 1977, 4,55-61.
54. Schulten, H.-R. Recent Advances in FieldDesorption Mass Spectrometry. Adv. MassSpectrom. 1978, 7A, 83-97.
55. Linden, H. B. Germany DE 99-19963317,2001, 4 pp.
56. Severin, D. Molecular Ion Mass Spec-trometry for the Analysis of High- andNonboiling Hydrocarbon Mixtures. Erdölund Kohle - Erdgas - Petrochemie vere-inigt mit Brennstoff-Chemie 1976, 29, 13-18.
57. Mead, L. Field Ionization Mass Spec-trometry of Heavy Petroleum Fractions.Waxes. Anal. Chem. 1968, 40, 743-747.
58. Scheppele, S.E.; Hsu, C.S.; Marriott, T.D.;Benson, P.A.; Detwiler, K.N.; Perreira,N.B. Field-Ionization Relative Sensitivi-ties for the Analysis of Saturated Hydro-carbons From Fossil-Energy-Related Ma-terials. Int. J. Mass Spectrom. Ion Phys.1978, 28, 335-346.
59. Röllgen, F.W.; Beckey, H.D. Surface Re-actions Induced by Field Ionization of Or-ganic Molecules. Surf. Sci. 1970, 23, 69-87.
60. Schulten, H.-R.; Beckey, H.D. Criteria forDistinguishing Between M+. and [M+H]+
Ions in Field Desorption Mass Spectra.Org. Mass Spectrom. 1974, 9, 1154-1155.
61. Neumann, G.M.; Cullis, P.G.; Derrick, P.J.Mass Spectrometry of Polymers: Polypro-pylene Glycol. Z. Naturforsch. 1980, 35A,1090-1097.
62. McCrae, C.E.; Derrick, P.J. The Role ofthe Field in Field Desorption Fragmenta-tion of Polyethylene Glycol. Org. MassSpectrom. 1983, 18, 321-323.
63. Heine, C.E.; Geddes, M.M. Field-Dependent [M-2H]+• Formation in theField Desorption Mass SpectrometricAnalysis of Hydrocarbon Samples. Org.Mass Spectrom. 1994, 29, 277-284.
64. Klesper, G.; Röllgen, F.W. Field-InducedIon Chemistry Leading to the Formationof [M-2nH]+• and [2M-2mH]+• Ions in FieldDesorption Mass Spectrometry of Satu-rated Hydrocarbons. J. Mass Spectrom.1996, 31, 383-388.
65. Evans, W.J.; DeCoster, D.M.; Greaves, J.Field Desorption Mass SpectrometryStudies of the Samarium-Catalyzed Po-lymerization of Ethylene Under Hydrogen.Macromolecules 1995, 28, 7929-7936.
66. Evans, W.J.; DeCoster, D.M.; Greaves, J.Evaluation of Field Desorption Mass

Reference List 379
Spectrometry for the Analysis of Polyeth-ylene. J. Am. Soc. Mass Spectrom. 1996,7, 1070-1074.
67. Gross, J.H.; Weidner, S.M. Influence ofElectric Field Strength and Emitter Tem-perature on Dehydrogenation and C-CCleavage in Field Desorption Mass Spec-trometry of Polyethylene Oligomers. Eur.J. Mass Spectrom. 2000, 6, 11-17.
68. Gross, J.H.; Vékey, K.; Dallos, A. FieldDesorption Mass Spectrometry of LargeMultiply Branched Saturated Hydrocar-bons. J. Mass Spectrom. 2001, 36 , 522-528.
69. Goldenfeld, I.V.; Korostyshevsky, I.Z.;Nazarenko, V.A. Multiple Field Ioniza-tion. Int. J. Mass Spectrom. Ion Phys.1973, 11, 9-16.
70. Helal, A.I.; Zahran, N.F. Field Ionizationof Indene on Tungsten. Int. J. Mass Spec-trom. Ion Proc. 1988, 85, 187-193.
71. Röllgen, F.W.; Heinen, H.J. Formation ofMultiply Charged Ions in a Field Ioniza-tion Mass Spectrometer. Int. J. MassSpectrom. Ion Phys. 1975, 17, 92-95.
72. Röllgen, F.W.; Heinen, H.J. Energetics ofFormation of Doubly Charged BenzeneIons by Field Ionization. Z. Naturforsch.1975, 30A, 918-920.
73. Röllgen, F.W.; Heinen, H.J.; Levsen, K.Doubly-Charged Fragment Ions in theField Ionization Mass Spectra of Alkyl-benzenes. Org. Mass Spectrom. 1976, 11,780-782.
74. Kane-Maguire, L.A.P.; Kanitz, R.; Sheil,M.M. Comparison of Electrospray MassSpectrometry With Other Soft IonizationTechniques for the Characterization ofCationic -Hydrocarbon OrganometallicComplexes. J. Organomet. Chem. 1995,486, 243-248.
75. Rogers, D.E.; Derrick, P.J. Mechanisms ofIon Formation in Field Desorption of Oli-gosaccharides. Org. Mass Spectrom. 1984,19, 490-495.
76. Derrick, P.J.; Nguyen, T.-T.; Rogers,D.E.C. Concerning the Mechanism of IonFormation in Field Desorption. Org. MassSpectrom. 1985, 11, 690.
77. Veith, H.J.; Röllgen, F.W. On the Ioniza-tion of Oligosaccharides. Org. MassSpectrom. 1985, 11, 689-690.
78. Schulten, H.-R.; Beckey, H.D. Field De-sorption Mass Spectrometry With High-Temperature Activated Emitters. Org.Mass Spectrom. 1972, 6, 885-895.
79. Davis, S.C.; Neumann, G.M.; Derrick, P.J.Field Desorption Mass Spectrometry WithSuppression of the High Field. Anal.Chem. 1987, 59, 1360-1362.
80. Veith, H.J. Alkali Ion Addition in FDMass Spectrometry. Cationization andProtonation-Ionization Methods in theApplication of Nonactivated Emitters. Tet-rahedron 1977, 33, 2825-2828.
81. Giessmann, U.; Röllgen, F.W. Electrody-namic Effects in Field Desorption MassSpectrometry. Int. J. Mass Spectrom. IonPhys. 1981, 38, 267-279.
82. Röllgen, F. W. Ion Formation From Or-ganic Solids: Principles of Field Desorp-tion Mass Spectrometry; Springer Series inChemical Physics [25]; Benninghoven, A.,editor; Springer-Verlag: Heidelberg, 1983;pp. 2-13.
83. Wong, S.S.; Giessmann, U.; Karas, M.;Röllgen, F.W. Field Desorption of SucroseStudied by Combined Optical Microscopyand Mass Spectrometry. Int. J. MassSpectrom. Ion Proc. 1984, 56, 139-150.
84. Derrick, P.J. Mass Spectroscopy at HighMass. Fresenius Z. Anal. Chem. 1986,324, 486-491.
85. Davis, S.C.; Natoli, V.; Neumann, G.M.;Derrick, P.J. A Model of Ion EvaporationTested Through Field Desorption Experi-ments on Glucose Mixed With AlkaliMetal Salts. Int. J. Mass Spectrom. IonProc. 1987, 78, 17-35.
86. Reichert, H. Monodesoxygenierte Gluco-sid-Synthese und Kinetikstudien der en-zymatischen Spaltung. Dissertation, Or-ganisch-Chemisches Institut, UniversitätHeidelberg, 1997.
87. Veith, H.J. Field Desorption Mass Spec-trometry of Quaternary Ammonium Salts:Cluster Ion Formation. Org. Mass Spec-trom. 1976, 11, 629-633.
88. Veith, H.J. Mass Spectrometry of Ammo-nium and Iminium Salts. Mass Spectrom.Rev. 1983, 2, 419-446.
89. Veith, H.J. Collision-Induced Fragmenta-tions of Field-Desorbed Cations. 4. Colli-sion-Induced Fragmentations of Alky-lideneammonium Ions. Angew. Chem.1980, 92, 548-550.
90. Fischer, M.; Veith, H.J. Collision-InducedFragmentations of Field-Desorbed Ca-tions. 5. Reactions of 2- and 3-PhenylSubstituted Alkylalkylidene Iminium Ionsin the Gas Phase. Helv. Chim. Acta 1981,64, 1083-1091.

380 8 Field Ionization and Field Desorption
91. Miermans, C.J.H.; Fokkens, R.H.; Nib-bering, N.M.M. A Study of the Applica-bility of Various Ionization Methods andTandem Mass Spectrometry in the Analy-ses of Triphenyltin Compounds. Anal.Chim. Acta 1997, 340, 5-20.
92. Röllgen, F.W.; Giessmann, U.; Heinen,H.J. Ion Formation in Field Desorption ofSalts. Z. Naturforsch. 1976, 31A, 1729-1730.
93. Röllgen, F.W.; Ott, K.H. On the Forma-tion of Cluster Ions and Molecular Ions inField Desorption of Salts. Int. J. MassSpectrom. Ion Phys. 1980, 32, 363-367.
94. Lehmann, W.D.; Schulten, H.-R. Determi-nation of Alkali Elements by Field De-sorption Mass Spectrometry. Anal. Chem.1977, 49, 1744-1746.
95. Schulten, H.-R.; Bohl, B.; Bahr, U.;Mueller, R.; Palavinskas, R. Qualitativeand Quantitative Trace-Metal Analysis inPhysiological Fluids of Multiple SclerosisPatients by Field Desorption Mass Spec-trometer. Int. J. Mass Spectrom. Ion Phys.1981, 38, 281-295.
96. Keough, T.; DeStefano, A.J. Acid-Enhanced Field Desorption Mass Spec-trometry of Zwitterions. Anal. Chem.1981, 53, 25-29.
97. Ott, K.H.; Röllgen, F.W.; Zwinselmann,J.J.; Fokkens, R.H.; Nibbering, N.M.M.Negative Ion Field Desorption MassSpectra of Some Inorganic and OrganicCompounds. Org. Mass Spectrom. 1980,15, 419-422.
98. Daehling, P.; Röllgen, F.W.; Zwinsel-mann, J.J.; Fokkens, R.H.; Nibbering,N.M.M. Negative Ion Field DesorptionMass Spectrometry of Anionic Surfac-tants. Fresenius Z. Anal. Chem. 1982, 312,335-337.
99. Mes, G.F.; Van der Greef, J.; Nibbering,N.M.M.; Ott, K.H.; Röllgen, F.W. TheFormation of Negative Ions by Field Ioni-zation. Int. J. Mass Spectrom. Ion Phys.1980, 34, 295-301.
100. Dähling, P.; Ott, K.H.; Röllgen, F.W.;Zwinselmann, J.J.; Fokkens, R.H.; Nib-bering, N.M.M. Ionization by Proton Ab-straction in Negative Ion Field DesorptionMass Spectrometry. Int. J. Mass Spectrom.Ion Phys. 1983, 46, 301-304.
101. Frauenkron, M.; Berkessel, A.; Gross, J.H.Analysis of Ruthenium Carbonyl-Porphyrin Complexes: a Comparison ofMatrix-Assisted Laser Desorp-tion/Ionization Time-of-Flight, Fast-Atom
Bombardment and Field Desorption MassSpectrometry. Eur. Mass. Spectrom. 1997,3, 427-438.
102. Lattimer, R.P.; Harmon, D.J.; Welch, K.R.Characterization of Low MolecularWeight Polymers by Liquid Chromatogra-phy and Field Desorption Mass Spectros-copy. Anal. Chem. 1979, 51, 293-296.
103. Craig, A.C.; Cullis, P.G.; Derrick, P.J.Field Desorption of Polymers: Polybutadi-ene. Int. J. Mass Spectrom. Ion Phys.1981, 38, 297-304.
104. Lattimer, R.P.; Schulten, H.-R. Field De-sorption of Hydrocarbon Polymers. Int. J.Mass Spectrom. Ion Phys. 1983, 52, 105-116.
105. Matsuo, T.; Matsuda, H.; Katakuse, I. Useof Field Desorption Mass Spectra of Poly-styrene and Polypropylene Glycol AsMass References Up to Mass 10000. Anal.Chem. 1979, 51, 1329-1331.
106. Heinen, H.J.; Hötzel, C.; Beckey, H.D.Combination of a Field Desorption IonSource With a Quadrupole Mass Analyzer.Int. J. Mass Spectrom. Ion Phys. 1974, 13,55-62.
107. Gierlich, H.H.; Heinen, H.J.; Beckey, H.D.The Application of Quadrupole Mass Fil-ters in Field Desorption Mass Spectrome-try. Biomed. Mass Spectrom. 1975, 2, 31-35.

9 Fast Atom Bombardment
When particles of kiloelectronvolt kinetic energy are impinging on a surface, theycause the ejection of neutrals and secondary ions from that surface. Secondary ionmass spectrometry (SIMS) employing the sputtering effects of a beam of impact-ing ions on bulk, inorganic materials, [1-3] 252Cf plasma desorption (PD) time-of-flight (TOF) mass spectrometry effecting desorption/ionization of biomolecules byimpact of single megaelectronvolt nuclear fission fragments, [4-6] and molecularbeam solid analysis (MBSA) using energetic neutrals [7,8] had already beenknown when SIMS was applied to organic solids for the first time. [9,10] How-ever, the organic surfaces tended to cause electrostatic charging upon ion impact,thereby disturbing the ion source potentials. Employing a beam of energetic neu-tral atoms in analogy to the MBSA technique circumvented such problems andgave an impetus to the further development of this promising method. [11,12] Theterm fast atom bombardment (FAB) was coined [11-13] and prevailed. [7] Itturned out that intact molecular or quasimolecular ions could be generated even incase of highly polar compounds that were definitely not candidates for electronionization (EI, Chaps. 5, 6) or chemical ionization (CI, Chap. 7). Those FABspectra still suffered from rapid radiolytic decomposition of the samples upon ir-radiation and from the comparatively harsh conditions of desorption/ionization.The use of a liquid matrix where the analyte was dissolved for analysis broughtthe awaited improvement. [14,15] Thus, “matrix-assisted fast atom bombardment”– as one now would probably term it – started its career in organic mass spec-trometry [16,17] and soon became a powerful competitor of field desorption(Chap. 8). It turned out that the properties of the liquid matrix are of key impor-tance for the resulting FAB spectra. [18-20] Due to some electric conductivity ofthe matrix, primary ions could now be successfully employed again. [21-24] Ifprimary ions instead of neutrals are used to provide the energy for secondary ionejection from the liquid matrix, the technique is termed liquid secondary ion massspectrometry (LSIMS). Parallel to FAB and LSIMS, inorganic SIMS has tremen-dously developed to become a highly regarded method for surface analysis. [25-27] Although being soft, extremely versatile and still relevant ionization methods,FAB and LSIMS have widely been replaced by matrix-assisted laser desorp-tion/ionization (MALDI, Chap. 10) and electrospray ionization (ESI, Chap. 11).
Note: Besides their momentum, the nature of the primary particles is of minorrelevance for the spectral appearance [28] because little difference is observedbetween FAB and LSIMS spectra. Otherwise not explicitly distinguished fromLSIMS, here the usage of the term FAB will also implicate LSIMS.

382 9 Fast Atom Bombardment
9.1 Ion Sources for FAB and LSIMS
9.1.1 FAB Ion Sources
A FAB ion source basically is an EI ion source (Chap. 5.2.1) modified to give freeaccess to the fast atom beam. The electron-emitting filament and the ion sourceheaters are switched off during FAB operation (Fig. 9.1). The FAB gas is intro-duced via a needle valve into the lower part of the FAB gun mounted above theion source. From there, it effuses into the ionization chamber of the FAB gun andinto the ion source housing. The saddle field gun [29] is the most common type ofFAB gun, delivering a primary particle flux of some 1010 s–1 mm–2. [30,31] Thegas is ionized and the ions are accelerated by a high voltage (4–8 kV) and focusedonto the sample. [11,13,17,32] Neutralization of the energetic noble gas ions is ef-fected by charge exchange with incoming neutrals (Chaps. 2.12.3, 7.3). The ki-netic energy of the atoms is mostly conserved during charge exchange, and thusthe neutrals hit the exposed surface with high kinetic energy. Of course, neutrali-zation is not quantitative, but this is not an issue as long electrostatic charging ofthe sample is avoided. [28] Ion guns for the generation of energetic noble gas ionscan therefore be employed without disadvantage. [33] Xenon is preferred over ar-gon and neon as FAB gas, [34,35] because it transfers a higher momentum whenimpacting onto the surface at equal kinetic energy (Fig. 9.2). Consequently, evenmercury has been tried as FAB gas. [36]
Fig. 9.1. Schematic of a FAB ion source and a FAB gun.

9.1 Ion Sources for FAB and LSIMS 383
Fig. 9.2. Comparison of the efficiency of xenon, argon and neon FAB gas for the FABmass spectrum of Met-enkephalin, a small peptide. The intensities are in scale. Reproducedfrom Ref. [34] by permission. © Elsevier Science, 1983.
Note: Effusing FAB gas and evaporating matrix are an additional load to thehigh vacuum pump of the ion source housing, affording sufficient pumpingspeed (300–500 l s–1) for stable operation. Different from EI and CI ionsources, FAB ion sources are operated without heating to reduce evaporation ofthe matrix and thermal stress of the analyte. Accordingly, the ion source iscontaminated with matrix. Often, ion sources are constructed as EI/CI/FABcombination ion sources. After FAB measurements, it is therefore recom-mended to heat and pump the ion source over night prior to EI or CI operation.
9.1.2 LSIMS Ion Sources
As mentioned before, primary ions can also be employed to provide the energy forsecondary ion emission when organic compounds are admixed to a liquid matrix.[21-23] Cs+ ions are preferably used in organic liquid secondary ion mass spec-trometry (LSIMS). The Cs+ ions are produced by evaporation from a surfacecoated with cesium alumina silicate or other cesium salts. [21] Temperatures ofabout 1000 °C are necessary to generate a sufficient flow of primary ions, and thusprecautions must be taken to shield the LSIMS ion source from that heat. The Cs+
ions are extracted, accelerated and focused onto the target as usual by electrostaticlenses. [37-39] It is an advantage of Cs+ ion guns that the beam energy can bemore widely varied, e.g., in the 5–25 keV range, in order to adjust for optimizedsecondary ion emission. [40] Especially with high-mass analytes, Cs+ ion gunsgenerally yield superior ion emission as compared to Xe FAB. [28] In order tofurther increase the momentum of the primary ions, gold negative atomic ions,[41] as well as molecular and massive cluster ions (Chap. 9.5) have been used asprimary ions.
9.1.3 FAB Probes
The analyte, either solid or admixed to some liquid matrix, is introduced into theFAB ion source by means of a probe bearing a sample holder or FAB target. The

384 9 Fast Atom Bombardment
FAB target usually is a stainless steel or copper tip that exposes the analyte atsome angle (30–60°) to the fast atom beam. The target can have a plane or morespecially cup-shaped surface to hold a 1–3 µl drop of matrix/analyte mixture(Fig. 9.3). Normally, the target is maintained at ion source temperature, i.e., onlyslightly above ambient temperature. Heating or – more important – cooling can beprovided with special FAB probes only (Chap. 9.4.6).
Fig. 9.3. FAB probe of a JEOL JMS-700 magnetic sector instrument (left). The probe tipwith a drop of glycerol placed onto the exchangeable stainless steel FAB target (right).
9.2 Ion Formation in FAB and LSIMS
9.2.1 Ion Formation from Inorganic Samples
The energy provided by the impacting primary particle causes a collision cascadein the upper atomic or molecular layers of the sample. Within 30–60 ps, a cylin-drical expansion is effected in the sample along the path of penetration. [22] Notall of this energy is dissipated and absorbed in deeper sample layers. A portion isdirected towards the surface, where it effects ejection of material into the vacuum(Fig. 9.4). [24] In case of a bulk inorganic salt such as cesium iodide, Cs+ and I–
ions are heading away from the surface. [42] Those ions having the suitable polar-ity are attracted by the extraction/acceleration voltage, those of opposite chargesign are pushed back onto the surface. Held together by strong inter-ionic forces,ionic clusters may desorb as such or dissociate in the selvedge region due to theirinternal energy content.
Example: Bombardment of inorganic solids such as cesium iodide or gold canproduce series of cluster ions which are very useful for mass calibration of the in-strument over a wide mass range. CsI works equally well in positive- and nega-tive-ion mode to yield [(CsI)nCs]+ and [(CsI)nI]
– cluster ions, respectively(Fig. 9.5). Starting from n = 0, [(CsI)nCs]+ cluster ions have been observed up tom/z 90,000. [42] Larger [(CsI)nCs]+ cluster ions dissociate to yield smaller ones:[(CsI)nCs]+ [(CsI)n–xCs]+ + (CsI)x. [43] Gold produces a negative Aun
–• clusterion series up to about m/z 10,000. [44]

9.2 Ion Formation in FAB and LSIMS 385
Fig. 9.4. Simple illustration of an instantaneous collision cascade generated as a result ofprimary particle impact in desorption/ionization mass spectrometry. Adapted from Ref. [24]by permission. © John Wiley & Sons, 1995.
Fig. 9.5. Negative-ion FAB spectrum of solid CsI. The monoisotopic [(CsI)nI]– cluster ion
series (cf. expanded view of m/z 2205.4) is well suited for calibrating a wide mass range.
Note: CsI and Au both bear the advantage of being monoisotopic. This insuresthe peak top to exactly represent the theoretical isotopic mass of the respectivecluster ion, independent of its m/z ratio or actual resolution (Chap. 3.3.5, 3.4).CsI, KI, and other alkali salts providing more narrow-spaced cluster ion seriescan alternatively be employed as saturated solutions in glycerol. [45-47]
9.2.2 Ion Formation from Organic Samples
According to a paper by Todd “it is a common feature of FAB and LSIMS thatthey defy any generally acceptable mechanistic description.” [48] Unlike EI or CI,where gaseous ions are generated from gaseous molecules, desorption/ionizationtechniques combine a state transition from liquid or solid to the gas phase andionization of neutral molecules. Nonetheless, reviews dealing with the processesof desorption and ion formation under FAB and LSIMS conditions offer some in-
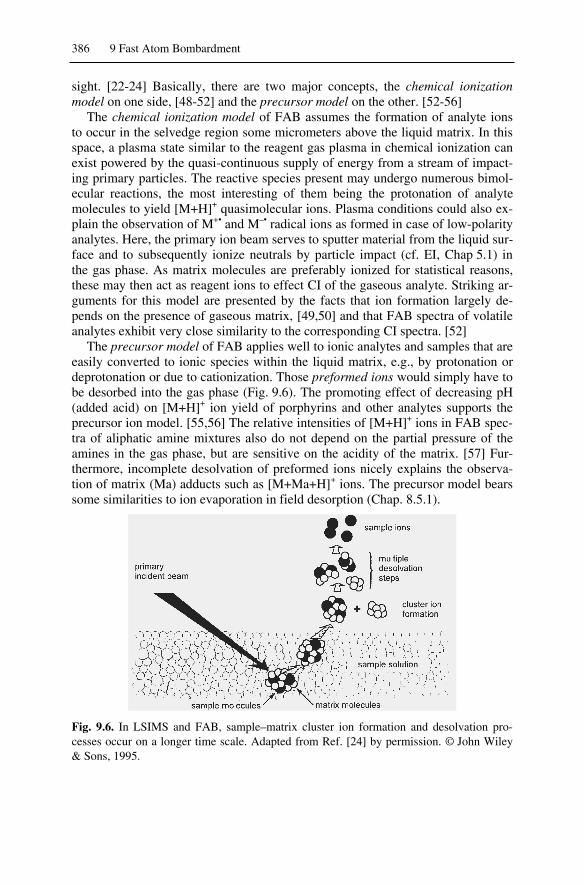
386 9 Fast Atom Bombardment
sight. [22-24] Basically, there are two major concepts, the chemical ionizationmodel on one side, [48-52] and the precursor model on the other. [52-56]
The chemical ionization model of FAB assumes the formation of analyte ionsto occur in the selvedge region some micrometers above the liquid matrix. In thisspace, a plasma state similar to the reagent gas plasma in chemical ionization canexist powered by the quasi-continuous supply of energy from a stream of impact-ing primary particles. The reactive species present may undergo numerous bimol-ecular reactions, the most interesting of them being the protonation of analytemolecules to yield [M+H]+ quasimolecular ions. Plasma conditions could also ex-plain the observation of M+• and M–• radical ions as formed in case of low-polarityanalytes. Here, the primary ion beam serves to sputter material from the liquid sur-face and to subsequently ionize neutrals by particle impact (cf. EI, Chap 5.1) inthe gas phase. As matrix molecules are preferably ionized for statistical reasons,these may then act as reagent ions to effect CI of the gaseous analyte. Striking ar-guments for this model are presented by the facts that ion formation largely de-pends on the presence of gaseous matrix, [49,50] and that FAB spectra of volatileanalytes exhibit very close similarity to the corresponding CI spectra. [52]
The precursor model of FAB applies well to ionic analytes and samples that areeasily converted to ionic species within the liquid matrix, e.g., by protonation ordeprotonation or due to cationization. Those preformed ions would simply have tobe desorbed into the gas phase (Fig. 9.6). The promoting effect of decreasing pH(added acid) on [M+H]+ ion yield of porphyrins and other analytes supports theprecursor ion model. [55,56] The relative intensities of [M+H]+ ions in FAB spec-tra of aliphatic amine mixtures also do not depend on the partial pressure of theamines in the gas phase, but are sensitive on the acidity of the matrix. [57] Fur-thermore, incomplete desolvation of preformed ions nicely explains the observa-tion of matrix (Ma) adducts such as [M+Ma+H]+ ions. The precursor model bearssome similarities to ion evaporation in field desorption (Chap. 8.5.1).
Fig. 9.6. In LSIMS and FAB, sample–matrix cluster ion formation and desolvation pro-cesses occur on a longer time scale. Adapted from Ref. [24] by permission. © John Wiley& Sons, 1995.

9.3 FAB Matrices 387
It has been estimated that a single impact causes the eruption of about 103 sec-ondary neutrals, but yields only 0.02–1.5 ions. [46,48,57,58] The ions are thenheading away from the surface in a supersonic expansion at speeds of about1000 m s–1. [22,46]
9.3 FAB Matrices
9.3.1 The Role of the Liquid Matrix
Soon after the first use of a glycerol matrix, the importance of a liquid matrix forFAB was recognized. [17] Other organic solvents of low volatility were exploredin order to obtain better spectra. The tasks of the matrix are numerous:[22,23,35,59,60] i) It has to absorb the primary energy. ii) By solvation it helps toovercome intermolecular forces between analyte molecules or ions. iii) The liquidmatrix provides a continuously refreshing and long-lasting supply of analyte.iv) Finally, it assists analyte ion formation, e.g., by yielding proton donat-ing/accepting or electron donating/accepting species upon bombardment. Nowa-days, numerous matrices are in use, with 3-nitrobenzyl alcohol (NBA), [61-63] 2-nitrophenyl octylether (NPOE), [18,61] and thioglycerol [16] being the mostwidespread. In particular NBA is a good choice for a first trial with an unknownsample. Others, such as di-, tri- and tetraethyleneglycols, [16,18] and triethanol-amine (TEA), [18] followed. Liquid paraffin, [64-66] sulfolane, [67,68] concen-trated sulfuric acid, [69] and others are also in use. [18,70,71] Several reviews onFAB matrices have appeared. [19,20,59,60,72] In summary, a good FAB matrixhas to fulfill the following criteria: [22,23,35,59,60] i) The analyte must be solublein the matrix. Otherwise, addition of co-solvents, e.g., dimethylformamide (DMF),dimethylsulfoxide (DMSO) or other additives, [73,74] can become necessary.
OH
NO2
NO2
OC8H17
HO
N OH
HO
SH
OH
OH
SH
OH
OH OH OH
OH
SH
glycerol thioglycerol dithiothreitol/-erythritol 5:1(magic bullet)
3-nitrobenzyl alcohol(NBA)
2-nitrophenyl octylether(NPOE)
triethanolamine(TEA)
Scheme 9.1.

388 9 Fast Atom Bombardment
ii) Only low-vapor pressure solvents can be easily used as a matrix in FAB. Inprinciple, volatile solvents could be employed, provided a stable surface could beobtained on the time scale of recording a mass spectrum. iii) The viscosity of thesolvent must be low enough to ensure the diffusion of the solutes to the surface.[75] iv) Ions from the matrix itself should be as unobtrusive as possible in the re-sulting FAB spectrum. v) The matrix itself has to be chemically inert. However,specific ion formation reactions promoting the secondary ion yield are beneficial.
Note: A great advantage of FAB is that the matrix can be perfectly adapted tothe analyte's requirements. On the other hand, using the wrong matrix can resultin complete suppression of analytically useful signals.
9.3.2 Characteristics of FAB Matrix Spectra
FAB matrix spectra are generally characterized by a series of matrix (Ma) clusterions accompanied by some more abundant fragment ions in the lower m/z range.In positive-ion FAB, [Man+H]+ cluster ions predominate, while [Man–H]– clusterions are preferably formed in negative-ion FAB (Fig. 9.7). The principal ion series
rela
tive
inte
nsity
[%]
185.1
93.0
75.0 277.2
*10
369.2
461.3
461.3
533.3645.4 737.4
[Ma+H]+
m/z
[Ma3+H]+
[Ma5+H]+
57.0
rela
tive
i nte
nsity
[%]
183.1
275.2
367.2
458.2
551.3
643.3
827.4 919.4
*10[Ma2-H]-
[Ma6-H]-
[Ma9-H]-
m/z
735.3
[Ma3-H]-
a
b
[Ma8+H]+
Fig. 9.7. FAB spectra of neat glycerol, Mr = 92 u. (a) Positive ions (for the positive-ion CIspectrum of glycerol cf. Chap. 7.2.5); (b) negative ions. The expanded view in (a) showsthe “peak at every m/z-character” of FAB spectra.

9.4 Applications of FAB-MS 389
may be accompanied by [Man+alkali]+ ions and some fragments of minor inten-sity, e.g., [Man+H–H2O]+. The fragment ions detected below the [Ma+H]+ ion,which normally also gives rise to the base peak, are almost the same as observedin the positive-ion CI mass spectrum of the respective matrix compound. [46]In addition to the prominent cluster ions, radiolytic decomposition of the matrixgenerates an enormous number of different ions, radicals, and cluster ions result-ing thereof. [76,77] Despite being of minor intensity, they contribute to the “peakat every m/z-character” of FAB spectra, i.e., there is significant chemical noise(Chap. 5.2.4). [78,79] During elongated measurements, the changes of the matrixspectrum due to increasing radiolytic decay are clearly visible. [76] High kineticenergy of impacting primary particles combined with reduced particle flux seemto diminish destructive effects of irradiation. [80]
9.3.3 Unwanted Reactions in FAB-MS
The conditions of the FAB process also promote unwanted reactions betweenanalyte and matrix. Even though such processes are not relevant in the majority ofFAB measurements, one should be aware of them. Besides addition or condensa-tion reactions with matrix fragment ions, [81,82] reduction [83-86] and dehalo-genation [87,88] of the analyte represent the more prominent side-reactions inFAB. Electron transfer to cause the reduction of otherwise doubly charged ionshave also been observed. [47]
9.4 Applications of FAB-MS
9.4.1 FAB-MS of Analytes of Low to Medium Polarity
The FAB plasma provides conditions that allow to ionize molecules by either lossor addition of an electron to form positive molecular ions, M+•, [52,89] or negativemolecular ions, M–•, respectively. Alternatively, protonation or deprotonation mayresult in [M+H]+ or [M–H]– quasimolecular ions. Their occurrence is determinedby the respective basicity or acidity of analyte and matrix. Cationization, prefera-bly with alkali metal ions, is also frequently observed. Often, [M+H]+ ions are ac-companied by [M+Na]+ and [M+K]+ ions as already noted with FD-MS(Chap. 8.5.7). Furthermore, it is not unusual to observe M+• and [M+H]+ ions inthe same FAB spectrum. [52] In case of simple aromatic amines, for example, thepeak intensity ratio M+•/[M+H]+ increases as the ionization energy of the substratedecreases, whereas 4-substituted benzophenones show preferential formation of[M+H]+ ions, regardless of the nature of the substituents. [90] It can be assumedthat protonation is initiated when the benzophenone carbonyl groups form hydro-gen bonds with the matrix.
Exchangeable hydrogens can be replaced by alkali ions without affecting thecharge state of a molecule. Thus, [M–Hn+alkalin+1]
+ and [M–Hn+alkalin–1]– ions

390 9 Fast Atom Bombardment
can also be observed if one or more acidic hydrogens are easily exchanged.[10,21,47,74,91,92] The addition of cation exchange resins or crown ethers mayhelp to reduce alkali ion contaminations. [93] Double protonation to yield[M+2H]2+ ions or double cationization [47] are only observed with high-massanalytes [94,95] and otherwise remain an exception in FAB. Which of the aboveprocesses will most effectively contribute to the total ion yield strongly dependson the actual analyte–matrix pair.
Example: The positive-ion FAB spectrum of tetramesitylporphyrin, C56H54N4,in NBA matrix exhibits M+• and [M+H]+ ions (Fig. 9.8). [96] The presence of bothspecies can be recognized by comparison of experimental and calculated M+1 in-tensity of the isotopic pattern. This difference can only be explained by assumingabout 20 % [M+H]+ ion formation. The diffuse groups of signals around m/z 900reveal the formation of some adduct ions with the matrix, e.g., [M+Ma+H–H2O]+
at m/z 918.
Fig. 9.8. Partial positive-ion FAB spectrum of a tetramesitylporphyrin in NBA matrix.Comparison of the experimental and calculated isotopic patterns reveals the presence ofM+• and [M+H]+ ions. Adapted from Ref. [96] by permission. © IM Publications, 1997.
Example: Polyethyleneglycols (PEGs) of average molecular weights up toabout 2000 u are well soluble in NBA. Resulting from their flexible polyetherchain, H(OCH2CH2)nOH, PEGs are easily cationized by loose complexation withNa+ or K+ ions. Traces of alkali salts are sufficient to prefer [M+alkali]+ over[M+H]+ ions. The positive-ion FAB spectrum of PEG 600 in NBA nicely showsthe molecular weight distribution of the oligomer (Fig. 9.9). The peaks belongingto the same series are displayed at 44 u distance.

9.4 Applications of FAB-MS 391
Fig. 9.9. Positive-ion FAB spectrum of polyethyleneglycol of average molecular weight600 u (PEG 600) in NBA matrix.
Note: PEGs ranging from PEG 300 to PEG 2000 are often used for mass cali-bration. They are particularly useful as internal reference (Chap. 3.3.5) for ac-curate mass measurements in positive-ion FAB-MS.
9.4.2 FAB-MS of Ionic Analytes
FAB is well suited for the analysis of ionic analytes. In positive-ion mode, thespectrum is usually dominated by the cationic species, C+, which is accompaniedby cluster ions of the general composition [Cn+An–1]
+. Thus, the distance betweenthese signals corresponds to the complete salt CA, i.e., yields its “molecular”weight. This behavior is perfectly analogous to FD (Chap. 8.5.3). In negative-ionFAB, the anion A– will cause the base peak of the spectrum, and accordingly,cluster ions of the type [Cn–1+An]
– are formed in addition. Consequently, both ca-tion and anion are usually identified from the same FAB spectrum, irrespective ofthe chosen polarity. Nonetheless, it is common practice to select the polarity of themore interesting ion for the measurement.
Provided the salt is sufficiently soluble in the matrix, the signals normally ex-hibit high intensity as compared to those of the matrix. This result is consistentwith the model of preformed ions in solution that only need to be desorbed intothe gas phase.
Example: The positive-ion FAB spectrum of an immonium perchlorate,[C14H16N]+ ClO4
–, [97] dissolved in NBA is dominated by the immonium ion (C+)at m/z 198 (Fig. 9.10). The perchlorate counterion can well be identified from thecluster ions [2C+A]+, m/z 495, and [3C+2A]+, m/z 792. The signal at m/z 495 isshown expanded to demonstrate that chlorine is readily recognized from its iso-topic pattern (Chap. 3.2.3).

392 9 Fast Atom Bombardment
Fig. 9.10. Positive-ion FAB spectrum of an immonium salt. [97] The perchlorate counter-ion can well be identified from the first and second cluster ion. By courtesy of H. Irn-gartinger, University of Heidelberg.
Example: The Bunte salt [CH3(CH2)15S-SO3]– Na+ yields a very useful nega-
tive-ion FAB spectrum from NBA matrix (Fig. 9.11). NBA forms [Ma–H]– andMa–• ions. The salt anion contributes the base peak at m/z 337.3. [C+2A]–,m/z 697.5, and [2C+3A]–, m/z 1057.6, cluster ions are observed in addition, theirisotopic patterns being in good agreement with theoretical expectation. It is note-worthy that the matrix adduct at m/z 513.4 is a negative radical ion.
rela
ti ve
inte
nsity
[%]
337.3
513.4
697.5
1057.6
153.1
m/z
[C48H99S6O9Na2]-[C32H66S4O6Na]-
exp. calc. exp. calc.
[C16H33S2O3]-
[CA+Ma]-.
[2C+3A]-
[C+2A]-
Fig. 9.11. Negative-ion FAB mass spectra of a Bunte salt. The insets compare experimentaland calculated isotopic patterns of the [C+2A]– and [2C+3A]– cluster ions. By courtesy ofM. Grunze, University of Heidelberg.
9.4.3 High-Mass Analytes in FAB-MS
FAB is chiefly applied to analytes up to about m/z 3000, but significantly heavierions are sometimes accessible. The upper limit surely has been demonstrated bythe detection of [(CsI)nCs]+ cluster ions up to m/z 90,000. [42] In case of organicmolecules, the detection of [M+H]+, [M+2H]2+ and [M+3H]3+ ions of porcine
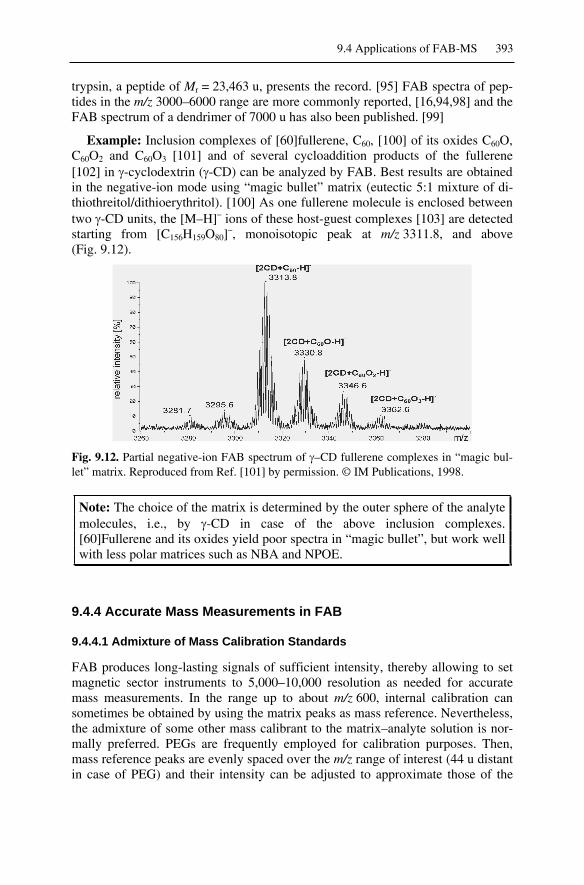
9.4 Applications of FAB-MS 393
trypsin, a peptide of Mr = 23,463 u, presents the record. [95] FAB spectra of pep-tides in the m/z 3000–6000 range are more commonly reported, [16,94,98] and theFAB spectrum of a dendrimer of 7000 u has also been published. [99]
Example: Inclusion complexes of [60]fullerene, C60, [100] of its oxides C60O,C60O2 and C60O3 [101] and of several cycloaddition products of the fullerene[102] in -cyclodextrin ( -CD) can be analyzed by FAB. Best results are obtainedin the negative-ion mode using “magic bullet” matrix (eutectic 5:1 mixture of di-thiothreitol/dithioerythritol). [100] As one fullerene molecule is enclosed betweentwo -CD units, the [M–H]– ions of these host-guest complexes [103] are detectedstarting from [C156H159O80]
–, monoisotopic peak at m/z 3311.8, and above(Fig. 9.12).
Fig. 9.12. Partial negative-ion FAB spectrum of –CD fullerene complexes in “magic bul-let” matrix. Reproduced from Ref. [101] by permission. © IM Publications, 1998.
Note: The choice of the matrix is determined by the outer sphere of the analytemolecules, i.e., by -CD in case of the above inclusion complexes.[60]Fullerene and its oxides yield poor spectra in “magic bullet”, but work wellwith less polar matrices such as NBA and NPOE.
9.4.4 Accurate Mass Measurements in FAB
9.4.4.1 Admixture of Mass Calibration Standards
FAB produces long-lasting signals of sufficient intensity, thereby allowing to setmagnetic sector instruments to 5,000–10,000 resolution as needed for accuratemass measurements. In the range up to about m/z 600, internal calibration cansometimes be obtained by using the matrix peaks as mass reference. Nevertheless,the admixture of some other mass calibrant to the matrix–analyte solution is nor-mally preferred. PEGs are frequently employed for calibration purposes. Then,mass reference peaks are evenly spaced over the m/z range of interest (44 u distantin case of PEG) and their intensity can be adjusted to approximate those of the

394 9 Fast Atom Bombardment
analyte. However, the mass calibrant can only be admixed if unwanted reactionswith the analyte do not occur. In particular, in case of badly soluble analytes,complete suppression of the analyte signals by the added calibrant often presents aproblem.
Example: The positive-ion high-resolution (HR) FAB spectrum of a cationicfluorescent marker dye shows the signal of the analyte ion enclosed by a set ofmass reference peaks due to the admixture of PEG 600 (Fig. 9.13). The elementalcomposition of the analyte can be assigned with good accuracy: exp.m/z 663.3182, calc. m/z 663.3158 for [C37H42O4N4F3]
+; exp. m/z 664.3189, calc.m/z 664.3186 for [13C12C36H42O4N4F3]
+.
Fig. 9.13. Positive-ion FAB spectrum of a cationic fluorescent marker dye with PEG 600admixed for internal mass calibration. By courtesy of K. H. Drexhage, University of Siegenand J. Wolfrum, University of Heidelberg.
9.4.3.2 Pseudo-Internal Calibration
Provided a mass spectrometer offers very good scan-to-scan reproducibility ofmass calibration, there is no absolute necessity to admix the mass calibrationcompound to the analyte. Instead, alternating scans on analyte and mass referencecan yield almost the same level of accuracy. The simplest technical realization ofsuch a procedure of pseudo-internal calibration is presented by changing the tar-get without interruption of the measurement. [104] The use of a dual-target FABprobe (DTP), i.e., of a split or double-sided target that offers two separated posi-tions, is much better. [105] Switching between these positions is then achieved byrotating the probe axially between successive scans. The resulting total ion chro-matogram (TIC, Chap. 5.4) typically has a saw-tooth appearance (Fig. 9.14). Cali-bration of the analyte spectra is then performed by transferring the internal cali-bration of the mass reference scan(s) to the successive scan(s) on the analyte side.The advantages of a DTP are: i) independent of resolution, the reference peaks donot interfere with those from the analyte, ii) mutual suppression of reference com-pound and analyte are excluded, iii) there is no need to adjust the relative intensi-

9.4 Applications of FAB-MS 395
ties of analyte and calibrant peaks very closely, and iv) otherwise reactive masscalibration compounds can be employed. [106]
Fig. 9.14. FAB dual-target probe with handle for 180° axial turns (left) and TIC of a HR-FAB measurement using this probe (right).
Note: Scanning of a magnet is affected by hysteresis. This causes the repro-ducibility of mass calibration to improve after several scan cycles have passed.For best results with dual-target probes, it is therefore recommended to skip thefirst few scans.
9.4.5 Continuous-Flow FAB
In standard FAB, the surface of the matrix solution is depleted of analyte and suf-fers from radiational damage during elongated measurements. Refreshment of thesurface proceeds by diffusion (limited by the viscosity of the matrix) or evapora-tion. Continuous-flow fast atom bombardment (CF-FAB) continuously refreshesthe surface exposed to the atom beam. [107,108] The same effect is obtained inslightly different way by the frit-fast atom bombardment (frit-FAB) technique.[109,110] In addition, both CF-FAB and frit-FAB can be used for online-couplingof liquid chromatography (LC, Chap. 12) [111] or capillary electrophoresis (CE)to a FAB ion source. [112]
In CF-FAB, a carrier solution which is typically composed of 95 % water and5 % glycerol is passed through the CF-FAB interface via a fused silica capillary of75 µm inner diameter at flow rates of 5–20 µl min–1. Into this flow, a volume of0.5–5 µl of liquid sample is injected. As the liquid reaches the end of the capillaryinside the FAB ion source, it becomes exposed to the atom beam. The waterevaporates while excess glycerol is typically absorbed by a small wick attached tothe probe tip. The signal persists as long as it takes to completely elute the analytefrom the interface (Fig. 9.15). [107,113] Due to lower flow rates of 1–2 µl min–1,the frit-FAB design does not need an absorbing pad (Fig 9.15). Generally, theopen capillary yields less tailing after injections and can accommodate higher flowrates, whereas the frit-FAB technique operates at lower flow rates and is easier tostabilize during operation. [113-115]

396 9 Fast Atom Bombardment
Fig. 9.15. Experimental setups of CF-FAB (a) and frit-FAB (b). Reproduced from Ref.[108] by permission (a). © Academic Press, 1986. Reproduced from Ref. [110] by permis-sion (b). © Elsevier Science, 1988.
Example: The significant increase in sensitivity and the improvements of sig-nal-to-background ratio (Chap. 5.2.4) in CF-FAB spectra are demonstrated bycomparison of the standard FAB and CF-FAB mass spectra of peptides. [108,116]In case of 10 pmol of the peptide des(gln)-substance P (Fig. 9.16) solely CF-FABreveals the low-intensity signals due to some loss of side chain groups and severala-type fragments.
Fig. 9.16. Comparison of standard FAB (a) and CF-FAB spectra (b) of 10 pmol of the pep-tide des(gln)-substance P. Reproduced from Ref. [108] by permission. © Academic Press,1986.
9.4.6 Low-Temperature FAB
Cooled FAB probes have been designed to prolong the acquisition time for FABmeasurements with more volatile matrices. [117] Research on sputtering processesfrom solid gases has contributed to FAB at cryogenic temperatures. [118,119]
9.4 Applications of FAB-MS 397
More recently, studies concerning cluster ion formation from solid or deeplycooled liquid alcohols [120-122] have gained new interest. [123,124] Low-temperature fast atom bombardment (LT-FAB) of frozen aqueous solutions ofmetal salts provides a source of abundant hydrated metal ions. [125-127] Organicmolecules can also be detected from their frozen solutions. [128] Such LT-FABapplications are particularly interesting when enabling the detection of species thatwould otherwise not be accessible by mass spectrometry, because they are eitherextremely air- and/or water-sensitive [129,130] as the phosphaoxetane intermedi-ate of the Wittig reaction [131] or insoluble in standard FAB matrices. [106,132]
LT-FAB mass spectra are obtained during thawing of the frozen solution in theion source of the mass spectrometer, thereby allowing to employ almost any sol-vent as matrix in LT-FAB-MS. Consequently, neither volatility nor unwantedchemical reactions with the matrix restrict the choice of a matrix. Instead, the sol-vent matrix may be tailored to the analyte's requirements.
LT-FAB needs somewhat higher amounts of sample than FAB at ambient tem-perature where more effective matrices than standard solvents are used. Thus, theanalytes should be dissolved in the respective solvent to yield 0.5–3.0 µg µl–1 so-lutions. About 3–4 µl of solution are deposited on the FAB probe tip and frozen.Freezing can be achieved in two ways: i) by cooling the target with cold nitrogengas inside a specially designed vacuum lock before application of the sample[129,131] or ii) by simply immersing the target with the drop of solution into liq-uid nitrogen for about 30 s prior to transfer into the vacuum lock.[106,123,124,130,133]
Fig. 9.17. Partial LT-FAB mass spectrum of the reaction mixture containing the iridiumcomplexes 1 and 2 in toluene. In addition to the changes in mass, the isotopic patternchanges upon exchange of Cl by Br. By courtesy of P. Hofmann, University of Heidelberg.

398 9 Fast Atom Bombardment
Example: Selective activation of C–H bonds is rarely observed in saturated al-kyl groups, but the iridium complex 1 does react by C–H insertion of the metalinto a ligand bond upon treatment with LiBr in solution. The reaction can betracked by LT-FAB-MS (Fig. 9.17). A decreasing intensity of the molecular ion of1, m/z 812.4, and increasing M+• of 2, m/z 856.4, indicate the progress of this re-action. Furthermore, the halogen exchange is indicated by the isotopic pattern.
9.4.7 FAB-MS and Peptide Sequencing
The possibility to obtain peptide sequence information from FAB mass spectrawas soon recognized. [15,134] Initially, the sequence was derived from fragmentions observed in the full scan FAB spectra. [15,98] Another approach to sequenceinformation is to subject the peptide to enzymatic hydrolysis by a mixture of sev-eral carboxypeptidases to produce a series of truncated molecules. The FAB spec-trum of the mixture then reveals the C-terminal sequence. [135,136] In theMALDI community, this approach became known as peptide ladder sequencing.[137] Nowadays, sequencing of peptides and other biopolymers by mass spec-trometry makes use of tandem MS methods and represents the major field of workfor many mass spectrometrists. [138-141] As protein ions are too big to effectfragmentation by collision-induced dissociation (CID, Chap. 2.12.1), they are en-zymatically degraded to peptides prior to their mass spectrometric examination,e.g., by tryptic digestion. [142] The digest may be used directly to obtain MS/MSspectra of peptide [M+H]+ or [M+Na]+ quasimolecular ions. Alternatively, thepeptides may be separated by liquid chromatography (LC), capillary electropho-resis (CE) [143], or 2D gel electrophoresis before.
Example: The FAB-CID-MS/MS spectrum of thymosin-T1 [M+H]+ quasi-molecular ions, m/z 1427.7, as obtained from a magnetic four-sector instrument[144] shows numerous fragment ions due to N-terminal, C-terminal, and internalfragmentations (Fig. 9.18). [145]
Fig. 9.18. FAB-CID-MS/MS spectrum of thymosin-T1 [M+H]+ ions, m/z 1427.7. Repro-duced from Ref. [145] by permission. © American Chemical Society, 1993.

9.4 Applications of FAB-MS 399
Note: One of the advantages of MS/MS techniques is that they do not requirethe full isolation of all compounds of interest, because the precursor ion selec-tion of MS1 excludes accompanying ions from contributing to the CID spec-trum of the actually selected precursor ion as acquired by MS2 (Chaps. 4.2.7,4.3.6, 4.4.5 and 12.3).
H2NN
NHN
OH
R
O R
O R
O R
O
H
H
X3
Y3
Z3 XY
Z
AB
C
H
HH2N
NN
NH3
R
O R
O R
O
H
HH2N
NN
R
O R
O R
H
HH2N
NN
R
O R
O R
O
H2NN
N
R
O R
O R
H
H
c"3
b3
a3
H+
OH
R
O
H3NOH
R
OHN
OH
O R
O
z1y"1x1acylium ion ammonium ion carbenium ion
acylium ion
ammonium ion
immonium ion
carbenium ion
26 u 17 u
28 u 17 u
charge on N terminal fragment
charge on C terminal fragment
A B C
X Y Z
+
+
++
+
+
+
Scheme 9.2.
It would be complicating if not impossible having to obtain sequence informa-tion from such a spectrum without rules to follow. [138-141,146,147] The mostabundant ions obtained from the fragmenting peptide ion usually belong to six se-ries named a, b, and c if the proton (charge) is kept in the N-terminus or x, y, andz, respectively, where the proton is located in the C-terminal part. Within each se-

400 9 Fast Atom Bombardment
ries the mass difference should be just that of one amino acid. Ideally, one cancount down amino acid by amino acid. Sometimes, a fragment ion may containmore hydrogens than expected from the “clear cut”. Those additional hydrogensare indicated as y"1 for example, where the index 1 denotes the presence of 1amino acid residue. However, reality is not so simple. Besides these ions, internalfragments of the chain may be formed by cleavage of two or more bonds. Amongothers, e.g., w type ions, this causes immonium ions to occur that are identicalwith the a1 ions of the respective amino acid.
9.5 Massive Cluster Impact
Massive cluster impact (MCI) mass spectrometry presents an additional means ofgenerating secondary ions by bombardment of a surface. [148] Massive clusters ofup to 108 u are generated by electrohydrodynamic emission (Chap. 11.1.3) of anelectrolyte/glycerol solution, e.g., 0.75 M ammonium acetate in glycerol. The re-sulting clusters consisting of about 106 glycerol molecules and bearing about 200electron charges on the average are accelerated by a 10–20 kV high voltage. [149]Although those highly charged microdroplets carry megaelectronvolt kinetic ener-gies, the translational energy per nucleon is only in the order of 1 eV, whereas it isabout 50 eV per nucleon in case of Xe FAB. A shock wave model is proposed toexplain ion formation in MCI. [150] Due to this model both the impacting clusterand the surface of the bulk or matrix-dissolved analyte are compressed to gigapas-cal pressures upon impact. Some mixing of analyte and impacting microdropletcan be demonstrated by the occurrence of analyte species cationized by the sameions as used as electrolyte in the solution employed to generate the massive clus-ters from. Nonetheless, a matrix effect due to accumulation of a thin layer of glyc-erol on the surface can be excluded. [149] Instead, dry sample preparations workequally well in MCI. [149]
MCI has successfully been applied to analyze proteins up to about 17,000 u.[151] These form multiply charged ions, e.g., [M+6Na]6+, under the conditions ofMCI. [151] Especially in the mass range of about 104 u, MCI is superior to FABand LSIMS because it combines good signal intensity due to the enormous mo-mentum of the impinging species with a remarkably low degree of ion fragmenta-tion. Despite of its promising capabilities, MCI has been superseded by MALDIand ESI before it could receive widespread acceptance.
9.6 252Californium Plasma Desorption
252Californium plasma desorption (252Cf-PD) dates back to 1973 [4-6,22,154-156]and was the first method to yield quasimolecular ions of bovine insulin. [157]Practically, 252Cf-PD served for protein characterization, a field of applicationwhich is now almost fully transferred to MALDI or ESI (Chaps. 10, 11). [158]

9.6 252Californium Plasma Desorption 401
In 252Cf-PD-MS, particles of megaelectronvolt translational energy are createdfrom radioactive decay of 252Cf nuclides, the nuclear process being the source oftheir kinetic energy. Each event yields two nuclides of varying identity, the sum oftheir masses being the mass of the former nucleus. The fission fragments of simi-lar mass are travelling in opposite direction. Thus, only one of each pair can beemployed to effect desorption of ions from a thin film of analyte on a support foil.The ionization process in 252Cf-PD is different from FAB with some closer rela-tions to dry SIMS. The incident particles are normally travelling from the backsidethrough a thin sample layer on a support foil. [24,159] The initial interaction of thefission fragment with a solid produces approximately 300 electron–hole pairs perangstrom along its track. Recombination of these pairs releases a large amount ofenergy to the surrounding medium. Within an organic layer, the resulting suddenheat is dissipated by lattice vibrations (phonons) that finally effect desorption ofions from that layer. [6,160,161] In addition to spontaneous ion desorption, ioni-zation processes can occur on the nanosecond timescale in the gas phase. [162]
Deposition of the analyte on nitrocellulose films instead of metal foils allowsthe removal of alkali ion contaminations by washing of the sample layer which re-sults in better PD spectra. [163] Further improvements can be achieved by ad-sorption of the analyte molecules on top of an organic low-molecular weight ma-trix layer. [164,165]
Obviously, 252Cf-PD creates ions in a pulsed manner – one burst of ions per fis-sion event – analogous to laser desorption, a fact that restricted the adaptation of252Cf-PD to time-of-flight (TOF) analyzers (Chap. 4.2). The second fission frag-ment is not useless, however, because it serves to trigger the time measurement ofthe TOF analyzer if the fission fragment source is placed between sample and fis-sion fragment detector (Fig. 9.19). [24,160]
252Cffissionsource
fissionfragmentdetector
supportfoil withsamplelayer
ionaccelerationgrid
accelerated ions
TOF drift region
detector
fission fragments
Fig. 9.19. Schematic of a 252Cf-plasma desorption TOF instrument. [160]
Example: The 252Cf-PD mass spectrum of bovine insulin exhibits the [M+H]+
quasimolecular ion as well as the doubly charged [M+2H]2+ and triply charged[M+3H]3+ ion (Fig. 9.20). [156] Fragment ions corresponding to the A and Bchain as well as some a-type peptide fragments ions are observed in addition.

402 9 Fast Atom Bombardment
Fig. 9.20. 252Cf-PD mass spectrum of oxidized insulin. Reproduced from Ref. [156] bypermission. © John Wiley and Sons, 1994.
9.7 General Characteristics of FAB and LSIMS
9.7.1 Sensitivity of FAB-MS
In FAB mode, the sensitivity (Chap. 5.2.4) is more difficult to specify than forother ionization methods, because the intensity of a signal also strongly dependson the actual preparation on the target. Magnetic sector instruments yield ion cur-rents of about 10–11–10–10 A on matrix ions at R = 1000. Significantly lower fig-ures (10–15–10–14 A) are obtained for the quasimolecular ion of bovine insulin,m/z 5734.6, at R = 6000. Accordingly, the detection limits vary depending on thesolubility of the analyte and the ease to achieve some sort of ionization if not al-ready ionic at all.
9.7.2 Types of Ions in FAB-MS
FAB produces a variety of ions depending on the polarity and on the ionizationenergy of the analyte as well as on the presence or absence of impurities such asalkali metal ions. [138] However, with some knowledge of the types of ionsformed, reasonable compositions can be assigned to the signals (Table 9.1).

9.7 General Characteristics of FAB and LSIMS 403
Table 9.1. Ions formed by FAB/LSIMS
Analytes Positive Ions Negative Ions
non-polar M+• M–•
mediumpolarity
M+• and/or [M+H]+, [M+alkali]+,clusters [2M]+• and/or [2M+H]+,[2M+alkali]+,adducts [M+Ma+H]+, [M+Ma+alkali]+
M–• and/or [M–H]–,clusters [2M]–• and/or [2M–H]–
adducts [M+Ma]–•, [M+Ma–H]–
polar [M+H]+, [M+alkali]+,clusters [nM+H]+, [nM+alkali]+,adducts [M+Ma+H]+, [M+Ma+alkali]+
exchange [M–Hn+alkalin+1]+
high-mass anal. [M+2H]2+, [M+2alkali]2+
[M–H]–,clusters [nM–H]–
adducts [M+Ma–H]–
exchange [M–Hn+alkalin–1]–
ionica C+, [Cn+An–1]+, rarely [CA]+• A–, [Cn–1+An]
–, rarely [CA]–•
a Comprising cation C+ and anion A–.
9.7.3 Analytes for FAB-MS
For FAB/LSIMS, the analyte should be soluble to at least 0.1 mg ml–1 in somesolvent or even better directly in the matrix; concentrations of 0.1–3 µg µl–1 in thematrix are ideal. In case of extremely low solubility, additives such as other sol-vents, acids or surfactants can help. [74]
The analyte may be neutral or ionic. Solutions containing metal salts, e.g., frombuffers or excess of noncomplexed metals, may cause a confusingly large numberof signals due to multiple proton/metal exchange and adduct ion formation. [91]The mass range up to 3000 u is easily covered by FAB, samples reaching up toabout twice that mass still may work if sufficient solubility and some ease of ioni-zation are combined.
9.7.4 Mass Analyzers for FAB-MS
Double-focusing magnetic sector instruments represent the standard in FAB-MS, because they combine a suitable mass range with the ability to perform high-resolution and accurate mass measurements. Until the advent of ESI and MALDI,FAB-MS/MS on magnetic four-sector instruments was the method of choice forbiomolecule sequencing (Chaps. 4.3.6, 9.4.7). [144,145,152] Linear quadrupoleshave also been adapted to FAB ion sources. [153] Triple quadrupole instrumentsin particular were used for peptide sequencing in the mid 1980s. However, thistype of FAB application for the most part has been replaced by matrix-assisted la-ser desorption/ionization (MALDI) and electrospray ionization (ESI). Other typesof mass analyzers are rare exceptions with FAB or LSIMS ion sources.

404 9 Fast Atom Bombardment
Reference List
1. Benninghoven, A.; Kirchner, F. The En-ergy Distribution of Atomized Neutral andCharged Products. Z. Naturforsch. 1963,18A, 1008-1010.
2. Honig, R.E. The Development of Secon-dary Ion-MS (SIMS): a Retrospective. Int.J. Mass Spectrom. Ion Proc. 1985, 66, 31-54.
3. Honig, R.E. Stone-Age Mass Spectrome-try: the Beginnings of "SIMS" at RCALaboratories, Princeton. Int. J. MassSpectrom. Ion Proc. 1995, 143, 1-10.
4. Macfarlane, R.D.; Torgerson, D.F. Cali-fornium-252-Plasma Desorption Time-of-Flight-MS. Int. J. Mass Spectrom. IonPhys. 1976, 21, 81-92.
5. Macfarlane, R.D.; Torgerson, D.F. Cali-fornium-252 Plasma Desorption MassSpectroscopy. Science 1976, 191, 920-925.
6. Macfarlane, R. D. Ion Formation fromOrganic Solids: High Energy Heavy-ionInduced Desorption. Benninghoven, A.,ed., Springer Series in Chemical Physics25, 32-46, 1983, Springer-Verlag Heidel-berg.
7. Devienne, F.M.; Roustan, J.-C. "FastAtom Bombardment" - a RediscoveredMethod for Mass Spectrometry. Org. MassSpectrom. 1982, 17, 173-181.
8. Devienne, F.M. Different Uses of HighEnergy Molecular Beams. Entropie 1967,18, 61-67.
9. Barber, M.; Vickerman, J.C.; Wolsten-holme, J. Secondary Ion Mass Spectra ofSome Simple Organic Molecules. J.Chem. Soc., Faraday Trans. 1 1980, 76,549-559.
10. Benninghoven, A. Ion Formation fromOrganic Solids: Secondary ion-MS of or-ganic compounds. Benninghoven, A., ed.,Springer Series in Chemical Physics 25,64-89, 1983, Springer-Verlag Heidelberg.
11. Barber, M.; Bordoli, R.S.; Sedgwick,R.D.; Tyler, A.N. FAB of Solids as an IonSource in Mass Spectrometry. Nature1981, 293, 270-275.
12. Barber, M.; Bordoli, R.S.; Sedgwick,R.D.; Tyler, A.N. FAB-MS of Cobala-mines. Biomed. Mass Spectrom. 1981, 8,492-495.
13. Surman, D.J.; Vickerman, J.C. FAB Quad-rupole-MS. J. Chem. Soc. , Chem. Com-mun. 1981, 324-325.
14. Barber, M.; Bordoli, R.S.; Sedgwick,R.D.; Tyler, A.N.; Bycroft, B.W. FAB-MSof Bleomycin A2 and B2 and Their MetalComplexes. Biochem. Biophys. Res.Commun. 1981, 101, 632-638.
15. Morris, H.R.; Panico, M.; Barber, M.;Bordoli, R.S.; Sedgwick, R.D.; Tyler,A.N. FAB: a New Mass SpectrometricMethod for Peptide Sequence Analysis.Biochem. Biophys. Res. Commun. 1981,101, 623-631.
16. Barber, M.; Bordoli, R.S.; Elliott, G.J.;Sedgwick, R.D.; Tyler, A.N.; Green, B.N.FAB-MS of Bovine Insulin and OtherLarge Peptides. J. Chem. Soc. , Chem.Commun. 1982, 936-938.
17. Barber, M.; Bordoli, R.S.; Elliott, G.J.;Sedgwick, R.D.; Tyler, A.N. FAB-MS.Anal. Chem. 1982, 54, 645A-657A.
18. Meili, J.; Seibl, J. Matrix Effects in FAB-MS. Int. J. Mass Spectrom. Ion Phys.1983, 46, 367-370.
19. Gower, L.J. Matrix Compounds for FAB-MS. Biomed. Mass Spectrom. 1985, 12,191-196.
20. De Pauw, E.; Agnello, A.; Derwa, F. Liq-uid Matrices for Liquid Secondary Ion-MS-FAB [LSIMS-FAB]: an Update. MassSpectrom. Rev. 1991, 10, 283-301.
21. Aberth, W.; Straub, K.M.; Burlingame,A.L. Secondary Ion-MS With Cesium IonPrimary Beam and Liquid Target Matrixfor Analysis of Bioorganic Compounds.Anal. Chem. 1982, 54, 2029-2034.
22. Sundqvist, B.U.R. Desorption Methods in-MS. Int. J. Mass Spectrom. Ion Proc.1992, 118/119, 265-287.
23. Sunner, J. Ionization in Liquid SecondaryIon-MS (LSIMS). Org. Mass Spectrom.1993, 28, 805-823.
24. Busch, K.L. Desorption Ionization-MS. J.Mass Spectrom. 1995, 30, 233-240.
25. Secondary Ion Mass Spectrometry: BasicConcepts, Instrumental Aspects, Applica-tions; 1st ed.; Benninghoven, A.; Werner,H.W.; Rudenauer, F.G., editors; WileyInterscience: New York, 1986.
26. Wilson, R.G.; Stevie, F.A.; Magee, C.W.Secondary Ion Mass Spectrometry: APractical Handbook for Depth Profilingand Bulk Impurity Analysis; John Wiley &Sons: Chichester, 1989.
27. Becker, S.; Dietze, H.-J. State-of-the-Artin Inorganic Mass Spectrometry for

Reference List 405
Analysis of High-Purity Materials. Int. J.Mass Spectrom. 2003, 228, 127-150.
28. Miller, J.M. FAB-MS of Organometallic,Coordination, and Related Compounds.Mass Spectrom. Rev. 1989, 9, 319-347.
29. Franks, J.; Ghander, A.M. Saddle FieldIon Source of Spherical Configuration forEtching and Thinning Applications. Vac-uum 1974, 24, 489-491.
30. Alexander, A.J.; Hogg, A.M. Characteri-zation of a Saddle-Field Discharge Gunfor FABMS Using Different DischargeVapors. Int. J. Mass Spectrom. Ion Proc.1986, 69, 297-311.
31. Boggess, B.; Cook, K.D. Determination ofFlux From a Saddle Field FAB Gun. J.Am. Soc. Mass Spectrom. 1994, 5, 100-105.
32. Barber, M.; Bordoli, R.S.; Sedgwick,R.D.; Tyler, A.N. FAB of Solids: a NewIon Source for Mass Spectrometry. J.Chem. Soc. , Chem. Commun. 1981, 325-327.
33. McDowell, R.A.; Morris, H.R. FAB-MS:Biological Analysis Using an Ion Gun. Int.J. Mass Spectrom. Ion Phys. 1983, 46,443-446.
34. Morris, H.R.; Panico, M.; Haskins, N.J.Comparison of Ionization Gases in FABMass Spectra. Int. J. Mass Spectrom. IonPhys. 1983, 46, 363-366.
35. Fenselau, C. Ion Formation from OrganicSolids: FAB. Benninghoven, A., ed.,Springer Series in Chemical Physics 25,90-100, 1983, Springer-Verlag Heidel-berg.
36. Stoll, R.; Schade, U.; Röllgen, F.W.; Gi-essmann, U.; Barofsky, D.F. Fast Atomand Ion Bombardment of Organic SamplesUsing Mercury. Int. J. Mass Spectrom. IonPhys. 1982, 43, 227-229.
37. Burlingame, A. L.; Aberth, W. Ion For-mation from Organic Solids: Use of a Ce-sium Primary Beam for Liquid SIMSAnalysis of Bio-Organic Compounds.Benninghoven, A., ed., Springer Series inChemical Physics 25, 167-171, 1983,Springer-Verlag Heidelberg.
38. Burlingame, A.L. Comparison of ThreeGeometries for a Cesium Primary BeamLiquid Secondary Ion-MS Source. Anal.Chem. 1984, 56, 2915-2918.
39. Aberth, W.; Burlingame, A.L. Comparisonof Three Geometries for a Cesium PrimaryBeam Liquid Secondary Ion-MS Source.Anal. Chem. 1984, 56, 2915-2918.
40. Aberth, W.H.; Burlingame, A.L. Effect ofPrimary Beam Energy on the Secondary-Ion Sputtering Efficiency of Liquid Sec-ondary-Ionization-MS in the 5-30-KeVRange. Anal. Chem. 1988, 60, 1426-1428.
41. McEwen, C.N.; Hass, J.R. Negative GoldIon Gun for Liquid Secondary Ion-MS.Anal. Chem. 1985, 57, 890-892.
42. Katakuse, I.; Nakabushi, H.; Ichihara, T.;Sakurai, T.; Matsuo, T.; Matsuda, H. Gen-eration and Detection of Cluster Ions[(CsI) NCs]+ Ranging Up to m/z = 90,000.Int. J. Mass Spectrom. Ion Proc. 1984, 57,239-243.
43. Katakuse, I.; Nakabushi, H.; Ichihara, T.;Sakurai, T.; Matsuo, T.; Matsuda, H. Me-tastable Decay of Cesium Iodide ClusterIons. Int. J. Mass Spectrom. Ion Proc.1984, 62, 17-23.
44. Sim, P.G.; Boyd, R.K. Calibration andMass Measurement in Negative-Ion FAB-MS. Rapid Commun. Mass Spectrom.1991, 5, 538-542.
45. Rapp, U.; Kaufmann, H.; Höhn, M.;Pesch, R. Exact Mass Determinations Un-der FAB Conditions. Int. J. Mass Spec-trom. Ion Phys. 1983, 46, 371-374.
46. Sunner, J. Role of Ion-Ion Recombinationfor Alkali Chloride Cluster Formation inLiquid Secondary Ion-MS. J. Am. Soc.Mass Spectrom. 1993, 4, 410-418.
47. Cao, Y.; Haseltine, J.N.; Busch, K.L.Double Cationization With Alkali Ions inLiquid Secondary Ion-MS. SpectroscopyLett. 1996, 29, 583-589.
48. Todd, P.J. Secondary Ion Emission FromGlycerol Under Continuous and PulsedPrimary Ion Current. Org. Mass Spectrom.1988, 23, 419-424.
49. Schröder, E.; Münster, H.; Budzikiewicz,H. Ionization by FAB - a Chemical Ioni-zation (Matrix) Process Ion the GasPhase? Org. Mass Spectrom. 1986, 21,707-715.
50. Münster, H.; Theobald, F.; Budzikiewicz,H. The Formation of a Matrix Plasma inthe Gas Phase Under FAB Conditions. Int.J. Mass Spectrom. Ion Proc. 1987, 79, 73-79.
51. Rosen, R.T.; Hartmann, T.G.; Rosen, J.D.;Ho, C.-T. Fast-Atom-Bombardment MassSpectra of Low-Molecular-Weight Alco-hols and Other Compounds. Evidence fora Chemical-Ionization Process in the GasPhase. Rapid Commun. Mass Spectrom.1988, 2, 21-23.

406 9 Fast Atom Bombardment
52. Miller, J.M.; Balasanmugam, K. FAB-MSof Some Nonpolar Compounds. Anal.Chem. 1989, 61, 1293-1295.
53. Benninghoven, A. Organic Secondary Ion-MS (SIMS) and Its Relation to FAB(FAB). Int. J. Mass Spectrom. Ion Phys.1983, 46, 459-462.
54. van Breemen, R.B.; Snow, M.; Cotter, R.J.Time-Resolved Laser Desorption-MS. I.Desorption of Preformed Ions. Int. J. MassSpectrom. Ion Phys. 1983, 49, 35-50.
55. Musselman, B.; Watson, J.T.; Chang, C.K.Direct Evidence for Preformed Ions ofPorphyrins in the Solvent Matrix for FAB-MS. Org. Mass Spectrom. 1986, 21, 215-219.
56. Shiea, J.; Sunner, J. The Acid Effect inFAB. Org. Mass Spectrom. 1991, 26, 38-44.
57. Todd, P.J. Solution Chemistry and Secon-dary Ion Emission From Amine-GlycerolSolutions. J. Am. Soc. Mass Spectrom.1991, 2, 33-44.
58. Wong, S.S.; Röllgen, F.W. Sputtering ofLarge Molecular Ions by Low EnergyParticle Impact. Nulc. Instrum. MethodsPhys. Res. ,B 1986, B14, 436-447.
59. Baczynskyi, L. New Matrices for FAB-MS. Adv. Mass Spectrom. 1985, 10, 1611-1612.
60. De Pauw, E.; Agnello, A.; Derwa, F. Liq-uid Matrices for Liquid Secondary Ion-MS. Mass Spectrom. Rev. 1986, 5, 191-212.
61. Meili, J.; Seibl, J. A New Versatile Matrixfor FAB Analysis. Org. Mass Spectrom.1984, 19, 581-582.
62. Barber, M.; Bell, D.; Eckersley, M.; Mor-ris, M.; Tetler, L. The Use of M-Nitrobenzyl Alcohol As a Matrix in FAB-MS. Rapid Commun. Mass Spectrom.1988, 2, 18-21.
63. Aubagnac, J.-L. Use of M-Nitrobenzyl Al-cohol As a Matrix in Fast-Atom-Bombardment Negative-Ion Mass Spec-trometry of Polar Compounds. RapidCommun. Mass Spectrom. 1990, 4, 114-116.
64. Dube, G. The Behavior of Aromatic Hy-drocarbons Under FAB. Org. Mass Spec-trom. 1984, 19, 242-243.
65. Abdul-Sada, A.K.; Greenway, A.M.; Sed-don, K.R. The Extent of Aggregation ofAir-Sensitive Alkyllithium Compounds AsDetermined by Fast-Atom-Bombardment-MS. J. Organomet. Chem. 1989, 375,C17-C19.
66. Abdul-Sada, A.K.; Greenway, A.M.; Sed-don, K.R. The Application of Liquid Par-affin and 3,4-Dimethoxybenzyl AlcoholAs Matrix Compounds to FAB-MS. Eur.Mass Spectrom. 1996, 2, 77-78.
67. Bandini, A.L.; Banditelli, G.; Minghetti,G.; Pelli, B.; Traldi, P. FAB Induced De-composition Pattern of the Gold(III)Bis(Carbene) Complex [[(p-MeC6H4NH)(EtO)C]2AuI2]ClO4, a Retro-synthetic Process? Organometallics 1989,8, 590-593.
68. Dobson, J.C.; Taube, H. CoordinationChemistry and Redox Properties of Poly-pyridyl Complexes of Vanadium(II).Inorg. Chem. 1989, 28, 1310-1315.
69. Leibman, C.P.; Todd, P.J.; Mamantov, G.Enhanced Positive Secondary Ion Emis-sion From Substituted Polynuclear Aro-matic Hydrocarbon/Sulfuric Acid Solu-tions. Org. Mass Spectrom. 1988, 23, 634-642.
70. Staempfli, A.A.; Schlunegger, U.P. A NewMatrix for FAB Analysis of Corrins.Rapid Commun. Mass Spectrom. 1991, 5,30-31.
71. Visentini, J.; Nguyen, P.M.; Bertrand, M.J.The Use of 4-HydroxybenzenesulfonicAcid As a Reduction-Inhibiting Matrix inLiquid Secondary-Ion-MS. Rapid Com-mun. Mass Spectrom. 1991, 5, 586-590.
72. Gower, L.J. Matrix Compounds for FAB:a Further Review. Adv. Mass Spectrom.1985, 10, 1537-1538.
73. Rozenski, J.; Herdewijn, P. The Effect ofAddition of Carbon Powder to Samples inLiquid Secondary Ion-MS: Improved Ioni-zation of Apolar Compounds. RapidCommun. Mass Spectrom. 1995, 9, 1499-1501.
74. Huang, Z.-H.; Shyong, B.-J.; Gage, D.A.;Noon, K.R.; Allison, J. N-AlkylnicotiniumHalides: a Class of Cationic Matrix Addi-tives for Enhancing the Sensitivity inNegative Ion FAB-MS of PolyanionicAnalytes. J. Am. Soc. Mass Spectrom.1994, 5, 935-948.
75. Shiea, J.T.; Sunner, J. Effects of MatrixViscosity on FAB Spectra. Int. J. MassSpectrom. Ion Proc. 1990, 96, 243-265.
76. Field, F.H. FAB Study of Glycerol: MassSpectra and Radiation Chemistry. J. Phys.Chem. 1982, 86, 5115-5123.
77. Caldwell, K.A.; Gross, M.L. Origins andStructures of Background Ions Producedby FAB of Glycerol. J. Am. Soc. MassSpectrom. 1994, 5, 72-91.
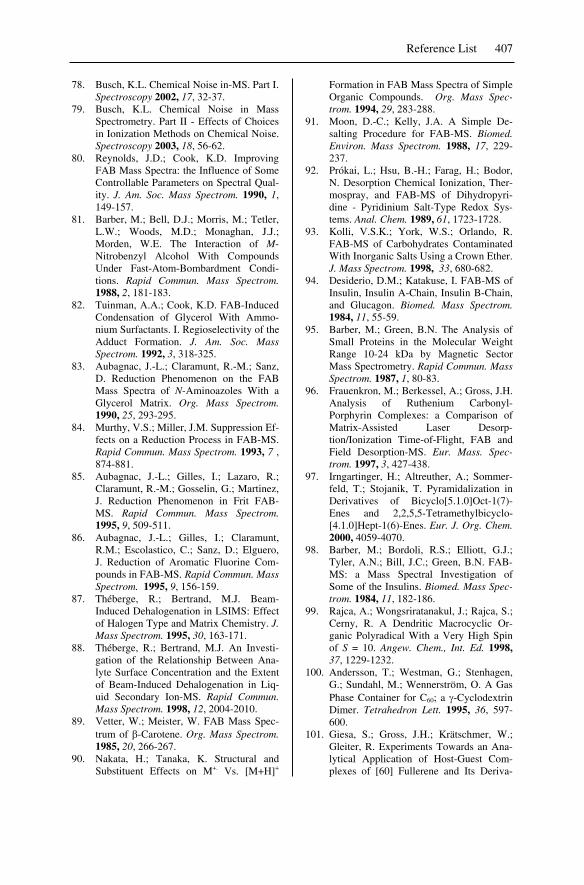
Reference List 407
78. Busch, K.L. Chemical Noise in-MS. Part I.Spectroscopy 2002, 17, 32-37.
79. Busch, K.L. Chemical Noise in MassSpectrometry. Part II - Effects of Choicesin Ionization Methods on Chemical Noise.Spectroscopy 2003, 18, 56-62.
80. Reynolds, J.D.; Cook, K.D. ImprovingFAB Mass Spectra: the Influence of SomeControllable Parameters on Spectral Qual-ity. J. Am. Soc. Mass Spectrom. 1990, 1,149-157.
81. Barber, M.; Bell, D.J.; Morris, M.; Tetler,L.W.; Woods, M.D.; Monaghan, J.J.;Morden, W.E. The Interaction of M-Nitrobenzyl Alcohol With CompoundsUnder Fast-Atom-Bombardment Condi-tions. Rapid Commun. Mass Spectrom.1988, 2, 181-183.
82. Tuinman, A.A.; Cook, K.D. FAB-InducedCondensation of Glycerol With Ammo-nium Surfactants. I. Regioselectivity of theAdduct Formation. J. Am. Soc. MassSpectrom. 1992, 3, 318-325.
83. Aubagnac, J.-L.; Claramunt, R.-M.; Sanz,D. Reduction Phenomenon on the FABMass Spectra of N-Aminoazoles With aGlycerol Matrix. Org. Mass Spectrom.1990, 25, 293-295.
84. Murthy, V.S.; Miller, J.M. Suppression Ef-fects on a Reduction Process in FAB-MS.Rapid Commun. Mass Spectrom. 1993, 7 ,874-881.
85. Aubagnac, J.-L.; Gilles, I.; Lazaro, R.;Claramunt, R.-M.; Gosselin, G.; Martinez,J. Reduction Phenomenon in Frit FAB-MS. Rapid Commun. Mass Spectrom.1995, 9, 509-511.
86. Aubagnac, J.-L.; Gilles, I.; Claramunt,R.M.; Escolastico, C.; Sanz, D.; Elguero,J. Reduction of Aromatic Fluorine Com-pounds in FAB-MS. Rapid Commun. MassSpectrom. 1995, 9, 156-159.
87. Théberge, R.; Bertrand, M.J. Beam-Induced Dehalogenation in LSIMS: Effectof Halogen Type and Matrix Chemistry. J.Mass Spectrom. 1995, 30, 163-171.
88. Théberge, R.; Bertrand, M.J. An Investi-gation of the Relationship Between Ana-lyte Surface Concentration and the Extentof Beam-Induced Dehalogenation in Liq-uid Secondary Ion-MS. Rapid Commun.Mass Spectrom. 1998, 12, 2004-2010.
89. Vetter, W.; Meister, W. FAB Mass Spec-trum of -Carotene. Org. Mass Spectrom.1985, 20, 266-267.
90. Nakata, H.; Tanaka, K. Structural andSubstituent Effects on M+. Vs. [M+H]+
Formation in FAB Mass Spectra of SimpleOrganic Compounds. Org. Mass Spec-trom. 1994, 29, 283-288.
91. Moon, D.-C.; Kelly, J.A. A Simple De-salting Procedure for FAB-MS. Biomed.Environ. Mass Spectrom. 1988, 17, 229-237.
92. Prókai, L.; Hsu, B.-H.; Farag, H.; Bodor,N. Desorption Chemical Ionization, Ther-mospray, and FAB-MS of Dihydropyri-dine - Pyridinium Salt-Type Redox Sys-tems. Anal. Chem. 1989, 61, 1723-1728.
93. Kolli, V.S.K.; York, W.S.; Orlando, R.FAB-MS of Carbohydrates ContaminatedWith Inorganic Salts Using a Crown Ether.J. Mass Spectrom. 1998, 33, 680-682.
94. Desiderio, D.M.; Katakuse, I. FAB-MS ofInsulin, Insulin A-Chain, Insulin B-Chain,and Glucagon. Biomed. Mass Spectrom.1984, 11, 55-59.
95. Barber, M.; Green, B.N. The Analysis ofSmall Proteins in the Molecular WeightRange 10-24 kDa by Magnetic SectorMass Spectrometry. Rapid Commun. MassSpectrom. 1987, 1, 80-83.
96. Frauenkron, M.; Berkessel, A.; Gross, J.H.Analysis of Ruthenium Carbonyl-Porphyrin Complexes: a Comparison ofMatrix-Assisted Laser Desorp-tion/Ionization Time-of-Flight, FAB andField Desorption-MS. Eur. Mass. Spec-trom. 1997, 3, 427-438.
97. Irngartinger, H.; Altreuther, A.; Sommer-feld, T.; Stojanik, T. Pyramidalization inDerivatives of Bicyclo[5.1.0]Oct-1(7)-Enes and 2,2,5,5-Tetramethylbicyclo-[4.1.0]Hept-1(6)-Enes. Eur. J. Org. Chem.2000, 4059-4070.
98. Barber, M.; Bordoli, R.S.; Elliott, G.J.;Tyler, A.N.; Bill, J.C.; Green, B.N. FAB-MS: a Mass Spectral Investigation ofSome of the Insulins. Biomed. Mass Spec-trom. 1984, 11, 182-186.
99. Rajca, A.; Wongsriratanakul, J.; Rajca, S.;Cerny, R. A Dendritic Macrocyclic Or-ganic Polyradical With a Very High Spinof S = 10. Angew. Chem., Int. Ed. 1998,37, 1229-1232.
100. Andersson, T.; Westman, G.; Stenhagen,G.; Sundahl, M.; Wennerström, O. A GasPhase Container for C60; a -CyclodextrinDimer. Tetrahedron Lett. 1995, 36, 597-600.
101. Giesa, S.; Gross, J.H.; Krätschmer, W.;Gleiter, R. Experiments Towards an Ana-lytical Application of Host-Guest Com-plexes of [60] Fullerene and Its Deriva-

408 9 Fast Atom Bombardment
tives. Eur. Mass. Spectrom. 1998, 4, 189-196.
102. Juo, C.-G.; Shiu, L.-L.; Shen, C.K.F.; Luh,T.-J.; Her, G.-R. Analysis of C60 Deriva-tives by FAB-MS As -Cyclodextrin In-clusion Complexes. Rapid Commun. MassSpectrom. 1995, 9, 604-608.
103. Vincenti, M. Host-Guest Chemistry in theMass Spectrometer. J. Mass Spectrom.1995, 30, 925-939.
104. Morgan, R.P.; Reed, M.L. FAB AccurateMass Measurement. Org. Mass Spectrom.1982, 17, 537.
105. Münster, H.; Budzikiewicz, H.; Schröder,E. A Modified Target for FAB Measure-ments. Org. Mass Spectrom. 1987, 22,384-385.
106. Gross, J.H.; Giesa, S.; Krätschmer, W.Negative-Ion Low-Temperature FAB-MSof Monomeric and Dimeric [60]FullereneCompounds. Rapid Commun. Mass Spec-trom. 1999, 13, 815-820.
107. Caprioli, R.M.; Fan, T.; Cottrell, J.S. AContinuous-Flow Sample Probe for FAB-MS. Anal. Chem. 1986, 58, 2949-2954.
108. Caprioli, R.M.; Fan, T. High SensitivityMass Spectrometric Determination ofPeptides: Direct Analysis of Aqueous So-lutions. Biochem. Biophys. Res. Commun.1986, 141, 1058-1065.
109. Ito, Y.; Takeuchi, T.; Ishii, D.; Goto, M.Direct Coupling of Micro High-Performance Liquid ChromatographyWith FAB-MS. J. Chromatogr. 1985,346, 161-166.
110. Takeuchi, T.; Watanabe, S.; Kondo, N.;Ishii, D.; Goto, M. Improvement of theInterface for Coupling of FAB-MS andMicro High-Performance Liquid Chro-matography. J. Chromatogr. 1988, 435,482-488.
111. Siethoff, C.; Nigge, W.; Linscheid, M.W.The Determination of Ifosfamide in Hu-man Blood Serum Using LC/MS. Fresen-ius J. Anal. Chem. 1995, 352, 801-805.
112. Suter, M.J.F.; Caprioli, R.M. An IntegralProbe for Capillary Zone Electrophore-sis/Continuous-Flow FAB-MS. J. Am.Soc. Mass Spectrom. 1992, 3, 198-206.
113. Caprioli, R.M. Continuous-Flow FAB-MS. Anal. Chem. 1990, 62, 477A-485A.
114. Continuous-Flow FAB Mass Spectrome-try; Caprioli, R.M., editor; John Wiley &Sons: Chichester, 1990.
115. Caprioli, R.M.; Suter, M.J.F. Continuous-Flow FAB: Recent Advances and Appli-
cations. Int. J. Mass Spectrom. Ion Proc.1992, 118/119 , 449-476.
116. Caprioli, R.M.; Moore, W.T.; Fan, T. Im-proved Detection of Suppressed Peptidesin Enzymic Digests Analyzed by FAB-MS. Rapid Commun. Mass Spectrom.1987, 1, 15-18.
117. Falick, A.M.; Walls, F.C.; Laine, R.A.Cooled Sample Introduction Probe forLiquid Secondary Ionization-MS. Anal.Biochem. 1986, 159, 132-137.
118. Jonkman, H.T.; Michl, J. Secondary Ion-MS of Small-Molecule Solids at Cryo-genic Temperatures. 1. Nitrogen and Car-bon Monoxide. J. Am. Chem. Soc. 1981,103, 733-737.
119. Orth, R.G.; Jonkman, H.T.; Michl, J. Sec-ondary Ion-MS of Small-Molecule Solidsat Cryogenic Temperatures. 2. Rare GasSolids. J. Am. Chem. Soc. 1981, 103,6026-6030.
120. Katz, R.N.; Chaudhary, T.; Field, F.H.Particle Bombardment (FAB) Mass Spec-tra of Methanol at Sub-Ambient Tem-peratures. J. Am. Chem. Soc. 1986, 107,3897-3903.
121. Katz, R.N.; Chaudhary, T.; Field, F.H.Particle Bombardment (keV) Mass Spectraof Ethylene Glycol, Glycerol, and Water atSub-Ambient Temperatures. Int. J. MassSpectrom. Ion Proc. 1987, 78, 85-97.
122. Johnstone, R.A.W.; Wilby, A.H. FAB atLow Temperatures. Part 2. Polymerizationin the Matrix. Int. J. Mass Spectrom. IonProc. 1989, 89, 249-264.
123. Kosevich, M.V.; Czira, G.; Boryak, O.A.;Shelkovsky, V.S.; Vékey, K. Comparisonof Positive and Negative Ion Clusters ofMethanol and Ethanol Observed by LowTemperature Secondary Ion-MS. RapidCommun. Mass Spectrom. 1997, 11, 1411-1416.
124. Kosevich, M.V.; Czira, G.; Boryak, O.A.;Shelkovsky, V.S.; Vékey, K. TemperatureDependences of Ion Currents of AlcoholClusters Under Low-Temperature Secon-dary Ion Mass Spectrometric Conditions.J. Mass Spectrom. 1998, 33, 843-849.
125. Magnera, T.F.; David, D.E.; Stulik, D.;Orth, R.G.; Jonkman, H.T.; Michl, J. Pro-duction of Hydrated Metal Ions by FastIon or Atom Beam Sputtering. Collision-Induced Dissociation and Successive Hy-dration Energies of Gaseous Cu+ With 1-4Water Molecules. J. Am. Chem. Soc. 1989,111 , 5036-5043.

Reference List 409
126. Boryak, O.A.; Stepanov, I.O.; Kosevich,M.V.; Shelkovsky, V.S.; Orlov, V.V.;Blagoy, Y.P. Origin of Clusters. I. Corre-lation of Low Temperature FAB MassSpectra With the Phase Diagram of NaCl-Water Solutions. Eur. Mass Spectrom.1996, 2, 329-339.
127. Kosevich, M.V.; Boryak, O.A.; Stepanov,I.O.; Shelkovsky, V.S. Origin of Clusters.II. Distinction of Two Different Processesof Formation of Mixed Metal/WaterClusters Under Low-Temperature FAB.Eur. Mass Spectrom. 1997, 3, 11-17.
128. Boryak, O.A.; Kosevich, M.V.; Shelkov-sky, V.S.; Blagoy, Y.P. Study of FrozenSolutions of Nucleic Acid Nitrogen Basesby Means of Low Temperature Fast-Atom-Bombardment-MS. Rapid Commun.Mass Spectrom. 1996, 10, 197-199.
129. Huang, M.-W.; Chei, H.-L.; Huang, J.P.;Shiea, J. Application of Organic SolventsAs Matrixes to Detect Air-Sensitive andLess Polar Compounds Using Low-Temperature Secondary Ion-MS. Anal.Chem. 1999, 71, 2901-2907.
130. Hofmann, P.; Volland, M.A.O.; Hansen,S.M.; Eisenträger, F.; Gross, J.H.; Stengel,K. Isolation and Characterization of aMonomeric, Solvent Coordinated Ruthe-nium(II) Carbene Cation Relevant to Ole-fin Metathesis. J. Organomet. Chem.2000, 606, 88-92.
131. Wang, C.H.; Huang, M.-W.; Lee, C.-Y.;Chei, H.-L.; Huang, J.P.; Shiea, J. Detec-tion of a Thermally Unstable Intermediatein the Wittig Reaction Using Low-Temperature Liquid Secondary Ion andAtmospheric Pressure Ionization-MS. J.Am. Soc. Mass Spectrom. 1998, 9, 1168-1174.
132. Giesa, S.; Gross, J.H.; Hull, W.E.; Lebed-kin, S.; Gromov, A.; Krätschmer, W.;Gleiter, R. C120OS: the First Sulfur-Containing Dimeric [60]Fullerene Deriva-tive. Chem. Commun. 1999, 465-466.
133. Gross, J.H. Use of Protic and Aprotic Sol-vents of High Volatility As Matrixes inAnalytical Low-Temperature FAB-MS.Rapid Commun. Mass Spectrom. 1998, 12,1833-1838.
134. König, W.A.; Aydin, M.; Schulze, U.;Rapp, U.; Höhn, M.; Pesch, R.; Kalik-hevitch, V.N. Fast-Atom-Bombardmentfor Peptide Sequencing - a ComparisonWith Conventional Ionization Techniques.Int. J. Mass Spectrom. Ion Phys. 1983, 46,403-406.
135. Caprioli, R.M. Enzymes and Mass Spec-trometry: a Dynamic Combination. MassSpectrom. Rev. 1987, 6, 237-287.
136. Caprioli, R.M. Analysis of BiochemicalReactions With Molecular SpecificityUsing FAB-MS. Biochemistry 1988, 27,513-521.
137. Chait, B.T.; Wang, R.; Beavis, R.C.; Kent,S.B. Protein Ladder Sequencing. Science1993, 262, 89-92.
138. Lehmann, W.D. Massenspektrometrie inder Biochemie; Spektrum AkademischerVerlag: Heidelberg, 1996.
139. Mass Spectrometry of Proteins and Pep-tides; Chapman, J.R., editor; HumanaPress: Totowa, 2000.
140. Snyder, A.P. Interpreting Protein MassSpectra; 1st ed.; Oxford University Press:New York, 2000.
141. Kinter, M.; Sherman, N.E. Protein Se-quencing and Identification Using TandemMass Spectrometry; John Wiley & Sons:Chichester, 2000.
142. Naylor, S.; Findeis, A.F.; Gibson, B.W.;Williams, D.H. An Approach Towards theComplete FAB Analysis of Enzymic Di-gests of Peptides and Proteins. J. Am.Chem. Soc. 1985, 108, 6359-6363.
143. Deterding, L.J.; Tomer, K.B.; Wellemans,J.M.Y.; Cerny, R.L.; Gross, M.L. Capil-lary Electrophoresis/Tandem Mass Spec-trometry With Array Detection. Eur. MassSpectrom. 1999, 5, 33-40.
144. Bordaz-Nagy, J.; Despeyroux, D.;Jennings, K.R.; Gaskell, S.J. ExperimentalAspects of the Collision-Induced Decom-position of Ions in a Four-Sector TandemMass Spectrometer. Org. Mass Spectrom.1992, 27, 406-415.
145. Stults, J.T.; Lai, J.; McCune, S.; Wetzel,R. Simplification of High-Energy Colli-sion Spectra of Peptides by Amino-Terminal Derivatization. Anal. Chem.1993, 65, 1703-1708.
146. Biemann, K.; Papyannopoulos, I.A.Amino Acid Sequencing of Proteins. Acc.Chem. Res. 1994, 27, 370-378.
147. Papyannopoulos, I.A. The Interpretation ofCollision-Induced Dissociation TandemMass Spectra of Peptides. Mass Spectrom.Rev. 1995, 14, 49-73.
148. Mahoney, J.F.; Perel, J.; Ruatta, S.A.;Martino, P.A.; Husain, S.; Lee, T.D. Mas-sive Cluster Impact Mass Spectrometry: aNew Desorption Method for the Analysisof Large Biomolecules. Rapid Commun.Mass Spectrom. 1991, 5, 441-445.

410 9 Fast Atom Bombardment
149. Cornett, D.S.; Lee, T.D.; Mahoney, J.F.Matrix-Free Desorption of BiomoleculesUsing Massive Cluster Impact. RapidCommun. Mass Spectrom. 1994, 8, 996-1000.
150. Mahoney, J.F.; Perel, J.; Lee, T.D.; Mar-tino, P.A.; Williams, P. Shock WaveModel for Sputtering Biomolecules UsingMassive Cluster Impact. J. Am. Soc. MassSpectrom. 1992, 3, 311-317.
151. Mahoney, J.F.; Cornett, D.S.; Lee, T.D.Formation of Multiply Charged Ions FromLarge Molecules Using Massive-ClusterImpact. Rapid Commun. Mass Spectrom.1994, 8, 403-406.
152. Karlsson, N.G.; Karlsson, H.; Hansson,G.C. Sulfated Mucin OligosaccharidesFrom Porcine Small Intestine Analyzed byFour-Sector Tandem Mass Spectrometry.J. Mass Spectrom. 1996, 31, 560-572.
153. Caprioli, R.M.; Beckner, C.F.; Smith, L.A.Performance of a FAB Source on a Quad-rupole Mass Spectrometer. Biomed. MassSpectrom. 1983, 10, 94-97.
154. Sundqvist, B.; Macfarlane, R.D. Califor-nium-252-Plasma Desorption-MS. MassSpectrom. Rev. 1985, 4, 421-460.
155. Macfarlane, R.D. Californium-252-PlasmaDesorption-MS I - a Historical Perspec-tive. Biol. Mass Spectrom. 1993, 22, 677-680.
156. Macfarlane, R.D.; Hu, Z.-H.; Song, S.;Pittenauer, E.; Schmid, E.R.; Allmaier, G.;Metzger, J.O.; Tuszynski, W. 252Cf-PlasmaDesorption-MS II - a Perspective of NewDirections. Biol. Mass Spectrom. 1994, 23,117-130.
157. Håkansson, P.; Kamensky, I.; Sundqvist,B.; Fohlman, J.; Peterson, P.; McNeal,C.J.; Macfarlane, R.D. Iodine-127-PlasmaDesorption-MS of Insulin. J. Am. Chem.Soc. 1982, 104, 2948-2949.
158. Macfarlane, R.D. Mass Spectrometry ofBiomolecules: From PDMS to MALDI.Brazilian J. Phys. 1999, 29, 415-421.
159. Sundqvist, B.; Håkansson, P.; Kamensky,I.; Kjellberg, J. Ion Formation from Or-ganic Solids: Fast heavy ion induced de-sorption of molecular ions from smallproteins. Benninghoven, A., ed., SpringerSeries in Chemical Physics 25, 52-57,1983, Springer-Verlag Heidelberg.
160. Macfarlane, R.D. 252Californium PlasmaDesorption-MS. Biomed. Mass Spectrom.1981, 8, 449-453.
161. Wien, K.; Becker, O. Ion Formation fromOrganic Solids: Secondary ion emissionfrom metals under fission fragment bom-bardment. Benninghoven, A., ed., SpringerSeries in Chemical Physics 25, 47-51,1983, Springer-Verlag Heidelberg.
162. Zubarev, R.A.; Abeywarna, U.K.;Demirev, P.; Eriksson, J.; Papaléo, R.;Håkansson, P.; Sundqvist, B.U.R. De-layed, Gas-Phase Ion Formation in PlasmaDesorption-MS. Rapid Commun. MassSpectrom. 1997, 11, 963-972.
163. Jonsson, G.P.; Hedin, A.B.; Håkansson,P.; Sundqvist, B.U.R.; Säve, B.G.S.; Niel-sen, P.; Roepstorff, P.; Johansson, K.-E.;Kamensky, I.; Lindberg, M.S.L. PlasmaDesorption-MS of Peptides and ProteinsAdsorbed on Nitrocellulose. Anal. Chem.1986, 58, 1084-1087.
164. Wolf, B.; Macfarlane, R.D. Small Mole-cules As Substrates for Adsorp-tion/Desorption in Californium-252Plasma Desorption-MS. J. Am. Soc. MassSpectrom. 1990, 2, 29-32.
165. Song, S.; Macfarlane, R.D. PDMS-Chemistry of Angiotensin II and Insulin inGlucose Glass Thin Films. Anal. Bioanal.Chem. 2002, 373, 647-655.
10 Matrix-Assisted Laser Desorption/Ionization
The technique of laser desorption/ionization (LDI) was introduced in the late1960s, [1-3] i.e., before the advent of field desorption (FD, Chap. 8), californiumplasma desorption (252Cf-PD, Chap. 9.6) or fast atom bombardment (FAB,Chap. 9). While low-mass organic salts and laser light-absorbing organic mole-cules are easily accessible by LDI, [2,3] it takes some effort to obtain useful spec-tra of biomolecules, [4] in particular when the mass of the analytes approachessome 103 u. [5,6] Until the ending 1980s, FAB and 252Cf-PD were by far more ef-fective than LDI in generating good mass spectra from biological samples. [7]
The introduction of light-absorbing compounds that are admixed to the samplepreparations for laser desorption mass spectrometry effected a change. Two ap-proaches were developed: i) the admixture of ultrafine cobalt power (particle sizeabout 30 nm) to analyte solutions in glycerol, [8,9] and ii) the co-crystallization ofthe analyte with an organic matrix. [10-13] When combined with a time-of-flight(TOF, Chap. 4.2) mass analyzer, both methods are capable of producing massspectra of proteins of about 100,000 u molecular weight. Nonetheless, the appli-cation of the “ultrafine-metal-plus-liquid-matrix” method remained an exceptionbecause the versatility of an organic matrix and the sensitivity of matrix-assistedlaser desorption/ionization (MALDI) [10,11,14] made it by far superior to theadmixture of cobalt powder (Fig. 10.1). [15-18] In its present status, MALDI rep-resents a major analytical tool in modern biochemistry [19-21] and polymer sci-ence. [22,23]
10.1 Ion Sources for LDI and MALDI
Both LDI and MALDI make use of the absorption of laser light by a solid samplelayer. The energy uptake upon laser irradiation then causes evaporation and ioni-zation of the sample. Wavelengths ranging from ultraviolet (UV) to infrared (IR)have been employed, e.g., nitrogen lasers (337 nm), excimer lasers (193, 248, 308and 351 nm), Q-switched, frequency-tripled and quadrupled Nd:Yag lasers (355and 266 nm, respectively), [24] Er:Yag lasers (2.94 µm) [24,25] and TEA-CO2 la-sers (10.6 µm). [16,26]
The general setup of LDI/MALDI ion sources is comparatively simple(Fig. 10.2). [27] The pulse of laser light is focused onto a small spot which is typi-cally 0.05–0.2 mm in diameter. [28] As laser irradiance is a critical parameter inMALDI, a variable beam attenuator in the laser optical path is employed to adjust

412 10 Matrix-Assisted Laser Desorption/Ionization
Fig. 10.1. MALDI-TOF mass spectra of (a) porcine cytochrome C from 2,5-dihydroxy-benzoic acid matrix at 337 nm and (b) a monoclonal antibody from nicotinic acid matrix at266 nm. Reproduced from Ref. [15] by permission. © John Wiley & Sons, 1991.
the irradiance, e.g., by means of a rotating UV filter of variable transmittance fromclose to 100 % down to about 1 %. Then, the laser attenuation is individually op-timized for each measurement. LDI/MALDI ion sources are generally operated atambient temperature.
UV lasers are emitting pulses of 3–10 ns duration, while those of IR lasers arein the range of 6–200 ns. Short pulses are needed to effect sudden ablation of thesample layer. In addition, an extremely short time interval of ion generation basi-cally avoids thermal degradation of the analyte. On the other hand, longer irradia-tion would simply cause heating of the bulk material. In case of IR-MALDI, aslight decrease in threshold fluence has been observed for shorter laser pulses.[29] Furthermore, a short time interval of ion generation means a better definitionof the starting pulse for the TOF measurement. However, since the introduction ofdelayed extraction, i.e., of a time delay between laser pulse and the onset of ionacceleration (Chap. 4.2.5), the latter disadvantage of IR lasers has been largelydiminished. [29]
Fig. 10.2. Schematic of a laser desorption ion source for non-resonance light absorption bya solid. Reproduced from Ref. [27] by permission. © Elsevier Science, 1994.
Note: The vast majority of MALDI instruments use UV nitrogen lasers(337 nm, 3 ns). IR-MALDI has been restricted to applications where its deeperpenetration offers advantages, e.g., for the direct desorption of analytes fromsodium dodecyl sulfate (SDS) gels or thin layer chromatographic (TLC) plates.

10.2 Ion Formation 413
10.2 Ion Formation
The mechanisms of ion formation in MALDI are a subject of continuing research.[30-34] The major concerns are the relationship between ion yield and laser flu-ence, [28,35] the temporal evolution of the desorption process and its implicationsupon ion formation, [36] the initial velocity of the desorbing ions, [29,37,38] andthe question whether preformed ions or ions generated in the gas phase providethe major source of the ionic species detected in MALDI. [39,40]
10.2.1 Ion Yield and Laser Fluence
Below a threshold of laser irradiance at about 106 W cm–2 no ion production isobserved. At threshold, a sharp onset of desorption/ionization occurs and ionabundances rise to a high power (5th to 9th) of laser irradiance. [16,35,41] Thethreshold laser fluence for the detection of matrix and analyte ions not only de-pends on the actual matrix, but also on the molar matrix-to-analyte ratio. A mini-mum of the threshold fluence for cytochrome C was found at a ratio of 4000 : 1.Significantly higher or lower ratios require almost double laser fluence (Fig. 10.3).[42] The increase at low analyte concentrations can be attributed to a decreasingdetection efficiency because a larger volume of material has to be ablated in orderto generate a sufficient number of analyte ions for detection. At high analyte con-centrations, the energy absorption per volume is reduced as the matrix becomesdiluted with analyte molecules causing a higher threshold fluence. The total parti-cle yield from laser desorption as a function of laser fluence has been determinedby collecting the desorbed neutrals on a quartz crystal microbalance. [43] Thestudy by Quist et al. indicates that the desorption of neutrals occurs by thermalevaporation [28] starting at laser fluences of about 11 mJ cm–2. However, the ion-to-neutral ratio of the MALDI process was determined to be less than 10–5. [43]
Fig. 10.3. Threshold fluence for positive ions of ( ) cytochrome c and ( ) sinapinic acidas function of the molar matrix-to-protein ratio. Reproduced from Ref. [42] by permission.© John Wiley & Sons, 1994.

414 10 Matrix-Assisted Laser Desorption/Ionization
Note: The fluence is defined as energy per unit area; in MALDI typical flu-ences are in the range of 10–100 mJ cm–2. The irradiance is fluence divided bythe laser pulse duration; in MALDI the irradiances are in the range of 106–107 W cm–2. [33]
10.2.2 Effect of Laser Irradiation on the Surface
Best MALDI spectra in terms of resolution and low to absent ion fragmentationare obtained slightly above threshold for analyte ion formation. [16,41] An evenlydistributed shallow ablation of material from the upper layers of the sample isachieved if a comparatively homogeneous laser fluence is irradiated onto the tar-get. [28,35,44] Laser spot sizes of 100–200 µm as realized by 100–200 mm focallength of the lenses commonly employed are ideal. [45] Numerous single-shotspectra are then obtained from one spot. Such a laser spot size is also advanta-geous because a number of micrometer-sized crystrals are illuminated simultane-ously thereby averaging out the effects of mutual orientation of crystal surfacesand laser beam axis. [44,46,47] On the other hand, an extremely sharp laser spotcauses the eruption of material from a small area upon formation of a deep crater(Fig. 10.4). The MALDI spectra of cytochrome C (Mr = 12,360 u) demonstrate thesuperior quality of spectra obtained using an optimized spot size. [48]
Fig. 10.4. Effect of focused and defocused laser beam. (a) SEM micrographs of DHB sin-gle crystals after exposure to 10 laser shots (337 nm) under focused (right column) and de-focused (left column) irradiation with corresponding sum spectra of horse heart cytochromeC (Mr = 12,360 u); black and white bars correspond to 10 µm. (b) Resulting MALDI spec-tra. Reproduced from Ref. [48] by permission. © Elsevier Science, 1991.

10.2 Ion Formation 415
Note: MALDI spectra are acquired just above the threshold laser fluence forion formation. Thus, single-shot spectra normally show a low signal-to-noiseratio (Chap. 5.2.3) due to poor ion statistics. Therefore, 50–200 single-shotspectra are usually accumulated to produce the final spectrum. [47]
10.2.3 Temporal Evolution of a Laser Desorption Plume
The desorption of ions and neutrals into the vacuum upon irradiation of a laserpulse onto a surface proceeds as a jet-like supersonic expansion: [38] a small, butinitially hot and very rapidly expanding plume is generated. [49] As the expansionis adiabatic, the process is accompanied by fast cooling of the plume. [38]
Although the initial velocity of the desorbed ions is difficult to measure, re-ported values generally are in the range of 400–1200 m s–1. The initial velocity isalmost independent of the ionic mass but dependent on the matrix. [33,36-38,46,50,51] On the other hand, the initial ion velocity is not independent of thecompound class, i.e., peptides show a behavior different from oligosaccharides.[51]
The essential independence of mean ion velocities on the molecular weight ofthe analyte leads to an approximate linear increase of the mean initial kinetic en-ergies of the analyte ions with mass. High-mass ions therefore carry tens of elec-tronvolts of translational energy before ion acceleration. [33,41,50] The initialvelocity of the ions is superimposed onto that obtained from ion acceleration,thereby causing considerable losses in resolution with continuous extraction TOFanalyzers, in particular when operated in the linear mode.
Fig. 10.5. Temporal evolution of a laser desorption plume generated by a 100 ns Er:Yag(2.94 µm) laser pulse from neat glycerol. [53] By courtesy of F. Hillenkamp and A. Leisner,University of Münster.

416 10 Matrix-Assisted Laser Desorption/Ionization
Example: Laser flash light photographs of the temporal evolution of a laser de-sorption plume are highly illustrative. [52,53] The plume shown in Fig. 10.5 wasgenerated from neat glycerol by an Er:Yag (2.94 µm) laser pulse of 100 ns pulsewidth. Pulses of a frequency-doubled ND:YAG laser (532 nm, 15 ns duration)served as the flash light source for obtaining the photographs by the dark field il-lumination technique.
10.2.4 Ion Formation in MALDI
The locations and processes of ion formation in MALDI seem to be numerous,i.e., no single process applies. [40] The promoting effect of decreasing pH of ma-trix-analyte solutions upon peptide ion yield indicates that the desorption of pre-formed [M+H]+ ions plays a role. Similar observations are made for quasi-molecular ions generated by cation attachment, e.g., [M+alkali]+ ions in case ofoxygen-rich analytes. However, gas phase processes cannot be excluded, becausethose species may also be generated in the initially formed plasma plume a fewhundred micrometers above the sample surface. [54,55] A recent study reveals agradual increase of the initial ion velocities with increasing mass for neutral oligo-saccharides and synthetic polymers to the high level characteristic for peptides andproteins which is also obtained for a small oligosaccharide by introduction of acharged functional group via derivatization. This indicates that typical MALDIanalytes need incorporation into the matrix crystal to be detected, whereas gasphase cationization is viable for small neutral analytes. [38] When non-carboxylicacid matrices are being used to protonate slightly basic analyte molecules such aspeptides, proton transfer reactions of excited states of the matrix molecules havealso to be taken into account. [55,56] In case of UV light-absorbing analytes, di-rect photoionization can also occur. The frequently observed positive and negativeradical ions, M+• [57,58] and M–•, [59-61] can only be generated by removal orcapture of an electron. Thus, M+• and M–• ions point towards the occurrence ofphotoionization, [57] charge exchange, and electron capture in the gas phase.[57,62] Which of the above processes contributes most to ion formation dependson the actual combination of matrix, analyte, and eventually present additives orcontaminations.
10.3 MALDI Matrices
10.3.1 Role of the Solid Matrix
The role of the matrix in MALDI is analogous to that in FAB (Chap. 9.3.1). Dif-ferent from FAB, MALDI matrices are generally crystalline solids of low vaporpressure in order not to be volatalized in the ion source vacuum. While basicallyany liquid can serve as a FAB matrix, the matrix in MALDI has to absorb light ofthe wavelength which is intended to be used for the experiment. [63] In UV-

10.3 MALDI Matrices 417
MALDI, the molecules must possess a suitable chromophore because energy ab-sorption is based on the strong absorption, and thus the resulting electronic excita-tion of the matrices. Therefore, the structure of UV-MALDI matrices is based onsome aromatic core suitably functionalized to achieve the desired properties.
In case of IR-MALDI, fewer restrictions apply because wavelengths around3 µm are effectively absorbed by O–H and N–H stretch vibrations, while wave-lengths around 10 µm cause excitation of C–O stretch and O–H bending vibra-tions. [29,32] Therefore, malonic acid, succinic acid, malic acid, urea, and glyc-erol serve well as matrices in IR-MALDI. [25,26] A matrix can serve asprotonating or deprotonating agent or as electron-donating or -accepting agent.
10.3.2 Matrices in UV-MALDI
Nicotinic acid (NA) was the first organic compound that was successfully em-ployed as a matrix in UV-MALDI of peptides and proteins. [12-14] Ever since,better matrices have been sought, the following now being widespread in use: pi-colinic acid (PA), [64] 3-hydroxypicolinic acid (HPA), [65] and 3-aminopicolinicacid (3-APA) [66] for oligonucleotides and DNA; [67] 2,5-dihydroxybenzoic acid(DHB, gentisic acid) [16,48] and combined matrices having DHB as the maincomponent [68-71], e.g., “super-DHB”, [72] for oligosaccharides; -cyano-4-hydroxycinnamic acid ( -CHC, -CHCA, 4-HCCA, CCA,) for peptides, smallerproteins, [73], triacylglycerols, [74] and numerous other compounds; [75,76] 3,5-dimethoxy-4-hydroxycinnamic acid (SA, sinapinic acid) for proteins; [77] 2-(4-hydroxyphenylazo)benzoic acid (HABA) for peptides, proteins, glycoproteins,[63] and polystyrene; [78] 2-mercaptobenzothiazole (MBT) and 5-chloro-2-mercaptobenzothiazole (CMBT) for peptides, proteins, and synthetic polymers;[79] 2,6-dihydroxyacetophenone (DHAP) for glycopeptides, phosphopeptides, andproteins; [80,81] 2,4,6-trihydroxyacetophenone (THAP) for solid-supported oli-gonucleotides; [82] 1,8,9-anthracenetriol (dithranol) for synthetic polymers;[83,84] and 9-nitroanthracene (9-NA), [61,85,86] benzo[a]pyrene, [60] and 2-[(2E)-3-(4-tert-butylphenyl)-2-methylprop-2-enylidene]malonitrile (DCTB) [87] forfullerenes and their derivatives. Even [60]fullerene [88] and porphyrins [89] havebeen used as matrix. Liquid matrices have been used either due to the specific ad-vantages of a certain matrix or to employ the self-refreshing surface for achievinglong-lasting signals in MALDI-magnetic sector experiments. [90,91]
For a first approach to a new analytical problem, it is recommended to try amatrix from this collection; those highlighted by a frame represent the most fre-quently used matrices. In general, highly polar analytes work better with highlypolar matrices, and nonpolar analytes are preferably combined with nonpolar ma-trices. In unfortunate cases, only one specific analyte-matrix combination mightyield useful MALDI spectra.

418 10 Matrix-Assisted Laser Desorption/Ionization
2-(4-hydroxyphenylazo)-benzoic acid
dithranol
OH O OH
N
COOH
N N
COOH
OH
COOH
OH
HO
nicotinic acid
2,5-dihydroxy-benzoic acid
COOH
MeO
OH
OMe
sinapinic acid
OHHO
OH
O
2,4,6-trihydroxy-acetophenone
benzo[a]pyrene
-cyano-4-hydroxy-cinnamic acid
OH
COOH
CN
9-nitroanthracene
NO2
S
NSH
N COOH N COOH
OH
picolinic acid 3-hydroxypicolinic acid
2-mercaptobenzothiazole
CN
CNtBu
2-[(2 E)-3-(4-tert-butyphenyl)-2-methylprop-2-enylidene]-malonitrile
3-aminopicolinic acid
N COOH
NH2
5-chloro-2-mercapto-benzothiazole
S
NSH
Cl
2,6-dihydroxy-acetophenone
OHHO
O
Scheme 10.1.
Note: It is commonplace to use acronyms rather than compound names formatrices. However, these are not always consistently used, e.g., -CHC, 4-HCCA, CHCA, and CCA all refer to -cyano-4-hydroxycinnamic acid. Othersmay be easily confused, e.g., nicotinic acid (NA) and 9-nitroanthracene (9-NA).
10.3.3 Characteristics of MALDI Matrix Spectra
MALDI matrix spectra are characterized by strong molecular and/or quasi-molecular ion signals accompanied by series of matrix (Ma) cluster ions and somemore abundant fragment ions. [32] In positive-ion MALDI, [Man+H]+ cluster ionspredominate, while [Man–H]– cluster ions are preferably formed in negative-ionMALDI. The principal ion series may be accompanied by [Man+alkali]+ ions andsome fragments of minor intensity, e.g., [Man+H–H2O]+. In particular with aproticmatrices, radical ions may predominate. In addition, a “continuous” background is

10.4 Sample Preparation 419
formed by clustering of radiolytic decomposition products of the matrix. In gen-eral, the spectrum of the neat matrix, i.e., its LDI spectrum, strongly depends onthe actual laser fluence and on the presence of impurities. Thus, the “correct” LDIspectrum of the matrix compound largely differs from what is obtained under con-ditions applied to form analyte ions from that matrix.
10.4 Sample Preparation
10.4.1 Standard Sample Preparation
The standard method of sample preparation in LDI and MALDI involves deposi-tion and subsequent evaporation of 0.5–2 µl of solution on the surface of a stain-less-steel sample holder or MALDI target, as it is often termed. Therefore, theanalyte should be soluble to at least about 0.1 mg ml–1 in some solvent. If a matrixis used, the matrix is dissolved to yield either a saturated solution or a concentra-tion of about 10 mg ml–1. The solution of the analyte is then admixed to that of thematrix. For optimized MALDI spectra, the molar matrix-to-analyte ratio is nor-mally adjusted not higher than 500 : 1 and above 5000 : 1, i.e., 1 µl of analyte so-lution are added to 5–50 µl of matrix solution. [15,16,48] In this range, a goodsignal-to-noise ratio and a low degree of ion fragmentation are preserved. At veryhigh sample concentrations the “matrix effect” is dimished and the spectra start re-sembling LDI spectra. Too low sample concentrations require additional laser ir-radiance for sufficient analyte ion production. [42] However, given a properpreparation, even a molar matrix-to-analyte ratio of 108 : 1 will produce useful re-sults – conditions that lead to a sample load of 1 fmol. A sufficient miscibility ofanalyte and matrix is also required. [83]
The crystallization process is a critical parameter in LDI and MALDI samplepreparation. [48,92,93] Slow evaporation, e.g., from aqueous solutions, yieldscomparatively large crystals, which in turn are detrimental for good shot-to-shotreproducibility and mass accuracy. Evenly distributed thin layers of microcrystal-lites are therefore preferred. [92,94] The formation of such layers can be achievedby i) using volatile solvent(s) such as acetone, ii) by eventually enforcing evapo-ration by gentle heating of the target or by a softly blowing hair dryer, and finallyiii) by using polished targets. Thus, the so-called thin layer technique almostrevolutionized MALDI sample preparation. [95,96]
Example: The choice of a matrix and optimized conditions of sample prepara-tion have substantial influence on the appearance of MALDI spectra. Even whenemploying standard matrices such as CHCA or DHB, significant improvementscan be achieved, e.g., by appropriate mixing of the two substances (Fig. 10.6).[71]
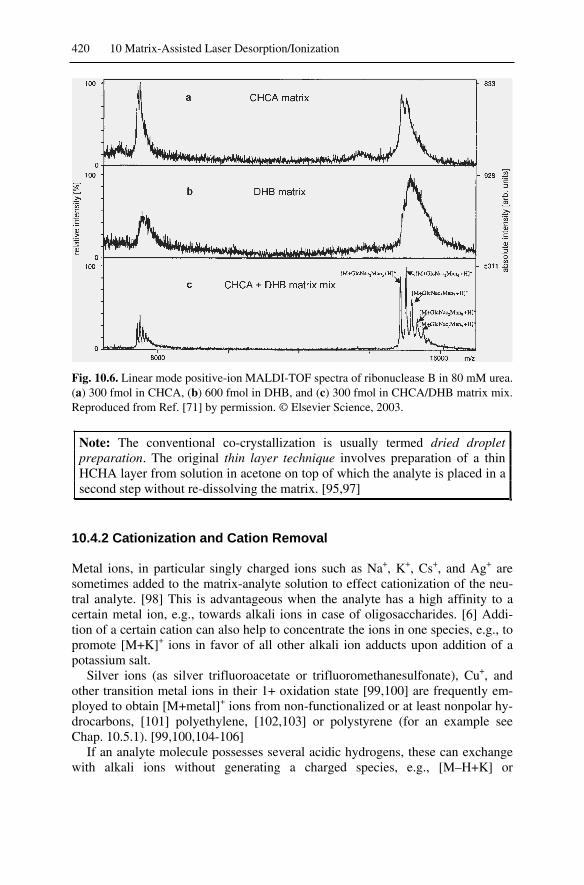
420 10 Matrix-Assisted Laser Desorption/Ionization
Fig. 10.6. Linear mode positive-ion MALDI-TOF spectra of ribonuclease B in 80 mM urea.(a) 300 fmol in CHCA, (b) 600 fmol in DHB, and (c) 300 fmol in CHCA/DHB matrix mix.Reproduced from Ref. [71] by permission. © Elsevier Science, 2003.
Note: The conventional co-crystallization is usually termed dried dropletpreparation. The original thin layer technique involves preparation of a thinHCHA layer from solution in acetone on top of which the analyte is placed in asecond step without re-dissolving the matrix. [95,97]
10.4.2 Cationization and Cation Removal
Metal ions, in particular singly charged ions such as Na+, K+, Cs+, and Ag+ aresometimes added to the matrix-analyte solution to effect cationization of the neu-tral analyte. [98] This is advantageous when the analyte has a high affinity to acertain metal ion, e.g., towards alkali ions in case of oligosaccharides. [6] Addi-tion of a certain cation can also help to concentrate the ions in one species, e.g., topromote [M+K]+ ions in favor of all other alkali ion adducts upon addition of apotassium salt.
Silver ions (as silver trifluoroacetate or trifluoromethanesulfonate), Cu+, andother transition metal ions in their 1+ oxidation state [99,100] are frequently em-ployed to obtain [M+metal]+ ions from non-functionalized or at least nonpolar hy-drocarbons, [101] polyethylene, [102,103] or polystyrene (for an example seeChap. 10.5.1). [99,100,104-106]
If an analyte molecule possesses several acidic hydrogens, these can exchangewith alkali ions without generating a charged species, e.g., [M–H+K] or

10.4 Sample Preparation 421
[M–2H+2Na]. As a result, a single analyte will form numerous ionic speciesthereby significantly decreasing the abundance of each species involved, e.g.,[M–2H+Na]–, [M–2H+K]–, [M–3H+Na+K]– etc. Thus, hydrogen-metal exchangemay even result in complete suppression of a signal. In such a case, cation ex-change resins should be added to substitute alkali ions for ammonium (Fig. 10.7).[24] There is an analogous necessity to remove sodium dodecyl sulfate contami-nations before subjecting samples to MALDI-MS. [107]
Fig. 10.7. Negative-ion MALDI spectra of the oligonucleotide pd[T]8; (a) 5 pmol, (b) sameas (a) after addition of 5–10 cation exchange beads to the sample preparation. Adaptedfrom Ref. [24] by permission. © John Wiley & Sons, 1992.
10.4.3 Solvent-Free Sample Preparation
If an analyte is definitely insoluble or only soluble in solvents that are not accept-able for the standard MALDI sample preparation technique, it can alternatively beground together with the solid matrix, preferably in a vibrating ball mill. The re-sulting fine powder is then spread onto the target. To avoid contamination, non-adherent material should be gently blown away from the target before insertioninto the ion source. [103,108,109]
Example: The organic dye pigment red 144, has been subjected to mass analy-sis by LDI, solvent-based MALDI, and solvent-free MALDI. [109] Its monoiso-topic molecular ion, [C40H23Cl5O4N6]
+•, is expected at m/z 826.0. Due to the stronglight absorption of the pigment, the uptake of energy in LDI causes quantitativefragmentation to yield solely [M–OH]+ ions. Here, solvent-based MALDI resultsin a poor sample preparation because of the unfavorable solvents needed. In thiscase, solvent-free sample preparation yields the best spectrum exhibiting mainlyM+• and [M+Na]+ ions of the pigment (Fig. 10.8).

422 10 Matrix-Assisted Laser Desorption/Ionization
Fig. 10.8. Comparison of spectra of the organic dye pigment red 144 as obtained by(a) LDI, (b) solvent-based and (c) solvent-free MALDI sample preparation. Adapted fromRef. [109] by permission. © John Wiley & Sons, 2001.
10.4.4 Sample Introduction
Sample introduction has undergone a dramatic change in MALDI. In the first ex-periments, single samples were supplied on MALDI probes designed similar toFAB probes (Chap. 9.1.3). Soon, multi-sample probes came into use. Early com-mercial products provided approximately twenty spots on one target which wasrotated, shifted or preferably moved freely in x- and y-directions to bring any spoton its surface at the point of laser focus. Driven by the needs of combinatorialchemistry, 96-spot targets were developed to allow for the transfer of samplesfrom a complete standard well plate (Fig. 10.9). More recently, 384-spot and even1536-spot targets have become available. To take full advantage of such targets itis necessary to combine robotic sample preparation with automated measurementof the MALDI spectra.
The spot size of MALDI preparations and thus the amount of sample necessaryto yield a useful layer can be further reduced by so-called anchor targets (BrukerDaltonik). Anchor targets exhibit small hydrophilic spots on a hydrophobic sur-face. As a result, the evaporating drop of matrix-analyte solution is “anchored” tosuch a point where it shrinks until the onset of crystallization exactly within thishydrophilic area. [110] The resulting preparation covers an about 100fold smallersurface than obtained from a freely spreading drop. In addition to improved detec-tion limits, this technique simplifies automated spot finding due to their preciselydefined location on the target.

10.4 Applications of LDI 423
Fig. 10.9. MALDI targets: (a) Bruker Scout26 target with some sample preparations usingdifferent matrices and (b) Micromass target suitable for 96 samples as delivered from stan-dard well plates. (b) By courtesy of Waters Corporation, MS Technologies, Manchester.
10.4.5 Additional Methods of Sample Supply
Surface-adsorbed analytes can be examined by laser desorption techniques if theyare supplied on a metal foil, a TLC plate, [111] or at least on semiconducting ma-terial. Even the foil itself can be accessible to LDI. This requires the foil to befixed on top of a sample target, e.g., by means of (conducting) double-sided adhe-sive tape or some general-purpose adhesive. Care has to be taken not to producesharp edges protruding from the surface because these might cause discharges inthe ion source when the accelerating voltage is switched on. Furthermore, themass calibration can be affected by such an unusually thick “sample layer”.
Note: Normally, commercial MALDI instruments tolerate such a sample sup-ply; however, great care is recommended when performing this sort of experi-ments in order not to loose the sample inside the ion source or to damage theinstrument's electronics from electric discharges.
10.4 Applications of LDI
Although examples of LDI of peptides [5] and oligosaccharides [4,6] are known,LDI is much better suited for the analysis of organic and inorganic salts, [112-114]molecules with large conjugated -electron systems, [115-117] organic dyes ascontained in ball point inks, [118], porphyrins, [119] or UV light-absorbing syn-thetic polymers. [5,49] As interferences with matrix ions are excluded, LDI pres-ents a useful alternative to MALDI in the low-mass range. In addition, solvent-

424 10 Matrix-Assisted Laser Desorption/Ionization
free sample preparation can be employed with insoluble analytes. However, LDIis a “harder” method than MALDI and fragmentation has to be taken into account.
Example: Polycyclic aromatic hydrocarbons (PAHs) are easily detected byLDI. The positive-ion LDI-TOF mass spectrum of 1,2,3,4,5,6-hexahydro-phenanthro[1,10,9,8-opqra]perylene exclusively exhibits the molecular ion atm/z 356 (Fig. 10.10; for the EI spectrum cf. Chap. 5.1). [117]
Fig. 10.10. Positive-ion LDI-TOF mass spectrum of 1,2,3,4,5,6-hexahydrophenanthro-[1,10,9,8-opqra]perylene. The inset shows an expanded view of the molecular ion signal.Adapted from Ref. [117] with permission. © Elsevier Science, 2002.
Example: Fullerene soots as obtained by the Huffman-Krätschmer synthesis offullerenes can be characterized by positive- as well as negative-ion LDI. [115] TheLDI-TOF spectrum of such a sample exhibits fullerene molecular ion signals wellbeyond m/z 3000; among these, C60
+• and C70+• are clearly preferred (Fig. 10.11).
Furthermore, such samples provide experimental carbon-only isotopic patternsover a wide mass range (Chap. 3.2.1).
Fig. 10.11. Positive-ion LDI-TOF spectrum of a fullerene soot. The insets show expandedviews of the isotopic patterns of C60
+• and C120+•. By courtesy of W. Krätschmer, Max
Planck Institute for Nuclear Physics, Heidelberg.

10.5 Applications of MALDI 425
10.5 Applications of MALDI
10.5.1 MALDI-MS of Synthetic Polymers
MALDI is the method of choice for the analysis of synthetic polymers because itusually provides solely intact and singly charged [62] quasimolecular ions over anessentially unlimited mass range. [22,23] While polar polymers such aspoly(methylmethacrylate) (PMMA), [83,120] polyethylene glycol (PEG),[120,121] and others [79,122,123] readily form [M+H]+ or [M+alkali]+ ions, non-polar polymers like polystyrene (PS) [99,100,105,106] or non-functionalizedpolymers like polyethylene (PE) [102,103] can only be cationized by transitionmetal ions in their 1+ oxidation state. [99,100] The formation of evenly spacedoligomer ion series can also be employed to establish an internal mass calibrationof a spectrum. [122]
The most important parameters that can be determined by MALDI are number-average molecular weight (Mn), weight-average molecular weight (Mw), and themolecular weight distribution expressed as polydispersity (PD): [106,124]
i
iin I
IMM
(10.1)
ii
i2
iw IM
IMM (10.2)
n
w
MMPD (10.3)
where Mi and Ii represent the molecular weights of the oligomeric componentsand their signal intensities (assuming a linear relationship between number of ionsand signal intensity) of the detected species. The formula for Mn is identical to thatused for the calculation of the molecular weight from isotopic masses and theirabundances as represented by an isotopic pattern (Eq. 3.1 in Chap. 3.1.4).
Fig. 10.12. MALDI-TOF spectra of polystyrene 12500 doped with Ag+ ions. Adapted fromRef. [106] by permission. © John Wiley & Sons, 2001.

426 10 Matrix-Assisted Laser Desorption/Ionization
Example: Polystyrenes ranging from PS 2200 to PS 12500 form [M+metal]+
ions with Ag+ and Cu+ ions when silver or copper(I) salts are admixed to the sam-ple preparation. In case of PS 12500, both metal ions were found to effect cationi-zation equally well, i.e., without causing differences in average molecular weightor ionic abundances (Fig. 10.12). [106]
In addition, the determination of a polymer's endgroup(s) [125,126] and theanalysis of random and block-copolymers [127,128] can be achieved by MALDI.However, care has to be taken when judging the MALDI spectra because of themass-dependent desorption and detection characteristics of the experiment. In caseof higher polydispersity (PD > 1.1) high-mass ions are underestimated fromMALDI spectra. [93,124] The current practice to deal with such samples is tofractionate them by gel permeation chromatography (GPC) [123] or size-exclusion chromatography (SEC) prior to MALDI analysis. [124,129]
Example: Extracted and synthesized oligo(ethylene terephthalate)s were com-pared by MALDI-MS. [126] Using the symbols G for ethylene glycol units, GGfor diethylene glycol units, and T for terephthalic acid units, the detected oligo-mers were i) cyclic oligomers [GT]n, ii) linear chains H-[GT]n-G, and iii) someother distributions such as linear H-[GH]n-OH and H-[GGT]1-[GT]n-1-G oligomersand cyclic H-[GGT]1-[GT]n-1 oligomers. Type i) was mainly contained in technicalyarns and tiles, whereas types ii) and iii) were constituents of the model oligomers(Fig. 10.13).
Fig. 10.13. MALDI-TOF spectrum of the model oligo(ethylene terephthalate diol)s. The in-set shows an expanded view of the low-intensity peaks in the circle (m/z 940–1120).Adapted from Ref. [126] by permission. © John Wiley & Sons, 1995.

10.5 Applications of MALDI 427
10.5.2 Fingerprints by MALDI-MS
The proteins or carbohydrates contained in material of biological origin can sup-ply a characteristic fingerprint of a species. Protein and carbohydrate fingerprintscan be readily obtained by means of MALDI-MS, the degree of preceding purifi-cation steps depending on the actual type of sample. The composition of the pro-teins or a certain fraction of these as isolated by some well-defined precipitationprocedure can be used to identify bacteria, [130] to reveal whether a Mozzarellacheese was obtained from water buffalo or bovine milk, [131] or whether bovinemilk has been fraudulently added in the production of marketed ewe cheese. [132]MALDI-MS of carbohydrates from fungal spores [133] allows for the characteri-zation of the corresponding fungus.
Example: MALDI spectra of protein extracts from Bacillus species can be usedto distinguish pathogenic and non-pathogenic bacteria. The protein fingerprintobtained from chemically lysed B. anthracis (Sterne), B. thuringiensis (4A1),B. cereus (6E1), and B. subtilis (3A1) are clearly different (Fig. 10.14). [130]Even the strains (mentioned in parenthesis) can be assigned to some degree due tothe presence of specific biomarker proteins.
Fig. 10.14. MALDI spectra of protein extracts from Bacillus species (matrix -CHCA).(a) B. anthracis (Sterne), (b) B. thuringiensis (4A1), (c) B. cereus (6E1), (d) B. sub-tilis (3A1). Reproduced from Ref. [130] by permission. © John Wiley & Sons, 1996.
10.5.3 Carbohydrates by MALDI-MS
Starting from simple mono- and disaccharides to oligo- and polysaccharides, car-bohydrates play an important role in organisms and nutrition. MALDI-MS, typi-cally using DHB or some DHB-containing matrix, [16,68-70,72] presents a pow-erful tool for their characterization. [134] Applications include the characterizationof maltose chains in “gummy bears”, [68] fructans in onions, [135] high-molecular-weight oligosaccharides in human milk, [69,70] and others. [98,136]

428 10 Matrix-Assisted Laser Desorption/Ionization
Example: The maltose chains in the confectionery “gummy bears” extend upto about 30 maltose units. [68] The signals of the ion series originating from[M+Na]+ ions of the saccharide are spaced 162 u distant, i.e., by C6H10O5 unitsapart from each other.
Fig. 10.15. Positive-ion MALDI spectrum of the maltose chains in “gummy bears”. Repro-duced from Ref. [68] by permission. © John Wiley & Sons, 1995.
10.5.4 Structure Elucidation of Carbohydrates by MALDI
Analogous to peptide sequencing (Chap. 9.4.7), tandem mass spectrometric meth-ods (Chaps. 2.12, 4.2.7, 4.3.6, and 4.4.5) can be employed to elucidate the struc-ture of linear as well as complex branched oligosaccharides. [134,137] If the car-bohydrate ions are generated by MALDI, sufficient energy for their fragmentationcan be provided in two ways: i) Higher laser irradiance can effect in-source decay(ISD) or metastable dissociation (2.7.1); [105] the latter being termed post-sourcedecay (PSD) in the MALDI-TOF community. ii) Collision-induced dissociation(CID) of selected precursor ions can be employed alternatively. (Of course, othercompound classes such as peptides, oligonucleotides or synthetic polymers can betreated analogously.) The general scheme of carbohydrate fragmentation is asfollows (from Ref. [134] by permission, © Elsevier Science, 2003):
Scheme 10.2.

10.5 Applications of MALDI 429
Example: The PSD-MALDI-TOF spectrum of the [M+Na]+ ion, m/z 1418.9, ofhigh-mannose N-linked glycan (Man)6(GlcNAc)2 from chicken ovalbumin re-corded from DHB shows distinct cleavages of the branched carbohydrate skeleton(Fig. 10.16). [134]
Fig. 10.16. PSD-MALDI-TOF spectrum of N-linked glycan (Man)6(GlcNAc)2 fromchicken ovalbumin. Reproduced from Ref. [134] by permission. © Elsevier Science, 2003.
Note: Carbohydrates possess a high affinity towards alkali metal ions, and thusin MALDI spectra [M+Na]+ and/or [M+K]+ are normally observed instead of orin addition to [M+H]+ ions of very low abundance. Radical ions are not ob-served. It basically depends on the relative amount of alkali ion impurities ordopant which quasimolecular ion will be dominant.
10.5.5 Oligonucleotides in MALDI
Oligonucleotides and DNA represent the highest polarity class of biopolymers.Therefore, it is of special importance that isolation in an organic matrix allows toovercome their strong intermolecular interaction. MALDI analysis of oligonu-cleotides is further complicated by the numerous acidic hydrogens present in asingle molecule. In particular the phosphate groups easily exchange protons withthe ubiqitous alkali ions (Chap. 10.4.2). [24] Thus, MALDI of this compoundclass requires to follow proven experimental protocols to obtain clean spectra ofintact quasimolecular ions. The acidity of the phosphates makes oligonucleotidesand DNA easier accessible as [M–H]– ions in the negative ion mode.[24,67,82,138,139]
Due to their numerous acidic hydrogens, oligonucleotides require desaltingprior to MALDI analysis, e.g. by using cation exchange resins (Chap. 10.4.2). [24]

430 10 Matrix-Assisted Laser Desorption/Ionization
Similar procedures are necessary when other ionization methods are applied tothis compound class.
Example: The negative- and positive-ion mode MALDI-TOF spectra of thesolid-supported 5-mer oligodeoxynucleotide po-CNE 5'-GACTT-3' are compared.[82] Both exhibit fragment ions due to cleavages of the phosphotriester backbone(Fig. 10.17). As oligonucleotides normally do not exhibit such a distinct level ofISD in MALDI spectra, it has been argued that the linking to the solid supportplays a role for the generation of this mass ladder of peaks differing from one an-other by a nucleotide residue.
Fig. 10.17. Comparison of the negative- and positive-ion mode MALDI-TOF spectra of the5-mer po-CNE 5'-GACTT-3' oligodeoxynucleotide. Both show fragment ions by ISD.Adapted from Ref. [82] by permission. © John Wiley & Sons, 2000.
10.6 Desorption/Ionization on Silicon
In desorption/ionization on silicon (DIOS), the analyte is absorbed by a micro-meters-thick porous surface layer on a silicon chip, i.e., the porous silicon is usedas substitute of an organic matrix. [140] Porous silicon surfaces possessing high

10.7 Atmospheric Pressure MALDI 431
absorptivity in the UV can be generated with varying properties from flat crystal-line silicon by using a galvanostatic etching procedure. [141] Stabilization of thefreshly prepared surfaces is achieved by hydrosilylation. Porous silicon surfacescan be reused repeatedly after washing. Arrays of 100–1000 sample positions canbe realized on a 3 3 cm silicon chip. [141] The DIOS technique offers picomoledetection limits for peptides, simple sample preparation, and the absence of matrixpeaks in the spectra. [142]
10.7 Atmospheric Pressure MALDI
In atmospheric pressure MALDI (AP-MALDI) the MALDI process takes placeunder atmospheric pressure in dry nitrogen gas. The desorbed ions are then trans-ferred into the vacuum of the mass analyzer by means of an atmospheric pressureionization (API) interface which is typically provided by an electrospray ioniza-tion (ESI, Chap. 11) source. AP-MALDI has first been presented in combinationwith an orthogonal acceleration TOF (oaTOF, Chap. 4.2.6) analyzer where theoriginal ESI ion source was modified to accommodate a simple MALDI targetplus laser instead of the ESI spray capillary. [143] AP-MALDI has also beenadapted to a quadrupole ion trap (QIT, Chap. 4.5) [144] where an improved designwas realized by extending the heated transfer capillary of a Finnigan LCQ ion trapinstrument. Thus, a multi-sample target on an xy-movable target holder and obser-
Fig. 10.18. AP-MALDI ion source with extended transfer capillary. Insets: (a) the targetholder can be equipped with a 64-spot MALDI target or (b) a 10 10-spot DIOS chip.Adapted from Ref. [142] by permission. © John Wiley & Sons, 2002.

432 10 Matrix-Assisted Laser Desorption/Ionization
vation optics could be incorporated on the atmospheric pressure side (Fig. 10.18).[145] The entrance of the capillary extender is held at 1.5–3 kV to attract the ionsfrom the target surface located about 2 mm distant. By modifying the target, AP-DIOS can also be realized on such an AP-MALDI source. [142]
Compared to vacuum MALDI, AP-MALDI has a larger tolerance to laser flu-ence variations and exhibits reduced fragmentation due to the collisional coolingof the expanding plume. As a result of this cooling process, clustering betweenmatrix and analyte ions is more pronounced. Declustering can be achieved by em-ploying higher laser fluences or adapting the parameters of the atmospheric pres-sure interface. [146]
10.8 General Characteristics of MALDI
10.8.1 Sample Consumption and Detection Limit
In MALDI, the minimum sample load or the detection limit is usually specifiedinstead of sensitivity (Chap. 5.2.4). Sample loads of 50–500 fmol of a protein forone sample preparation have been communicated earlier [13,14] and 1 fmol cannormally be achieved. As thousands of single-shot spectra can be obtained fromone preparation spread over some squaremillimeters, the sample consumption hasbeen estimated to approximate 10–17 mol per laser shot, i.e., normally more than99 % of the sample could theoretically be recovered from the target. In between,improved ion extraction and detection as well as miniaturized sample preparation,e.g., by means of the anchor target technology, can provide attomole detectionlimits for peptides.
Note: In MALDI-MS, the combination of the actual analyte and the procedureof sample preparation represent the true limiting factors for sample consump-tion and detection limit.
10.8.2 Analytes for MALDI
For standard MALDI sample preparation, the analyte should be soluble to about0.1 mg ml–1 in some solvent. If an analyte is completely insoluble, solvent-freesample preparation may alternatively be applied (Chap. 10.4.3). The analyte maybe neutral or ionic. Solutions containing metal salts, e.g., from buffers or excess ofnon-complexated metals, may cause a confusingly large number of signals due tomultiple proton/metal exchange and adduct ion formation; even complete suppres-sion of the analyte can occur. The mass range of MALDI is theoretically almostunlimited; in practice, limits can be as low as 3000 u, e.g., with polyethylene, or ashigh as 300,000 u in case of antibodies.

10.8 General Characteristics of MALDI 433
10.8.3 Types of Ions in LDI and MALDI-MS
Very similar to FAB/LSIMS, LDI and MALDI produce a variety of ions depend-ing on the polarity of the analyte, its ionization energy, the characteristics of thematrix (if any) and on the presence or absence of impurities such as alkali metalions. [19,32,33] The tendency to form radical ions is somewhat lower than in caseof FAB/LSIMS (Table 10.1).
Table 10.1. Ions formed by LDI and MALDI
Analytes Positive Ions Negative Ions
non-polar M+• M–•
mediumpolarity
M+• and/or [M+H]+, [M+alkali]+,{clusters [2M]+• and/or [2M+H]+,[2M+alkali]+,adducts [M+Ma+H]+, [M+Ma+alkali]+}b
M–• and/or [M–H]–,{clusters [2M]–• and/or [2M–H]–
adducts [M+Ma]–•, [M+Ma–H]–}
polar [M+H]+, [M+alkali]+,exchange [M–Hn+alkalin+1]
+
high-mass anal. [M+2H]2+, [M+2alkali]2+
{clusters [nM+H]+, [nM+alkali]+,adducts [M+Ma+H]+, [M+Ma+alkali]+}
[M–H]–,exchange [M–Hn+alkalin–1]
–
{clusters [nM–H]–
adducts [M+Ma–H]–}
ionica C+, [Cn+An–1]+, {[CA]+•} A–, [Cn–1+An]
–, {[CA]–•}a Comprising of cation C+ and anion A–.b Enclosure in parentheses denotes rarely observed species.
10.8.4 Mass Analyzers for MALDI-MS
Laser desorption intrinsically is a pulsed ionization process, which is thereforeideally combined with time-of-flight (TOF) analyzers (Chap. 4.2). [16,49] Eversince the first MALDI experiments, MALDI and TOF have been forming a unit,and the majority of MALDI applications are MALDI-TOF measurements. Viceversa, it was the success of MALDI that pushed forth the tremendous delevopmentof TOF mass analyzers. More recently, MALDI has also been adapted to orthogo-nal acceleration TOF analyzers. [147]
The limited resolution and mass accuracy of the early MALDI-TOF instru-ments made the combination of MALDI with magnetic sector instruments(Chap. 4.3) desirable, [148,149] but this set-up suffered from low shot-to-shot re-producibility and poor sensitivity; getting a full scan spectrum required thousandsof laser shots while scanning the magnet. Even though eutectic matrix mixtureswere introduced to circumvent such problems, [90,91] the MALDI-magnetic sec-tor combination never became established.
Fourier transform ion cyclotron resonance (FT-ICR, Chap. 4.6) is much bettersuited for laser desorption. [5,6] Best results are obtained when the ions are gener-
434 10 Matrix-Assisted Laser Desorption/Ionization
ated in an external ion source and subsequently transferred into the ICR cell formass analysis. [150] MALDI-FT-ICR has become a mature combination.[151,152] Modern MALDI-FT-ICR instruments make use of collisional cooling ofthe plasma plume before transferring the ions into the ICR cell. [153,154]
Reference List
1. Fenner, N.C.; Daly, N.R. Laser Used forMass Analysis. Rev. Sci. Instrum. 1966,37, 1068-1070.
2. Vastola, F.J.; Pirone, A.J. Ionization ofOrganic Solids by Laser Irradiation. Adv.Mass Spectrom. 1968, 4, 107-111.
3. Vastola, F.J.; Mumma, R.O.; Pirone, A.J.Analysis of Organic Salts by Laser Ioni-zation. Org. Mass Spectrom. 1970, 3, 101-104.
4. Posthumus, M.A.; Kistemaker, P.G.; Meu-zelaar, H.L.C.; Ten Noever de Brauw,M.C. Laser Desorption-Mass Spectrome-try of Polar Nonvolatile Bio-OrganicMolecules. Anal. Chem. 1978, 50, 985-991.
5. Wilkins, C.L.; Weil, D.A.; Yang, C.L.C.;Ijames, C.F. High Mass Analysis by LD-FTMS. Anal. Chem. 1985, 57, 520-524.
6. Coates, M.L.; Wilkins, C.L. LD-FT-MS ofMalto-Oligosaccharides. Biomed. MassSpectrom. 1985, 12, 424-428.
7. Macfarlane, R.D. Mass Spectrometry ofBiomolecules: From PDMS to MALDI.Brazilian J. Phys. 1999, 29, 415-421.
8. Tanaka, K.; Waki, H.; Ido, Y.; Akita, S.;Yoshida, Y.; Yhoshida, T. Protein andPolymer Analyses Up to M/z 100,000 byLaser Ionization-TOF-MS. Rapid Com-mun. Mass Spectrom. 1988, 2, 151-153.
9. Tanaka, K. The Origin of MacromoleculeIonization by Laser Irradiation (NobelLecture). Angew. Chem., Int. Ed. 2003, 42,3861-3870.
10. Karas, M.; Bachmann, D.; Hillenkamp, F.Influence of the Wavelength in High-Irradiance Ultraviolet Laser Desorption-MS of Organic Molecules. Anal. Chem.1985, 57, 2935-2939.
11. Karas, M.; Bachmann, D.; Bahr, U.; Hil-lenkamp, F. Matrix-Assisted UltravioletLaser Desorption of Non-Volatile Com-pounds. Int. J. Mass Spectrom. Ion Proc.1987, 78, 53-68.
12. Karas, M.; Hillenkamp, F. Laser Desorp-tion Ionization of Proteins With Molecular
Masses Exceeding 10,000 Daltons. Anal.Chem. 1988, 60, 2299-2301.
13. Karas, M.; Bahr, U.; Ingendoh, A.; Hil-lenkamp, F. Laser-Desorption-MS of100,000-250,000-Dalton Proteins. Angew.Chem. 1989, 101, 805-806.
14. Karas, M.; Ingendoh, A.; Bahr, U.; Hil-lenkamp, F. Ultraviolet-Laser Desorp-tion/Ionization-MS of FemtomolarAmounts of Large Proteins. Biomed. Envi-ron. Mass Spectrom. 1989, 18, 841-843.
15. Karas, M.; Bahr, U.; Gießmann, U.MALDI-MS. Mass Spectrom. Rev. 1991,10, 335-357.
16. Hillenkamp, F.; Karas, M.; Beavis, R.C.;Chait, B.T. MALDI-MS of Biopolymers.Anal. Chem. 1991, 63, 1193A-1203A.
17. Beavis, R.C. Matrix-Assisted UltravioletLaser Desorption: Evolution and Princi-ples. Org. Mass Spectrom. 1992, 27, 653-659.
18. Hillenkamp, F.; Karas, M. Matrix-AssistedLaser Desorption/Ionisation, an Experi-ence. Int. J. Mass Spectrom. 2000, 200,71-77.
19. Lehmann, W.D. Massenspektrometrie inder Biochemie; Spektrum AkademischerVerlag: Heidelberg, 1996.
20. Cotter, R.J. Time-of-Flight Mass Spec-trometry: Instrumentation and Applica-tions in Biological Research; AmericanChemical Society: Washington, DC, 1997.
21. Siuzdak, G. The Expanding Role of MassSpectrometry in Biotechnology; MCCPress: San Diego, 2003.
22. Mass Spectrometry of Polymers; 1st ed.;Montaudo, G.; Lattimer, R.P., editors;CRC Press: Boca Raton, 2001.
23. Murgasova, R.; Hercules, D.M. MALDI ofSynthetic Polymers - an Update. Int. J.Mass Spectrom. 2003, 226, 151-162.
24. Nordhoff, E.; Ingendoh, A.; Cramer, R.;Overberg, A.; Stahl, B.; Karas, M.; Hil-lenkamp, F.; Crain, P.F. MALDI-MS ofNucleic Acids With Wavelengths in theUltraviolet and Infrared. Rapid Commun.Mass Spectrom. 1992, 6, 771-776.

Reference List 435
25. Overberg, A.; Karas, M.; Bahr, U.; Kauf-mann, R.; Hillenkamp, F. Matrix-AssistedInfrared-Laser (2.94 m) Desorp-tion/Ionization-MS of Large Biomolecu-les. Rapid Commun. Mass Spectrom. 1990,4, 293-296.
26. Overberg, A.; Karas, M.; Hillenkamp, F.Matrix-Assisted Laser Desorption ofLarge Biomolecules With a TEA-CO2-Laser. Rapid Commun. Mass Spectrom.1991, 5, 128-131.
27. Mamyrin, B.A. Laser Assisted Reflectron-TOF-MS. Int. J. Mass Spectrom. Ion Proc.1994, 131, 1-19.
28. Dreisewerd, K.; Schürenberg, M.; Karas,M.; Hillenkamp, F. Influence of the LaserIntensity and Spot Size on the Desorptionof Molecules and Ions in MALDI With aUniform Beam Profile. Int. J. Mass Spec-trom. Ion Proc. 1995, 141, 127-148.
29. Berkenkamp, S.; Menzel, C.; Hillenkamp,F.; Dreisewerd, K. Measurements of MeanInitial Velocities of Analyte and MatrixIons in Infrared MALDI-MS. J. Am. Soc.Mass Spectrom. 2002, 13, 209-220.
30. Zenobi, R.; Knochenmuss, R. Ion Forma-tion in MALDI-MS. Mass Spectrom. Rev.1999, 17, 337-366.
31. Menzel, C.; Dreisewerd, K.; Berkenkamp,S.; Hillenkamp, F. Mechanisms of EnergyDeposition in Infrared MALDI-MS. Int. J.Mass Spectrom. 2001, 207, 73-96.
32. Dreisewerd, K.; Berkenkamp, S.; Leisner,A.; Rohlfing, A.; Menzel, C. Fundamen-tals of MALDI-MS With Pulsed InfraredLasers. Int. J. Mass Spectrom. 2003, 226,189-209.
33. Dreisewerd, K. The Desorption Process inMALDI. Chem. Rev. 2003, 103, 395-425.
34. Karas, M.; Krüger, R. Ion Formation inMALDI: The Cluster Ionization Mecha-nism. Chem. Rev. 2003, 103, 427-439.
35. Westmacott, G.; Ens, W.; Hillenkamp, F.;Dreisewerd, K.; Schürenberg, M. The In-fluence of Laser Fluence on Ion Yield inMALDI-MS. Int. J. Mass Spectrom. 2002,221, 67-81.
36. Menzel, C.; Dreisewerd, K.; Berkenkamp,S.; Hillenkamp, F. The Role of the LaserPulse Duration in Infrared MALDI-MS. J.Am. Soc. Mass Spectrom. 2002, 13, 975-984.
37. Juhasz, P.; Vestal, M.L.; Martin, S.A. Onthe Initial Velocity of Ions Generated byMALDI and Its Effect on the Calibrationof Delayed Extraction-TOF Mass Spectra.
J. Am. Soc. Mass Spectrom. 1997, 8, 209-217.
38. Karas, M.; Bahr, U.; Fournier, I.; Glück-mann, M.; Pfenninger, A. The Initial IonVelocity As a Marker for Different De-sorption-Ionization Mechanisms inMALDI. Int. J. Mass Spectrom. 2003,226, 239-248.
39. Horneffer, V.; Dreisewerd, K.; Ludemann,H.-C.; Hillenkamp, F.; Lage, M.; Strupat,K. Is the Incorporation of Analytes intoMatrix Crystals a Prerequisite for MALDI-MS? A Study of Five Positional Isomersof Dihydroxybenzoic Acid. Int. J. MassSpectrom. 1999, 185/186/187, 859-870.
40. Glückmann, M.; Pfenninger, A.; Krüger,R.; Thierolf, M.; Karas, M.; Horneffer, V.;Hillenkamp, F.; Strupat, K. Mechanisms inMALDI Analysis: Surface Interaction orIncorporation of Analytes? Int. J. MassSpectrom. 2001, 210/211, 121-132.
41. Ens, W.; Mao, Y.; Mayer, F.; Standing,K.G. Properties of Matrix-Assisted LaserDesorption. Measurements With a Time-to-Digital Converter. Rapid Commun.Mass Spectrom. 1991, 5, 117-123.
42. Medina, N.; Huth-Fehre, T.; Westman, A.;Sundqvist, B.U.R. Matrix-Assisted LaserDesorption: Dependence of the ThresholdFluence on Analyte Concentration. Org.Mass Spectrom. 1994, 29, 207-209.
43. Quist, A.P.; Huth-Fehre, T.; Sundqvist,B.U.R. Total Yield Measurements in Ma-trix-Assisted Laser Desorption Using aQuartz Crystal Microbalance. RapidCommun. Mass Spectrom. 1994, 8, 149-154.
44. Beavis, R.C.; Chait, B.T. Factors Affect-ing the Ultraviolet Laser Desorption ofProteins. Rapid Commun. Mass Spectrom.1989, 3, 233-237.
45. Ingendoh, A.; Karas, M.; Hillenkamp, F.;Giessmann, U. Factors Affecting theResolution in Matrix-Assisted Laser De-sorption-Ionization-MS. Int. J. MassSpectrom. Ion Proc. 1994, 131, 345-354.
46. Aksouh, F.; Chaurand, P.; Deprun, C.;Della-Negra, S.; Hoyes, J.; Le Beyec, Y.;Pinho, R.R. Influence of the Laser BeamDirection on the Molecular Ion EjectionAngle in MALDI. Rapid Commun. MassSpectrom. 1995, 8, 515-518.
47. Liao, P.-C.; Allison, J. Dissecting MALDIMass Spectra. J. Mass Spectrom. 1995, 30,763-766.
48. Strupat, K.; Karas, M.; Hillenkamp, F. 2,5-Dihydroxybenzoic Acid: a New Matrix for

436 10 Matrix-Assisted Laser Desorption/Ionization
Laser Desorption-Ionization-MS. Int. J.Mass Spectrom. Ion Proc. 1991, 111, 89-102.
49. Cotter, R.J. Laser-MS: an Overview ofTechniques, Instruments and Applications.Anal. Chim. Acta 1987, 195, 45-59.
50. Pan, Y.; Cotter, R.J. Measurement of Ini-tial Translational Energies of Peptide Ionsin Laser Desorption/Ionization-MS. Org.Mass Spectrom. 1992, 27, 3-8.
51. Glückmann, M.; Karas, M. The Initial IonVelocity and Its Dependence on Matrix,Analyte and Preparation Method in Ultra-violet MALDI. J. Mass Spectrom. 1999,34, 467-477.
52. Puretzky, A.A.; Geohegan, D.B.; Hurst,G.B.; Buchanan, M.V.; Luk'yanchuk, B.S.Imaging of Vapor Plumes Produced byMatrix Assisted Laser Desorption: APlume Sharpening Effect. Phys. Rev. Lett.1999, 83, 444-447.
53. Leisner, A.; Rohlfing, A.; Berkenkamp, S.;Röhling, U.; Dreisewerd, K.; Hillenkamp,F. IR-MALDI With the Matrix Glycerol:Examination of the Plume Expansion Dy-namics for Lasers of Different Pulse Du-ration. 36. DGMS Jahrestagung 2003,Poster.
54. Wang, B.H.; Dreisewerd, K.; Bahr, U.;Karas, M.; Hillenkamp, F. Gas-Phase Ca-tionization and Protonation of NeutralsGenerated by Matrix-Assisted Laser De-sorption. J. Am. Soc. Mass Spectrom.1993, 4, 393-398.
55. Liao, P.-C.; Allison, J. Ionization Proc-esses in MALDI-MS: Matrix-DependentFormation of [M+H]+ Vs. [M+Na]+ Ions ofSmall Peptides and Some MechanisticComments. J. Mass Spectrom. 1995, 30,408-423.
56. Gimon, M.E.; Preston, L.M.; Solouki, T.;White, M.A.; Russel, D.H. Are ProtonTransfer Reactions of Excited States In-volved in UV Laser Desorption Ioniza-tion? Org. Mass Spectrom. 1992, 27, 827-830.
57. Juhasz, P.; Costello, C.E. Generation ofLarge Radical Ions From Oligometallo-cenes by MALDI. Rapid Commun. MassSpectrom. 1993, 7, 343-351.
58. Lidgard, R.O.; McConnell, B.D.; Black,D.S.C.; Kumar, N.; Duncan, M.W. Frag-mentation Observed in Continuous Ex-traction Linear MALDI: a CautionaryNote. J. Mass Spectrom. 1996, 31, 1443-1445.
59. Irngartinger, H.; Weber, A. Twofold Cy-cloaddition of [60]Fullerene to a Bifunc-tional Nitrile Oxide. Tertrahedron Lett.1996, 37, 4137-4140.
60. Gromov, A.; Ballenweg, S.; Giesa, S.; Le-bedkin, S.; Hull, W.E.; Krätschmer, W.Preparation and Characterization of C119.Chem. Phys. Lett. 1997, 267, 460-466.
61. Giesa, S.; Gross, J.H.; Hull, W.E.; Lebed-kin, S.; Gromov, A.; Krätschmer, W.;Gleiter, R. C120OS: the First Sulfur-Containing Dimeric [60]Fullerene Deriva-tive. Chem. Commun. 1999, 465-466.
62. Karas, M.; Glückmann, M.; Schäfer, J.Ionization in MALDI: Singly ChargedMolecular Ions Are the Lucky Survivors.J. Mass Spectrom. 2000, 35, 1-12.
63. Juhasz, P.; Costello, C.E.; Biemann, K.MALDI-MS With 2-(4-Hydroxyphenyl-azo)benzoic Acid Matrix. J. Am. Soc.Mass Spectrom. 1993, 4, 399-409.
64. Tang, K.; Taranenko, N.I.; Allman, S.L.;Chen, C.H.; Chang, L.Y.; Jacobson, K.B.Picolinic Acid As a Matrix for Laser-MSof Nucleic Acids and Proteins. RapidCommun. Mass Spectrom. 1994, 8, 673-677.
65. Wu, K.J.; Steding, A.; Becker, C.H. Ma-trix-Assisted Laser Desorption-TOF-MSof Oligonucleotides Using 3-Hydroxy-picolinic Acid As an Ultraviolet-SensitiveMatrix. Rapid Commun. Mass Spectrom.1993, 7, 142-146.
66. Taranenko, N.I.; Tang, K.; Allman, S.L.;Ch'ang, L.Y.; Chen, C.H. 3-Amino-picolinic Acid As a Matrix for Laser De-sorption-MS of Biopolymers. RapidCommun. Mass Spectrom. 1994, 8, 1001-1006.
67. Taranenko, N.I.; Potter, N.T.; Allman,S.L.; Golovlev, V.V.; Chen, C.H. GenderIdentification by MALDI-TOF-MS. Anal.Chem. 1999, 71, 3974-3976.
68. Mohr, M.D.; Börnsen, K.O.; Widmer,H.M. MALDI-MS: Improved Matrix forOligosaccharides. Rapid Commun. MassSpectrom. 1995, 9, 809-814.
69. Finke, B.; Stahl, B.; Pfenninger, A.; Karas,M.; Daniel, H.; Sawatzki, G. Analysis ofHigh-Molecular-Weight OligosaccharidesFrom Human Milk by Liquid Chromatog-raphy and MALDI-MS. Anal. Chem. 1999,71, 3755-3762.
70. Pfenninger, A.; Karas, M.; Finke, B.;Stahl, B.; Sawatzki, G. Matrix Optimiza-tion for MALDI-MS of Oligosaccharides
Reference List 437
From Human Milk. J. Mass Spectrom.1999, 34, 98-104.
71. Laugesen, S.; Roepstorff, P. Combinationof Two Matrices Results in Improved Per-formance of Maldi MS for Peptide MassMapping and Protein Analysis. J. Am. Soc.Mass Spectrom. 2003, 14, 992-1002.
72. Karas, M.; Ehring, H.; Nordhoff, E.; Stahl,B.; Strupat, K.; Hillenkamp, F.; Grehl, M.;Krebs, B. MALDI-MS With Additives to2,5-Dihydroxybenzoic Acid. Org. MassSpectrom. 1993, 28, 1476-1481.
73. Beavis, R.C.; Chaudhary, T.; Chait, B.T.-Cyano-4-Hydroxycinnamic Acid As a
Matrix for Matrix-Assisted Laser Desorp-tion-MS. Org. Mass Spectrom. 1992, 27,156-158.
74. Ayorinde, F.O.; Elhilo, E.; Hlongwane, C.MALDI-TOF-MS of Canola, Castor andOlive Oils. Rapid Commun. Mass Spec-trom. 1999, 13, 737-739.
75. George, M.; Wellemans, J.M.Y.; Cerny,R.L.; Gross, M.L.; Li, K.; Cavalieri, E.L.Matrix Design for MALDI: Sensitive De-termination of PAH-DNA Adducts. J. Am.Soc. Mass Spectrom. 1994, 5, 1021-1025.
76. Lidgard, R.O.; Duncan, M.W. Utility ofMALDI-TOF-MS for the Analysis of LowMolecular Weight Compounds. RapidCommun. Mass Spectrom. 1995, 9, 128-132.
77. Beavis, R.C.; Chait, B.T. Cinnamic AcidDerivatives As Matrices for UltravioletLaser Desorption-MS of Proteins. RapidCommun. Mass Spectrom. 1989, 3, 432-435.
78. Montaudo, G.; Montaudo, M.S.; Puglisi,C.; Samperi, F. 2-(4-Hydroxyphenylazo)-Benzoic Acid: a Solid Matrix for MALDIof Polystyrene. Rapid Commun. MassSpectrom. 1994, 8, 1011-1015.
79. Xu, N.; Huang, Z.-H.; Watson, J.T.; Gage,D.A. Mercaptobenzothiazoles: a NewClass of Matrixes for Laser DesorptionIonization-MS. J. Am. Soc. Mass Spec-trom. 1997, 8, 116-124.
80. Pitt, J.J.; Gorman, J.J. MALDI-TOF-MSof Sialylated Glycopeptides and ProteinsUsing 2,6-Dihydroxyacetophenone As aMatrix. Rapid Commun. Mass Spectrom.1996, 10, 1786-1788.
81. Gorman, J.J.; Ferguson, B.L.; Nguyen,T.B. Use of 2,6-Dihydroxyacetophenonefor Analysis of Fragile Peptides, DisulfideBonding and Small Proteins by MALDI.Rapid Commun. Mass Spectrom. 1996, 10,529-536.
82. Meyer, A.; Spinelli, N.; Imbach, J.-L.;Vasseur, J.-J. Analysis of Solid-SupportedOligonucleotides by MALDI-TOF-MS.Rapid Commun. Mass Spectrom. 2000, 14,234-242.
83. Kassis, C.M.; DeSimone, J.M.; Linton,R.W.; Lange, G.W.; Friedman, R.M. AnInvestigation into the Importance of Poly-mer-Matrix Miscibility Using SurfactantModified MALDI-MS. Rapid Commun.Mass Spectrom. 1997, 11, 1462-1466.
84. Carr, R.H.; Jackson, A.T. PreliminaryMALDI-TOF and Field Desorption MassSpectrometric Analyses of PolymericMethylene Diphenylene Diisocyanate, ItsAmine Precursor and a Model PolyetherPrepolymer. Rapid Commun. Mass Spec-trom. 1998, 12, 2047-2050.
85. Lebedkin, S.; Ballenweg, S.; Gross, J.H.;Taylor, R.; Krätschmer, W. Synthesis ofC120O: a New Dimeric [60]Fullerene De-rivative. Tetrahedron Lett. 1995, 36, 4971-4974.
86. Ballenweg, S.; Gleiter, R.; Krätschmer, W.Chemistry at Cyclopentene Addends on[60]Fullerene. Matrix-Assisted Laser De-sorption-Ionization-TOF-MS (MALDI-TOF MS) As a Quick and Facile Methodfor the Characterization of Fullerene De-rivatives. Synth. Met. 1996, 77, 209-212.
87. Brown, T.; Clipston, N.L.; Simjee, N.;Luftmann, H.; Hungebühler, H.; Drewello,T. MALDI of Amphiphilic Fullerene De-rivatives. Int. J. Mass Spectrom. 2001,210/211, 249-263.
88. Hopwood, F.G.; Michalak, L.; Alderdice,D.S.; Fisher, K.J.; Willett, G.D. C60-Assisted Laser Desorption/Ionization-MSin the Analysis of Phosphotungstic Acid.Rapid Commun. Mass Spectrom. 1994, 8,881-885.
89. Jones, R.M.; Lamb, J.H.; Lim, C.K.5,10,15,20-Meso-Tetra(Hydroxyphenyl)-Chlorin As a Matrix for the Analysis ofLow Molecular Weight Compounds byMALDI-TOF-MS. Rapid Commun. MassSpectrom. 1995, 9, 968-969.
90. Kumar, N.; Kolli, V.S.; Orlando, R. ANew Matrix for MALDI on MagneticSector Instruments With Point Detectors.Rapid Commun. Mass Spectrom. 1996, 10,923-926.
91. Harvey, D.J.; Hunter, A.P. Use of a Con-ventional Point Detector to RecordMALDI Spectra From a Magnetic SectorInstrument. Rapid Commun. Mass Spec-trom. 1998, 12, 1721-1726.

438 10 Matrix-Assisted Laser Desorption/Ionization
92. Westman, A.; Huth-Fehre, T.; Demirev,P.A.; Sundqvist, B.U.R. Sample Morphol-ogy Effects in MALDI-MS of Proteins. J.Mass Spectrom. 1995, 30, 206-211.
93. Arakawa, R.; Watanabe, S.; Fukuo, T. Ef-fects of Sample Preparation on MALDI-TOF Mass Spectra for Sodium PolystyreneSulfonate. Rapid Commun. Mass Spec-trom. 1999, 13, 1059-1062.
94. Chan, P.K.; Chan, T.-W.D. Effect of Sam-ple Preparation Methods on the Analysisof Dispersed Polysaccharides by MALDI-TOF-MS. Rapid Commun. Mass Spec-trom. 2000, 14, 1841-1847.
95. Vorm, O.; Mann, M. Improved Mass Ac-curacy in MALDI-TOF-MS of Peptides. J.Am. Soc. Mass Spectrom. 1994, 5, 955-958.
96. Vorm, O.; Roepstorff, P.; Mann, M. Im-proved Resolution and Very High Sensi-tivity in MALDI-TOF of Matrix SurfacesMade by Fast Evaporation. Anal. Chem.1994, 66, 3281-3287.
97. Ayorinde, F.O.; Keith, Q.L., Jr.; Wan,L.W. MALDI-TOF-MS of Cod Liver Oiland the Effect of Analyte/Matrix Concen-tration on Signal Intensities. Rapid Com-mun. Mass Spectrom. 1999, 13, 1762-1769.
98. Bashir, S.; Derrick, P.J.; Critchley, P.;Gates, P.J.; Staunton, J. MALDI-TOF-MSof Dextran and Dextrin Derivatives. Eur.J. Mass Spectrom. 2003, 9, 61-70.
99. Rashidezadeh, H.; Baochuan, G. Investi-gation of Metal Attachment to Polysty-renes in MALDI. J. Am. Soc. Mass Spec-trom. 1998, 9, 724-730.
100. Rashidezadeh, H.; Hung, K.; Baochuan, G.Probing Polystyrene Cationization in Ma-trix-Assisted Laser/Desorption Ionization.Eur. Mass Spectrom. 1998, 4, 429-433.
101. Kühn, G.; Weidner, S.; Decker, R.; Hol-länder, A. Derivatization of Double BondsInvestigated by MALDI-MS. Rapid Com-mun. Mass Spectrom. 1997, 11, 914-918.
102. Kühn, G.; Weidner, S.; Just, U.; Hohner,S. Characterization of Technical Waxes.Comparison of Chromatographic Tech-niques and Matrix-Assisted Laser-Desorption/Ionization-MS. J. Chromatogr.A 1996, 732, 111-117.
103. Pruns, J.K.; Vietzke, J.-P.; Strassner, M.;Rapp, C.; Hintze, U.; König, W.A. Char-acterization of Low Molecular WeightHydrocarbon Oligomers by Laser Desorp-tion/Ionization-TOF-MS Using a Solvent-Free Sample Preparation Method. Rapid
Commun. Mass Spectrom. 2002, 16, 208-211.
104. Mowat, I.A.; Donovan, R.J. Metal-IonAttachment to Non-Polar Polymers DuringLaser Desorption/Ionization at 337 Nm.Rapid Commun. Mass Spectrom. 1995, 9,82-90.
105. Goldschmitt, R.J.; Wetzel, S.J.; Blair,W.R.; Guttman, C.M. Post-Source Decayin the Analysis of Polystyrene by MALDI-TOF-MS. J. Am. Soc. Mass Spectrom.2000, 11, 1095-1106.
106. Kéki, S.; Deák, G.; Zsuga, M. Copper(I)Chloride: a Simple Salt for Enhancementof Polystyrene Cationization in MALDI-MS. Rapid Commun. Mass Spectrom.2001, 15, 675-678.
107. Puchades, M.; Westman, A.; Blennow, K.;Davidsson, P. Removal of Sodium Dode-cyl Sulfate From Protein Samples Prior toMALDI-MS. Rapid Commun. Mass Spec-trom. 1999, 13, 344-349.
108. Trimpin, S.; Grimsdale, A.C.; Räder, H.J.;Müllen, K. Characterization of an Insolu-ble Poly(9,9-Diphenyl-2,7-Fluorene) bySolvent-Free Sample Preparation forMALDI-TOF-MS. Anal. Chem. 2002, 74,3777-3782.
109. Trimpin, S.; Rouhanipour, A.; Az, R.;Räder, H.J.; Müllen, K. New Aspects inMALDI-TOF-MS: a Universal Solvent-Free Sample Preparation. Rapid Commun.Mass Spectrom. 2001, 15, 1364-1373.
110. Nordhoff, E.; Schürenberg, M.; Thiele, G.;Lübbert, C.; Kloeppel, K.-D.; Theiss, D.;Lehrach, H.; Gobom, J. Sample Prepara-tion Protocols for MALDI-MS of Peptidesand Oligonucleotides Using PrestructuredSample Supports. Int. J. Mass Spectrom.2003, 226, 163-180.
111. Guittard, J.; Hronowski, X.L.; Costello,C.E. Direct MALDI Mass SpectrometricAnalysis of Glycosphingolipids on ThinLayer Chromatographic Plates and Trans-fer Membranes. Rapid Commun. MassSpectrom. 1999, 13, 1838-1849.
112. McCrery, D.A.; Ledford, E.B., Jr.; Gross,M.L. Laser Desorption Fourier Transform-MS. Anal. Chem. 1982, 54, 1435-1437.
113. Claereboudt, J.; Claeys, M.; Geise, H.;Gijbels, R.; Vertes, A. Laser Microprobe-MS of Quaternary Phosphonium Salts: Di-rect Versus Matrix-Assisted Laser De-sorption. J. Am. Soc. Mass Spectrom.1993, 4, 798-812.
114. Gromer, S.; Gross, J.H. MethylseleninateIs a Substrate Rather Than an Inhibitor of

Reference List 439
Mammalian Thioredoxin Reductase: Im-plications for the Antitumor Effects ofSelenium. J. Biol. Chem. 2002, 277,9701-9706.
115. Wood, T.D.; Van Cleef, G.W.; Mearini,M.A.; Coe, J.V.; Marshall, A.G. Forma-tion of Giant Fullerene Gas-Phase Ions(C2n
+, n = 60-500): Laser Desorp-tion/Electron Ionization Fourier-Transform Ion Cyclotron Resonance MassSpectrometric Evidence. Rapid Commun.Mass Spectrom. 1993, 7, 304-311.
116. Beck, R.D.; Weis, P.; Hirsch, A.; Lam-parth, I. Laser Desorption-MS of FullereneDerivatives: Laser-Induced Fragmentationand Coalescence Reactions. J. Phys.Chem. 1994, 98, 9683-9687.
117. Wolkenstein, K.; Gross, J.H.; Oeser, T.;Schöler, H.F. Spectroscopic Characteriza-tion and Crystal Structure of the1,2,3,4,5,6-Hexahydrophenanthro-[1,10,9,8-opqra]perylene. TetrahedronLett. 2002, 43, 1653-1655.
118. Grim, D.M.; Siegel, J.; Allison, J. DoesInk Age Inside of a Pen Cartridge? J. Fo-rensic Sci. 2002, 47, 1294-1297.
119. Jones, R.M.; Lamb, J.H.; Lim, C.K. Uri-nary Porphyrin Profiles by Laser Desorp-tion/Ionization-TOF-MS Without the Useof Classical Matrixes. Rapid Commun.Mass Spectrom. 1995, 9, 921-923.
120. Jackson, A.T.; Yates, H.T.; Scrivens, J.H.;Critchley, G.; Brown, J.; Green, M.R.;Bateman, R.H. The Application ofMALDI Combined With Collision-Induced Dissociation to the Analysis ofSynthetic Polymers. Rapid Commun. MassSpectrom. 1996, 10, 1668-1674.
121. Tang, X.; Dreifuss, P.A.; Vertes, A. NewMatrixes and Accelerating Voltage Effectsin MALDI of Synthetic Polymers. RapidCommun. Mass Spectrom. 1995, 9, 1141-1147.
122. Montaudo, G.; Montaudo, M.S.; Puglisi,C.; Samperi, F. Self-Calibrating Propertyof MALDI-TOF Spectra of PolymericMaterials. Rapid Commun. Mass Spec-trom. 1994, 8, 981-984.
123. Williams, J.B.; Chapman, T.M.; Hercules,D.M. MALDI-MS of Discrete MassPoly(Butylene Glutarate) Oligomers. Anal.Chem. 2003, 75, 3092-3100.
124. Nielen, M.F.W.; Malucha, S. Characteri-zation of Polydisperse Synthetic Polymersby Size-Exclusion Chromatogra-phy/MALDI-TOF-MS. Rapid Commun.Mass Spectrom. 1997, 11, 1194-1204.
125. de Koster, C.G.; Duursma, M.C.; vanRooij, G.J.; Heeren, R.M.A.; Boon, J.J.Endgroup Analysis of Polyethylene GlycolPolymers by MALDI Fourier-TransformIon Cyclotron Resonance-MS. RapidCommun. Mass Spectrom. 1995, 9, 957-962.
126. Weidner, S.; Kühn, G.; Just, U. Charac-terization of Oligomers in Poly(EthyleneTerephthalate) by MALDI-MS. RapidCommun. Mass Spectrom. 1995, 9, 697-702.
127. Montaudo, M.S. Sequence Constraints in aGlycine-Lactic Acid Copolymer Deter-mined by MALDI-MS. Rapid Commun.Mass Spectrom. 1999, 13, 639-644.
128. Montaudo, M.S. Mass Spectra of Copoly-mers. Mass Spectrom. Rev. 2002, 21, 108-144.
129. Murgasova, R.; Hercules, D.M. Quantita-tive Characterization of a Polysty-rene/Poly( -methylstyrene) Blend byMALDI-MS and Size-Exclusion Chro-matography. Anal. Chem. 2003, 75, 3744-3750.
130. Krishnamurthy, T.; Ross, P.L.; Rajamani,U. Detection of Pathogenic and Non-Pathogenic Bacteria by MALDI-TOF-MS.Rapid Commun. Mass Spectrom. 1996, 10,883-888.
131. Angeletti, R.; Gioacchini, A.M.; Seraglia,R.; Piro, R.; Traldi, P. The Potential ofMALDI-MS in the Quality Control ofWater Buffalo Mozzarella Cheese. J. MassSpectrom. 1998, 33, 525-531.
132. Fanton, C.; Delogu, G.; Maccioni, E.;Podda, G.; Seraglia, R.; Traldi, P.MALDI-MS in the Dairy Industry 2. TheProtein Fingerprint of Ewe Cheese and ItsApplication to Detection of Adulterationby Bovine Milk. Rapid Commun. MassSpectrom. 1998, 12, 1569-1573.
133. Welham, K.J.; Domin, M.A.; Johnson, K.;Jones, L.; Ashton, D.S. Characterization ofFungal Spores by Laser Desorp-tion/Ionization-TOF-MS. Rapid Commun.Mass Spectrom. 2000, 14, 307-310.
134. Harvey, D.J. MALDI-MS of Carbohy-drates and Glycoconjugates. Int. J. MassSpectrom. 2003, 226, 1-35.
135. Stahl, B.; Linos, A.; Karas, M.; Hillenk-amp, F.; Steup, M. Analysis of FructansFrom Higher Plants by MALDI-MS. Anal.Biochem. 1997, 246, 195-204.
136. Garrozzo, D.; Impallomeni, G.; Spina, E.;Sturiale, L.; Zanetti, F. MALDI-MS of
440 10 Matrix-Assisted Laser Desorption/Ionization
Polysaccharides. Rapid Commun. MassSpectrom. 1995, 9, 937-941.
137. Harvey, D.J.; Naven, T.J.P.; Küster, B.;Bateman, R.; Green, M.R.; Critchley, G.Comparison of Fragmentation Modes forthe Structural Determination of ComplexOligosaccharides Ionized by MALDI-MS.Rapid Commun. Mass Spectrom. 1995, 9,1556-1561.
138. Lin, H.; Hunter, J.M.; Becker, C.L. LaserDesorption of DNA Oligomers LargerThan One Kilobase From Cooled 4-Nitrophenol. Rapid Commun. Mass Spec-trom. 1999, 13, 2335-2340.
139. Bartolini, W.P.; Johnston, M.V. Charac-terizing DNA Photo-Oxidation Reactionsby High-Resolution Mass MeasurementsWith MALDI-TOF-MS. J. Mass Spec-trom. 2000, 35, 408-416.
140. Wei, J.; Buriak, J.M.; Siuzdak, G. Desorp-tion-Ionization-MS on Porous Silicon.Nature 1999, 399, 243-246.
141. Shen, Z.; Thomas, J.J.; Averbuj, C.; Broo,K.M.; Engelhard, M.; Crowell, J.E.; Finn,M.G.; Siuzdak, G. Porous Silicon As aVersatile Platform for Laser Desorp-tion/Ionization-MS. Anal. Chem. 2001, 73,612-619.
142. Laiko, V.V.; Taranenko, N.I.; Berkout,V.D.; Musselman, B.D.; Doroshenko,V.M. Atmospheric Pressure Laser De-sorption/Ionization on Porous Silicon.Rapid Commun. Mass Spectrom. 2002, 16,1737-1742.
143. Laiko, V.V.; Baldwin, M.A.; Burlingame,A.L. Atmospheric Pressure MALDI-MS.Anal. Chem. 2000, 72, 652-657.
144. Laiko, V.V.; Moyer, S.C.; Cotter, R.J.Atmospheric Pressure MALDI/Ion Trap-MS. Anal. Chem. 2000, 72, 5239-5243.
145. Moyer, S.C.; Marzilli, L.A.; Woods, A.S.;Laiko, V.V.; Doroshenko, V.M.; Cotter,R.J. Atmospheric Pressure MALDI (APMALDI) on a Quadrupole Ion Trap MassSpectrometer. Int. J. Mass Spectrom.2003, 226, 133-150.
146. Doroshenko, V.M.; Laiko, V.V.; Ta-ranenko, N.I.; Berkout, V.D.; Lee, H.S.Recent Developments in AtmosphericPressure MALDI-MS. Int. J. Mass Spec-trom. 2002, 221, 39-58.
147. Krutchinsky, A.N.; Loboda, A.V.; Spicer,V.L.; Dworschak, R.; Ens, W.; Standing,K.G. Orthogonal Injection of MALDI Ionsinto a TOF Spectrometer Through a Colli-sional Damping Interface. Rapid Commun.Mass Spectrom. 1998, 12, 508-518.
148. Hill, J.A.; Annan, R.S.; Biemann, K.MALDI With a Magnetic Mass Spec-trometer. Rapid Commun. Mass Spectrom.1991, 5, 395-399.
149. Annan, R.S.; Köchling, H.J.; Hill, J.A.;Biemann, K. Matrix-Assisted Laser De-sorption Using a Fast-Atom BombardmentIon Source and a Magnetic Mass Spec-trometer. Rapid Commun. Mass Spectrom.1992, 6, 298-302.
150. McIver, R.T., Jr.; Li, Y.; Hunter, R.L.MALDI With an External Ion Source Fou-rier-Transform Mass Spectrometer. RapidCommun. Mass Spectrom. 1994, 8, 237-241.
151. Li, Y.; McIver, R.T., Jr.; Hunter, R.L.High-Accuracy Molecular Mass Determi-nation for Peptides and Proteins by FourierTransform-MS. Anal. Chem. 1994, 66,2077-2083.
152. Li, Y.; Tang, K.; Little, D.P.; Koester, H.;McIver, R.T., Jr. High-Resolution MALDIFourier Transform-MS of Oligonucleo-tides. Anal. Chem. 1996, 68, 2090-2096.
153. Baykut, G.; Jertz, R.; Witt, M. MALDIFT-ICR-MS With Pulsed in-Source Colli-sion Gas and in-Source Ion Accumulation.Rapid Commun. Mass Spectrom. 2000, 14,1238-1247.
154. O'Connor, P.B.; Costello, C.E. A HighPressure MALDI Fourier Transform-MSIon Source for Thermal Stabilization ofLabile Biomolecules. Rapid Commun.Mass Spectrom. 2001, 15, 1862-1868.

11 Electrospray Ionization
Electrospray ionization (ESI) “is a soft ionization technique that accomplishes thetransfer of ions from solution to the gas phase. The technique is extremely usefulfor the analysis of large, non-volatile, chargeable molecules such as proteins andnucleic acid polymers.” [1] Different from fast atom bombardment (FAB,Chap. 9) the solution is composed of a volatile solvent and the ionic analyte atvery low concentration, typically 10–6–10–3 M. In addition, the transfer of ionsfrom the condensed phase into the state of an isolated gas phase ion starts at at-mospheric pressure and leads continuously into the high vacuum of the mass ana-lyzer. [2-5] This results in a marked softness of ionization and makes electrospraythe “wings for molecular elephants”. [6] Another reason for the extraordinaryhigh-mass capability of ESI [7,8] is found in the characteristic formation of multi-ply charged ions in case of high-mass analytes. [4,9] Multiple charging folds upthe m/z scale by the number of charges and thus compresses the ions into the m/zrange of standard mass analyzers (Fig. 11.1 and Chap. 3.5)
Nowadays, ESI is the leading member of the group of atmospheric pressureionization (API) methods and the method of choice for liquid chromatography-mass spectrometry coupling (LC-MS, Chap. 12). [10-13] Currently, ESI andMALDI (Chap. 10) are the most commonly employed ionization methods andthey opened doors to the widespread biological and biomedical application ofmass spectrometry. [5,10,11,13-17] Moreover, ESI serves well for the analysis ofionic metal complexes [18,19] and other inorganic analytes. [20-22]
Note: Although the range up to m/z 3000 is normally employed for the detec-tion of ions generated by ESI, ions of much higher m/z can be formed. [23,24]Even ions at m/z 85,000 have been observed. [25]
11.1 Development of ESI and Related Methods
11.1.1 Atmospheric Pressure Ionization
Atmospheric pressure ionization (API) was the first technique to directly interfacesolution phase with a mass analyzer. [26] In API, a solution of the analyte is in-jected into a stream of hot nitrogen to rapidly evaporate the solvent. The vaporpasses through a 63Ni source where electrons emitted from the radioactive 63Niisotope initiate a complex series of ionizing processes. Beginning with the ioniza-

442 11 Electrospray Ionization
tion of N2, consecutive ion molecule reactions finally lead to the formation of[(H2O)n+H]+ cluster ions that are able to protonate the analyte via ion molecule re-actions. [26-28] (Also see APCI in Chap. 11.6).
Fig. 11.1. Relationship between the mass of peptides and proteins and the number of ioniccharges under ESI conditions. Adapted from Ref. [4] by permission. © American ChemicalSociety, 1990.
11.1.2 Thermospray
Thermospray (TSP) [29-31] unites three modes of operation. In pure TSP, a solu-tion of the analyte and a volatile buffer, usually 0.1 M ammonium acetate, isevaporated from a heated capillary at a flow rate of 1–2 ml min–1 into a heatedchamber, hence the term thermospray. As the solvent evaporates, the analyte isforming adducts with ions from the buffer salt. While most of the neutrals are re-moved by a vacuum pump, the ions are extracted orthogonally from their mainaxis of motion by use of an electrostatic potential. The ions are transferred into aquadrupole mass analyzer through a pinhole of about 25 µm in diameter(Fig. 11.2). The quadrupole was employed according to its tolerance to poor vac-

11.1 Development of ESI and Related Methods 443
uum conditions. As the pure TSP mode only works from high-polarity solvents inthe presence of a buffer salt, modified modes of operation were developed to ex-pand the use of TSP to lower-polarity systems: ii) use of an electrical discharge inthe vapor phase [32] or iii) an electron-emitting filament as used in EI (Chap. 5) orCI (Chap. 7). TSP meant a breakthrough for LC-MS. [33]
Fig. 11.2. Schematic of a thermospray interface. A: cartridge heater; B: copper blockbrazed to stainless steel capillary; C: capillary; D: copper tube; E: ion lenses; F: quadrupolemass analyzer; G: line to rotary vane pump; H: ion exit aperture; J: source heater. Repro-duced from Ref. [30] by permission. © American Chemical Society, 1983.
Note: Thermospray is not a true API method because the liquid is sprayed intoa vacuum of several hundred Pa instead of spraying at atmospheric pressure.
11.1.3 Electrohydrodynamic Ionization
An electrolytic solution of sufficiently low volatility can be transferred into thevacuum and sprayed from a fine capillary by the action of a strong electrostaticfield. This is known as electrohydrodynamic ionization (EHI). [34,35] EHI resultsfrom the interaction of the field with the liquid meniscus at the end of the capillarytube. [36,37] A mist of micrometer-sized electrically charged droplets expandsinto the vacuum at supersonic speed. The droplets shrink upon evaporation of sol-vent. Shrinking causes the charge density on their surface to exceed the Rayleighlimit of stability, [38] i.e., the surface tension is overcome by electrostatic repul-sion. The electric forces then tear the droplets apart. The sequence of dropletshrinking and subsequent disintegration into smaller sub-units occurs repeatedlyand in the end leads to the formation of isolated ions in the gas phase. Althoughoptimized EHI conditions [39] and convenient ion sources are at hand, e.g., EHI iscompatible to FD ion sources upon replacement of the field emitter by a capillarytube, (Chap. 8.2), [40] EHI never became widespread in organic mass spectrome-

444 11 Electrospray Ionization
try. This is most probably due to its limitation to low-volatility solvents. Never-theless, EHI can be applied to analyze polymers [41] and is used to generate pri-mary ions in massive cluster impact (MCI) mass spectrometry (Chap. 9.5.1).
11.1.4 Electrospray Ionization
The development of electrospray ionization by Dole [42,43] indeed preceded API,TSP, and EHI by years. The underlying principle of ESI which it has in commonwith EHI even goes back to work by Zeleny [36] and Taylor. [37] Again, a mist ofmicrometer-sized electrically charged droplets is generated and the repetitiveshrinking disintegration is also observed under ESI conditions. In contrast to EHI,the electrostatic sprayer is operated at atmospheric pressure. Thus, sufficient en-ergy to vaporize volatile solvents without freezing the aerosol droplets is suppliedby the surrounding gas. Presumably, the ability of ESI to work with standard sol-vents is the key to the tremendous success of ESI. [6]
The limitation of Dole's experiments was that the ions of the electrosprayedhigh-molecular weight polystyrene used in his group could not be detected bymass spectrometry. [42-44] It took years of work and lasted until the ending 1980sfor the Fenn group to fully realize that analytes of 100–2000 u molecular weightcan be readily analyzed with a quadrupole analyzer attached to a properly con-structed ESI ion source. [2,6,45]
11.2 Ion Sources for ESI
11.2.1 Basic Design Considerations
An ESI source of sufficiently advanced design for mass spectrometry was de-signed by the Fenn group in the mid 1980s (Fig. 11.3). [2,45-47] The dilute sam-ple solution is forced by a syringe pump through a hypodermic needle at a rate of5–20 µl min–1. The needle is held at a potential of 3–4 kV relative to a surroundingcylindrical electrode. Then, the electrosprayed aerosol expands into a countercur-rent stream of dry nitrogen gas that serves as a heat supply for vaporization of thesolvent. A small portion of the sprayed material enters the aperture of a short cap-illary (0.2 mm inner diameter, 60 mm length) that interfaces the atmospheric pres-sure spray to the first pumping stage (ca. 102 Pa). Most of the gas expanding fromthe desolvating aerosol is pumped off by a rotary vane pump as it exits from thecapillary. A minor portion passes through the orifice of a skimmer into the highvacuum behind (ca. 10–3–10–4 Pa). At this stage, desolvation of the ions is com-pleted, while the ions are focused into a mass analyzer. Suitable potentials appliedto capillary, skimmer, and lenses behind provide an effective transfer of ionsthrough the interface, whereas neutral gas is not affected.
Modern ESI sources – also termed ESI interfaces – are constructed in manyvariations of this basic design. [48,49] They may have a heated transfer capillary

11.2 Ion Sources for ESI 445
or a countercurrent stream of heated nitrogen to enforce solvent evaporation. [50]These differences can influence a system's robustness and the degree of cluster ionformation with a particular ESI interface. [51,52] Whatever the details, they are allderived from a nozzle-skimmer system proposed by Kantrowitz and Grey [53] thatdelivers an intense cool molecular jet into the high vacuum environment.[42,45,54] The adiabatic expansion of the gas on the first pumping stage reducesrandom motion of the particles due to extensive cooling. Furthermore, a portion ofthe thermal motion is converted into directed flow by the nozzle-skimmer ar-rangement. In summary, this causes the heavier, analyte ion-containing solventclusters to travel close to the center of the flight path through the interface,whereas light solvent molecules escape from the jet. [43]
Fig. 11.3. Schematic of an early electrospray ion source. Reproduced from Ref. [2] by per-mission. © American Association for the Advancement of Science, 1989.
11.2.2 ESI with Modified Sprayers
The pure electrospray process of dispersing a liquid into an aerosol works best atflow rates of 1–20 µl min–1. Conventional unassisted ESI has also limitations as aLC-MS interface due to the solvent properties in terms of volatility and polaritywhich can be electrosprayed without some type of assistance. Therefore, a numberof sprayer modifications including a heated sprayer [55] have been developed toexpand the range of ESI applications (Fig. 11.4).
The design of a pneumatically assisted ESI interface differs from the pureelectrospray interface in that it provides a pneumatic assistance for the spray proc-ess. This is achieved by admitting a concentric flow of an inert gas such as nitro-gen around the electrospray plume. [56-58] Pneumatic assistance allows for higherflow rates and for a reduced influence of the surface tension of the solvent used.[59] Pneumatically assisted ESI can accommodate flow rates of 10–200 µl min–1.
In addition to high LC flow rates, solutions of high conductivity, and/or highsurface tension are unsuitable for use with conventional ESI. An ultrasonic nebu-lizer can reduce such problems because it mechanically creates the spray. Unfor-tunately, the ultrasonically created droplets are comparatively large and this hin-

446 11 Electrospray Ionization
ders ion formation, i.e., the ion yield is reduced. Nonetheless, the ultrasonic nebu-lizer handles liquid flow rates of 50–1000 µl min–1 and reduces the restrictions ofthe range of mobile-phase compositions amenable to ESI. For example, a mobile-phase gradient beginning at water : methanol = 95 : 5 falls outside the solventrange that can be used with conventional ESI, while an ultrasonic nebulizer willwork. [60,61] With both pneumatically assisted ESI and ultrasonic nebulizer ESIthe role of the high voltage almost reduces to the mere supply of electric chargingof the droplets. If in the absence of high flow rates, high polarity alone is an issue,nanoESI provides the better tool to deal with (next section).
For capillary zone electrophoresis (CZE) mass spectrometry coupling, anothermodification of an ESI interface has been developed. This interface uses a sheathflow of liquid to make the electrical contact at the CZE terminus, thus definingboth the CZE and electrospray field gradients. This way, the composition of theelectrosprayed liquid can be controlled independently of the CZE buffer, therebyproviding operation with buffers that could not be used previously, e.g., aqueousand high ionic strength buffers. In addition, the interface operation becomes inde-pendent of the CZE flow rate. [62]
Fig. 11.4. Different sprayers for ESI. (a) Pure electrospray, (b) ESI with sheath liquid,(c) pneumatically assisted ESI, and (d) ultrasonic nebulizer. Adapted from Ref. [5] (p. 109)by permission. © John Wiley & Sons, Inc. 1997.
Note: Pneumatically assisted electrospray is also termed ion spray (ISP).However, the term ISP is not recommended instead of pneumatically assistedESI because ISP i) represents a mere modification of the ESI setup and ii) is acompany-specific term. [63]

11.2 Ion Sources for ESI 447
11.2.3 Nano-Electrospray
Miniaturization of the electrospray is even more attractive than enlarging the flowrates. It has been theoretically described and experimentally demonstrated byWilm and Mann that a more narrow spray capillary results in smaller droplets, andmoreover in much reduced flow rates. [64] Such a downscaling can be achievedby replacing the spray needle by a borosilicate glass capillary of some microlitersvolume to which a fine tip is pulled with a micropipette puller. The tip has a nar-row bore exit of 1–4 µm diameter making flow rates of 20–50 nl min–1 sufficientto provide a stable electrospray. [65] Derived from the nanoliter flow rates, theterm nano-electrospray (nanoESI) has become established for that technique.While conventional ESI produces initial droplets of 1–2 µm in diameter, thedroplet size from nanoESI is less than 200 nm, i.e., their volume is about 100–1000 times smaller. NanoESI allows for high-polarity solvents such as pure waterin both positive- and negative-ion mode, has extremely low sample consumption[66], and tolerates even higher loads with buffer salts than conventional ESI.[50,67]
For the measurement, the nanoESI capillary is adjusted at about 1 mm distanceto the entrance of the counter electrode by means of a micromanipulator. Thus,precise optical control is needed during positioning to prevent crashing of the tipor electric discharges during operation. Commercial nanoESI sources are thereforeequipped with a built-in microscope or camera (Fig. 11.5). The spray voltage of0.7–1.1 kV is normally applied via an electrically conducting coating on the outersurface of the spray capillaries, usually a sputtered gold film. Occasionally, widercapillaries with a fine metal filament inside are used. With the high voltageswitched on, the liquid sample flow is solely driven by capillary forces refillingthe aperture as droplets are leaving the tip. Sometimes, liquid flow is slightly sup-ported by a gentle backing pressure on the capillary.
Fig. 11.5. Nano-electrospray; (a) SEM micrograph of the open end of a glass nanoESI cap-illary having a 2-µm aperture, (b) microscopic view of the spray from a nanoESI capillaryas provided by observations optics. By courtesy of New Objective, Woburn, MA.

448 11 Electrospray Ionization
Example: The reduced sample consumption of nanoESI allows for the se-quencing of the peptides (Chap. 9.4.7) obtained by tryptic digestion of only800 fmol of the protein bovine serum albumin (BSA, Fig. 11.6). [66] The experi-ment depicted below requires each of the BSA-derived peptide ions in the fullscan spectrum to be subjected to fragment ion analysis by means of CID-MS/MSon a triple quadrupole instrument (Chaps. 2.12 and 4.4.5).
Fig. 11.6. Peptide sequencing by nanoESI-CID-MS/MS from a tryptic digest of bovine se-rum albumin (BSA); 800 fmol of BSA were used. (a) Full scan spectrum, (b) fragmentationof the selected doubly charged peptide ion at m/z 740.5. Adapted from Ref. [66] by permis-sion. © Nature Publishing Group, 1996.
Note: Besides its low sample consumption, nanoESI is free of memory effectsbecause each sample is supplied in a fresh capillary by means of disposable mi-cropipettes. Furthermore, the narrow exits of nanoESI capillaries prevent air-sensitive samples from rapid decomposition.
11.2.3.1 Nano-Electrospray from a Chip
The sample throughput of nanoESI is limited by the comparatively time-consuming procedure of manual capillary loading. A chip-based nanoESI sprayeron an etched silicon wafer allows for the automated loading of the sprayer arrayby a pipetting robot (Fig. 11.7). The chip provides a 10 10 array of nanoESI

11.2 Ion Sources for ESI 449
spray nozzles of 10 µm inner diameter. Volumes up to 10 µl are supplied directlyfrom a pipette contacting the chip from the backside. An electrically conductingcoating of the pipette tip is used to connect the sprayer to high voltage. Pipettingrobot and automated chip handling are united in a common housing that replacesthe conventional (nano)ESI spray unit.
Fig. 11.7. Illustration of the chip-based Advion nanoESI system. The pictures stepwisezoom in from the pipetting unit to the spray capillary on the silicon chip. By courtesy ofG. Schultz, Advion BioSciences, Ithaca, NY.
11.2.4 ESI with Modified Spray Geometries
Clogging of capillaries and skimmers is one of the prominent problems with theotherwise easy-to-use ESI interfaces. In particular when analytes are accompaniedby involatile impurities such as buffer salts used to improve liquid chromatogra-phy or organic material as present in blood or urine samples, for example, thedeposition of material can cause the rapid breakdown of the ESI interface. Nu-merous modifications of spray geometry and skimmer design were developed tocircumvent this problem. The principle of such designs is to achieve spatial sepa-ration of the deposition site of non-volatized material and the location of the ionentrance into the mass spectrometer. Such designs include i) spraying off-axis,ii) spraying at some angle up to orthogonal, and iii) guiding the desolvating mi-crodroplets through bent paths (Fig. 11.8). [63] Probably the most successful de-sign of modern commercial ESI interfaces is the Micromass z-spray interface(Fig. 11.9). Another advantage of orthogonal spraying is that it selectively collectssmall and highly charged droplets which are the preferred source of analyte ions.Larger and less-charged droplets are not sufficiently attracted by the extractionfield at 90° angle and therefore pass by.
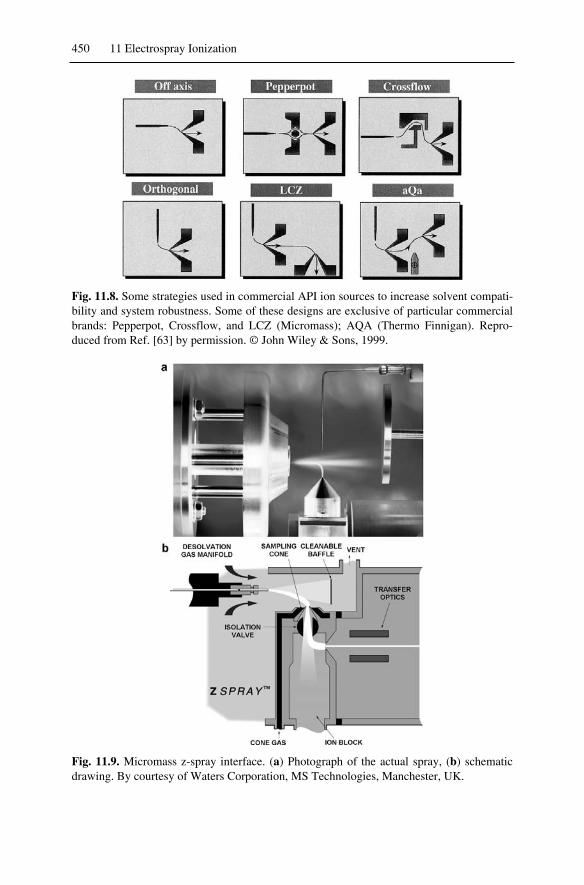
450 11 Electrospray Ionization
Fig. 11.8. Some strategies used in commercial API ion sources to increase solvent compati-bility and system robustness. Some of these designs are exclusive of particular commercialbrands: Pepperpot, Crossflow, and LCZ (Micromass); AQA (Thermo Finnigan). Repro-duced from Ref. [63] by permission. © John Wiley & Sons, 1999.
Fig. 11.9. Micromass z-spray interface. (a) Photograph of the actual spray, (b) schematicdrawing. By courtesy of Waters Corporation, MS Technologies, Manchester, UK.

11.3 Ion Formation 451
11.2.5 Skimmer CID
The intermediate pressure region between nozzle and skimmer of an electrosprayinterface does not only provide space for effective desolvation, [68,69] but canalso be used to achieve fragmentation of the ions by CID (Chap. 2.12). While acomparatively high pressure in this region can effect collisional cooling ratherthan dissociative collisions, [70] a higher voltage difference between nozzle andskimmer enhances ionic fragmentation by CID. [68,70,71]
Skimmer CID or nozzle/skimmer CID can i) strip off residual solvent molecules,ii) achieve fragmentation of electrosprayed ions resulting in spectra similar to CImode, [72] and iii) generate first generation fragment ions for further tandem MSexperiments. The latter method provides a pseudo MS3 operation on triple quad-rupole mass spectrometers [73,74] (real MS3 requires mass-selection prior to thefirst CID stage in addition). A programmable skimmer CID routine delivers ESImass spectra with a variable degree of fragmentation from a single run. [71,73-75]
Example: Even a moderate voltage drop between nozzle and skimmer cancause the elimination of weakly bonded substituents such as CO2 in case of carbondioxide-protected deprotonated N-heterocycles. In particular SnMe3-substitutedanions such as 2-(trismethylstannyl)pyrrole-N-carbamate exhibit variations in the[A–CO2]
–/A– ratio of up to a factor of 30 (Fig. 11.10). [76]
Fig. 11.10. (a) Partial negative-ion ESI spectrum of 2-(trismethylstannyl)pyrrole-N-carbamate (A–) from tetrahydrofurane at low nozzle-skimmer voltage drop and (b) depend-ence of the [A–CO2]
–/A– ratio variation of this voltage.
11.3 Ion Formation
11.3.1 Formation of an Electrospray
Ion formation in ESI can be regarded as divided into three steps: i) creation of anelectrically charged spray, ii) dramatic reduction of the droplets' size, and finallyiii) liberation of fully desolvated ions. To understand the formation of a continu-ous spray, consider the surface of an ion-containing liquid at the end of an electri-

452 11 Electrospray Ionization
Fig. 11.11. Schematic of Taylor cone formation, ejection of a jet, and its disintegration intoa fine spray. The electrochemical processes of ESI [77,78] are also assigned. Adapted fromRef. [49] by permission of the authors.
Fig. 11.12. Electrospray from a nanoESI capillary. The jet emitted from the Taylor cone isclearly visible and separate from the region of rapid expansion into a plume of microdro-plets. By courtesy of New Objective, Woburn, MA.
cally conducting capillary of about 75 µm inner diameter which is held at an elec-tric potential of 3–4 kV with reference to a counter electrode at 1–2 cm distance.At the open end of the capillary this liquid is exposed to an electric field of about106 V m–1. The electric field causes charge separation in the liquid and finally de-formation of the meniscus into a cone, the formation of which has been discoveredby Zeleny [36] and theoretically first described by Taylor. [37]
In detail, the surface starts forming an oval under the influence of increasingfield strength; and in turn, a sharper curvature of the oval increases the fieldstrength. When a certain field strength is reached, the equilibrium of surface ten-sion and electrostatic forces becomes independent of the curvature's radius, andmathematically, the radius could become zero. However, in a real system infinite

11.3 Ion Formation 453
field strength is impossible. Instead, at the moment the critical electric fieldstrength is reached, the Taylor cone instantaneously forms and immediately startsejecting a fine jet of liquid from its apex towards the counter electrode. [64] Thismode of operation is termed cone-jet mode. [5] The jet carries a large excess ofions of one particular charge sign, because it emerges from the point of highestcharge density, i.e., from the cone's tip. However, such a jet cannot remain stablefor an elongated period, but breaks up into small droplets. Due to their charge,these droplets are driven away from each other by Coulombic repulsion. Overall,this process causes the generation of a fine spray, and thus gave rise to the termelectrospray (Figs. 11.11 and 11.12).
11.3.2 Disintegration of Charged Droplets
When a micrometer-sized droplet carrying a large excess of ions of one particularcharge sign – some 104 charges are a realistic value – evaporates some solvent, thecharge density on its surface is continuously increased. As soon as electrostaticrepulsion exceeds the conservative force of surface tension, disintegration of thedroplet into smaller sub-units will occur. The point at which this occurs is knownas Rayleigh limit. [38] Originally, it has been assumed that the droplets would thensuffer a Coulomb fission (or Coulomb explosion). This process should occur re-peatedly to generate increasingly smaller microdoplets. While the model of a cas-cading reduction in size holds valid, more recent work has demonstrated that themicrodroplets do not explode, but eject a series of much smaller microdropletsfrom an elongated end (Fig. 11.13). [49,79,80] The ejection from an elongated endcan be explained by deformation of the flying microdroplets, i.e., they have no
Fig. 11.13. Illustration of droplet jet fission. The average number of charges on a droplet,the radii of the droplets [µm], and the timescale of events are assigned. The inset shows adrawing of droplet jet fission based on an actual flash microphotograph. Reproduced fromRef. [49] by permission of the authors.

454 11 Electrospray Ionization
perfect spherical shape. Thus, the charge density on their surface is not homoge-neous, but significantly increased in the region of sharper curvature. The smalleroffspring droplets carry off only about 1–2 % of the mass, but 10–18 % of thecharge of the parent droplet. [79] This process resembles the initial ejection of ajet from the Taylor cone. The concept of this so-called droplet jet fission is notonly based on theoretical considerations but can be proven by flash microphoto-graphs. [80,81] The total series of events from the initially sprayed droplet to theisolated ion takes less than one millisecond.
11.3.3 Formation of Ions from Charged Droplets
The elder model of ion formation, the charged-residue model (CRM), assumes thecomplete desolvation of ions by successive loss of all solvent molecules fromdroplets that are sufficiently small to contain just one analyte molecule in the endof a cascade of Coulomb fissions. [9,42,84] The charges (protons) of this ultimatedroplet are then transferred onto the molecule. This would allow that even largeprotein molecules can form singly charged ions, and indeed, CRM is supported bythis fact. [23]
A later theory, the ion evaporation model (IEM), [82,83] describes the forma-tion of desolvated ions as direct evaporation from the surface of highly chargedmicrodroplets. [85] (Ion evaporation is also discussed in FD-MS, Chap. 8.5.1).Ionic solvation energies are in the range of 3–6 eV, but thermal energy can onlycontribute about 0.03 eV at 300 K to their escape from solution. Thus, the electricforce has to provide the energy needed. It has been calculated that a field of109 V m–1 is required for ion evaporation which corresponds to a final droplet di-ameter of 10 nm. [83] The IEM corresponds well to the observation that the num-ber of charges is related to the fraction of the microdroplet's surface that a mole-cule can cover. As the radius diminishes, molecule size and number of dropletcharges remain constant; however, the spacing of the surface charges decreases,and thus the increasing charge density brings more charges within the reach of ananalyte molecule. [86,87] Flat and planar molecules therefore exhibit higher aver-age charge states than spheric ones, e.g., the unfolding of proteins is accompaniedby higher charge states under identical ESI conditions. [88,89]
Example: The cleavage of disulfide bonds by reduction with 1,4-dithiothreitolcauses the unfolding of the protein. This exposes additional basic sites to protona-tion, and therefore results in higher average charge states in the corresponding ESIspectrum (Fig. 11.14). [88]
Further support of IEM comes from the effect of the droplet evaporation rate onthe charge state distribution of proteins. Fast evaporation (more drying gas, highertemperature) favors higher average charge states, while slower evaporation resultsin fewer charges. This is in accordance with the reduced time available for ionevaporation from the shrinking droplet leading to a relative enrichment of chargeon the droplet and thus on the leaving ions. [86]

11.4 Charge Deconvolution 455
Fig. 11.14. Positive-ion ESI spectra of (a) hen egg white lysozyme and (b) the protein afteraddition of 1,4-dithiothreitol. Reproduced from Ref. [88] by permission. © AmericanChemical Society, 1990.
On the contrary, it may be argued that the electric field strength locally neces-sary to evaporate ions from a droplet cannot be attained because of the prior fis-sion of the droplet due to crossing the Rayleigh limit. [23,90]
More recent work revealed the importance of gas phase proton transfer reac-tions. [91-94] This implies that multiply charged peptide ions do not exist as pre-formed ions in solution, but are generated by gas phase ion-ion reactions(Chap. 11.4.4). The proton exchange is driven by the difference in proton affinities(PA, Chap. 2.11) of the species encountered, e.g., a protonated solvent moleculeof low PA will protonate a peptide ion with some basic sites left. Under equilib-rium conditions, the process would continue until the peptide ion is “saturated”with protons, a state that also marks its maximum number of charges.
Note: There is a continuing debate about ion formation in ESI. [79,87,95] Insummary, it may be assumed that CRM holds valid for large molecules [9]while the formation of smaller ions is better described by IEM. [79,95]
11.4 Charge Deconvolution
11.4.1 Problem of Multiple Charging
The discussion of ion formation in ESI has revealed that the appearance of an ESIspectrum can largely be influenced by the actual experimental conditions as de-fined by the pH of the sprayed solution, the flow of nebulizing or drying gas, andthe temperature of these or of a desolvation capillary. In particular, the degree of

456 11 Electrospray Ionization
multiple charging is affected by those parameters, and of course, by the compoundclass under study (also cf. Figs. 11.1 and 11.14). In addition, insufficient sprayingconditions (like the use of a nebulizer) can lead to a net lack of protons which re-duces the achievable charge state due to the limited number of protons available.
Example: The average charge state of a protein depends on whether it is dena-tured or not and on the actual solvent; lower pH causes more protons to be at-tached to the protein than neutral conditions. The degree of denaturization in turndepends on the pH of the electrosprayed solution. Resulting conformationalchanges of the protein, e.g., unfolding upon protonation, make additional basicsites accessible, thereby effecting an increase of the average charge state(Fig. 11.15.) [89] The maximum number of charges that can be placed upon pep-tide and protein molecules can clearly be related to the number of basic aminoacid residues (arginine, lysine, histidine) present in the molecule (Fig. 11.16). [88]
Fig. 11.15. Positive-ion ESI mass spectra of cytochrome c at different pH of the sprayedsolution: (a) at pH 2.6, (b) at pH 5.2. Adapted from Ref. [89] by permission. © AmericanChemical Society, 1990.
Fig. 11.16. Correlation between the number of basic amino acid residues and the maximumnumber of charges observed for a set of peptides and proteins under ESI conditions. Repro-duced from Ref. [88] by permission. © American Chemical Society, 1990.

11.4 Charge Deconvolution 457
Example: In case of synthetic polymers, multiple charging causes the simulta-neous occurrence of several interfering ion series each of them representing themolecular weight distribution of the polymer. [87] Whereas low-mass polyethyl-ene glycol exhibits only singly charged ions, PEGs of higher mass form doubly,triply, and multiply charged ions under ESI conditions (Fig. 11.17). [2] Further-more, those charge distributions depend on the concentration of the sample, e.g.,PEG 1450 yields triply and few doubly charged ions at 0.005 mg ml–1 inMeOH : H2O = 1 : 1, triply and doubly charged ions of equal abundance plus fewsingly charged ions at 0.05 mg ml–1, but mainly doubly charged ions accompaniedby few singly and triply charged ions at 0.5 mg ml–1. [87] This demonstrates that acomparatively fixed number of charges in a droplet is distributed among few ormany analytes molecules contained and thus supports IEM. PEGs and relatedcompounds form [M+alkalin]
n+ ions. [2,96,97]
Fig. 11.17. Positive-ion ESI spectra of different PEGs at 0.05 mg ml–1. (a) PEG 400 yieldssingly charged ions, (b) PEG 1000 forms singly and doubly charged ions, (c) withPEG 1450 the charge states 2+ and 3+ predominate over 1+, and (d) with PEG 3500 thespectrum is a complex superimposition of charge states 6+ to 2+. Reproduced from Ref. [2]by permission. © American Association for the Advancement of Science, 1989.
In general, the number of charges on a molecule in ESI depends on its molecularweight [9,98] and on the number of sites available for charge localization, e.g.,sites that can be protonated, [1,9,88,89] cationized, [97] or deprotonated. [99,100]On one hand, this behavior is advantageous as it folds up the m/z scale and makeseven extremely large molecules accessible to standard mass analyzers(Fig. 11.18). On the other hand, this produces a confusingly large number of peaksand requires tools to deal with in order to enable reliable mass assignments of un-known samples.
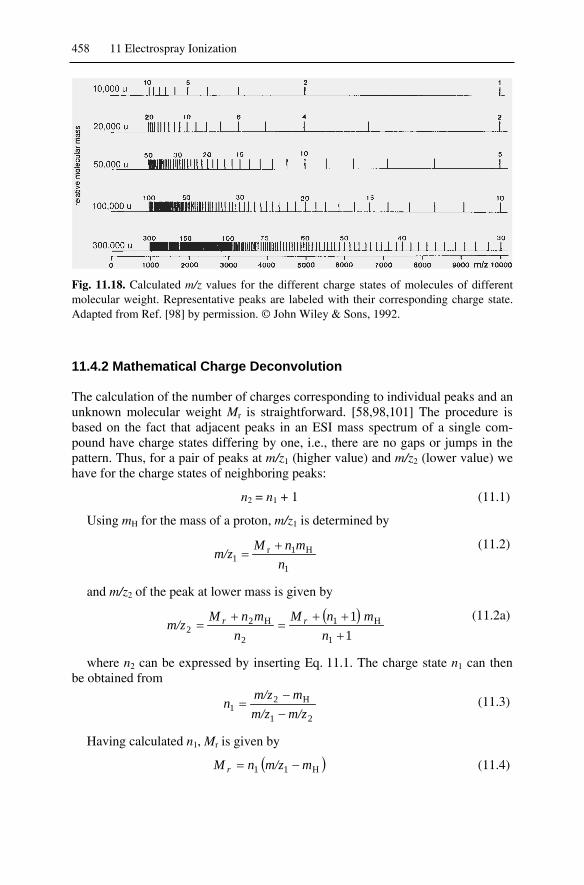
458 11 Electrospray Ionization
Fig. 11.18. Calculated m/z values for the different charge states of molecules of differentmolecular weight. Representative peaks are labeled with their corresponding charge state.Adapted from Ref. [98] by permission. © John Wiley & Sons, 1992.
11.4.2 Mathematical Charge Deconvolution
The calculation of the number of charges corresponding to individual peaks and anunknown molecular weight Mr is straightforward. [58,98,101] The procedure isbased on the fact that adjacent peaks in an ESI mass spectrum of a single com-pound have charge states differing by one, i.e., there are no gaps or jumps in thepattern. Thus, for a pair of peaks at m/z1 (higher value) and m/z2 (lower value) wehave for the charge states of neighboring peaks:
n2 = n1 + 1 (11.1)
Using mH for the mass of a proton, m/z1 is determined by
1
H1r1 n
mnMm/z(11.2)
and m/z2 of the peak at lower mass is given by
11
1
H1
2
H22 n
mnMn
mnMm/z rr (11.2a)
where n2 can be expressed by inserting Eq. 11.1. The charge state n1 can thenbe obtained from
21
H21 m/zm/z
mm/zn (11.3)
Having calculated n1, Mr is given by
H11 mm/znM r (11.4)

11.4 Charge Deconvolution 459
In case of cationization instead of protonation, mH has to be replaced by thecorresponding mass of the cationizing agent, e.g., NH4
+, Na+, or K+. (The recogni-tion of cationized species is addressed in Chap. 8.5.7).
Example: For the ease of calculation we use nominal mass (Chap. 3.1.4) andassume the charges from protonation. Consider the first peak at m/z 1001, the sec-ond at m/z 501. Now n1 is obtained according to Eq. 11.3 from n1 = (501 – 1) / (1001 – 501) = 500 / 500 = 1. Therefore, Mr is calculated from Eq. 11.4 to beMr = 1 (1001 – 1) = 1000. (The doubly protonated ion is detected at m/z 501 be-cause (1000 + 2) / 2 = 501.)
The above algorithm works well for pure compounds and simple mixtures, butit becomes increasingly difficult to assign all peaks properly when complex mix-tures are to be addressed. Additional problems arise from the simultaneous pres-ence of peaks due to protonation and alkali ion attachment etc. Therefore, numer-ous refined procedures have been developed to cope with these requirements.[102] Modern ESI instrumentation is normally equipped with elaborate softwarefor charge deconvolution.
Example: The ESI mass spectrum and the charge-deconvoluted molecularweights (inset) of bovine serum albumine (BSA) as obtained from a quadrupoleion trap instrument are compared below (Fig. 11.19). Ion series A belongs to thenoncovalent BSA dimer, series B results from the monomer. [24]
Fig. 11.19. Partial ESI mass spectrum of BSA and molecular weights after charge decon-volution (inset). Charge states are assigned to both series of peaks. Reproduced from Ref.[24] by permission. © John Wiley & Sons, 2000.
Note: As each pair of signals delivers an independent mass value for the hypo-thetical singly charged ion, mass accuracy can greatly be enhanced in ESI bymultiple determination of this value and subsequent calculation of the average.

460 11 Electrospray Ionization
11.4.3 Hardware Charge Deconvolution
The most effective technique to deal with complex spectra due to multiply chargedions is to achieve the full separation between signals corresponding to differentcharge states and to resolve their isotopic patterns. Beyond a molecular weight ofabout 2000 u this requires high-resolving mass analyzers.
Example: At molecular weights of some 103 u the isotopic distribution of or-ganic ions becomes several masses wide (Fig. 11.20). The minimum resolution forits full separation is always equal to the ion's mass number (Chaps. 3.3.4 and3.4.3). Lower resolution can only provide an envelope over the distribution. At in-sufficient resolution, the resulting peak may even be wider than the envelope. [98]
Fig. 11.20. Theoretical peak shape for a hypothetical singly charged protein ion ofMr = 15,300 at different settings of resolution. Reproduced from Ref. [98] by permission.© John Wiley & Sons, 1992.
Magnetic sector instruments (Chap. 4.3) were used first to demonstrate thebeneficial effects of resolution on ESI spectra of biomolecules. [96,103,104] Fou-rier transform ion cyclotron resonance (FT-ICR, Chap. 4.6) instruments followed.[105-107] The more recently developed orthogonal acceleration of time-of-flight(oaTOF, Chap. 4.2 and 4.7) analyzers also present an effective means to resolveall or at least most peaks. [108-110]
Example: ESI on a magnetic sector instrument set to R = 20,000 allows for thefull resolution of isotopic peaks in case of medium-molecular weight proteins(Fig. 11.21). This enables the direct determination of the charge state of the ionsfrom the spacing of the isotopic peaks, i.e., 11+ for the lysozyme ion due to theaverage spaces of m = 0.091 u and 13+ for the myoglobin ion due to
m = 0.077 u. In this particular case, the lysozyme [M+11H]11+ ion serves as amass reference for the accurate mass measurement of the “unknown“ [M+13H]13+
ion. [103]

11.4 Charge Deconvolution 461
Fig. 11.21. Partial high-resolution ESI spectrum (R = 20,000) of a mixture of lysozyme andmyoglobin. Reproduced from Ref. [103] by permission. © John Wiley & Sons, 1993.
11.4.4 Controlled Charge Reduction in ESI
The complexity of ESI spectra of mixtures where all components form series ofmultiply charged ions is apparent. An alternative approach to high resolution ispresented by the controlled reduction of the charge state of the ions. Charge re-duction electrospray (CRE) results in a significantly reduced number of peaks percomponent at the cost of their detection being required at substantially higher m/z.[111] The aforementioned oaTOF analyzers provide a sufficient mass range forsuch an experimental approach.
Charge reduction can be accomplished by neutralizing ion-molecule reactionsduring the desolvation step of ESI. The reducing ions needed for such neutraliza-tions can either be generated by irradiating the gas with a 210Po -particle source[111,112] or more conveniently by a corona discharge. [113,114] Besides beingnonradiative, the corona discharge offers the advantage of being tunable toachieve varying degrees of neutralization (Fig. 11.22). [113,114]
Ion-ion chemistry of oppositely charged ions presents another approach tocharge reduction and charge state determination. [91] Such studies were done i) byemploying the region preceding the skimmer of an ESI interface as a flow reactorand ii) inside a quadrupole ion trap. In the first case, both the substrate ion and theoppositely charged reactant ion are created by means of two separate ESI sprayersattached to a common interface. [115] The approach in a quadrupole ion trapmakes use of the in-trap generation of proton-transferring reactant ions, while sub-strate ions are admitted via the ESI interface. [116]

462 11 Electrospray Ionization
Fig. 11.22. Positive-ion ESI mass spectra of cytochrome c (a) under standard ESI condi-tions from acidic solution, (b) same but with medium setting of charge-reducing coronadischarge. Adapted from Ref. [113] by permission. © American Chemical Society, 2000.
11.5 Applications of ESI
ESI is not only a versatile tool for any aspects of peptide and protein characteriza-tion including their complete sequencing, it also offers numerous other fields ofapplication [5,17] some of which are highlighted below.
11.5.1 ESI of Small Molecules
Polar analytes in the m/z 100–1500 range are often involved in pharmaceuticalanalytics including metabolism studies. The types of ions formed are various anddepend on the ion polarity, the pH of the solution, the presence of salts, and theconcentration of the sprayed solution. Multiply charged ions are rarely observed.
Example: The compound below (Fig. 11.23) represents the functional part ofan effective drug (BM 50.0341) inhibiting HIV-1 infection by suppression of theunfolding of the gp120 glycoprotein. Its positive-ion nanoESI spectrum fromethanol in the presence of ammonium chloride exhibits signals due to the forma-tion of [M+H]+, [M+NH4]
+, and [M+Na]+ ions. In addition, cluster ions of the type[2M+H]+, [2M+NH4]
+, and [2M+Na]+ are observed. In negative-ion mode, the[M–H]– ion is accompanied by [M+Cl]– [117] and [M+EtO]– adduct ions; the cor-responding cluster ion series is also observed.
11.5.2 ESI of Metal Complexes
In general, ESI can be well applied to ionic metal complexes and related com-pounds if these are soluble to at least 10–6 M in solvents suitable for the method.[18,19] Whether conventional or nanoESI should be employed basically depends
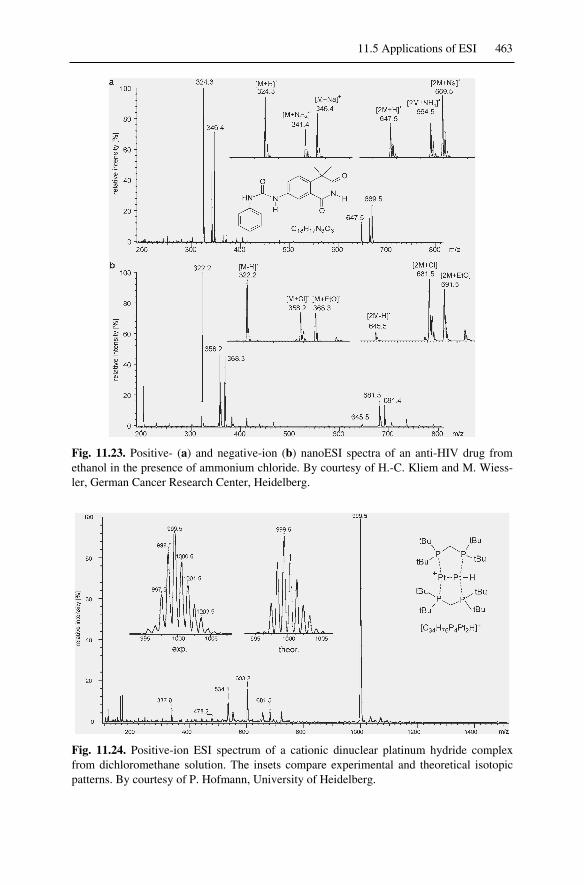
11.5 Applications of ESI 463
Fig. 11.23. Positive- (a) and negative-ion (b) nanoESI spectra of an anti-HIV drug fromethanol in the presence of ammonium chloride. By courtesy of H.-C. Kliem and M. Wiess-ler, German Cancer Research Center, Heidelberg.
Fig. 11.24. Positive-ion ESI spectrum of a cationic dinuclear platinum hydride complexfrom dichloromethane solution. The insets compare experimental and theoretical isotopicpatterns. By courtesy of P. Hofmann, University of Heidelberg.

464 11 Electrospray Ionization
on the tendency of the respective compounds towards decomposition. Labile com-plexes or compounds that are strongly adhesive to surfaces are preferably ana-lyzed by nanoESI to avoid long-lasting contamination of the sample supply line.Illustrative examples in this field are presented by the application of ESI to iso-poly metal oxyanions, [22], polyphosphates, [118] transition metal complexes(Fig. 11.24), [20,119,120] and cadmium sulfide clusters. [121] Furthermore, thegas phase reactions of electrosprayed metal complexes can be directly examinedby tandem MS techniques (Chap. 2.12.3). [21,122,123]
11.5.3 ESI of Surfactants
Surfactants belong to a group of products where a low price is crucial, and there-fore they are usually synthesized from coarsely defined mineral oil fractions orvegetable oils both of which represent (sometimes complex) mixtures (Fig. 11.25).Cationic and anionic surfactants are readily detected by ESI, but it also serves wellfor the detection of non-ionic surfactants which tend to form [M+alkali]+ or[M–H]– ions, respectively. [124-128]
Fig. 11.25. Negative-ion ESI spectrum of an industrial cooling lubricant dissolved 1 : 1000in 1-propanol. The dominant ions belong to alkylbenzene sulfonates. The inset expands them/z 420–555 range, the most intensive peaks belonging to saturated alkyl chains. By cour-tesy of OMTEC GmbH, Eberbach.
11.5.4 Oligonucleotides, DNA, and RNA
Oligonucleotides, DNA, and RNA are best analyzed by negative-ion ESI. WhileMALDI becomes difficult beyond oligonucleotide 20-mers, ESI can handle muchlarger molecules. [129-131] Sequencing by ESI-MS/MS techniques is also possi-ble. [129,131] However, the problems associated with the multiple exchange ofprotons versus alkali ions remain (Chap. 10.5.5). Instead of ion exchange beads,nitrogen bases have proven very helpful in removing alkali ions from solutions.

11.6 Atmospheric Pressure Chemical Ionization 465
[132] In particular the addition of 25 mM imidazole and piperidine yields veryclean spectra (Fig. 11.26). [133]
Fig. 11.26. Negative-ion ESI spectrum of the oligonucleotide dT10 in the presence of imi-dazole and piperidine. Here, H+/Na+ exchange is not completely suppressed. By courtesy ofT. Krüger, University of Heidelberg.
11.5.5 ESI of Oligosaccharides
Oligosaccharides [50,70,134,135] as well as closely related compounds such asglycoproteins, [69,136] gangliosides, [137] liposaccharides etc. are similar to oli-gonucleotides in that they require polar solvents and very soft ionization, in par-ticular when the molecules are branched. As demonstrated by a large number ofapplications, ESI permits molecular weight determination and structure elucida-tion in these cases (Fig. 11.27; for a general fragmentation scheme cf.Chap. 10.5.4). [5,13,14,17]
11.6 Atmospheric Pressure Chemical Ionization
In atmospheric pressure chemical ionization (APCI) ion-molecule reactions oc-curring at atmospheric pressure are employed to generate the ions, i.e., it repre-sents a high-pressure version of conventional chemical ionization (CI, Chap. 7).The CI plasma is maintained by a corona discharge between a needle and thespray chamber serving as the counter electrode. The ions are transferred into themass analyzer by use of the same type of vacuum interface as employed in ESI.Therefore, ESI ion sources can easily be switched to APCI: instead of an ESIsprayer, a unit comprising a heated pneumatic nebulizer and the spray chamberwith the needle electrode are put in front of the orifice, while the atmosphericpressure-to-vacuum interface remains unchanged. [48,138]

466 11 Electrospray Ionization
Fig. 11.27. (a) NanoESI-CID-MS/MS spectrum of the [M–H]– ion, m/z 2246.9, of a modi-fied nonasaccharide obtained in a Q-TOF hybrid instrument and (b) proposed structure withfragments indicated. Reproduced from Ref. [137] by permission. © Elservier Science,2001.
The significant enhancement of ion formation by a corona discharge as com-pared to a 63Ni source has already been implemented in early API sources.[139,140] The nature of the APCI plasma varies widely as both solvent and nebu-lizing gas contribute to the composition of the CI plasma, i.e., APCI spectra canresemble PICI, CECI, NICI, or EC spectra (Chap. 7.2–7.4) depending on the ac-tual conditions and ion polarity. This explains why APCI conditions suffer fromcomparatively low reproducibility as compared to other ionization methods.
It is the great advantage of APCI that it – different from ESI – actively gener-ates ions from neutrals. Thus, APCI makes low- to medium-polarity analyteseluting from a liquid chromatograph accessible for mass spectrometry. In contrastto its development as an ionization method, the application of APCI has a backlogbehind ESI. The use of APCI rapidly grew in the mid-1990, perhaps because
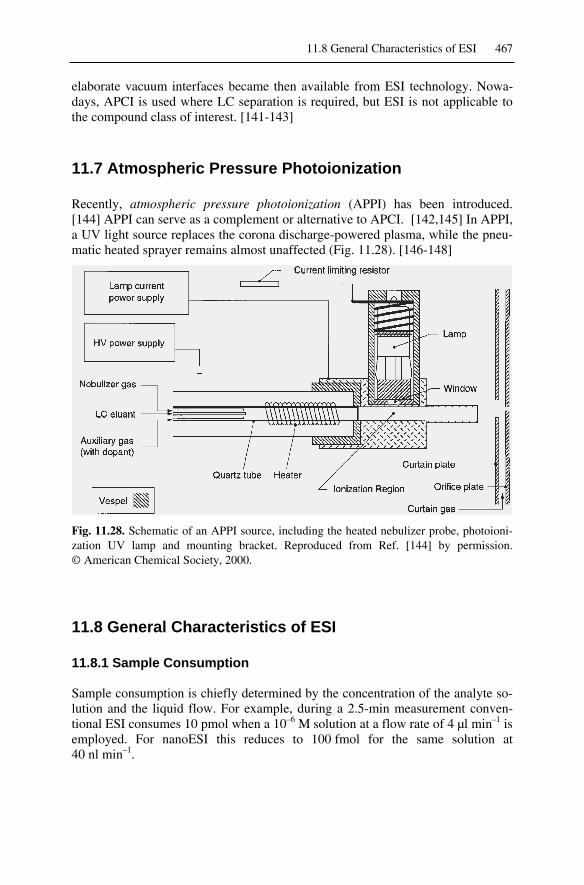
11.8 General Characteristics of ESI 467
elaborate vacuum interfaces became then available from ESI technology. Nowa-days, APCI is used where LC separation is required, but ESI is not applicable tothe compound class of interest. [141-143]
11.7 Atmospheric Pressure Photoionization
Recently, atmospheric pressure photoionization (APPI) has been introduced.[144] APPI can serve as a complement or alternative to APCI. [142,145] In APPI,a UV light source replaces the corona discharge-powered plasma, while the pneu-matic heated sprayer remains almost unaffected (Fig. 11.28). [146-148]
Fig. 11.28. Schematic of an APPI source, including the heated nebulizer probe, photoioni-zation UV lamp and mounting bracket. Reproduced from Ref. [144] by permission.© American Chemical Society, 2000.
11.8 General Characteristics of ESI
11.8.1 Sample Consumption
Sample consumption is chiefly determined by the concentration of the analyte so-lution and the liquid flow. For example, during a 2.5-min measurement conven-tional ESI consumes 10 pmol when a 10–6 M solution at a flow rate of 4 µl min–1 isemployed. For nanoESI this reduces to 100 fmol for the same solution at40 nl min–1.

468 11 Electrospray Ionization
11.8.2 Types of Ions in ESI
Very similar to the previously introduced desorption methods ESI produces a va-riety of ions depending on the polarity of the analyte, the characteristics of thesolvent, and on the presence or absence of impurities such as alkali metal ions.Radical ions are normally not observed. (Table 11.1).
Table 11.1. Ions formed by ESI
Analytes Positive Ions Negative Ions
non-polar [M+H]+, [M+alkali]+ if any [M–H]–, [M+A]– if any
medium tohighpolarity
[M+H]+, [M+alkali]+
exchange [M–Hn+alkalin+1]+
{clusters [2M+H]+, [2M+alkali]+,adducts [M+solv+H]+, [M+solv+alkali]+}b
[M–H]–, [M+A]–
exchange [M–Hn+alkalin–1]–
{clusters [2M–H]–
adducts [M+solv–H]–}
ionica C+, [Cn+An–1]+ A–, [Cn–1+An]
–
a Comprising cation C+ and anion A–.b Enclosure in parentheses denotes less abundant species.
11.8.3 Mass Analyzers for ESI
ESI ion sources are offered in combination with all types of mass analyzers, i.e.,one is essentially free to choose any mass analyzer according to the analytical re-quirements or to upgrade an existing instrument with an ESI interface(Chap. 11.4.3). As fragment ions in ESI are often absent or exhibit very low inten-sity, MS/MS capability of the mass analyzer is beneficial.
Reference List
1. Amad, M.H.; Cech, N.B.; Jackson, G.S.;Enke, C.G. Importance of Gas-Phase Pro-ton Affinities in Determining the ESI Re-sponse for Analytes and Solvents. J. MassSpectrom. 2000, 35, 784-789.
2. Fenn, J.B.; Mann, M.; Meng, C.K.; Wong,S.F.; Whithouse, C.M. ESI for MS ofLarge Biomolecules. Science 1989, 246,64-71.
3. Fenn, J.B.; Mann, M.; Meng, C.K.; Wong,S.F. Electrospray Ionization - Principlesand Practice. Mass Spectrom. Rev. 1990,9, 37-70.
4. Smith, R.D.; Loo, J.A.; Edmonds, C.G.;Barinaga, C.J.; Udseth, H.R. New Devel-
opments in Biochemical MS: ESI. Anal.Chem. 1990, 62, 882-899.
5. Electrospray Ionization Mass Spectrome-try - Fundamentals, Instrumentation andApplications; 1st ed.; Dole, R.B., editor;John Wiley & Sons: Chichester, 1997.
6. Fenn, J.B. Electrospray: Wings for Mo-lecular Elephants (Nobel Lecture). Angew.Chem., Int. Ed. 2003, 42, 3871-3894.
7. Fuerstenau, S.D.; Benner, W.H. MolecularWeight Determination of MegadaltonDNA Electrospray Ions Using ChargeDetection Time-of-Flight-MS. RapidCommun. Mass Spectrom. 1995, 9, 1528-1538.

Reference List 469
8. Fuerstenau, S.D.; Benner, W.H.; Thomas,J.J.; Brugidou, C.; Bothner, B.; Suizdak,G. Mass Spectrometry of an Intact Virus.Angew. Chem., Int. Ed. 2001, 40, 541-544.
9. Felitsyn, N.; Peschke, M.; Kebarle, P. Ori-gin and Number of Charges Observed onMultiply-Protonated Native Proteins Pro-duced by ESI. Int. J. Mass Spectrom.2002, 219, 39-62.
10. Mass Spectrometry in Drug Discovery;Rossi, D.T.; Sinz, M.W., editors; MarcelDekker: New York, 2002.
11. Modern Mass Spectrometry; Schalley,C.A., editor; Springer: New York, 2003.
12. Ardrey, R.E. Liquid Chromatography-Mass Spectrometry - An Introduction;John Wiley & Sons: Chichester, 2003.
13. Siuzdak, G. The Expanding Role of MassSpectrometry in Biotechnology; MCCPress: San Diego, 2003.
14. Lehmann, W.D. Massenspektrometrie inder Biochemie; Spektrum AkademischerVerlag: Heidelberg, 1996.
15. Roboz, J. Mass Spectrometry in CancerResearch; 1st ed.; CRC Press: BocaRaton, 1999.
16. Mass Spectrometry of Proteins and Pep-tides; Chapman, J.R., editor; HumanaPress: Totowa, 2000.
17. Applied Electrospray Mass Spectrometry;Pramanik, B.N.; Ganguly, A.K.; Gross,M.L., editors; Marcel Dekker: New York,2002.
18. Colton, R.; D'Agostino, A.; Traeger, J.C.ESI-MS Applied to Inorganic and Or-ganometallic Chemistry. Mass Spectrom.Rev. 1995, 14, 79-106.
19. Traeger, J.C. ESI-MS of OrganometallicCompounds. Int. J. Mass Spectrom. 2000,200, 387-401.
20. Poon, G.K.; Bisset, G.M.F.; Mistry, P.ESI-MS for Analysis of Low-Molecular-Weight Anticancer Drugs and Their Ana-logs. J. Am. Soc. Mass Spectrom. 1993, 4,588-595.
21. Hinderling, C.; Feichtinger, D.; Plattner,D.A.; Chen, P. A Combined Gas-Phase,Solution-Phase, and Computational Studyof C-H Activation by Cationic Iridium(III)Complexes. J. Am. Chem. Soc. 1997, 119,10793-10804.
22. Truebenbach, C.S.; Houalla, M.; Hercules,D.M. Characterization of Isopoly MetalOxyanions Using ESI Time-of-Flight-MS.J. Mass Spectrom. 2000, 35, 1121-1127.
23. Winger, B.E.; Light-Wahl, K.J.; Ogor-zalek Loo, R.R.; Udseth, H.R.; Smith,
R.D. Observation and Implications ofHigh Mass-to-Charge Ratio Ions FromESI-MS. J. Am. Soc. Mass Spectrom.1993, 4, 536-545.
24. Wang, Y.; Schubert, M.; Ingendoh, A.;Franzen, J. Analysis of Non-CovalentProtein Complexes Up to 290 KDa UsingESI and Ion Trap-MS. Rapid Commun.Mass Spectrom. 2000, 14, 12-17.
25. Sobott, F.; Hernández, H.; McCammon,M.G.; Tito, M.A.; Robinson, C.V. A Tan-dem Mass Spectrometer for ImprovedTransmission and Analysis of Large Mac-romolecular Assemblies. Anal. Chem.2002, 74, 1402-1407.
26. Horning, E.C.; Horning, M.G.; Carroll,D.I.; Dzidic, I.; Stillwell, R.N. New Pico-gram Detection System Based on a MassSpectrometer With an External IonizationSource at Atmospheric Pressure. Anal.Chem. 1973, 45, 936-943.
27. Horning, E.C.; Carroll, D.I.; Dzidic, I.;Haegele, K.D.; Horning, M.G.; Stillwell,R.N. Atmospheric Pressure Ionization(API) MS. Solvent-Mediated Ionization ofSamples Introduced in Solution and in aLiquid Chromatograph Effluent Stream. J.Chromatogr. Sci. 1974, 12, 725-729.
28. Carroll, D.I.; Dzidic, I.; Stillwell, R.N.;Horning, M.G.; Horning, E.C. Subpico-gram Detection System for Gas PhaseAnalysis Based Upon Atmospheric Pres-sure Ionization (API) MS. Anal. Chem.1974, 46, 706-704.
29. Blakley, C.R.; Carmody, J.J.; Vestal, M.L.A New Soft Ionization Technique for MSof Complex Molecules. J. Am. Chem. Soc.1980, 102, 5931-5933.
30. Blakley, C.R.; Vestal, M.L. ThermosprayInterface for Liquid Chromatogra-phy/Mass Spectrometry. Anal. Chem.1983, 55, 750-754.
31. Vestal, M.L. Studies of Ionization Mecha-nisms Involved in Thermospray LC-MS.Int. J. Mass Spectrom. Ion Phys. 1983, 46,193-196.
32. Wilkes, J.G.; Freeman, J.P.; Heinze, T.M.;Lay, J.O., Jr.; Vestal, M.L. AC Corona-Discharge Aerosol-Neutralization DeviceAdapted to Liquid Chromatogra-phy/Particle Beam/Mass Spectrometry.Rapid Commun. Mass Spectrom. 1995, 9,138-142.
33. Vestal, M.L. High-Performance LiquidChromatography-Mass Spectrometry. Sci-ence 1984, 226, 275-281.
470 11 Electrospray Ionization
34. Evans, C.A., Jr.; Hendricks, C.D. Electro-hydrodynamic Ion Source for the MS ofLiquids. Rev. Sci. Inst. 1972, 43, 1527-1530.
35. Simons, D.S.; Colby, B.N.; Evans, C.A.,Jr. Electrohydrodynamic Ionization-MS.Ionization of Liquid Glycerol and Non-volatile Organic Solutes. Int. J. MassSpectrom. Ion Phys. 1974, 15, 291-302.
36. Zeleny, J. Instability of Electrified LiquidSurfaces. Phys. Rev. 1917, 10, 1-7.
37. Taylor, G.I. Disintegration of Water Dropsin an Electric Field. Proc. Royal Soc. Lon-don A 1964, 280, 383-397.
38. Lord Rayleigh On the Equilibrium of Liq-uid Conducting Masses Charged WithElectricity. London, Edinburgh, DublinPhil. Mag. J. Sci. 1882, 14, 184-186.
39. Dülcks, T.; Röllgen, F.W. Ionization Con-ditions and Ion Formation in Electrohy-drodynamic MS. Int. J. Mass Spectrom.Ion Proc. 1995, 148, 123-144.
40. Dülcks, T.; Röllgen, F.W. Ion Source forElectrohydrodynamic MS. J. Mass Spec-trom. 1995, 30, 324-332.
41. Cook, K.D. Electrohydrodynamic MS.Mass Spectrom. Rev. 1986, 5, 467-519.
42. Dole, M.; Mack, L.L.; Hines, R.L.; Mo-bley, R.C.; Ferguson, L.D.; Alice, M.B.Molecular Beams of Macroions. J. Chem.Phys. 1968, 49, 2240-2249.
43. Dole, M.; Hines, R.L.; Mack, L.L.; Mo-bley, R.C.; Ferguson, L.D.; Alice, M.B.Gas Phase Macroions. Macromolecules1968, 1, 96-97.
44. Gieniec, J.; Mack, L.L.; Nakamae, K.;Gupta, C.; Kumar, V.; Dole, M. ESI MassSpectroscopy of Macromolecules: Appli-cation of an Ion-Drift Spectrometer. Bio-med. Mass Spectrom. 1984, 11, 259-268.
45. Yamashita, M.; Fenn, J.B. ESI Ion Source.Another Variation on the Free-Jet Theme.J. Phys. Chem. 1984, 88, 4451-4459.
46. Yamashita, M.; Fenn, J.B. Negative IonProduction With the ESI Ion Source. J.Phys. Chem. 1984, 88, 4671-4675.
47. Whitehouse, C.M.; Robert, R.N.; Yama-shita, M.; Fenn, J.B. ESI Interface for Liq-uid Chromatographs and Mass Spec-trometers. Anal. Chem. 1985, 57, 675-679.
48. Bruins, A.P. Mass Spectrometry With IonSources Operating at Atmospheric Pres-sure. Mass Spectrom. Rev. 1991, 10, 53-77.
49. Kebarle, P.; Tang, L. From Ions in Solu-tion to Ions in the Gas Phase - the Mecha-
nism of ESI-MS. Anal. Chem. 1993, 65,972A-986A.
50. Karas, M.; Bahr, U.; Dülcks, T. Nano-ESI-MS: Addressing Analytical Problems Be-yond Routine. Fresenius J. Anal. Chem.2001, 366, 669-676.
51. Anacleto, J.F.; Pleasance, S.; Boyd, R.K.Calibration of Ion Spray Mass SpectraUsing Cluster Ions. Org. Mass Spectrom.1992, 27, 660-666.
52. Hop, C.E.C.A. Generation of High Mo-lecular Weight Cluster Ions by ESI; Impli-cations for Mass Calibration. J. MassSpectrom. 1996, 31, 1314-1316.
53. Kantrowitz, A.; Grey, J. High IntensitySource for the Molecular Beam. I. Theo-retical. Rev. Sci. Inst. 1951, 22, 328-332.
54. Fenn, J.B. Mass Spectrometric Implica-tions of High-Pressure Ion Sources. Int. J.Mass Spectrom. 2000, 200, 459-478.
55. Ikonomou, M.G.; Kebarle, P. A HeatedESI Source in Mass Spectrometry forAnalytes From Aqueous Solutions. J. Am.Soc. Mass Spectrom. 1994, 5, 791-799.
56. Bruins, A.P.; Covey, T.R.; Henion, J.D.Ion Spray Interface for Combined LiquidChromatography/Atmospheric PressureIonization-MS. Anal. Chem. 1987, 59,2642-2646.
57. Covey, T.R.; Bruins, A.P.; Henion, J.D.Comparison of Thermospray and IonSpray-MS in an Atmospheric Pressure IonSource. Org. Mass Spectrom. 1988, 23,178-186.
58. Covey, T.R.; Bonner, R.F.; Shushan, B.I.;Henion, J.D. The Determination of Pro-tein, Oligonucleotide, and Peptide Mo-lecular Weights by Ion-Spray-MS. RapidCommun. Mass Spectrom. 1988, 2, 249-256.
59. Ikonomou, M.G.; Blades, A.T.; Kebarle,P. ESI - Ion Spray: a Comparison ofMechanisms and Performance. Anal.Chem. 1991, 63, 1989-1998.
60. Banks, J.F., Jr.; Quinn, J.P.; Whitehouse,C.M. LC/ESI-MS Determination of Pro-teins Using Conventional Liquid Chro-matography and Ultrasonically AssistedESI. Anal. Chem. 1994, 66, 3688-3695.
61. Banks, J.F., Jr.; Shen, S.; Whitehouse,C.M.; Fenn, J.B. Ultrasonically AssistedESI for LC/MS Determination of Nucleo-sides From a Transfer RNA Digest. Anal.Chem. 1994, 66, 406-414.
62. Smith, R.D.; Barinaga, C.J.; Udseth, H.R.Improved ESI Interface for Capillary Zone

Reference List 471
Electrophoresis-Mass Spectrometry. Anal.Chem. 1988, 60, 1948-1952.
63. Abian, J. The Coupling of Gas and LiquidChromatography With Mass Spectrome-try. J. Mass Spectrom. 1999, 34, 157-168.
64. Wilm, M.S.; Mann, M. Electrospray andTaylor-Cone Theory, Dole's Beam ofMacromolecules at Last? Int. J. MassSpectrom. Ion Proc. 1994, 136, 167-180.
65. Wilm, M.; Mann, M. Analytical Propertiesof the NanoESI Ion Source. Anal. Chem.1996, 68, 1-8.
66. Wilm, M.; Shevshenko, A.; Houthaeve, T.;Breit, S.; Schweigerer, L.; Fotsis, T.;Mann, M. Femtomole Sequencing of Pro-teins From Polyacrylamide Gels by Nano-ESI-MS. Nature 1996, 379, 466-469.
67. Juraschek, R.; Dülcks, T.; Karas, M.NanoESI - More Than Just a Minimized-Flow ESI Source. J. Am. Soc. Mass Spec-trom. 1999, 10, 300-308.
68. Smith, R.D.; Loo, J.A.; Barinaga, C.J.;Edmonds, C.G.; Udseth, H.R. CollisionalActivation and Collision-Activated Disso-ciation of Large Multiply Charged Poly-peptides and Proteins Produced by ESI. J.Am. Soc. Mass Spectrom. 1990, 1, 53-65.
69. Harvey, D.J. Collision-Induced Fragmen-tation of Underivatized N-Linked Carbo-hydrates Ionized by ESI. J. Mass Spec-trom. 2000, 35, 1178-1190.
70. Schmidt, A.; Bahr, U.; Karas, M. Influ-ence of Pressure in the First PumpingStage on Analyte Desolvation and Frag-mentation in Nano-ESI MS. Anal. Chem.2001, 71, 6040-6046.
71. Jedrzejewski, P.T.; Lehmann, W.D. De-tection of Modified Peptides in EnzymaticDigests by Capillary Liquid Chromatogra-phy/ESI-MS and a Programmable Skim-mer CID Acquisition Routine. Anal.Chem. 1997, 69, 294-301.
72. Weinmann, W.; Stoertzel, M.; Vogt, S.;Svoboda, M.; Schreiber, A. Tuning Com-pounds for ESI/in-Source Collision-Induced Dissociation and Mass SpectraLibrary Searching. J. Mass Spectrom.2001, 36, 1013-1023.
73. Huddleston, M.J.; Bean, M.F.; Carr, S.A.Collisional Fragmentation of Glycopep-tides by ESI LC/MS and LC/MS/MS:Methods for Selective Detection of Glyco-peptides in Protein Digests. Anal. Chem.1993, 65, 877-884.
74. Chen, H.; Tabei, K.; Siegel, M.M. Bio-polymer Sequencing Using a Triple Quad-rupole Mass Spectrometer in the ESI Noz-
zle-Skimmer/Precursor Ion MS/MS Mode.J. Am. Soc. Mass Spectrom. 2001, 12, 846-852.
75. Miao, X.-S.; Metcalfe, C.D. Determinationof Carbamazepine and Its Metabolites inAqueous Samples Using Liquid Chroma-tography-ESI Tandem-MS. Anal. Chem.2003, 75, 3731-3738.
76. Gross, J.H.; Eckert, A.; Siebert, W. Nega-tive-Ion ESI Mass Spectra of Carbon Di-oxide-Protected N-Heterocyclic Anions. J.Mass Spectrom. 2002, 37, 541-543.
77. de la Mora, J.F.; Van Berkel, G.J.; Enke,C.G.; Cole, R.B.; Martinez-Sanchez, M.;Fenn, J.B. Electrochemical Processes inESI-MS. J. Mass Spectrom. 2000, 35, 939-952.
78. Van Berkel, G.J. Electrolytic Depositionof Metals on to the High-Voltage Contactin an ESI Emitter: Implications for Gas-Phase Ion Formation. J. Mass Spectrom.2000, 35, 773-783.
79. Cole, R.B. Some Tenets Pertaining to ESI-MS. J. Mass Spectrom. 2000, 35, 763-772.
80. Gomez, A.; Tang, K. Charge and Fissionof Droplets in Electrostatic Sprays. Phys.Fluids 1994, 6, 404-414.
81. Duft, D.; Achtzehn, T.; Müller, R.; Huber,B.A.; Leisner, T. Coulomb Fission. Ray-leigh Jets From Levitated Microdroplets.Nature 2003, 421, 128.
82. Iribarne, J.V.; Thomson, B.A. On theEvaporation of Small Ions From ChargedDroplets. J. Chem. Phys. 1976, 64, 2287-2294.
83. Thomson, B.A.; Iribarne, J.V. Field-Induced Ion Evaporation From Liquid Sur-faces at Atmospheric Pressure. J. Chem.Phys. 1979, 71, 4451-4463.
84. Mack, L.L.; Kralik, P.; Rheude, A.; Dole,M. Molecular Beams of Macroions. II. J.Chem. Phys. 1970, 52, 4977-4986.
85. Labowsky, M.; Fenn, J.B.; de la Mora, J.F.A Continuum Model for Ion EvaporationFrom a Drop: Effect of Curvature andCharge on Ion Solvation Energy. Anal.Chim. Acta 2000, 406, 105-118.
86. Fenn, J.B. Ion Formation From ChargedDroplets: Roles of Geometry, Energy, andTime. J. Am. Soc. Mass Spectrom. 1993, 4,524-535.
87. Fenn, J.B.; Rosell, J.; Meng, C.K. In ESI,How Much Pull Does an Ion Need to Es-cape Its Droplet Prison? J. Am. Soc. MassSpectrom. 1997, 8, 1147-1157.
88. Loo, J.A.; Edmonds, C.G.; Udseth, H.R.;Smith, R.D. Effect of Reducing Disulfide-
472 11 Electrospray Ionization
Containing Proteins on ESI Mass Spectra.Anal. Chem. 1990, 62, 693-698.
89. Chowdhury, S.K.; Katta, V.; Chait, B.T.Probing Conformational Changes in Pro-teins by-MS. J. Am. Chem. Soc. 1990, 112,9012-9013.
90. Schmelzeisen-Redeker, G.; Bütfering, L.;Röllgen, F.W. Desolvation of Ions andMolecules in Thermospray-MS. Int. J.Mass Spectrom. Ion Proc. 1989, 90, 139-150.
91. Williams, E.R. Proton Transfer Reactivityof Large Multiply Charged Ions. J. MassSpectrom. 1996, 31, 831-842.
92. Iavarone, A.T.; Jurchen, J.C.; Williams,E.R. Supercharged Protein and PeptideIons Formed by ESI. Anal. Chem. 2001,73, 1455-1460.
93. Iavarone, A.T.; Williams, E.R. Super-charging in ESI: Effects on Signal andCharge. Int. J. Mass Spectrom. 2002, 219,63-72.
94. Iavarone, A.T.; Williams, E.R. Mechanismof Charging and Supercharging Moleculesin ESI. J. Am. Chem. Soc. 2003, 125,2319-2327.
95. Kebarle, P. A Brief Overview of the Pres-ent Status of the Mechanisms Involved inESI-MS. J. Mass Spectrom. 2000, 35, 804-817.
96. Cody, R.B.; Tamura, J.; Musselman, B.D.ESI/Magnetic Sector Mass Spectrometry:Calibration, Resolution, and AccurateMass Measurements. Anal. Chem. 1992,64, 1561-1570.
97. Saf, R.; Mirtl, C.; Hummel, K. ESI-MSUsing Potassium Iodide in Aprotic Or-ganic Solvents for the Ion Formation byCation Attachment. Tetrahedron Lett.1994, 35, 6653-6656.
98. Chapman, J.R.; Gallagher, R.T.; Barton,E.C.; Curtis, J.M.; Derrick, P.J. Advan-tages of High-Resolution and High-MassRange Magnetic-Sector Mass Spectrome-try for ESI. Org. Mass Spectrom. 1992,27, 195-203.
99. Cole, R.B.; Harrata, A.K. Solvent Effecton Analyte Charge State, Signal Intensity,and Stability in Negative Ion ESI-MS; Im-plications for the Mechanism of NegativeIon Formation. J. Am. Soc. Mass Spec-trom. 1993, 4, 546-556.
100. Straub, R.F.; Voyksner, R.D. Negative IonFormation in ESI-MS. J. Am. Soc. MassSpectrom. 1993, 4, 578-587.
101. Mann, M.; Meng, C.K.; Fenn, J.B. Inter-preting Mass Spectra of Multiply ChargedIons. Anal. Chem. 1989, 61, 1702-1708.
102. Labowsky, M.; Whitehouse, C.M.; Fenn,J.B. Three-Dimensional Deconvolution ofMultiply Charged Spectra. Rapid Com-mun. Mass Spectrom. 1993, 7, 71-84.
103. Dobberstein, P.; Schroeder, E. AccurateMass Determination of a High MolecularWeight Protein Using ESI With a Mag-netic Sector Instrument. Rapid Commun.Mass Spectrom. 1993, 7, 861-864.
104. Haas, M.J. Fully Automated Exact MassMeasurements by High-Resolution ESI ona Sector Instrument. Rapid Commun. MassSpectrom. 1999, 13, 381-383.
105. Hofstadler, S.A.; Griffey, R.H.; Pasa-Tolic, R.; Smith, R.D. The Use of a StableInternal Mass Standard for Accurate MassMeasurements of Oligonucleotide Frag-ment Ions Using ESI Fourier TransformIon Cyclotron Resonance-MS With Infra-red Multiphoton Dissociation. RapidCommun. Mass Spectrom. 1998, 12, 1400-1404.
106. Cooper, H.J.; Marshall, A.G. ESI FourierTransform Mass Spectrometric Analysisof Wine. J. Agric. Food Chem. 2001, 49,5710-5718.
107. Stenson, A.C.; Landing, W.M.; Marshall,A.G.; Cooper, W.T. Ionization and Frag-mentation of Humic Substances in ESIFourier Transform-Ion Cyclotron Reso-nance-MS. Anal. Chem. 2002, 74, 4397-4409.
108. Coles, J.; Guilhaus, M. Orthogonal Accel-eration - a New Direction for Time-of-Flight-MS: Fast, Sensitive Mass Analysisfor Continuous Ion Sources. Trends Anal.Chem. 1993, 12, 203-213.
109. Guilhaus, M. The Return of Time-of-Flight to Analytical-MS. Adv. Mass Spec-trom. 1995, 13, 213-226.
110. Guilhaus, M.; Selby, D.; Mlynski, V. Or-thogonal Acceleration Time-of-Flight-MS.Mass Spectrom. Rev. 2000, 19, 65-107.
111. Scalf, M.; Westphall, M.S.; Krause, J.;Kaufmann, S.L.; Smith, L.M. ControllingCharge States of Large Ions. Science 1999,283, 194-197.
112. Scalf, M.; Westphall, M.S.; Smith, L.M.Charge Reduction ESI-MS. Anal. Chem.2000, 72, 52-60.
113. Ebeling, D.D.; Westphall, M.S.; Scalf, M.;Smith, L.M. Corona Discharge in ChargeReduction ESI-MS. Anal. Chem. 2000, 72,5158-5161.

Reference List 473
114. Ebeling, D.D.; Scalf, M.; Westphall, M.S.;Smith, L.M. A Cylindrical Capacitor Ioni-zation Source: Droplet Generation andControlled Charge Reduction for MS.Rapid Commun. Mass Spectrom. 2001, 15,401-405.
115. McLuckey, S.A.; Stephenson, J.L., Jr.Ion/Ion Chemistry of High-Mass MultiplyCharged Ions. Mass Spectrom. Rev. 1998,17, 369-407.
116. Herron, W.J.; Goeringer, D.E.; McLuckey,S.A. Product Ion Charge State Determina-tion Via Ion/Ion Proton Transfer Reac-tions. Anal. Chem. 1996, 68, 257-262.
117. Zhu, J.; Cole, R.B. Formation and Decom-positions of Chloride Adduct Ions,[M+Cl]-, in Negative Ion ESI-MS. J. Am.Soc. Mass Spectrom. 2000, 11, 932-941.
118. Choi, B.K.; Hercules, D.M.; Houalla, M.Characterization of Polyphosphates byESI-MS. Anal. Chem. 2000, 72, 5087-5091.
119. Favaro, S.; Pandolfo, L.; Traldi, P. TheBehavior of [Pt( 3-Allyl)XP(C6H5)3]Complexes in ESI Conditions ComparedWith Those Achieved by Other IonizationMethods. Rapid Commun. Mass Spectrom.1997, 11, 1859-1866.
120. Feichtinger, D.; Plattner, D.A. DirectProof for MnV-Oxo-Salen Complexes.Angew. Chem. ,Int. Ed. 1997, 36, 1718-1719.
121. Løver, T.; Bowmaker, G.A.; Henderson,W.; Cooney, R.P. ESI-MS of Some Cad-mium Thiophenolate Complexes and of aThiophenolate Capped CdS Cluster.Chem. Commun. 1996, 683-685.
122. Reid, G.E.; O'Hair, R.A.J.; Styles, M.L.;McFadyen, W.D.; Simpson, R.J. GasPhase Ion-Molecule Reactions in a Modi-fied Ion Trap: H/D Exchange of Non-Covalent Complexes and CoordinativelyUnsaturated Platinum Complexes. RapidCommun. Mass Spectrom. 1998, 12,1701-1708.
123. Volland, M.A.O.; Adlhart, C.; Kiener,C.A.; Chen, P.; Hofmann, P. CatalystScreening by ESI Tandem-MS: HofmannCarbenes for Olefin Metathesis. Chem. -Eur. J. 2001, 7, 4621-4632.
124. Jewett, B.N.; Ramaley, L.; Kwak, J.C.T.Atmospheric Pressure Ionization-MSTechniques for the Analysis of Alkyl Eth-oxysulfate Mixtures. J. Am. Soc. MassSpectrom. 1999, 10, 529-536.
125. Benomar, S.H.; Clench, M.R.; Allen,D.W. The Analysis of Alkylphenol Eth-
oxysulphonate Surfactants by HPLC, LC-ESI-MS and MALDI-MS. Anal. Chim.Acta 2001, 445, 255-267.
126. Eichhorn, P.; Knepper, T.P. ESI MassSpectrometric Studies on the AmphotericSurfactant Cocamidopropylbetaine. J.Mass Spectrom. 2001, 36, 677-684.
127. Levine, L.H.; Garland, J.L.; Johnson, J.V.HPLC/ESI-Quadrupole Ion Trap-MS forCharacterization and Direct Quantificationof Amphoteric and Nonionic Surfactantsin Aqueous Samples. Anal. Chem. 2002,74, 2064-2071.
128. Barco, M.; Planas, C.; Palacios, O.;Ventura, F.; Rivera, J.; Caixach, J. Simul-taneous Quantitative Analysis of Anionic,Cationic, and Nonionic Surfactants inWater by ESI-MS With Flow InjectionAnalysis. Anal. Chem. 2003, 75, 5179-5136.
129. Little, D.P.; Chorush, R.A.; Speir, J.P.;Senko, M.W.; Kelleher, N.L.; McLafferty,F.W. Rapid Sequencing of Oligonucleo-tides by High-Resolution-MS. J. Am.Chem. Soc. 1994, 116, 4893-4897.
130. Limbach, P.A.; Crain, P.F.; McCloskey,J.A. Molecular Mass Measurement of In-tact Ribonucleic Acids Via ESI Quad-rupole MS. J. Am. Soc. Mass Spectrom.1995, 6, 27-39.
131. Little, D.P.; Thannhauser, T.W.; McLaf-ferty, F.W. Verification of 50- to 100-MerDNA and RNA Sequences With High-Resolution-MS. Proc. Natl. Acad. Sci. U.S. A. 1995, 92, 2318-2322.
132. De Bellis, G.; Salani, G.; Battaglia, C.;Pietta, P.; Rosti, E.; Mauri, P. ESI-MS ofSynthetic Oligonucleotides Using 2-Propanol and Spermidine. Rapid Commun.Mass Spectrom. 2000, 14, 243-249.
133. Greig, M.; Griffey, R.H. Utility of OrganicBases for Improved ESI-MS of Oligonu-cleotides. Rapid Commun. Mass Spectrom.1995, 9, 97-102.
134. Pfenninger, A.; Karas, M.; Finke, B.;Stahl, B. Structural Analysis of Un-derivatized Neutral Human Milk Oligo-saccharides in the Negative Ion Mode byNano-ESI MSn (Part 1: Methodology). J.Am. Soc. Mass Spectrom. 2002, 13, 1331-1340.
135. Pfenninger, A.; Karas, M.; Finke, B.;Stahl, B. Structural Analysis of Un-derivatized Neutral Human Milk Oligo-saccharides in the Negative Ion Mode byNano-ESI MSn (Part 2: Application to

474 11 Electrospray Ionization
Isomeric Mixtures). J. Am. Soc. MassSpectrom. 2002, 13, 1341-1348.
136. Weiskopf, A.S.; Vouros, P.; Harvey, D.J.ESI-Ion Trap-MS for Structural Analysisof Complex N-Linked Glycoprotein Oli-gosaccharides. Anal. Chem. 1998, 70,4441-4447.
137. Metelmann, W.; Peter-Katalinic, J.;Müthing, J. Gangliosides From HumanGranulocytes: a Nano-ESI QTOF-MS Fu-cosylation Study of Low Abundance Spe-cies in Complex Mixtures. J. Am. Soc.Mass Spectrom. 2001, 12, 964-973.
138. Tsuchiya, M. Atmospheric Pressure IonSources, Physico-Chemical and AnalyticalApplications. Adv. Mass Spectrom. 1995,13, 333-346.
139. Carroll, D.I.; Dzidic, I.; Stillwell, R.N.;Haegele, K.D.; Horning, E.C. Atmos-pheric Pressure Ionization-MS. CoronaDischarge Ion Source for Use in a LiquidChromatograph-Mass Spectrometer-Computer Analytical System. Anal. Chem.1975, 47, 2369-2373.
140. Dzidic, I.; Stillwell, R.N.; Carroll, D.I.;Horning, E.C. Comparison of PositiveIons Formed in Nickel-63 and CoronaDischarge Ion Sources Using Nitrogen,Argon, Isobutane, Ammonia and NitricOxide As Reagents in Atmospheric Pres-sure Ionization-MS. Anal. Chem. 1976, 48,1763-1768.
141. Mottram, H.; Woodbury, S.E.; Evershed,R.P. Identification of TriacylglycerolPositional Isomers Present in VegetableOils by High Performance Liquid Chro-matography/Atmospheric Pressure Chemi-cal Ionization-MS. Rapid Commun. MassSpectrom. 1997, 11, 1240-1252.
142. Hayen, H.; Karst, U. Strategies for theLiquid Chromatographic-Mass Spectro-metric Analysis of Non-Polar Compounds.J. Chromatogr. A 2003, 1000, 549-565.
143. Reemtsma, T. Liquid Chromatography-Mass Spectrometry and Strategies forTrace-Level Analysis of Polar OrganicPollutants. J. Chromatogr. A 2003, 1000 ,477-501.
144. Robb, D.B.; Covey, T.R.; Bruins, A.P.Atmospheric Pressure Photoionization: anIonization Method for Liquid Chromatog-raphy-Mass Spectrometry. Anal. Chem.2000, 72, 3653-3659.
145. Keski-Hynnilä, H.; Kurkela, M.; Elovaara,E.; Antonio, L.; Magdalou, J.; Luukkanen,L.; Taskinen, J.; Koistiainen, R. Compari-son of ESI, Atmospheric Pressure Chemi-
cal Ionization, and Atmospheric PressurePhotoionization in the Identification ofApomorphine, Dobutamine, and Entaca-pone Phase II Metabolites in BiologicalSamples. Anal. Chem. 2002, 74, 3449-3457.
146. Yang, C.; Henion, J.D. Atmospheric Pres-sure Photoionization Liquid Chroma-tographic-Mass Spectrometric Determina-tion of Idoxifene and Its Metabolites inHuman Plasma. J. Chromatogr. A 2002,970, 155-165.
147. Kauppila, T.J.; Kuuranne, T.; Meurer,E.C.; Eberlin, M.N.; Kotiaho, T.; Koisti-ainen, R. Atmospheric Pressure Photoioni-zation-MS. Ionization Mechanism and theEffect of Solvent on the Ionization ofNaphthalenes. Anal. Chem. 2002, 74,5470-5479.
148. Raffaeli, A.; Saba, A. Atmospheric Pres-sure Photoionization-MS. Mass Spectrom.Rev. 2003, 22, 318-331.

12 Hyphenated Methods
The analysis of complex mixtures particularly requires the combination of bothseparation techniques and mass spectrometry. [1-3] The first step in this directionwas made by gas chromatography-mass spectrometry coupling (GC-MS), [4] andsoon, GC-MS became a routine method. [5-7] The desire to realize a liquid chro-matography-mass spectrometry coupling (LC-MS) [8,9] was the driving force forthe development of API methods (Chap. 11). [10-13] Coupling of other liquidphase separation techniques to mass spectrometry followed: capillary zone elec-trophoresis-mass spectrometry (CZE-MS), [14-18] and supercritical fluid chro-matography-mass spectrometry (SFC-MS). [19-23] Whatever the separation tech-nique, it adds an additional dimension to the analytical measurement. The hyphenused to indicate the coupling of a separation technique to mass spectrometry led tothe term hyphenated methods.
However, mass spectrometry itself offers two additional “degrees of freedom”.One can either resolve the complexity of a sample by going to high or even ultra-high mass resolution or one can employ tandem MS techniques to separate thefragmentation pattern of a single component from that of others in a mixture. [2,3]In practice, the coupling of separation techniques to mass spectrometry is oftencombined with advanced MS techniques to achieve the desired level of accuracyand reliability of analytical information. [1,7,24-27]
This chapter is about extending the range of samples that can be analyzed bymass spectrometry and about increasing the specificity of analytical informationthereof. It briefly explains the basic concepts and methodologies such as handlingof chromatograms, quantitation, as well as GC and LC interfaces.
12.1 General Properties of Chromatography-MassSpectrometry Coupling
Chromatographic detectors such as the flame ionization detector (FID), frequentlyemployed in GC, deliver a chromatogram that represents the mass flow elutingfrom the chromatographic column. Using a mass spectrometer instead, offers anadded dimension of information, e.g., the mass spectra associated to any of theeluting components or other more selective means of target compound identifica-tion. Regardless of the separation method employed, there are some basic tech-niques in common to operate the mass spectrometer.

476 12 Hyphenated Methods
Fig. 12.1. TIC and RICs (m/z 167, 181, 333, and 403) obtained from an EC-GC-MS runfrom a plasma sample spiked with 4-HNE. [32] (The EC spectrum of the 4-HNE derivativeis show in Fig. 12.2.)
Note: The abscissa of the TIC or RIC can either be plotted on the time scale,i.e., in units of seconds or minutes, or be labeled with scan numbers. Scannumbers are useful during data processing, while the time scale is better suitedfor comparison with other chromatography-mass spectrometry data.

12.1 General Properties of Chromatography-Mass Spectrometry Coupling 477
12.1.1 Chromatograms and Spectra
A widespread mode of chromatography-mass spectrometry operation is to repeti-tively scan the mass analyzer over the m/z range of interest during the chroma-tographic run. [28-30] This generates a relationship between chromatogram andmass spectra of the eluting components. The conventional chromatogram is thenreplaced by the total ion chromatogram (TIC, Chap. 5.4.1). Knowledgeable hand-ling of the TIC and suitable reconstructed ion chromatograms (RICs, Chap. 5.4.2)[30] presents the key to the effective assignment of chromatographic peaks to tar-get compounds.
Example: 4-Hydroxynon-2-enal (4-HNE) is a major aldehydic product of lipidperoxidation (LPO), its products being indicators for oxidative stress. In order tointroduce LPO products as biomarkers a GC-MS method for 4-HNE detection inclinical studies [31] was developed using a sample volume of 50 µl of plasma. Forimproved GC separation and subsequent mass spectral detection the aldehyde isconverted into the pentafluorbenzyl-hydroxylimine and the hydroxy group is tri-methylsilylated. [32] The TIC acquired in negative-ion electron capture mode(EC, Chap. 7.4) exhibits 50 chromatographic peaks (Fig. 12.1). Those related tothe target compounds can easily be identified from suitable RICs. The choice ofpotentially useful m/z values for RICs is made from the EC mass spectrum of thepure 4-HNE derivative (below). In this case, [M–HF]–•, m/z 403, [M–HOSiMe3]
–•,m/z 333, and [C6F5]
–, m/z 167, are indicative, while [CH2C6F5]–, m/z 181, is not.
When a GC-MS experiment is performed in the repetitive scanning mode, eachpoint of the TIC corresponds to a full mass spectrum. The time for the acquisitionof a mass spectrum has to be shorter than the time to elute a component from thechromatographic column. In capillary GC-MS, this requires scan cycle times inthe order of one second, i.e., a single chromatogram is represented by a set ofabout a thousand mass spectra. Nonetheless, the concentration of the eluting com-ponents still varies rapidly in time as compared to the time for a scan cycle. Thisaffects the relative intensities of mass spectral peaks, i.e., high-mass ions are em-phasized in an upwards mass scan at the onset of elution, but are underrepresentedwhen elution fades out (Fig. 12.2). Averaging or accumulation of the scans con-tributing to a specific chromatographic peak compensates for that source of error.Additional background subtraction can substantially improve the signal-to-noiseratio (Chap. 5.2.3.) of the final spectrum. [29]
Note: High-quality mass spectra suitable for interpretation and/or data basesearch (Chap. 5.7) are only obtained from summing/averaging plus subsequentbackground subtraction. Particularly for components of low concentration thevalue of background subtraction cannot be overestimated.
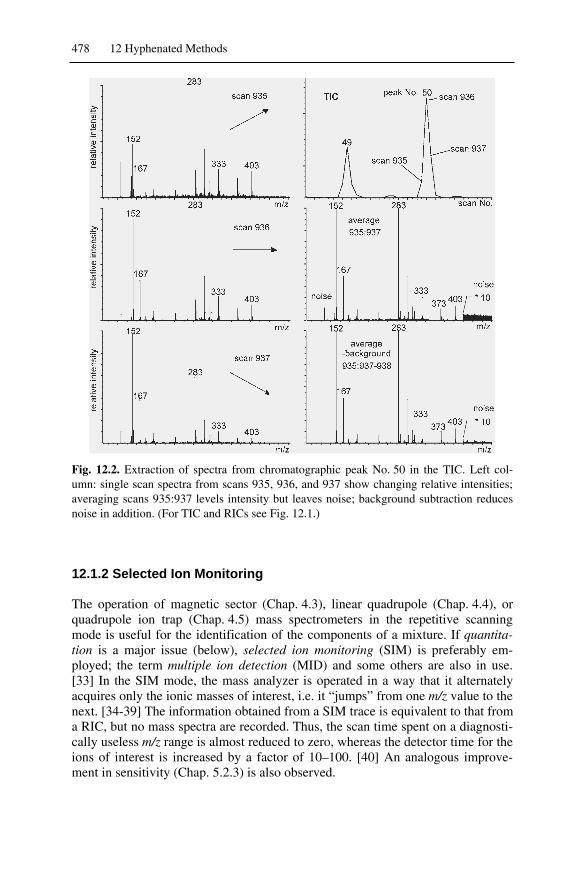
478 12 Hyphenated Methods
Fig. 12.2. Extraction of spectra from chromatographic peak No. 50 in the TIC. Left col-umn: single scan spectra from scans 935, 936, and 937 show changing relative intensities;averaging scans 935:937 levels intensity but leaves noise; background subtraction reducesnoise in addition. (For TIC and RICs see Fig. 12.1.)
12.1.2 Selected Ion Monitoring
The operation of magnetic sector (Chap. 4.3), linear quadrupole (Chap. 4.4), orquadrupole ion trap (Chap. 4.5) mass spectrometers in the repetitive scanningmode is useful for the identification of the components of a mixture. If quantita-tion is a major issue (below), selected ion monitoring (SIM) is preferably em-ployed; the term multiple ion detection (MID) and some others are also in use.[33] In the SIM mode, the mass analyzer is operated in a way that it alternatelyacquires only the ionic masses of interest, i.e. it “jumps” from one m/z value to thenext. [34-39] The information obtained from a SIM trace is equivalent to that froma RIC, but no mass spectra are recorded. Thus, the scan time spent on a diagnosti-cally useless m/z range is almost reduced to zero, whereas the detector time for theions of interest is increased by a factor of 10–100. [40] An analogous improve-ment in sensitivity (Chap. 5.2.3) is also observed.

12.1 General Properties of Chromatography-Mass Spectrometry Coupling 479
As the monitored m/z values are selected to best represent the target compound,SIM exhibits high selectivity that can be further increased by high resolution SIM(HR-SIM) because this reduces isobaric interferences. [41-44] As HR-SIM re-quires precise and drift-free positioning on narrow peaks, one or several lockmasses are generally employed although rarely explicitly mentioned. [44,45] Therole of the lock mass is to serve as internal mass reference for accurate massmeasurement. (Examples are given below.)
Note: Normally, three to ten m/z values are monitored 20–100 ms each in a cy-cle. Some settling time is needed for the mass analyzer after switching to thenext value, e.g., 1–2 ms for pure electric scanning, 20–50 ms for a magnet scan.
12.1.3 Quantitation
Any ionization method exhibits compound-dependent ionization efficiencies(Chap. 2.4). Whether a specific compound is rather preferred or suppressed rela-tive to another greatly depends on the ionization process employed. This makes acareful calibration of the instrument's response versus the sample concentrationbecome prerequisite for reliable quantitation. [6,7]
12.1.3.1 Quantitation by External Standardization
External standardization is obtained by constructing a calibration curve, i.e., fromplotting measured intensities versus rising concentration of the target compound.Calibration curves are generally linear over a wide range of concentrations. Whenconcentration approaches the detection limit (Chap. 5.2.3) the graph deviates from
Fig. 12.3. General appearance of a calibration curve. The upper limit of the linear range isdefined by saturation, the lower by memory and chemical background or adsorption. In ad-dition, the noise level plays a role for the detection limit.

480 12 Hyphenated Methods
linearity, either towards underestimation or towards overestimation. Underestima-tion can be due to losses by adsorption, overestimation may either be due to“memory” from previous injections or result from chemical background. In the re-gime of high concentration, saturation of the detector or of the ion source cause anupper limit (Fig. 12.3). The preparation of a calibration curve requires repeatedmeasurements which can be very time-consuming in case of a slow chroma-tographic separation. In addition, drifts in instrument sensitivity, e.g., due to ionsource contamination, can deteriorate the quantitation result. Depending on the in-strument's dynamic range (Chap. 4.2.5), the range of linear response is in the orderof two to four orders of magnitude.
12.1.3.2 Quantitation by Internal Standardization
Internal standardization circumvents the effects of time-variant instrument re-sponse, but does not compensate for different ionization efficiencies of analyteand standard. For internal standardization, a compound exhibiting close similarityin terms of ionization efficiency and retention time is added to the sample at aknown level of concentration, e.g., an isomer eluting closely to the analyte or ahomologue may serve for that purpose. It is important to add the standard beforeany clean-up procedure in order not to alter the concentration of the analyte with-out affecting that of the standard. For reliable results, the relative concentration ofanalyte and standard should not differ by more than a factor of about ten.
12.1.3.3 Quantitation by Isotope Dilution
Identical or at least almost identical ionization efficiency (Chap. 2.4) for a pair ofcompounds is only given for isotopomers (Chap. 3.2.9). As these differ from thenonlabeled target compound in mass, they can be added to the mixture at knownconcentration to result in a special case of internal standardization. The relativeintensity of the corresponding peaks in the RICs or SIM traces is then taken as therelative concentration of labeled internal standard and target compound; hence theterm isotope dilution. [46]
Example: A potential drug and its metabolite in a liver sample are quantifiedby internal standardization with trideuterated standards for both compounds(Fig. 12.4). [25] Under these conditions it neither presents a problem that bothanalytes and their isotopic standards are almost co-eluting from the LC column,nor does the completely unspecific TIC play a role. If required for sensitivity rea-sons, this analysis could also have been performed in the SIM mode using the m/zvalues of the RICs shown.
Example: The number of m/z values to be monitored in SIM is limited. Suchlimitations are more severe when additional lock mass peaks have to be includedin case of HR-SIM. Therefore, it is commonplace to monitor different sets of SIMtraces during consecutive time windows leading to a sequence of different SIMsetups during a single chromatographic separation. The quantitation of halogen-
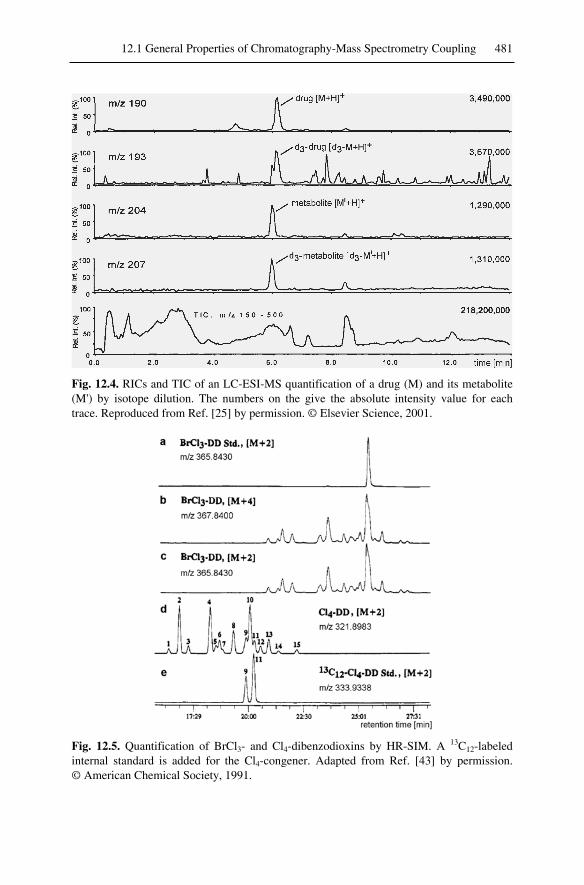
12.1 General Properties of Chromatography-Mass Spectrometry Coupling 481
Fig. 12.4. RICs and TIC of an LC-ESI-MS quantification of a drug (M) and its metabolite(M') by isotope dilution. The numbers on the give the absolute intensity value for eachtrace. Reproduced from Ref. [25] by permission. © Elsevier Science, 2001.
Fig. 12.5. Quantification of BrCl3- and Cl4-dibenzodioxins by HR-SIM. A 13C12-labeledinternal standard is added for the Cl4-congener. Adapted from Ref. [43] by permission.© American Chemical Society, 1991.

482 12 Hyphenated Methods
ated dibenzo-p-dioxins in municipal waste incinerator fly ash at concentrations inthe ppb to low-ppm range requires such a setup (Fig. 12.5). [43] Here, a combinedapproach of external standardization for the BrCl3-species and internal standardi-zation for the Cl4-species has been realized.
Note: According to the enormous usage of isotope dilution, 2H- (D) and 13C-labeled standards [47] are commercially available for a wide range of applica-tions. It is important not to select compounds with acidic hydrogens exchangedfor deuterons. Other restrictions for internal standards apply analogously.
12.1.3.4 Retention Times of Isotopomers
Isotopomers exhibit slightly different retention times in chromatography. Deuter-ated compounds, for example, elute from chromatographic columns at slightlyshorter retention times than their nonlabeled isotopomers. Normally, the differ-ence is less than the peak width of the corresponding chromatographic peaks, butis still large enough to require their integration over separate time windows(Fig. 12.6).
Fig. 12.6. Shorter retention times are observed for [D7]glucose than for glucose elutingfrom a SE30 GC column as demonstrated for three pairs of peaks. Reproduced from Ref.[35] by permission. © American Chemical Society, 1966.
12.2 Gas Chromatography-Mass Spectrometry
12.2.1 GC-MS Interfaces
In early GC-MS with packed GC columns eluting several tens of milliliters perminute most of the flow had to be separated before entering the ion source to pre-vent the vacuum system from breakdown. [4,29,34] This was either effected by asimple split to divide the effluent in front of the inlet system by a factor of about1 : 100 or by means of a more elaborate separator, the jet separator being the best

12.2 Gas Chromatography-Mass Spectrometry 483
known of those. [48,49] The advantage of separators over a simple split is the en-richment of the analyte relative to the carrier gas; in case of the jet separator thiseffect is based on a principle related to that of the nozzle-skimmer system in ESI(Chap. 11.2.1).
With the advent of capillary GC, [50-54] the need for separators and the con-comitant risk of suppression of certain components vanished. Capillary columnsare operated at flow rates in the order of 1 ml min–1, and therefore can be directlyinterfaced to EI/CI ion sources. [48,49] Thus, a modern GC-MS interface basicallyconsists of a heated (glass) line bridging the distance between GC oven and ionsource. On the ion source block, an entrance port often opposite to the direct probeis reserved for that purpose (Chap. 5.2.1). The interface should be operated at thehighest temperature employed in the actual GC separation or at the highest tem-perature the column can tolerate (200–300 °C). Keeping the transfer line at lowertemperature causes condensation of eluting components to the end of the column.
In contrast to sample introduction via direct probe (Chap. 5.3.1), the compo-nents eluting from a GC capillary are quantitatively transferred into the ion sourceduring a short time interval just sufficient to acquire about five mass spectra. Con-sequently, the partial pressure of the analyte is comparatively high during elutionallowing sample amounts in the low nanogram range to be analyzed by capillaryGC-MS.
12.2.2 Volatility and Derivatization
Gas chromatography requires a certain level of volatility and thermal robustnessof the analyte. Both injection block of the chromatograph and interface region arealways at high temperature even while the column oven is not. In order to adapt ananalyte to these needs, derivatization is well established, [55,56] the most frequentderivatization procedures being silylation, acetylation, methylation, and fluor-alkylation. As derivatization transforms XH groups into XSiR3, XC=OMe, XMe,or XCOCF3 groups, for example, polarity of the molecules largely decreases. Thiscauses an improved volatility even though the molecular weight increases uponderivatization. Derivatization suppresses thermal decomposition, e.g., it protectsalcohols from thermal dehydration. In particular fluoralkyl and fluoraryl groupsare extremely useful to improve detection limits in EC-MS. [32,57]
12.2.3 Column Bleed
Rising temperature of the GC column not only assists transport of less volatilecomponents, it also causes the slow release of the liquid phase from the inner wallof the capillary. As a result of slow thermal degradation, even chemically bondedliquid phases show such column bleed at elevated temperature. It is a characteris-tic of column bleed that it continuously rises as the temperature of the GC oven israised and it falls again upon cooling of the system. Of course, the peaks fromcolumn bleed observed in the mass spectrum depend on the liquid phase of the GC

484 12 Hyphenated Methods
capillary in use. In case of the frequently employed methyl-phenyl-siloxane liquidphases, abundant ions at m/z 73, 147, 207, 281, 355, 429, etc. are observed. Withinone series the peaks are 74 u (OSiMe2) distant. Fortunately, column bleed is easilyrecognized and can be removed by careful background subtraction. Similar back-ground ions are also obtained from septum bleed and silicon grease. [6,58]
Si
OSi
O
SiO
n+. +
n
Si
OSi
O
SiO
- CH3.
n = 1 m/z 207
n = 2 m/z 281
n = 3 m/z 355
n = 4 m/z 429
SiO
SiO
Si
n+.
.- CH3 + n
SiO
SiO
Si
n = 0 m/z 147
n = 1 m/z 221
n = 2 m/z 295
n = 3 m/z 369
Scheme 12.1.
Example: In the partial TIC obtained by GC-EI-MS of an unknown mixture ona HP-5 column the chromatographic peak at 32.6 min is rather weak (Fig. 12.7).Scan 2045 extracted from its maximum yields a spectrum that is mainly due tobackground ions from column bleed as demonstrated by comparison to the aver-age of scans 2068:2082. Finally, manual background subtraction ((2035:2052)-(2013:2020)) delivers a spectrum of reasonable quality, although some back-ground signals are not completely erased.
12.2.4 Fast GC-MS
When a high sample throughput is of importance, fast GC-MS offers a time-savingconcept for mixture analysis. [59-61] The GC separation can be accelerated by re-placing standard size (20–60 m 0.25–0.53 mm i.d.) capillary columns by shortnarrow-bore columns (2–5 m 50 µm i.d.) and by applying sufficient pressure (8–10 bar) and rapid heating (50–200 °C min–1). Thus, a conventional 30-min separa-tion is compressed into a 3-min or even shorter time frame. However, in fast GCthe half life of an eluting peak is too short for use with scanning quadrupole ormagnetic sector analyzers. In fast GC-MS, oaTOF analyzers (Chap. 4.2.6) aretypically employed because of their ability to acquire about a hundred spectra persecond. Furthermore, the high duty cycle of oaTOFs offsets the difference in sen-sitivity between repetitive scanning and SIM analysis. At somewhat lower rates,advanced oaTOF systems even enable accurate mass determination at reasonableaccuracy.

12.3 Liquid Chromatography-Mass Spectrometry 485
207281
268 34114773
193
21.4
23.3
28.2
30.9
32.6
scan 2045 at max. of peak at 32.6 min
scans 2068:2082 background207
193
281
341147267
73
211
scans (2035:2052)-(2013:2020)211
268
25318310673 77
341281167
M+.
[M-57]+
rela
tive
inte
nsity
rela
tive
inte
nsity
rela
tive
inte
nsity
rela
tive
inte
nsity
TIC
time [min]
m/z
m/z
m/z
35.1
37.9
Fig. 12.7. Partial TIC and three EI spectra obtained by GC-MS of an unknown mixture on a30-m HP-5 column. See text for discussion.
12.3 Liquid Chromatography-Mass Spectrometry
12.3.1 LC-MS Interfaces
Coupling of liquid chromatography to mass spectrometry has not only led to awide variety of interfaces, but also initiated the development of new ionizationmethods. [8-13,62] In retrospect, the moving belt interface seems rather a curiositythan a LC-interface. The LC effluent is deposited onto a metal wire or belt whichis heated thereafter to desolvate the sample. Then, the belt traverses a region of
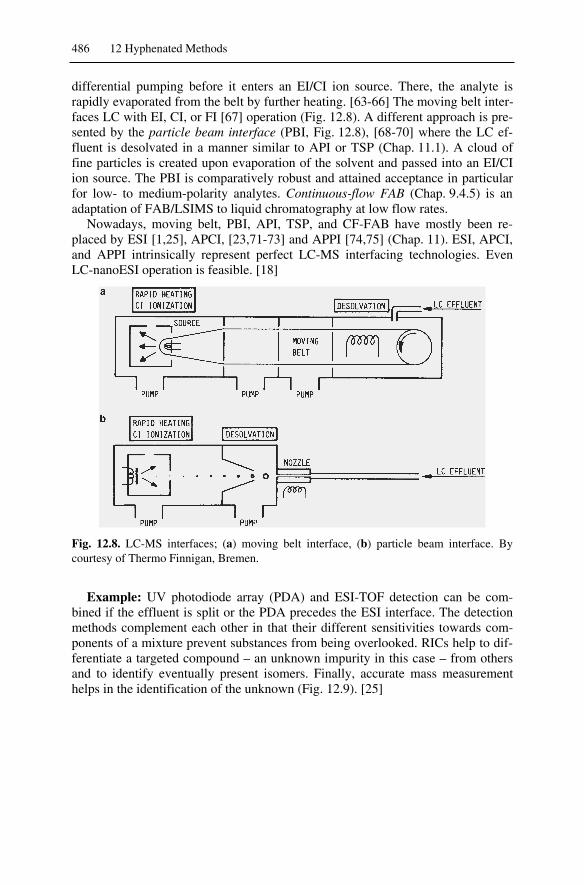
486 12 Hyphenated Methods
differential pumping before it enters an EI/CI ion source. There, the analyte israpidly evaporated from the belt by further heating. [63-66] The moving belt inter-faces LC with EI, CI, or FI [67] operation (Fig. 12.8). A different approach is pre-sented by the particle beam interface (PBI, Fig. 12.8), [68-70] where the LC ef-fluent is desolvated in a manner similar to API or TSP (Chap. 11.1). A cloud offine particles is created upon evaporation of the solvent and passed into an EI/CIion source. The PBI is comparatively robust and attained acceptance in particularfor low- to medium-polarity analytes. Continuous-flow FAB (Chap. 9.4.5) is anadaptation of FAB/LSIMS to liquid chromatography at low flow rates.
Nowadays, moving belt, PBI, API, TSP, and CF-FAB have mostly been re-placed by ESI [1,25], APCI, [23,71-73] and APPI [74,75] (Chap. 11). ESI, APCI,and APPI intrinsically represent perfect LC-MS interfacing technologies. EvenLC-nanoESI operation is feasible. [18]
Fig. 12.8. LC-MS interfaces; (a) moving belt interface, (b) particle beam interface. Bycourtesy of Thermo Finnigan, Bremen.
Example: UV photodiode array (PDA) and ESI-TOF detection can be com-bined if the effluent is split or the PDA precedes the ESI interface. The detectionmethods complement each other in that their different sensitivities towards com-ponents of a mixture prevent substances from being overlooked. RICs help to dif-ferentiate a targeted compound – an unknown impurity in this case – from othersand to identify eventually present isomers. Finally, accurate mass measurementhelps in the identification of the unknown (Fig. 12.9). [25]

12.3 Liquid Chromatography-Mass Spectrometry 487
Fig. 12.9. Liquid chromatograms (from top) by photodiode array detection, TIC and RICfrom ESI-MS and accurate mass measurement of one component. Adapted from Ref. [25]by permission. © Elsevier Science, 2001.
12.3.2 Multiplexed Electrospray Inlet Systems
Combinatorial chemistry and other high-throughput screening applications haveforced the development of multiplexed electrospray inlet systems (MUX). Up toeight chromatographs can be connected in parallel to a single mass spectrometerby means of a MUX interface (Fig. 12.10). [76,77] Similar to fast GC-MS, this re-quires a sufficiently high speed of spectral acquisition and a high sensitivity of theinstrument to compensate for the loss of sample by the alternating mode of opera-tion. [78]
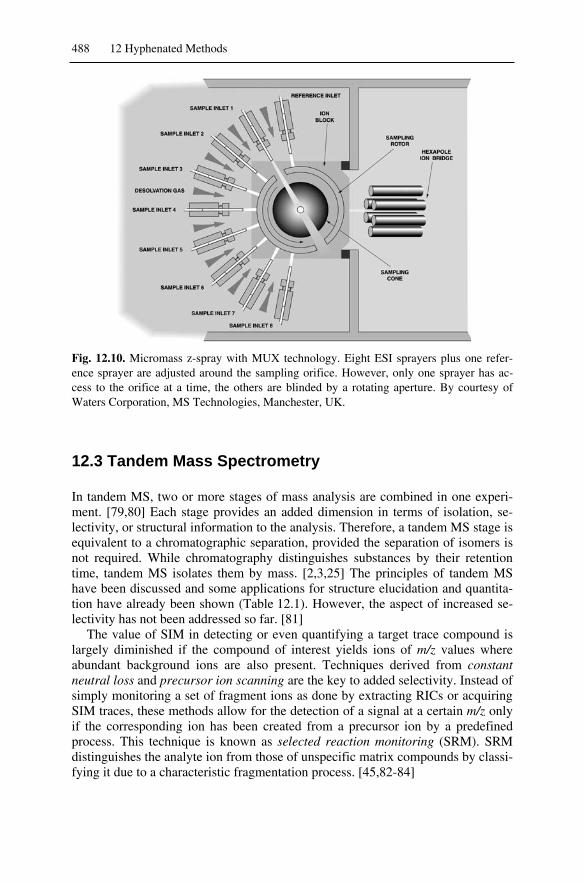
488 12 Hyphenated Methods
Fig. 12.10. Micromass z-spray with MUX technology. Eight ESI sprayers plus one refer-ence sprayer are adjusted around the sampling orifice. However, only one sprayer has ac-cess to the orifice at a time, the others are blinded by a rotating aperture. By courtesy ofWaters Corporation, MS Technologies, Manchester, UK.
12.3 Tandem Mass Spectrometry
In tandem MS, two or more stages of mass analysis are combined in one experi-ment. [79,80] Each stage provides an added dimension in terms of isolation, se-lectivity, or structural information to the analysis. Therefore, a tandem MS stage isequivalent to a chromatographic separation, provided the separation of isomers isnot required. While chromatography distinguishes substances by their retentiontime, tandem MS isolates them by mass. [2,3,25] The principles of tandem MShave been discussed and some applications for structure elucidation and quantita-tion have already been shown (Table 12.1). However, the aspect of increased se-lectivity has not been addressed so far. [81]
The value of SIM in detecting or even quantifying a target trace compound islargely diminished if the compound of interest yields ions of m/z values whereabundant background ions are also present. Techniques derived from constantneutral loss and precursor ion scanning are the key to added selectivity. Instead ofsimply monitoring a set of fragment ions as done by extracting RICs or acquiringSIM traces, these methods allow for the detection of a signal at a certain m/z onlyif the corresponding ion has been created from a precursor ion by a predefinedprocess. This technique is known as selected reaction monitoring (SRM). SRMdistinguishes the analyte ion from those of unspecific matrix compounds by classi-fying it due to a characteristic fragmentation process. [45,82-84]
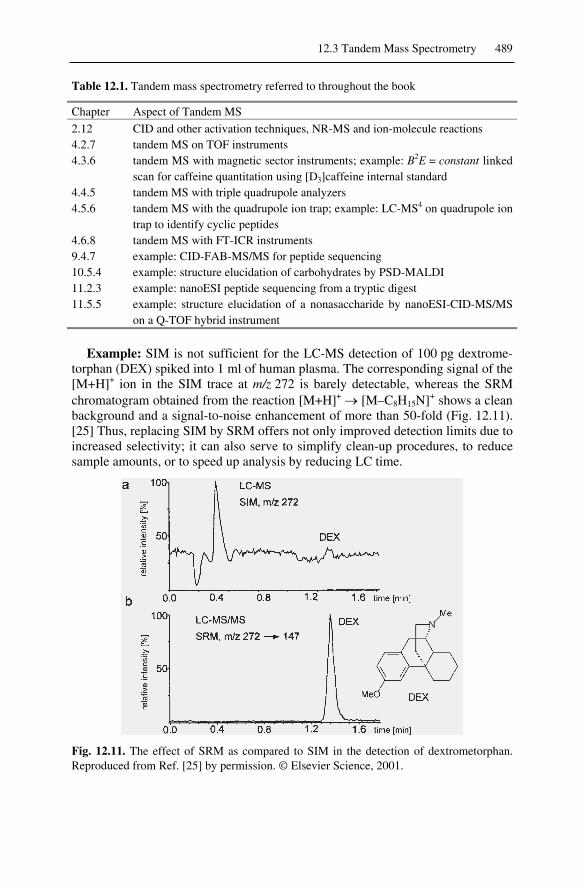
12.3 Tandem Mass Spectrometry 489
Table 12.1. Tandem mass spectrometry referred to throughout the book
Chapter Aspect of Tandem MS2.12 CID and other activation techniques, NR-MS and ion-molecule reactions4.2.7 tandem MS on TOF instruments4.3.6 tandem MS with magnetic sector instruments; example: B2E = constant linked
scan for caffeine quantitation using [D3]caffeine internal standard4.4.5 tandem MS with triple quadrupole analyzers4.5.6 tandem MS with the quadrupole ion trap; example: LC-MS4 on quadrupole ion
trap to identify cyclic peptides4.6.8 tandem MS with FT-ICR instruments9.4.7 example: CID-FAB-MS/MS for peptide sequencing10.5.4 example: structure elucidation of carbohydrates by PSD-MALDI11.2.3 example: nanoESI peptide sequencing from a tryptic digest11.5.5 example: structure elucidation of a nonasaccharide by nanoESI-CID-MS/MS
on a Q-TOF hybrid instrument
Example: SIM is not sufficient for the LC-MS detection of 100 pg dextrome-torphan (DEX) spiked into 1 ml of human plasma. The corresponding signal of the[M+H]+ ion in the SIM trace at m/z 272 is barely detectable, whereas the SRMchromatogram obtained from the reaction [M+H]+ [M–C8H15N]+ shows a cleanbackground and a signal-to-noise enhancement of more than 50-fold (Fig. 12.11).[25] Thus, replacing SIM by SRM offers not only improved detection limits due toincreased selectivity; it can also serve to simplify clean-up procedures, to reducesample amounts, or to speed up analysis by reducing LC time.
Fig. 12.11. The effect of SRM as compared to SIM in the detection of dextrometorphan.Reproduced from Ref. [25] by permission. © Elsevier Science, 2001.

490 12 Hyphenated Methods
Note: SRM is preferably performed on triple quadrupole, quadrupole ion trap,and Q-TOF hybrid instruments due to their ease of setting up the experimentand to their speed of switching between channels if monitoring of multiple re-actions plays a role.
12.4. Ultrahigh-Resolution Mass Spectrometry
High and in particular ultrahigh-resolution in combination with a soft ionizationmethod such as ESI, MALDI, or FD presents another way to achieve the separa-tion of the molecular species contained in a mixture. Given a sufficient level ofresolution, isobaric ions are displayed separately in the range of their commonnominal mass value (Chap. 3.3.2, 3.4).
Fig. 12.12. Positive-ion ESI-FT-ICR spectrum of crude oil. The mass scale is successivelyexpanded from the broadband spectrum into detail at three nominal mass values. Adaptedfrom Ref. [86] by permission. © American Chemical Society, 2002.
Reference List 491
Classically, high-resolution work is the domain of double-focusing magneticsector instruments. More recently, TOF and to a certain degree triple quadrupoleinstruments are also capable of resolutions up to about 20,000. However, the rapiddevelopment of FT-ICR instruments has established those as the systems of choiceif ultrahigh-resolution (>100,000) and highest mass accuracy (1 ppm) are required(Chap. 4.6).
The potential of ultrahigh-resolution mass spectrometry for the analysis ofcomplex chemical mixtures is particularly illustrated by FT-ICR-MS which defi-nitely sets a new standard. For example, ultrahigh-resolution was applied to sepa-rate several thousand components in crude oil, [85,86] fuels, [87,88] or explosionresidues. [89]
Example: ESI selectively ionizes the basic compounds, i.e., only a small frac-tion of the entire chemical composition, in a sample of South American crude oil.Nevertheless, the positive-ion ESI-FT-ICR mass spectrum exhibits more than11,100 resolved peaks, of which >75 % may be assigned to a unique elementalcomposition (CcHhOoNnSs). Such a separation in mass is possible because the av-erage mass resolution in the m/z 225–1000 broadband spectrum is approximately350,000 (Fig. 12.12). This demonstrates the current upper limit for the number ofchemically distinct components resolved and identified in a single step. [86]
Reference List
1. Williams, J.D.; Burinsky, D.J. Mass Spec-trometric Analysis of Complex MixturesThen and Now: the Impact of LinkingLiquid Chromatography and Mass Spec-trometry. Int. J. Mass Spectrom. 2001,212, 111-133.
2. McLafferty, F.W. Tandem MS Analysis ofComplex Biological Mixtures. Int. J. MassSpectrom. 2001, 212, 81-87.
3. Kondrat, R.W. Mixture Analysis by MassSpectrometry: Now's the Time. Int. J.Mass Spectrom. 2001, 212, 89-95.
4. Gohlke, R.S.; McLafferty, F.W. Early GasChromatography/Mass Spectrometry. J.Am. Chem. Soc. Mass Spectrom. 1993, 4,367-371.
5. Message, G.M. Practical Aspects of GasChromatography/Mass Spectrometry;John Wiley & Sons: New York, 1984.
6. Hübschmann, H.-J. Handbook of GC/MS:Fundamentals and Applications; Wiley-VCH: Weinheim, 2001.
7. Budde, W.L. Analytical Mass Spectrome-try; ACS and Oxford University Press:Washington, D.C. and Oxford, 2001.
8. Current Practice of Liquid Chromatogra-phy-Mass Spectrometry; Niessen,
W.M.A.; Voyksner, R.D., editors; El-sevier: Amsterdam, 1998.
9. Ardrey, R.E. Liquid Chromatography-Mass Spectrometry - An Introduction;John Wiley & Sons: Chichester, 2003.
10. Horning, E.C.; Carroll, D.I.; Dzidic, I.;Haegele, K.D.; Horning, M.G.; Stillwell,R.N. Atmospheric Pressure Ionization(API) MS. Solvent-Mediated Ionization ofSamples Introduced in Solution and in aLiquid Chromatograph Effluent Stream. J.Chromatogr. Sci. 1974, 12, 725-729.
11. Blakley, C.R.; Vestal, M.L. ThermosprayInterface for LC-MS. Anal. Chem. 1983,55, 750-754.
12. Vestal, M.L. High-Performance LiquidChromatography-Mass Spectrometry. Sci-ence 1984, 226, 275-281.
13. Abian, J. The Coupling of Gas and LiquidChromatography with Mass Spectrometry.J. Mass Spectrom. 1999, 34, 157-168.
14. Smith, R.D.; Barinaga, C.J.; Udseth, H.R.Improved Electrospray Ionization Inter-face for Capillary Zone Electrophoresis-Mass Spectrometry. Anal. Chem. 1988, 60,1948-1952.
492 12 Hyphenated Methods
15. Schrader, W.; Linscheid, M. Styrene Ox-ide DNA Adducts: in Vitro Reaction andSensitive Detection of Modified Oligonu-cleotides Using Capillary Zone Electro-phoresis Interfaced to ESI-MS. Archives ofToxicology 1997, 71, 588-595.
16. Tanaka, Y.; Kishimoto, Y.; Otsuga, K.;Terabe, S. Strategy for Selecting Separa-tion Solutions in CE-MS. J. Chromatogr.A 1998, 817, 49-57.
17. Siethoff, C.; Nigge, W.; Linscheid, M.Characterization of a CZE/ESI-MS Inter-face. Anal. Chem. 1998, 70, 1357-1361.
18. Hsieh, F.; Baronas, E.; Muir, C.; Martin,S.A. A Novel Nanospray CE/MS Inter-face. Rapid Commun. Mass Spectrom.1999, 13, 67-72.
19. Smith, R.D.; Felix, W.D.; Fjeldsted, J.C.;Lee, M.L. Capillary Column SupercriticalFluid Chromatography Mass Spectrome-try. Anal. Chem. 1982, 54, 1883-1885.
20. Arpino, P.J.; Haas, P. Recent Develop-ments in SFC-MS Coupling. J. Chroma-togr. A 1995, 703, 479-488.
21. Pinkston, J.D.; Chester, T.L. Guidelinesfor Successful SFC/MS. Anal. Chem.1995, 67, 650A-656A.
22. Sjöberg, P.J.R.; Markides, K.E. New SFCInterface Probe for ESI and APCI-MS. J.Chromatogr. A 1997, 785, 101-110.
23. Combs, M.T.; Ashraf-Khorassani, M.;Taylor, L.T. Packed SFC-MS: A Review.J. Chromatogr. A 1998, 785, 85-100.
24. Forensic Applications of Mass Spec-trometry; Yinon, J., editor; CRC Press:Boca Raton, 1994.
25. Hoke, S.H.II.; Morand, K.L.; Greis, K.D.;Baker, T.R.; Harbol, K.L.; Dobson,R.L.M. Transformations in PharmaceuticalResearch and Development, Driven by In-novations in Multidimensional MassSpectrometry-Based Technologies. Int. J.Mass Spectrom. 2001, 212, 135-196.
26. Mass Spectrometry in Drug Discovery;Rossi, D.T.; Sinz, M.W., editors; MarcelDekker: New York, 2002.
27. Modern Mass Spectrometry; Schalley,C.A., editor; Springer: New York, 2003.
28. Hites, R.A.; Biemann, K. A Computer-Compatible Digital Data Acquisition Sys-tem for Fast-Scanning, Single-FocusingMass Spectrometers. Anal. Chem. 1967,39, 965-970.
29. Hites, R.A.; Biemann, K. Mass Spec-trometer-Computer System ParticularlySuited for Gas Chromatography of Com-
plex Mixtures. Anal. Chem. 1968, 40 ,1217-1221.
30. Hites, R.A.; Biemann, K. ComputerEvaluation of Continuously Scanned MassSpectra of Gas Chromatographic Efflu-ents. Anal. Chem. 1970, 42, 855-860.
31. Bertholf, R.L. Gas Chromatography andMass Spectrometry in Clinical Chemistry,in Encyclopedia of Analytical Chemistry,Meyers, R.A., editor; John Wiley & Sons:Chichester, 2000; pp. 1314-1336.
32. Spies-Martin, D.; Sommerburg, O.; Lang-hans, C.-D.; Leichsenring, M. Measure-ment of 4-Hydroxynonenal in Small Vol-ume Blood Plasma Samples: Modificationof a GC-MS Method for Clinical Settings.Journal of Chromatography B 2002, 774,231-239.
33. Price, P. Standard Definitions of TermsRelating to Mass Spectrometry. A ReportFrom the Committee on Measurementsand Standards of the Amercian Society forMass Spectrometry. J. Am. Soc. MassSpectrom. 1991, 2, 336-348.
34. Henneberg, D. Combination of Gas Chro-matography and Mass Spectrometry forthe Analysis of Organic Mixtures.Zeitschrift für Analytische Chemie 1961,183, 12-23.
35. Sweeley, C.C.; Elliot, W.H.; Fries, I.; Ry-hage, R. Mass Spectrometric Determina-tion of Unresolved Components in GasChromatographic Effluents. Anal. Chem.1966, 38, 1549-1553.
36. Crosby, N.T.; Foreman, J.K.; Palframan,J.F.; Sawyer, R. Estimation of Steam-Volatile N-Nitrosamines in Foods at the136 g/Kg Level. Nature 1972, 238, 342-343.
37. Brooks, C.J.W.; Middleditch, B.S. Uses ofChloromethyldimethylsilyl Ethers As De-rivatives for Combined GC-MS of Ster-oids. Anal. Lett. 1972, 5, 611-618.
38. Young, N.D.; Holland, J.F.; Gerber, J.N.;Sweeley, C.C. Selected Ion Monitoring forMulticomponent Analyses by ComputerControl of Accelerating Voltage and Mag-netic Field. Anal. Chem. 1975, 47, 2373-2376.
39. Tanchotikul, U.; Hsieh, T.C.Y. An Im-proved Method for Quantification of 2-Acetyl-1-Pyrroline, a "Popcorn"-LikeAroma, in Aromatic Rice by High-Resolution GC-MS/SIM. J. Agric. FoodChem. 1991, 39, 944-947.
40. Middleditch, B.S.; Desiderio, D.M. Com-parison of SIM and Repetitive Scanning
Reference List 493
During GC-MS. Anal. Chem. 1973, 45,806-808.
41. Millington, D.S.; Buoy, M.E.; Brooks, G.;Harper, M.E.; Griffiths, K. Thin-LayerChromatography and HR-SIM for theAnalysis of C19 Steroids in Human Hyper-plastic Prostate Tissue. Biomed. MassSpectrom. 1975, 2, 219-224.
42. Thorne, G.C.; Gaskell, S.J.; Payne, P.A.Approaches to the Improvement of Quan-titative Precision in SIM: High ResolutionApplications. Biomed. Mass Spectrom.1984, 11, 415-420.
43. Tong, H.Y.; Monson, S.J.; Gross, M.L.;Huang, L.Q. Monobromopolychlorodi-benzo-p-Dioxins and Dibenzofurans inMunicipal Waste Incinerator Fly Ash.Anal. Chem. 1991, 63, 2697-2705.
44. Shibata, A.; Yoshio, H.; Hayashi, T.;Otsuki, N. Determination of Phenylpyru-vic Acid in Human Urine and Plasma byGC-NICI-MS. Shitsuryo Bunseki 1992, 40,165-171.
45. Tondeur, Y.; Albro, P.W.; Hass, J.R.;Harvan, D.J.; Schroeder, J.L. Matrix Ef-fect in Determination of 2,3,7,8-Tetrachlorodibenzodioxin by MS. Anal.Chem. 1984, 56, 1344-1347.
46. Heumann, K.G. Isotope Dilution MassSpectrometry of Inorganic and OrganicSubstances. Fresenius Z. Anal. Chem.1986, 325, 661-666.
47. Calder, A.G.; Garden, K.E.; Anderson,S.E.; Lobley, G.E. Quantitation of Bloodand Plasma Amino Acids Using IsotopeDilution GC-EI-MS with U-13C AminoAcids As Internal Standards. Rapid Com-mun. Mass Spectrom. 1999, 13, 2080-2083.
48. Gudzinowicz, B.J.; Gudzinowizc, M.J.;Martin, H.F. The GC-MS Interface, inFundamentals of integrated GC-MS PartIII, Marcel Dekker: New York, 1977;Chapter B, pp. 58-181.
49. McFadden, W.H. Interfacing Chromatog-raphy and Mass Spectrometry. J. Chro-matogr. Sci. 1979, 17, 2-16.
50. Lindeman, L.P.; Annis, J.L. A Conven-tional Mass Spectrometer As a Detectorfor Gas Chromatography. Anal. Chem.1960, 32, 1742-1749.
51. Gohlke, R.S. Time-of-Flight Mass Spec-trometry: Application to Capillary-ColumnGC. Anal. Chem. 1962, 34, 1332-1333.
52. McFadden, W.H.; Teranishi, R.; Black,D.R.; Day, J.C. Use of Capillary GasChromatography With a Time-of-Flight
Mass Spectrometer. J. Food Sci. 1963, 28,316-319.
53. Dandeneau, R.D.; Zerenner, E.H. An In-vestigation of Glasses for Capillary Chro-matography. J. High Resol. Chromatogr./Chromatogr. Commun. 1979, 2, 351-356.
54. Dandeneau, R.D.; Zerenner, E.H. The In-vention of the Fused-Silica Column: anIndustrial Perspective. LC-GC 1990, 8,908-912.
55. Handbook of Derivates for Chromatogra-phy; 1st ed.; Blau, G.; King, G.S., editors;Heyden & Son: London, 1977.
56. Halket, H.M.; Zaikin, V.G. Derivatizationin Mass Spectrometry -1. Silylation. Eur.Mass Spectrom. 2003, 9, 1-21.
57. Aubert, C.; Rontani, J.-F. PerfluoroalkylKetones: Novel Derivatization Productsfor the Sensitive Determination of FattyAcids by GC-MS in EI and NICI Modes.Rapid Commun. Mass Spectrom. 2000, 14,960-966.
58. Spiteller, G. Contaminants in Mass Spec-trometry. Mass Spectrom. Rev. 1982, 1,29-62.
59. Leclerq, P.A.; Camers, C.A. High-SpeedGC-MS. Mass Spectrom. Rev. 1998, 17,37-49.
60. Prazen, B.J.; Bruckner, C.A.; Synovec,R.E.; Kowalski, B.R. Enhanced ChemicalAnalysis Using Parallel Column GasChromatography With Single-DetectorTOF-MS and Chemometric Analysis.Anal. Chem. 1999, 71, 1093-1099.
61. Hirsch, R.; Ternes, T.A.; Bobeldijk, I.;Weck, R.A. Determination of Environ-mentally Relevant Compounds Using FastGC/TOF-MS. Chimia 2001, 55, 19-22.
62. van der Greef, J.; Niessen, W.M.A.;Tjaden, U.R. Liquid Chromatography-Mass Spectrometry. The Need for a Multi-dimensional Approach. J. Chromatogr.1989, 474, 5-19.
63. McFadden, W.H.; Schwartz, H.L.; Evans,S. Direct Analysis of Liquid Chroma-tographic Effluents. J. Chromatogr. 1976,122, 389-396.
64. Karger, B.L.; Kirby, D.P.; Vouros, P.;Foltz, R.L.; Hidy, B. On-Line ReversedPhase LC-MS. Anal. Chem. 1979, 51,2324-2328.
65. Millington, D.S.; Yorke, D.A.; Burns, P. ANew Liquid Chromatography-Mass Spec-trometry Interface. Adv. Mass Spectrom.1980, 8B, 1819-1825.
66. Games, D.E.; Hirter, P.; Kuhnz, W.;Lewis, E.; Weerasinghe, N.C.A.; West-

494 12 Hyphenated Methods
wood, S.A. Studies of Combined LC-MSWith a Moving-Belt Interface. Journal ofChromatography 1981, 203, 131-138.
67. Liang, Z.; Hsu, C.S. Molecular Speciationof Saturates by Online Liquid Chromatog-raphy-Field Ionization Mass Spectrometry.Energy Fuels 1998, 12, 637-643.
68. Willoughby, R.C.; Browner, R.F. Mono-disperse Aerosol Generation Interface forCombining LC With MS. Anal. Chem.1984, 56, 2625-2631.
69. Brauers, F.; von Bünau, G. Mass Spec-trometry of Solutions: a New Simple Inter-face for the Direct Introduction of LiquidSamples. Int. J. Mass Spectrom. Ion Proc.1990, 99, 249-262.
70. Winkler, P.C.; Perkins, D.D.; Williams,D.K.; Browner, R.F. Performance of anImproved Monodisperse Aerosol Genera-tion Interface for LC-MS. Anal. Chem.1988, 60, 489-493.
71. Chesnov, S.; Bigler, L.; Hesse, M. Detec-tion and Characterization of Natural Poly-amines by HPLC-APCI (ESI) MS. Eur.Mass Spectrom. 2002, 8, 1-16.
72. Hayen, H.; Karst, U. Strategies for the LC-MS Analysis of Non-Polar Compounds. J.Chromatogr. A 2003, 1000, 549-565.
73. Reemtsma, T. Liquid Chromatography-Mass Spectrometry and Strategies forTrace-Level Analysis of Polar OrganicPollutants. J. Chromatogr. A 2003, 1000,477-501.
74. Robb, D.B.; Covey, T.R.; Bruins, A.P.Atmospheric Pressure Photoionization: anIonization Method for LC-MS. Anal.Chem. 2000, 72, 3653-3659.
75. Raffaeli, A.; Saba, A. Atmospheric Pres-sure Photoionization Mass Spectrometry.Mass Spectrom. Rev. 2003, 22, 318-331.
76. Sage, A.B.; Giles, K. High ThroughputParallel LC/MS Analysis of Multiple Liq-uid Streams. GIT Laboratory Journal2000, 4, 35-36.
77. Schrader, W.; Eipper, A.; Pugh, D.J.;Reetz, M.T. Second-Generation MS-BasedHigh-Throughput Screening System forEnantioselective Catalysts and Biocata-lysts. Canadian J. Chem. 2002, 80, 626-632.
78. Morrison, D.; Davies, A.E.; Watt, A.P. AnEvaluation of a Four-Channel MultiplexedESI Tandem MS for Higher ThroughputQuantitative Analysis. Anal. Chem. 2002,74, 1896-1902.
79. Tandem Mass Spectrometry; 1st ed.;McLafferty, F.W., editor; John Wiley &Sons: New York, 1983.
80. Busch, K.L.; Glish, G.L.; McLuckey, S.A.Mass Spectrometry/Mass Spectrometry;1st ed.; Wiley VCH: New York, 1988.
81. Moritz, T.; Olsen, J.E. Comparison Be-tween High-Resolution Selected IonMonitoring, Selected Reaction Monitor-ing, and Four-Sector Tandem Mass Spec-trometry in Quantitative Analysis of Gib-berellins in Milligram Amounts of PlantTissue. Anal. Chem. 1995, 67, 1711-1716.
82. Johnson, J.V.; Yost, R.A.; Faull, K.F.Tandem MS for the Trace Determinationof Tryptolines in Crude Brain Extracts.Anal. Chem. 1984, 56, 1655-1661.
83. Dams, R.; Murphy, C.M.; Lambert, W.E.;Huestis, M.A. Urine Drug Testing forOpioids, Cocaine, and Metabolites by Di-rect Injection LC/Tandem MS. RapidCommun. Mass Spectrom. 2003, 17, 1665-1670.
84. Miao, X.-S.; Metcalfe, C.D. Determinationof Carbamazepine and Its Metabolites inAqueous Samples Using LC-ESI TandemMS. Anal. Chem. 2003, 75, 3731-3738.
85. Hughey, C.A.; Hendrickson, C.L.; Rod-gers, R.P.; Marshall, A.G. Kendrick MassDefect Spectrum: A Compact VisualAnalysis for Ultrahigh-ResolutionBroadband Mass Spectra. Anal. Chem.2001, 73, 4676-4681.
86. Hughey, C.A.; Rodgers, R.P.; Marshall,A.G. Resolution of 11,000 Composition-ally Distinct Components in a Single ESI-FT-ICR Mass Spectrum of Crude Oil.Anal. Chem. 2002, 74, 4145-4149.
87. Hsu, C.S.; Liang, Z.; Campana, J.E. Hy-drocarbon Characterization by UltrahighResolution FT-ICR-MS. Anal. Chem.1994, 66, 850-855.
88. Hughey, C.A.; Hendrickson, C.L.; Rod-gers, R.P.; Marshall, A.G. ElementalComposition Analysis of Processed andUnprocessed Diesel Fuel by ESI-FT-ICR-MS. Energy Fuels 2001, 15, 1186-1193.
89. Wu, Z.; Hendrickson, C.L.; Rodgers, R.P.;Marshall, A.G. Composition of Explosivesby ESI-FT-ICR-MS. Anal. Chem. 2002,74, 1879-1883.

Appendix
1 Isotopic Composition of the Elements
Table A.1 comprises the stable elements from hydrogen to bismuth with the radio-active elements technetium and promethium omitted. Natural variations in isotopiccomposition of some elements such as carbon or lead do not allow for more accu-rate values, a fact also reflected in the accuracy of their relative atomic mass.However, exact masses of the isotopes are not affected by varying abundances.The isotopic masses listed may differ up to some 10–6 u in other publications.
Table A.1. Isotopic mass, isotopic composition, and relative atomic mass [u] of non-radioactive elements. © IUPAC 2001.
AtomicSymbol
Name AtomicNo.
MassNo.
Isotopic Mass IsotopicComp.
RelativeAtomic Mass
H Hydrogen 1 1 1.007825 100 1.007952 2.014101 0.0115
He Helium 2 3 3.016029 0.000137 4.0026024 4.002603 100
Li Lithium 3 6 6.015122 8.21 6.9417 7.016004 100
Be Beryllium 4 9 9.012182 100 9.012182
B Boron 5 10 10.012937 24.8 10.81211 11.009306 100
C Carbon 6 12 12.000000 100 12.010813 13.003355 1.08
N Nitrogen 7 14 14.003070 100 14.0067515 15.000109 0.369
O Oxygen 8 16 15.994915 100 15.999417 16.999132 0.03818 17.999116 0.205
F Fluorine 9 19 18.998403 100 18.998403
Ne Neon 10 20 19.992402 100 20.179821 20.993847 0.3022 21.991386 10.22
Na Sodium 11 23 22.989769 100 22.989769
Mg Magnesium 12 24 23.985042 100 24.305125 24.985837 12.6626 25.982593 13.94
Al Aluminium 13 27 26.981538 100 26.981538
Si Silicon 14 28 27.976927 100 28.085529 28.976495 5.077830 29.973770 3.3473

496 Appendix
P Phosphorus 15 31 30.973762 100 30.973762
S Sulfur 16 32 31.972071 100 32.06733 32.971459 0.8034 33.967867 4.5236 35.967081 0.02
Cl Chlorine 17 35 34.968853 100 35.452837 36.965903 31.96
Ar Argon 18 36 35.967546 0.3379 39.94838 37.962776 0.063540 39.962383 100
K Potassium 19 39 38.963706 100 39.098340 39.963999 0.012541 40.961826 7.2167
Ca Calcium 20 40 39.962591 100 40.07842 41.958618 0.66743 42.958769 0.13944 43.955481 2.15246 45.953693 0.00448 47.952534 0.193
Sc Scandium 21 45 44.955910 100 44.955910
Ti Titanium 22 46 45.952629 11.19 47.86747 46.951764 10.0948 47.947947 10049 48.947871 7.3450 49.944792 7.03
V Vanadium 23 50 49.947163 0.250 50.941551 50.943964 100
Cr Chromium 24 50 49.946050 5.187 51.996252 51.940512 10053 52.940654 11.33954 53.938885 2.823
Mn Manganese 25 55 54.938050 100 54.938050
Fe Iron 26 54 53.939615 6.37 55.84556 55.934942 10057 56.935399 2.30958 57.933280 0.307
Co Cobalt 27 59 58.933200 100 58.933200
Ni Nickel 28 58 57.935348 100 58.693460 59.930791 38.519861 60.931060 1.674462 61.928349 5.338864 63.927970 1.3596
Cu Copper 29 63 62.929601 100 63.54665 64.927794 44.57
Zn Zinc 30 64 63.929147 100 65.3966 65.926037 57.37

1 Isotopic Composition of the Elements 497
Zn continued 67 66.927131 8.4368 67.924848 38.5670 69.925325 1.27
Ga Gallium 31 69 68.925581 100 69.72371 70.924705 66.367
Ge Germanium 32 70 69.924250 56.44 72.6172 71.922076 75.9173 72.923459 21.3174 73.921178 10076 75.921403 20.98
As Arsenic 33 75 74.921596 100 74.921596
Se Selenium 34 74 73.922477 1.79 78.9676 75.919214 18.8977 76.919915 15.3878 77.917310 47.9180 79.916522 10082 81.916700 17.60
Br Bromine 35 79 78.918338 100 79.90481 80.916291 97.28
Kr Krypton 36 78 77.920387 0.61 83.8080 79.916378 4.0082 81.913485 20.3283 82.914136 20.1684 83.911507 10086 85.910610 30.35
Rb Rubidium 37 85 84.911789 100 85.467887 86.909183 38.56
Sr Strontium 38 84 83.913425 0.68 87.6286 85.909262 11.9487 86.908879 8.4888 87.905614 100
Y Yttrium 39 89 88.905848 100 88.905848
Zr Zirconium 40 90 89.904704 100 91.22491 90.905645 21.8192 91.905040 33.3394 93.906316 33.7896 95.908276 5.44
Nb Niobium 41 93 92.906378 100 92.906378
Mo Molybdenum 42 92 91.906810 61.50 95.9494 93.905088 38.3395 94.905841 65.9896 95.904679 69.1397 96.906021 39.5898 97.905408 100
100 99.907478 39.91
Ru Ruthenium 44 96 95.907599 17.56 101.0798 97.905288 5.93

498 Appendix
Ru continued 99 98.905939 40.44100 99.904229 39.94101 100.905582 54.07102 101.904350 100104 103.905430 59.02
Rh Rhodium 45 103 102.905504 100 102.905504
Pd Palladium 46 102 101.905608 3.73 106.42104 103.904036 40.76105 104.905084 81.71106 105.903484 100108 107.903894 96.82110 109.905151 42.88
Ag Silver 47 107 106.905094 100 107.8682109 108.904756 92.90
Cd Cadmium 48 106 105.906459 4.35 112.412108 107.904184 3.10110 109.903006 43.47111 110.904182 44.55112 111.902757 83.99113 112.904401 42.53114 113.903358 100116 115.904755 26.07
In Indium 49 113 112.904061 4.48 114.818115 114.903879 100
Sn Tin 50 112 111.904822 2.98 118.711114 113.902782 2.03115 114.903346 1.04116 115.901744 44.63117 116.902954 23.57118 117.901606 74.34119 118.903309 26.37120 119.902197 100122 121.903440 14.21124 123.905275 17.77
Sb Antimony 51 121 120.903818 100 121.760123 122.904216 74.79
Te Tellurium 52 120 119.904021 0.26 127.60122 121.903047 7.48123 122.904273 2.61124 123.902819 13.91125 124.904425 20.75126 125.903306 55.28128 127.904461 93.13130 129.906223 100
I Iodine 53 127 126.904468 100 126.904468
Xe Xenon 54 124 123.905896 0.33 131.29126 125.904270 0.33128 127.903530 7.14
1 Isotopic Composition of the Elements 499
Xe continued 129 128.904779 98.33130 129.903508 15.17131 130.905082 78.77132 131.904154 100134 133.905395 38.82136 135.907221 32.99
Cs Caesium 55 133 132.905447 100 132.905447
Ba Barium 56 130 129.906311 0.148 137.328132 131.905056 0.141134 133.904503 3.371135 134.905683 9.194136 135.904570 10.954137 136.905821 15.666138 137.905241 100
La Lanthanum 57 138 137.907107 0.090 138.9055139 138.906348 100
Ce Cerium 58 136 135.907145 0.209 140.116138 137.905991 0.284140 139.905434 100142 141.909240 12.565
Pr Praseodymium 59 141 140.907648 100 140.907648
Nd Neodymium 60 142 141.907719 100 144.24143 142.909810 44.9144 143.910083 87.5145 144.912569 30.5146 145.913112 63.2148 147.916889 21.0150 149.920887 20.6
Sm Samarium 62 144 143.911995 11.48 150.36147 146.914893 56.04148 147.914818 42.02149 148.917180 51.66150 149.917271 27.59152 151.919728 100154 153.922205 85.05
Eu Europium 63 151 150.919846 91.61 151.964153 152.921226 100
Gd Gadolinium 64 152 151.919788 0.81 157.25154 153.920862 8.78155 154.922619 59.58156 155.922120 82.41157 156.923957 63.00158 157.924101 100160 159.927051 88.00
Tb Terbium 65 159 158.925343 100 158.925343
Dy Dysprosium 66 156 155.924279 0.21 162.50158 157.924405 0.35

500 Appendix
Dy continued 160 159.925194 8.30161 160.926930 67.10162 161.926795 90.53163 162.928728 88.36164 163.929171 100
Ho Holmium 67 165 164.930319 100 164.930319
Er Erbium 68 162 161.928775 0.42 167.26164 163.929197 4.79166 165.930290 100167 166.932045 68.22168 167.932368 79.69170 169.935460 44.42
Tm Thulium 69 169 168.934211 100 168.934211
Yb Ytterbium 70 168 167.933894 0.41 173.04170 169.934759 9.55171 170.936322 44.86172 171.936378 68.58173 172.938207 50.68174 173.938858 100176 175.942568 40.09
Lu Lutetium 71 175 174.940768 100 174.967176 175.942682 2.66
Hf Hafnium 72 174 173.940040 0.46 178.49176 175.941402 14.99177 176.943220 53.02178 177.943698 77.77179 178.944815 38.83180 179.946549 100
Ta Tantalum 73 180 179.947466 0.012 180.9479181 180.947996 100
W Tungsten 74 180 179.946707 0.40 183.84182 181.948206 86.49183 182.950224 46.70184 183.950933 100186 185.954362 93.79
Re Rhenium 75 185 184.952956 59.74 186.207187 186.955751 100
Os Osmium 76 184 183.952491 0.05 190.23186 185.953838 3.90187 186.955748 4.81188 187.955836 32.47189 188.958145 39.60190 189.958445 64.39192 191.961479 100
Ir Iridium 77 191 190.960591 59.49 192.217193 192.962924 100
Pt Platinum 78 190 189.959931 0.041 195.078

2 Carbon Isotopic Patterns 501
Pt continued 192 191.961035 2.311194 193.962664 97.443195 194.964774 100196 195.964935 74.610198 197.967876 21.172
Au Gold 79 197 196.966552 100 196.966552
Hg Mercury 80 196 195.965815 0.50 200.59198 197.966752 33.39199 198.968262 56.50200 199.968309 77.36201 200.970285 44.14202 201.970626 100204 203.973476 23.00
Tl Thallium 81 203 202.972329 41.892 204.3833205 204.974412 100
Pb Lead 82 204 203.973029 2.7 207.2206 205.974449 46.0207 206.975881 42.2208 207.976636 100
Bi Bismuth 83 209 208.980383 100 208.980383
Th Thorium* 90 232 232.038050 100 232.038050
U Uranium* 92 234 234.040946 0.0055 238.0289235 235.043923 0.73238 238.050783 100
2 Carbon Isotopic Patterns
Read out the PM+1/PM ratio from a mass spectrum to calculate the approximatenumber of carbon atoms. Provided no other element contributing to M+1 is pres-ent, an M+1 intensity of 15 %, for example, indicates the presence of 14 carbons.(For the risk of overestimation due to autoprotonation cf. Chap. 7.2.1)
Fig. A.1. Calculated isotopic patterns for carbon. Note the steadily expanding width of thepattern as X+2, X+3, X+4,... become visible. At about C90 the X+1 peak reaches the sameintensity as the X peak. At higher carbon number it becomes the base peak of the pattern.

502 Appendix
Table A.2. Calculated isotopic distributions for carbon
Number ofCarbons
X+1 X+2 X+3 X+4 X+5
1 1.1 0.002 2.2 0.013 3.3 0.044 4.3 0.065 5.4 0.106 6.5 0.167 7.6 0.238 8.7 0.339 9.7 0.4210 10.8 0.512 13.0 0.815 16.1 1.120 21.6 2.2 0.125 27.0 3.5 0.230 32.3 5.0 0.540 43.2 9.0 1.3 0.150 54.1 14.5 2.5 0.2 0.160 65.0 20.6 4.2 0.6 0.290 97.2 46.8 14.9 3.5 0.6120a 100.0 64.4 27.3 8.6 2.2
a The X peak has an abundance of 77.0 % in that case.
3 Silicon and Sulfur Isotopic Patterns
Fig. A.2. Isotopic patterns for silicon and sulfur. The peak at zero position corresponds tothe monoisotopic ion at m/z X. The isotopic peaks are then located at m/z = X+1, 2, 3, ...

5 Characteristic Ions 503
4 Chlorine and Bromine Isotopic Patterns
For halogens theisotopic peaksare separated by2 u.
Fig. A.3. Calculated isotopic patterns for combinations of bromine and chlorine. The peakshown at zero position corresponds to the monoisotopic ion at m/z X. The isotopic peaksare then located at m/z = X+2, 4, 6, ... The numerical value of X is given by the mass num-ber of the monoisotopic combination, e.g., 70 u for Cl2.
5 Characteristic Ions
Remember that care should be taken when using tables of characteristic ions andneutral losses, because the values listet represent only a minor fraction of thefragmentations possible. There is a substantial risk of getting fixed on a certainfragment or structure too early.

504 Appendix
Table A.3. Characteristic ion series and neutral losses
Ion Series m/z and [M–X]+ Ions Remarkscarbenium ions 15, 29, 43, 57, 71, 85, 99, 113,
127, 141, ...any alkyl group
acylium ions 29, 43, 57, 71, 85, 99, 113, 127,141, 155, ...
aliphatic aldehydes, ketones, car-boxylic acids and their derivatives
immonium ions 30, 44, 58, 72, 86, 100, 114, 128,142, 156, ...
aliphatic amines
oxonium ions 31, 45, 59, 73, 87, 101, 115, 129,143, 157, ...
aliphatic alcohols and ethers
sulfonium ions 47, 61, 75, 89, 103, 117, 131,145, 159, ...
aliphatic thiols and thioethers
from benzyl 39, 51, 65, 77, 91 phenylalkanesfrom benzoyl 51, 77, 105 aromatic aldehydes, ketones, car-
boxylic acids and derivatives[M–16]+, [M–30]+, [M–46]+• nitroarenes45, 60, 73,[M–17]+, [M–45]+
carboxylic acids
59, 74, 87,[M–31]+, [M–59]+
methyl carboxylates
73, 88, 101,[M–45]+, [M–73]+
ethyl carboxylates
44 McL of aldehydes58 McL of methyl ketones60 McL of carboxylic acids59 McL of carboxylic acid amides74 McL of methyl carboxylates88 McL of ethyl carboxylates[M–20]+• fluorine compounds35, [M–35]+, [M–36]+• chlorine compounds (plus Cl iso-
topic pattern)79, [M–79]+, [M–80]+• bromine compounds (plus Br iso-
topic pattern)127, [M–127]+, [M–128]+• iodine compounds[M–15]+ loss of methyl[M–17]+•
[M–17]+loss of ammonia from amines,loss of OH• from (tert.) alcohols
[M–18]+• loss of water from alcohols[M–27]+• loss of HCN from heterocycles or
HNC from aromatic amines[M–28]+• loss of CO, C2H4 or N2
[M–44]+• loss of carbon dioxide[M–91]+ loss of benzyl

6 Frequent Impurities 505
6 Frequent Impurities
Table A.4. Recognition of frequent impurities
m/z Source18, 28, 32, 40, 44 residual air149, 167, 279 phthalic acid esters (plasticizers)149, 177, 222 diethyl phthalate (plasticizers)73, 147, 207, 281, 355, 429 silicon grease or GC column bleed
(Six isotopic pattern)27, 29, 41, 43, 55, 57, 69, 71, 83, 85,97, 99, 109, 111, 113,125, 127, ..., up to m/z 500
hydrocarbons from grease or fromsuspensions in paraffin
32, 64, 96, 128, 160, 192, 224, 256 sulfur (Sx isotopic pattern)51, 69, 119, 131, 169, 181, 219, 231,243, 281, 317, 331, ...
background from PFK

Subject Index
A-cleavageof acetone 229of amines, ethers, and alcohols 235of halogenated hydrocarbons 243of ketones 232of thioethers 242
accumulationof spectra 477
accurate massmeasurement 88
activation energy of the reverse reaction36
acylium ions 234ADC see analog-to-digital converteradiabatic ionization 19AE see appearance energyallylic bond cleavage
isomerization prior to 255of alkenes 255
amu see atomic mass unitanalog-to-digital converter 124analysis of complex mixtures 475AP see appearance energyAPCI see atmospheric pressure
chemical ionizationAPI see atmospheric pressure ionizationAP-MALDI see atmospheric pressure
MALDIappearance energy
definition 23determination 48
appearance potential see appearanceenergy
APPI see atmospheric pressurephotoionization
array detector 179atmospheric pressure chemical
ionization 465atmospheric pressure ionization 441
interface for AP-MALDI 431atmospheric pressure ionization methods
441atmospheric pressure MALDI 431atmospheric pressure photoionization
467atomic mass unit 72atomic number 67atomic weight see relative atomic massautoprotonation 333averaging
of spectra 477
Bbackground subtraction
from spectra 477bar graph
representation of spectra 6base peak
definition 5BAT see field desorptionbenzyl/tropylium isomerization 251benzylic bond cleavage 249
phenylalkanes 249BEqQ 173Born-Oppenheimer approximation 18breakdown graph 49
508 Subject Index
C252Californium plasma desorption 400252Cf-PD see 252Cf plasma desorptionCA see collision-induced dissociationCAD see collision-induced dissociationcalibration file 99capillary zone electrophoresis 446capillary zone electrophoresis-mass
spectrometry coupling 475carbenium ions 234
stability of isomers 260CE see charge exchangeCE-CI see charge exchange chemical
ionizationCEM see detectorscenter-of-mass collision energy 55CF-FAB 395 see fast atom
bombardmentcharacteristic ions 234charge deconvolution
in ESI 458charge exchange 341
also see charge exchange chemicalionization
charge exchange chemical ionizationenergetics 341reagent gases 342regio- and stereoselectivity 344selective ionization 343
charge reduction electrospray 461charge retention 230charge state
effect on time-of-flight 116charge transfer ionization see charge
exchange chemical ionizationcharged-residue model
in ESI 454charge-localization 16chemical ionization 331
ion formation 331ion source 332reagent gas 332
chemi-ionization 334Chevron plate 177chirp 169chromatogram 475CI see chemical ionizationCID see collision-induced dissociationclosed-shell ion see even-electron ion
see even-electron ioncluster ions
for mass calibration 384in FAB-MS 384
CO loss 281differentiation from N2, C2H4 288of arylmethylethers 285of carbonyl compounds 288of phenols 281of quinones 283of transition metal carbonyl
complexes 287collision cell 53, 151collisional activation see collision-
induced dissociationcollisional cooling 151collisional focusing 151collisionally activated dissociation see
collision-induced dissociationcollision-induced dissociation 53column bleed
in GC-MS 483combination ion source 201composite metastable peak 286constant neutral loss scan 143, 153, 488consumption of analyte
by MS in general 4continuous-flow FAB see fast atom
bombardmentfor LC-MS 486
conversion dynode 179CRE see charge reduction ESICRM see charged-residue modelcryogenic detector see detectorscryopump 181curved-field reflectron 121CZE see capillary zone electrophoresisCZE-MS see capillary zone
electrophoresis-mass spectrometrycoupling
DDa see daltondalton 5data reduction 6, 214DBE see double bond equivalentsDCI see desorption chemical ionizationDE see delayed extractiondegrees of freedom
external 21internal 22
degrees of freedom effect 38DEI see direct electron ionization
509
delayed extraction 123deltamass 91DEP see direct exposure probedesorption chemical ionization 210, 349desorption electron ionization 349desorption/ionization on silicon 430detection limit 204detectors 175
channel electron multiplier (CEM)176
channeltron (CEM) 176conversion dynode 179cryogenic detector 175Faraday cup 175focal plane detector (FPD) 179microchannel plate (MCP) 177post-acceleration detector 178secondary electron multiplier (SEM)
175differential pumping 53di-isotopic element
definition 68DIOS see desorption/ionization on
siliconDIP see direct insertion probedirect electron ionization 210direct exposure probe 210, 349direct insertion probe 208distonic ions 247
as intermediates 248formation 247
DOF see degrees of freedom effectdouble bond equivalents 254double -cleavage
identification of regioisomers 246of alicyclic compounds 244
double-focusing see magnetic sectoranalyzer
doubly charged ionin EI 16
droplet jet fissionin ESI 454
DTP see dual-target FAB probedual-target FAB probe 394duty cycle 127dwelltime of ions
in ion source 32dynamic range 125
EEBqQ 173
EC see electron capture see electroncapture see electron capture
ECD see Fourier transform ioncyclotron resonance see electroncapture dissociation
EHC see field desorptionEHI see electrohydrodynamic
ionizationEI see electron ionizationEI ion source 200
contamination 201efficiency 203emission-controlled filament 203filament 202ionization chamber 200repeller 20070 eV EI 197
EI mass spectral libraries 218electrohydrodynamic ionization 443electron attachment see electron captureelectron capture 196, 345
creating thermal electrons 347cross section 59EC spectra 348energetics 345ionization process 345
electron capture dissociation 59, 172electron impact see electron ionizationelectron ionization 15, 193, 223
doubly charged ions 194excess energy 197fragment ions 195fragmentation pathways 198ionization efficiency 197ionization process 194layout of EI ion source 200low-energy, low-temperature 199primary electrons 202rearrangement ions 195timescale 195
electron massin calculation of exact mass 73, 103
electron monochromator 45electrospray ionization 441
charge deconvolution 458charge reduction 461conventional vs. nanoESI 447design of sprayers 445disintegration of droplets 453formation of a spray 451ion formation 454
510 Subject Index
ion source/interface 444ionic metal complexes 462multiple charging 456oligonucleotides and DNA 464oligosaccharides 465principle 444sample consumption 467small molecules 462spray geometries 449surfactants 464Taylor cone 453types of ions 468
electrostatic analyzer 134energy dispersion 135
electrostatic sector see electrostaticanalyzer
elimination of carbon monoxide see COloss
emitter heating current 372end cap electrodes see quadrupole ion
trapESA see electrostatic analyzerESI see electrospray ionizationESI interface see electrospray ionizationeven-electron ion 15, 223even-electron rule 227exact mass
definition 73external ion source
for quadrupole ion trap 162external ion sources
in FT-ICR-MS 171external mass calibration 99
FFAB see fast atom bombardmentFAB gun 382FAB matrix 387Faraday cup see detectorsfast atom bombardment 381
accurate mass 393continuous-flow (CF) FAB 395criteria for the liquid matrix 387FAB gas 382FAB target 383frit-FAB 395high-mass analytes 392ion formation 384, 385ion source 382ionic analytes 391low- to medium polarity analytes 389
low-temperature (LT) FAB 397matrix spectra 388peptide sequencing 398role of the liquid matrix 387side-reactions 389types of ions 402
fast GC-MS 484FC43 see perfluorotributylamineFD see field desorptionFD emitter see field desorptionFFR see field-free regionFI see field ionizationFI/FD ion source 357
counter electrode 357field emitter 357
field anode/emitter see FI/FD ionsource
field desorption 355best anode temperature (BAT) 372cationization 368cluster ions 369emitter activation 358emitter handling 360emitter heating current (EHC) 359FD spectra 365field-induced desolvation 368ion evaporation 368ionic analytes 371liquid injection field desorption
ionization (LIFDI) 362protonation 368surface mobility 366wire emitters 358
field ionization 355[M+H]+ ions 363electric field strength 356emitter activation 358field emitter/field anode 356field-induced dissociation 364mass spectra 363multiply charged ions 364post-ionization 364process 355wire emitters 358
field-free region 128Fourier transform ion cyclotron
resonance 164axial trapping 168cyclotron frequency 165cyclotron motion 167Fourier transformation 166

511
free induction decay 166frequency domain 166frequency sweep (chirp) 169image current detection 169infrared multiphoton dissociation
(IRMPD) 172principle 165stored wavefrom inverse Fourier
transform (SWIFT) 169sustained off-resonance irradiation
(SORI) 172time domain 166
Fourier transformation see Fouriertransform ion cyclotron resonance
FPD see detectorsfragment ion peaks
definition 5fragment ions
definition 5Franck-Condon factor 19Franck-Condon principle 18frit-FAB 395FT-ICR see Fourier transform ion
cyclotron resonanceFWHM
full width at half maximum 96
G-H shift with -cleavage see
McLafferty rearrangementgas chromatography-mass spectrometry
coupling 475derivatization 483fast GC-MS 484interface 482jet separator 482narrow-bore columns 484separators 482
gas phase basicity 50GB see gas phase basicityGC columns
fused silica capillaries 483narrow bore capillaries 484packed 482
GC-MS see gas chromatography-massspectrometry coupling
HH2O loss
of alkanols 290HCN loss 315
heterocyclic compounds 311aromatic heterocycles 318aromatic N-heterocycles 315HCN loss 315saturated heterocycles 311
heterolytic bond dissociation 24high energy collisions 56high-resolution 88high-resolution SIM 479, 480histogram see bar graphHNC loss 317homolytic bond cleavage
k(E) functions 30homolytic bond dissociation 24HR-MS
in FAB/LSIMS 393hybrid instruments 173hyphenated methods 475
IIE see ionization energyIEM see ion evaporation modelimmonium ions 235, 238INC see ion-neutral complexesinfrared multiphoton dissociation 58,
172inlet see inlet systeminlet system 206
direct exposure probe (DEP) 210direct insertion probe (DIP) 208liquid introduction system 213particle beam interface 213reservoir inlet 212sample vials for DIP 209
in-source decay 129, 428in-source liquid injection FD 362internal energy 20
consequences 31influence on rate constants 27randomization 26
internal mass calibration 100interpretation of EI mass spectra 223ion beam 113ion evaporation model
in ESI 454ion guides see RF-only quadrupoleion source
simple implementation 113ion spray see pneumatically assisted
ESIion trajectory calculations 205
512 Subject Index
ionization cross section 20ionization efficiency 20ionization energy
definition 16determination 44
ionization potential see ionizationenergy
ion-molecule reaction 60ion-neutral complexes 300
electrostatic attraction 301evidence 300intermediates of onium reaction 297of radical ions 303reorientation criterion 302
IP see ionization energyIR-MALDI 417IRMPD see infrared multiphoton
dissociationIR-MS see isotope ratio mass
spectrometryISD see in-source decayisobaric ions 234isotope dilution 480isotope effect 40
determination 42intermolecular 40intramolecular 40kinetic 40primary 42secondary 43
isotope ratio mass spectrometry 73isotopes
definition 67isotopic abundance
representation 69isotopic compositions see isotopic
abundanceisotopic distribution see isotopic patternisotopic enrichment 87isotopic ions 77isotopic labeling 88isotopic mass 88
definition 71isotopic molecular ion 77isotopic pattern 70, 74
at very high resolution 104average molecular mass 106calculation 74carbon 74effect of charge state 108effect of resolution 107
halogens 78oxygen, silicon, sulfur 81polyisotopic elements 80, 83, 86practical aspects 84
ISP see ion spray
Kk(E) function 29Kendrick mass scale 91KER see kinetic energy releasekinetic energy release 37, 142kinetic method
for detn. of GB 51kinetic shift 35
Lladder sequencing see peptide
sequencinglaser desorption/ionization 423
applications 423LC-MS see liquid chromatography-
mass spectrometry couplingLDI see laser desorption/ionizationLIFDI see field desorptionlinear quadrupole analyzer 145
hyperbolic vs. cylindrical rods 151principle 146properties seetriple quadrupole 152unit resolution 150
linear quadrupole ion trap 153liquid chromatography-mass
spectrometry coupling 475interfaces 485moving belt interface 485multiplexed electrospray inlet
systems (MUX) 487liquid injection field desorption
ionization see field desorptionliquid matrix
in FAB/LSIMS 381liquid secondary ion mass spectrometry
381ion source 383primary ions 383
LIT see linear quadrupole ion trapLITICR 173localization of double bonds 257lock mass
in SIM 479loose transition state 30

513
Lorentz force 131, 165low-energy collisions 56low-energy EI spectra 199low-temperature EI spectra 199LSIMS see fast atom bombardment see
liquid secondary ion massspectrometry
LT-FAB see fast atom bombardment
Mm/z see mass-to-charge ratioM+• see molecular ionmagnetic sector analyzer
Bainbridge-Jordan 136double-focusing 136forward geometry 137four-sector 144lamination of the yoke 139linked scans 142magnet scan 137Mattauch-Herzog 136Nier-Johnson 136principle 131reversed geometry 137setting resolution 138tandem MS 140
magnetic sector instrument seemagnetic sector analyzer
magnetic sector-oaTOF 173magnetic sector-QIT 173magnetic sector-quadrupole hybrid 173main beam
attenuation in CID 56MALDI see matrix-assisted laser
desorption/ionizationmass accuracy 92
limits 93specification 94
mass analyzer 111ideal 112
mass calibration 99reference list 103
mass calibration compound 99mass defect see mass deficiencymass deficiency 89mass number 67
in definition of m/z 4mass reference compound see mass
calibration compoundmass reference list 99mass spectrograph 133
term 3mass spectrometer 133
components of 4term 3
mass spectrometryprinciple of 3term 2
mass spectroscopy see massspectrometry
mass spectrumdefinition 4
mass sufficiency 90mass-analyzed ion kinetic energy
spectrometrydetermination of KER 39
mass-analyzed ion kinetic energyspectrum 142
mass-analyzed threshold ionization 47massive cluster impact 400mass-to-charge ratio
definition 4Mathieu equations 147, 156MATI see mass-analyzed threshold
ionizationmatrix-assisted laser
desorption/ionization 411carbohydrates 427cationization 420characteristic fingerprint 427delayed extraction 412desalting/cation exchange 421, 429detection limit 432dried droplet preparation 420expansion of plume 415ion formation 413, 416ion source 411laser fluence 413laser irradiance 413laser spot size 414MALDI target 419matrices in IR-MALDI 417matrices in UV-MALDI 417matrix spectra 418oligonucleotides and DNA 429oligosaccharide structures 428polymer endgroups 426role of the matrix 416sample holder 419sample introduction 422sample load 432sample preparation 419

514 Subject Index
solvent-free preparation 421synthetic polymers 425thin layer technique 419types of ions in LDI/MALDI 433
MBSA see molecular beam solidanalysis
MCI see massive cluster impactMcLafferty rearrangement 264
concerted or stepwise 266even-electron analogy 292frequent product ions 270of aldehydes and ketones 264of aromatic hydrocarbons 271of carboxylic acids and derivatives
267requirements 265role of the -hydrogen 267with double hydrogen transfer 272
McLafferty rearrangement with doublehydrogen transfer 272
MCP see detectorsmemory effect 200metastable dissociation 428metastable ion 129metastable ions 33MID see multiple ion detectionMIKES see mass-analyzed ion kinetic
energy spectrometrymolecular beam solid analysis 381molecular ion 194, 224
criteria 263definition 5recognition 263writing conventions 224
molecular ion peakdefinition 5
molecular weight see relative molecularmass
monoisotopic elementsdefinition 68
monoisotopic massdefinition 72
most abundant mass 77moving belt interface
in LC-MS 486MS/MS see tandem MSMS2 see tandem MSMSn 163 see tandem MSmultiple ion detection see selected ion
monitoringmultiply charged ions
isotopic patterns 108MUX see liquid chromatography-mass
spectrometry coupling
Nnano-electrospray 447
chip-based 448droplet size 447memory effects 448spray capillaries 447
nanoESI see nano-electrospraynegative-ion chemical ionization 331neutralization-reionization mass
spectrometry 59NICI 345 see negative-ion chemical
ionizationNier-type ion source 202NIST/EPA/NIH Mass Spectral Database
218nitroarenes 309nitrogen rule 239
effect of autoprotonation 334nominal mass
definition 71deviations 89
nozzle/skimmer CID see skimmer CIDnozzle-skimmer system
in ESI source 445NR-MS see neutralization-reionization
mass spectrometrynucleon number see mass numbernumber of charges
in definition of m/z 4number-average molecular weight
of polymers 425
OoaTOF see orthogonal acceleration TOFodd-electron ion 15, 223oil diffusion pump 181onium ions 292
immonium ions 292McLafferty rearrangement 292, 293onium reaction 293, 296oxonium ions 292sulfonium ions 292
onium reaction 293mechanism 297
open-shell ion see odd-electron ion seeodd-electron ion
organic salts

515
EI mass spectra 291ortho effect see ortho eliminationortho elimination 304
of aromatic molecular ions 305of even-electron ions 306of nitroarenes 310
orthogonal acceleration TOF 125oxonium ions 236, 241
PPA see proton affinity see proton
affinityparticle beam interface 213
in LC-MS 486PBI see particle beam interface see
particle beam interfacePD see 252Californium plasma
desorptionpeak shapes
and KER 39Penning ionization 16peptide sequencing 398perfluorokerosene 212
mass calibration in EI 100perfluorotributylamine 212PES see photoelectron spectroscopyPFK see perfluorokerosenephotoelectron spectroscopy 46photoionization
for determination of IEs 45process 45
physical quantitiesunits for 9
PI see photoionizationPICI see positive-ion chemical
ionizationPIE see pulsed ion extractionpneumatically assisted ESI 445polydispersity
of polymers 425polyisotopic elements
definition 69positive-ion chemical ionization 331
ammonia reagent gas 338energetics of protonation 336isobutane reagent gas 338methane reagent gas 334, 337
post-acceleration detector see detectorspost-source decay 129, 428ppb 92ppm 92
precursor ion scan 143, 153, 488product ion scan 153profile data
representation of spectra 6proton affinity 50, 336protonation
in CI 332PSD see post-source decaypulsed ion extraction 123Py-MS see pyrolysis mass spectrometrypyrolysis DCI 349pyrolysis mass spectrometry 211
QQET see quasi-equilibrium theoryQIT see quadrupole ion trapQITTOF 173QqICR 173QqLIT 173QqTOF 173quadrupole analyzer see linear
quadrupole analyzerquadrupole ion trap 154
automatic gain control 160axial modulation 160mass-selective instability 159mass-selective stability 157MSn 163nonlinear resonances 161principle 155resonant ejection 159shape of electrodes 155trajectories 157
quadrupole mass filter see linearquadrupole analyzer
quantitation 479calibration curve 479external standardization 479internal standardization 480isotope dilution 480
quasi-equilibrium theory 13basic assumptions 14
QUISTOR see quadrupole ion trap
Rr + d see rings plus double bondsradical ion 15, 223radical-site initiated process 229rate constants 27
meaning 28Rayleigh limit 443, 453
516 Subject Index
RDA see retro-Diels-Alder reactionrearrangement fragmentation
k(E) functions 30recombination energy 341reconstructed ion chromatogram 215,
477reference inlet system see reservoir inlet
systemreflector
in TOF-MS 119reflectron see reflectorrelative atomic mass
definition 72variations 73
relative intensitydefinition 5
relative molecular massdefinition 73
reservoir inlet system 211residual air
EI spectrum 97resolution 96
10 % valley definition 96determination 98full width at half maximum definition
96resolving power 96ReTOF see time-of-flight analyzerretro-1,4-addition see ortho eliminationretro-Diels-Alder reaction 276
of isomeric ions 278of natural products 279requirements 276stepwise or concerted 279
retro-ene reaction 292RF-only quadrupole 151
collisional cooling 151collisional focusing 151
RIC see reconstructed ionchromatogram see reconstructed ionchromatogram
Rice-Ramsperger-Marcus-Kassel theory13
ring electrode see quadrupole ion traprings plus double bonds 254RRKM see Rice-Ramsperger-Marcus-
Kassel theoryrules for interpretation of spectra 319
SS/N see signal-to-noise ratio
saddle field gun 382sample introduction system see inlet
systemsample vial 209scrambling 252secondary ion mass spectrometry 381selected ion monitoring 478selected reaction monitoring 488self-CI 333SEM see detectorssensitivity 203septum bleed
in GC-MS 484SFC-MS see supercritical fluid
chromatography-mass spectrometrycoupling
sheath flowESI sprayers for CZE 446
-bond cleavageof functionalized molecules 228of non-functionalized molecules 225of saturated hydrocarbons 258
SI units 9SID see surface-induced dissociationsignal-to-background ratio 204signal-to-noise ratio 204, 477SIM see selected ion monitoringSIMION 205SIMS see liquid secondary ion mass
spectrometryskimmer CID 451soft ionization
chemical ionization 331field desorption 355
SORI see Fourier transform ioncyclotron resonance
SRM see selected reaction monitoringstability diagram see linear quadrupole
analyzerof two-dimensional quadrupole field
147stable ions 33Stevenson's rule 231sulfonium ions 242supercritical fluid chromatography-mass
spectrometry coupling 475supersonic expansion
in ESI 445in FAB 387in MALDI 415
surface-induced dissociation 57

517
SWIFT see Fourier transform ioncyclotron resonance
symbolsin MS 8
systematic approach to spectralinterpretation 320
Ttabular listing
representation of spectra 6tandem mass spectrometry 53, 128
for structure elucidation 488in mixture analysis 475on FT-ICR instruments 172on magnetic sector instruments 140on quadrupole ion traps 163on ReTOF instruments 129on TOF instruments 128on triple quadrupole instruments 153tandem-in-space, 128tandem-in-time 128
tandem MS see tandem massspectrometry
tandem-in-time 163, 172Taylor cone
in ESI 452TDC see time-to-digital converterterminology
usage in MS 7Th see thomsonthermal degradation 289
decarbonylation 289decarboxylation 289elimination of water 290of organic salts 291RDA reaction 289
thermokinetic methodfor detn. of GB 51
thermospray 442thomson 5three-dimensional quadrupole field see
quadrupole ion trapthreshold laser irradiance
in MALDI 413TIC see total ion chromatogram see
total ion chromatogramtight transition state 30time lag focusing 123time scale of MS 32time-of-flight see time-of-flight
analyzer
time-of-flight analyzerflight times 115linear TOF 117principle 113properties 114reflector TOF 119tandem TOF 130
time-to-digital converter 127TLF see time lag focusingTOF see time-of-flight analyzertotal ion chromatogram 214, 477total ion current 214transannular cleavages 311triple quadrupole analyzer see linear
quadrupole analyzertriply charged ion
in EI 16TSP see thermospraytuning
of the instrument 205turbomolecular pump 181
Uu see unified atomic massultrafine-metal-plus-liquid-matrix
method 411ultrahigh-resolution 105
applications 490ultrasonic nebulizer
for ESI 445unified atomic mass
definition 5, 71unit resolution see linear quadrupole
analyzerunits
for physical quantities 9unstable ions 33UV-MALDI 417
Vvacuum 180
cryopump 181oil diffusion pump 181pumping speed 180rotary vane pump 180turbomolecular pump 181
vacuum lock 208velocity of ions 115vertical transitions 18

518 Subject Index
Wweight-average molecular weight
of polymers 425Wiley/NBS mass spectral database 218
ZZEKE-PES see zero kinetic energy
photo-electron spectroscopyzero kinetic energy photoelectron
spectroscopy 46z-spray 449z-stack 177