jsc nordea bank international financial reporting ... · international financial reporting...
TRANSCRIPT
JSC Nordea Bank International Financial Reporting Standards Consolidated Financial Statements and Auditors’ Report 31 December 2014
JSC Nordea Bank
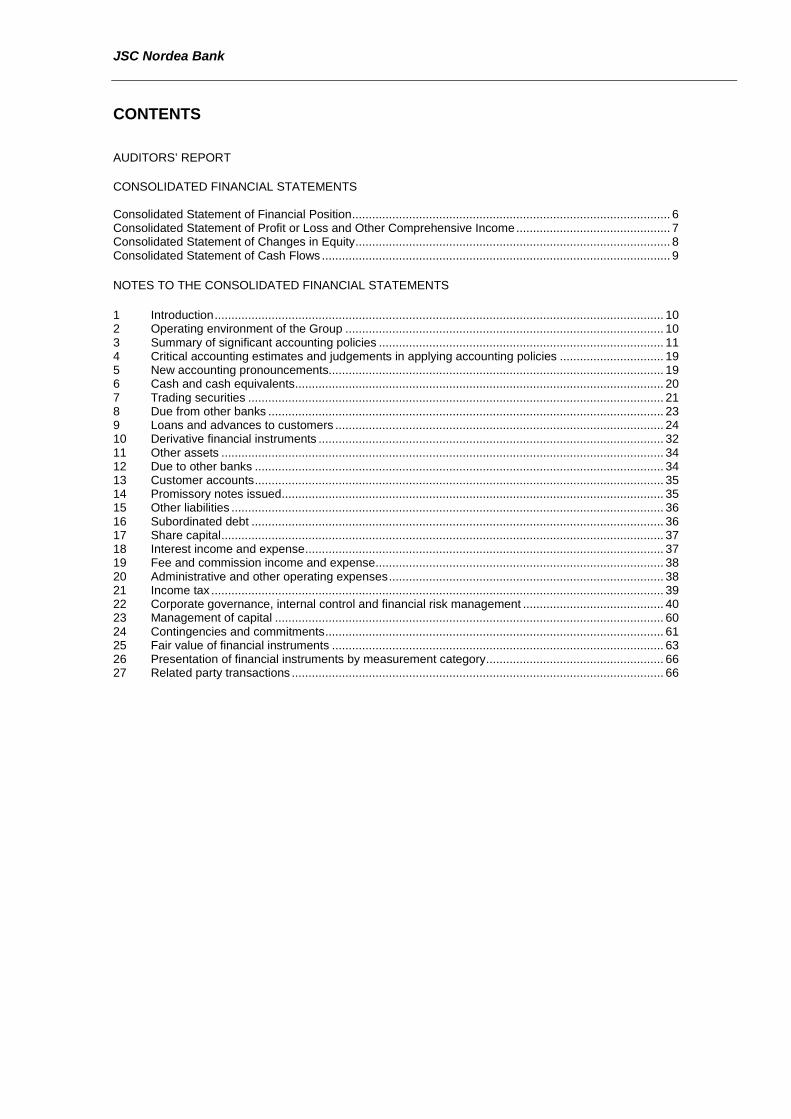
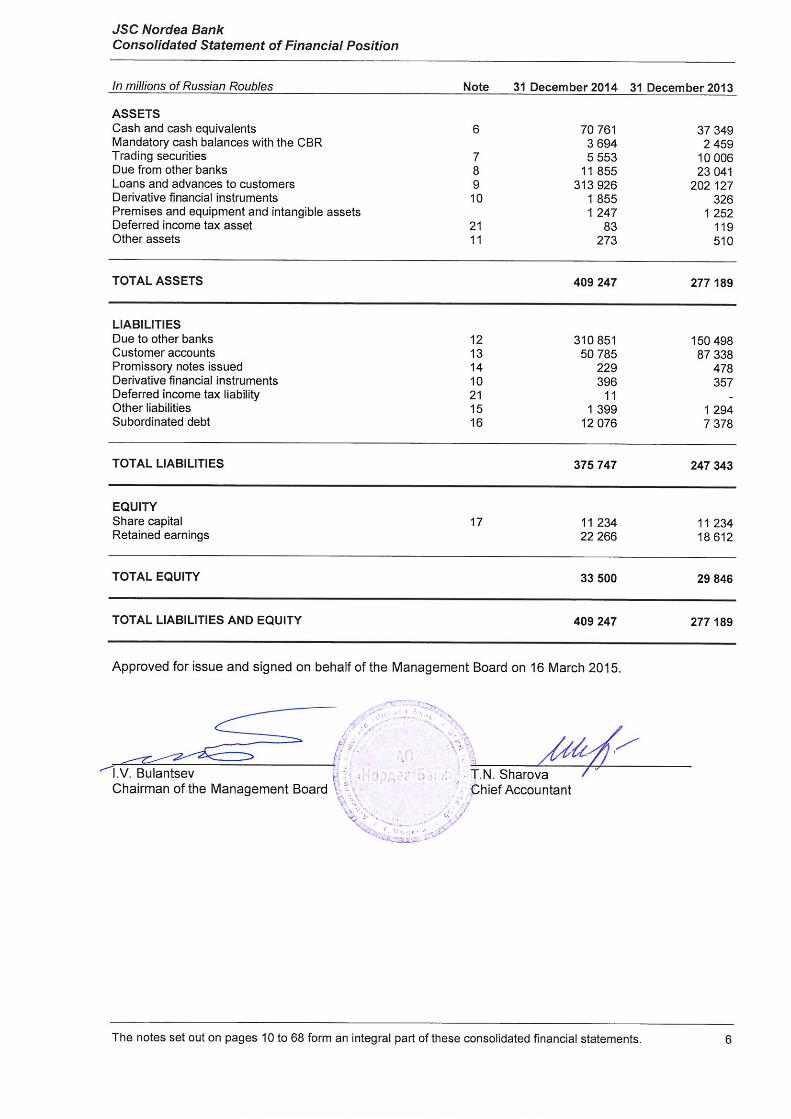
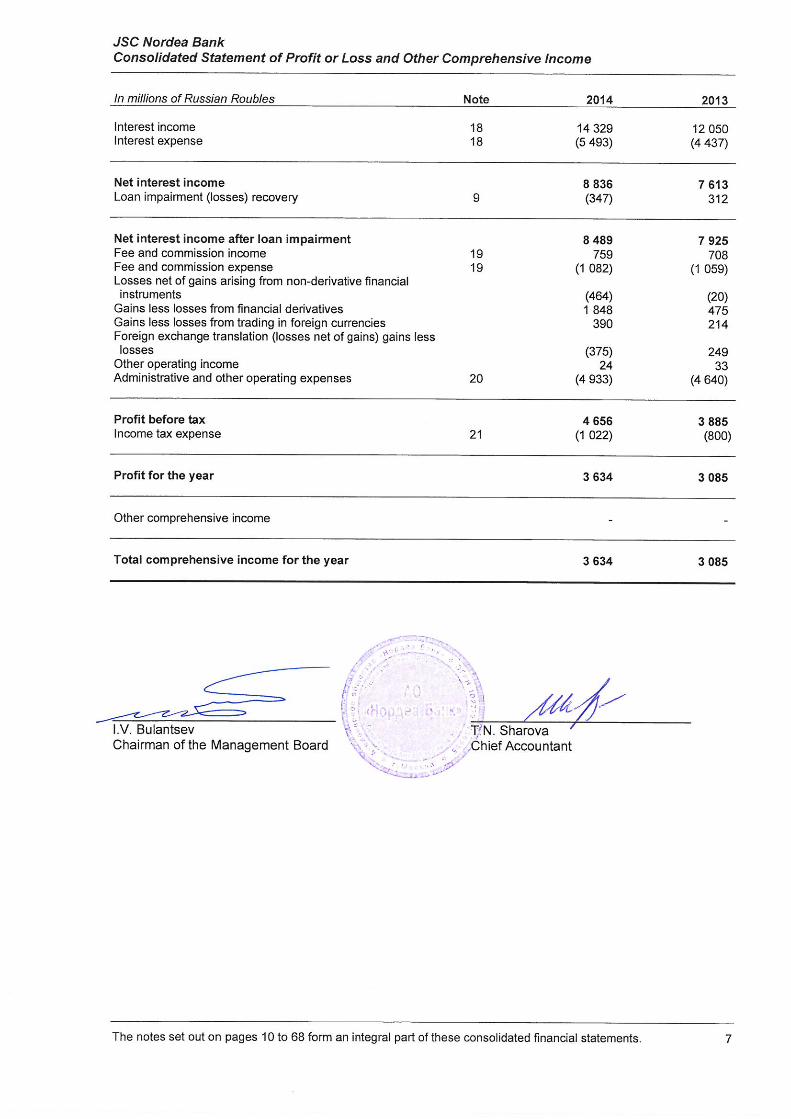
CONTENTS AUDITORS’ REPORT CONSOLIDATED FINANCIAL STATEMENTS Consolidated Statement of Financial Position ............................................................................................... 6 Consolidated Statement of Profit or Loss and Other Comprehensive Income .............................................. 7 Consolidated Statement of Changes in Equity .............................................................................................. 8 Consolidated Statement of Cash Flows ........................................................................................................ 9
NOTES TO THE CONSOLIDATED FINANCIAL STATEMENTS
1 Introduction ...................................................................................................................................... 10 2 Operating environment of the Group ............................................................................................... 10 3 Summary of significant accounting policies ..................................................................................... 11 4 Critical accounting estimates and judgements in applying accounting policies ............................... 19 5 New accounting pronouncements.................................................................................................... 19 6 Cash and cash equivalents .............................................................................................................. 20 7 Trading securities ............................................................................................................................ 21 8 Due from other banks ...................................................................................................................... 23 9 Loans and advances to customers .................................................................................................. 24 10 Derivative financial instruments ....................................................................................................... 32 11 Other assets .................................................................................................................................... 34 12 Due to other banks .......................................................................................................................... 34 13 Customer accounts .......................................................................................................................... 35 14 Promissory notes issued .................................................................................................................. 35 15 Other liabilities ................................................................................................................................. 36 16 Subordinated debt ........................................................................................................................... 36 17 Share capital .................................................................................................................................... 37 18 Interest income and expense ........................................................................................................... 37 19 Fee and commission income and expense ...................................................................................... 38 20 Administrative and other operating expenses .................................................................................. 38 21 Income tax ....................................................................................................................................... 39 22 Corporate governance, internal control and financial risk management .......................................... 40 23 Management of capital .................................................................................................................... 60 24 Contingencies and commitments ..................................................................................................... 61 25 Fair value of financial instruments ................................................................................................... 63 26 Presentation of financial instruments by measurement category ..................................................... 66 27 Related party transactions ............................................................................................................... 66

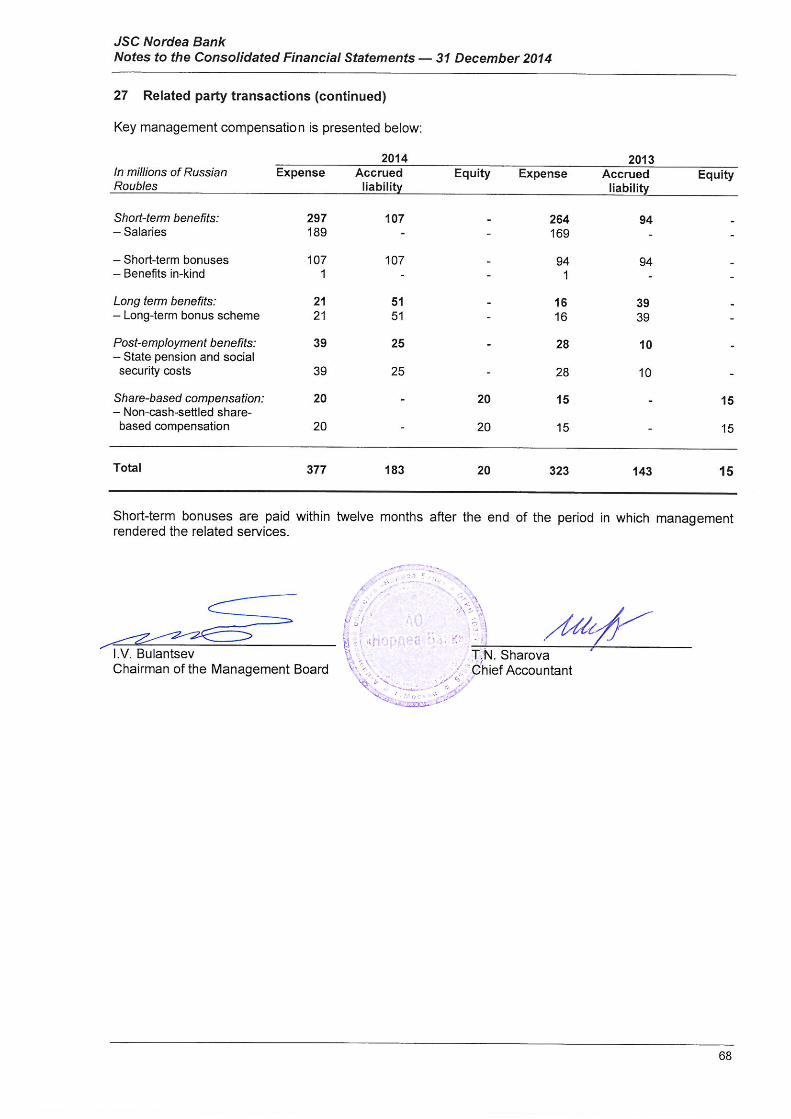
JSC Nordea Bank Notes to the Consolidated Financial Statements — 31 December 2014
1 Introduction
These consolidated financial statements (the “financial statements”) are prepared in accordance with International Financial Reporting Standards (“IFRS”) for the year ended 31 December 2014 for Joint Stock Company Nordea Bank (the “Bank”) and its subsidiaries (the ”Group”).
The Bank was established in 1994 and is domiciled in the Russian Federation. The Bank is a joint stock company and was set up in accordance with Russian regulations.
The Bank changed its full name to Joint Stock Corporation “Nordea Bank” to comply with requirements of Federal Law No 99-FZ dated 5 May 2014 On Amendments to Chapter 4 of the Civil Code of the Russian Federation and Invalidating Certain Provisions of Legislative Acts of the Russian Federation. The Bank registered a new edition of the Charter in the United State Register of Legal Entities on 2 December 2014 to reflect that change.
The Bank’s sole shareholder is Nordea Bank AB. Nordea Bank AB is a public company and has no majority shareholders.
Principal activity. The Group’s principal business activity is commercial banking operations within the Russian Federation. The Bank operates under general banking license No 3016 issued by the Central Bank of the Russian Federation (the “CBR”) since 1994. The Bank participates in the state deposit insurance scheme. The State Deposit Insurance Agency guarantees repayment of 100% of individual deposits up to RUB 1 400 thousand per individual in case of a withdrawal of a bank’s licence or moratorium on payments imposed by the CBR.
The Bank has 4 branches (2013: 4) and 18 additional offices (2013: 19).
As at 31 December 2014, the number of employees was 1 539 (2013: 1 585).
The principal subsidiaries and correspondent shareholdings as at 31 December 2014 and 2013 were as follows:
Name Registration country Principal activity Share
2014 2013 LLC “Nordea Leasing” Russian Federation Leasing 100% 100% LLC “Lanvin” Russian Federation Services 100% 100% LLC “Matis” Russian Federation Trade 100% 100% LLC “Tiks” Russian Federation Real estate - 100%
Registered address and place of business. The Bank’s registered address and place of business is 19/1, 3-ya ulitsa Yamskogo Polya, Moscow, Russian Federation, 125040.
Presentation currency. These financial statements are presented in Russian Roubles (“RUB”), unless otherwise stated.
2 Operating environment of the Group
The Russian Federation displays certain characteristics of an emerging market. Its economy is particularly sensitive to oil and gas prices. The legal, tax and regulatory frameworks continue to develop and are subject to varying interpretation (refer to Note 24).
The ongoing uncertainty and volatility of the financial markets and other risks could have significant negative effects on the Russian financial and corporate sectors. Management determined loan impairment provisions using the “incurred loss” model required by the applicable accounting standards.
These standards require recognition of impairment losses that arose from past events and prohibit recognition of impairment losses that could arise from future events, including future changes in the economic environment, no matter how likely those future events are. Thus actual level of potential impairment losses from financial assets could differ significantly from the current level of provisions (refer to Note 4).
10
JSC Nordea Bank Notes to the Consolidated Financial Statements — 31 December 2014
2 Operating environment of the Group (continued)
The recent conflict in Ukraine and related events has increased the perceived risks of doing business in the Russian Federation. The imposition of economic sanctions on Russian individuals and legal entities by the European Union, the United States of America, Japan, Canada, Australia and others, as well as retaliatory sanctions imposed by the Russian government, has resulted in increased economic uncertainty including more volatile equity markets, a depreciation of the Russian Rouble, a reduction in both local and foreign direct investment inflows and a significant tightening in the availability of credit. In particular, some Russian entities, including banks, may be experiencing difficulties in accessing international equity and debt markets and may become increasingly dependent on Russian state banks to finance their operations. The longer term effects of recently implemented sanctions, as well as the threat of additional future sanctions, are difficult to determine. Management of the Group believes that it takes all the necessary efforts to support the economic stability of the Group in the current environment.
These financial statements reflect management’s assessment of the impact of the Russian business environment on the operations and the financial position of the Group. The future business environment may differ from management’s assessment. Management believes that all necessary steps have been made to ensure sustainability and growth of the Group’s business.
3 Summary of significant accounting policies
Basis of preparation. These consolidated financial statements are prepared in accordance with IFRS under the historical cost convention, as modified by the initial recognition of financial instruments at fair value, and by the revaluation of financial assets and financial instruments categorised as at fair value through profit or loss. The principal accounting policies applied in the preparation of these consolidated financial statements are set out below. These policies are consistently applied to all the periods presented, unless otherwise stated.
Financial information presented in RUB is rounded to the nearest million.
Consolidated financial statements. Subsidiaries are investees controlled by the Group. The Group controls an investee when it is exposed to, or has rights to, variable returns from its involvement with the investee and has the ability to affect those returns through its power over the investee. In particular, the Group consolidates investees that it controls on the basis of de facto circumstances. The financial statements of subsidiaries are included in the consolidated financial statements from the date that control commences until the date that control ceases.
The acquisition method of accounting is used to account for the acquisition of subsidiaries. Identifiable assets acquired and liabilities and contingent liabilities assumed in a business combination are measured at their fair values at the acquisition date, irrespective of the extent of any non-controlling interest.
The consideration transferred for the acquiree is measured at the fair value of the assets given up, equity instruments issued and liabilities incurred or assumed, including fair value of assets or liabilities from contingent consideration arrangements, but excludes acquisition related costs such as advisory, legal, valuation and similar professional services. Transaction costs incurred for issuing equity instruments are deducted from equity; transaction costs incurred for issuing debt are deducted from its carrying amount and all other transaction costs associated with the acquisition are expensed.
Intercompany transactions, balances and unrealised gains on transactions between Group’s companies are eliminated; unrealised losses are also eliminated unless the cost cannot be recovered. The Bank and all of its subsidiaries use uniform accounting policies consistent with the Group’s policies.
Financial instruments — key measurement terms. Depending on their classification financial instruments are carried at fair value or amortised cost as described below.
Fair value is the price that would be received to sell an asset or paid to transfer a liability in an orderly transaction between market participants at the measurement date in the principal, or in its absence, the most advantageous market to which the Group has access at that date. The fair value of a liability reflects its non-performance risk.
11
JSC Nordea Bank Notes to the Consolidated Financial Statements — 31 December 2014
3 Summary of significant accounting policies (continued)
When available, the Group measures the fair value of an instrument using quoted prices in an active market for that instrument. A market is regarded as active if transactions for the asset or liability take place with sufficient frequency and volume to provide pricing information on an ongoing basis. When there is no quoted price in an active market, the Group uses valuation techniques that maximise the use of relevant observable inputs and minimise the use of unobservable inputs. The chosen valuation technique incorporates all the factors that market participants would take into account in these circumstances.
The best evidence of the fair value of a financial instrument at initial recognition is normally the transaction price, i.e., the fair value of the consideration given or received. If the Group determines that the fair value at initial recognition differs from the transaction price and the fair value is evidenced neither by a quoted price in an active market for an identical asset or liability nor based on a valuation technique that uses only data from observable markets, the financial instrument is initially measured at fair value, adjusted to defer the difference between the fair value at initial recognition and the transaction price. Subsequently, that difference is recognised in profit or loss on an appropriate basis over the life of the instrument but no later than when the valuation is supported wholly by observable market data or the transaction is closed out.
Transaction costs are incremental costs that are directly attributable to the acquisition, issue or disposal of a financial instrument. An incremental cost is one that would not have been incurred if the transaction had not taken place. Transaction costs include fees and commissions paid to agents (including employees acting as selling agents), advisors, brokers and dealers, levies by regulatory agencies and securities exchanges, and transfer taxes and duties. Transaction costs do not include debt premiums or discounts, financing costs or internal administrative or holding costs.
Amortised cost is the amount at which the financial instrument was recognised at initial recognition less any principal repayments, plus accrued interest, and for financial assets less any write-down for incurred impairment losses. Accrued interest includes amortisation of transaction costs deferred at initial recognition and of any premium or discount to maturity amount using the effective interest method. Accrued interest income and accrued interest expense, including both accrued coupon and amortised discount or premium (including fees deferred at origination, if any), are not presented separately and are included in the carrying values of related items in the consolidated statement of financial position.
The effective interest method is a method of allocating interest income or interest expense over the relevant period so as to achieve a constant periodic rate of interest (effective interest rate) on the carrying amount. The effective interest rate is the rate that exactly discounts estimated future cash payments or receipts (excluding future credit losses) through the expected life of the financial instrument or a shorter period, if appropriate, to the net carrying amount of the financial instrument. The effective interest rate discounts cash flows of variable interest instruments to the next interest repricing date except for the premium or discount which reflects the credit spread over the floating rate specified in the instrument, or other variables that are not reset to market rates. Such premiums or discounts are amortised over the whole expected life of the instrument. The present value calculation includes all fees paid or received between parties to the contract that are an integral part of the effective interest rate.
Initial recognition of financial instruments. Trading securities, derivatives and other financial instruments at fair value through profit or loss are initially recorded at fair value. All other financial instruments are initially recorded at fair value plus transaction costs. Fair value at initial recognition is best evidenced by the transaction price. A gain or loss on initial recognition is only recorded if there is a difference between fair value and transaction price which can be evidenced by other observable current market transactions in the same instrument or by a valuation technique whose inputs include only data from observable markets.
All purchases and sales of financial assets that require delivery within the time frame established by regulation or market convention (“regular way” purchases and sales) are recorded at trade date, which is the date that the Group commits to deliver a financial asset. All other purchases are recognised when the entity becomes a party to the contractual provisions of the instrument.
12
JSC Nordea Bank Notes to the Consolidated Financial Statements — 31 December 2014
3 Summary of significant accounting policies (continued)
Derecognition of financial assets The Group derecognises financial assets when (a) the assets are redeemed or the rights to cash flows from the assets otherwise expire or (b) the Group has transferred the rights to the cash flows from the financial assets or entered into a qualifying pass-through arrangement while (i) also transferring substantially all the risks and rewards of ownership of the assets or (ii) neither transferring nor retaining substantially all risks and rewards of ownership but not retaining control. Control is retained if the counterparty does not have the practical ability to sell the asset in its entirety to an unrelated third party without needing to impose restrictions on the sale.
Cash and cash equivalents. Cash and cash equivalents are items which are readily convertible to known amounts of cash and which are subject to an insignificant risk of changes in value. All short term interbank deposits, except for overnight placements, are included in due from other banks. Cash and cash equivalents are carried at amortised cost.
Mandatory cash balances with the CBR. Mandatory cash balances with the CBR are carried at amortised cost and represent non-interest bearing mandatory reserve deposits which are not available to finance the Group's day to day operations and hence are not considered as part of cash and cash equivalents for the purposes of the consolidated statement of cash flows.
Trading securities. Trading securities are financial assets which are either acquired for generating a profit from short-term fluctuations in price or trader’s margin, or are securities included in a portfolio in which a pattern of short-term trading exists. The Group classifies securities into trading securities if it has an intention to sell them within a short period after purchase, i.e. within six months. Financial assets other than loans and receivables are permitted to be reclassified out of at fair value through profit or loss category only in rare circumstances arising from a single event that is unusual and highly unlikely to reoccur in the near term. Financial assets that would meet the definition of loans and receivables may be reclassified if the Group has the intention and ability to hold these financial assets for the foreseeable future or until maturity.
Trading securities are carried at fair value. Interest earned on trading securities calculated using the effective interest method is presented in profit or loss for the year as interest income. Dividends are included in dividend income within other operating income when the Group’s right to receive the dividend payment is established and it is probable that the dividends will be collected. All other elements of the changes in the fair value and gains or losses on derecognition are recorded in profit or loss for the year as gains less losses from trading securities in the period in which they arise.
Due from other banks. Amounts due from other banks are recorded when the Group advances money to counterparty banks with no intention of trading the resulting unquoted non-derivative receivable due on fixed or determinable dates. Amounts due from other banks are carried at amortised cost.
Loans and advances to customers. Loans and advances to customers are recorded when the Group advances money to purchase or originate an unquoted non-derivative receivable from a customer due on fixed or determinable dates and has no intention of trading the receivable. Loans and advances to customers are carried at amortised cost.
Impairment of financial assets carried at amortised cost. Impairment losses are recognised in profit or loss for the year when incurred as a result of one or more events (“loss events”) that occurred after the initial recognition of the financial asset and which have an impact on the amount or timing of the estimated future cash flows of the financial asset or group of financial assets that can be reliably estimated. If the Group determines that no objective evidence exists that impairment has been incurred for an individually assessed financial asset, whether significant or not, it includes the asset in a group of financial assets with similar credit risk characteristics and collectively assesses them for impairment. The primary factor that the Group considers in determining whether a financial asset is impaired is its overdue status.
The following other principal criteria are also used to determine whether there is objective evidence that an impairment loss has occurred:
- any instalment is overdue and the late payment cannot be attributed to a delay caused by the settlement systems,
- the borrower experiences a significant financial difficulty as evidenced by the borrower’s financial information that the Group obtains,
- the borrower considers bankruptcy or a financial reorganisation,
13
JSC Nordea Bank Notes to the Consolidated Financial Statements — 31 December 2014
3 Summary of significant accounting policies (continued)
- there is an adverse change in the payment status of the borrower as a result of changes in the national or local economic conditions that impact the borrower, or
- the value of collateral significantly decreases as a result of deteriorating market conditions.
For the purposes of collective evaluation of impairment, financial assets are grouped on the basis of similar credit risk characteristics. Those characteristics are relevant to the estimation of future cash flows for groups of such assets by being indicative of the debtors’ ability to pay all amounts due according to the contractual terms of the assets being evaluated.
Future cash flows in a group of financial assets that are collectively evaluated for impairment are estimated on the basis of the contractual cash flows of the assets and the experience of management in respect of the extent to which amounts will become overdue as a result of past loss events and the success of recovery of overdue amounts. Past experience is adjusted on the basis of current observable data to reflect the effects of current conditions that did not affect past periods and to remove the effects of past conditions that do not exist currently.
If the terms of an impaired financial asset held at amortised cost are renegotiated or otherwise modified because of financial difficulties of the borrower or issuer, impairment is measured using the original effective interest rate before the modification of terms. The renegotiated asset is then derecognised and a new asset is recognised at its fair value only if the terms of the asset were modified significantly. This is normally evidenced by a substantial difference between the present values of the original cash flows and the new expected cash flows.
Impairment losses are recognised through an allowance account to write down the asset’s carrying amount to the present value of expected cash flows (which exclude future credit losses that have not been incurred) discounted at the original effective interest rate of the asset. The calculation of the present value of the estimated future cash flows of a collateralised financial asset reflects the cash flows that may result from foreclosure less costs for obtaining and selling the collateral, whether or not foreclosure is probable.
If in a subsequent period the amount of the impairment loss decreases and the decrease can be related objectively to an event occurring after the impairment was recognised (such as an improvement in the debtor’s credit rating), the previously recognised impairment loss is reversed by adjusting the allowance account through profit or loss for the year.
Uncollectible assets are written off against the related allowance for loan impairment after all the necessary procedures to recover the asset have been completed and the amount of the loss has been determined. Subsequent recoveries of amounts previously written off are credited to the impairment allowance account.
Repossessed collateral. Repossessed collateral represents financial and non-financial assets acquired by the Group in settlement of overdue loans. The assets are initially recognised at fair value when acquired and included in premises and equipment, other financial assets or investment properties within other assets depending on their nature and the Group's intention in respect of recovery of these assets, and are subsequently remeasured and accounted for in accordance with the accounting policies for these categories of assets.
Where repossessed collateral results in acquiring control or significant influence over a business, the Group recognises acquisition of a subsidiary or associate with carrying value of the settled loan representing the cost of acquisition.
Credit related commitments. The Group enters into credit related commitments, including letters of credit and financial guarantees. Financial guarantees represent irrevocable commitments to make payments in the event that a customer cannot meet its obligations to third parties and carry the same credit risk as loans. Financial guarantees and commitments to provide a loan are initially recognised at their fair value, which is normally evidenced by the amount of fees received. This amount is amortised on a straight line basis over the life of the commitment, except for commitments to originate loans if it is probable that the Group will enter into a specific lending arrangement and does not expect to sell the resulting loan shortly after origination; such loan commitment fees are deferred and included in the carrying value of the loan on initial recognition. At the end of each reporting period, the commitments are measured at the higher of (i) the remaining unamortised balance of the amount at initial recognition and (ii) the best estimate of expenditure required to settle the commitment at the end of each reporting period.
14

JSC Nordea Bank Notes to the Consolidated Financial Statements — 31 December 2014
3 Summary of significant accounting policies (continued)
Sale and repurchase agreements and lending of securities. Sale and repurchase agreements (“repo agreements”) which effectively provide a return to the counterparty are treated as secured financing transactions. Securities sold under such sale and repurchase agreements are not derecognised. The securities are not reclassified in the consolidated statement of financial position unless the transferee has the right by contract or custom to sell or repledge the securities, in which case they are reclassified as assets pledged. The corresponding liability is presented within amounts due to other banks or customer accounts.
Securities purchased under agreements to resell (“reverse repo agreements”) which effectively provide a return to the Group are recorded as due from other banks or loans and advances to customers, as appropriate. The difference between the sale and repurchase price is treated as interest income and accrued over the life of repo agreements using the effective interest method.
Securities lent to counterparties for a fixed fee are retained in the financial statements in their original category in the consolidated statement of financial position unless the counterparty has the right by contract or custom to sell or repledge the securities, in which case they are reclassified and presented separately. Securities borrowed for a fixed fee are not recorded in the financial statements, unless these are sold to third parties, in which case the obligation to return the securities is recorded at fair value in other borrowed funds.
Premises and equipment. Premises and equipment are stated at cost, restated to the equivalent purchasing power of the Russian Rouble at 31 December 2002 for assets acquired prior to 1 January 2003, less accumulated depreciation and impairment losses, where required.
Costs of minor repairs and maintenance are expensed when incurred. Costs of replacing major parts or components of premises and equipment items are capitalised and the replaced part is retired.
At the end of each reporting period management assesses whether there is any indication of impairment of premises and equipment. If any such indication exists, management estimates the recoverable amount, which is determined as the higher of an asset’s fair value less costs to sell and its value in use. The carrying amount is reduced to the recoverable amount and the impairment loss is recognised in profit or loss for the year. An impairment loss recognised for an asset in prior years is reversed if there has been a change in the estimates used to determine the asset’s value in use or fair value less costs to sell.
Gains and losses on disposals determined by comparing proceeds with carrying amount are recognised in profit or loss for the year (within other operating income or expenses).
Depreciation. Depreciation of fixed assets is calculated using the straight-line method to allocate their cost to their residual values over their estimated useful lives as follows:
Useful lives in years Premises 30–50 Leasehold improvements 7–10 Office equipment 2–7 Computers 3–5 Furniture and fittings 5 Motor vehicles 3–4
The residual value of an asset is the estimated amount that the Group would currently obtain from disposal of the asset less the estimated costs of disposal, if the asset were already of the age and in the condition expected at the end of its useful life. The assets’ residual values and useful lives are reviewed, and adjusted if appropriate, at the end of each reporting period.
15

JSC Nordea Bank Notes to the Consolidated Financial Statements — 31 December 2014
3 Summary of significant accounting policies (continued)
Intangible assets. The Group’s intangible assets have definite useful lives and primarily include capitalised computer software and acquired computer software licenses which are capitalised on the basis of the costs incurred to acquire and bring to use the specific software. Development costs that are directly associated with identifiable and unique software controlled by the Group are recorded as intangible assets if the inflow of incremental economic benefits exceeding costs is probable. Capitalised costs include staff costs of the software development team and an appropriate portion of relevant overheads. All other costs associated with computer software, e.g. its maintenance, are expensed when incurred. Capitalised computer software is amortised on a straight line basis over expected useful lives of 1 to 7 years.
Operating leases. Where the Group is a lessee in a lease which does not transfer substantially all the risks and rewards incidental to ownership from the lessor to the Group, the total lease payments are charged to profit or loss for the year (as lease expenses) on a straight-line basis over the period of the lease.
Finance lease receivables. Where the Group is a lessor in a lease which transfers substantially all the risks and rewards incidental to ownership to the lessee, the assets leased out are presented as a finance lease receivable and carried at the present value of the future lease payments. Finance lease receivables are initially recognised at commencement (when the lease term begins) using a discount rate determined at inception. Finance lease receivables are recorded within loans and advances to customers.
The difference between the gross receivable and the present value represents unearned finance income. This income is recognised over the term of the lease using the net investment method (before tax), which reflects a constant periodic rate of return. Incremental costs directly attributable to negotiating and arranging the lease are included in the initial measurement of the finance lease receivable and reduce the amount of income recognised over the lease term. Finance income from leases is recorded within in profit or loss for the year.
Impairment losses are recognised in profit or loss for the year when incurred as a result of one or more events (“loss events”) that occurred after the initial recognition of finance lease receivables. The Group uses the same principal criteria to determine whether there is objective evidence that an impairment loss has occurred, as for loans carried at amortised cost. Impairment losses are recognised through an allowance account to write down the receivables’ net carrying amount to the present value of expected cash flows (which exclude future credit losses that have not been incurred), discounted at the interest rates implicit in the finance leases. The estimated future cash flows reflect the cash flows that may result from obtaining and selling the assets subject to the lease.
Due to other banks. Amounts due to other banks are recorded when money or other assets are advanced to the Group by counterparty banks. The non-derivative liability is carried at amortised cost.
Customer accounts. Customer accounts are non-derivative liabilities to individuals, state or corporate customers and are carried at amortised cost.
Promissory notes issued. Promissory notes issued are stated at amortised cost. If the Group purchases its own promissory notes issued, they are removed from the consolidated statement of financial position, and the difference between the carrying amount of the liability and the consideration paid is included in gains or losses arising from retirement of debt.
Derivative financial instruments. Derivative financial instruments, including foreign exchange contracts, interest rate futures, forward rate agreements, currency and interest rate swaps, and currency and interest rate options are carried at their fair value.
All derivative instruments are carried as assets when fair value is positive and as liabilities when fair value is negative. Changes in the fair value of derivative instruments are included in profit or loss for the year (gains less losses on derivatives). The Group does not apply hedge accounting.
Subordinated debt. Subordinated debt is recorded when money is advanced to the Group by counterparty banks. Subordinated debt is carried at amortised cost.
16
JSC Nordea Bank Notes to the Consolidated Financial Statements — 31 December 2014
3 Summary of significant accounting policies (continued)
Income tax. Income tax is provided for in the financial statements in accordance with the legislation enacted or substantively enacted as at the end of the reporting period. The income tax charge comprises current tax and deferred tax and is recognised in profit or loss for the year except if it is recognised in other comprehensive income or directly in equity because it relates to transactions that are also recognised, in the same or a different period, in other comprehensive income or directly in equity.
Current tax is the amount expected to be paid to or recovered from the taxation authorities in respect of taxable profits or losses for the current and prior periods. Taxable profits or losses are based on estimates if financial statements are authorised prior to filing relevant tax returns. Taxes other than on income are recorded within administrative and other operating expenses.
Deferred income tax is recognised for tax loss carry forwards and temporary differences arising between the tax bases of assets and liabilities and their carrying amounts for financial reporting purposes. In accordance with the initial recognition exemption, deferred taxes are not recorded for temporary differences on initial recognition of an asset or a liability in a transaction other than a business combination if the transaction, when initially recorded, affects neither accounting nor taxable profit. Deferred tax balances are measured at tax rates enacted or substantively enacted at the end of the reporting period which are expected to apply to the period when the temporary differences will reverse or the tax loss carry forwards will be utilised. Deferred tax assets for deductible temporary differences and tax loss carry forwards are recorded only to the extent that it is probable that future taxable profit will be available against which the deductions can be utilised.
Uncertain tax positions. The Group’s uncertain tax positions are reassessed by management at the end of each reporting period. Liabilities are recorded for income tax positions that are determined by management as more likely than not to result in additional taxes being levied if the positions were to be challenged by the tax authorities. The assessment is based on the interpretation of tax laws that have been enacted or substantively enacted by the end of the reporting period and any known court or other rulings on such issues. Liabilities for penalties, interest and taxes other than on income are recognised based on management’s best estimate of the expenditure required to settle the obligations at the end of the reporting period.
Provisions for liabilities and charges are non-financial liabilities of uncertain timing or amount. They are accrued when the Group has a present legal or constructive obligation as a result of past events, it is probable that an outflow of resources embodying economic benefits will be required to settle the obligation, and a reliable estimate of the amount of the obligation can be made.
Trade and other payables. Trade payables are accrued when the counterparty has performed its obligations under the contract and are carried at amortised cost.
Share capital. Ordinary shares that are not redeemable and with discretionary dividends are classified as equity. Incremental costs directly attributable to the issue of new shares are shown in equity as a deduction, net of tax, from the proceeds. Any excess of the fair value of consideration received over the par value of shares issued is recorded as share premium in equity.
Employee share scheme. Employees participating in Long Term Incentive Programmes are granted share-based and equity-settled rights, i.e. rights to receive shares for free or to acquire shares in Nordea Bank AB at a significant discount compared to the share price at grant date. The value of such rights is expensed. The expense is based on the estimated fair value of each right at grant date. The total fair value of these rights is determined based on the estimate of the number of rights that will eventually vest, which is reassessed at each reporting date, and is expensed on a straight-line basis over the vesting period. The vesting period is the period that the employees have to remain in service in the Group in order for their rights to vest.
Income and expense recognition. Interest income and expense are recorded for all debt instruments on an accrual basis using the effective interest method. This method defers, as part of interest income or expense, all fees paid or received between the parties to the contract that are an integral part of the effective interest rate, transaction costs and all other premiums or discounts.
17

JSC Nordea Bank Notes to the Consolidated Financial Statements — 31 December 2014
3 Summary of significant accounting policies (continued)
Fees integral to the effective interest rate include origination fees received or paid by the entity relating to the creation or acquisition of a financial asset or issuance of a financial liability, for example fees for evaluating creditworthiness, evaluating and recording guarantees or collateral, negotiating the terms of the instrument and for processing transaction documents. Commitment fees received by the Group to originate loans at market interest rates are integral to the effective interest rate if it is probable that the Group will enter into a specific lending arrangement and does not expect to sell the resulting loan shortly after origination. The Group does not designate loan commitments as financial liabilities at fair value through profit or loss.
When loans and other debt instruments become doubtful of collection, they are written down to the present value of expected cash inflows and interest income is thereafter recorded for the unwinding of the present value discount based on the asset’s effective interest rate which was used to measure the impairment loss.
All other fees, commissions and other income and expense items are generally recorded on an accrual basis by reference to completion of the specific transaction assessed on the basis of the actual service provided as a proportion of the total services to be provided. Loan syndication fees are recognised as income when the syndication has been completed and the Group retained no part of the loan package for itself or retained a part at the same effective interest rate as for the other participants.
Commissions and fees arising from negotiating, or participating in the negotiation of a transaction for a third party, such as the acquisition of loans, shares or other securities or the purchase or sale of businesses, and which are earned on execution of the underlying transaction, are recorded on its completion. Portfolio and other management advisory and service fees are recognised based on the applicable service contracts, usually on a time-proportion basis. Asset management fees related to investment funds are recorded rateably over the period the service is provided. The same principle is applied for wealth management, financial planning and custody services that are continually provided over an extended period of time.
Foreign currency translation. The functional currency of the Group companies is the currency of the primary economic environment in which the Group companies operate. The functional currency and presentation currency is the national currency of the Russian Federation, Russian Roubles.
Foreign exchange gains and losses resulting from the settlement of transactions and from the translation of monetary assets and liabilities into roubles at the official exchange rates of the CBR at the transaction date are recognised in profit or loss for the year (as foreign exchange translation gains less losses). Translation at year-end rates does not apply to non-monetary items that are measured at historical cost. Non-monetary items measured at fair value in a foreign currency, including equity investments, are translated using the exchange rates at the date when the fair value was determined. Effects of exchange rate changes on non-monetary items measured at fair value in a foreign currency are recorded as part of the fair value gain or loss.
As at 31 December 2014, the principal rates of exchange used for translating foreign currency balances was USD 1 = RUB 56.2584 (2013: USD 1 = RUB 32.7292) and EUR 1 = RUB 68.3427 (2013: EUR 1 = RUB 44.9699).
Fiduciary assets. Assets held by the Group in its own name, but on the account of third parties, are not reported in the consolidated statement of financial position. Commissions received from fiduciary activities are shown in fee and commission income.
Offsetting. Financial assets and liabilities are offset and the net amount is reported in the consolidated statement of financial position only when there is a legally enforceable right to offset the recognised amounts, and there is an intention to either settle on a net basis, or to realise the asset and settle the liability simultaneously.
Staff costs and related contributions. Wages, salaries, contributions to the Russian Federation state pension and social insurance funds, paid annual leave and sick leave and bonuses are accrued in the period in which the associated services are rendered by the employees.
Presentation of statement of financial position in order of liquidity. The Group does not have a clearly identifiable operating cycle and therefore does not present current and non-current assets and liabilities separately in the consolidated statement of financial position. Instead, assets and liabilities are presented in order of their liquidity.
18
JSC Nordea Bank Notes to the Consolidated Financial Statements — 31 December 2014
4 Critical accounting estimates and judgements in applying accounting policies
The Group makes estimates and assumptions that affect the amounts recognised in the financial statements. Estimates and judgements are continually evaluated and are based on management’s experience and other factors, including expectations of future events that are believed to be reasonable under the circumstances. Management also makes certain judgements, apart from those involving estimations, in the process of applying the accounting policies. Judgements that have the most significant effect on the amounts recognised in the financial statements and estimates that can cause a significant adjustment to the carrying amount of assets and liabilities include:
Impairment losses on loans and advances. The Group regularly reviews its loan portfolios to assess impairment. In determining whether an impairment loss should be recorded in profit or loss for the year, the Group makes judgements as to whether there is any observable data indicating that there is a measurable decrease in the estimated future cash flows from a portfolio of loans before the decrease can be identified with an individual loan in that portfolio. This evidence may include observable data indicating that there has been an adverse change in the payment status of borrowers in a group, or national or local economic conditions that correlate with defaults on assets in the group. Management uses estimates based on historical loss experience for assets with credit risk characteristics and objective evidence of impairment similar to those in the portfolio when scheduling its future cash flows. If there is objective evidence that an impairment loss on a loan or receivable has been incurred, the amount of the loss is measured as the difference between the carrying amount of the loan or receivable and the present value of estimated future cash flows including amounts recoverable from guarantees and collateral discounted at the loan or receivable’s original effective interest rate. Contractual cash flows and historical loss experience adjusted on the basis of relevant observable data that reflect current economic conditions provide the basis for estimating expected cash flows. The methodology and assumptions used for estimating both the amount and timing of future cash flows are reviewed regularly to reduce any differences between loss estimates and actual loss experience.
Fair value of derivatives and certain other instruments. The fair values of financial derivatives that are not quoted in active markets are determined by using valuation techniques. Where valuation techniques (for example, models) are used to determine fair values, they are validated and periodically reviewed by qualified personnel independent of the operating unit that originated them. To the extent practical, models use only observable data, however areas such as credit risk (both own and counterparty), volatilities and correlations require management to make estimates. Changes in assumptions about these factors could affect reported fair values.
5 New accounting pronouncements
The Group has adopted the following amendments to standards, including any consequential amendments to other standards, with a date of initial application of 1 January 2014:
Amendments to IAS 32 Financial Instruments: Presentation - Offsetting Financial Assets and Financial Liabilities do not introduce new rules for offsetting financial assets and liabilities; rather they clarify the offsetting criteria to address inconsistencies in their application. The amendments specify that an entity currently has a legally enforceable right to set-off if that right is not contingent on a future event; and enforceable both in the normal course of business and in the event of default, insolvency or bankruptcy of the entity and all counterparties.
The Group does not expect that these amendments will have an impact on its financial statements.
A number of new standards, amendments to standards and interpretations are not yet effective as at 31 December 2014, and are not applied in preparing these consolidated financial statements. Of these pronouncements, potentially the following will have an impact on the financial position and performance. The Group plans to adopt these pronouncements when they become effective.
IFRS 9 Financial Instruments, published in July 2014, is intended ultimately to replace International Financial Reporting Standard IAS 39 Financial Instruments: Recognition and Measurement. The Group recognises that the new standard introduces many changes to accounting for financial instruments and is likely to have a significant impact on the financial statements. The Group has not analysed the impact of these changes yet. The Group does not intend to adopt this standard early. The standard will be effective for annual periods beginning on or after 1 January 2018 and will be applied retrospectively with some exemptions.
19

JSC Nordea Bank Notes to the Consolidated Financial Statements — 31 December 2014
5 New accounting pronouncements (continued)
Various Improvements to IFRS are dealt with on a standard-by-standard basis. All amendments, which result in accounting changes for presentation, recognition or measurement purposes, will come into effect not earlier than 1 January 2015. The Group has not yet analysed the likely impact of the improvements on its financial position or performance.
Unless otherwise described above, the new standards and interpretations are not expected to significantly affect the financial statements.
6 Cash and cash equivalents
In millions of Russian Roubles 2014 2013 Cash on hand 6 903 1 160 Cash balances with the CBR and overnight placements (other than mandatory cash balances) 29 531 2 795
Correspondent accounts and overnight placements with other banks: – the Russian Federation 1 241 890 – OECD countries 29 343 29 978 Settlements with trading systems 3 743 2 526 Total cash and cash equivalents 70 761 37 349
Analysis by credit quality of cash and cash equivalents balances based on internal ratings at 31 December 2014 is as follows (refer to Note 22):
In millions of Russian Roubles
Cash on hand Cash balances with the CBR
and overnight placements
Correspondent accounts and
overnight placements
with other banks – the
Russian Federation
Correspondent accounts and
overnight placements
with other banks – OECD
countries
Settlements with trading
systems
Total
Neither past due nor impaired
– Cash on hand 6 903 - - - - 6 903
– Nordea Group - - - 28 974 - 28 974
– Central Bank of the Russian Federation - 29 531 - - - 29 531
– 5 rated - - - 369 - 369 – 4 rated - - 1 241 - 3 743 4 984 Total cash and cash equivalents 6 903 29 531 1 241 29 343 3 743 70 761
20
JSC Nordea Bank Notes to the Consolidated Financial Statements — 31 December 2014
6 Cash and cash equivalents (continued)
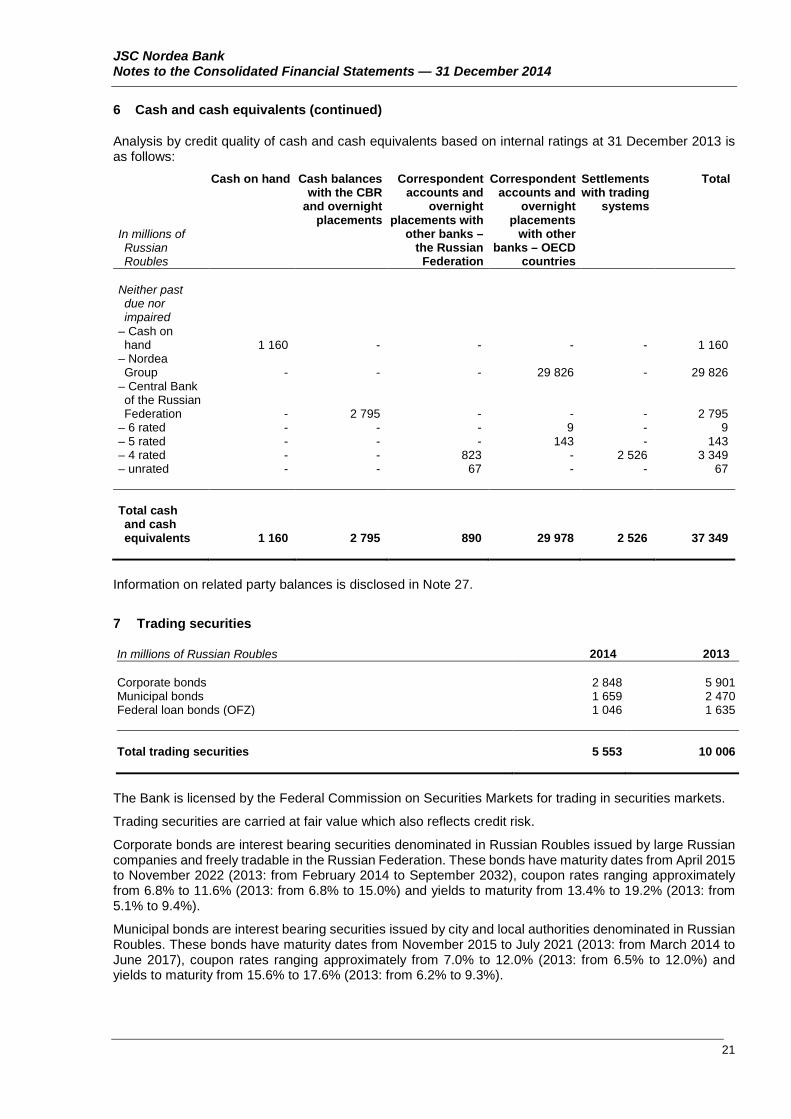
Analysis by credit quality of cash and cash equivalents based on internal ratings at 31 December 2013 is as follows:
In millions of Russian Roubles
Cash on hand Cash balances with the CBR
and overnight placements
Correspondent accounts and
overnight placements with
other banks – the Russian
Federation
Correspondent accounts and
overnight placements
with other banks – OECD
countries
Settlements with trading
systems
Total
Neither past due nor impaired
– Cash on hand 1 160 - - - - 1 160
– Nordea Group - - - 29 826 - 29 826
– Central Bank of the Russian Federation - 2 795 - - - 2 795
– 6 rated - - - 9 - 9 – 5 rated - - - 143 - 143 – 4 rated - - 823 - 2 526 3 349 – unrated - - 67 - - 67 Total cash and cash equivalents 1 160 2 795 890 29 978 2 526 37 349
Information on related party balances is disclosed in Note 27.
7 Trading securities
In millions of Russian Roubles 2014 2013
Corporate bonds 2 848 5 901 Municipal bonds 1 659 2 470 Federal loan bonds (OFZ) 1 046 1 635
Total trading securities 5 553 10 006
The Bank is licensed by the Federal Commission on Securities Markets for trading in securities markets.
Trading securities are carried at fair value which also reflects credit risk.
Corporate bonds are interest bearing securities denominated in Russian Roubles issued by large Russian companies and freely tradable in the Russian Federation. These bonds have maturity dates from April 2015 to November 2022 (2013: from February 2014 to September 2032), coupon rates ranging approximately from 6.8% to 11.6% (2013: from 6.8% to 15.0%) and yields to maturity from 13.4% to 19.2% (2013: from 5.1% to 9.4%).
Municipal bonds are interest bearing securities issued by city and local authorities denominated in Russian Roubles. These bonds have maturity dates from November 2015 to July 2021 (2013: from March 2014 to June 2017), coupon rates ranging approximately from 7.0% to 12.0% (2013: from 6.5% to 12.0%) and yields to maturity from 15.6% to 17.6% (2013: from 6.2% to 9.3%).
21

JSC Nordea Bank Notes to the Consolidated Financial Statements — 31 December 2014
7 Trading securities (continued)
OFZ bonds are Russian Rouble denominated government securities issued by the Ministry of Finance of the Russian Federation. These bonds have maturity dates from June 2015 to June 2017 (2013: from March 2014 to June 2017), coupon rates ranging approximately from 6.0% to 7.4% (2013: from 6.5% to 12.0%) and yields to maturity from 13.2% to 17.0% (2013: from 5.5% to 7.4%).
An analysis by credit quality of debt trading securities based on internal ratings at 31 December 2014 is as follows (refer to Note 22):
In millions of Russian Roubles Corporate
bonds Municipal
bonds Federal loan bonds (OFZ)
Total
Neither past due nor impaired (at fair value)
– S rated - 1 659 1 046 2 705 – 5 rated 566 - - 566 – 4 rated 2 179 - - 2 179 – 3 rated 103 - - 103
Total neither past due nor impaired 2 848 1 659 1 046 5 553
Total debt trading securities 2 848 1 659 1 046 5 553
Analysis by credit quality of debt trading securities based on internal ratings at 31 December 2013 is as follows:
In millions of Russian Roubles Corporate
bonds Municipal
bonds Federal loan bonds (OFZ)
Total
Neither past due nor impaired (at fair value)
– S rated - 2 470 1 635 4 105 – 5 rated 612 - - 612 – 4 rated 5 289 - - 5 289
Total neither past due nor impaired 5 901 2 470 1 635 10 006
Total debt trading securities 5 901 2 470 1 635 10 006
22
JSC Nordea Bank Notes to the Consolidated Financial Statements — 31 December 2014
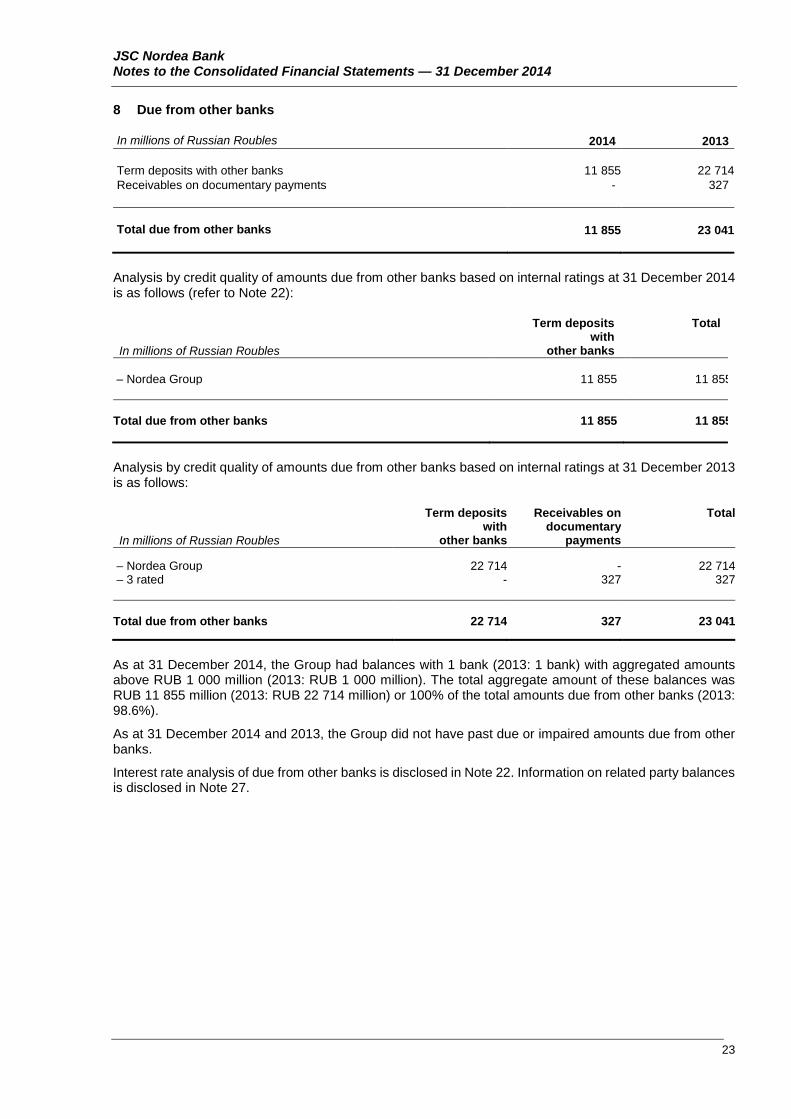
8 Due from other banks
In millions of Russian Roubles 2014 2013 Term deposits with other banks 11 855 22 714 Receivables on documentary payments - 327 Total due from other banks 11 855 23 041
Analysis by credit quality of amounts due from other banks based on internal ratings at 31 December 2014 is as follows (refer to Note 22):
In millions of Russian Roubles
Term deposits with
other banks
Total
– Nordea Group 11 855 11 855 Total due from other banks 11 855 11 855
Analysis by credit quality of amounts due from other banks based on internal ratings at 31 December 2013 is as follows:
In millions of Russian Roubles
Term deposits with
other banks
Receivables on documentary
payments
Total
– Nordea Group 22 714 - 22 714 – 3 rated - 327 327 Total due from other banks 22 714 327 23 041
As at 31 December 2014, the Group had balances with 1 bank (2013: 1 bank) with aggregated amounts above RUB 1 000 million (2013: RUB 1 000 million). The total aggregate amount of these balances was RUB 11 855 million (2013: RUB 22 714 million) or 100% of the total amounts due from other banks (2013: 98.6%).
As at 31 December 2014 and 2013, the Group did not have past due or impaired amounts due from other banks.
Interest rate analysis of due from other banks is disclosed in Note 22. Information on related party balances is disclosed in Note 27.
23

JSC Nordea Bank Notes to the Consolidated Financial Statements — 31 December 2014
9 Loans and advances to customers
In millions of Russian Roubles 2014 2013 Corporate loans above EUR 10 mln 286 438 176 494 Corporate loans under EUR 10 mln 2 581 3 077 Receivables on finance leases 1 696 1 521 Mortgage loans to individuals 23 353 20 331 Loans to individuals – auto 1 092 1 376 Loans to individuals – retail 454 503 Less impairment allowance (1 688) (1 175) Total loans and advances to customers 313 926 202 127
Loan impairment losses are presented net of impairment losses reversal of RUB 1 million (2013: RUB 362 million) as a result of full repayment of a debt.
Movements in the loan impairment allowance during 2014 are as follows:
Corporate loans Receivables on finance
leases
Loans to individuals Total In millions of Russian Roubles
Mortgage loans
Auto Retail
Loan impairment allowance at 1 January 2014 745 45 32 175 178 1 175
Loan impairment losses during the year 139 - 132 56 20
347
Amounts written off during the year as uncollectible (132) -
(3) (35) (52) (222)
Exchange differences on translation 357
22 9
-
-
388
Loan impairment allowance at 31 December 2014 1 109 67 170 196 146 1 688
24
JSC Nordea Bank Notes to the Consolidated Financial Statements — 31 December 2014
9 Loans and advances to customers (continued)
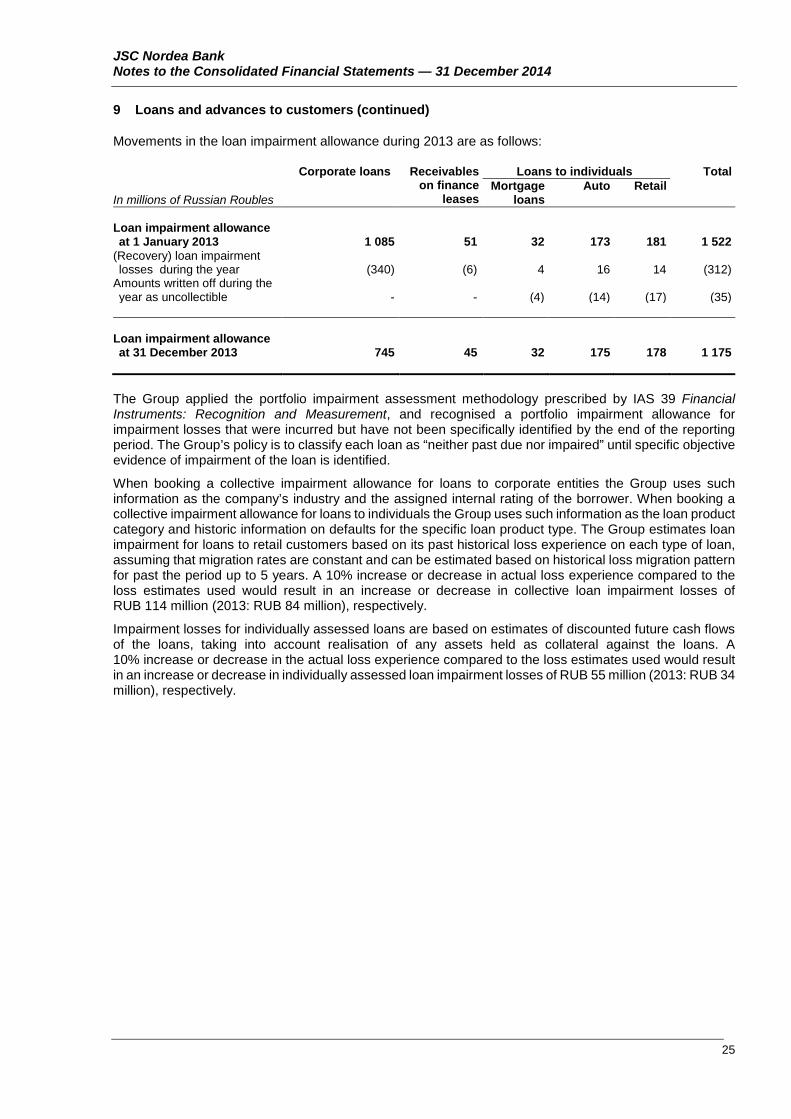
Movements in the loan impairment allowance during 2013 are as follows:
Corporate loans Receivables on finance
leases
Loans to individuals Total
In millions of Russian Roubles Mortgage
loans Auto Retail
Loan impairment allowance at 1 January 2013 1 085 51 32 173 181 1 522
(Recovery) loan impairment losses during the year (340) (6) 4 16 14 (312)
Amounts written off during the year as uncollectible - - (4) (14) (17) (35)
Loan impairment allowance at 31 December 2013 745 45 32 175 178 1 175
The Group applied the portfolio impairment assessment methodology prescribed by IAS 39 Financial Instruments: Recognition and Measurement, and recognised a portfolio impairment allowance for impairment losses that were incurred but have not been specifically identified by the end of the reporting period. The Group’s policy is to classify each loan as “neither past due nor impaired” until specific objective evidence of impairment of the loan is identified.
When booking a collective impairment allowance for loans to corporate entities the Group uses such information as the company’s industry and the assigned internal rating of the borrower. When booking a collective impairment allowance for loans to individuals the Group uses such information as the loan product category and historic information on defaults for the specific loan product type. The Group estimates loan impairment for loans to retail customers based on its past historical loss experience on each type of loan, assuming that migration rates are constant and can be estimated based on historical loss migration pattern for past the period up to 5 years. A 10% increase or decrease in actual loss experience compared to the loss estimates used would result in an increase or decrease in collective loan impairment losses of RUB 114 million (2013: RUB 84 million), respectively.
Impairment losses for individually assessed loans are based on estimates of discounted future cash flows of the loans, taking into account realisation of any assets held as collateral against the loans. A 10% increase or decrease in the actual loss experience compared to the loss estimates used would result in an increase or decrease in individually assessed loan impairment losses of RUB 55 million (2013: RUB 34 million), respectively.
25
JSC Nordea Bank Notes to the Consolidated Financial Statements — 31 December 2014
9 Loans and advances to customers (continued)
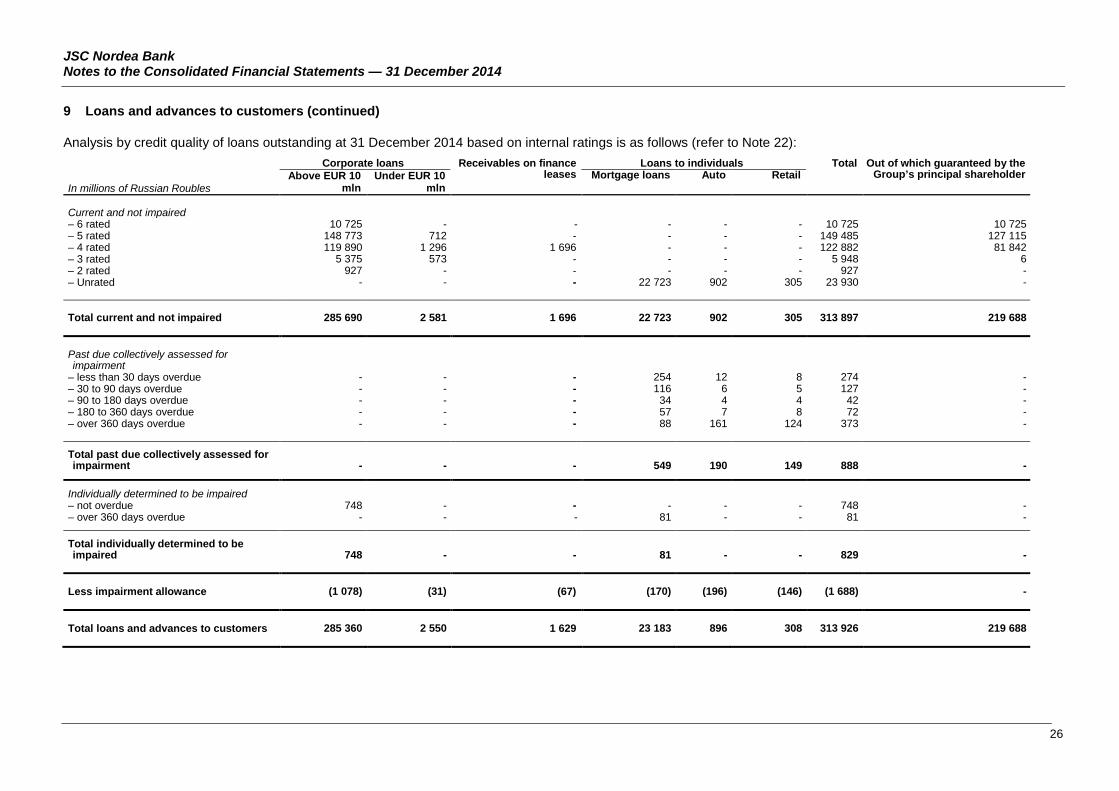
Analysis by credit quality of loans outstanding at 31 December 2014 based on internal ratings is as follows (refer to Note 22):
In millions of Russian Roubles
Corporate loans Receivables on finance leases
Loans to individuals Total Out of which guaranteed by the Group’s principal shareholder Above EUR 10
mln Under EUR 10
mln Mortgage loans Auto Retail
Current and not impaired – 6 rated 10 725 - - - - - 10 725 10 725 – 5 rated 148 773 712 - - - - 149 485 127 115 – 4 rated 119 890 1 296 1 696 - - - 122 882 81 842 – 3 rated 5 375 573 - - - - 5 948 6 – 2 rated 927 - - - - - 927 - – Unrated - - - 22 723 902 305 23 930 - Total current and not impaired 285 690 2 581 1 696 22 723 902 305 313 897 219 688 Past due collectively assessed for impairment
– less than 30 days overdue - - - 254 12 8 274 - – 30 to 90 days overdue - - - 116 6 5 127 - – 90 to 180 days overdue - - - 34 4 4 42 - – 180 to 360 days overdue - - - 57 7 8 72 - – over 360 days overdue - - - 88 161 124 373 -
Total past due collectively assessed for impairment - - - 549 190 149 888 -
Individually determined to be impaired – not overdue 748 - - - - - 748 - – over 360 days overdue - - - 81 - - 81 -
Total individually determined to be impaired 748 - - 81 - - 829 -
Less impairment allowance (1 078) (31) (67) (170) (196) (146) (1 688) - Total loans and advances to customers 285 360 2 550 1 629 23 183 896 308 313 926 219 688
26
JSC Nordea Bank Notes to the Consolidated Financial Statements — 31 December 2014
9 Loans and advances to customers (continued)
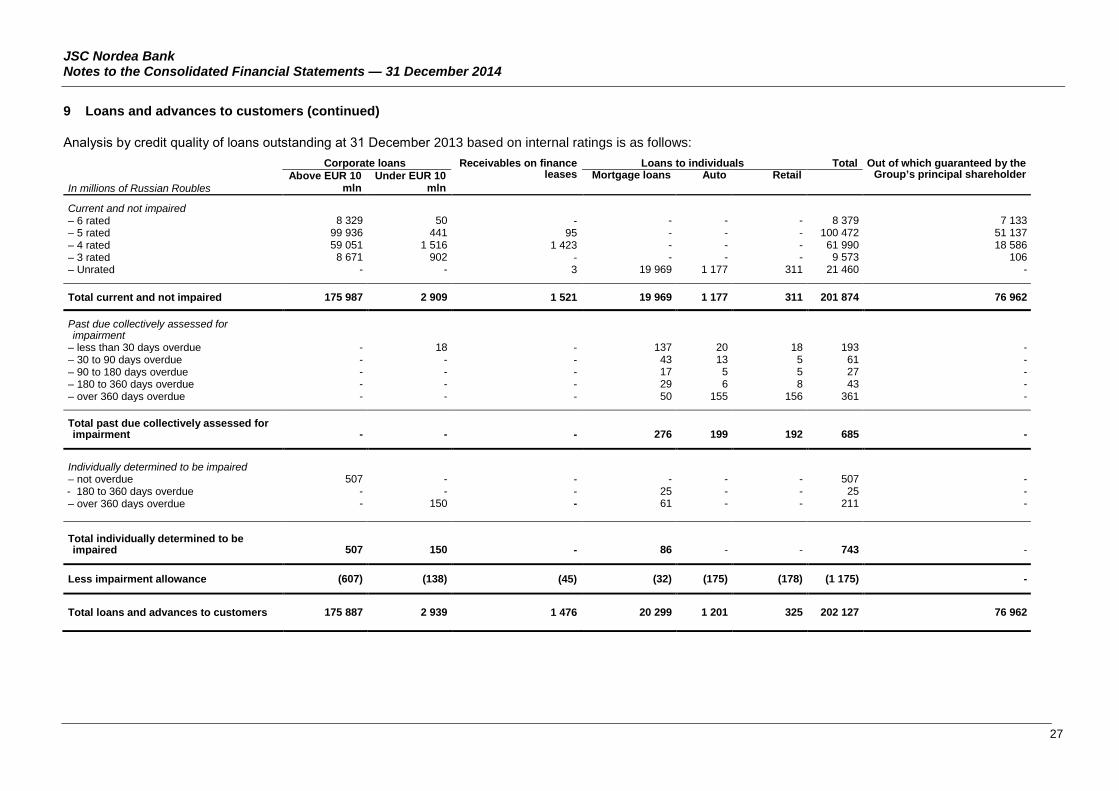
Analysis by сredit quality of loans outstanding at 31 December 2013 based on internal ratings is as follows:
In millions of Russian Roubles
Corporate loans Receivables on finance leases
Loans to individuals Total Out of which guaranteed by the Group’s principal shareholder Above EUR 10
mln Under EUR 10
mln Mortgage loans Auto Retail
Current and not impaired – 6 rated 8 329 50 - - - - 8 379 7 133 – 5 rated 99 936 441 95 - - - 100 472 51 137 – 4 rated 59 051 1 516 1 423 - - - 61 990 18 586 – 3 rated 8 671 902 - - - - 9 573 106 – Unrated - - 3 19 969 1 177 311 21 460 -
Total current and not impaired 175 987 2 909 1 521 19 969 1 177 311 201 874 76 962
Past due collectively assessed for impairment
– less than 30 days overdue - 18 - 137 20 18 193 - – 30 to 90 days overdue - - - 43 13 5 61 - – 90 to 180 days overdue - - - 17 5 5 27 - – 180 to 360 days overdue - - - 29 6 8 43 - – over 360 days overdue - - - 50 155 156 361 -
Total past due collectively assessed for impairment - - - 276 199 192 685 -
Individually determined to be impaired – not overdue 507 - - - - - 507 - - 180 to 360 days overdue - - - 25 - - 25 - – over 360 days overdue - 150 - 61 - - 211 - Total individually determined to be impaired 507 150 - 86 - - 743 -
Less impairment allowance (607) (138) (45) (32) (175) (178) (1 175) -
Total loans and advances to customers 175 887 2 939 1 476 20 299 1 201 325 202 127 76 962
27
JSC Nordea Bank Notes to the Consolidated Financial Statements — 31 December 2014
9 Loans and advances to customers (continued)
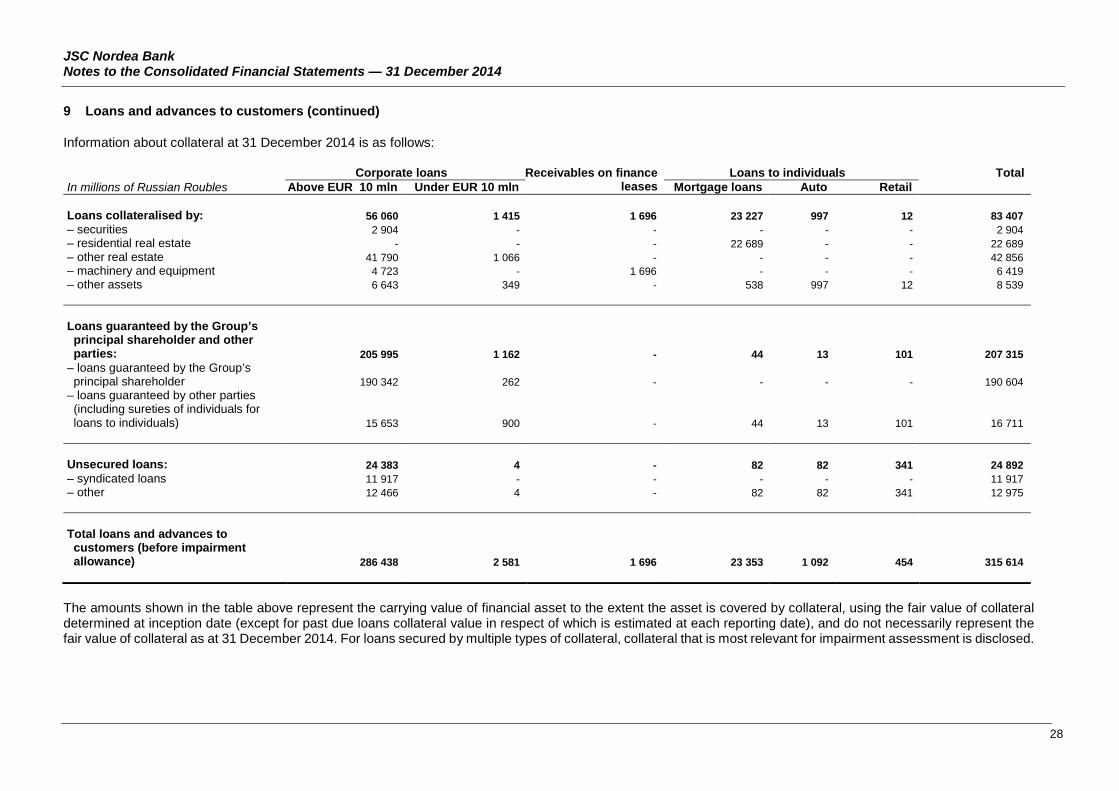
Information about collateral at 31 December 2014 is as follows:
In millions of Russian Roubles Corporate loans Receivables on finance
leases Loans to individuals Total
Above EUR 10 mln Under EUR 10 mln Mortgage loans Auto Retail Loans collateralised by: 56 060 1 415 1 696 23 227 997 12 83 407 – securities 2 904 - - - - - 2 904 – residential real estate - - - 22 689 - - 22 689 – other real estate 41 790 1 066 - - - - 42 856 – machinery and equipment 4 723 - 1 696 - - - 6 419 – other assets 6 643 349 - 538 997 12 8 539 Loans guaranteed by the Group’s principal shareholder and other parties: 205 995 1 162 - 44 13 101 207 315
– loans guaranteed by the Group’s principal shareholder 190 342 262 - - - - 190 604
– loans guaranteed by other parties (including sureties of individuals for loans to individuals) 15 653 900 - 44 13 101 16 711
Unsecured loans: 24 383 4 - 82 82 341 24 892 – syndicated loans 11 917 - - - - - 11 917 – other 12 466 4 - 82 82 341 12 975 Total loans and advances to customers (before impairment allowance) 286 438 2 581 1 696 23 353 1 092 454 315 614
The amounts shown in the table above represent the carrying value of financial asset to the extent the asset is covered by collateral, using the fair value of collateral determined at inception date (except for past due loans collateral value in respect of which is estimated at each reporting date), and do not necessarily represent the fair value of collateral as at 31 December 2014. For loans secured by multiple types of collateral, collateral that is most relevant for impairment assessment is disclosed.
28

JSC Nordea Bank Notes to the Consolidated Financial Statements — 31 December 2014
9 Loans and advances to customers (continued)
Information about collateral at 31 December 2013 is as follows:
In millions of Russian Roubles Corporate loans Receivables on finance
leases Loans to individuals Total
Above EUR 10 mln Under EUR 10 mln Mortgage loans Auto Retail Loans collateralised by: 42 041 1 667 1 521 19 890 1 247 17 66 383 – securities 1 986 50 - - - - 2 036 – residential real estate - - - 19 412 - - 19 412 – other real estate 25 865 1 617 - - - - 27 482 – machinery and equipment 8 193 - 1 521 - - 1 9 715 – other assets 5 997 - - 478 1 247 16 7 738 Loans guaranteed by the Group’s principal shareholder and other parties: 81 527 1 029 - 10 11 126 82 703
– loans guaranteed by the Group’s principal shareholder 69 753 622 - - - - 70 375
– loans guaranteed by other parties (including sureties of individuals for loans to individuals) 11 774 407 - 10 11 126 12 328
Unsecured loans: 52 926 381 - 431 118 360 54 216 – syndicated loans 23 623 - - - - - 23 623 – other 29 303 381 - 431 118 360 30 593 Total loans and advances to customers (before impairment allowance) 176 494 3 077 1 521 20 331 1 376 503 203 302
The amounts shown in the table above represent the carrying value of financial asset to the extent the asset is covered by collateral, using the fair value of collateral determined at inception date (except for past due loans collateral value in respect of which is estimated at each reporting date), and do not necessarily represent the fair value of collateral as at 31 December 2013. For loans secured by multiple types of collateral, collateral that is most relevant for impairment assessment is disclosed.
29
JSC Nordea Bank Notes to the Consolidated Financial Statements — 31 December 2014
9 Loans and advances to customers (continued)
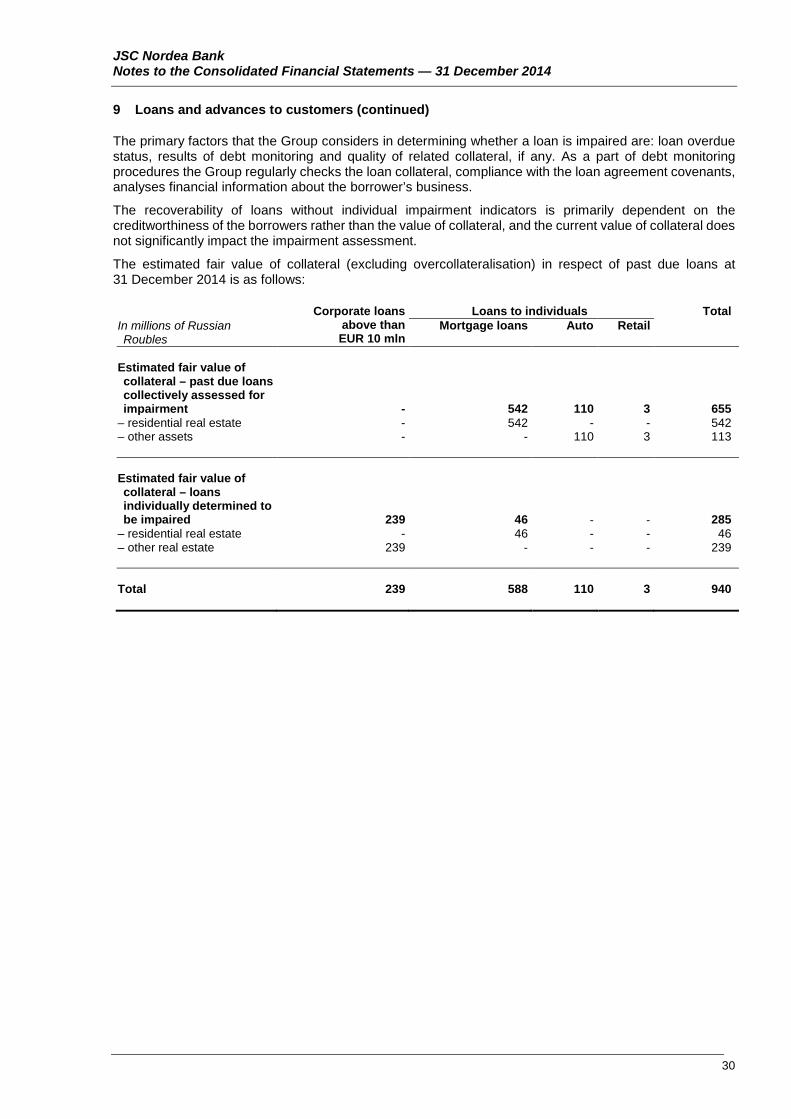
The primary factors that the Group considers in determining whether a loan is impaired are: loan overdue status, results of debt monitoring and quality of related collateral, if any. As a part of debt monitoring procedures the Group regularly checks the loan collateral, compliance with the loan agreement covenants, analyses financial information about the borrower’s business.
The recoverability of loans without individual impairment indicators is primarily dependent on the creditworthiness of the borrowers rather than the value of collateral, and the current value of collateral does not significantly impact the impairment assessment.
The estimated fair value of collateral (excluding overcollateralisation) in respect of past due loans at 31 December 2014 is as follows:
Corporate loans above than EUR 10 mln
Loans to individuals Total In millions of Russian Roubles
Mortgage loans Auto Retail
Estimated fair value of collateral – past due loans collectively assessed for impairment - 542 110 3 655
– residential real estate - 542 - - 542 – other assets - - 110 3 113
Estimated fair value of collateral – loans individually determined to be impaired 239 46 - - 285
– residential real estate - 46 - - 46 – other real estate 239 - - - 239
Total 239 588 110 3 940
30
JSC Nordea Bank Notes to the Consolidated Financial Statements — 31 December 2014
9 Loans and advances to customers (continued)
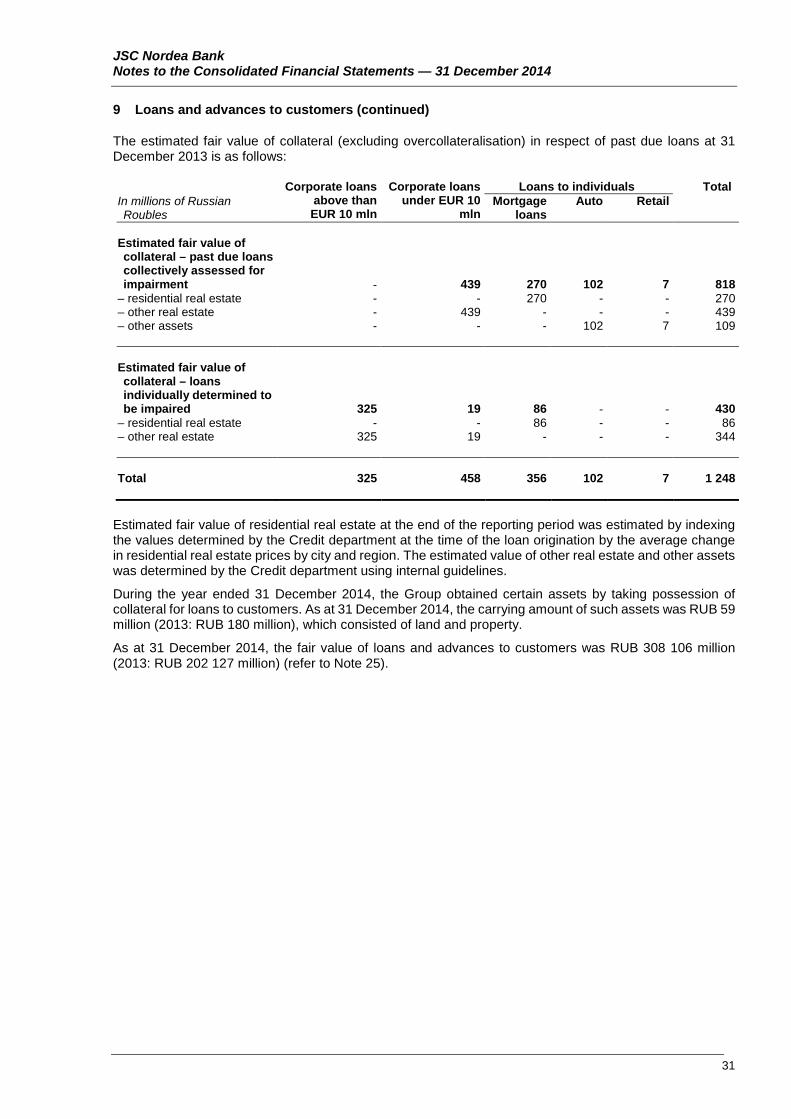
The estimated fair value of collateral (excluding overcollateralisation) in respect of past due loans at 31 December 2013 is as follows:
Corporate loans above than EUR 10 mln
Corporate loans under EUR 10
mln
Loans to individuals Total In millions of Russian Roubles
Mortgage loans
Auto Retail
Estimated fair value of collateral – past due loans collectively assessed for impairment - 439 270 102 7 818
– residential real estate - - 270 - - 270 – other real estate - 439 - - - 439 – other assets - - - 102 7 109
Estimated fair value of collateral – loans individually determined to be impaired 325 19 86 - - 430
– residential real estate - - 86 - - 86 – other real estate 325 19 - - - 344
Total 325 458 356 102 7 1 248
Estimated fair value of residential real estate at the end of the reporting period was estimated by indexing the values determined by the Credit department at the time of the loan origination by the average change in residential real estate prices by city and region. The estimated value of other real estate and other assets was determined by the Credit department using internal guidelines.
During the year ended 31 December 2014, the Group obtained certain assets by taking possession of collateral for loans to customers. As at 31 December 2014, the carrying amount of such assets was RUB 59 million (2013: RUB 180 million), which consisted of land and property.
As at 31 December 2014, the fair value of loans and advances to customers was RUB 308 106 million (2013: RUB 202 127 million) (refer to Note 25).
31

JSC Nordea Bank Notes to the Consolidated Financial Statements — 31 December 2014
9 Loans and advances to customers (continued)
Economic sector risk concentrations within the customer loan portfolio are as follows:
2014 2013 In millions of Russian Roubles Amount % Amount % Manufacturing 158 987 50.4% 96 551 47.5% Real estate activities 48 946 15.5% 29 701 14.6% Mining and quarrying 45 653 14.5% 17 291 8.5% Loans to individuals 24 899 7.9% 22 210 10.9% Electricity, gas, steam and air conditioning 14 260 4.5% 15 927 7.8% Transporting and storage 13 206 4.2% 10 131 5.0% Information and communication 4 032 1.2% 2 784 1.4% Administrative and support service activities 3 096 1.0% 3 912 1.9% Wholesale and retail trade 2 525 0.8% 4 573 2.3% Other 10 0.0% 222 0.1%
Total loans and advances to customers (before impairment allowance) 315 614 100.0% 203 302 100.0%
As at 31 December 2014, the Group had 48 borrowers with aggregated loan amounts above RUB 1 000 million (2013: 39 borrowers with aggregated loan amounts above RUB 1 000 million). The total aggregate amount of these loans is RUB 279 442 million, or 88.5% of the gross loan portfolio (2013: RUB 163 947 million, or 80.6% of the gross loan portfolio).
As at 31 December 2014, the total amount of guarantees received from Nordea Bank AB amounted to RUB 253 299 million (2013: RUB 111 316 million) which is higher than carrying amount of the individual loans guaranteed as it covers the credit limit for the borrower.
As at 31 December 2014, the aggregated amount of syndicated loans where the Group is a syndicated member was RUB 70 324 million, or 22.3% of the gross loan portfolio (2013: RUB 39 014 million, or 19.2% of the gross loan portfolio).
Interest rate analysis of loans and advances to customers is disclosed in Note 22. Information on related party balances is disclosed in Note 27.
10 Derivative financial instruments
In millions of Russian Roubles 2014 2013 Foreign exchange forward contracts (assets) 178 102 Interest rate swaps (assets) 1 677 224 Foreign exchange forward contracts (liabilities) (190) (163) Interest rate swaps (liabilities) (206) (194) Total derivative financial instruments 1 459 (31)
These financial instruments are carried at fair value (refer to Note 25).
As at 31 December 2014, there were 4 large Russian and foreign banks (2013: 21) as counterparties on the currency forward contracts – assets. The aggregate amount of foreign currency forwards – assets with Nordea Group amounted to RUB 119 million (2013: RUB 34 million) or 66.9% (2013: 33.3%) of total currency forward contracts – assets. The aggregate amount of foreign currency forwards – liabilities with Nordea Group amounted to RUB 28 million (2013: RUB 125 million) or 14.7% (2013: 76.7%) of total currency forward contracts – liabilities.
32
JSC Nordea Bank Notes to the Consolidated Financial Statements — 31 December 2014
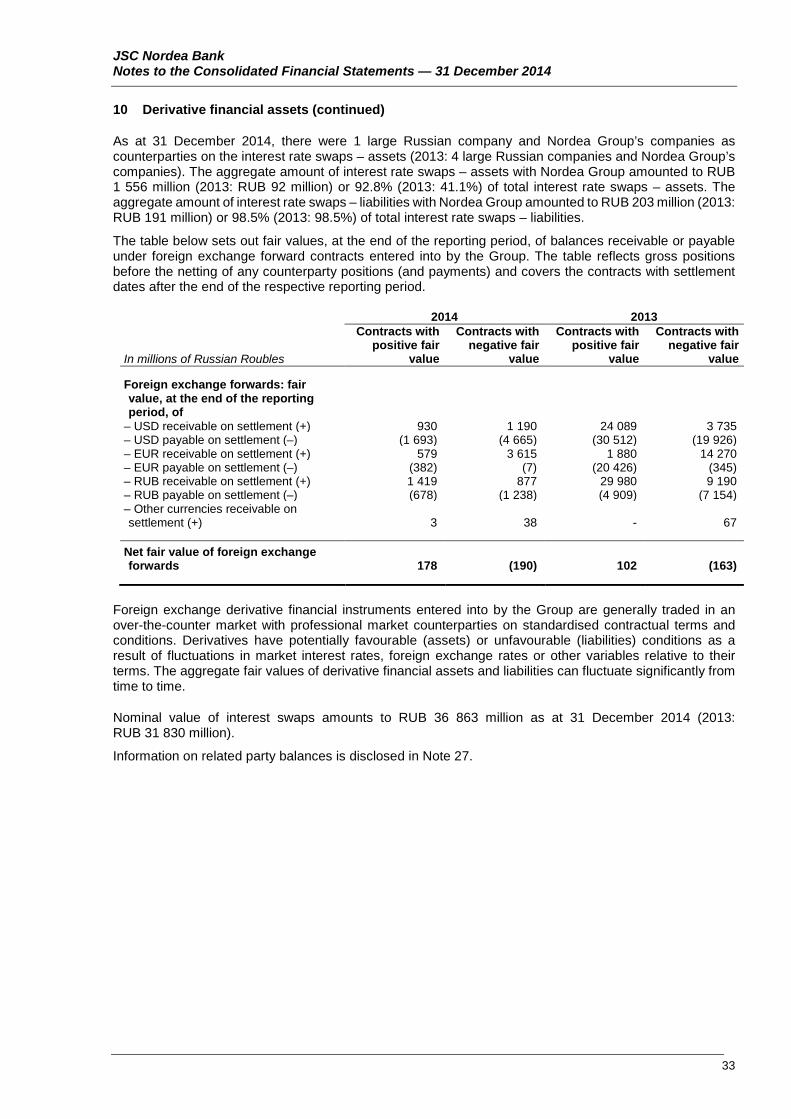
10 Derivative financial assets (continued)
As at 31 December 2014, there were 1 large Russian company and Nordea Group’s companies as counterparties on the interest rate swaps – assets (2013: 4 large Russian companies and Nordea Group’s companies). The aggregate amount of interest rate swaps – assets with Nordea Group amounted to RUB 1 556 million (2013: RUB 92 million) or 92.8% (2013: 41.1%) of total interest rate swaps – assets. The aggregate amount of interest rate swaps – liabilities with Nordea Group amounted to RUB 203 million (2013: RUB 191 million) or 98.5% (2013: 98.5%) of total interest rate swaps – liabilities.
The table below sets out fair values, at the end of the reporting period, of balances receivable or payable under foreign exchange forward contracts entered into by the Group. The table reflects gross positions before the netting of any counterparty positions (and payments) and covers the contracts with settlement dates after the end of the respective reporting period.
2014 2013
In millions of Russian Roubles
Contracts with positive fair
value
Contracts with negative fair
value
Contracts with positive fair
value
Contracts with negative fair
value
Foreign exchange forwards: fair value, at the end of the reporting period, of
– USD receivable on settlement (+) 930 1 190 24 089 3 735 – USD payable on settlement (–) (1 693) (4 665) (30 512) (19 926) – EUR receivable on settlement (+) 579 3 615 1 880 14 270 – EUR payable on settlement (–) (382) (7) (20 426) (345) – RUB receivable on settlement (+) 1 419 877 29 980 9 190 – RUB payable on settlement (–) (678) (1 238) (4 909) (7 154) – Other currencies receivable on settlement (+) 3 38 - 67
Net fair value of foreign exchange forwards 178 (190) 102 (163)
Foreign exchange derivative financial instruments entered into by the Group are generally traded in an over-the-counter market with professional market counterparties on standardised contractual terms and conditions. Derivatives have potentially favourable (assets) or unfavourable (liabilities) conditions as a result of fluctuations in market interest rates, foreign exchange rates or other variables relative to their terms. The aggregate fair values of derivative financial assets and liabilities can fluctuate significantly from time to time.
Nominal value of interest swaps amounts to RUB 36 863 million as at 31 December 2014 (2013: RUB 31 830 million).
Information on related party balances is disclosed in Note 27.
33
JSC Nordea Bank Notes to the Consolidated Financial Statements — 31 December 2014
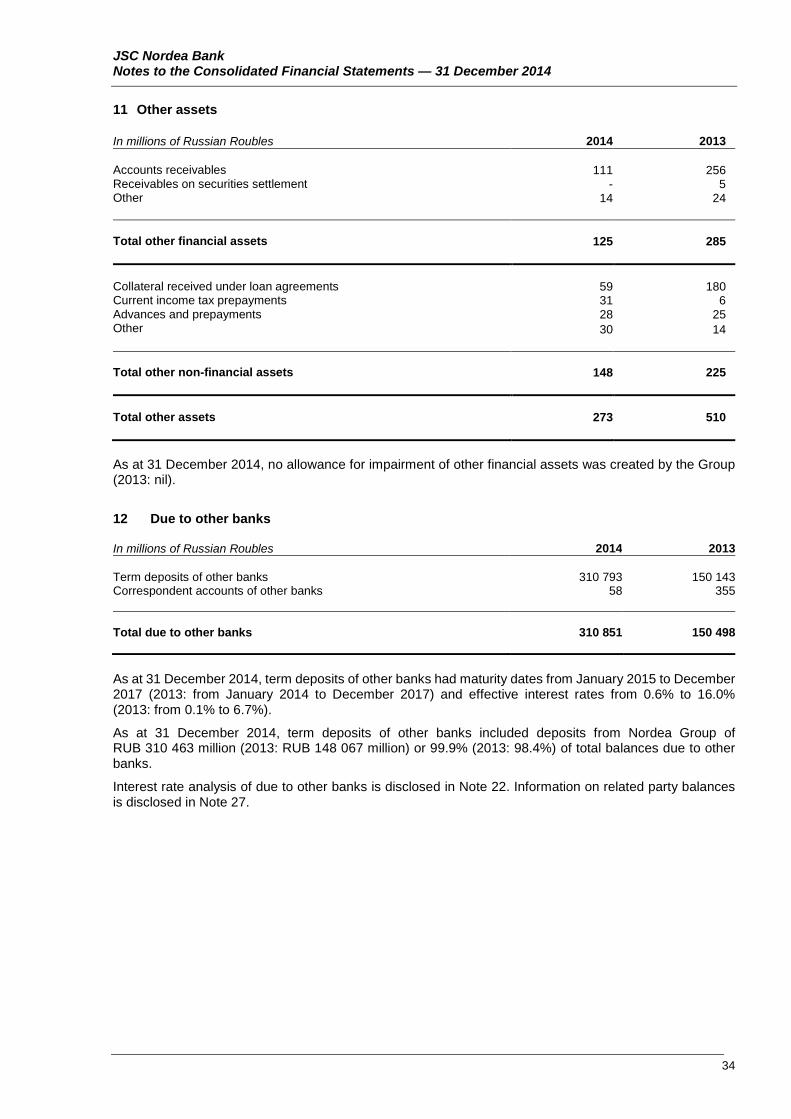
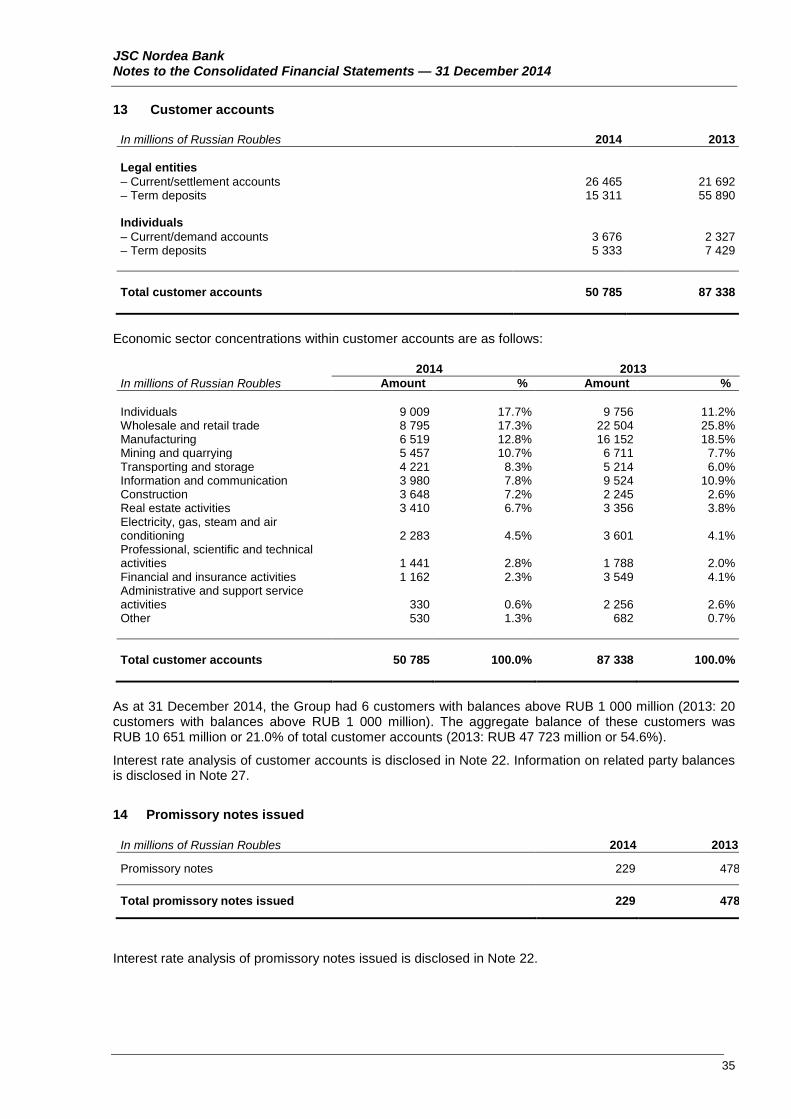
11 Other assets
In millions of Russian Roubles 2014 2013 Accounts receivables 111 256 Receivables on securities settlement - 5 Other 14 24 Total other financial assets 125 285
Collateral received under loan agreements 59 180 Current income tax prepayments 31 6 Advances and prepayments 28 25 Other 30 14 Total other non-financial assets 148 225
Total other assets 273 510
As at 31 December 2014, no allowance for impairment of other financial assets was created by the Group (2013: nil).
12 Due to other banks In millions of Russian Roubles 2014 2013 Term deposits of other banks 310 793 150 143 Correspondent accounts of other banks 58 355 Total due to other banks 310 851 150 498
As at 31 December 2014, term deposits of other banks had maturity dates from January 2015 to December 2017 (2013: from January 2014 to December 2017) and effective interest rates from 0.6% to 16.0% (2013: from 0.1% to 6.7%).
As at 31 December 2014, term deposits of other banks included deposits from Nordea Group of RUB 310 463 million (2013: RUB 148 067 million) or 99.9% (2013: 98.4%) of total balances due to other banks.
Interest rate analysis of due to other banks is disclosed in Note 22. Information on related party balances is disclosed in Note 27.
34
JSC Nordea Bank Notes to the Consolidated Financial Statements — 31 December 2014
13 Customer accounts
In millions of Russian Roubles 2014 2013 Legal entities – Current/settlement accounts 26 465 21 692 – Term deposits 15 311 55 890 Individuals – Current/demand accounts 3 676 2 327 – Term deposits 5 333 7 429 Total customer accounts 50 785 87 338
Economic sector concentrations within customer accounts are as follows:
2014 2013 In millions of Russian Roubles Amount % Amount % Individuals 9 009 17.7% 9 756 11.2% Wholesale and retail trade 8 795 17.3% 22 504 25.8% Manufacturing 6 519 12.8% 16 152 18.5% Mining and quarrying 5 457 10.7% 6 711 7.7% Transporting and storage 4 221 8.3% 5 214 6.0% Information and communication 3 980 7.8% 9 524 10.9% Construction 3 648 7.2% 2 245 2.6% Real estate activities 3 410 6.7% 3 356 3.8% Electricity, gas, steam and air conditioning 2 283 4.5% 3 601 4.1% Professional, scientific and technical activities 1 441 2.8% 1 788 2.0% Financial and insurance activities 1 162 2.3% 3 549 4.1% Administrative and support service activities 330 0.6% 2 256 2.6% Other 530 1.3% 682 0.7% Total customer accounts 50 785 100.0% 87 338 100.0%
As at 31 December 2014, the Group had 6 customers with balances above RUB 1 000 million (2013: 20 customers with balances above RUB 1 000 million). The aggregate balance of these customers was RUB 10 651 million or 21.0% of total customer accounts (2013: RUB 47 723 million or 54.6%).
Interest rate analysis of customer accounts is disclosed in Note 22. Information on related party balances is disclosed in Note 27.
14 Promissory notes issued
In millions of Russian Roubles 2014 2013 Promissory notes 229 478 Total promissory notes issued 229 478
Interest rate analysis of promissory notes issued is disclosed in Note 22.
35
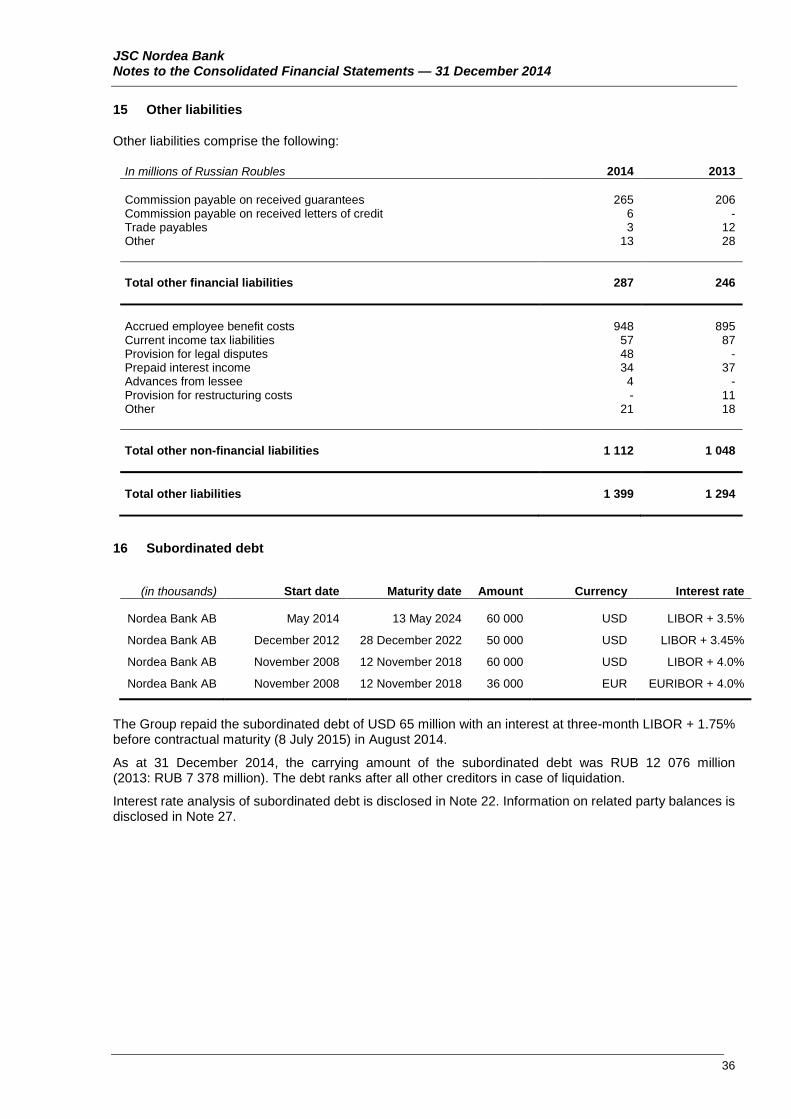
JSC Nordea Bank Notes to the Consolidated Financial Statements — 31 December 2014
15 Other liabilities
Other liabilities comprise the following:
In millions of Russian Roubles 2014 2013 Commission payable on received guarantees 265 206 Commission payable on received letters of credit 6 - Trade payables 3 12 Other 13 28
Total other financial liabilities 287 246
Accrued employee benefit costs 948 895 Current income tax liabilities 57 87 Provision for legal disputes 48 - Prepaid interest income 34 37 Advances from lessee 4 - Provision for restructuring costs - 11 Other 21 18 Total other non-financial liabilities 1 112 1 048 Total other liabilities 1 399 1 294
16 Subordinated debt
(in thousands) Start date Maturity date Amount Currency Interest rate Nordea Bank AB May 2014 13 May 2024 60 000 USD LIBOR + 3.5%
Nordea Bank AB December 2012 28 December 2022 50 000 USD LIBOR + 3.45%
Nordea Bank AB November 2008 12 November 2018 60 000 USD LIBOR + 4.0%
Nordea Bank AB November 2008 12 November 2018 36 000 EUR EURIBOR + 4.0%
The Group repaid the subordinated debt of USD 65 million with an interest at three-month LIBOR + 1.75% before contractual maturity (8 July 2015) in August 2014.
As at 31 December 2014, the carrying amount of the subordinated debt was RUB 12 076 million (2013: RUB 7 378 million). The debt ranks after all other creditors in case of liquidation.
Interest rate analysis of subordinated debt is disclosed in Note 22. Information on related party balances is disclosed in Note 27.
36
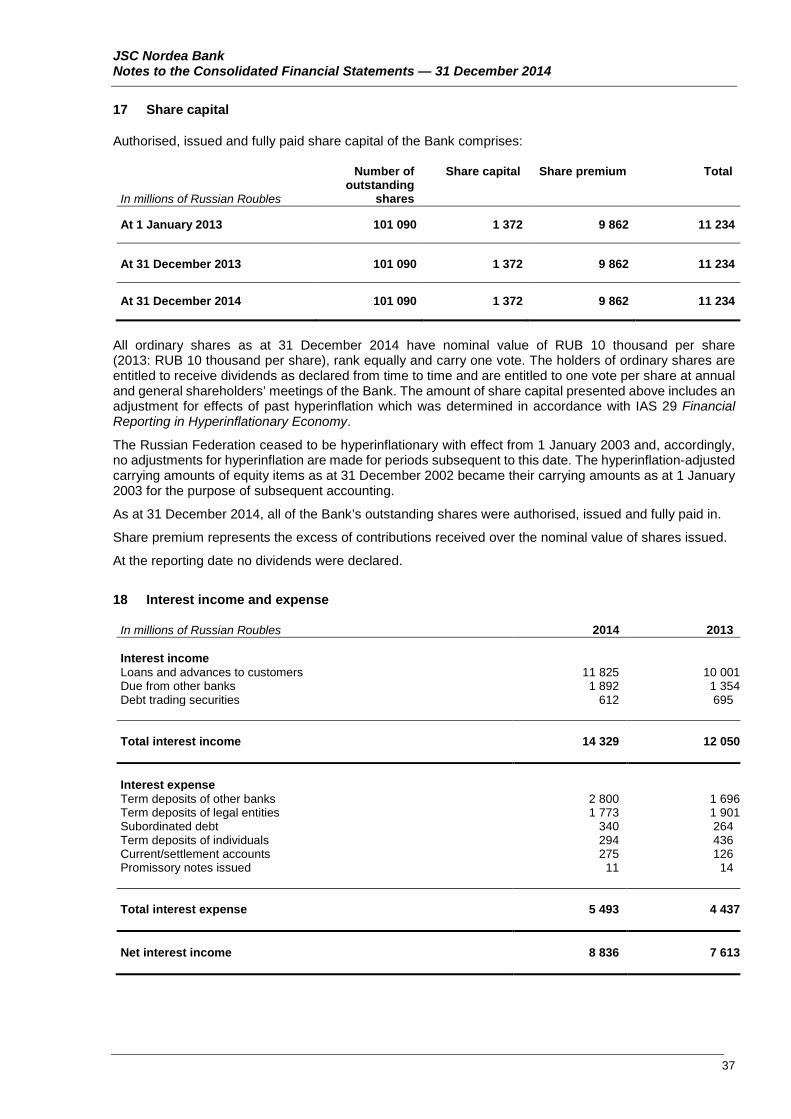
JSC Nordea Bank Notes to the Consolidated Financial Statements — 31 December 2014
17 Share capital
Authorised, issued and fully paid share capital of the Bank comprises:
In millions of Russian Roubles
Number of outstanding
shares
Share capital Share premium Total
At 1 January 2013 101 090 1 372 9 862 11 234 At 31 December 2013 101 090 1 372 9 862 11 234 At 31 December 2014 101 090 1 372 9 862 11 234
All ordinary shares as at 31 December 2014 have nominal value of RUB 10 thousand per share (2013: RUB 10 thousand per share), rank equally and carry one vote. The holders of ordinary shares are entitled to receive dividends as declared from time to time and are entitled to one vote per share at annual and general shareholders’ meetings of the Bank. The amount of share capital presented above includes an adjustment for effects of past hyperinflation which was determined in accordance with IAS 29 Financial Reporting in Hyperinflationary Economy.
The Russian Federation ceased to be hyperinflationary with effect from 1 January 2003 and, accordingly, no adjustments for hyperinflation are made for periods subsequent to this date. The hyperinflation-adjusted carrying amounts of equity items as at 31 December 2002 became their carrying amounts as at 1 January 2003 for the purpose of subsequent accounting.
As at 31 December 2014, all of the Bank’s outstanding shares were authorised, issued and fully paid in.
Share premium represents the excess of contributions received over the nominal value of shares issued.
At the reporting date no dividends were declared.
18 Interest income and expense
In millions of Russian Roubles 2014 2013 Interest income Loans and advances to customers 11 825 10 001 Due from other banks 1 892 1 354 Debt trading securities 612 695 Total interest income 14 329 12 050 Interest expense Term deposits of other banks 2 800 1 696 Term deposits of legal entities 1 773 1 901 Subordinated debt 340 264 Term deposits of individuals 294 436 Current/settlement accounts 275 126 Promissory notes issued 11 14 Total interest expense 5 493 4 437 Net interest income 8 836 7 613
37
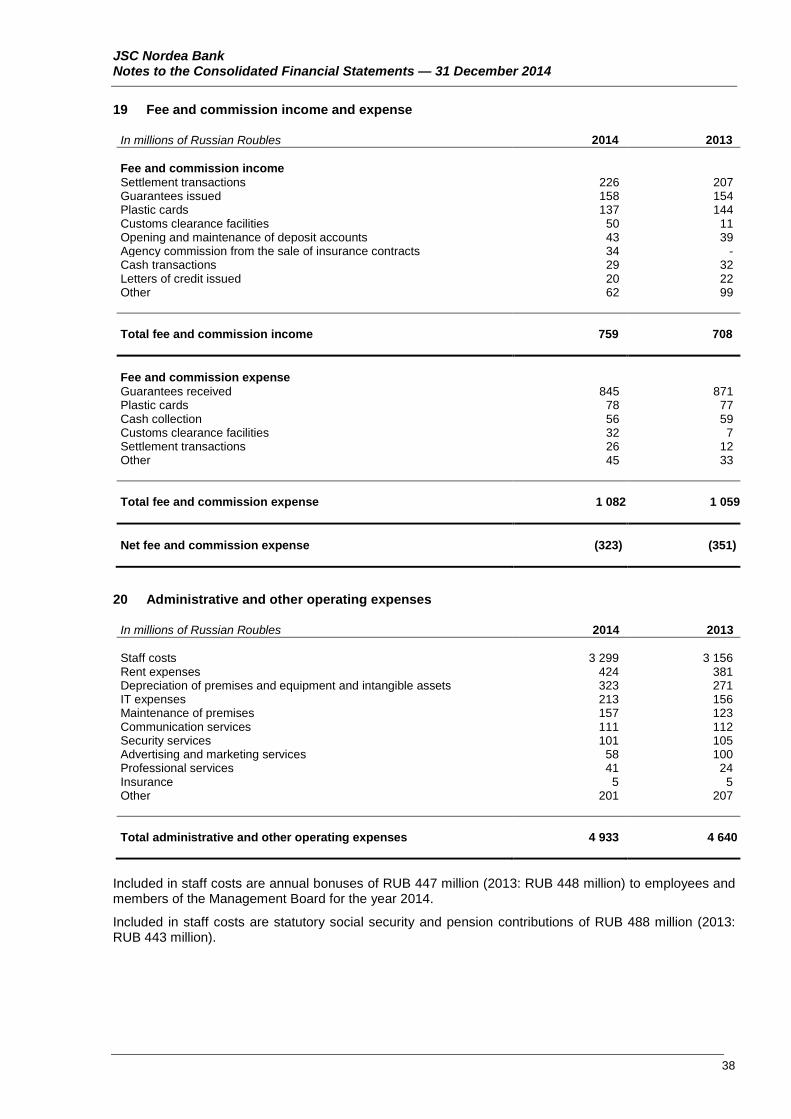
JSC Nordea Bank Notes to the Consolidated Financial Statements — 31 December 2014
19 Fee and commission income and expense
In millions of Russian Roubles 2014 2013 Fee and commission income Settlement transactions 226 207 Guarantees issued 158 154 Plastic cards 137 144 Customs clearance facilities 50 11 Opening and maintenance of deposit accounts 43 39 Agency commission from the sale of insurance contracts 34 - Cash transactions 29 32 Letters of credit issued 20 22 Other 62 99 Total fee and commission income 759 708 Fee and commission expense Guarantees received 845 871 Plastic cards 78 77 Cash collection 56 59 Customs clearance facilities 32 7 Settlement transactions 26 12 Other 45 33 Total fee and commission expense 1 082 1 059 Net fee and commission expense (323) (351)
20 Administrative and other operating expenses
In millions of Russian Roubles 2014 2013 Staff costs 3 299 3 156 Rent expenses 424 381 Depreciation of premises and equipment and intangible assets 323 271 IT expenses 213 156 Maintenance of premises 157 123 Communication services 111 112 Security services 101 105 Advertising and marketing services 58 100 Professional services 41 24 Insurance 5 5 Other 201 207 Total administrative and other operating expenses 4 933 4 640
Included in staff costs are annual bonuses of RUB 447 million (2013: RUB 448 million) to employees and members of the Management Board for the year 2014.
Included in staff costs are statutory social security and pension contributions of RUB 488 million (2013: RUB 443 million).
38
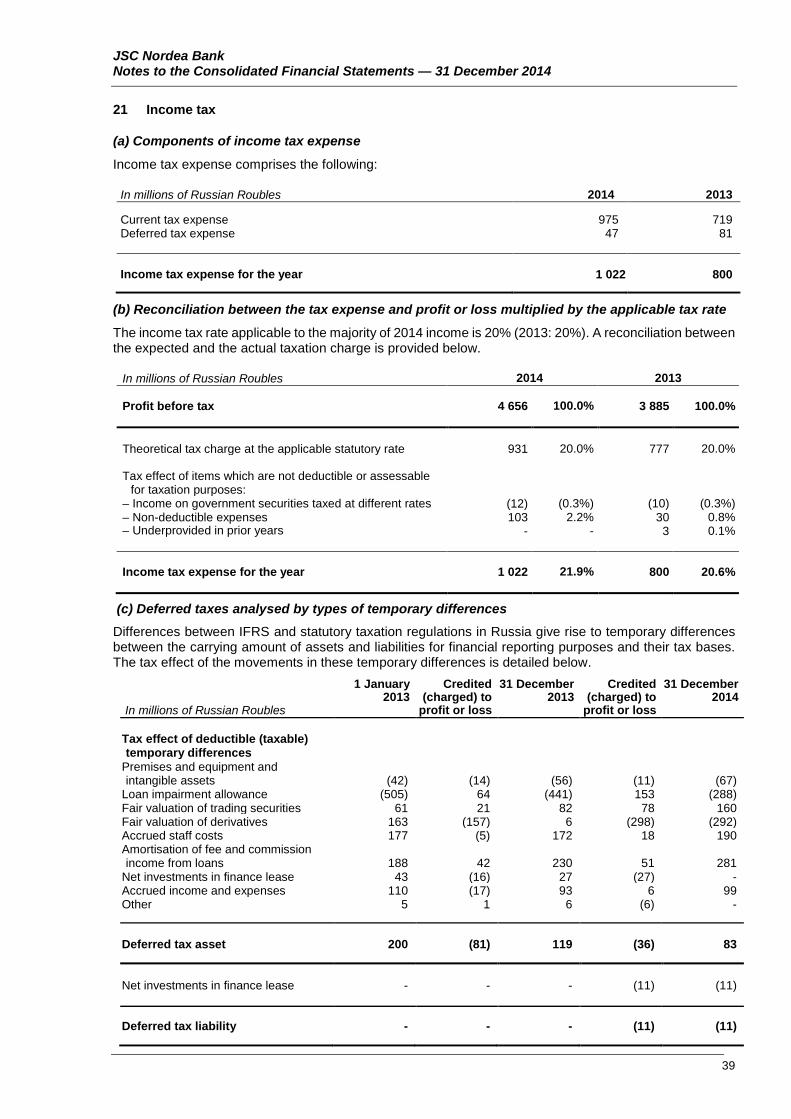
JSC Nordea Bank Notes to the Consolidated Financial Statements — 31 December 2014
21 Income tax
(a) Components of income tax expense
Income tax expense comprises the following:
In millions of Russian Roubles 2014 2013 Current tax expense 975 719 Deferred tax expense 47 81 Income tax expense for the year 1 022 800
(b) Reconciliation between the tax expense and profit or loss multiplied by the applicable tax rate
The income tax rate applicable to the majority of 2014 income is 20% (2013: 20%). A reconciliation between the expected and the actual taxation charge is provided below.
In millions of Russian Roubles 2014 2013 Profit before tax 4 656 100.0% 3 885 100.0% Theoretical tax charge at the applicable statutory rate 931 20.0% 777 20.0% Tax effect of items which are not deductible or assessable
for taxation purposes:
– Income on government securities taxed at different rates (12) (0.3%) (10) (0.3%) – Non-deductible expenses 103 2.2% 30 0.8% – Underprovided in prior years - - 3 0.1% Income tax expense for the year 1 022 21.9% 800 20.6%
(c) Deferred taxes analysed by types of temporary differences Differences between IFRS and statutory taxation regulations in Russia give rise to temporary differences between the carrying amount of assets and liabilities for financial reporting purposes and their tax bases. The tax effect of the movements in these temporary differences is detailed below.
In millions of Russian Roubles
1 January 2013
Credited (charged) to
profit or loss
31 December 2013
Credited (charged) to
profit or loss
31 December 2014
Tax effect of deductible (taxable) temporary differences
Premises and equipment and intangible assets (42) (14) (56) (11) (67)
Loan impairment allowance (505) 64 (441) 153 (288) Fair valuation of trading securities 61 21 82 78 160 Fair valuation of derivatives 163 (157) 6 (298) (292) Accrued staff costs 177 (5) 172 18 190 Amortisation of fee and commission income from loans 188 42 230 51 281
Net investments in finance lease 43 (16) 27 (27) - Accrued income and expenses 110 (17) 93 6 99 Other 5 1 6 (6) - Deferred tax asset 200 (81) 119 (36) 83 Net investments in finance lease - - - (11) (11) Deferred tax liability - - - (11) (11)
39

JSC Nordea Bank Notes to the Consolidated Financial Statements — 31 December 2014
22 Corporate governance, internal control and financial risk management
Corporate governance framework. The Bank is a joint stock company in accordance with Russian law. The supreme governing body of the Bank is the general shareholders’ meeting that is called for annual or extraordinary meetings. The general shareholders’ meeting makes strategic decisions about the Bank’s operations.
The general shareholders’ meeting elects the Board of Directors. The Board of Directors is responsible for overall governance of the Bank's activities.
Russian legislation and the Charter of the Bank establish lists of decisions that are exclusively approved by the general shareholders’ meeting and that are approved by the Board of Directors.
As at 31 December 2014, the Board of Directors includes:
- Casper von Koskull — Chairman of the Board of Directors
- Igor Vladimirovich Kogan — Deputy Chairman of the Board of Directors
- Igor Vladimirovich Bulantsev — Chairman of the Management Board, member of the Board of Directors
- Ari Antero Kaperi — member of the Board of Directors
- Olli-Petteri Lehtinen — member of the Board of Directors
- Klaus Asbjorn Ster — member of the Board of Directors.
According to the decision of the general shareholders’ meeting Claus Asbjorn Stehr was elected to the Board of Directors on September 2014 as a member of the Board of Directors. Member of the Board of Directors Peter Nyegaard left the Board in 2014.
General activities of the Bank are managed by the sole executive body of the Bank (the Chairman of the Management Board) and collective executive body of the Bank (the Management Board). The general shareholders’ meeting elects the Chairman of the Management Board and composition of the Management Board. The executive bodies of the Bank are responsible for implementation of decisions of the general shareholders’ meeting and the Board of Directors of the Bank. Executive bodies of the Bank report to the Board of Directors and to the general shareholders’ meeting.
As at 31 December 2014, the Management Board includes:
- Igor Vladimirovich Bulantsev — Chairman
- Irina Vyacheslavovna Mamkhegova — The First Deputy Chairman
- Sergejs Babuskins — Chief Risk Officer, Deputy Chairman
- Mikhail Yurievich Genis — Deputy Chairman
- Aleksandr Evgenievich Kuznetsov — Deputy Chairman
- Petri Heiki Juhani Loikkanen — Chief Financial Officer, Deputy Chairman
- Andrey Anatolievich Maltsev — Deputy Chairman
- Mikhail Vyacheslavovich Polyakov — Deputy Chairman
- Tatiana Nikolaevna Sharova — Chief Accountant, Deputy Chairman
- Igor Vladimirovich Volkov — Deputy Chairman.
40
JSC Nordea Bank Notes to the Consolidated Financial Statements — 31 December 2014
22 Corporate governance, internal control and financial risk management (continued)
Internal control policies and procedures. The Board of Directors and the Management Board have responsibility for the development, implementation and maintaining of internal controls in the Group that are commensurate with the scale and nature of operations.
The purpose of internal controls is to ensure:
- proper and comprehensive risk assessment and risk management
- proper business and accounting and financial reporting functions, including proper authorisation, processing and recording of transactions
- completeness, accuracy and timeliness of accounting records, managerial information, regulatory reports, etc.
- reliability of IT-systems, data and systems integrity and protection
- prevention of fraudulent or illegal activities, including misappropriation of assets
- compliance with laws and regulations.
Management is responsible for identifying and assessing risks, designing controls, monitoring their effectiveness and for maintaining internal control and organising risk management systems in accordance with requirements established by the CBR. Management monitors the effectiveness of the Group’s internal controls and periodically implements additional controls or modifies existing controls as considered necessary.
The Group developed a system of standards, policies and procedures to ensure effective operations and compliance with relevant legal and regulatory requirements, including the following areas:
- requirements for appropriate segregation of duties, including the independent authorisation of transactions
- requirements for the recording, reconciliation and monitoring of transactions
- compliance with regulatory and other legal requirements
- documenting of controls and procedures
- requirements for the periodic assessment of operational risks faced, and the adequacy of controls and procedures to address the risks identified
- requirements for the reporting of operational losses and proposed remedial action
- development of contingency plans
- training and professional development
- ethical and business standards and
- risk mitigation, including insurance where this is effective.
There is a hierarchy of requirements for authorisation of transactions depending on their size and complexity. A significant portion of operations are automated and the Group put in place a system of automated controls.
41
JSC Nordea Bank Notes to the Consolidated Financial Statements — 31 December 2014
22 Corporate governance, internal control and financial risk management (continued)
The system of internal controls of the Group consists of:
- Managerial bodies of the Bank, including permanent committees affiliated with the Board of Directors and the Management Board with the purpose of making internal control functions under the responsibility of the Board of Directors and the Management Board’s responsibility more efficient. The competence of the managerial bodies of the Bank is determined by the Charter and relevant regulations on managerial bodies
- Audit Committee that controls financial and operational activities of the Bank and is elected on the basis of the Regulation on the Audit Committee, approved by the general shareholders’ meeting
- Chief Accountant
- The Internal control service
- The Internal audit service
- Directors and chief accountants of the branches of the Bank
- Divisions and employees who are in charge of internal control in accordance with the powers granted by the Bank's internal documents.
In 2014 new requirements for the organisation of internal control system in credit organisations came into force. The new version of Provision of the Central Bank of Russia dated 16 December 2003 No 242-P On the Organisation of Internal Control in Credit Organisations and Banking Groups sets out the specific requirements for the Internal audit service and the Internal control service.
The main functions of the Internal audit service include the following:
- audit and efficiency assessment of the system of internal control as a whole, fulfillment of the decisions of key management
- audit of efficiency of methodology of assessment of banking risks and risk management procedures, regulated by internal documents in the Bank (methods, programmes, rules and procedures for banking operations and transactions, and for the management of banking risks)
- audit of reliability of internal control system over automated information systems
- audit and testing of fairness, completeness and timeliness of accounting and reporting function and the reliability (including the trustworthiness, fullness and objectivity) of the collection and submission of financial information
- audit of applicable methods of safekeeping the Bank's property
- assessment of economic reasonability and efficiency of operations and other deals
- audit of internal control processes and procedures
- audit of the Internal control service and the Risk unit.
The Internal control service conducts compliance activities focused primarily on regulatory risks faced by the Group.
The main functions of the Internal control service include the following:
- identification of regulatory risks
- monitoring of events related to regulatory risk, including probability of occurrence and quantitative assessment of their consequences
- monitoring of regulatory risk
- preparation of recommendations on regulatory risk management
- coordination and participation in developing of measures aimed to decrease regulatory risk
- monitoring of regulatory risk management efficiency
42

JSC Nordea Bank Notes to the Consolidated Financial Statements — 31 December 2014
22 Corporate governance, internal control and financial risk management (continued)
- participation in preparation of internal documents on regulatory risk management, anti-corruption, compliance with corporate behaviour rules, code of professional ethics and minimisation of conflicts of interest
- analysis of dynamics of clients’ complaints
- analysis of economic reasonableness of agreements with suppliers
- participation in interaction with authorities, self-organised organisations, associations and financial market participants.
Compliance with Group standards is supported by a program of periodic reviews undertaken by the Internal audit service. The Internal audit service is independent from management and reports directly to the Board of Directors. The results of the Internal audit service reviews are discussed with relevant business process managers, with summaries submitted to the Audit Committee and the Board of Directors and senior management of the Bank.
Russian legislation, including Federal Law dated 2 December 1990 No 395-1 On Banks and Banking Activity, Direction of the CBR dated 1 April 2014 No 3223-U On Requirement to Head of the Risk Management Service, Head of the Internal Control Service, Head of the Internal Audit Service of the Credit Organisation establish the professional qualifications, business reputation and other requirements for members of the Board of Directors, the Management Board, heads of the Internal audit service, the Internal control service and the Risk unit and other key management personnel. All members of the Bank’s governing and management bodies comply with these requirements.
Management believes that the Bank complies with the CBR’s requirements for a system of risk management and internal control system, including the requirements for the Internal audit service. Risk management system and the system of internal controls comply with the scale, nature and level of complexity of operations.
The Bank calculates mandatory ratios on a daily basis in accordance with the requirements of the CBR. Management is responsible for the Group’s compliance with mandatory ratios. As at 31 December 2014 and 2013 the mandatory ratios were in compliance with limits set by the CBR.
Risk management structure. The risk management function within the Group is carried out in respect of financial risks (credit, market, geographical, currency, liquidity and interest rates), operational risks and legal risks. The primary objectives of the financial risk management function are to establish risk limits, and then ensure that exposure to risks stays within these limits. The operational and legal risk management functions are intended to ensure proper functioning of internal policies and procedures to minimise operational and legal risks.
The risks in the Group are managed centrally. The Group risk management policies are applied groupwide and are used by all Group subsidiaries.
The risk management system of the Group includes development, implementation and control over risk management policies and procedures and subsequent update of policies and procedures following changes in economic, business and regulatory environment.
There were no significant changes in risk assessment in 2014.
The Bank’s risk management policy aims to identify, analyse and manage risks faced by the Group, to set risk limits and relevant controls, and to perform a continuous assessment of risk levels and adherence to limits. The risk management policy and procedures are revised on a regular basis in order to reflect changes in the market situation, banking products and services offered, and emerging best practice.
Bank’s internal documentation establishing the procedures and methodologies for identifying and managing the Group’s significant credit, operational, market, legal, liquidity and reputational risks, and for stress-testing was approved by the authorised management bodies of the Bank in accordance with regulations and recommendations issued by the CBR. The Bank maintains a system for reporting on the Group’s significant credit, operational, market, legal, liquidity and reputational risks, and on the Group’s capital.
The purpose of managing risks is to identify risks on timely basis, evaluate them and to develop and ensure proper functioning of internal processes and procedures providing control of the Group’s exposure to internal and external risk factors.
43
JSC Nordea Bank Notes to the Consolidated Financial Statements — 31 December 2014
22 Corporate governance, internal control and financial risk management (continued)
The risk and capital management system established in the Group, as well as the internal control system, comply with the scale, nature and level of complexity of operations and composition of risks taken.
There is following hierarchy of authority in the Group:
- The Board of Directors authorises the Group’s general risk management policy, which states the general principles of risk management, the risk level acceptable for the Group, strategic risk management goals, and development priorities of the risk management system
- The Management Board implements the risk management system, authorises the powers and composition of collective risk management bodies, makes decisions on accepting certain types of risks, and establishes the Group’s credit policy and policy for other operations, approves the limits for the different types of risks
- The Risk Management Committee ensures the development of the risk management system; approves internal risk management draft documents, terms of standard products and programmes for the Group’s customers; monitors and controls elements of the risk management system; approves the acceptable risk level as a part of the established development strategy; controls the compliance of operations performed by the Group with the general principles of the credit policy and policies for other operations; develops, implements and manages the authority system when making credit decisions
- The Bank’s Credit Committee is responsible for optimising the Group’s credit risks and composition an efficient credit portfolio based on risk-return ratio, and controls risks both at the portfolio level and at the single transaction level.
Subdivisions manage risks as part of their functional responsibilities.
Considering the nature and scope of the Group’s activities and to centralise risk management function the Board of Directors decided to create the Risk unit acting as a risk management service in terms of Federal Law dated 2 July 2013 No 146-FZ On Making Amendments to Certain Regulatory Acts of the Russian Federation in December 2014.
The Risk unit comprises:
- Credit risk department
- Limits and position control department
- Operational risk service
- Credit control function.
The Risk unit is not subordinated to, and does not report to, divisions accepting relevant risks in accordance with regulations and recommendations issued by the Bank of Russia. The Chief Risk Officer is a member of the Management Board and reports directly to the Board of Directors.
The Risk unit is responsible for the following:
- coordination and centralised management of Group’s risks
- developing methodologies for and conducting assessments of Group’s risks
- risk management training for employees
- risk management reporting
- preparation of proposals for risk management system improvements.
Management of the Group established procedures for reports preparation by the Risk unit as a result of work performed, which cover the Group’s credit, operational, market, legal, liquidity and reputational risk management also as management of capital.
The Internal audit service performs independent audit of efficiency of risk assessment methodology and procedures of risk management implemented also as audit the Risk unit subdivisions for compliance with the Group’s internal documentation, prepares reports to the Board of Directors and senior management of the Bank on timely basis with deficiencies and failures identified and mitigation plans.
44
JSC Nordea Bank Notes to the Consolidated Financial Statements — 31 December 2014
22 Corporate governance, internal control and financial risk management (continued)
The frequency and consistency of reports prepared by Risk unit and Internal audit service are in compliance with the Group’s internal documentation, these reports include observation of the effectiveness of the Group’s procedures and methodologies of risk assessment, and recommendations for improvement.
The Board of Directors and the Management Board of the Bank have responsibility for monitoring the Group’s compliance with risk limits and capital adequacy ratios as established by the Bank’s internal documentation. With the objective of monitoring effectiveness of the Group’s risk management procedures and their consistent application the Board of Directors and the Management Board of the Bank periodically discuss reports prepared by the Internal audit service and Risk unit, and considered proposed corrective actions.
Credit risk. The Group takes on exposure to credit risk, which is the risk that one party to a financial instrument will cause a financial loss for the other party by failing to discharge an obligation. Exposure to credit risk arises as a result of the Group’s lending and other transactions with counterparties giving rise to financial assets.
The Group’s maximum exposure to credit risk, excluding collateral and guarantees is generally reflected in the carrying amounts of financial assets in the consolidated statement of financial position. For guarantees and commitments to extend credits, the maximum exposure to credit risk is the amount of the commitment (refer to Note 24). The credit risk is mitigated by collateral and other credit enhancements.
Management monitors concentrations of credit risk by obtaining reports listing exposures to borrowers with aggregated loan balances in excess of 10% of net assets.
The Group manages its exposure to credit risk by placing limits on the amount of credit risk accepted in relation to one borrower, or group of borrowers, and to industry segments. Limits are established and are approved regularly by the appropriate credit committee. Such risks are monitored on a regular basis and are subject to an annual or more frequent review. The Group established a number of credit committees, which are responsible for approving credit limits for borrowers within the scope of their authority. These limits depend upon the borrower’s type, borrower’s rating, collateral and other conditions:
- Senior Credit Committee
- Retail Credit Committee
- Committee on impaired retail loans.
The committees hold their meetings on a weekly basis or as necessary.
The senior credit committee’s decisions on limits above EUR 10 million are agreed with Nordea Bank AB. The credit committee of Nordea Bank AB issues recommendations on parameters of the approved limit. Loan applications originated by the relevant client relationship managers are passed on to the relevant credit committee for approval of credit limit. Exposure to credit risk is also managed, in part, by obtaining collateral and corporate and personal guarantees.
The credit risk management system includes a model for assessing expected losses on the credit portfolio (the “expected loss model”) by using (i) the “probability of default” by the client or counterparty on its contractual obligations; (ii) current exposures to the counterparty and its likely future development, from which the Group derives the “exposure at default”; and (iii) the likely recovery ratio on the defaulted obligations (the “loss given default”). By calculating these measures the Group determines a risk premium for covering expected losses on the credit portfolio.
This model takes into consideration parameters such as the financial position of a counterparty, credit risk exposure, lending period, collateral and other factors that adjust the final risk premium. However, the expected loss model used for internal credit risk management can be contrasted with impairment allowances required under IAS 39, which are based on losses that have been incurred at the end of the reporting period (the “incurred loss model”) rather than expected losses as reflected in these consolidated financial statements (refer to Note 3).
Credit risk for unrecognised financial instruments is defined as the possibility of sustaining a loss as a result of another party to a financial instrument failing to perform in accordance with the terms of the contract. The Group uses the same credit policies in assuming conditional obligations as it does for recognised financial instruments through established credit approvals, risk control limits and monitoring procedures.
45

JSC Nordea Bank Notes to the Consolidated Financial Statements — 31 December 2014
22 Corporate governance, internal control and financial risk management (continued)
The Credit Committee, which determines the Group’s credit policy, assesses the creditworthiness of borrowers by reviewing documents defining their financial and operating activities and other publicly available information. The Committee also receives details of recent payment history and the status of any ongoing negotiations between the Group and third parties. Individual operating units keep records of the payment history for all customers with whom they conduct regular business. The exposure to individual counterparties is also managed by other mechanisms, such as guarantees from Nordea Bank AB. Management information reported to the Credit committee includes details of impairment allowances. The Internal audit service makes regular reviews to assess the degree of compliance with the internal procedures on credit. In evaluating a lending transaction or in evaluating risks associated with a problem borrower, the Group uses the results of a financial review performed based on the methodology developed by Nordea Bank AB and adapted to the Russian business environment.
In order to monitor credit risk exposures, credit department officers produce regular reports with a structured analysis of the exposure focusing on the customer’s business and financial performance. All information on significant exposures against customers with deteriorating creditworthiness is reported to and reviewed by the Credit Committee.
The Group’s management is responsible for the compliance of the Group, wherein the Bank is the parent credit institution, with the requirements of the CBR in respect of mandatory ratios, including the Group’s maximum risk exposure ratio per borrower or group of related borrowers (N21); the Group’s maximum risk exposure to large credit risks ratio (N22).
N21 ratio regulates (mitigates) the credit risk of the Group, wherein the Bank is the parent credit institution, in respect of a borrower or a group of related borrowers and sets the maximum ratio of the Group’s total credit claims (excluding unconsolidated participants of the Group) to the borrower or group of related borrowers to the Group’s capital.
N22 ratio regulates (mitigates) the total exposure to large credit risks of the Group, wherein the Bank is the parent credit institution, and sets the maximum ratio of the banking group’s total exposure to large credit risks (excluding unconsolidated participants of the Group) to the Group’s capital.
The Group was in compliance with the mandatory ratios in respect of the Group’s credit risk as at 31 December 2014 and 2013. The following table shows the mandatory credit risk ratios of the Group calculated as at 31 December 2014 and 2013.
Requirement 2014, % 2013, % Ratio N21 Not more than 25% 14.7 19.1 Ratio N22 Not more than 800% 273.6 351.4
The Group manages credit risk with regards to interbank loans and trading securities on the basis of internal ratings according to the methodology developed by Nordea Bank AB.
The Group assigns the rating to financial institutions and issuers, taking into consideration current business environment, outlook for the future, ownership structure, likelihood of government assistance and support from owners, market share and development strategy, reputation and availability of financial information, assets structure and quality.
Based on the results of analysis the internal integrated rating is assigned. The rating scale ranges from “0–“ to “6”, where rating 6 defines the highest credit quality under the rating model. Rating 5 is assigned to borrowers with strong capacity to meet their financial obligations. Rating 4 is assigned to borrowers with good capacity to meet their financial obligations. Rating 3 is assigned to borrowers with acceptable capacity to meet their financial obligations. Rating 2 is assigned to borrowers with low quality of assets, poor market position, restricted access to capital market and likelihood of government assistance and support from owners and dependence of future developments upon certain risk factors. Rating 1 is assigned to borrowers which are currently vulnerable to non-payment and are dependent upon favourable financial, economic and business conditions to meet their financial obligations. Rating 0 is assigned to the troubled, non-operating borrowers. Rating 0– is assigned to borrowers which became bankrupt. Rating S is assigned to state and municipal organisations. A rating is not assigned to counterparties which do not have credit balances at the reporting date.
46
JSC Nordea Bank Notes to the Consolidated Financial Statements — 31 December 2014
22 Corporate governance, internal control and financial risk management (continued)
The limits are set on transactions with financial institutions and issuers in accordance with ratings assigned: limit on direct lending operations, limit on documentary operations, limit on operations with securities and derivative financial instruments.
The Group usually takes collateral as security for all loans and credit facilities granted to its customers. The loan collateral value usually exceeds the loan amount. The main types of collateral or credit support taken are guarantees, Russian Government securities, shares of blue-chip companies, actively traded promissory notes, real estate, goods, wares and merchandise and similar assets.
Offsetting financial assets and financial liabilities. The disclosures set out in the tables below include financial assets and financial liabilities that:
- are offset in the Group’s consolidated statement of financial position or
- are subject to an enforceable master netting arrangement or similar agreement that covers similar financial instruments, irrespective of whether they are offset in the consolidated statement of financial position.
A part of Group’s derivative transactions is entered into under International Derivative Swaps and Dealers Association (ISDA) Master Netting Agreements. In general, under such agreements the amounts owned by each counterparty that are due on a single day in respect of transactions outstanding in the same currency under the agreement are aggregated into a single net amount being payable by one party to the other. In certain circumstances, for example when a credit event such as a default occurs, all outstanding transactions under the agreement are terminated, the termination value is assessed and only a single net amount is due or payable in settlement transactions.
The ISDA and similar master netting arrangements do not meet the criteria for offsetting in the consolidated statement of financial position. This is because they create a right of set-off of recognised amounts that is enforceable only following an event of default, insolvency or bankruptcy of the Group or the counterparties. In addition the Group and its counterparties do not intend to settle on a net basis or to realise the assets and settle the liabilities simultaneously.
The table below shows financial assets and financial liabilities subject to offsetting, enforceable master netting arrangements and similar arrangements as at 31 December 2014:
In millions of Russian Roubles
Gross amounts of recognised
financial asset/liability
Gross amount of recognised
financial liability/asset
offset in the consolidated statement of
financial position
Net amount of financial
assets/liabilities presented in the
consolidated statement of
financial position
Related amounts subject to offset in the event of
default
Net amount
Financial instruments
Cash collateral received
Derivative financial assets 1 855 - 1 855 (231) - 1 624
Derivative financial liabilities 396 - 396 (231) - 165
47
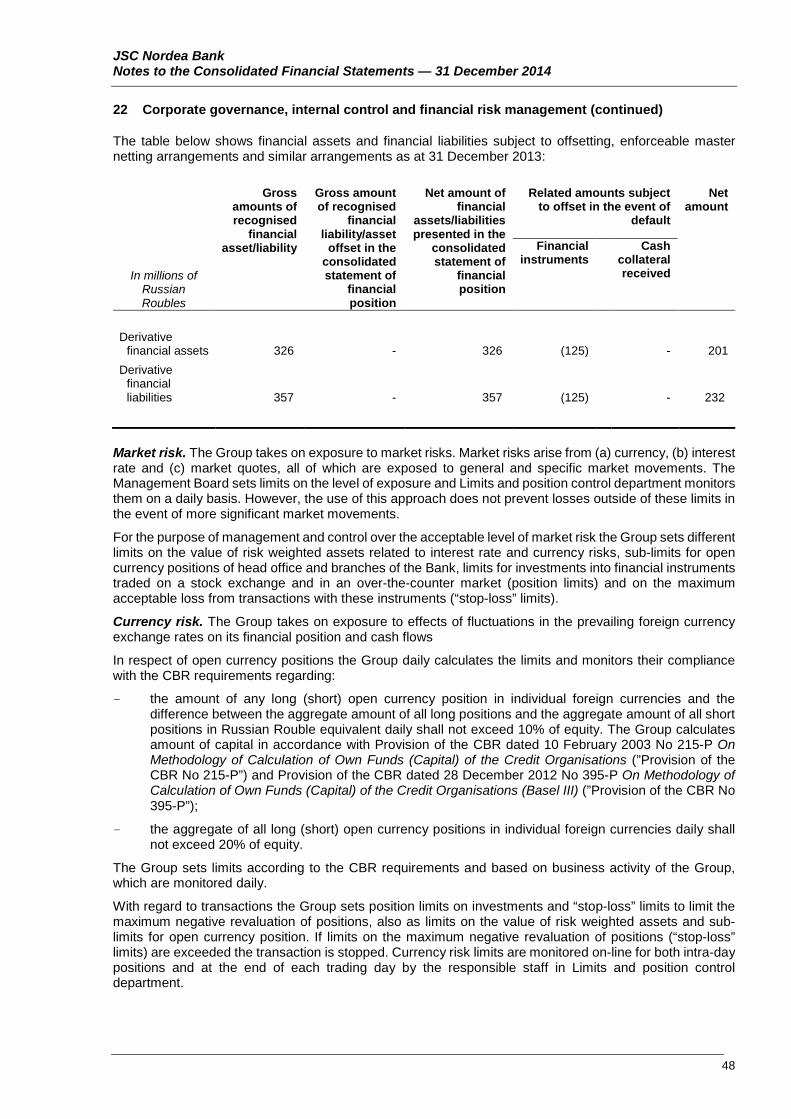
JSC Nordea Bank Notes to the Consolidated Financial Statements — 31 December 2014
22 Corporate governance, internal control and financial risk management (continued)
The table below shows financial assets and financial liabilities subject to offsetting, enforceable master netting arrangements and similar arrangements as at 31 December 2013:
In millions of Russian Roubles
Gross amounts of recognised
financial asset/liability
Gross amount of recognised
financial liability/asset
offset in the consolidated statement of
financial position
Net amount of financial
assets/liabilities presented in the
consolidated statement of
financial position
Related amounts subject to offset in the event of
default
Net amount
Financial instruments
Cash collateral received
Derivative financial assets 326 - 326 (125) - 201
Derivative financial liabilities 357 - 357 (125) - 232
Market risk. The Group takes on exposure to market risks. Market risks arise from (a) currency, (b) interest rate and (c) market quotes, all of which are exposed to general and specific market movements. The Management Board sets limits on the level of exposure and Limits and position control department monitors them on a daily basis. However, the use of this approach does not prevent losses outside of these limits in the event of more significant market movements.
For the purpose of management and control over the acceptable level of market risk the Group sets different limits on the value of risk weighted assets related to interest rate and currency risks, sub-limits for open currency positions of head office and branches of the Bank, limits for investments into financial instruments traded on a stock exchange and in an over-the-counter market (position limits) and on the maximum acceptable loss from transactions with these instruments (“stop-loss” limits).
Currency risk. The Group takes on exposure to effects of fluctuations in the prevailing foreign currency exchange rates on its financial position and cash flows
In respect of open currency positions the Group daily calculates the limits and monitors their compliance with the CBR requirements regarding:
- the amount of any long (short) open currency position in individual foreign currencies and the difference between the aggregate amount of all long positions and the aggregate amount of all short positions in Russian Rouble equivalent daily shall not exceed 10% of equity. The Group calculates amount of capital in accordance with Provision of the CBR dated 10 February 2003 No 215-P On Methodology of Calculation of Own Funds (Capital) of the Credit Organisations (”Provision of the CBR No 215-P”) and Provision of the CBR dated 28 December 2012 No 395-P On Methodology of Calculation of Own Funds (Capital) of the Credit Organisations (Basel III) (”Provision of the CBR No 395-P”);
- the aggregate of all long (short) open currency positions in individual foreign currencies daily shall not exceed 20% of equity.
The Group sets limits according to the CBR requirements and based on business activity of the Group, which are monitored daily.
With regard to transactions the Group sets position limits on investments and “stop-loss” limits to limit the maximum negative revaluation of positions, also as limits on the value of risk weighted assets and sub-limits for open currency position. If limits on the maximum negative revaluation of positions (“stop-loss” limits) are exceeded the transaction is stopped. Currency risk limits are monitored on-line for both intra-day positions and at the end of each trading day by the responsible staff in Limits and position control department.
48
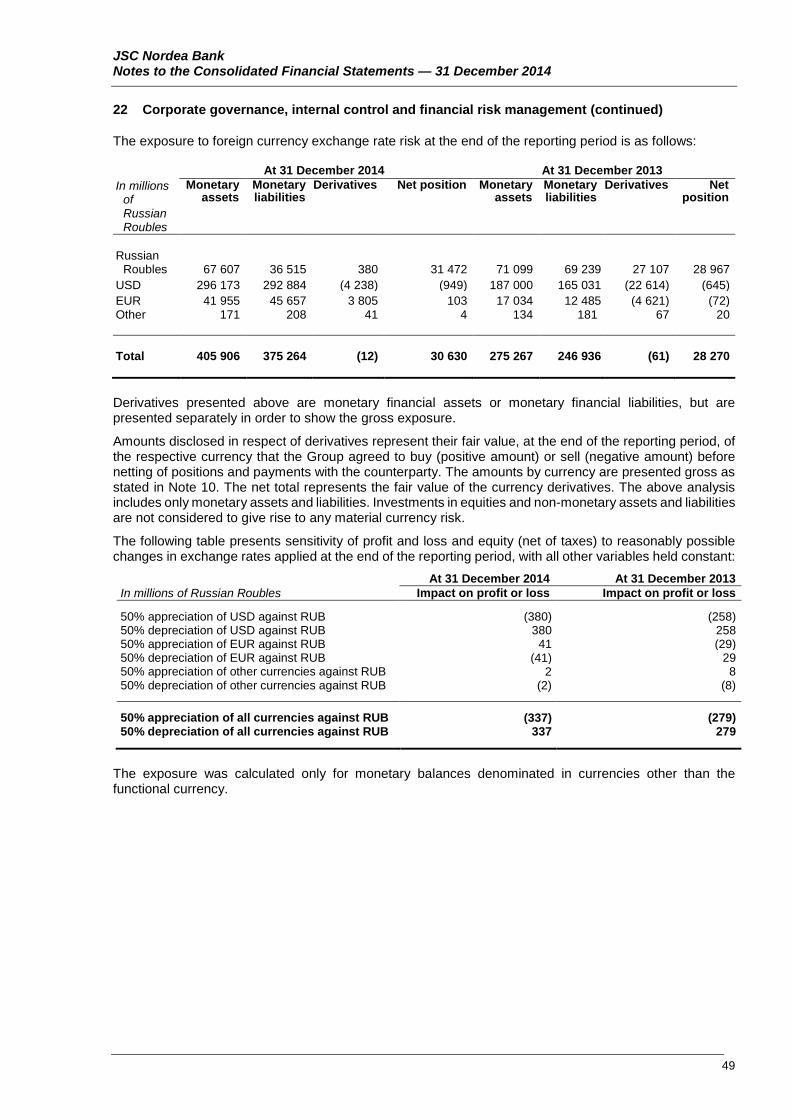
JSC Nordea Bank Notes to the Consolidated Financial Statements — 31 December 2014
22 Corporate governance, internal control and financial risk management (continued)
The exposure to foreign currency exchange rate risk at the end of the reporting period is as follows:
At 31 December 2014 At 31 December 2013 In millions
of Russian Roubles
Monetary assets
Monetary liabilities
Derivatives Net position Monetary assets
Monetary liabilities
Derivatives Net position
Russian
Roubles 67 607 36 515 380 31 472 71 099 69 239 27 107 28 967 USD 296 173 292 884 (4 238) (949) 187 000 165 031 (22 614) (645) EUR 41 955 45 657 3 805 103 17 034 12 485 (4 621) (72) Other 171 208 41 4 134 181 67 20 Total 405 906 375 264 (12) 30 630 275 267 246 936 (61) 28 270
Derivatives presented above are monetary financial assets or monetary financial liabilities, but are presented separately in order to show the gross exposure.
Amounts disclosed in respect of derivatives represent their fair value, at the end of the reporting period, of the respective currency that the Group agreed to buy (positive amount) or sell (negative amount) before netting of positions and payments with the counterparty. The amounts by currency are presented gross as stated in Note 10. The net total represents the fair value of the currency derivatives. The above analysis includes only monetary assets and liabilities. Investments in equities and non-monetary assets and liabilities are not considered to give rise to any material currency risk.
The following table presents sensitivity of profit and loss and equity (net of taxes) to reasonably possible changes in exchange rates applied at the end of the reporting period, with all other variables held constant:
In millions of Russian Roubles At 31 December 2014 At 31 December 2013
Impact on profit or loss Impact on profit or loss 50% appreciation of USD against RUB (380) (258) 50% depreciation of USD against RUB 380 258 50% appreciation of EUR against RUB 41 (29) 50% depreciation of EUR against RUB (41) 29 50% appreciation of other currencies against RUB 2 8 50% depreciation of other currencies against RUB (2) (8) 50% appreciation of all currencies against RUB (337) (279) 50% depreciation of all currencies against RUB 337 279
The exposure was calculated only for monetary balances denominated in currencies other than the functional currency.
49
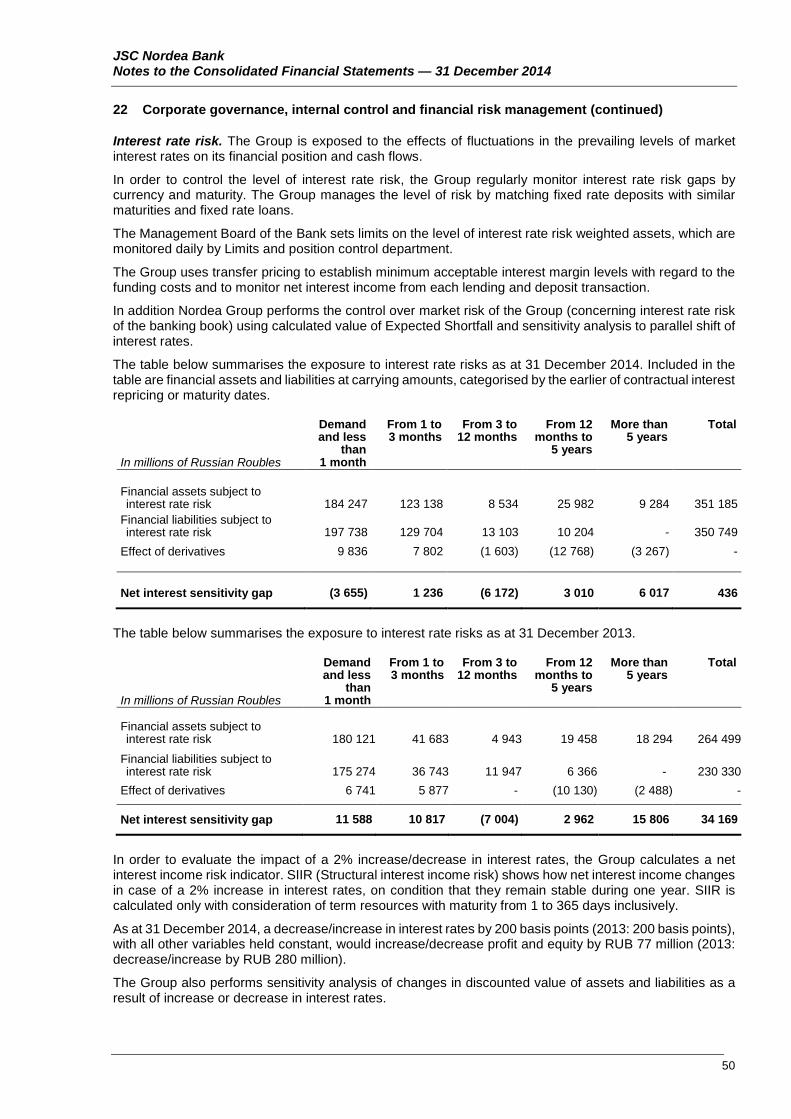
JSC Nordea Bank Notes to the Consolidated Financial Statements — 31 December 2014
22 Corporate governance, internal control and financial risk management (continued)
Interest rate risk. The Group is exposed to the effects of fluctuations in the prevailing levels of market interest rates on its financial position and cash flows.
In order to control the level of interest rate risk, the Group regularly monitor interest rate risk gaps by currency and maturity. The Group manages the level of risk by matching fixed rate deposits with similar maturities and fixed rate loans.
The Management Board of the Bank sets limits on the level of interest rate risk weighted assets, which are monitored daily by Limits and position control department.
The Group uses transfer pricing to establish minimum acceptable interest margin levels with regard to the funding costs and to monitor net interest income from each lending and deposit transaction.
In addition Nordea Group performs the control over market risk of the Group (concerning interest rate risk of the banking book) using calculated value of Expected Shortfall and sensitivity analysis to parallel shift of interest rates.
The table below summarises the exposure to interest rate risks as at 31 December 2014. Included in the table are financial assets and liabilities at carrying amounts, categorised by the earlier of contractual interest repricing or maturity dates.
In millions of Russian Roubles
Demand and less
than 1 month
From 1 to 3 months
From 3 to 12 months
From 12 months to
5 years
More than 5 years
Total
Financial assets subject to interest rate risk 184 247 123 138 8 534 25 982 9 284 351 185
Financial liabilities subject to interest rate risk 197 738 129 704 13 103 10 204 - 350 749
Effect of derivatives 9 836 7 802 (1 603) (12 768) (3 267) - Net interest sensitivity gap (3 655) 1 236 (6 172) 3 010 6 017 436
The table below summarises the exposure to interest rate risks as at 31 December 2013.
In millions of Russian Roubles
Demand and less
than 1 month
From 1 to 3 months
From 3 to 12 months
From 12 months to
5 years
More than 5 years
Total
Financial assets subject to interest rate risk 180 121 41 683 4 943 19 458 18 294 264 499
Financial liabilities subject to interest rate risk 175 274 36 743 11 947 6 366 - 230 330
Effect of derivatives 6 741 5 877 - (10 130) (2 488) -
Net interest sensitivity gap 11 588 10 817 (7 004) 2 962 15 806 34 169
In order to evaluate the impact of a 2% increase/decrease in interest rates, the Group calculates a net interest income risk indicator. SIIR (Structural interest income risk) shows how net interest income changes in case of a 2% increase in interest rates, on condition that they remain stable during one year. SIIR is calculated only with consideration of term resources with maturity from 1 to 365 days inclusively.
As at 31 December 2014, a decrease/increase in interest rates by 200 basis points (2013: 200 basis points), with all other variables held constant, would increase/decrease profit and equity by RUB 77 million (2013: decrease/increase by RUB 280 million).
The Group also performs sensitivity analysis of changes in discounted value of assets and liabilities as a result of increase or decrease in interest rates.
50
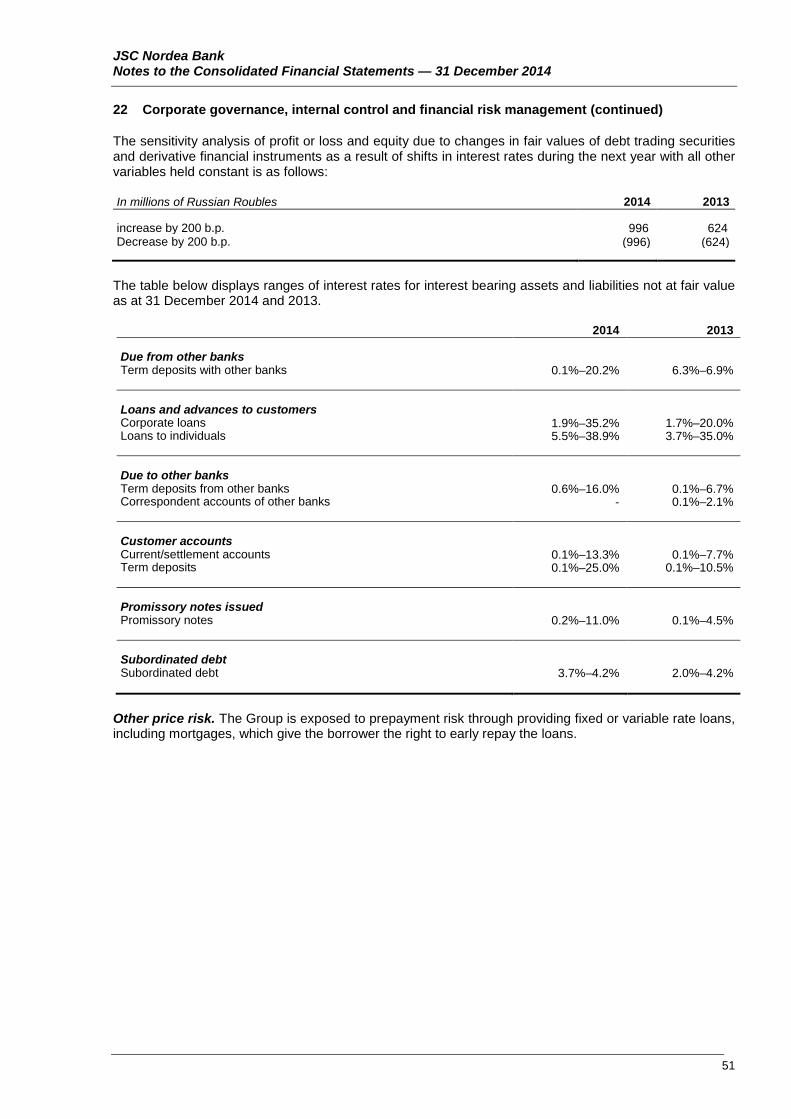
JSC Nordea Bank Notes to the Consolidated Financial Statements — 31 December 2014
22 Corporate governance, internal control and financial risk management (continued)
The sensitivity analysis of profit or loss and equity due to changes in fair values of debt trading securities and derivative financial instruments as a result of shifts in interest rates during the next year with all other variables held constant is as follows:
In millions of Russian Roubles 2014 2013
increase by 200 b.p. 996 624 Decrease by 200 b.p. (996) (624)
The table below displays ranges of interest rates for interest bearing assets and liabilities not at fair value as at 31 December 2014 and 2013.
2014 2013 Due from other banks Term deposits with other banks 0.1%–20.2% 6.3%–6.9% Loans and advances to customers Corporate loans 1.9%–35.2% 1.7%–20.0% Loans to individuals 5.5%–38.9% 3.7%–35.0% Due to other banks Term deposits from other banks 0.6%–16.0% 0.1%–6.7% Correspondent accounts of other banks - 0.1%–2.1% Customer accounts Current/settlement accounts 0.1%–13.3% 0.1%–7.7% Term deposits 0.1%–25.0% 0.1%–10.5% Promissory notes issued Promissory notes 0.2%–11.0% 0.1%–4.5% Subordinated debt Subordinated debt 3.7%–4.2% 2.0%–4.2%
Other price risk. The Group is exposed to prepayment risk through providing fixed or variable rate loans, including mortgages, which give the borrower the right to early repay the loans.
51
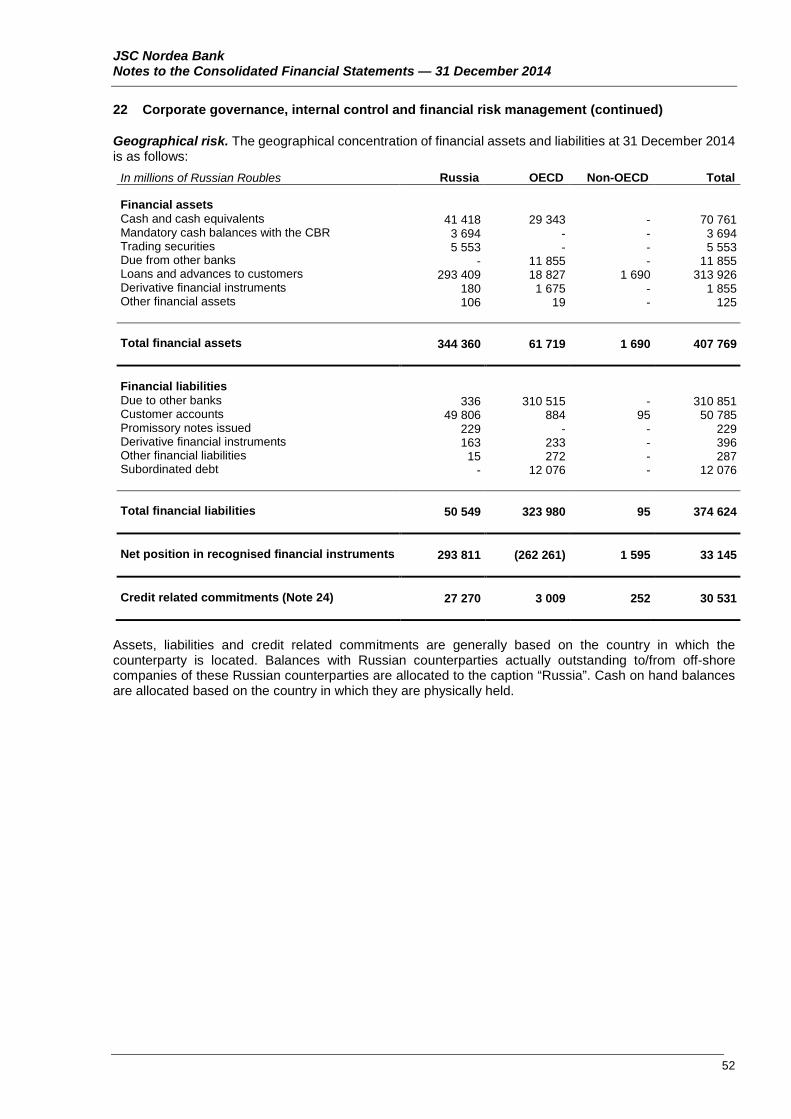
JSC Nordea Bank Notes to the Consolidated Financial Statements — 31 December 2014
22 Corporate governance, internal control and financial risk management (continued)
Geographical risk. The geographical concentration of financial assets and liabilities at 31 December 2014 is as follows:
In millions of Russian Roubles Russia OECD Non-OECD Total Financial assets Cash and cash equivalents 41 418 29 343 - 70 761 Mandatory cash balances with the CBR 3 694 - - 3 694 Trading securities 5 553 - - 5 553 Due from other banks - 11 855 - 11 855 Loans and advances to customers 293 409 18 827 1 690 313 926 Derivative financial instruments 180 1 675 - 1 855 Other financial assets 106 19 - 125 Total financial assets 344 360 61 719 1 690 407 769 Financial liabilities Due to other banks 336 310 515 - 310 851 Customer accounts 49 806 884 95 50 785 Promissory notes issued 229 - - 229 Derivative financial instruments 163 233 - 396 Other financial liabilities 15 272 - 287 Subordinated debt - 12 076 - 12 076 Total financial liabilities 50 549 323 980 95 374 624 Net position in recognised financial instruments 293 811 (262 261) 1 595 33 145 Credit related commitments (Note 24) 27 270 3 009 252 30 531
Assets, liabilities and credit related commitments are generally based on the country in which the counterparty is located. Balances with Russian counterparties actually outstanding to/from off-shore companies of these Russian counterparties are allocated to the caption “Russia”. Cash on hand balances are allocated based on the country in which they are physically held.
52
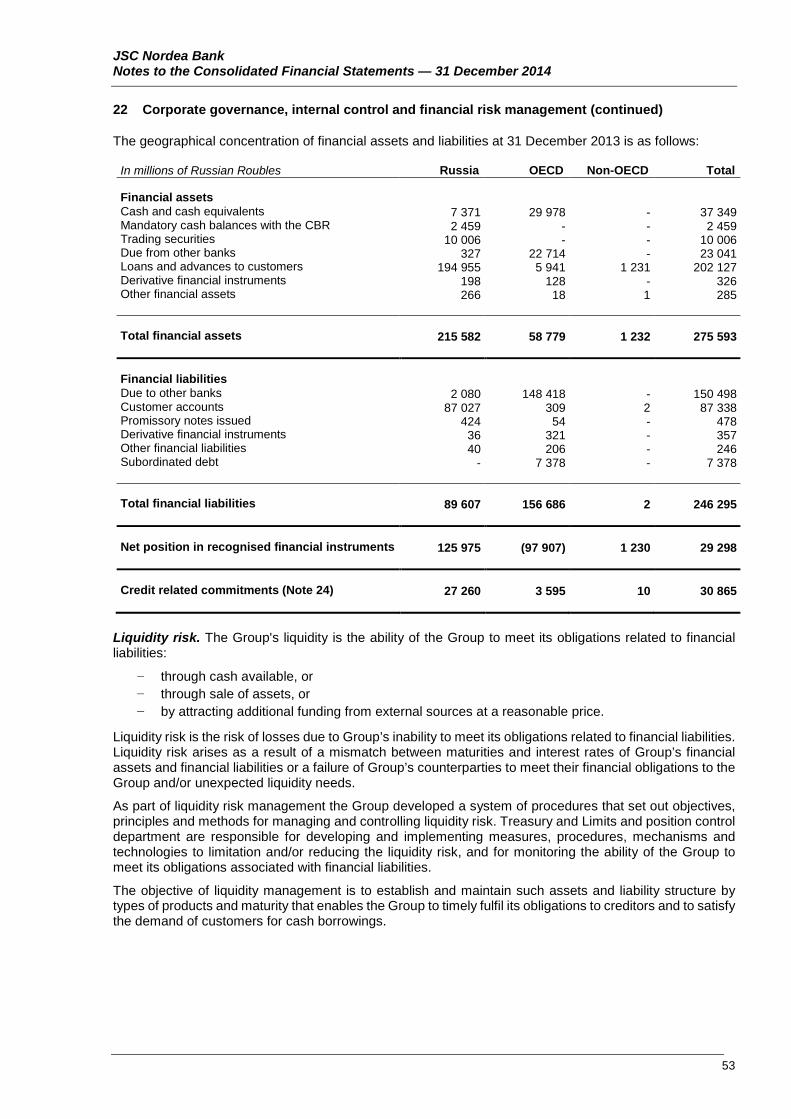
JSC Nordea Bank Notes to the Consolidated Financial Statements — 31 December 2014
22 Corporate governance, internal control and financial risk management (continued)
The geographical concentration of financial assets and liabilities at 31 December 2013 is as follows:
In millions of Russian Roubles Russia OECD Non-OECD Total Financial assets Cash and cash equivalents 7 371 29 978 - 37 349 Mandatory cash balances with the CBR 2 459 - - 2 459 Trading securities 10 006 - - 10 006 Due from other banks 327 22 714 - 23 041 Loans and advances to customers 194 955 5 941 1 231 202 127 Derivative financial instruments 198 128 - 326 Other financial assets 266 18 1 285 Total financial assets 215 582 58 779 1 232 275 593 Financial liabilities Due to other banks 2 080 148 418 - 150 498 Customer accounts 87 027 309 2 87 338 Promissory notes issued 424 54 - 478 Derivative financial instruments 36 321 - 357 Other financial liabilities 40 206 - 246 Subordinated debt - 7 378 - 7 378 Total financial liabilities 89 607 156 686 2 246 295 Net position in recognised financial instruments 125 975 (97 907) 1 230 29 298 Credit related commitments (Note 24) 27 260 3 595 10 30 865
Liquidity risk. The Group's liquidity is the ability of the Group to meet its obligations related to financial liabilities:
− through cash available, or − through sale of assets, or − by attracting additional funding from external sources at a reasonable price.
Liquidity risk is the risk of losses due to Group’s inability to meet its obligations related to financial liabilities. Liquidity risk arises as a result of a mismatch between maturities and interest rates of Group’s financial assets and financial liabilities or a failure of Group’s counterparties to meet their financial obligations to the Group and/or unexpected liquidity needs.
As part of liquidity risk management the Group developed a system of procedures that set out objectives, principles and methods for managing and controlling liquidity risk. Treasury and Limits and position control department are responsible for developing and implementing measures, procedures, mechanisms and technologies to limitation and/or reducing the liquidity risk, and for monitoring the ability of the Group to meet its obligations associated with financial liabilities.
The objective of liquidity management is to establish and maintain such assets and liability structure by types of products and maturity that enables the Group to timely fulfil its obligations to creditors and to satisfy the demand of customers for cash borrowings.
53
JSC Nordea Bank Notes to the Consolidated Financial Statements — 31 December 2014
22 Corporate governance, internal control and financial risk management (continued)
The main goals, objectives, principles and methods for managing and controlling the liquidity position are set out in the Liquidity Policy of the Group approved by the Board of Directors. The Liquidity Policy comprises:
− the goals and objectives of the liquidity management process
− main principles of the liquidity management process and for monitoring the liquidity position
− a hierarchy of the powers of employees and managerial bodies of the Bank
− a liquidity control system
− an information system designed to meet liquidity risk management and liquidity control objectives
− an overview of anti-crisis measures.
The liquidity control system in the Group comprises three levels:
− heads of business departments are responsible for ensuring that the volume and terms of transactions/operations comply with the limits established by the managerial bodies of the Bank
− the Head of Treasury ensures that operations comply with the limits established by the managerial bodies of the Bank, ensures that mandatory liquidity ratios comply with Russian legislation and with the CBR regulations, prevents liquidity excess or deficiency, controls the Group's liquidity position on an operational basis and ensures that anti-crisis measures are implemented.
− the Head of Limits and position control department performs operational control over mandatory liquidity ratios, and ensures that operations comply with the limits established by the managerial bodies of the Bank. The Internal audit service performs an audit of the completeness of the application and efficiency of risk assessment methodology and liquidity management procedures and compliance with established limits.
Treasury is responsible for liquidity risk management in the Group within established limits. The main objectives and functions of Treasury and its subdivisions in relation to liquidity risk management are:
− the Group's liquidity management including standard procedures for liquidity management and procedures in the event of identifying liquidity excess or deficiency
− the Group's funding by operations on interbank and money markets including derivatives, collateralised funding and operations with own debt instruments
− liquid security portfolio management
− ensuring compliance between mandatory liquidity ratios and limits set by the CBR
− analysis of the liquidity position including funding gaps and liquidity buffers
− establishing internal limits for required funding
− income generation from asset and liability management within risk limits and risk appetite.
Limits and position control department is responsible for operational control and analysis of the Group’s liquidity risk. The main objectives and functions of this department and its subordinated Liquidity risk unit are:
− monitoring compliance between mandatory liquidity ratios and the CBR Instruction dated 3 December 2012 № 139-I On Mandatory Ratios of Banks including the daily monitoring of liquidity ratios
− monitoring compliance between the internal liquidity ratios and liquidity limits of the Group and internal limits
− analysis of the Group’s current liquidity position
54
JSC Nordea Bank Notes to the Consolidated Financial Statements — 31 December 2014
22 Corporate governance, internal control and financial risk management (continued)
− liquidity gap analysis
− scenario analysis of liquidity risk including cash flow forecasts and stress testing
− analysis of the warning indicators system and monitoring its operation
− using the ratio method for liquidity risk analysis and monitoring
− analysis and evaluation of the liquidity structure of assets and liabilities
− preparing internal liquidity reports with a frequency set by the Head of Treasury.
Monitoring of the current and projected current liquidity position is performed daily on the basis of a payment schedule and a forecast of short term resource requirements. Monitoring of the structural liquidity position is done by means of the regular preparation of current and projected assets and liabilities gap reports.
The Group seeks to maintain a stable funding base, primarily consisting of amounts due to other banks and corporate customer/individual deposits, and invests funds in diversified portfolios of liquid assets, in order to be able to respond quickly and efficiently to unforeseen liquidity requirements.
Treasury receives information about the liquidity profile of financial assets and liabilities. Treasury then provides for a portfolio of short-term liquid assets, largely made up of short-term liquid trading securities, deposits with banks and other inter-bank facilities, to ensure that sufficient liquidity is maintained within the Group as a whole.
The table below shows assets and liabilities at 31 December 2014 by the earliest date of their remaining contractual maturity excluding trading securities at fair value through profit and loss which are presented in “Demand and less than 1 months” category as they can be realised on the securities market within one month. The amounts disclosed in the table are contractual undiscounted cash flows. Such undiscounted cash flows differ from the amounts included in the consolidated statement of financial position because the amounts in the consolidated statement of financial position are based on discounted cash flows. Net settled derivatives are included in the net amounts expected to be paid.
In accordance with Russian legislation, individuals can withdraw their term deposits at any time, losing in most of the cases the accrued interest. Accordingly, these deposits, excluding accrued interest, are shown in the table below in the category of “Demand and less than 1 month”.
When the amount receivable or payable is not fixed, the amount disclosed is determined by reference to the conditions existing at the reporting date. Foreign currency payments are translated using the spot exchange rate at the end of the reporting period.
55
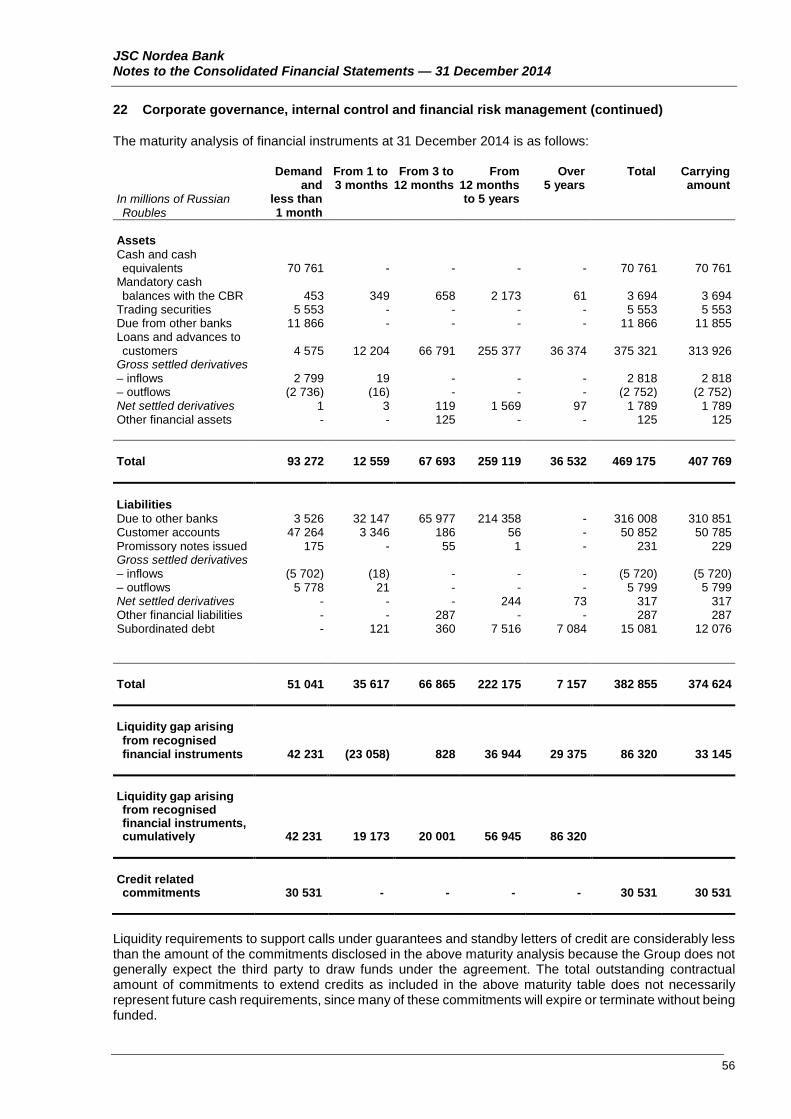
JSC Nordea Bank Notes to the Consolidated Financial Statements — 31 December 2014
22 Corporate governance, internal control and financial risk management (continued)
The maturity analysis of financial instruments at 31 December 2014 is as follows:
In millions of Russian Roubles
Demand and
less than 1 month
From 1 to 3 months
From 3 to 12 months
From 12 months to 5 years
Over 5 years
Total Carrying amount
Assets Cash and cash equivalents 70 761 - - - - 70 761 70 761
Mandatory cash balances with the CBR 453 349 658 2 173 61 3 694 3 694
Trading securities 5 553 - - - - 5 553 5 553 Due from other banks 11 866 - - - - 11 866 11 855 Loans and advances to customers 4 575 12 204 66 791 255 377 36 374 375 321 313 926
Gross settled derivatives – inflows 2 799 19 - - - 2 818 2 818 – outflows (2 736) (16) - - - (2 752) (2 752) Net settled derivatives 1 3 119 1 569 97 1 789 1 789 Other financial assets - - 125 - - 125 125 Total 93 272 12 559 67 693 259 119 36 532 469 175 407 769 Liabilities Due to other banks 3 526 32 147 65 977 214 358 - 316 008 310 851 Customer accounts 47 264 3 346 186 56 - 50 852 50 785 Promissory notes issued 175 - 55 1 - 231 229 Gross settled derivatives – inflows (5 702) (18) - - - (5 720) (5 720) – outflows 5 778 21 - - - 5 799 5 799 Net settled derivatives - - - 244 73 317 317 Other financial liabilities - - 287 - - 287 287 Subordinated debt - 121 360 7 516 7 084 15 081 12 076 Total 51 041 35 617 66 865 222 175 7 157 382 855 374 624 Liquidity gap arising from recognised financial instruments 42 231 (23 058) 828 36 944 29 375 86 320 33 145
Liquidity gap arising from recognised financial instruments, cumulatively 42 231 19 173 20 001 56 945 86 320
Credit related commitments 30 531 - - - - 30 531 30 531
Liquidity requirements to support calls under guarantees and standby letters of credit are considerably less than the amount of the commitments disclosed in the above maturity analysis because the Group does not generally expect the third party to draw funds under the agreement. The total outstanding contractual amount of commitments to extend credits as included in the above maturity table does not necessarily represent future cash requirements, since many of these commitments will expire or terminate without being funded.
56
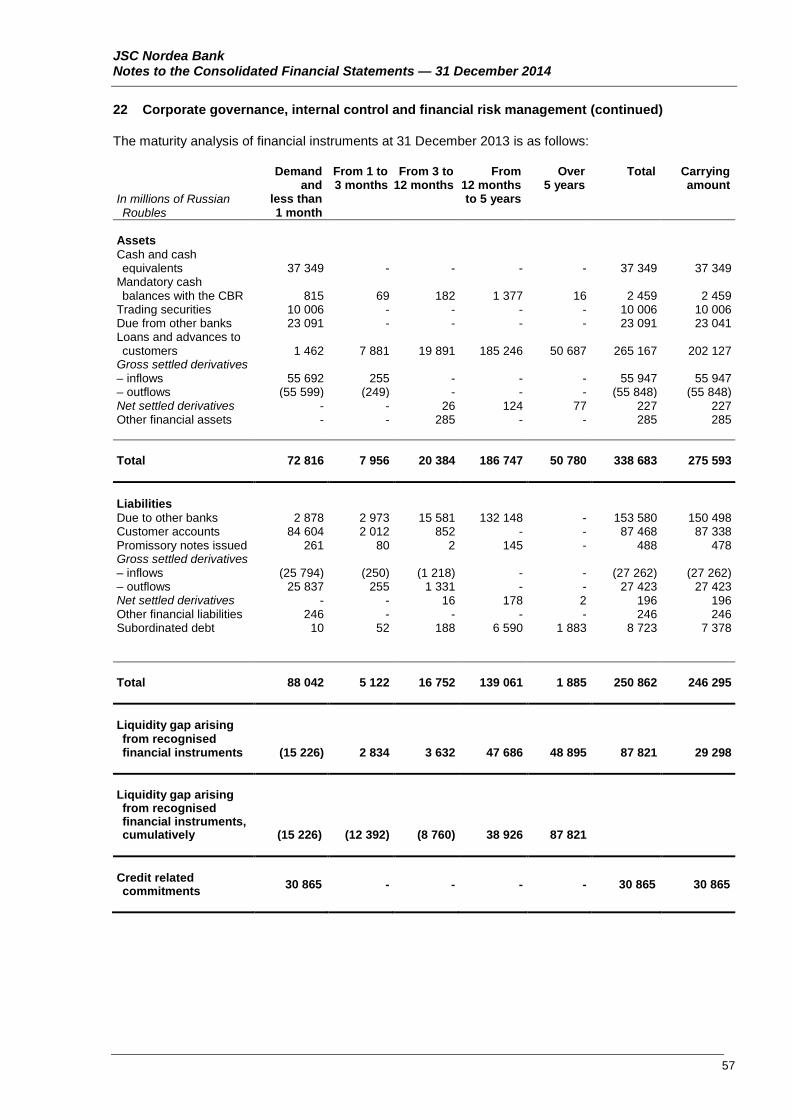
JSC Nordea Bank Notes to the Consolidated Financial Statements — 31 December 2014
22 Corporate governance, internal control and financial risk management (continued)
The maturity analysis of financial instruments at 31 December 2013 is as follows:
In millions of Russian Roubles
Demand and
less than 1 month
From 1 to 3 months
From 3 to 12 months
From 12 months to 5 years
Over 5 years
Total Carrying amount
Assets Cash and cash equivalents 37 349 - - - - 37 349 37 349
Mandatory cash balances with the CBR 815 69 182 1 377 16 2 459 2 459
Trading securities 10 006 - - - - 10 006 10 006 Due from other banks 23 091 - - - - 23 091 23 041 Loans and advances to customers 1 462 7 881 19 891 185 246 50 687 265 167 202 127
Gross settled derivatives – inflows 55 692 255 - - - 55 947 55 947 – outflows (55 599) (249) - - - (55 848) (55 848) Net settled derivatives - - 26 124 77 227 227 Other financial assets - - 285 - - 285 285 Total 72 816 7 956 20 384 186 747 50 780 338 683 275 593 Liabilities Due to other banks 2 878 2 973 15 581 132 148 - 153 580 150 498 Customer accounts 84 604 2 012 852 - - 87 468 87 338 Promissory notes issued 261 80 2 145 - 488 478 Gross settled derivatives – inflows (25 794) (250) (1 218) - - (27 262) (27 262) – outflows 25 837 255 1 331 - - 27 423 27 423 Net settled derivatives - - 16 178 2 196 196 Other financial liabilities 246 - - - - 246 246 Subordinated debt 10 52 188 6 590 1 883 8 723 7 378 Total 88 042 5 122 16 752 139 061 1 885 250 862 246 295 Liquidity gap arising from recognised financial instruments (15 226) 2 834 3 632 47 686 48 895 87 821 29 298
Liquidity gap arising from recognised financial instruments, cumulatively (15 226) (12 392) (8 760) 38 926 87 821
Credit related commitments 30 865 - - - - 30 865 30 865
57
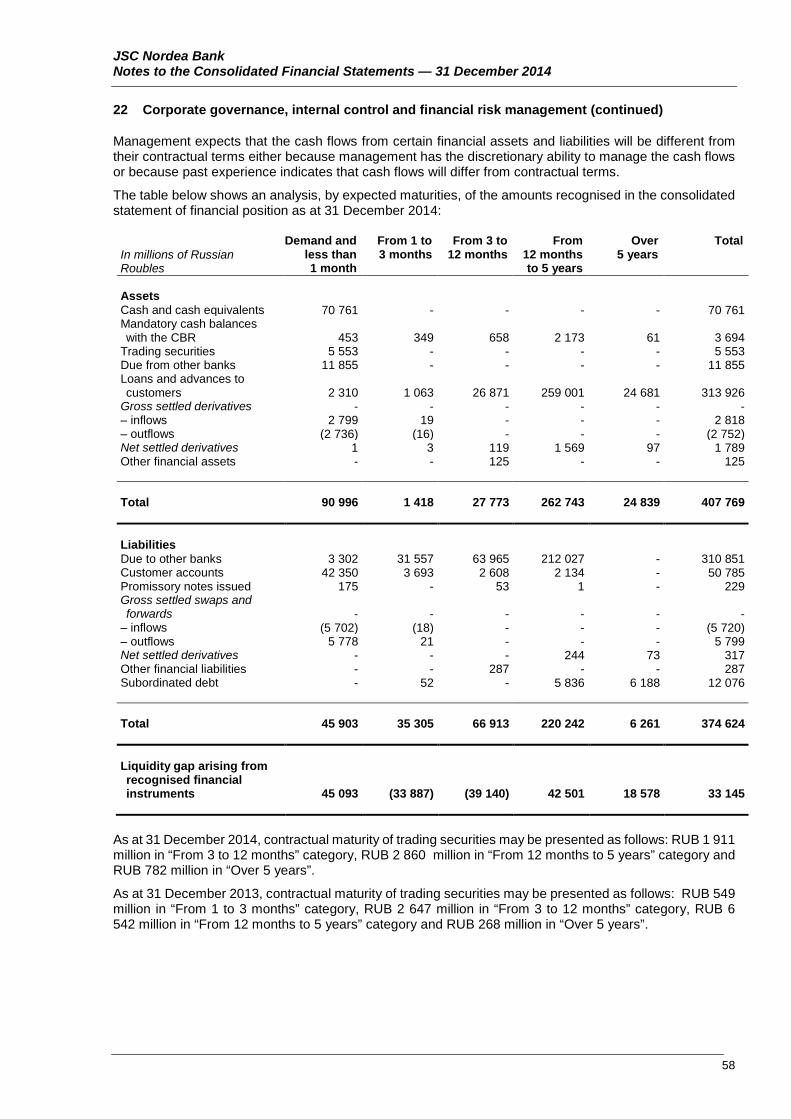
JSC Nordea Bank Notes to the Consolidated Financial Statements — 31 December 2014
22 Corporate governance, internal control and financial risk management (continued)
Management expects that the cash flows from certain financial assets and liabilities will be different from their contractual terms either because management has the discretionary ability to manage the cash flows or because past experience indicates that cash flows will differ from contractual terms.
The table below shows an analysis, by expected maturities, of the amounts recognised in the consolidated statement of financial position as at 31 December 2014:
In millions of Russian Roubles
Demand and less than 1 month
From 1 to 3 months
From 3 to 12 months
From 12 months to 5 years
Over 5 years
Total
Assets Cash and cash equivalents 70 761 - - - - 70 761 Mandatory cash balances with the CBR 453 349 658 2 173 61 3 694
Trading securities 5 553 - - - - 5 553 Due from other banks 11 855 - - - - 11 855 Loans and advances to customers 2 310 1 063 26 871 259 001 24 681 313 926
Gross settled derivatives - - - - - - – inflows 2 799 19 - - - 2 818 – outflows (2 736) (16) - - - (2 752) Net settled derivatives 1 3 119 1 569 97 1 789 Other financial assets - - 125 - - 125 Total 90 996 1 418 27 773 262 743 24 839 407 769 Liabilities Due to other banks 3 302 31 557 63 965 212 027 - 310 851 Customer accounts 42 350 3 693 2 608 2 134 - 50 785 Promissory notes issued 175 - 53 1 - 229 Gross settled swaps and forwards - - - - - -
– inflows (5 702) (18) - - - (5 720) – outflows 5 778 21 - - - 5 799 Net settled derivatives - - - 244 73 317 Other financial liabilities - - 287 - - 287 Subordinated debt - 52 - 5 836 6 188 12 076 Total 45 903 35 305 66 913 220 242 6 261 374 624 Liquidity gap arising from recognised financial instruments 45 093 (33 887) (39 140) 42 501 18 578 33 145
As at 31 December 2014, contractual maturity of trading securities may be presented as follows: RUB 1 911 million in “From 3 to 12 months” category, RUB 2 860 million in “From 12 months to 5 years” category and RUB 782 million in “Over 5 years”.
As at 31 December 2013, contractual maturity of trading securities may be presented as follows: RUB 549 million in “From 1 to 3 months” category, RUB 2 647 million in “From 3 to 12 months” category, RUB 6 542 million in “From 12 months to 5 years” category and RUB 268 million in “Over 5 years”.
58
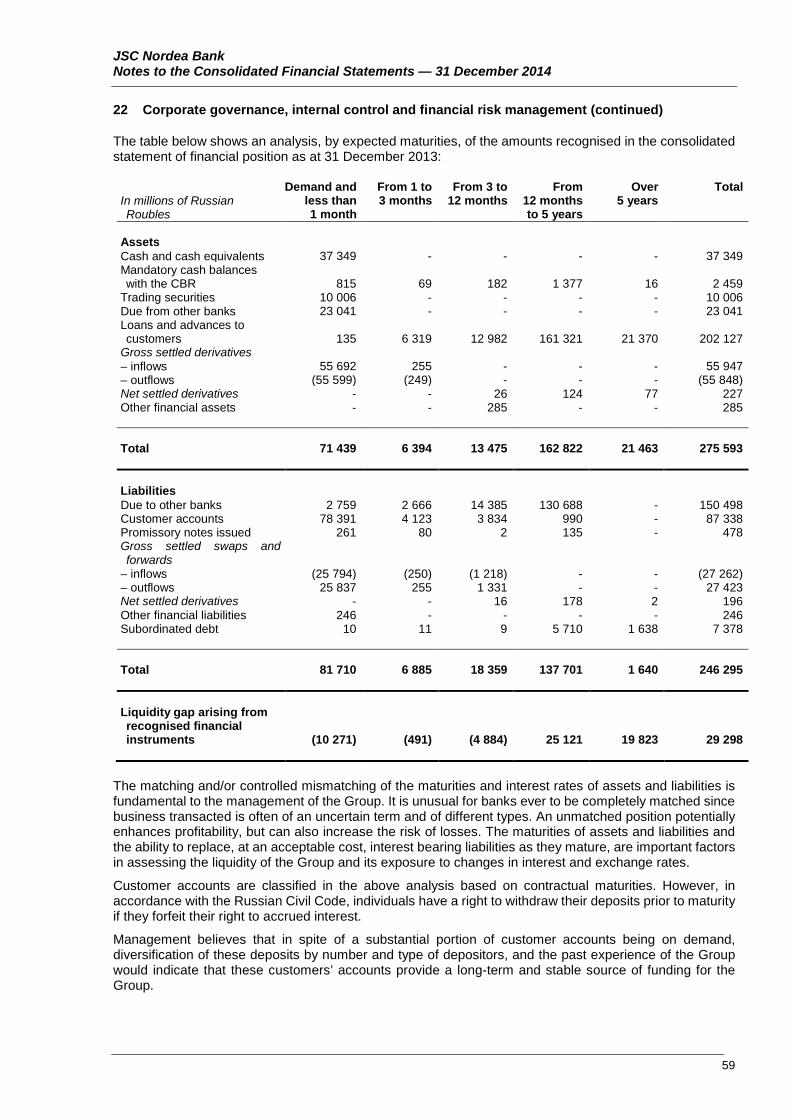
JSC Nordea Bank Notes to the Consolidated Financial Statements — 31 December 2014
22 Corporate governance, internal control and financial risk management (continued)
The table below shows an analysis, by expected maturities, of the amounts recognised in the consolidated statement of financial position as at 31 December 2013:
In millions of Russian Roubles
Demand and less than 1 month
From 1 to 3 months
From 3 to 12 months
From 12 months to 5 years
Over 5 years
Total
Assets Cash and cash equivalents 37 349 - - - - 37 349 Mandatory cash balances with the CBR 815 69 182 1 377 16 2 459
Trading securities 10 006 - - - - 10 006 Due from other banks 23 041 - - - - 23 041 Loans and advances to customers 135 6 319 12 982 161 321 21 370 202 127
Gross settled derivatives – inflows 55 692 255 - - - 55 947 – outflows (55 599) (249) - - - (55 848) Net settled derivatives - - 26 124 77 227 Other financial assets - - 285 - - 285 Total 71 439 6 394 13 475 162 822 21 463 275 593 Liabilities Due to other banks 2 759 2 666 14 385 130 688 - 150 498 Customer accounts 78 391 4 123 3 834 990 - 87 338 Promissory notes issued 261 80 2 135 - 478 Gross settled swaps and forwards
– inflows (25 794) (250) (1 218) - - (27 262) – outflows 25 837 255 1 331 - - 27 423 Net settled derivatives - - 16 178 2 196 Other financial liabilities 246 - - - - 246 Subordinated debt 10 11 9 5 710 1 638 7 378 Total 81 710 6 885 18 359 137 701 1 640 246 295 Liquidity gap arising from recognised financial instruments (10 271) (491) (4 884) 25 121 19 823 29 298
The matching and/or controlled mismatching of the maturities and interest rates of assets and liabilities is fundamental to the management of the Group. It is unusual for banks ever to be completely matched since business transacted is often of an uncertain term and of different types. An unmatched position potentially enhances profitability, but can also increase the risk of losses. The maturities of assets and liabilities and the ability to replace, at an acceptable cost, interest bearing liabilities as they mature, are important factors in assessing the liquidity of the Group and its exposure to changes in interest and exchange rates.
Customer accounts are classified in the above analysis based on contractual maturities. However, in accordance with the Russian Civil Code, individuals have a right to withdraw their deposits prior to maturity if they forfeit their right to accrued interest.
Management believes that in spite of a substantial portion of customer accounts being on demand, diversification of these deposits by number and type of depositors, and the past experience of the Group would indicate that these customers’ accounts provide a long-term and stable source of funding for the Group.
59

JSC Nordea Bank Notes to the Consolidated Financial Statements — 31 December 2014
22 Corporate governance, internal control and financial risk management (continued)
The Bank also calculates mandatory liquidity ratios on a daily basis in accordance with the requirements of the CBR.
Limits and position control department calculates and monitors the projected value of liquidity ratios. In case any ratio approaches its critical value, Limits and position control department informs the Head of Treasury and the supervising Deputy Chairman of the Board and works out proposals to prevent breach of the set ratios.
Planning and reporting department is responsible for the calculation of ratios.
These ratios include:
- instant liquidity ratio (N2), which is calculated as the ratio of highly liquid assets to liabilities payable on demand
- current liquidity ratio (N3), which is calculated as the ratio of liquid assets to liabilities maturing within 30 calendar days
- long-term liquidity ratio (N4), which is calculated as the ratio of assets maturing after 1 year to the equity and liabilities maturing after 1 year.
The following table shows the mandatory liquidity ratios calculated as at 31 December 2014 and 2013.
Requirement 2014 2013 Instant liquidity ratio (N2) Not less than 15% 249.1% 185.1% Current liquidity ratio (N3) Not less than 50% 254.8% 96.9% Long-term liquidity ratio (N4) Not more than 120% 105.1% 103.0%
23 Management of capital
The objectives when managing capital are (i) to comply with capital requirements set by the CBR, and (ii) to safeguard the ability to continue as a going concern. The amount of capital as at 31 December 2014 was RUB 33 500 million (2013: RUB 29 846 million).
The Group defines as capital those items defined by statutory regulation as capital for credit institutions. Till 31 December 2013 the Group calculated amount of capital in accordance with Provision of the CBR No 215-P and starting from 1 January 2014 – in accordance with Provision of the CBR No 395-P and in accordance with Direction of the CBR 3090-U dated 25 October 2013 On Calculation of Own Funds (Capital), Mandatory Ratios and Open Currency Limits for Banking Groups.
As at 31 December 2013, the minimum level of ratio of capital to risk weighted assets (statutory capital ratio) was 10%. As at 31 December 2014, minimum levels of basic capital ratio (ratio N20.1), main capital ratio (ratio N20.2), own funds (capital) ratio (ratio N20.0) are 5.0%, 5.5% and 10.0%, accordingly. Starting from 1 January 2015, minimum level of ratio N20.2 is 6.0%.
The Group maintains capital adequacy at the level appropriate to the nature and volume of its operations.
The Group provides the territorial CBR that supervises the Bank with information on mandatory ratios in accordance with set form. The Planning and reporting department controls on a daily basis compliance with capital adequacy ratios.
In case values of capital adequacy ratios become close to limits set by the CBR and Group’s internal policy is that this information is communicated to the Management Board and the Board of Directors. The Group is in compliance with the statutory capital ratios as at 31 December 2014 and 2013.
60
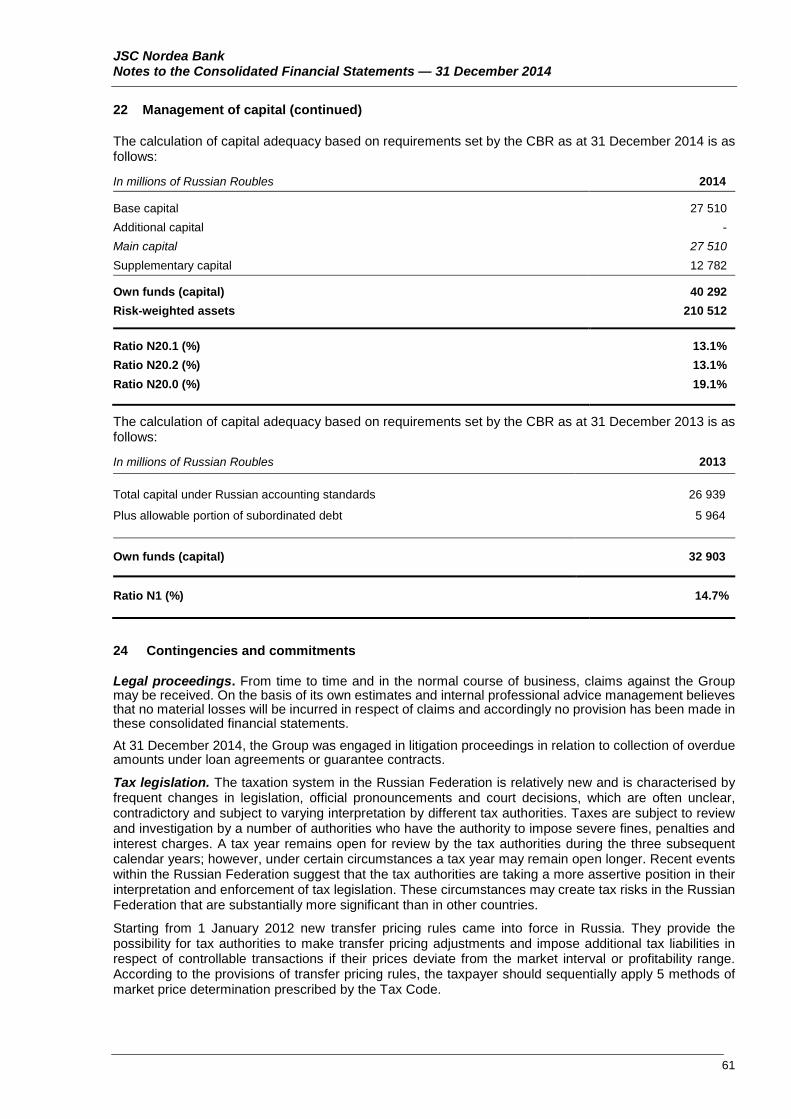
JSC Nordea Bank Notes to the Consolidated Financial Statements — 31 December 2014
22 Management of capital (continued)
The calculation of capital adequacy based on requirements set by the CBR as at 31 December 2014 is as follows:
In millions of Russian Roubles 2014
Base capital 27 510 Additional capital - Main capital 27 510 Supplementary capital 12 782
Own funds (capital) 40 292 Risk-weighted assets 210 512
Ratio N20.1 (%) 13.1% Ratio N20.2 (%) 13.1% Ratio N20.0 (%) 19.1%
The calculation of capital adequacy based on requirements set by the CBR as at 31 December 2013 is as follows:
In millions of Russian Roubles 2013
Total capital under Russian accounting standards 26 939
Plus allowable portion of subordinated debt 5 964
Own funds (capital) 32 903
Ratio N1 (%) 14.7%
24 Contingencies and commitments
Legal proceedings. From time to time and in the normal course of business, claims against the Group may be received. On the basis of its own estimates and internal professional advice management believes that no material losses will be incurred in respect of claims and accordingly no provision has been made in these consolidated financial statements. At 31 December 2014, the Group was engaged in litigation proceedings in relation to collection of overdue amounts under loan agreements or guarantee contracts.
Tax legislation. The taxation system in the Russian Federation is relatively new and is characterised by frequent changes in legislation, official pronouncements and court decisions, which are often unclear, contradictory and subject to varying interpretation by different tax authorities. Taxes are subject to review and investigation by a number of authorities who have the authority to impose severe fines, penalties and interest charges. A tax year remains open for review by the tax authorities during the three subsequent calendar years; however, under certain circumstances a tax year may remain open longer. Recent events within the Russian Federation suggest that the tax authorities are taking a more assertive position in their interpretation and enforcement of tax legislation. These circumstances may create tax risks in the Russian Federation that are substantially more significant than in other countries.
Starting from 1 January 2012 new transfer pricing rules came into force in Russia. They provide the possibility for tax authorities to make transfer pricing adjustments and impose additional tax liabilities in respect of controllable transactions if their prices deviate from the market interval or profitability range. According to the provisions of transfer pricing rules, the taxpayer should sequentially apply 5 methods of market price determination prescribed by the Tax Code.
61
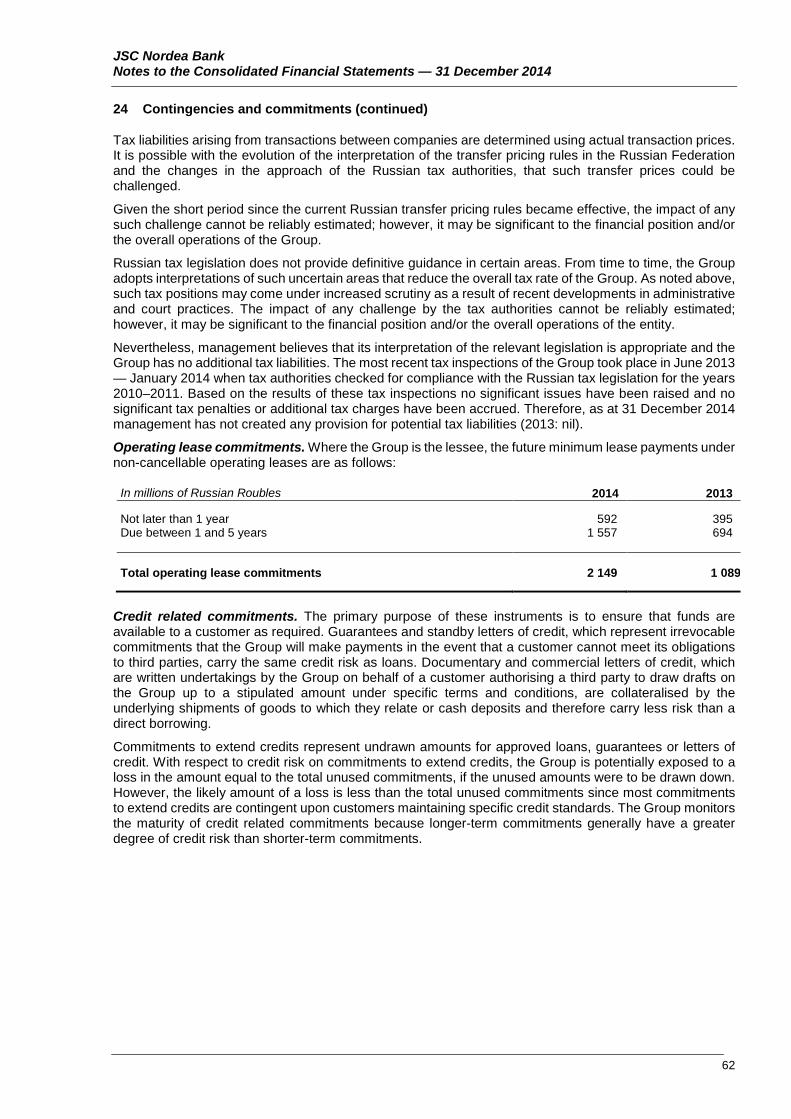
JSC Nordea Bank Notes to the Consolidated Financial Statements — 31 December 2014
24 Contingencies and commitments (continued)
Tax liabilities arising from transactions between companies are determined using actual transaction prices. It is possible with the evolution of the interpretation of the transfer pricing rules in the Russian Federation and the changes in the approach of the Russian tax authorities, that such transfer prices could be challenged.
Given the short period since the current Russian transfer pricing rules became effective, the impact of any such challenge cannot be reliably estimated; however, it may be significant to the financial position and/or the overall operations of the Group.
Russian tax legislation does not provide definitive guidance in certain areas. From time to time, the Group adopts interpretations of such uncertain areas that reduce the overall tax rate of the Group. As noted above, such tax positions may come under increased scrutiny as a result of recent developments in administrative and court practices. The impact of any challenge by the tax authorities cannot be reliably estimated; however, it may be significant to the financial position and/or the overall operations of the entity.
Nevertheless, management believes that its interpretation of the relevant legislation is appropriate and the Group has no additional tax liabilities. The most recent tax inspections of the Group took place in June 2013 — January 2014 when tax authorities checked for compliance with the Russian tax legislation for the years 2010–2011. Based on the results of these tax inspections no significant issues have been raised and no significant tax penalties or additional tax charges have been accrued. Therefore, as at 31 December 2014 management has not created any provision for potential tax liabilities (2013: nil).
Operating lease commitments. Where the Group is the lessee, the future minimum lease payments under non-cancellable operating leases are as follows:
In millions of Russian Roubles 2014 2013 Not later than 1 year 592 395 Due between 1 and 5 years 1 557 694
Total operating lease commitments 2 149 1 089
Credit related commitments. The primary purpose of these instruments is to ensure that funds are available to a customer as required. Guarantees and standby letters of credit, which represent irrevocable commitments that the Group will make payments in the event that a customer cannot meet its obligations to third parties, carry the same credit risk as loans. Documentary and commercial letters of credit, which are written undertakings by the Group on behalf of a customer authorising a third party to draw drafts on the Group up to a stipulated amount under specific terms and conditions, are collateralised by the underlying shipments of goods to which they relate or cash deposits and therefore carry less risk than a direct borrowing.
Commitments to extend credits represent undrawn amounts for approved loans, guarantees or letters of credit. With respect to credit risk on commitments to extend credits, the Group is potentially exposed to a loss in the amount equal to the total unused commitments, if the unused amounts were to be drawn down. However, the likely amount of a loss is less than the total unused commitments since most commitments to extend credits are contingent upon customers maintaining specific credit standards. The Group monitors the maturity of credit related commitments because longer-term commitments generally have a greater degree of credit risk than shorter-term commitments.
62
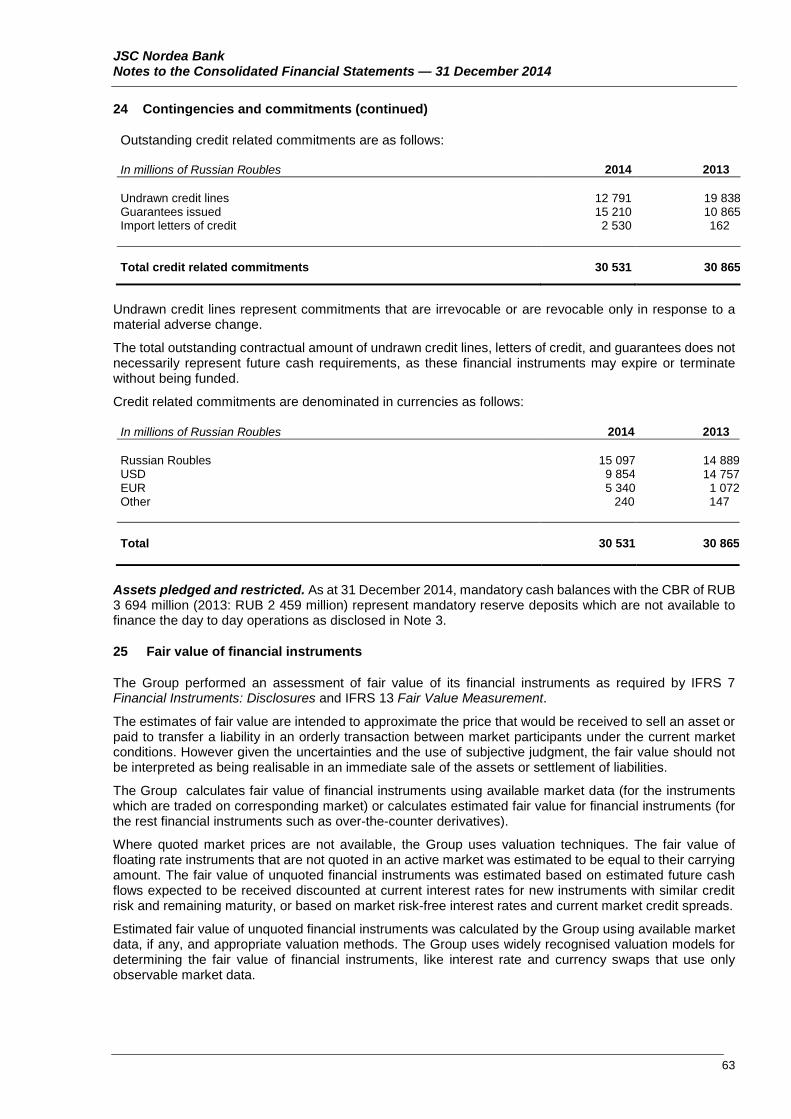
JSC Nordea Bank Notes to the Consolidated Financial Statements — 31 December 2014
24 Contingencies and commitments (continued)
Outstanding credit related commitments are as follows: In millions of Russian Roubles 2014 2013 Undrawn credit lines 12 791 19 838 Guarantees issued 15 210 10 865 Import letters of credit 2 530 162 Total credit related commitments 30 531 30 865
Undrawn credit lines represent commitments that are irrevocable or are revocable only in response to a material adverse change.
The total outstanding contractual amount of undrawn credit lines, letters of credit, and guarantees does not necessarily represent future cash requirements, as these financial instruments may expire or terminate without being funded.
Credit related commitments are denominated in currencies as follows:
In millions of Russian Roubles 2014 2013
Russian Roubles 15 097 14 889 USD 9 854 14 757 EUR 5 340 1 072 Other 240 147 Total 30 531 30 865
Assets pledged and restricted. As at 31 December 2014, mandatory cash balances with the CBR of RUB 3 694 million (2013: RUB 2 459 million) represent mandatory reserve deposits which are not available to finance the day to day operations as disclosed in Note 3.
25 Fair value of financial instruments
The Group performed an assessment of fair value of its financial instruments as required by IFRS 7 Financial Instruments: Disclosures and IFRS 13 Fair Value Measurement.
The estimates of fair value are intended to approximate the price that would be received to sell an asset or paid to transfer a liability in an orderly transaction between market participants under the current market conditions. However given the uncertainties and the use of subjective judgment, the fair value should not be interpreted as being realisable in an immediate sale of the assets or settlement of liabilities.
The Group calculates fair value of financial instruments using available market data (for the instruments which are traded on corresponding market) or calculates estimated fair value for financial instruments (for the rest financial instruments such as over-the-counter derivatives).
Where quoted market prices are not available, the Group uses valuation techniques. The fair value of floating rate instruments that are not quoted in an active market was estimated to be equal to their carrying amount. The fair value of unquoted financial instruments was estimated based on estimated future cash flows expected to be received discounted at current interest rates for new instruments with similar credit risk and remaining maturity, or based on market risk-free interest rates and current market credit spreads.
Estimated fair value of unquoted financial instruments was calculated by the Group using available market data, if any, and appropriate valuation methods. The Group uses widely recognised valuation models for determining the fair value of financial instruments, like interest rate and currency swaps that use only observable market data.
63
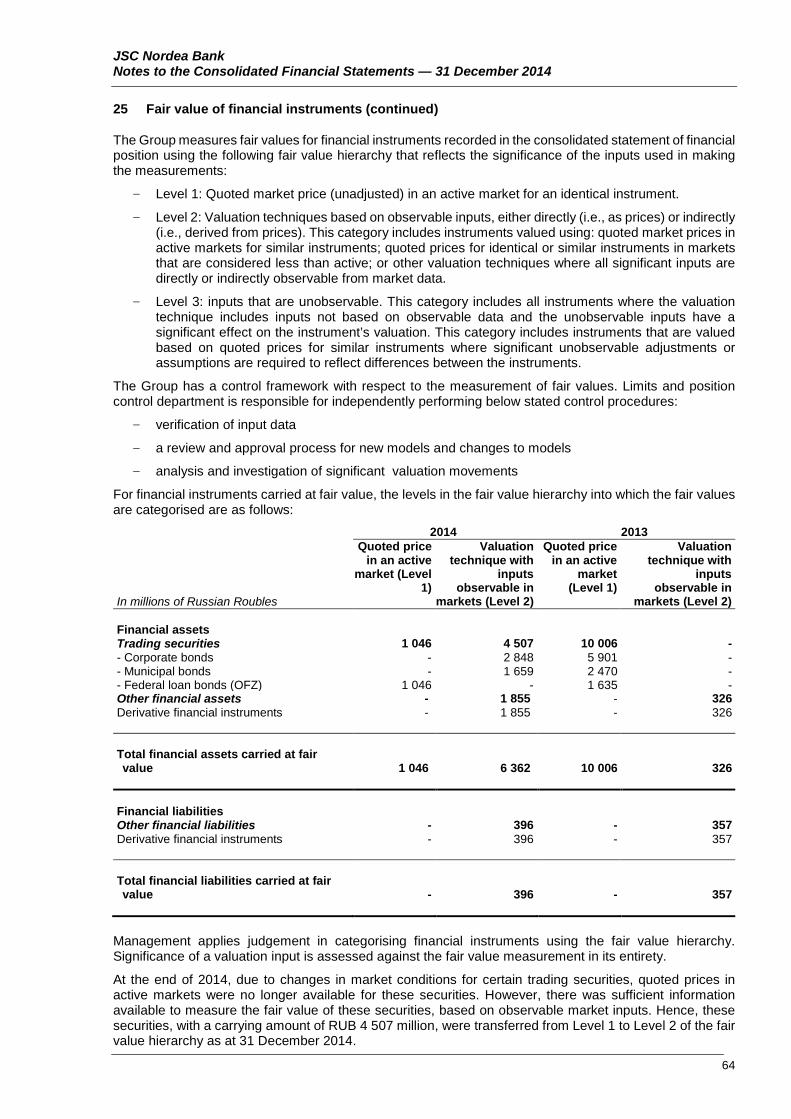
JSC Nordea Bank Notes to the Consolidated Financial Statements — 31 December 2014
25 Fair value of financial instruments (continued)
The Group measures fair values for financial instruments recorded in the consolidated statement of financial position using the following fair value hierarchy that reflects the significance of the inputs used in making the measurements:
- Level 1: Quoted market price (unadjusted) in an active market for an identical instrument.
- Level 2: Valuation techniques based on observable inputs, either directly (i.e., as prices) or indirectly (i.e., derived from prices). This category includes instruments valued using: quoted market prices in active markets for similar instruments; quoted prices for identical or similar instruments in markets that are considered less than active; or other valuation techniques where all significant inputs are directly or indirectly observable from market data.
- Level 3: inputs that are unobservable. This category includes all instruments where the valuation technique includes inputs not based on observable data and the unobservable inputs have a significant effect on the instrument’s valuation. This category includes instruments that are valued based on quoted prices for similar instruments where significant unobservable adjustments or assumptions are required to reflect differences between the instruments.
The Group has a control framework with respect to the measurement of fair values. Limits and position control department is responsible for independently performing below stated control procedures:
- verification of input data
- a review and approval process for new models and changes to models
- analysis and investigation of significant valuation movements
For financial instruments carried at fair value, the levels in the fair value hierarchy into which the fair values are categorised are as follows: 2014 2013
In millions of Russian Roubles
Quoted price in an active
market (Level 1)
Valuation technique with
inputs observable in
markets (Level 2)
Quoted price in an active
market (Level 1)
Valuation technique with
inputs observable in
markets (Level 2) Financial assets Trading securities 1 046 4 507 10 006 - - Corporate bonds - 2 848 5 901 - - Municipal bonds - 1 659 2 470 - - Federal loan bonds (OFZ) 1 046 - 1 635 - Other financial assets - 1 855 - 326 Derivative financial instruments - 1 855 - 326 Total financial assets carried at fair value 1 046 6 362 10 006 326
Financial liabilities Other financial liabilities - 396 - 357 Derivative financial instruments - 396 - 357 Total financial liabilities carried at fair value - 396 - 357
Management applies judgement in categorising financial instruments using the fair value hierarchy. Significance of a valuation input is assessed against the fair value measurement in its entirety.
At the end of 2014, due to changes in market conditions for certain trading securities, quoted prices in active markets were no longer available for these securities. However, there was sufficient information available to measure the fair value of these securities, based on observable market inputs. Hence, these securities, with a carrying amount of RUB 4 507 million, were transferred from Level 1 to Level 2 of the fair value hierarchy as at 31 December 2014. 64
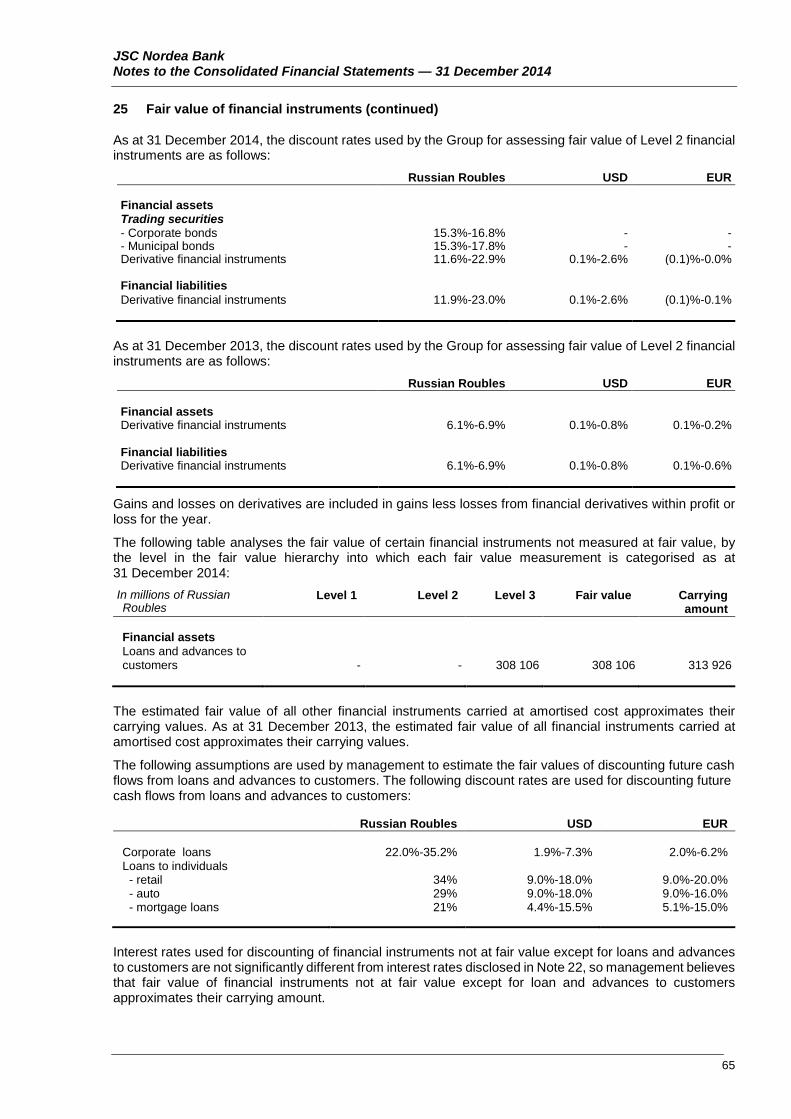
JSC Nordea Bank Notes to the Consolidated Financial Statements — 31 December 2014
25 Fair value of financial instruments (continued)
As at 31 December 2014, the discount rates used by the Group for assessing fair value of Level 2 financial instruments are as follows:
Russian Roubles USD EUR Financial assets Trading securities - Corporate bonds 15.3%-16.8% - - - Municipal bonds 15.3%-17.8% - - Derivative financial instruments 11.6%-22.9% 0.1%-2.6% (0.1)%-0.0% Financial liabilities Derivative financial instruments 11.9%-23.0% 0.1%-2.6% (0.1)%-0.1%
As at 31 December 2013, the discount rates used by the Group for assessing fair value of Level 2 financial instruments are as follows:
Russian Roubles USD EUR Financial assets Derivative financial instruments 6.1%-6.9% 0.1%-0.8% 0.1%-0.2% Financial liabilities Derivative financial instruments 6.1%-6.9% 0.1%-0.8% 0.1%-0.6%
Gains and losses on derivatives are included in gains less losses from financial derivatives within profit or loss for the year.
The following table analyses the fair value of certain financial instruments not measured at fair value, by the level in the fair value hierarchy into which each fair value measurement is categorised as at 31 December 2014: In millions of Russian Roubles
Level 1 Level 2 Level 3 Fair value Carrying amount
Financial assets Loans and advances to customers - - 308 106 308 106
313 926
The estimated fair value of all other financial instruments carried at amortised cost approximates their carrying values. As at 31 December 2013, the estimated fair value of all financial instruments carried at amortised cost approximates their carrying values.
The following assumptions are used by management to estimate the fair values of discounting future cash flows from loans and advances to customers. The following discount rates are used for discounting future cash flows from loans and advances to customers: Russian Roubles USD EUR Corporate loans 22.0%-35.2% 1.9%-7.3% 2.0%-6.2% Loans to individuals - retail 34% 9.0%-18.0% 9.0%-20.0% - auto 29% 9.0%-18.0% 9.0%-16.0% - mortgage loans 21% 4.4%-15.5% 5.1%-15.0%
Interest rates used for discounting of financial instruments not at fair value except for loans and advances to customers are not significantly different from interest rates disclosed in Note 22, so management believes that fair value of financial instruments not at fair value except for loan and advances to customers approximates their carrying amount.
65
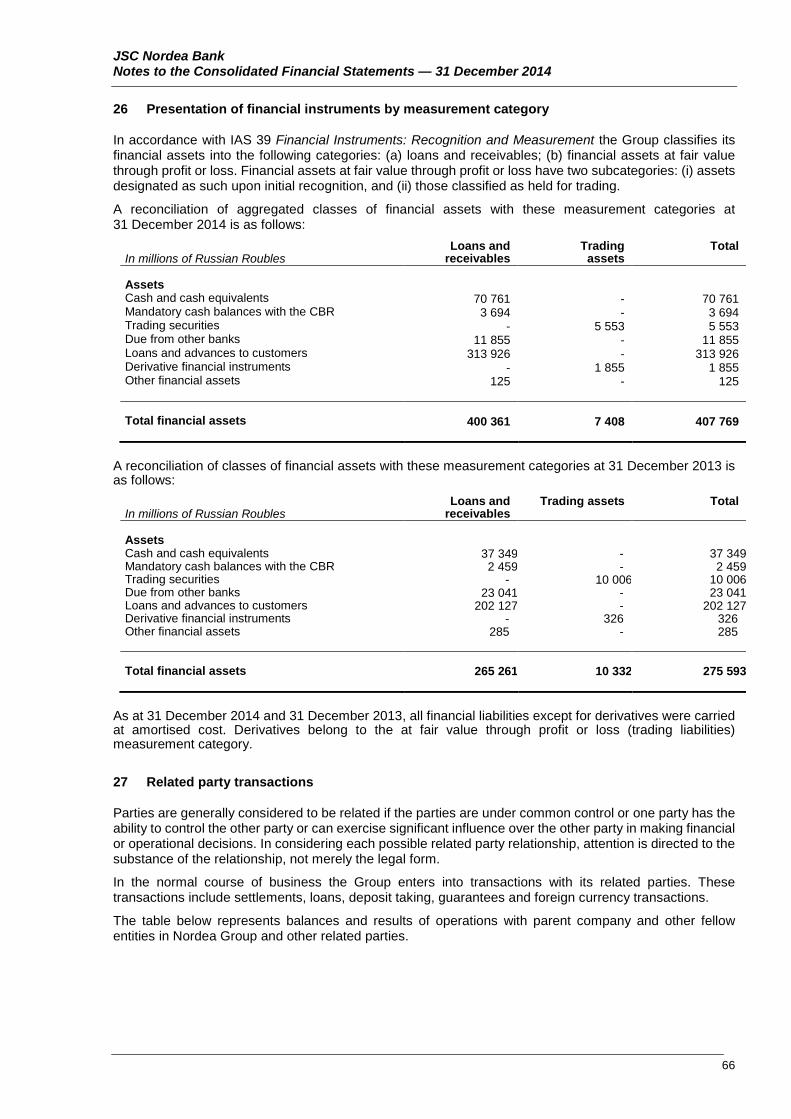
JSC Nordea Bank Notes to the Consolidated Financial Statements — 31 December 2014
26 Presentation of financial instruments by measurement category
In accordance with IAS 39 Financial Instruments: Recognition and Measurement the Group classifies its financial assets into the following categories: (a) loans and receivables; (b) financial assets at fair value through profit or loss. Financial assets at fair value through profit or loss have two subcategories: (i) assets designated as such upon initial recognition, and (ii) those classified as held for trading.
A reconciliation of aggregated classes of financial assets with these measurement categories at 31 December 2014 is as follows:
In millions of Russian Roubles Loans and
receivables Trading
assets Total
Assets Cash and cash equivalents 70 761 - 70 761 Mandatory cash balances with the CBR 3 694 - 3 694 Trading securities - 5 553 5 553 Due from other banks 11 855 - 11 855 Loans and advances to customers 313 926 - 313 926 Derivative financial instruments - 1 855 1 855 Other financial assets 125 - 125 Total financial assets 400 361 7 408 407 769
A reconciliation of classes of financial assets with these measurement categories at 31 December 2013 is as follows:
In millions of Russian Roubles Loans and
receivables Trading assets Total
Assets Cash and cash equivalents 37 349 - 37 349 Mandatory cash balances with the CBR 2 459 - 2 459 Trading securities - 10 006 10 006 Due from other banks 23 041 - 23 041 Loans and advances to customers 202 127 - 202 127 Derivative financial instruments - 326 326 Other financial assets 285 - 285 Total financial assets 265 261 10 332 275 593
As at 31 December 2014 and 31 December 2013, all financial liabilities except for derivatives were carried at amortised cost. Derivatives belong to the at fair value through profit or loss (trading liabilities) measurement category.
27 Related party transactions
Parties are generally considered to be related if the parties are under common control or one party has the ability to control the other party or can exercise significant influence over the other party in making financial or operational decisions. In considering each possible related party relationship, attention is directed to the substance of the relationship, not merely the legal form.
In the normal course of business the Group enters into transactions with its related parties. These transactions include settlements, loans, deposit taking, guarantees and foreign currency transactions.
The table below represents balances and results of operations with parent company and other fellow entities in Nordea Group and other related parties.
66

JSC Nordea Bank Notes to the Consolidated Financial Statements — 31 December 2014
27 Related party transactions (continued)
The outstanding balances with related parties at 31 December 2014 and 2013 are as follows:
2014 2013
In millions of Russian Roubles
Parent company and other fellow
entities in Nordea Group
Other Parent company and other fellow
entities in Nordea Group
Other
Cash and cash equivalents 28 974 - 29 826 - Due from other banks (contractual interest rate: 2014: 0.1%–20.2%; 2013: 6.3%–6.9%) 11 855 - 22 714 - Gross amount of loans and advances to customers (contractual interest rate: 2014: 0.0%; 2013: 2.0%–15.0%) - - - 6 Derivative financial instruments assets 1 675 - 125 - Due to other banks 310 515 - 148 411 - – current accounts 52 - 344 - – term deposits outstanding (contractual interest rate: 2014: 0.6%–16.0%; 2013: 0.8%–6.7%) 310 463 - 148 067 - Customer accounts 13 119 14 1 185 – current accounts (contractual interest rate: 2014: 0.1%–12.8%; 2013: 0.1%–1.0%) - 41 1 8 – term deposits (contractual interest rate: 2014: 1.0%–12.6%; 2013: 1.0%–8.1%) 13 78 13 1 177 Derivative financial instruments liabilities 231 - 316 - Other financial liabilities 260 - 207 - Subordinated debt (contractual interest rate: 2014: 3.7%–4.2%; 2013: 2.0%–4.2%) 12 076 - 7 378 - Guarantees issued by the Group at the year end 161 - 99 - Guarantees received by the Group at the year-end (contractual interest rate: 2014: 0.1%–2.3%; 2013: 0.1%–6.2%) 253 299 - 111 316 7 Other contingent liabilities 2 500 - 2 500 -
The income and expense items with related parties at 31 December 2014 and 2013 are as follows:
2014 2013
In millions of Russian Roubles
Parent company and
other fellow entities in
Nordea Group
Other Parent company and
other fellow entities in
Nordea Group
Other
Interest income 527 - 1 166 1 Interest expense (3 070) (22) (1 889) (48) – due to other banks (2 729) - (1 624) - – subordinated debt (340) - (264) - – customer accounts (1) (22) (1) (48) Fee and commission expense (847) - (864) 1 Losses less of gains arising from non-derivative
financial instruments (54) - - - Gains less losses from financial derivatives 1 500 - 31 - Losses less gains from trading in foreign currencies - (1) - - Administrative and other operating expenses - (384) - (330)
67