jswsteel most 291014
TRANSCRIPT
8/10/2019 Jswsteel Most 291014
http://slidepdf.com/reader/full/jswsteel-most-291014 1/8
21 October 2014
2QFY15 Results Update | Sector: Metals
JSW Steel
Sanjay Jain ([email protected]); +91 22 3982 5412
Dhruv Muchhal ([email protected]); +91 22 3027 8033
BSE SENSEX S&P CNXCMP: INR1,176 TP: INR1,678 Buy
26,576 7,928
Bloomberg JSTL IN
Equity Shares (m) 241.7M.Cap. (INR b) / (USD b) 284.2/4.6
2-Week Range (INR) 1,365/805
1, 6, 12 Rel. Per (%) -7/-11/13
Financials & Valuation (INR Billion)
Y/E MAR 2015E 2016E 2017E
Net Sales 563.4 592.9 634.5
EBITDA 112.6 113.1 123.2
dj PAT 32.4 33.2 38.9
EPS (INR) 133.6 136.2 159.6
Gr. (%) 288.4 2.0 17.2
RoE (%) 13.9 12.6 13.1
RoCE (%) 11.8 11.2 11.8
P/E (x) 8.8 8.6 7.4
P/BV (x) 1.1 1.0 0.9
EV/EBITDA 6.2 6.1 5.4
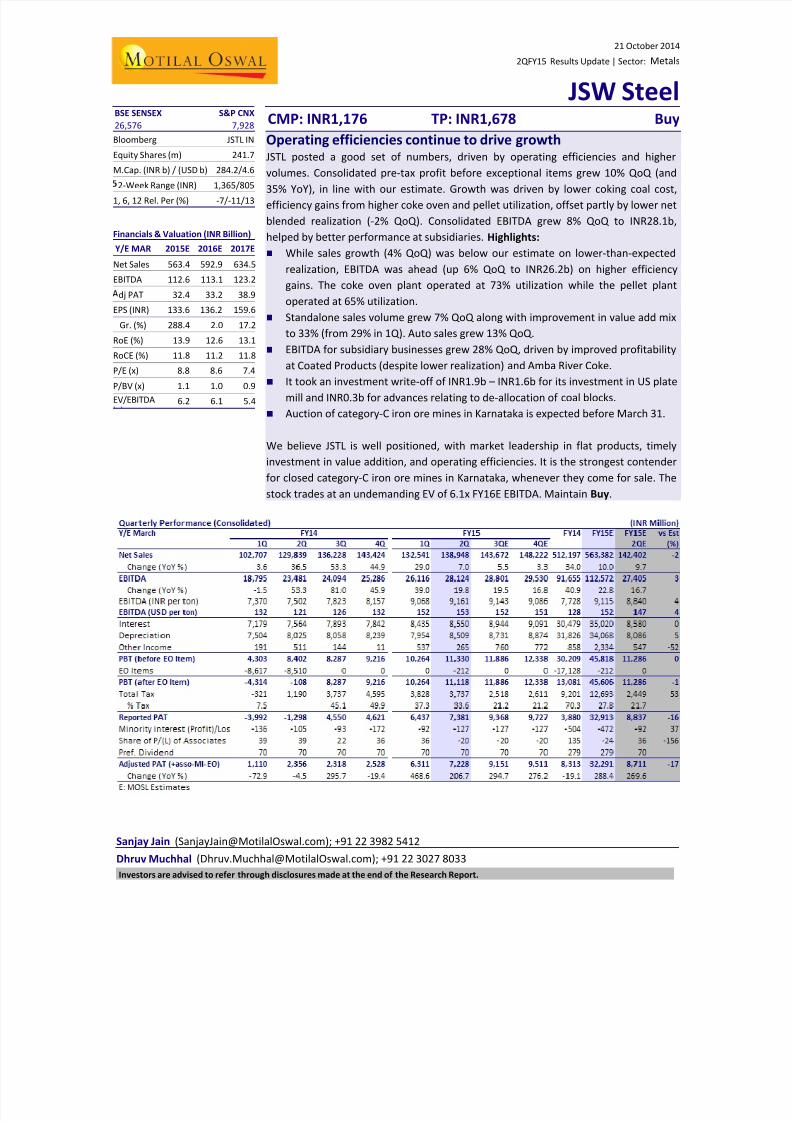
Operating efficiencies continue to drive growth
JSTL posted a good set of numbers, driven by operating efficiencies and highervolumes. Consolidated pre-tax profit before exceptional items grew 10% QoQ (and
35% YoY), in line with our estimate. Growth was driven by lower coking coal cost,
efficiency gains from higher coke oven and pellet utilization, offset partly by lower net
blended realization (-2% QoQ). Consolidated EBITDA grew 8% QoQ to INR28.1b,
helped by better performance at subsidiaries. Highlights:
While sales growth (4% QoQ) was below our estimate on lower-than-expected
realization, EBITDA was ahead (up 6% QoQ to INR26.2b) on higher efficiency
gains. The coke oven plant operated at 73% utilization while the pellet plant
operated at 65% utilization.
Standalone sales volume grew 7% QoQ along with improvement in value add mixto 33% (from 29% in 1Q). Auto sales grew 13% QoQ.
EBITDA for subsidiary businesses grew 28% QoQ, driven by improved profitability
at Coated Products (despite lower realization) and Amba River Coke.
It took an investment write-off of INR1.9b – INR1.6b for its investment in US plate
mill and INR0.3b for advances relating to de-allocation of coal blocks.
Auction of category-C iron ore mines in Karnataka is expected before March 31.
We believe JSTL is well positioned, with market leadership in flat products, timely
investment in value addition, and operating efficiencies. It is the strongest contender
for closed category-C iron ore mines in Karnataka, whenever they come for sale. Thestock trades at an undemanding EV of 6.1x FY16E EBITDA. Maintain Buy.
Investors are advised to refer through disclosures made at the end of the Research Report.

8/10/2019 Jswsteel Most 291014
http://slidepdf.com/reader/full/jswsteel-most-291014 2/8
21 October 2014 2
JSW Steel
Consolidated adjusted PAT grew 15% QoQ to INR 7.1b driven by increase in
sales volumes (+7% QoQ) and operating efficiencies. EBITDA grew 8% QoQ to
INR28.8b, despite decline in standalone net realization, on coking coal cost
savings and operating efficiencies from higher coke oven and pellet plant
utilization. Subsidiary businesses continued to perform well with EBITDA
increasing 28% QoQ to INR1.9 b. The company took an investment write-off of
INR 1.9b – INR 1.6b for its investment in US plate mill and INR 0.3b for advances
relating to coal blocks de-allocation.
Net sales grew 5% QoQ to INR 138.9b with higher volumes partly offset by lower
realization (-2% QoQ)
Standalone: EBITDA/t broadly flat despite lower realization
Standalone adjusted PAT grew 11% QoQ (and 33% YoY) to INR 8.8b driven by
increase in volumes (+7% QoQ) and higher other income (+22% QoQ). Blended
EBITDA/t was broadly flat QoQ at USD142, despite the 2% decline in blended
realization, benefiting from operating efficiencies.
Standalone sales volumes grew 7% QoQ (lower 2% YoY) to 3.07mt. Value added
product mix improved further in the quarter to 33% from 29% in 1QFY15,
reaching the management target well ahead of time. Auto sales rose 13% QoQ,
as the company continued to gain market share. Auto sales now represent 15%
of its total India steel sales volume as against 14% in 1Q and 10% in 2QFY14.
Retail sales were also 10% higher QoQ.
Operating cost efficiency was driven by higher coke oven utilization (73%) and
pellet utilization (65%). Coking coal cost was USD15/t lower QoQ, and guided to
be largely unchanged at USD135-140/t for 3Q.
Significant increase in inventory was due to logistics issues at Salem and Dolvi
which is guided to stabilize in H2.
Management mentioned that some of the ‘C’ category mines in Karnataka could
be auctioned before March 2015. It would participate in the auction.
Exhibit 1: Standalone: Realization (INR/T) was stable
Source: MOSL, Company
Exhibit 2: EBITDA per ton continues to improve
Source: MOSL, Company
4 2 , 9
3 7
4 1 , 2
2 1
3 8 , 3
4 2
3 8 , 6
8 4
3 6 , 6
9 9
3 6 , 6
9 5
3 8 , 8
4 6
4 0 , 2
8 8
4 0 , 0
9 1
3 9 , 2
6 2
1 Q F Y 1 3
2 Q F Y 1 3
3 Q F Y 1 3
4 Q F Y 1 3
1 Q F Y 1 4
2 Q F Y 1 4
3 Q F Y 1 4
4 Q F Y 1 4
1 Q F Y 1 5
2 Q F Y 1 5
2 , 5
6 9
2 , 5
2 6
2 , 6
1 0
2 , 8
2 8
2 , 5
5 0
3 , 1
3 0
3 , 0
8 0
3 , 1
0 0
2 , 8
8 0
3 , 0
7 0
8,230
6,457 5,527 6,674 6,859 7,137 7,478 8,052 8,545 8,534
1 Q F Y 1 3
2 Q F Y 1 3
3 Q F Y 1 3
4 Q F Y 1 3
1 Q F Y 1 4
2 Q F Y 1 4
3 Q F Y 1 4
4 Q F Y 1 4
1 Q F Y 1 5
2 Q F Y 1 5
Volumes (Kt) EBITDA (INR/T)

8/10/2019 Jswsteel Most 291014
http://slidepdf.com/reader/full/jswsteel-most-291014 3/8
21 October 2014 3
JSW Steel
Subsidiaries: coated and plate mill drive performance
Subsidiary businesses EBITDA grew 28% QoQ to INR 1.9b as they maintained
their good performance in the quarter. The increase was driven by improved
profitability in coated and Ambariver coke division, partly offset by lower
profitability in Chile iron ore business.
Coated business EBITDA/t grew to INR 2,634 despite the lower realization which
we estimate was driven by better mix. Coated division sales volume was at
410kt while realization came at INR 58,634/t.
Chile business was under pressure from decline in iron ore prices. Realization
declined to USD83/t from USD99/t in 1Q.
Subsidiaries (INR Million)
Y/E March FY14 FY15 FY14 FY15E FY15E vs Est
1Q 2Q 3Q 4Q 1Q 2Q 3QE 4QE 2QE (%)
Net Sales 9,125 14,982 16,583 18,530 17,077 18,413 18,932 19,522 59,220 73,944 19,642 -6
EBITDA 1,303 1,141 1,062 323 1,506 1,925 2,066 2,049 3,829 7,546 1,544 25
JSW coated 790 780 790 940 950 1,080 911 920 3,300 3,861 987 9
US Mills 34 -127 -107 -248 240 152
Chile iron ore 48 332 324 82 -21 -106
Ambariver coke 125 410
US coal & adj. -20 -21 55 -450 212 388
PAT -2,476 -4,266 -4,125 -5,435 -1,633 -1,613 -1,958 -1,974 -16,303 -7,691 -1,388 16
Exhibit 3: Subsidiaries: EBITDA (INR m)
Source: MOSL, Company
Exhibit 4: JSW Coated: margins improving with product mix
Source: MOSL, Company
Earnings outlook remains robust; Maintain BUY
JSW Steel is now driving benefit of investments in Dolvi coke oven & pellet plant
and Vijaynagar 2.3mtpa CRM-2. Dolvi coke oven and pellet plants are now fully
commissioned. Further benefit will accrue in subsequent quarters with 100%
substitution of 3rd
party purchase of coke and pellets.
1st
phase of 2.3mtpa CRM-2 has been commissioned (PLTCM in Oct 2013, CGL in
March 2014 and CAL-1 in April 2014). 2nd
phase i.e. CAL-2 is expected to be
commissioned by 1QFY165.
Margins are likely to improve driven by full benefit of captive coke and pellets,
higher share of VASPs. Demand is expected to be stronger in 2HFY15.
Although there are challenges in sourcing iron ore post closure of iron ore mines
in Odisha and no further improvement in Karnataka’s iron ore production, JSW
steel is now bridging the gap at Vijaynagar through imports. The cost of
imported ore is higher, but lower impurities (e.g. alumina) in imports help in
780 790 940 950 1,080
361 272
-617
556845
2QFY14 3QFY14 4QFY14 1QFY15 2QFY15
JSW Coated Others
390 420 440 400 410
2,000 1,881
2,1362,375
2,634
2QFY14 3QFY14 4QFY14 1QFY15 2QFY15
Volumes (Kt) EBITDA (INR/T)
Demand acceleration will
drive margins

8/10/2019 Jswsteel Most 291014
http://slidepdf.com/reader/full/jswsteel-most-291014 4/8
21 October 2014 4
JSW Steel
reduced consumption of coke and energy thereby offsetting certain amount of
higher cost of ore.
Capex spend in 1H was at INR 31b while for full year was maintained at INR 75b.
Net debt (excluding acceptances) has increased by INR17.4b. Adjusting for
acceptances, net has increased by INR24.9b.
Consolidated EBITDA is upgraded by 1% for FY15-FY17 as we incorporate 2Q
numbers.
EPS is cut by 4%-1% for FY15-17 on higher depreciation charge.
The target price is marginally increased to INR1,678/share based on FY16
estimates. Stock is trading at FY16E EV/EBITDA of 6.1x. Maintain Buy.
JSW STEEL: Target price calculations
Year 2013 2014 2015E 2016E 2017E
A. S/A volumes 8.9 11.9 12.4 12.9 13.9
B. EBITDA per ton 7,105 7,405 8,504 8,119 8,228
C. S/A EBITDA (AxB) 63,088 87,826 105,026 104,335 113,958
D. Sub. EBITDA 1,951 3,829 7,546 8,746 9,235
E. Cons. EBITDA (C+D) 65,039 91,655 112,572 113,082 123,193
F. Target EV/EBITDA (x) 6.5 6.5 6.5
G. Target EV (FxG) 731,717 735,031 800,756
less: Net Debt (Rs m) 292,123 424,082 418,900 400,502 380,450
add: CWIP 65,972 90,972 85,972 70,972 60,972
Equity value 398,789 405,500 481,278
No. of shares 242 242 242
Target price 1,650 1,678 1,991

8/10/2019 Jswsteel Most 291014
http://slidepdf.com/reader/full/jswsteel-most-291014 5/8
21 October 2014 5
JSW Steel
JSW Steel: an investment profile Company descriptionJSW Steel (JSTL) demonstrated excellent project
execution skills over the past decade, growing its annual
capacity 6x to 10m tons through brownfield expansions
at Vijaynagar. With the acquisition of Ispat Industries
and Salem Steel, it controls annual capacity of 14.3m
tons. Its main production facilities are located in
proximity to rich iron ore reserves in Karnataka. It has
investments in iron ore and coal mining in Americas. Its
other overseas investments include plate and pipe mill
operations and coal mines in the US.
Key investment arguments
JSTL has the lowest conversion cost due to
operational efficiencies. Its strategic location near
the iron ore rich Bellary-Hospet belt helps it to keepiron ore purchase costs low.
JSTL is investing in low cost projects to increase
capacity to 18mtpa.
Investment in 2.3mtpa PLTCM will help in
substituting imports in auto segment and enhance
margin.
Key investment risks
High dependence on external sources for raw
material can put significant pressure on marginsand earnings growth.
Recent developments
Promoters have purchased 5.5m shares through
open market operation since 1st
April 2014.
Valuation and view
We believe JSW Steel is well positioned with market
leadership in flat products, timely investment in
value addition & operating efficiencies.
JSW Steel is the strongest contender for closed “C”
category iron ore mines in Karnataka whenever they
come for sale.
Stock trades at undemanding EV/EBTIDA of 6.1x in
view of strong growth ahead. Maintain Buy.
Sector outlook We believe that Indian steel demand growth has hit
bottom in FY14. We expect Indian steel demand
growth to accelerate to 4% in FY15 and 6% in FY16.
The conversion spreads for steel mills are expanding
on global demand (ex-China) growth and oversupply
of iron ore and coking coal.
Comparative valuations
JSW Steel Tata Steel SAIL
P/E (x) FY15E 8.8 12.0 9.1
FY16E 8.6 8.3 8.7
P/BV (x) FY15E 1.1 1.4 0.7
FY16E 1.0 1.2 0.7
EV/Sales (x) FY15E 1.2 0.8 1.2
FY16E 1.2 0.8 1.1
EV/EBITDA (x) FY15E 6.2 6.6 7.6
FY16E 6.1 6.1 6.7
EPS: MOSL forecast v/s consensus (INR)
MOSL Consensus Variation
Forecast Forecast (%)
FY15 133.6 108.1 23.6
FY16 136.2 126.0 8.1
Target price and recommendation
Current Target Upside Reco.
Price (INR) Price (INR) (%)
1,176 1,678 42.7 Buy
Shareholding pattern (%)
Sep-14 Jun-14 Sep-13
Promoter 39.3 38.5 36.3
DII 3.7 3.2 6.3
FII 20.4 21.4 17.2
Others 36.6 36.9 40.3
Note: FII Includes depository receipts
Stock performance (1-year)

8/10/2019 Jswsteel Most 291014
http://slidepdf.com/reader/full/jswsteel-most-291014 6/8
21 October 2014 6
JSW Steel
Financials and valuation
Income statement (INR Billion)
Y/E Mar 2014 2015E 2016E 2017E
Net Sales 512.2 563.4 592.9 634.5
Change (%) 34.0 10.0 5.2 7.0
EBITDA 91.7 112.6 113.1 123.2
EBITDA Margin (%) 17.9 20.0 19.1 19.4
Depreciation 31.8 34.1 36.2 38.2
EBIT 59.8 78.5 76.9 85.0
Interest 30.5 35.0 37.1 38.4
Other Income 0.9 2.3 3.2 3.4
Extraordinary items -17.1 -0.2 0.0 0.0
PBT 13.1 45.6 42.9 50.0
Tax 9.2 12.7 9.2 10.6
Tax Rate (%) 70.3 27.8 21.3 21.2
Reported PAT 3.9 32.9 33.8 39.4
Adjusted PAT 21.0 33.1 33.8 39.4
Change (%) 37.9 57.7 2.0 16.7
Min. Int. & Assoc. Share -0.4 -0.5 -0.6 -0.6Adj Cons PAT 8.3 32.3 32.9 38.6
Balance sheet (INR Billion)
Y/E Mar 2014 2015E 2016E 2017E
Share Capital 2.4 2.4 2.4 2.4
Reserves 217.0 244.9 274.4 309.6
Net Worth 219.4 247.3 276.8 312.0
Debt 431.4 432.5 432.5 432.5
Deferred Tax 21.2 24.8 25.4 26.0
Total Capital Employed 673.7 705.7 735.3 770.6
Gross Fixed Assets 691.2 781.2 841.2 901.2
Less: Acc Depreciation 217.7 251.8 288.0 326.2Net Fixed Assets 473.5 529.4 553.2 575.0
Capital WIP 91.0 86.0 71.0 61.0
Investments 5.9 5.9 5.9 5.9
Current Assets 206.0 223.5 248.0 276.6
Inventory 81.6 92.6 97.5 104.3
Debtors 22.9 23.2 24.4 26.1
Cash & Bank 7.3 13.6 32.0 52.0
Loans & Adv, Others 94.2 94.2 94.2 94.2
Curr Liabs & Provns 102.7 139.1 142.8 147.9
Curr. Liabilities 33.1 69.5 73.1 78.2
Provisions 69.7 69.7 69.7 69.7
Net Current Assets 103.3 84.4 105.2 128.7
Total Assets 673.7 705.7 735.3 770.6
E: MOSL Estimates
Ratios
Y/E Mar 2014 2015E 2016E 2017E
Basic (INR)
EPS 34.4 133.6 136.2 159.6
Cash EPS 164.9 273.4 284.9 316.5
Book Value 907.5 1,022.9 1,145.1 1,290.6
DPS 11.0 11.0 11.0 12.0
Payout (incl. Div. Tax.) 37.4 10.5 10.3 8.8
Valuation(x)
P/E 34.2 8.8 8.6 7.4
Cash P/E 7.1 4.3 4.1 3.7
Price / Book Value 1.3 1.1 1.0 0.9
EV/Sales 1.4 1.2 1.2 1.0
EV/EBITDA 7.7 6.2 6.1 5.4
Dividend Yield (%) 0.9 0.9 0.9 1.0
Profitability Ratios (%)
RoE 10.4 13.9 12.6 13.1
RoCE 10.3 11.8 11.2 11.8Turnover Ratios (%)
Asset Turnover (x) 0.9 0.8 0.8 0.8
Debtors (No. of Days) 16.3 15.0 15.0 15.0
Inventory (No. of Days) 58.1 60.0 60.0 60.0
Creditors (No. of Days) 28.7 56.2 55.6 55.8
Leverage Ratios (%)
Net Debt/Equity (x) 2.0 1.7 1.6 1.4
Cash flow statement (INR Billion)
Y/E Mar 2014 2015E 2016E 2017E
OP/(Loss) before Tax 29.4 43.5 39.7 46.6
Depreciation 31.8 34.1 36.2 38.2Others -0.9 -2.3 -3.2 -3.4
Interest 30.5 35.0 37.1 38.4
Direct Taxes Paid -2.6 -9.1 -8.6 -10.0
(Inc)/Dec in Wkg Cap -46.6 25.1 -2.4 -3.4
CF from Op. Activity 41.6 124.3 98.0 105.5
(Inc)/Dec in FA & CWIP -56.9 -85.0 -45.0 -50.0
(Pur)/Sale of Invt 0.0 0.0 0.0 0.0
Others 0.9 2.3 3.2 3.4
CF from Inv. Activity -56.0 -82.7 -41.8 -46.6
Inc/(Dec) in Net Worth 0.0 0.0 0.0 0.0
Inc / (Dec) in Debt 36.5 1.1 0.0 0.0
Interest Paid -30.5 -35.0 -37.1 -38.4
Divd Paid (incl Tax) -3.1 -3.4 -3.4 -3.4CF from Fin. Activity 3.8 -35.0 -37.3 -38.3
Inc/(Dec) in Cash -10.7 6.6 18.9 20.6
Add: Opening Balance 18.0 7.3 13.6 32.0
Closing Balance 7.3 13.9 32.5 52.5
8/10/2019 Jswsteel Most 291014
http://slidepdf.com/reader/full/jswsteel-most-291014 7/8
21 October 2014 7
JSW Steel
N O T E S
8/10/2019 Jswsteel Most 291014
http://slidepdf.com/reader/full/jswsteel-most-291014 8/8
21 October 2014 8
JSW Steel
Disclosures
This research report has been prepared by MOSt to provide information about the company(ies) and sector(s), if any, covered in the report and may be distributed by it and/or its affiliated company(ies). This
report is for personal information of the select recipient and does not construe to be any investment, legal or taxation advice to you. This research report does not constitute an offer, invitation or inducement to
invest in securities or other investments and Motilal Oswal Securities Limited (hereinafter referred as MOSt) is not soliciting any action based upon it. This report is not for public distribution and has been
furnished to you solely for your general information and should not be reproduced or redistributed to any other person in any form. This report does not constitute a personal recommendation or take into
account the particular investment objectives, financial situations, or needs of individual clients. Before acting on any advice or recommendation in this material, investors should consider whether it is suitable
for their particular circumstances and, if necessary, seek professional advice. The price and value of the investments referred to in this material and the income from them may go down as well as up, and
investors may realize losses on any investments. Past performance is not a guide for future performance, future returns are not guaranteed and a loss of original capital may occur.
MOSt and its affiliates are a full-service, integrated investment banking, investment management, brokerage and financing group. We and our affiliates have investment banking and other business
relationships with a significant percentage of the companies covered by our Research Department Our research professionals provide important input into our investment banking and other business selection
processes. Investors should assume that MOSt and/or its affiliates are seeking or will seek investment banking or other business from the company or companies that are the subject of this material and that
the research professionals who were involved in preparing this material may participate in the solicitation of such business. The research professionals responsible for the preparation of this document may
interact with trading desk personnel, sales personnel and other parties for the purpose of gathering, applying and interpreting market information. Our research professionals are paid in part based on the
profitability of MOSt which include earnings from investment banking and other business. MOSt generally prohibits its analysts, persons reporting to analysts, and members of their households from
maintaining a financial interest in the securities or derivatives of any companies that the analysts cover. Additionally, MOSt generally prohibits its analysts and persons reporting to analysts from serving as an
officer, director, or advisory board member of any companies that the analysts cover. Our salespeople, traders, and other professionals or affiliates may provide oral or written market commentary or trading
strategies to our clients that reflect opinions that are contrary to the opinions expressed herein, and our proprietary trading and investing businesses may make investment decisions that are inconsistent with
the recommendations expressed herein. In reviewing these materials, you should be aware that any or all o the foregoing, among other things, may give rise to real or potential conflicts of interest . MOSt and
its affiliated company(ies), their directors and employees may; (a) from time to time, have a long or short position in, and buy or sell the securities of the company(ies) mentioned herein or (b) be engaged in
any other transaction involving such securities and earn brokerage or other compensation or act as a market maker in the financial instruments of the company(ies) discussed herein or act as an advisor or
lender/borrower to such company(ies) or may have any other potential conflict of interests with respect to any recommendation and other related information and opinions.
Unauthorized disclosure, use, dissemination or copying (either whole or partial) of this information, is prohibited. The person accessing this information specifically agrees to exempt MOSt or any of its
affiliates or employees from, any and all responsibility/liability arising from such misuse and agrees not to hold MOSt or any of its affiliates or employees responsible for any such misuse and further agrees to
hold MOSt or any of its affiliates or employees free and harmless from all losses, costs, damages, expenses that may be suffered by the person accessing this information due to any errors and delays. The
information contained herein is based on publicly available data or other sources believed to be reliable. Any statements contained in this report attributed to a third party represent MOSt’s interpretation of the
data, information and/or opinions provided by that third party either publicly or through a subscription service, and such use and interpretation have not been reviewed by the third party. This Report is not
intended to be a complete statement or summary of the securities, markets or developments referred to in the document. While we would endeavor to update the information herein on reasonable basis, MOSt
and/or its affiliates are under no obligation to update the information. Also there may be regulatory, compliance, or other reasons that may prevent MOSt and/or its affiliates from doing so. MOSt or any of its
affiliates or employees shall not be in any way responsible and liable for any loss or damage that may arise to any person from any inadvertent error in the information contained in this report. MOSt or any of
its affiliates or employees do not provide, at any time, any express or implied warranty of any kind, regarding any matter pertaining to this report, including without limitation the implied warranties of
merchantability, fitness for a particular purpose, and non-infringement. The recipients of this report should rely on their own investigations.
Recipients who are not institutional investors should seek advice of their independent financial advisor prior to taking any investment decision based on this report or for any necessary explanation of its
contents.
MOSt and/or its affiliates and/or employees may have interests/positions, financial or otherwise in the securities mentioned in this report. To enhance transparency, MOSt has incorporated a Disclosure of
Interest Statement in this document. This should, however, not be treated as endorsement of the views expressed in the report.
Disclosure of Interest Statement JSW STEEL
Analyst ownership of the stock No Analyst Certification
The views expressed in this research report accurately reflect the personal views of the analyst(s) about the subject securities or issues, and no part of the compensation of the research analyst(s) was, is, or
will be directly or indirectly related to the specific recommendations and views expressed by research analyst(s) in this report. The research analysts, strategists, or research associates principally responsible
for preparation of MOSt research receive compensation based upon various factors, including quality o f research, investor client feedback, stock picking, competitive f actors and firm revenues.
Regional Disclosures (outside India)
This report is not directed or intended for distribution to or use by any person or entity resident in a state, country or any jurisdiction, where such distribution, publication, availability or use would be contrary tolaw, regulation or which would subject MOSt & its group companies to registration or licensing requirements within such jurisdictions.
For U.K.This report is intended for distribution only to persons having professional experience in matters relating to investments as described in Article 19 of the Financial Services and Markets Act 2000 (Financial
Promotion) Order 2005 (referred to as "investment professionals"). This document must not be acted on or relied on by persons who are not investment professionals. Any investment or investment activity to
which this document relates is only available to investment professionals and will be engaged in only with such persons.
For U.S. Motilal Oswal Securities Limited (MOSL) is not a registered broker - dealer under the U.S. Securities Exchange Act of 1934, as amended (the"1934 act") and under applicable state laws in the United States.
In addition MOSL is not a registered investment adviser under the U.S. Investment Advisers Act of 1940, as amended (the "Advisers Act" and together with the 1934 Act, the "Acts), and under applicable state
laws in the United States. Accordingly, in the absence of specific exemption under the Acts, any brokerage and investment services provided by MOSL, including the products and services described herein
are not available to or intended for U.S. persons.
This report is intended for distribution only to "Major Institutional Investors" as defined by Rule 15a-6(b)(4) of the Exchange Act and interpretations thereof by SEC (henceforth referred to as "major institutional
investors"). This document must not be acted on or relied on by persons who are not major institutional investors. Any investment or investment activity to which this document relates is only available to major
institutional investors and will be engaged in only with major institutional investors. In reliance on the exemption from registration provided by Rule 15a-6 of the U.S. Securities Exchange Act of 1934, as
amended (the "Exchange Act") and interpretations thereof by the U.S. Securities and Exchange Commission ("SEC") in order to conduct business with Institutional Investors based in the U.S., MOSL has
entered into a chaperoning agreement with a U.S. registered broker-dealer, Motilal Oswal Securities International Private Limited. ("MOSIPL"). Any business interaction pursuant to this report will have to beexecuted within the provisions of this chaperoning agreement.
The Research Analysts contributing to the report may not be registered /qualified as research analyst with FINRA. Such research analyst may not be associated persons of the U.S. registered broker-dealer,
MOSIPL, and therefore, may not be subject to NASD rule 2711 and NYSE Rule 472 restrictions on communication with a subject company, public appearances and trading securities held by a research
analyst account.
For SingaporeMotilal Oswal Capital Markets Singapore Pte Limited is acting as an exempt financial advisor under section 23(1)(f) of the Financial Advisers Act(FAA) read with regulation 17(1)(d) of the Financial Advisors
Regulations and is a subsidiary of Motilal Oswal Securities Limited in India. This research is distributed in Singapore by Motilal Oswal Capital Markets Singapore Pte Limited and it is only directed in Singapore
to accredited investors, as defined in the Financial Advisers Regulations and the Securities and Futures Act (Chapter 289), as amended from time to time.
In respect of any matter arising from or in connection with the research you could contact the following representatives of Motilal Oswal Capital Markets Singapore Pte Limited:
Anosh Koppikar Kadambari Balachandran
Email:[email protected] Email : [email protected]
Contact(+65)68189232 Contact: (+65) 68189233 / 65249115Office Address:21 (Suite 31),16 Collyer Quay,Singapore 04931
Motilal Oswal Securities LtdMotilal Oswal Tower, Level 9, Sayani Road, Prabhadevi, Mumbai 400 025
Phone: +91 22 3982 5500 E-mail: [email protected]