juki corporation established in 1938, commenced · market, juki’s smt systems sold well. as a...
TRANSCRIPT

JUKI CORPORATION established in 1938, commenced
production of household sewing machines in 1947 and
rapidly became known as Japan’s premier sewing
machine manufacturer. We are now the world’s leading
manufacturer of industrial sewing machines and export
apparel-related manufacturing equipment to all over
the world.
In recent years, we have been diversifying our
business on the basis of high-precision technologies
developed through the manufacture of sewing
machines. The systems of Surface Mount Technology
(SMT), one of many outgrowths of our sewing
machine-manufacturing technologies, continue their
remarkable growth and are emerging as a new pillar of
our business. Consolidated net sales for the term
ended March 31, 2004, totaled ¥120,625 million
(US$1,138 million). The number of employees at the
end of the term totaled 6,006.
ContentsFinancial Highlights .................................................... 1
To Our Shareholders .................................................. 2
Research & Development........................................... 6
Consolidated Balance Sheets..................................... 10
Consolidated Statements of Operations .................... 12
Consolidated Statements of Shareholders’ Equity..... 13
Consolidated Statements of Cash Flows.................... 14
Notes to Consolidated Financial Statements ............. 15
Independent Auditors’ Report.................................... 26
Corporate Data........................................................... 27
Overseas Offices......................................................... 28
Corporate Profile

1
Financial HighlightsJUKI CORPORATION and Consolidated Subsidiaries
Yen in millions and dollars in thousands, except for per share amounts
Consolidated 2004 2003 2002 2001 2004
Years ended March 31
Net Sales ¥120,625 ¥118,556 ¥114,197 ¥136,551 $1,137,974
Income (Loss) Before Income Taxes and Minority Interests 3,504 (1,057) 893 52 33,061
Net Income (loss) 866 (3,231) 289 160 8,173
As of March 31
Total Assets 118,563 139,012 115,157 169,167 1,118,516
Shareholders’ Equity 3,260 2,113 6,741 5,241 30,753
Yen U.S. dollars
Net Income (loss) per Share ¥8.55 ¥(31.88) ¥2.85 ¥1.58 $0.08
Note: Dollar figures in this annual report refer to U.S. currency. Yen amounts have been translated into U.S. dollars, for conve-nience only, at the approximate exchange rate of ¥106 = US$1 on March 31, 2004. Net income per share is based on theaverage number of shares of common stock outstanding during the respective fiscal year.
(Millions of Yen)Net Sales
0
25,000
50,000
75,000
100,000
125,000
150,000
01 02 03 04
(Millions of Yen)Net Income (loss)
-4,000
0
200
400
600
800
1,000
01
136,551
114,197118,556 120,625
160
289
-3,231
866
1.58
2.85
-31.88
8.55
02 03 04
(Yen)Net Income (loss) per Share
-40.0
2.0
0
4.0
6.0
8.0
10.0
01 02 03 04
2
Business Situation
1. Outline of Results(1) Results
The moderate economic recovery over the
fiscal year under review seems to have
improved the underlying strength of domes-
tic demand. While the U.S. economy itself
appears to be on a full recovery track, the
world economy as a whole continues to face
great uncertainties, foremost of which is the
protracted chaos in the Middle East.
Within this business climate, our Group (Juki
Corporation and its consolidated
subsidiaries) has worked to improve its finan-
cial position by promoting thoroughgoing
reductions in costs, inventories, and interest-
bearing debt by selling off idle properties, as
well as investment securities. As a result, the
Group’s net sales on a consolidated basis for
the reporting period stood at ¥120,625 mil-
lion, up 1.7% from the previous year. Juki
also earned special income by selling off
fixed assets (property, plant and equipment)
but it incurred loss on inventory
obsolescence. Overall, consolidated net
income stood at ¥866 million, compared with
a loss of ¥3,231 million for the previous year.
The following section summarizes the results
in the four main business segments:
(i) Industrial sewing machines
Capital investment restraints under the con-
tinued situation of deflationary business slug-
gishness affected sales of industrial sewing
machines in the domestic market. Sales in
China were heavily impacted by the strong
yen and by the outbreak of SARS (severe
acute respiratory syndrome) in the first half of
the year. As a result, consolidated net sales
for the entire industrial sewing machine busi-
ness totaled ¥59,607 million (down 11.6%
year-on-year) and operating income stood at
¥6,018 million (down 39.6% year-on-year).
With respect to production, Juki was suc-
cessful in reducing costs and inventories by
smoothly advancing inventory adjustment
through the use of SCM (supply chain man-
agement), and by procuring a larger propor-
tion of parts from China.
(ii) Household sewing machines
While the domestic market showed signs of
recovery, consumer spending fell short of the
level required for a full-scale recovery. In
keeping with Juki’s commitment to “improv-
ing the quality of business,” the company
made good progress in door-to-door sales
of its highest-grade computer-controlled
models for the sewing of large embroideries.
In overseas markets, however, the recovery
trend in the U.S. economy was not sufficient
to boost OEM sales from their stagnant level.
Overall, consolidated net sales stood at
¥13,592 million, a year-on-year decline of
3.6%, bringing in an operating income of
¥1,588 million, up 24.1%.
(iii) SMT (surface-mount technology) systems
Capital investments gradually recovered in
the domestic market, particularly in the digi-
tal consumer electronics industry, in spite of
severe price competition. In the Chinese
To Our Shareholders

3
market, Juki’s SMT systems sold well. As a
result, consolidated net sales reached
¥17,592 million, up 57.0%, and operating loss
was trimmed back to ¥1,127 million (as com-
pared with a loss of ¥4,734 million for the
previous year).
(iv) Other businesses (jewelry, optical equip-
ment, amusement equipment, others)
Sales of jewelry and optical equipment were
sluggish, while those of amusement equip-
ment grew well, boosted by brisk orders in
the domestic market. Consolidated net sales
reached ¥29,834 million, up 15.6% year-on-
year, and operating income totaled ¥2,855
million, up 43.1%.
The following section summarizes the
Company’s business performance by geo-
graphical segment:
(i) Japan
Sales amounted to ¥67,428 million, a year-
on-year increase of 17.3% and operating
income totaled ¥7,555 million, up 6.9%.
(ii) North America
Sales stood at ¥7,568 million, down 11.8%
year-on-year. Operating loss came to ¥94
million, an improvement compared with the
loss of ¥575 million for the previous year.
(iii) Asia
Sales came to ¥37,061 million, down 9.2%,
and operating income totaled ¥2,443 million,
an increase of 19.2%.
(iv) Europe
Sales came to ¥8,568 million, a decline of
26.5% and the operating loss totaled ¥570
million (compared with a loss of ¥42 million
for the previous year).
(2) Cash flows
Cash and cash equivalents (hereinafter
referred to as “Cash”) on a consolidated
basis stood at ¥11,533 million at the fiscal
year-end, down ¥1,126 million from the pre-
vious term-end.
(i) Cash flow from operating activities
Net cash provided by operating activities
amounted to ¥18,829 million, compared with
¥20,360 million for the previous term. This
was due to several factors, including the
reduction in inventories.
(ii) Cash flow from investing activities
Net cash provided by investing activities
amounted to ¥5,255 million, compared with
net cash used in investing activities in the
amount of ¥2,815 million for the previous
term. This was due to several factors, includ-
ing the sale of fixed assets.
(iii) Cash flow from financing activities
Net cash used in financing activities came to
¥24,650 million, compared with ¥14,817 mil-
lion for the previous term. This was due to a
reduction in interest-bearing debt and sev-
eral other factors.

4
2. Issues to be AddressedThe three-year medium-term management
plan launched in 2002 calls for the prompt
implementation of the following five basic
schemes. The core objective of the schemes
is to strengthen the business infrastructure of
the Juki Group through a basic policy of
pursuing profits and cash flow
simultaneously.
(1) Reforming Juki’s business structure
Juki will further develop its production and
sales activities for industrial sewing machines
in China, the world’s largest apparel-
manufacturing country. With respect to Juki’s
SMT system business, the Group will further
strengthen its sales and service systems as a
means to increase sales.
At the same time, the Juki Group has been
proceeding with the downsizing, withdrawal,
and restructuring of the less-competitive
businesses of affiliated companies. In the
future, the Group will develop and expand
new business fields utilizing its core tech-
nologies in cooperation with affiliated
companies.
(2) Reforming Juki’s financial structure
Juki will be conducting a group-wide review
of its asset structure and working to further
increase capital efficiency. SCM (Supply
Chain Management) strategies will be
aggressively used to shorten lead times,
reduce inventories, and further reduce
interest-bearing debt.
(3) Reforming Juki’s cost structure
Juki will speed up the implementation of its
V-30 Plan for re-evaluating costs related to all
of its businesses and reducing them overall.
In our industrial and household sewing
machine businesses, the Company is rapidly
promoting local production in China. In the
SMT (Surface Mount Technology) system
business, Juki is making great efforts to
reduce costs for labor and parts by centraliz-
ing domestic manufacturing locations.
(4) Strengthening Juki’s brand power
By developing more appealing new products
and sustaining rigorous quality assurance
activities for every one of its products and
services, Juki will reinforce its position as a
brand that customers can rely on completely.
To be more specific, Juki is improving the
efficiency of its designs with the use of 3D-
CAD (three dimensional computer aided
design) and PDM (product data manage-
ment) systems while working towards full
compliance with the ISO-9001 (quality assur-
ance system) and ISO-14000 (environmental
management system) standards throughout
the Group.
As always, the management and staff of Juki
will continue to put forward their best efforts
to save resources, conserve energy, and
develop environment-friendly technologies
and products.
5
(5) Strengthening Juki’s human resources
development, technological capabilities,
and intellectual property rights
In addition to the aforementioned activities
to strengthen its brand power, Juki will make
further efforts to improve its competitiveness
as a manufacturer by strengthening its
human resources, technological capabilities,
and intellectual property rights.
Specifically, the management of Juki will
press ahead with human resource policies
based on a management strategy of foster-
ing capable human resources and stationing
them locally. By globalizing its businesses
through the deployment of human
resources, Juki will be enhancing its selling
power, refining its manufacturing techniques,
and developing its engineering skills
throughout the entire Group. We will also
work to increase the corporate value of the
Juki Group as a global corporation by secur-
ing intellectual property rights in overseas
markets.
3. Contracts/Agreements with ManagerialImportance
Nothing particular to report
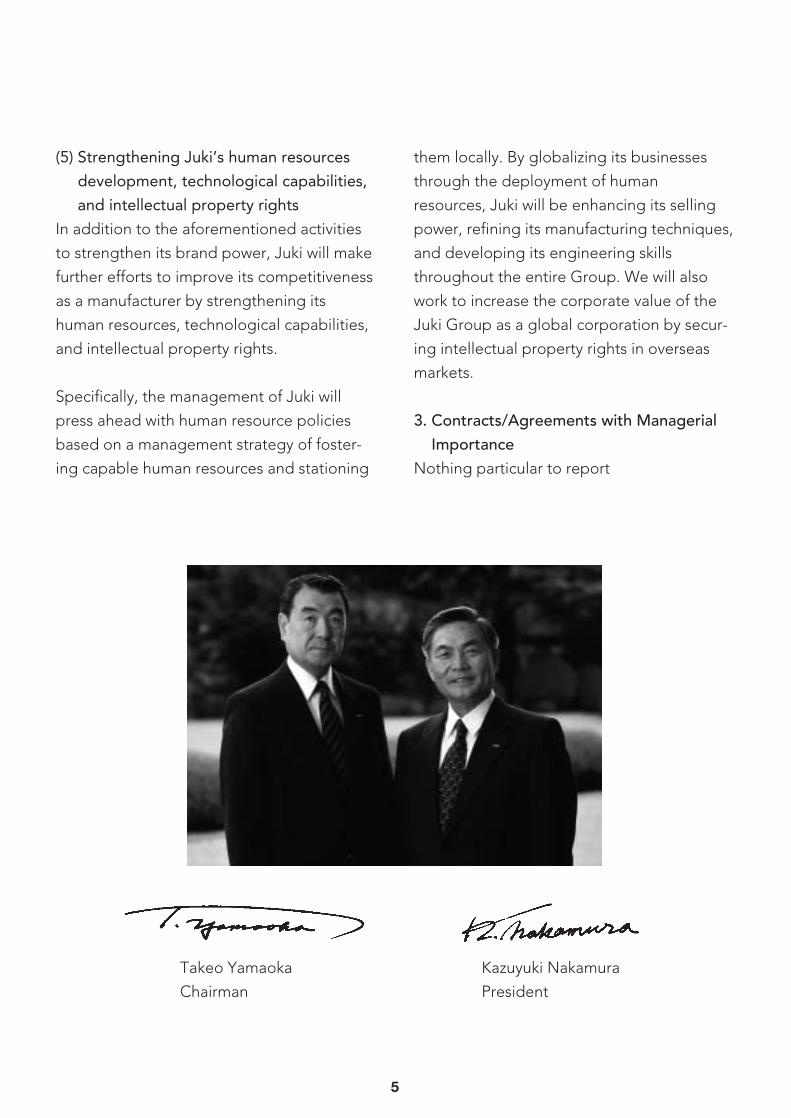
Takeo Yamaoka
Chairman
Kazuyuki Nakamura
President

6
Research & Development
The Group’s research and development activities have been carried out mainly by its
Central Research and Development Laboratory, a facility established in 2002 to work
towards Juki’s targets of creating new core technologies and new values. The Group
has been continuously researching and developing elementary technologies, tech-
niques, and new materials to improve the functions and performance of its
environment-friendly products. To address newly developed technologies, we are
accumulating experience to strengthen our technical capabilities, and are facilitating
the early establishment of advanced technologies through the active utilization of
joint study and development initiatives with external organizations (such as universi-
ties and other companies). In addition, we are making efforts to rapidly transfer the
technologies and skills we have perfected to frontline business sections and compa-
nies within the Group.
Research and development costs within the
entire Juki Group for the term under review
amounted to ¥4,665 million (ratio of cost to
sales: 3.89%). The number of industrial property
rights at the term-end totaled 721.
Central R&D Laboratory Design work with 3-D CAD

7
(1) Industrial sewing machines
Juki is attempting to build on its technolo-
gies to develop sewing machines that pro-
vide an even higher degree of customer
satisfaction for its industrial users.
Juki is aiming to position itself apart from its
competitors by offering direct-drive or dry-
head sewing machines, which are very popu-
lar with customers because of their advanced
features, such as ease of operation and stain-
free performance. We have also been
researching and developing IT-capable
sewing machines, devices, and panels as solu-
tions for customers who need to send and
receive information on the operational status
of their production and maintenance, to
improve the quality of their sewing products,
and to rapidly respond to changes in designs,
changes in production items, small-lot orders,
and demanding delivery schedules.
Specific developments achieved thanks to
the above-described measures include the
AMB-289, the first machine ever for sewing
stay buttons; the DP-2100, the only industrial
machine capable of automatic sleeve-cutting
in menswear, a process that demands long
experience and a high degree of skill; the LZ-
2290-A-SR, capable of high-speed topstitch-
ing and zigzag pattern stitching; the MF-7700
Series, the highest grade machines in the
covering stitch market and a guarantee of an
improved position for Juki in the knit fabric
market; and the DLN-6390, a new cylinder-
head lockstitch machine that has already
earned an outstanding reputation for its per-
formance in the sewing of jeans.
Juki will continue to offer the highest-grade
reliability and performance as a leading man-
ufacturer by launching new products on the
market, by adopting leading-edge technolo-
gies incorporating IT, and so on, and by
offering products at prices that are extremely
competitive internationally.
Through these and other strategies, Juki will
maintain its position as a global leader in
industrial sewing machines by providing
maximum value-added to its customers.
Computer-controlled, Dry-head, Lockstitch Sleeve Setting Machine with Multi-programming Device
Computer-controlled, High-speed, Single-thread Chainstitch, Button-neck-wrapping Machine AMB-289

8
(2) Household sewing machines
In the field of household sewing machines,
Juki is researching and developing sewing
machines for household use, compact over-
lock sewing machines, and sewing machines
for occupational use.
In the field of high-grade, large-scale com-
puterized embroidery stitching machines,
Juki expanded its HZL-010 Series in June
2003 with the launch of the HZL-2100, a new
model featuring a fully automatic needle
threading device and touch panel that per-
mits pattern selection. More new models in
the HZL-010 Series will be coming soon.
Juki has also continued to develop new
models with improved software for overseas
OEM customers.
In the field of medium- to low-priced com-
puterized machines, Juki has launched the
HZL-E60 Series, a new lineup of machines for
both domestic and overseas markets. Active
efforts to promote the series have boosted
the popularity of Juki-brand machines.
In the field of compact overlock machines,
Juki has further strengthened its lineup and
sales through the domestic and overseas
launch of a new overlock machine equipped
with a covering stitch capability.
Sewing & Embroidery Machine “jureve” HZL-010N Electronic Computerized Sewing Machine HZL-E61

9
(3) SMT (surface-mount technology) systems
In the field of SMT systems, Juki has been
researching and developing pick-and-placers
for placing electronic components on sub-
strates for electronic products and their
ancillary devices.
Customers demand reliable and stable
equipment that ensures enhanced productiv-
ity (the number of components that can be
successfully mounted per hour). Juki is satis-
fying these demands by developing products
through further enhanced computer-
simulation analyses and various evaluation
tests.
The high-speed pick-and-placer KE-2050 and
the high-speed flexible pick-and-placer KE-
2060 are both medium-sized models devel-
oped on the basis of a modular concept that
enables flexible combination and integral
management by means of a host-line com-
puter. Both models have won high praise
from customers, and are selling briskly.
In January 2004, Juki also launched sales of
the FX-1, a newly developed high-speed
modular pick-and-placer equipped with a
linear motor that enables high-speed and
high-precision implementation of electronic
components. This new machine provides
customers with a wider selection and its
superior performance has already won its
strong popularity among customers.
In cooperation with the other companies in
the Juki Group, Juki will continue to research
and develop pick-and-placers and feeders
that offer optimal solutions to customer
needs.
High-speed modular mounter FX-1R, High-speed flexible mounter KE-2060R

10
Thousands ofMillions of Yen U.S. Dollars (Note 1)
2004 2003 2004
ASSETSCURRENT ASSETS:
Cash and cash equivalents .................................................................. ¥ 11,533 ¥ 12,659 $ 108,803Marketable securities (Note 3) ............................................................ 40 438 381Short-term investments (Notes 4 and 6) ............................................ 2,177 3,800 20,534Receivables:
Trade notes (Note 10) ...................................................................... 2,163 2,068 20,406Trade accounts (Note 10)................................................................. 20,579 22,816 194,139Other ................................................................................................. 1,303 3,552 12,291Allowance for doubtful accounts .................................................... (2,627) (3,108) (24,780)
Inventories (Note 5).............................................................................. 42,280 52,698 398,866Deferred tax assets (Note 9)................................................................ 2,211 2,126 20,859Prepaid expenses and other current assets....................................... 1,871 2,049 17,650
Total current assets....................................................................... 81,530 99,098 769,149
PROPERTY, PLANT AND EQUIPMENT (Note 6):Land....................................................................................................... 5,956 6,317 56,186Buildings and structures ...................................................................... 21,574 23,257 203,534Machinery and equipment .................................................................. 20,355 21,115 192,026Furniture and fixtures........................................................................... 20,972 20,941 197,850Construction in progress ..................................................................... 74 499 696
Total ............................................................................................... 68,931 72,129 650,292Accumulated depreciation.................................................................. (47,225) (48,086) (445,521)
Net property, plant and equipment............................................ 21,706 24,043 204,771
INVESTMENTS AND OTHER ASSETS:Investment securities (Notes 3 and 6) ................................................ 5,293 4,467 49,930Investments in and long-term loans to unconsolidated
subsidiaries and associated companies........................................... 1,626 1,442 15,337Long-term receivables ......................................................................... 307 229 2,902Deferred charges ................................................................................. 3Deferred tax assets (Note 9)................................................................ 2,447 4,104 23,087Other assets.......................................................................................... 5,654 5,626 53,340
Total investments and other assets............................................. 15,327 15,871 144,596
TOTAL ...................................................................................................... ¥118,563 ¥139,012 $1,118,516
See notes to consolidated financial statements.
Consolidated Balance SheetsJUKI CORPORATION and Consolidated Subsidiaries, March 31, 2004 and 2003

11
Thousands ofMillions of Yen U.S. Dollars (Note 1)
2004 2003 2004
LIABILITIES AND SHAREHOLDERS’ EQUITYCURRENT LIABILITIES:
Short-term borrowings (Note 6).......................................................... ¥ 33,343 ¥ 55,794 $ 314,551Current portion of long-term debt (Note 6) ...................................... 21,380 13,547 201,701Payables:
Trade notes (Note 10) ...................................................................... 12,100 9,255 114,151Trade accounts (Note 10)................................................................. 6,974 5,590 65,795
Income taxes payable.......................................................................... 1,288 274 12,145Accrued expenses................................................................................ 5,500 5,546 51,890Other current liabilities ........................................................................ 3,802 5,888 35,871
Total current liabilities .................................................................. 84,387 95,894 796,104
LONG-TERM LIABILITIES:Long-term debt (Note 6) ..................................................................... 24,614 34,694 232,206Liability for retirement benefits (Note 7) ............................................ 5,460 5,221 51,513Other long-term liabilities ................................................................... 399 580 3,761
Total long-term liabilities ............................................................. 30,473 40,495 287,480
MINORITY INTERESTS ........................................................................... 443 510 4,179
CONTINGENT LIABILITIES (Note 13)
SHAREHOLDERS’ EQUITY (Note 8):Common stock—authorized, 400,000,000 shares;issued, 101,375,990 shares in 2004 and 2003................................... 9,941 9,941 93,785
Capital surplus...................................................................................... 6,901 6,901 65,104Deficit .................................................................................................... (9,229) (10,088) (87,066)Net unrealized gain (loss) on available-for-sale securities................ 330 (1,059) 3,112Foreign currency translation adjustments.......................................... (4,665) (3,569) (44,014)
Total ............................................................................................... 3,278 2,126 30,921Treasury stock—at cost, 66,157 shares in 2004 and 52,567 shares in 2003 ......................................................................... (18) (13) (168)
Total shareholders’ equity ........................................................... 3,260 2,113 30,753
TOTAL ...................................................................................................... ¥118,563 ¥139,012 $1,118,516
12
Thousands ofMillions of Yen U.S. Dollars (Note 1)
2004 2003 2004
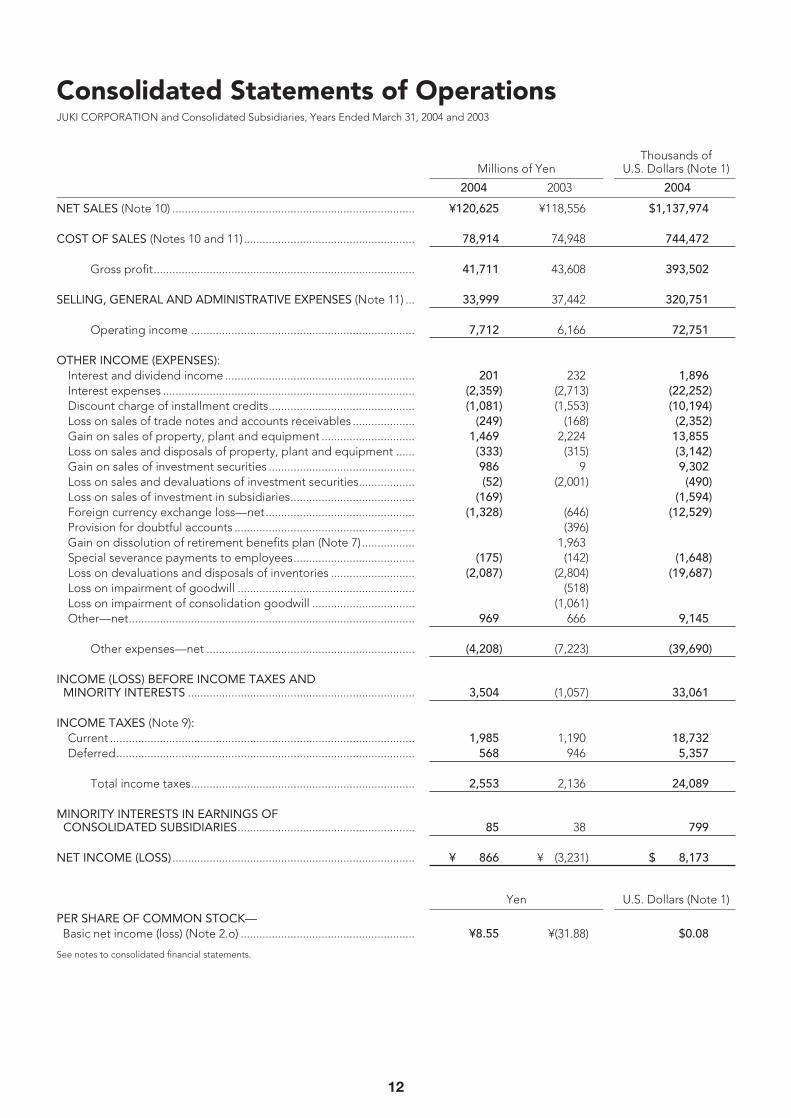
NET SALES (Note 10) .............................................................................. ¥120,625 ¥118,556 $1,137,974
COST OF SALES (Notes 10 and 11)....................................................... 78,914 74,948 744,472
Gross profit.................................................................................... 41,711 43,608 393,502
SELLING, GENERAL AND ADMINISTRATIVE EXPENSES (Note 11) ... 33,999 37,442 320,751
Operating income ........................................................................ 7,712 6,166 72,751
OTHER INCOME (EXPENSES):Interest and dividend income ............................................................. 201 232 1,896Interest expenses ................................................................................. (2,359) (2,713) (22,252)Discount charge of installment credits............................................... (1,081) (1,553) (10,194)Loss on sales of trade notes and accounts receivables .................... (249) (168) (2,352)Gain on sales of property, plant and equipment .............................. 1,469 2,224 13,855Loss on sales and disposals of property, plant and equipment ...... (333) (315) (3,142)Gain on sales of investment securities ............................................... 986 9 9,302Loss on sales and devaluations of investment securities.................. (52) (2,001) (490)Loss on sales of investment in subsidiaries........................................ (169) (1,594)Foreign currency exchange loss—net................................................ (1,328) (646) (12,529)Provision for doubtful accounts .......................................................... (396)Gain on dissolution of retirement benefits plan (Note 7)................. 1,963Special severance payments to employees....................................... (175) (142) (1,648)Loss on devaluations and disposals of inventories ........................... (2,087) (2,804) (19,687)Loss on impairment of goodwill ......................................................... (518)Loss on impairment of consolidation goodwill ................................. (1,061)Other—net............................................................................................ 969 666 9,145
Other expenses—net ................................................................... (4,208) (7,223) (39,690)
INCOME (LOSS) BEFORE INCOME TAXES AND MINORITY INTERESTS ......................................................................... 3,504 (1,057) 33,061
INCOME TAXES (Note 9):Current .................................................................................................. 1,985 1,190 18,732Deferred................................................................................................ 568 946 5,357
Total income taxes........................................................................ 2,553 2,136 24,089
MINORITY INTERESTS IN EARNINGS OFCONSOLIDATED SUBSIDIARIES......................................................... 85 38 799
NET INCOME (LOSS) .............................................................................. ¥ 866 ¥ (3,231) $ 8,173
Yen U.S. Dollars (Note 1)
PER SHARE OF COMMON STOCK—Basic net income (loss) (Note 2.o) ........................................................ ¥8.55 ¥(31.88) $0.08
See notes to consolidated financial statements.
Consolidated Statements of OperationsJUKI CORPORATION and Consolidated Subsidiaries, Years Ended March 31, 2004 and 2003
13
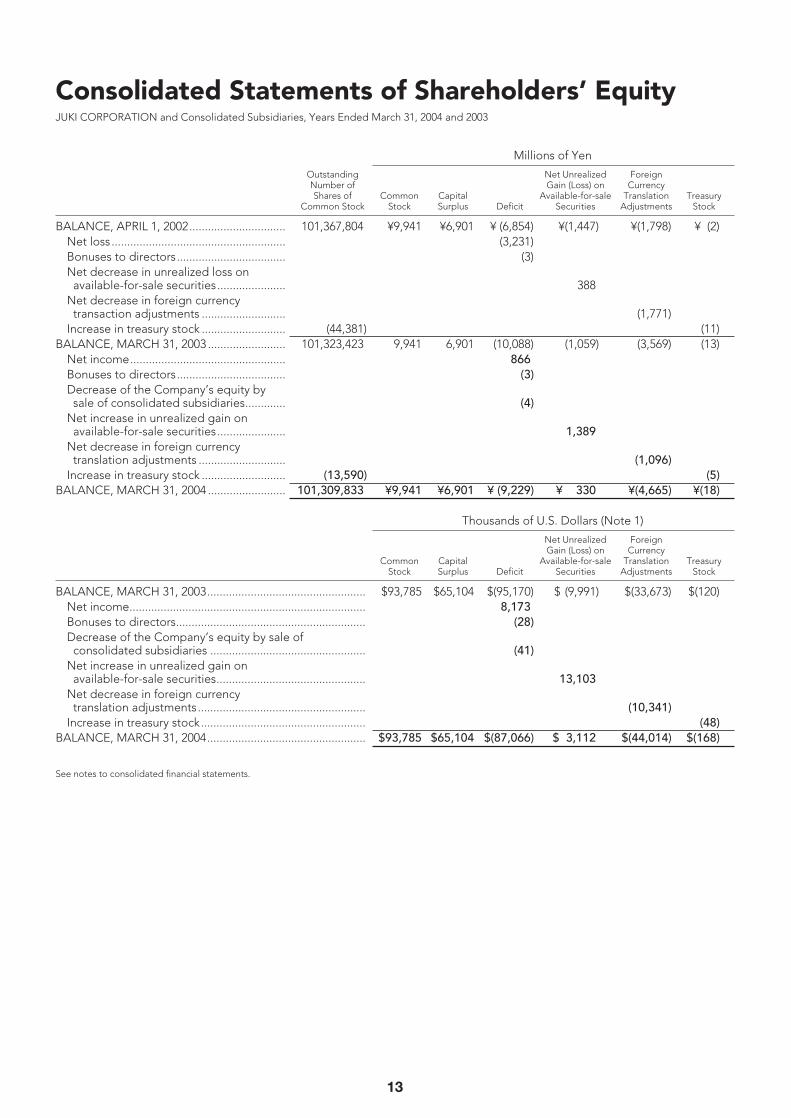
Millions of Yen
Outstanding Net Unrealized ForeignNumber of Gain (Loss) on CurrencyShares of Common Capital Available-for-sale Translation Treasury
Common Stock Stock Surplus Deficit Securities Adjustments Stock
BALANCE, APRIL 1, 2002............................... 101,367,804 ¥9,941 ¥6,901 ¥ (6,854) ¥(1,447) ¥(1,798) ¥ (2)Net loss ........................................................ (3,231)Bonuses to directors................................... (3)Net decrease in unrealized loss onavailable-for-sale securities...................... 388
Net decrease in foreign currencytransaction adjustments ........................... (1,771)
Increase in treasury stock ........................... (44,381) (11)BALANCE, MARCH 31, 2003 ......................... 101,323,423 9,941 6,901 (10,088) (1,059) (3,569) (13)
Net income.................................................. 866Bonuses to directors................................... (3)Decrease of the Company’s equity bysale of consolidated subsidiaries............. (4)
Net increase in unrealized gain onavailable-for-sale securities...................... 1,389
Net decrease in foreign currencytranslation adjustments ............................ (1,096)
Increase in treasury stock ........................... (13,590) (5)BALANCE, MARCH 31, 2004 ......................... 101,309,833 ¥9,941 ¥6,901 ¥ (9,229) ¥ 330 ¥(4,665) ¥(18)
Thousands of U.S. Dollars (Note 1)
Net Unrealized ForeignGain (Loss) on Currency
Common Capital Available-for-sale Translation TreasuryStock Surplus Deficit Securities Adjustments Stock
BALANCE, MARCH 31, 2003................................................... $93,785 $65,104 $(95,170) $ (9,991) $(33,673) $(120)Net income............................................................................ 8,173Bonuses to directors............................................................. (28)Decrease of the Company’s equity by sale ofconsolidated subsidiaries .................................................. (41)
Net increase in unrealized gain onavailable-for-sale securities................................................ 13,103
Net decrease in foreign currencytranslation adjustments...................................................... (10,341)
Increase in treasury stock..................................................... (48)BALANCE, MARCH 31, 2004................................................... $93,785 $65,104 $(87,066) $ 3,112 $(44,014) $(168)
See notes to consolidated financial statements.
Consolidated Statements of Shareholders’ EquityJUKI CORPORATION and Consolidated Subsidiaries, Years Ended March 31, 2004 and 2003

14
Thousands ofMillions of Yen U.S. Dollars (Note 1)
2004 2003 2004
OPERATING ACTIVITIES:Income (loss) before income taxes and minority interests ............... ¥ 3,504 ¥ (1,057) $ 33,061Adjustments for:
Income taxes—(paid) refunded....................................................... (17) 532 (156)Depreciation and amortization ....................................................... 3,389 4,033 31,976Loss on impairment of goodwill...................................................... 518Loss on impairment of consolidation goodwill.............................. 1,326 (4)Provision for doubtful accounts ...................................................... (316) 267 (2,978)Provision for accrued pension and severance costs...................... 248 (1,304) 2,342Foreign currency translation adjustments on cash and
cash equivalents ............................................................................. 1,104 205 10,414Gain on sales of investment securities ........................................... (986) (9) (9,302)Loss on sales and devaluations of investment securities .............. 52 2,001 490Loss on sales of investment in subsidiaries .................................... 169 1,594Gain on sales of property, plant and equipment .......................... (1,469) (2,224) (13,855)Loss on sales and disposals of property, plant and equipment... 331 315 3,120Changes in assets and liabilities, net of effects:
Increase in receivables ................................................................. (565) (443) (5,330)Decrease in inventories ................................................................ 8,181 6,235 77,176Increase in payables ..................................................................... 4,333 4,213 40,878Increase (decrease) in notes receivables discounted ................ 1,358 (107) 12,812
Other—net ........................................................................................ (487) 5,859 (4,605)
Net cash provided by operating activities .............................. 18,829 20,360 177,633
INVESTING ACTIVITIES:Purchases of property, plant and equipment.................................... (3,648) (2,519) (34,416)Proceeds from sales of property, plant and equipment................... 4,763 830 44,934Purchases of investment securities..................................................... (400) (3,062) (3,769)Proceeds from sales of investment securities and
investment in subsidiaries ................................................................. 2,460 2,847 23,203Other—net............................................................................................ 2,080 (911) 19,620
Net cash provided by (used in) investing activities ................ 5,255 (2,815) 49,572
FINANCING ACTIVITIES:Decrease in short-term borrowings—net .......................................... (22,461) (11,397) (211,894)Proceeds from long-term debt ........................................................... 12,939 11,610 122,063Repayments of long-term debt........................................................... (15,065) (14,941) (142,123)Dividends paid ..................................................................................... (58) (78) (541)Other—net............................................................................................ (5) (11) (47)
Net cash used in financing activities ....................................... (24,650) (14,817) (232,542)
FOREIGN CURRENCY TRANSLATION ADJUSTMENTSON CASH AND CASH EQUIVALENTS ............................................... (560) (413) (5,286)
NET (DECREASE) INCREASE IN CASH AND CASH EQUIVALENTS... (1,126) 2,315 (10,623)
CASH AND CASH EQUIVALENTS, BEGINNING OF YEAR ............... 12,659 10,344 119,426
CASH AND CASH EQUIVALENTS, END OF YEAR ............................. ¥11,533 ¥12,659 $108,803
See notes to consolidated financial statements.
Consolidated Statements of Cash FlowsJUKI CORPORATION and Consolidated Subsidiaries, Years Ended March 31, 2004 and 2003

15
1. BASIS OF PRESENTING CONSOLIDATEDFINANCIAL STATEMENTS
The accompanying consolidated financial statements of JUKICORPORATION (the “Company”) and its consolidatedsubsidiaries (together, the “Group”) have been prepared inaccordance with the provisions set forth in the JapaneseSecurities and Exchange Law and its related accountingregulations, and in conformity with accounting principlesgenerally accepted in Japan, which are different in certainrespects as to application and disclosure requirements ofInternational Financial Reporting Standards.
In preparing these consolidated financial statements,certain reclassifications and rearrangements have been madeto the consolidated financial statements issued domesticallyin order to present them in a form which is more familiar toreaders outside Japan. In addition, certain reclassificationshave been made in the 2003 financial statements to conformto the classifications used in 2004.
The consolidated financial statements are stated inJapanese yen, the currency of the country in which theCompany is incorporated and operates. The translations ofJapanese yen amounts into U.S. dollar amounts are includedsolely for the convenience of readers outside Japan and havebeen made at the rate of ¥106 to $1,the approximate rate ofexchange at March 31, 2004. Such translations should not beconstrued as representations that the Japanese yen amountscould be converted into U.S. dollars at that or any other rate.
2. SUMMARY OF SIGNIFICANT ACCOUNTING POLICIES
a. Consolidation—The consolidated financial statements asof March 31, 2004 and 2003,include the accounts of theCompany and its 47 significant (51 in 2003) subsidiaries.
Under the control or influence concept, those companies inwhich the Company, directly or indirectly, is able to exercisecontrol over operations are fully consolidated, and thosecompanies over which the Group has the ability to exercisesignificant influence are accounted for by the equity method.
Investments in 11 (13 in 2003) unconsolidated subsidiariesand 5 associated companies are stated at cost. If the equitymethod of accounting had been applied to the investmentsin these companies, the effect on the accompanying consoli-dated financial statements would not be material.
Consolidation goodwill is the difference between the costand underlying net equity of investments in consolidatedsubsidiaries and associated companies at acquisition and isamortized on a straight-line basis over 5 years. The consolida-tion goodwill is impaired if the expectation of its future valueis assessed less than the value estimated when it wasacquired.
All significant intercompany balances and transactions havebeen eliminated in consolidation. All material unrealizedprofit included in assets resulting from transactions within theGroup is eliminated.b. Cash Equivalents—Cash equivalents are short-term invest-ments that are readily convertible into cash and that areexposed to insignificant risk of changes in value.
Cash equivalents include time deposits, certificate ofdeposits, commercial paper and mutual funds investing inbonds that represent short-term investments, all of whichmature or become due within three months of the date ofacquisition.c. Inventories—Inventories are principally stated at cost asdetermined by the average method for merchandise, finishedgoods and work-in-process, and by the last purchase pricemethod for raw materials and supplies.d. Marketable and Investment Securities—Marketable andinvestment securities are classified as available-for-sale secu-rities and are reported at fair value, with unrealized gains andlosses, net of applicable taxes, reported in a separate compo-nent of shareholders’ equity. Non-marketable available-for-sale securities are stated at cost determined by themoving-average method. For other than temporary declinesin fair value, investment securities are reduced to net realiz-able value by a charge to income.e. Property, Plant and Equipment—Property, plant andequipment are stated at cost.
Depreciation of property, plant and equipment of theCompany and its consolidated domestic subsidiaries is com-puted substantially by the declining-balance method at ratesbased on the estimated useful lives of the assets, while thestraight-line method is applied to the buildings acquired afterApril 1,1998 of the Company and its domestic subsidiaries,and to the whole property, plant and equipment of consoli-dated foreign subsidiaries. The range of useful lives is princi-pally from 5 to 50 years for buildings and structures, from 2 to12 years for machinery and equipment and from 2 to 15 yearsfor furniture and fixtures.f. Allowance for Doubtful Accounts—The allowance fordoubtful accounts is stated in amounts considered to beappropriate based on the past credit loss experience and anevaluation of potential losses in the receivables outstanding.g. Liability for Retirement Benefits and Pension Plans—TheCompany has retirement benefits and pension plans foremployees. Employees terminating at the mandatory retire-ment age are entitled to pension payments under the fundedpension plan.
Notes to Consolidated Financial StatementsJUKI CORPORATION and Consolidated Subsidiaries, Years Ended March 31, 2004 and 2003
16
Effective April 1, 2000, the Company and domestic consoli-dated subsidiaries adopted a new accounting standard foremployees’ retirement benefits and accounted for the liabilityfor retirement benefits based on the projected benefit oblig-ations and plan assets at the balance sheet date. The transi-tional obligation, determined as of April 1, 2000, is beingamortized over 10 years.
Retirement benefits to directors and corporate auditors areprovided at 100% (the Company and 4 consolidated domesticsubsidiaries) of the amount which would be paid if they allretired at the balance sheet date. Prior to April 1, 2002,retirement benefits to directors and corporate auditors areprovided at 40% (the Company and 2 consolidated domesticsubsidiaries) of the amount which would be required if theyall retired at the balance sheet date. However, effective April1, 2002, those companies changed its method of accountingfor such retirement benefits to the provision at 100% of theamount which would be required if they all retired at thebalance sheet date to reflect periodic income and expensesmore appropriately.h. Research and Development Costs—Research and devel-opment costs are charged to income as incurred while suchcosts incurred before April 1, 1999 were recorded as deferredcharges and have been amortized over 5 years.i. Leases—All leases are accounted for as operating leases.Under Japanese accounting standards for leases, financeleases that deem to transfer ownership of the leased propertyto the lessee are to be capitalized, while other finance leasesare permitted to be accounted for as operating lease transac-tions if certain “as if capitalized” information is disclosed inthe notes to the lessee’s financial statements.j. Income Taxes—The provision for income taxes is computedbased on the pretax income included in the consolidatedstatements of operations. The asset and liability approach isused to recognize deferred tax assets and liabilities for theexpected future tax consequences of temporary differencesbetween the carrying amounts and the tax bases of assetsand liabilities. Deferred taxes are measured by applyingcurrently enacted tax laws to the temporary differences.k. Appropriations of Retained Earnings—Appropriations ofretained earnings at each year end are reflected in the finan-cial statements for the following year upon shareholders’approval.
l. Foreign Currency Transactions—All short-term and long-term monetary receivables and payables denominated inforeign currencies are translated into Japanese yen at theexchange rates at the balance sheet date. The foreignexchange gains and losses from translation are recognized inthe consolidated statements of operations to the extent thatthey are not hedged by forward exchange contracts.m. Foreign Currency Financial Statements—The balancesheet accounts of the consolidated foreign subsidiaries aretranslated into Japanese yen at the current exchange rate asof the balance sheet date except for shareholders’ equity,which is translated at the historical rate. Differences arisingfrom such translation are shown as “Foreign currency transla-tion adjustments” in a separate component of shareholders’equity.
Revenue and expense accounts of the consolidated foreignsubsidiaries are translated into yen at the average exchangerate.n. Derivatives and Hedging Activities—The Group usesderivative financial instruments (“derivatives”) to manage itsexposures to fluctuations in foreign exchange and interestrates. Foreign exchange forward contracts, currency swaps,interest rate swaps and interest rate caps are utilized by theGroup to reduce foreign currency exchange and interest raterisks. The Group does not enter into derivatives for trading orspeculative purposes.
Derivative financial instruments and foreign currency trans-actions are classified and accounted for as follows: (a) allderivatives be recognized as either assets or liabilities andmeasured at fair value, and gains or losses on derivativetransactions are recognized in the statements of operationsand (b) for derivatives used for hedging purposes, if deriva-tives qualify for hedge accounting because of high correlationand effectiveness between the hedging instruments and thehedged items, gains or losses on derivatives are deferreduntil maturity of the hedged transactions.
The foreign exchange forward contracts and currencyswaps employed to hedge foreign exchange exposures forexport sales are measured at the fair value and the unrealizedgains/losses are recognized in income. Forward contractsapplied for forecasted (or committed) transactions are alsomeasured at the fair value but the unrealized gains/losses aredeferred until the underlying transactions are completed.

17
The interest rate swaps and interest rate caps which qualifyfor hedge accounting and meet specific matching criteria arenot remeasured at market value but the differential paid orreceived under the swap agreements are recognized andincluded in interest expenses or income.o. Per Share Information—Basic net income per share iscomputed by dividing net income available to commonshareholders by the weighted-average number of commonshares outstanding for the period.
Diluted net income per share is not disclosed because it isanti-dilutive.
Cash dividends per share presented in the accompanyingconsolidated statements of operations are dividends applica-ble to the respective years including dividends to be paidafter the end of the year.p. New Accounting Pronouncements—In August 2002, theBusiness Accounting Council issued a Statement of Opinion,“Accounting for Impairment of Fixed Assets, ” and inOctober 2003 the Accounting Standards Board of Japan(“ASB”) issued ASB Guidance No. 6,“Guidance forAccounting Standard for Impairment of Fixed Assets.” Thesenew pronouncements are effective for fiscal years beginningon or after April 1, 2005 with early adoption permitted forfiscal years ending on or after March 31, 2004.
The new accounting standard requires an entity to reviewits long-lived assets for impairment whenever events orchanges in circumstances indicate that the carrying amount ofan asset or asset group may not be recoverable. An impair-ment loss would be recognized if the carrying amount of anasset or asset group exceeds the sum of the undiscountedfuture cash flows expected to result from the continued useand eventual disposition of the asset or asset group. Theimpairment loss would be measured as the amount by whichthe carrying amount of the asset or asset group exceeds itsrecoverable amount, which is the higher of the discountedcash flows from the continued use and eventual disposition ofthe asset or asset group or the net selling price at disposition.
The Company is currently in the process of assessing theeffect of adoption of these pronouncements.
3. MARKETABLE AND INVESTMENT SECURITIES
Marketable and investment securities as of March 31, 2004and 2003, consisted of the following:
Thousands ofMillions of Yen U.S. Dollars2004 2003 2004
Current:Bonds ............................................. ¥ 340Other .............................................. ¥ 40 98 $ 381
Total.................................................... ¥ 40 ¥ 438 $ 381
Non-current:Marketable equity securities ........ ¥4,342 ¥3,647 $40,963Bonds ............................................. 101 100 949Other ............................................. 850 720 8,018
Total.................................................... ¥5,293 ¥4,467 $49,930
The carrying amounts and aggregate fair values ofmarketable and investment securities as of March 31, 2004and 2003, were as follows:
Millions of YenUnrealized Unrealized Fair
March 31, 2004 Cost Gains Losses Value
Available-for-sale:Equity securities .................... ¥3,804 ¥745 ¥207 ¥4,342Bonds..................................... 100 1 101Others .................................... 576 26 10 592
Millions of YenUnrealized Unrealized Fair
March 31, 2003 Cost Gains Losses Value
Available-for-sale:Equity securities .................... ¥5,352 ¥58 ¥1,763 ¥3,647Bonds..................................... 100 3 97Others .................................... 616 1 70 547
Thousands of U.S. DollarsUnrealized Unrealized Fair
March 31, 2004 Cost Gains Losses Value
Available-for-sale:Equity securities .................... $35,882 $7,032 $1,951 $40,963Bonds..................................... 943 6 949Others .................................... 5,430 246 94 5,582
18
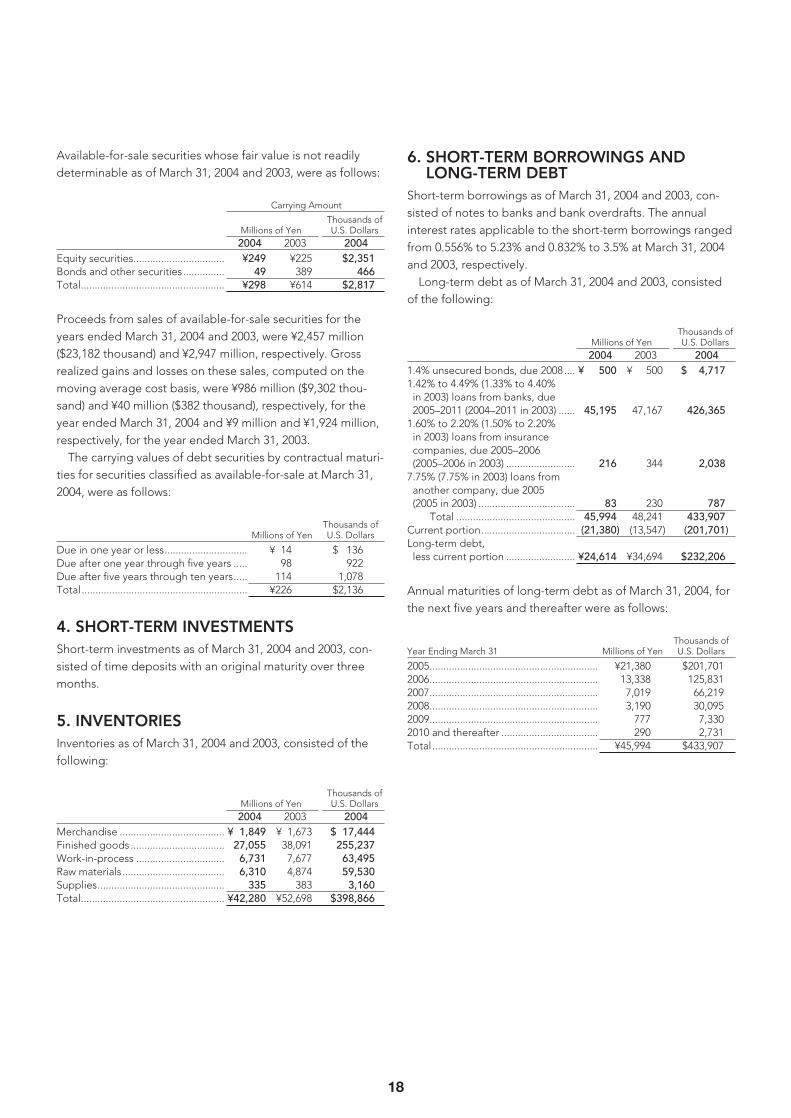
Available-for-sale securities whose fair value is not readilydeterminable as of March 31, 2004 and 2003, were as follows:
Carrying Amount
Thousands ofMillions of Yen U.S. Dollars2004 2003 2004
Equity securities................................. ¥249 ¥225 $2,351Bonds and other securities............... 49 389 466Total.................................................... ¥298 ¥614 $2,817
Proceeds from sales of available-for-sale securities for theyears ended March 31, 2004 and 2003, were ¥2,457 million($23,182 thousand) and ¥2,947 million, respectively. Grossrealized gains and losses on these sales, computed on themoving average cost basis, were ¥986 million ($9,302 thou-sand) and ¥40 million ($382 thousand), respectively, for theyear ended March 31, 2004 and ¥9 million and ¥1,924 million,respectively, for the year ended March 31, 2003.
The carrying values of debt securities by contractual maturi-ties for securities classified as available-for-sale at March 31,2004, were as follows:
Thousands of Millions of Yen U.S. Dollars
Due in one year or less.............................. ¥ 14 $ 136Due after one year through five years ..... 98 922Due after five years through ten years..... 114 1,078Total............................................................ ¥226 $2,136
4. SHORT-TERM INVESTMENTSShort-term investments as of March 31, 2004 and 2003, con-sisted of time deposits with an original maturity over threemonths.
5. INVENTORIESInventories as of March 31, 2004 and 2003, consisted of thefollowing:
Thousands ofMillions of Yen U.S. Dollars2004 2003 2004
Merchandise ...................................... ¥ 1,849 ¥ 1,673 $ 17,444Finished goods .................................. 27,055 38,091 255,237Work-in-process ................................ 6,731 7,677 63,495Raw materials..................................... 6,310 4,874 59,530Supplies.............................................. 335 383 3,160Total.................................................... ¥42,280 ¥52,698 $398,866
6. SHORT-TERM BORROWINGS ANDLONG-TERM DEBT
Short-term borrowings as of March 31, 2004 and 2003, con-sisted of notes to banks and bank overdrafts. The annualinterest rates applicable to the short-term borrowings rangedfrom 0.556% to 5.23% and 0.832% to 3.5% at March 31, 2004and 2003, respectively.
Long-term debt as of March 31, 2004 and 2003, consistedof the following:
Thousands ofMillions of Yen U.S. Dollars2004 2003 2004
1.4% unsecured bonds, due 2008.... ¥ 500 ¥ 500 $ 4,7171.42% to 4.49% (1.33% to 4.40%
in 2003) loans from banks, due 2005–2011 (2004–2011 in 2003) ...... 45,195 47,167 426,365
1.60% to 2.20% (1.50% to 2.20%in 2003) loans from insurancecompanies, due 2005–2006(2005–2006 in 2003) ......................... 216 344 2,038
7.75% (7.75% in 2003) loans fromanother company, due 2005(2005 in 2003) ................................... 83 230 787
Total ........................................... 45,994 48,241 433,907Current portion.................................. (21,380) (13,547) (201,701)Long-term debt,less current portion ......................... ¥24,614 ¥34,694 $232,206
Annual maturities of long-term debt as of March 31, 2004, forthe next five years and thereafter were as follows:
Thousands of Year Ending March 31 Millions of Yen U.S. Dollars
2005............................................................. ¥21,380 $201,7012006............................................................. 13,338 125,8312007............................................................. 7,019 66,2192008............................................................. 3,190 30,0952009............................................................. 777 7,3302010 and thereafter ................................... 290 2,731Total............................................................ ¥45,994 $433,907

19
As of March 31, 2004, the following assets were pledged tosecure long-term debt aggregating ¥20,655 million ($194,858thousand), bonds guaranteed by banks aggregating ¥500million ($4,717 thousand), and certain short-term borrowingsand current portion of long-term debt aggregating ¥26,067million ($245,920 thousand):
Thousands of Millions of Yen U.S. Dollars
Short-term investments (time deposits)... ¥ 1,000 $ 9,434Investment securities................................. 4,053 38,235Buildings—net of accumulateddepreciation............................................. 5,675 53,536
Machinery—net of accumulateddepreciation............................................. 1,658 15,643
Land ............................................................ 4,713 44,462Other .......................................................... 194 1,830Total............................................................ ¥17,293 $163,140
7. LIABILITY FOR RETIREMENT BENEFITSThe Company and most of its domestic consolidated sub-sidiaries have a severance payment and pension plan cover-ing substantially all employees. The amounts of the severanceand pension payments are, in general, determined on thebasis of length of service and current basic salary at the timeof termination of service. If the termination is involuntary, theemployee is entitled to greater payments than in the case ofvoluntary retirement. Certain foreign consolidatedsubsidiaries have a defined contribution pension plan.Retirement allowances for directors and corporate auditorsare paid subject to approval of the shareholders in accor-dance with the Japanese Commercial Code (the “Code”).Liability for retirement benefits at March 31, 2004 and 2003,included those for directors and corporate auditors in theamount of ¥210 million ($1,982 thousand) and ¥244 million,respectively.
The contributory funded defined benefit pension plan forthe Company and its domestic subsidiary, which was estab-lished under the Japanese Welfare Pension Insurance Law,has dissolved on November 19, 2002. As a result of thisdissolution, the Company and its domestic subsidiary recog-nized a gain in the amount of ¥1,963 million for the yearended March 31, 2003.
The liability for employees’ retirement benefits at March 31,2004 and 2003, consisted of the following:
Thousands ofMillions of Yen U.S. Dollars2004 2003 2004
Projected benefit obligation ............ ¥14,259 ¥15,462 $134,519Fair value of plan assets.................... (2,811) (3,272) (26,524)Unrecognized actuarial loss.............. (2,141) (2,363) (20,194)Unrecognized transitionalobligation......................................... (4,057) (4,850) (38,270)
Net liability......................................... ¥ 5,250 ¥ 4,977 $ 49,531
The components of net periodic benefit costs for the yearsended March 31, 2004 and 2003, were as follows:
Thousands ofMillions of Yen U.S. Dollars2004 2003 2004
Service cost ........................................ ¥1,074 ¥1,188 $10,138Interest cost ....................................... 296 791 2,795Expected return on plan assets........ (56) (351) (530)Amortization of transitionalobligation......................................... 676 1,095 6,378
Recognized actuarial loss ................. 273 697 2,572Special severance payments ............ 175 142 1,648Amortization of prior service cost .... (69) (649)Net periodic benefit costs ................ ¥2,369 ¥3,562 $22,352
Assumptions used for the years ended March 31, 2004 and2003, are set forth as follows:
2004 2003
Discount rate:Parent and domestic subsidiaries .................... 2.0% 2.5%Consolidated foreign subsidiaries ................... 6.5%
Expected rate of return on plan assets ................ 2.5% 2.5%Amortization period of prior service cost ............ 1 yearRecognition period of actuarial gain/loss............ 10 years 10 yearsAmortization period of transitional obligation.... 10 years 10 years
20
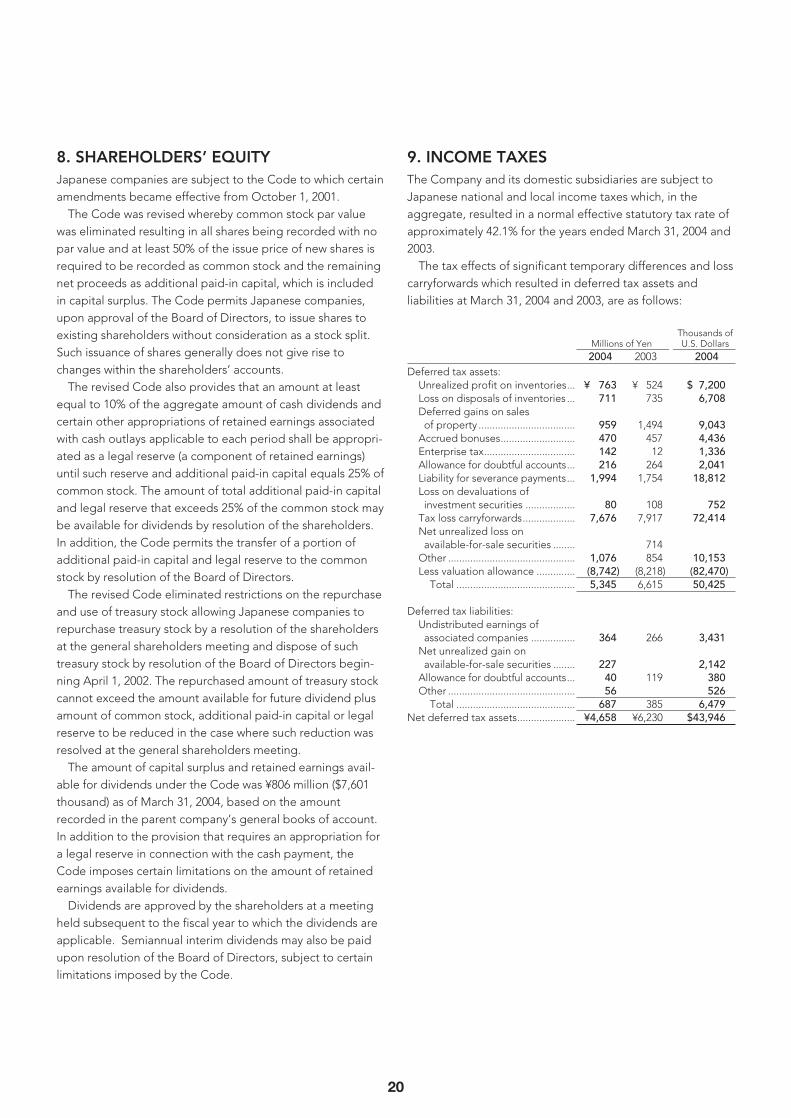
8. SHAREHOLDERS’ EQUITYJapanese companies are subject to the Code to which certainamendments became effective from October 1, 2001.
The Code was revised whereby common stock par valuewas eliminated resulting in all shares being recorded with nopar value and at least 50% of the issue price of new shares isrequired to be recorded as common stock and the remainingnet proceeds as additional paid-in capital, which is includedin capital surplus. The Code permits Japanese companies,upon approval of the Board of Directors, to issue shares toexisting shareholders without consideration as a stock split.Such issuance of shares generally does not give rise tochanges within the shareholders’ accounts.
The revised Code also provides that an amount at leastequal to 10% of the aggregate amount of cash dividends andcertain other appropriations of retained earnings associatedwith cash outlays applicable to each period shall be appropri-ated as a legal reserve (a component of retained earnings)until such reserve and additional paid-in capital equals 25% ofcommon stock. The amount of total additional paid-in capitaland legal reserve that exceeds 25% of the common stock maybe available for dividends by resolution of the shareholders.In addition, the Code permits the transfer of a portion ofadditional paid-in capital and legal reserve to the commonstock by resolution of the Board of Directors.
The revised Code eliminated restrictions on the repurchaseand use of treasury stock allowing Japanese companies torepurchase treasury stock by a resolution of the shareholdersat the general shareholders meeting and dispose of suchtreasury stock by resolution of the Board of Directors begin-ning April 1, 2002. The repurchased amount of treasury stockcannot exceed the amount available for future dividend plusamount of common stock, additional paid-in capital or legalreserve to be reduced in the case where such reduction wasresolved at the general shareholders meeting.
The amount of capital surplus and retained earnings avail-able for dividends under the Code was ¥806 million ($7,601thousand) as of March 31, 2004, based on the amountrecorded in the parent company’s general books of account.In addition to the provision that requires an appropriation fora legal reserve in connection with the cash payment, theCode imposes certain limitations on the amount of retainedearnings available for dividends.
Dividends are approved by the shareholders at a meetingheld subsequent to the fiscal year to which the dividends areapplicable. Semiannual interim dividends may also be paidupon resolution of the Board of Directors, subject to certainlimitations imposed by the Code.
9. INCOME TAXESThe Company and its domestic subsidiaries are subject toJapanese national and local income taxes which, in theaggregate, resulted in a normal effective statutory tax rate ofapproximately 42.1% for the years ended March 31, 2004 and2003.
The tax effects of significant temporary differences and losscarryforwards which resulted in deferred tax assets andliabilities at March 31, 2004 and 2003, are as follows:
Thousands ofMillions of Yen U.S. Dollars2004 2003 2004
Deferred tax assets:Unrealized profit on inventories... ¥ 763 ¥ 524 $ 7,200Loss on disposals of inventories ... 711 735 6,708Deferred gains on sales
of property ................................... 959 1,494 9,043Accrued bonuses........................... 470 457 4,436Enterprise tax................................. 142 12 1,336Allowance for doubtful accounts... 216 264 2,041Liability for severance payments... 1,994 1,754 18,812Loss on devaluations of
investment securities .................. 80 108 752Tax loss carryforwards................... 7,676 7,917 72,414Net unrealized loss on
available-for-sale securities ........ 714Other .............................................. 1,076 854 10,153Less valuation allowance .............. (8,742) (8,218) (82,470)
Total ........................................... 5,345 6,615 50,425
Deferred tax liabilities:Undistributed earnings of
associated companies ................ 364 266 3,431Net unrealized gain on
available-for-sale securities ........ 227 2,142Allowance for doubtful accounts... 40 119 380Other .............................................. 56 526
Total ........................................... 687 385 6,479Net deferred tax assets..................... ¥4,658 ¥6,230 $43,946

21
A reconciliation between the normal effective statutory taxrate and the actual effective tax rates reflected in the accom-panying consolidated statements of operations for the yearsended March 31, 2004 and 2003 is as follows:
2004 2003
Normal effective statutory tax rate....................... 42.1% 42.1 %Lower income tax rates applicable toincome in certain foreign countries.................... (27.2) 38.0
Reversal of dividend income inconsolidated subsidiaries.................................... 21.1 (76.9)
Reversal of loss on sales of investments inconsolidated subsidiaries.................................... (84.3)
Reversal of unrealized profits and loss oninvestments in consolidated subsidiaries .......... 12.8
Deficit of consolidated subsidiaries ..................... 29.3 (93.7)Unrealized profits without recognition ofdeferred tax.......................................................... (9.4) 66.1
Unrealized loss without recognition ofdeferred tax.......................................................... 12.2
Loss on impairment of consolidation goodwill ... (52.8)Inhabitant tax per capita levy................................ 3.5 (10.9)Other—net ............................................................. (11.5) (29.7)Actual effective tax rate......................................... 72.9% (202.1)%
At March 31, 2004, the Company and certain subsidiarieshave tax loss carryforwards aggregating approximately¥25,334 million ($238,998 thousand) which are available to beoffset against taxable income of each company in futureyears. These tax loss carryforwards, if not utilized, will expireas follows:
Thousands of Year Ending March 31 Millions of Yen U.S. Dollars
2005............................................................. ¥ 17 $ 1622006............................................................. 209 1,9702007............................................................. 62 5832008............................................................. 1 142009 and thereafter ................................... 25,045 236,269Total............................................................ ¥25,334 $238,998
10. RELATED PARTY TRANSACTIONSTransactions of the Group with unconsolidated subsidiariesand associated companies for the years ended March 31,2004 and 2003, were as follows:
Thousands ofMillions of Yen U.S. Dollars2004 2003 2004
Sales to............................................... ¥ 22 ¥ 48 $ 207Purchases from .................................. 402 553 3,793Trade notes andaccounts receivable......................... 4 11 40
Trade notes and accounts payable... 112 118 1,056
11. RESEARCH AND DEVELOPMENTCOSTS
Research and development costs charged to income were¥4,665 million ($44,008 thousand) and ¥5,031 million for theyears ended March 31, 2004 and 2003, respectively.
12. LEASESThe Group leases certain machinery, computer equipmentand other assets.
Lease payments under finance leases, where the ownershipof the property is not deemed to transfer to the lessee, were¥1,586 million ($14,965 thousand) and ¥1,564 million for theyears ended March 31, 2004 and 2003, respectively.
Pro forma information of leased property such as acquisi-tion cost, accumulated depreciation, obligations underfinance leases, depreciation expense, interest expense offinance leases that do not transfer ownership of the leasedproperty to the lessee on an “as if capitalized” basis for theyears ended March 31, 2004 and 2003, was as follows:
Millions of Yen
2004Machinery Furniture
and andEquipment Fixtures Software Total
Acquisition cost ....................... ¥2,038 ¥2,523 ¥1,374 ¥5,935Accumulated depreciation ..... 1,071 1,345 629 3,045Net leased property ................ ¥ 967 ¥1,178 ¥ 745 ¥2,890
Thousands of U.S. Dollars
2004Machinery Furniture
and andEquipment Fixtures Software Total
Acquisition cost ....................... $19,227 $23,799 $12,965 $55,991Accumulated depreciation ..... 10,108 12,687 5,936 28,731Net leased property ................ $ 9,119 $11,112 $ 7,029 $27,260
Millions of Yen
2003Machinery Furniture
and andEquipment Fixtures Software Total
Acquisition cost ....................... ¥1,983 ¥2,869 ¥1,642 ¥6,494Accumulated depreciation ..... 1,004 1,411 546 2,961Net leased property ................ ¥ 979 ¥1,458 ¥1,096 ¥3,533
Obligations under finance leases:
Thousands ofMillions of Yen U.S. Dollars2004 2003 2004
Due within one year .......................... ¥1,229 ¥1,302 $11,594Due after one year............................. 1,788 2,301 16,866Total.................................................... ¥3,017 ¥3,603 $28,460

22
The imputed interest expense portion which is computedusing the interest method is excluded from the above obliga-tions under finance leases.
Depreciation expense and interest expense under financeleases:
Thousands ofMillions of Yen U.S. Dollars2004 2003 2004
Depreciation expense....................... ¥1,534 ¥1,490 $14,475Interest expense ................................ 65 78 613Total.................................................... ¥1,599 ¥1,568 $15,088
Depreciation expense and interest expense, which are notreflected in the accompanying consolidated statements ofoperations, are computed by the straight-line method andthe interest method, respectively.
The minimum rental commitments under noncancelableoperating leases at March 31, 2004 and 2003, were as follows:
Thousands ofMillions of Yen U.S. Dollars2004 2003 2004
Due within one year .......................... ¥ 458 ¥ 581 $ 4,321Due after one year............................. 623 861 5,873Total.................................................... ¥1,081 ¥1,442 $10,194
13. CONTINGENT LIABILITIESContingent liabilities at March 31, 2004 were as follows:
Thousands of Millions of Yen U.S. Dollars
Trade notes discounted with banks ......... ¥3,589 $33,860Guarantees and similaritems of bank loans.................................. 518 4,882
14. DERIVATIVESThe Group enters into derivatives including comprehensiveforeign exchange forward contracts, currency swaps, interestrate swaps and interest rate caps. The Group enters intoderivatives, in the normal course of business, to reduce theexposure to fluctuations in foreign exchange rates and interest rates. The Group does not hold derivatives for speculation.
Derivatives are subject to market risk and credit risk.Market risk is the exposure created by potential fluctuationsin market conditions, including interest or foreign exchangerates. Since most of the Group’s derivative transactions arerelated to qualified hedges of underlying business exposures,market gain or loss risk in the derivative instruments is basi-cally offset by opposite movements in the value of thehedged assets or liabilities. Because the counterparties tothose derivatives are limited to major international financialinstitutions, the Group does not anticipate any losses arisingfrom credit risk.
The basic policies for the use of derivatives are approvedby the Board of Directors and the execution and control ofderivatives are controlled by the Finance Department. Eachderivative transaction is periodically reported to the Board ofDirectors, where evaluation and analysis of derivatives aremade.
The Group had the following derivatives contracts out-standing at March 31, 2004 and 2003:
Millions of Yen
2004Contract or
Notional UnrealizedAmount Fair Value Gain/Loss
Foreign currencyforward contracts:
Selling U.S.$ ......................... ¥8,676 ¥8,655 ¥21Selling EUR........................... 3,314 3,271 43
Currency swaps........................ 1,079 (17) (17)
Millions of Yen
2003Contract or
Notional UnrealizedAmount Fair Value Gain/Loss
Foreign currencyforward contracts:
Selling U.S.$ ......................... ¥4,180 ¥4,202 ¥(22)Selling EUR........................... 1,229 1,295 (66)
Currency swaps........................ 1,079 9 9
Thousands of U.S. Dollars
2004Contract or
Notional UnrealizedAmount Fair Value Gain/Loss
Foreign currencyforward contracts:
Selling U.S.$ ......................... $81,847 $81,650 $197Selling EUR........................... 31,263 30,855 408
Currency swaps........................ 10,179 (165) (165)
Derivatives which qualify for hedge accounting for the yearsended March 31, 2004 and 2003, are excluded from thedisclosure of market value information.
The contract or notional amounts of derivatives which areshown in the above table do not represent the amountsexchanged by the parties and do not measure the Group’sexposure to credit or market risk.

23
15. SEGMENT INFORMATIONInformation about industry segments, geographic segments and sales to foreign customers of the Group for the years endedMarch 31, 2004 and 2003, is as follows:
(1) Industry Segmentsa. Sales and Operating Income (Loss)
Millions of Yen
2004Electronic
Industrial Sewing Home Sewing Assembly and Eliminations/Machines Machines Test Systems Other Corporate Consolidated
Sales to customers..................................... ¥59,607 ¥13,592 ¥17,592 ¥29,834 ¥120,625Intersegment sales..................................... 493 39 2,398 ¥(2,930)
Total sales............................................... 60,100 13,631 17,592 32,232 (2,930) 120,625Operating expenses .................................. 54,082 12,043 18,719 29,377 (1,308) 112,913Operating income (loss) ............................ ¥ 6,018 ¥ 1,588 ¥ (1,127) ¥ 2,855 ¥(1,622) ¥ 7,712
b. Assets, Depreciation and Capital Expenditures
Millions of Yen
2004Electronic
Industrial Sewing Home Sewing Assembly and Eliminations/Machines Machines Test Systems Other Corporate Consolidated
Assets.......................................................... ¥60,285 ¥7,030 ¥18,546 ¥17,239 ¥15,463 ¥118,563Depreciation .............................................. 2,044 149 447 436 313 3,389Capital expenditures ................................. 1,505 180 710 658 295 3,348
a. Sales and Operating Income (Loss)
Thousands of U.S. Dollars
2004Electronic
Industrial Sewing Home Sewing Assembly and Eliminations/Machines Machines Test Systems Other Corporate Consolidated
Sales to customers..................................... $562,333 $128,222 $165,967 $281,452 $1,137,974Intersegment sales..................................... 4,649 374 22,623 $(27,646)
Total sales............................................... 566,982 128,596 165,967 304,075 (27,646) 1,137,974Operating expenses .................................. 510,208 113,616 176,596 277,144 (12,341) 1,065,223Operating income (loss) ............................ $ 56,774 $ 14,980 $ (10,629) $ 26,931 $(15,305) $ 72,751

24
b. Assets, Depreciation and Capital Expenditures
Thousands of U.S. Dollars
2004Electronic
Industrial Sewing Home Sewing Assembly and Eliminations/Machines Machines Test Systems Other Corporate Consolidated
Assets.......................................................... $568,729 $66,318 $174,958 $162,635 $145,876 $1,118,516Depreciation .............................................. 19,284 1,401 4,219 4,117 2,955 31,976Capital expenditures ................................. 14,193 1,698 6,699 6,206 2,786 31,582
a. Sales and Operating Income (Loss)
Millions of Yen
2003Electronic
Industrial Sewing Home Sewing Assembly and Eliminations/Machines Machines Test Systems Other Corporate Consolidated
Sales to customers..................................... ¥67,445 ¥14,098 ¥11,204 ¥25,809 ¥118,556
Intersegment sales..................................... 326 44 1,614 ¥(1,984)
Total sales............................................... 67,771 14,142 11,204 27,423 (1,984) 118,556
Operating expenses .................................. 57,813 12,862 15,938 25,428 349 112,390
Operating income (loss) ............................ ¥ 9,958 ¥ 1,280 ¥ (4,734) ¥ 1,995 ¥(2,333) ¥ 6,166
b. Assets, Depreciation and Capital Expenditures
Millions of Yen
2003Electronic
Industrial Sewing Home Sewing Assembly and Eliminations/Machines Machines Test Systems Other Corporate Consolidated
Assets.......................................................... ¥75,841 ¥6,556 ¥21,402 ¥12,980 ¥22,233 ¥139,012
Depreciation .............................................. 2,238 240 843 387 325 4,033
Capital expenditures ................................. 2,945 209 367 430 300 4,251
25
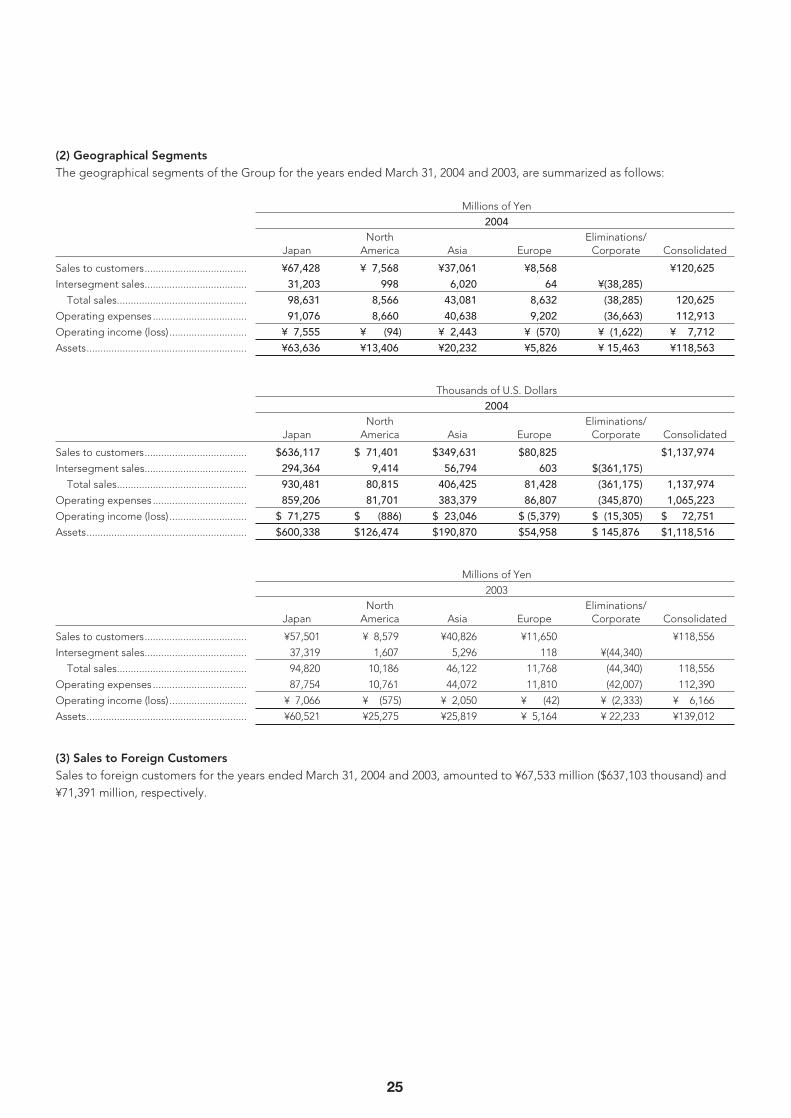
(2) Geographical SegmentsThe geographical segments of the Group for the years ended March 31, 2004 and 2003, are summarized as follows:
Millions of Yen
2004North Eliminations/
Japan America Asia Europe Corporate Consolidated
Sales to customers..................................... ¥67,428 ¥ 7,568 ¥37,061 ¥8,568 ¥120,625Intersegment sales..................................... 31,203 998 6,020 64 ¥(38,285)
Total sales............................................... 98,631 8,566 43,081 8,632 (38,285) 120,625Operating expenses .................................. 91,076 8,660 40,638 9,202 (36,663) 112,913Operating income (loss) ............................ ¥ 7,555 ¥ (94) ¥ 2,443 ¥ (570) ¥ (1,622) ¥ 7,712Assets.......................................................... ¥63,636 ¥13,406 ¥20,232 ¥5,826 ¥ 15,463 ¥118,563
Thousands of U.S. Dollars
2004North Eliminations/
Japan America Asia Europe Corporate Consolidated
Sales to customers..................................... $636,117 $ 71,401 $349,631 $80,825 $1,137,974Intersegment sales..................................... 294,364 9,414 56,794 603 $(361,175)
Total sales............................................... 930,481 80,815 406,425 81,428 (361,175) 1,137,974Operating expenses .................................. 859,206 81,701 383,379 86,807 (345,870) 1,065,223Operating income (loss) ............................ $ 71,275 $ (886) $ 23,046 $ (5,379) $ (15,305) $ 72,751Assets.......................................................... $600,338 $126,474 $190,870 $54,958 $ 145,876 $1,118,516
Millions of Yen
2003North Eliminations/
Japan America Asia Europe Corporate Consolidated
Sales to customers..................................... ¥57,501 ¥ 8,579 ¥40,826 ¥11,650 ¥118,556
Intersegment sales..................................... 37,319 1,607 5,296 118 ¥(44,340)
Total sales............................................... 94,820 10,186 46,122 11,768 (44,340) 118,556
Operating expenses .................................. 87,754 10,761 44,072 11,810 (42,007) 112,390
Operating income (loss) ............................ ¥ 7,066 ¥ (575) ¥ 2,050 ¥ (42) ¥ (2,333) ¥ 6,166
Assets.......................................................... ¥60,521 ¥25,275 ¥25,819 ¥ 5,164 ¥ 22,233 ¥139,012
(3) Sales to Foreign CustomersSales to foreign customers for the years ended March 31, 2004 and 2003, amounted to ¥67,533 million ($637,103 thousand) and¥71,391 million, respectively.

26
INDEPENDENT AUDITORS’ REPORT
To the Board of Directors ofJUKI CORPORATION:
We have audited the accompanying consolidated balance sheets of JUKI CORPORATION (the “Company”) and
consolidated subsidiaries as of March 31, 2004 and 2003, and the related consolidated statements of operations,
shareholders’ equity, and cash flows for the years then ended, all expressed in Japanese yen. These consolidated
financial statements are the responsibility of the Company’s management. Our responsibility is to express an opin-
ion on these consolidated financial statements based on our audits.
We conducted our audits in accordance with auditing standards generally accepted in Japan. Those standards
require that we plan and perform the audit to obtain reasonable assurance about whether the financial statements
are free of material misstatement. An audit includes examining, on a test basis, evidence supporting the amounts
and disclosures in the financial statements. An audit also includes assessing the accounting principles used and
significant estimates made by management, as well as evaluating the overall financial statement presentation. We
believe that our audits provide a reasonable basis for our opinion.
In our opinion, the consolidated financial statements referred to above present fairly, in all material respects, the
consolidated financial position of JUKI CORPORATION and consolidated subsidiaries as of March 31, 2004 and
2003, and the consolidated results of their operations and their cash flows for the years then ended in conformity
with accounting principles generally accepted in Japan.
Our audits also comprehended the translation of Japanese yen amounts into U.S. dollar amounts and, in our opin-
ion, such translation has been made in conformity with the basis stated in Note 1. Such U.S. dollar amounts are
presented solely for the convenience of readers outside Japan.
June 29, 2004
Deloitte Touche TohmatsuMS Shibaura Building4-13-23, ShibauraMinato-ku, Tokyo 108-8530 Japan
Tel: +81(3)3457 7321Fax: +81(3)3457 1694www.deloitte.com/jp

27
Corporate Data
SHAREHOLDERS’ GUIDE
Trade nameJUKI CORPORATION
EstablishedDecember 15,1938
Paid-in Capital¥9,941million
Authorized Shares400,000,000 shares
Issued and Outstanding Shares 101,375,990 shares
Shareholders13,573 shareholders
Employees1,033 employees
Stock ListingTokyo Stock Exchange(1st Section)
Transfer Agent and RegistrarMizuho Trust and Banking Co., Ltd.5-1, Marunouchi 1-chome, Chiyoda-ku,Tokyo 100-0005, Japan
Independent AuditorDeloitte Touche TohmatsuMS Shibaura Building13-23, Shibaura 4-chome, Minato-ku,Tokyo 108-8530, Japan
(As of March 31, 2004)
BOARD OF DIRECTORS
ChairmanTakeo Yamaoka
PresidentKazuyuki Nakamura
Senior Managing DirectorShigeyoshi Suzuki
Managing DirectorsTomohisa MiyakeHiroshi Kawano
DirectorMasakuni Fujita
Corporate AuditorsShinya KawamuraHiroshi Tabata
AuditorsSeiji KuritaMasahiro Watanabe
All the directors hold the posts of executiveofficers concurrently.
(As of June 29, 2004)
MAJOR OFFICE AND PLANT
Head office8-2-1, Kokuryo-cho, Chofu-shi,Tokyo 182-8655, JapanTel: 81-3-3480-1111Fax: 81-3-3488-4055
Central R&D Laboratory3-17-14, Funabashi, Setagaya-ku, Tokyo 156-0055, JapanTel: 81-3-5429-3120Fax: 81-3-5429-3154
Ohtawara Plant1863, Kita-kanemaru, Ohtawara-shi,Tochigi 324-0011, JapanTel: 81-287-23-5111Fax: 81-287-23-5594
EXECUTIVE OFFICERS
Executive Managing OfficerTadashi Sasaki
Senior Executive OfficersToshikazu NakanoIsao Kamimura
Executive OfficersTsutomu YoshidaTakashi Mizuno
(As of June 29, 2004)

28
<< Holding Companies >>JUKI AMERICAS HOLDING INC.One Union Special Plaza, Huntley, IL. 60142 U.S.A.Tel: 1-847-669-4502Fax: 1-847-669-4258
JUKI (CHINA) CO., LTD.19F New Town Center 83 LouShanGuan Rd. ShanghaiP.R.ChinaTel: 86-21-6236-8822Fax: 86-21-6236-8821
JUKI EUROPEAN HOLDINGS B.V.Holland Office Center 5, Kruisweg 795A 2132 NGHoofddorp, The NetherlandsTel: 31-23-5542060Fax: 31-23-5542069
<< Manufacturers >>UNION SPECIAL CORPORATION(Manufacture of industrial sewing machines for knitting)One Union Special Plaza, Huntley IL 60142, U.S.A. 019-0793Tel: 1-847-669-5101Fax: 1-847-669-4258http://www.unionspecial.com/
SHANGHAI JUKI SEWING MACHINE CO., LTD.(Manufacture of household and industrial sewing machines)288 Yuyangroad, Suite #a6-7 Cangqiao Industrial AreaSongjiang District, Shanghai, 201600, P.R.ChinaTel: 86-21-57736080Fax: 86-21-57736018
JUKI (NINGBO) CLOTHES EQUIPMENT INDUSTRIAL CO.,LTD.(Manufacture of sewing machines parts)Mao Shan Industry Zone, Yinxian Ningbo, P.R.ChinaTel: 86-574-88466299Fax: 86-574-8466584
JUKI (NINGBO) PRECISION INDUSTRIAL CO., LTD.Mao Shan Industry Zone, YinZhou, Ningbo. P.R.China315193Tel: 0574-88466724Fax: 0574-88466584
JUKI XINXING INDUSTRY CO., LTD.(Manufacture of sewing machines and parts)No.160 Guangyang Road, Langfang City, Hebei, P.R.ChinaTel: 86-316-233-5100Fax: 86-316-211-1733
JUKI (SHANGHAI) INDUSTRIAL CO., LTD.(Manufacture of sewing machines and parts)No.435 Xingpin Road Jiading, Shanghai 201818, P.R.ChinaTel: 86-21-5951-2020Fax: 86-21-5951-2525
JUKI (VIETNAM) CO., LTD.(Manufacture of sewing machines and parts)Tan Thuan Epz, Tan Thuan Dong Word, Dist Nha Be, Ho ChiMinh City, VietnamTel: 84-8-7701441Fax: 84-8-7701446
<< Related Industrial Sewing Machine >>JUKI (MIDDLE EUROPE) GMBHWalter Business-Park, Iz N-S D, Str.7, Object 58/D4, A-2351Wiener Neudorf, AustriaTel: 43-2236-64480Fax: 43-2236-64490 http://www.juki.at/
JUKI (EUROPE) GMBHKieler Strasse 303A, 22525 Hamburg, GermanyTel: 49-40-54886-0Fax: 49-40-54886-129http://www.juki.de/
JUKI (HONG KONG) LTD.Units 190&1911-12, Level 19, Metroplaza Tower II, 223Hing Fong Road, Kwai Fong, N.T., Hong KongTel: 852-2423-7888Fax: 852-2423-7121
JUKI SINGAPORE PTE. LTD.20 Bendeemer Road #04-12, Cyberhub, Singapore 339914,SingaporeTel:65-65534388Fax:65-65525565
JUKI UNION SPECIAL, INC. HEADQUARTERS8500 N.W. 17th Street Suite 100 Miami, FL 33126 U.S.A.Tel: 1-305-594-0059Fax: 1-305-594-0720http://www.juki.com/jus.html/
<< Related Surface Mount Technology System >>JUKI AUTOMATION SYSTEMS, AGWeissensteinstrasse 81, CH 4500 Solothurm, SwitzerlandTel: 41-32-626-2929Fax: 41-32-626-2930http://www.jas-smt.com/
JUKI AUTOMATION SYSTEMS, INC. (NC)507, Airport Blvd., Morrisville, NC 27560 U.S.A.Tel: 1-919-460-0111Fax: 1-919-469-0480http://www.jas-smt.com/
TOKYO JUKI INTERNATIONAL TRADING (SHANGHAI)CO., LTD.1907 New Town Center 83 LouShanGuan Rd. ShanghaiTel: 021-6236-8206Fax: 021-6236-8110
Overseas Offices
Printed on recycled paper in Japan
8-2-1, Kokuryo-cho, Chofu-shi, Tokyo 182-8655, JapanT e l: 81-3-3480-1111 F a x: 81-3-3488-4055U R L: http://www.juki.co.jpE-Mail: [email protected]