julio boltvinick · expanding gross domestic product (gdp). to address this problem, desai, sen and...
TRANSCRIPT
Relatório de Atividades 2010
Conselho de Desenvolvimento Econômico e Social
52
the urgent need of consolidating compatibility indicators between human activities and the situation •of existing resources: this refers essentially to the ecological input, that requires not only knowing what the annual consumption of a resource is, but also knowing what the regenerative annual capacity of the planet is12.the utility of the indicators of inequality, which could be broadened to all types of capital and incomes, •and without which the economic statistics, often considered by half, does not sincerely describe the reality experienced by the individuals. A ranking such as the HDI could, for example, with excellent outcomes, create an alternative classification for annual human development production completely aggregated, based on the mediums of each variable in place and the location of their variables. Indeed, nothing keeps us from computing medium hope, a medium level of psychometric tests to measure education, a medium life standard per capita. We would thus obtain a measure of the level of development of each human being.
Julio BoltvinickJulio Boltvinick Kalinka is an Economist, has a PhD in Social Sciences at the Center for Research and Superior Studies in Social Anthropology from the West (CIESA) and is honorary doctorate by the College of Mexico
Conceiving and Measuring Social Progress. Two Approaches
Introduction
In this paper, two alternative views on social progress are presented, respectively, in the First and Second parts in which this paper is divided. Their nature is quite diverse. One, presented in the First part is a view of social progress from within the paradigm of economic well-being to which the concept of the direct sources of well-being is added, so that it produces a broader approach to social progress as a result of, on the one hand, of incorporating all the sources of well-being, especially time and knowledge/abilities, and on the other hand, as a result of incorporating not only average results but inequality as well in all the components. The other view, presented in the Second Part, is a view of Social Progress from outside the paradigm of economic well-being, which links wealth/poverty with human flourishing and which distinguishes human wealth/poverty from economic wealth/poverty. In the first case the proposed indices are applied to data for Mexico in the 1981-2000 period. In the second case, measurement is still a challenge. Both approaches might be valid depending on our aims, but the second one goes much deeper in to what matters for a human life.
First part. A view of social progress from within the paradigm of economic well-being
In this first part, Social Progress is seen from within the paradigm of economic well-being. This part is divided in three sections. In the first, the concept of sources of well–being, which plays a central role in this approach, is broached. In the second and third the two components of the Social Progress Index (the Opportunity Set and the Achievement Set) are explained and their application is exemplified with Mexican data.
1. The sources of well-being
The well-being of individuals and households depends on the following direct sources of well-being: (1) current income; (2) family patrimony, understood as the set of durable goods and assets that provide households with basic services; (3) non-basic assets and households’ borrowing capacity; (4) access to governmental free goods and services; (5) available time for rest, domestic work, education and leisure; and (6) individual knowledge, understood not as a means to obtain income, but as a direct satisfier of the human need for understanding.
12 This brings an end to a supplementary difficulty: should we, in fact, consider that the exhaustible resources are depleted by the consumers or by the legal owners of these resources? If we assume these are resources related to the land, and that, therefore, each individual (living in or that will live in the planet) has the right to consume a small part of these resources, then we would have to assign responsibility to the consumers. Yet, the adjusted income of the rich will be strongly reduced because their way of consumption takes out more from the planet if compared to the poor. It is the Gabonese that consumes today what his children will not consume tomorrow, when oil will have been depleted. This arbitrage is very delicate. The problem is, obviously, imposing today because of CO2 emissions. The Chinese industry issues CO2 in order to manufacture the products that are consumed by the OECD: is this CO2 the reason of China’s industrial specialization and, therefore, it should be assigned to the final polluters, that is, those that consume them? This is evidently core and has multiple dimensions (agriculture, water, transportation)?

Relatório de Atividades 2010
Conselho de Desenvolvimento Econômico e Social
53
The first three categories represent private economic resources, in the form of either flows or stocks; the fourth category represents the flow of public economic resources (the so-called social wage). Together, the first four categories represent economic resources that can be expressed in monetary terms. The fifth and sixth categories have their own units of measurement, which are not reducible to monetary value. In sum, economic resources, free time and knowledge are the three irreducible dimensions of sources of well-being.
These six sources of well-being display two notable characteristics. The first is their degree of substitutability. Dis-saving non-basic assets or borrowing can substitute for low current income without affecting the satisfaction of other present needs. However, the same is not true for basic assets because selling basic assets in order to compensate for low current income would affect the satisfaction of other needs. Thus, if an individual draws down bank savings (a non-basic asset), he or she can maintain current private consumption. But if that individual takes his or her television, refrigerator or bed to the pawnshop, the gain in liquidity is offset by a loss in terms of the basic services these assets provide. More current income can substitute for a lack of access to free services (for example, by paying for private education and health care) and for a lack of family patrimony (by renting a house or a furnished apartment). Nevertheless, this substitutability has limits. More income cannot compensate for the lack of free time or ignorance.
The fact that there is not total substitutability among sources of well-being is related to their second characteristic: their specificity. Generally speaking, these sources are not generic, and they do not satisfy all needs. However, there are diverse degrees of specificity among different sources. Although current monetary income and non-basic assets permit the satisfaction of a broad range of needs (in principle, any need that can be satisfied through the consumption of goods and services available on the market), other sources are more specific. Non-monetary current income and basic patrimony take the form of specific goods that provide defined services (for example corn, a house, a table). Therefore, they can only satisfy specific needs. Government social policy usually provides goods and services in kind (education, health care, food) associated to a specific need.13
From another perspective, one or several well-being sources may be required in order to meet each need. For example, increasing a child’s knowledge requires the child to attend school. This, in turn, implies devoting personal time to this effort. The government may freely provide school services, but the child will need school supplies, appropriate clothing and transportation, needs usually met through the market and financed by current family income or dis-savings. Feeding the family members usually requires both income and domestic work, which involves the use of time.
Well-being trends in a society are a function of changes in the level and distribution among individuals of the six sources of well-being outlined above. At the same time, the level and distribution of each source have specific determinants. For example, household’s average real income in any given year is determined by current conditions in the broader economy and the factors that shape them, including macroeconomic policy. Access to free government goods and services, in terms of both level and distribution, depends almost entirely on social policy (expressed in public expenditures for social well-being) and its supporting legislation. Free time depends on customs regarding the length of the work day, on weekly and annual rest periods, and, inversely, on household income (households with less income will feel pressure to extend the work day) and individual preferences. Although the determinants of the sources of each well-being source are quite different, this does not mean that they are fully independent of one another. Free time and social policy, for example, may be influenced (although not mechanically determined) by what is happening in the economy.
The well-being of the population, in turn, is the fundamental determinant of mortality rates for specific age groups, as demonstrated by the empirical relationship between living standards and life expectancy at birth between countries.
To summarize, social well-being is determined by multiple sources whose evolution over time may vary because their determinants are diverse. Therefore, when studying well-being trends in a society (whether from a micro-social or a macro-social perspective), one must take the diverse sources of human well-being and their determinants into account.
13 Or, in the language of classical political economy and Marxism, monetary incomes are exchange values expressed in amounts of the general equivalent that can be transformed into almost any use-value through market exchange. Non-monetary income, basic patrimony, and goods and services freely provided by the government are specific use-values.
Relatório de Atividades 2010
Conselho de Desenvolvimento Econômico e Social
54
2. The Opportunity Set for Social Well-being (OSSW) as measurement of the potential for well-being
Evaluating development requires a vision other than the predominant view, which reduces “development” to expanding gross domestic product (GDP). To address this problem, Desai, Sen and Boltvinik (1992) developed an alternative approach, called the Social Progress Index that, while not denying the role of growth, defines human well-being as the sole objective of development. The index embraces two complementary perspectives: the opportunity set and the achievement set. The former focuses on the availability of goods, services, free time and knowledge—as well as the fairness of their distribution—in relation to needs, providing a macro-social view of the potential for well-being. The latter is a micro-social evaluation of the well-being actually achieved at the household level. This section presents calculations of the opportunity set in Mexico during the 1981–2000 period. The measurement of poverty and social stratification performed with the Integrated Poverty Measurement Method (IPMM) may be taken as an approximation of the achievement set.14
In order to quantify the opportunity set for social well-being, one must consider several factors: (1) the available volume of goods and services in relation to the population’s needs, along with equality in the distribution of access to them; (2) available free time or its complement—working time—as well as its social distribution; and (3) the level and distribution of knowledge in the population. I have explored two possibilities for weighting these three dimensions. The first is to give them equal weight; the second is to accord half the weight to the first dimension, because of its broader nature, with the other two dimensions receiving the other half. The second option—the one followed here—is more faithful to the actual circumstances affecting social well-being.
This analysis incorporates the following variables: (1) Total consumption (TC), rather than the more usual GDP, as an indicator of the availability of goods and services—the “size of the pie”; (2) the standardized size of the population, expressed as number of adult equivalents (AE), as an indicator of the size of needs (the “hunger” of those at the table); (3) the Gini coefficient for income distribution among households as an indicator of inequality in the distribution of access to goods and services (how the pie is distributed); (4) an indicator of free time (FT) based on observed extra-domestic excess work (EW) and on domestic work requirements; (5) an indicator of equality in free time (6) an indicator of educational achievement (EA); and (7) an indicator of equality of distribution of educational achievement.15
Total Consumption (TC), which is the sum of private and governmental (public) consumption as defined in national accounts, is a better indicator than GDP of the size of the pie because it excludes asset depreciation (the consumption of fixed capital), the income of non residents in the country. It approximates National Disposable Income (NDY) which is the sum of private consumption, public consumption and net savings. The difference between TC and NDY is only net savings. Total Consumption is an expression of the social capacity to attain a certain living standard. It expresses somehow the first four sources of well-being, all of which are material resources that can be expressed in monetary terms.
The number of equivalent adults (EA)16 is a better indicator than population size of the evolution of needs because, in addition to the overall number of people it takes age and gender structures into account. To the extent that adults have greater needs than children or infants, the aging of the Mexican population means a faster growth in needs than what demographic growth alone would suggest.
Dividing TC by EA yields the size of the pie by unit of need, or total consumption per equivalent adult (TCEA). Its values for selected years between 1981 and 2000 appear in Table 1. If TCEA increases, the availability of goods and services per unit of need rises.
The Gini coefficient is the best known and most widely used measure of income inequality. When the coefficient equals 1, there is total inequality in the distribution of income (one household perceives all the income); when it equals zero, there is total equality. Its complement—the value that results from 1.0 minus the Gini coefficient—is a measure of equality in income distribution (Table 1). Multiplying TCEA by the Gini
14 The approach to the achievement set adopted here differs in some respects from that developed by Desai (1992) in Desai, Sen and Boltvinick (1992). For a comparison between both, see Boltvinick (1993 and 1994)15 The set of variables originally presented in Boltvinick (1992) included the first five elements but not the last two. In this reference it is suggested that the indicator of availability of goods and services be adjusted so as to reflect destruction of the environment and by excluding the production of harmful or destructive goods, such as cigarettes or weapons. These issues are not addressed in this chapter.16 Strictly, given the way I have calculated it, using caloric requirements for age/sex groups, the result is an adult male equivalent, but the name is complicated and confusing, so for simplicity I express it as “adult equivalent”. Transforming number of people into adult equivalents is a standard procedure in poverty and well-being studies. A very good review of the (huge) literature in the topic is Deaton and Mullbauer (1980/1991), but references can be found in any good microeconomics textbook.
Relatório de Atividades 2010
Conselho de Desenvolvimento Econômico e Social
55
complement results in the egalitarian total consumption per equivalent adult (ETCEA). In other words, ETCEA is the volume of consumption that would be needed, were it distributed with total equality, to generate the same level of well-being as the observed total consumption generates with the observed inequality. It synthesizes the three variables mentioned up to this point17.
The egalitarian free time indicator (EFT) is constructed in two steps. The first step is establishing the indicator of extra-domestic excess work (EW), which expresses a household’s excess non-domestic work in relation to the social norm. It takes into account each household’s domestic work requirements, according to the household’s size, age structure, and resources available to support domestic work.18 Because EW ranges from 0 to 2 (with the norm at 1), subtracting its value from 2 yields a new variable, FT, which also ranges from 0 to 2 with a norm of 1. FT is an indirect measure of available free time. At a value of 0, households have no free time; at a value of 2 they reach a level of free time beyond which there is no further increase in well-being—that is, they reach the maximum well-being that free time can provide.
The second step is to construct an indicator of equality in free time (EFT) as the quotient of the FT of the poor divided by the FT of the non-poor (FTP / FTNP) according to the IPMM. The product of the average value of FT for the whole population and this quotient (called FT equality) is egalitarian free time (EFT). Because FT ranges from 0 to 2 with the norm at 1, and FT equality ranges from 0 to 1, EFT will also range from 0 to 2, and the norm will also be at 119.
The indicator of egalitarian educational achievement (EEA) serves as a proxy for the average level and equality in access to knowledge. It is obtained by multiplying 1-EL (one minus educational lag), called educational achievement (EA), by a simple indicator of distributive equality, defined as the ratio between the educational achievement of the poor (taken as the poorest 75% of the population) and of the non poor (taken as the richest 25% of the population) (EAP / EANP). Educational lag is one of the indicators of unsatisfied basic needs (UBN) that make up the IPMM (see methodological appendix). It is obtained by comparing each household member’s educational level with the norm of completed secondary schooling for adults and school attendance (at an age-appropriate grade) for minors. In EA, the norm is at 1 and the worst situation is zero. The maximum that can be reached has been reduced to 2.
The indicators, combined as follows, yield the opportunity set for social well-being (OSSW):
OSSW = [(TCEA) (EY)] [{(FT) (EFT) + (EA) (EEA)} / 2] (1)
where EY, the indicator of income equality, is equal to (1-GY); EFT, the indicator of free time equality equals (FTP / FTNP); and EEA, the indicator of educational equality, equals (EAP / EANP).
Therefore, (1) may be rewritten as follows:
OSSW = [(TCEA) (1-GY)] [{(FT) (FTP / FTNP) + (EA) (EAP / EANP)} / 2] (1’)
= (ETCEA) [(EFT + EEA) / 2] (2)
given that (ETCEA) = (TCEA) (1-GY); (EFT) = (FT) (FTP / FTNP); and (EEA) = (EA) (EAP / EANP).
TCEA is national total consumption per equivalent adult; GY is the Gini coefficient of households’ current income (monetary and non monetary); ETCEA is the product of TCEA and (1-GY) (that is, the egalitarian national total consumption per equivalent adult); FT is the average free time in Mexico’s households, and FTP and FTNP are the average values of that same variable in poor and non-poor households (as defined); and EA is the average educational achievement among the population older than seven years of age, and EAP and EANP are the respective indicators for the poor and the non-poor (as defined).
ETCEA is multiplied by the simple average of EFT and EEA. Given that the last are both indices expressed in pure numbers that take a value between 0 and 2 with the norm at 1, this operation leaves intact the unit of measurement in which ETCEA is expressed: constant 1993 pesos. Thus, in a society in which everyone is at the maximum well-being that free time can provide, FT would be equal to 2 and EFT equal to 1, so that EFT would also equal 2. If in that same society everyone were at the educational maximum, EA would be 2 and EEA would
17 This solution is far from the ideal one, which should be based on the Gini coefficient of total consumption and not of household income, but although there are figures for the distribution of private consumption amongst households, it is very difficult indeed to distribute public consumption amongst them, which would be required to calculate the Gini which corresponds to TCEA. The proxy used in the text is quite a good one.18 The methodology for calculating EW can be seen in Boltvinick and Hernández Laos (1999, Methodological Appendix).19 In order to avoid the bias which would have been introduced in the time series if FT equality were to be calculated each year with the changing proportion of poor/non poor in the population, it has been calculated using the richest 25% of the population as rich and the poorest 75% as poor. These figures reflect the most frequent level these proportions have taken in the period under study as measured by IPMM.
Relatório de Atividades 2010
Conselho de Desenvolvimento Econômico e Social
56
be 1. Therefore, the arithmetic mean for the egalitarian indicators of free time and educational achievement would be 2. If one were to multiply egalitarian total consumption (ETCEA) by 2, its value would double as a consequence of the high results reached in terms of free time and education. With values at the level of the norm in FT and EA and with total equality in both, the value of EFT is 1 and egalitarian consumption remains the same when multiplied by 1. What is most common is for the empirical values of EFT and EEA to fall between 0 and 1. In this case, the closer their average is to 0, the greater the reduction entailed in making the shift from ETCEA to OSSW.
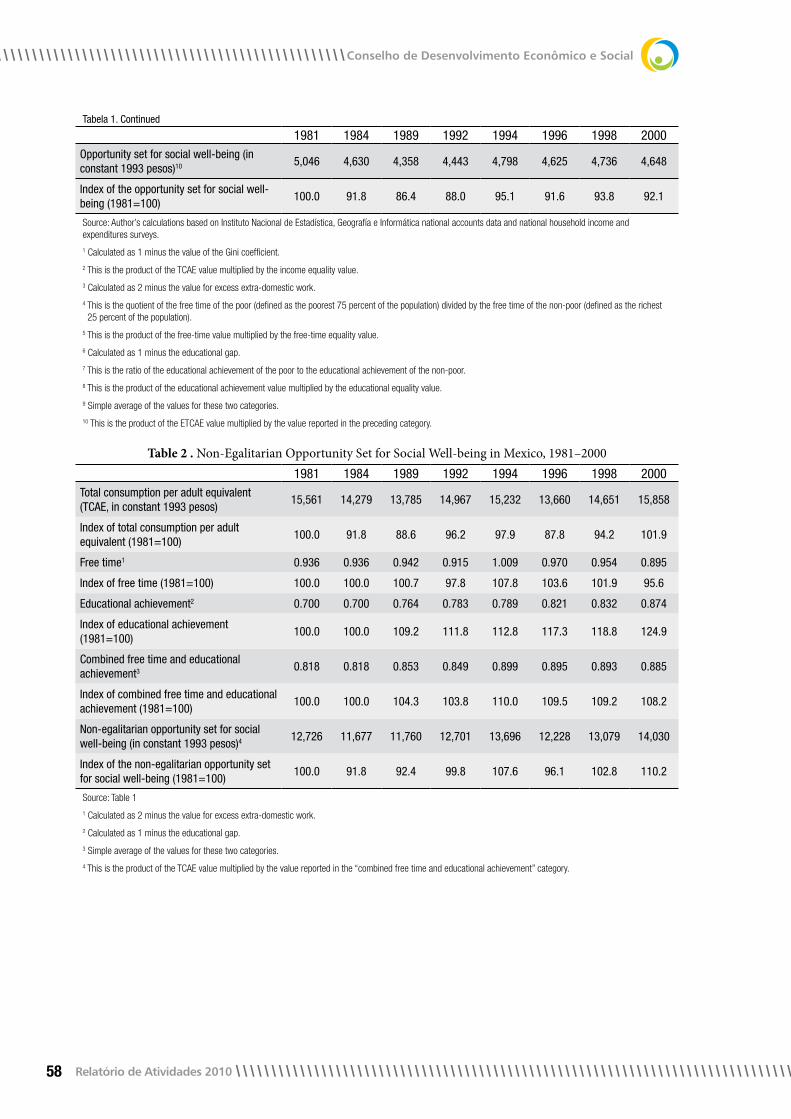
The final result, the OSSW, is the (national) total consumption per equivalent adult, adjusted by three factors: equity in income distribution, egalitarian free time, and egalitarian educational achievement. These three adjustments preserve the ETCEA unit of measurement (constant 1993 pesos), but the amount declines (as can be seen by reading Table 1 horizontally).20 For example, in 1989 the TCEA 13,790 pesos drop to 7,320 pesos in the ETCEA as an effect of income inequality. Conceptually, this means that the well-being effects of both figures are equivalent: 7,320 pesos equally distributed (with 1 minus the Gini coefficient equal to one—that is, with the Gini value equal to zero) would produce the same aggregate well-being as 13,790 pesos distributed with the actually observed 1 minus the Gini coefficient of 0.469. I have also calculated (Table 2) the non egalitarian OSSW, which only considers average achievement indicators in consumption, free time and education.
Something similar occurs when one combines ETCEA with the average of egalitarian free time and education; the resulting OSSW is 4,358 pesos. This indicates that 4,358 pesos with total equality of income distribution, and with free time and education at the norm for everyone (egalitarian and without educational nor time poverty), would generate the same well-being as 13,790 pesos with the actually observed income equality, levels of free time and education, and their distribution.
The central conclusion to be drawn from Table 1 is that in year 2000, seventeen years after Mexico adopted the first steps towards the neoliberal economic model, not only had Mexicans’ opportunities for social well-being (OSSW) not increased, but they were 7.9 percent below their level in 1981. This situation resulted from negative trends in four of the six indicators: the three indicators of equality (in household income, EY, free time, EFT, and in educational achievement, (EEA) and free time average achievement indicator, FT. The only indicator that showed a clear upward tendency was educational achievement, EA, while total consumption per equivalent adult (TCEA) was practically stagnant (an increase of 1.9% in 19 years) when one compares the extreme years of the period, but in between was always below the 1981 level.
The data point to the inability of the Mexican economy and of economic policy adopted to attain a steady growth in consumption per unit of needs. Indeed, the TCEA (which only includes total consumption and units of needs) in year 2000 was only 1.9 percent above its 1981 level (an average annual rate of growth of only 0.1%) and had remained below the 1981 level throughout the 1982-1998 period21.. The pattern of behaviour of the Mexican economy has been one of cyclical fluctuations and long run stagnation in consumption per unit of need.
Moreover, this flow of resources was generated with a larger working effort by the population and therefore with less available free time. The average value of FT for the entire population attained a peak in 1994 and since then has been dropping. The level in year 2000 is the lowest level in the period (Table 2), thus making the opportunities for well-being shrink even further. If the non egalitarian opportunity set for social well-being (NEOSSW) had been calculated only with these two indicators, consumption and free time, the level in 2000 would still have been below the 1981 level by 3.5 percent.
But in terms of achievements in average values for the population as a whole, education registered a significant advance of almost 25 percent (Table 2). This advance explains the fact that when the three indicators of mean achievement, without taking inequality indicators into account, are combined to obtain the non-egalitarian opportunity set (Table 2) or NEOSSW, this indicator rose 10.3 percent in the 1981–2000 period as a whole, rise explained basically by the important improvement in educational achievement and by the dramatic change between 1998 and 2000 in total consumption per equivalent adult (TCEA).
20 This is a particularity of the Social Progress Index that was consciously sought. The starting point was a diagnosis postulating that alternative indices of development had proved inadequate in part because “when they arrive at a single figure, it is usually expressed in artificial units which do not correspond to the units of daily life” (Boltvinick 1998a: 48). In developing this idea, the author postulated that the new index has the property of being expressed “in units of measurement that are dealt with by people on a daily basis and this allows them to be socially adopted in a generalized way” (Boltvinick 1998a: 13).21 In the period 1998-2000 growth in TCEA was quite fast: 4% annually, well above growth in GDP per EA, due to an expansion in consumption credit. The period of expansion of the Mexican economy, which started in 1996 came to an end in 2000, when GDP decreased 0.3%. So TCEA must be expected to stagnate in 2001 (as consumption apparently maintained some growth) and to drop in 2002.

Relatório de Atividades 2010
Conselho de Desenvolvimento Econômico e Social
57
The data reflect the increased levels of inequality under Mexico’s new economic model. The values for equality in income, free time and education, were between 8 and 9 percent lower at the end of the 1981–2000 period than at the beginning (See Table 1), i.e. inequality was larger. Income equality fell systematically from 1984 to 1994, rose temporarily from 1994 to 1996, and then declined again throughout 2000, year at which it attained its lowest level in the whole period under analysis. The period ended with an EY nine percent below that of 1984 (also used as an estimator for 1981). FT equality rose from 1984 to 1994 and then decreased dramatically to attain, again, its lowest level in year 2000. Educational equality attained its lowest level in 1994. The figure for 2000 is, nevertheless, much below the 1981/1984 level.
In other words, not only was Mexico’s new model unable to expand the economy, but it also furthered concentration of income, free time, and education, thereby shrinking the population’s well-being opportunities. Figure 1 summarizes the role of inequality in the evolution of opportunities for social well-being in Mexico, where the area between the two “curves” (the index values vis à vis 1981 of OSSW and NEOSSW) may be interpreted as the inequality effect. As can be seen, the width of this area attains its maximum in year 2000, pointing out the peak of inequality at which the economy arrived.
In terms of mean achievements, once past the strong initial adjustment, the defenders of Mexico’s economic reform process might argue that the performance has been positive, and that even after the 1994–1995 economic crisis, in 1996, the NEOSSW was above its level in 1984 (96.1 in index terms vs. 91.8) and that the level attained in year 2000 is 18 index points above the 1984 level. However, only 10 of the points in this recovery are explained by economic performance (growth in TCEA) while the rest is explained by evolution in education.
In fact, including social inequality (as it is appropriate to do) produces a very different story, as demonstrated by the evolution of the OSSW. It continued to fall after 1984, reaching its lowest level in 1989 and separating significantly from the NEOSSW, especially during periods of expansion (Figure 1).
The closing balance as this text is being revised at the beginning of 2002, when the economy is again in a recession (GDP change in 2001 was – 0.3%) is a socioeconomic system that offers fewer opportunities for well-being now than it did 20 years ago, as a consequence of its meager capacity for economic growth and its intrinsic tendencies towards concentration of its benefits.
Table 1. Opportunity Set for Social Well-being in Mexico, 1981–20001981 1984 1989 1992 1994 1996 1998 2000
Total consumption per adult equivalent (TCAE, in constant 1993 pesos)
15,561 14,279 13,785 14,967 15,232 13,660 14,651 15,858
Index of total consumption per adult equivalent (1981=100)
100.0 91.8 88.6 96.2 97.9 87.8 94.2 101.9
Income distribution (Gini coefficients) 0.429 0.429 0.469 0.475 0.477 0.456 0.476 0.481
Income equality1 0.571 0.571 0.531 0.525 0.523 0.544 0.524 0.519
Egalitarian total consumption per adult equivalent (ETCAE, in constant 1993 pesos)2 8,885 8,153 7,320 7,858 7,967 7,431 7,677 8,231
Index of egalitarian total consumption per adult equivalent (1981=100)
100.0 91.8 82.4 88.4 89.7 83.6 86.4 92.6
Free time3 0.936 0.936 0.942 0.915 1.009 0.970 0.954 0.895
Free-time equality4 0.706 0.706 0.726 0.696 0.721 0.759 0.748 0.651
Egalitarian free time5 0.660 0.660 0.684 0.636 0.727 0.736 0.714 0.583
Educational achievement6 0.700 0.700 0.764 0.783 0.789 0.821 0.832 0.874
Educational equality7 0.679 0.679 0.663 0.632 0.605 0.620 0.625 0.625
Egalitarian educational achievement8 0.476 0.476 0.507 0.494 0.477 0.509 0.520 0.547
Combined egalitarian free time and egalitarian educational achievement9
0.568 0.568 0.595 0.565 0.602 0.622 0.617 0.565
Table 1. Continue on next page
Relatório de Atividades 2010
Conselho de Desenvolvimento Econômico e Social
58
Tabela 1. Continued
1981 1984 1989 1992 1994 1996 1998 2000Opportunity set for social well-being (in constant 1993 pesos)10 5,046 4,630 4,358 4,443 4,798 4,625 4,736 4,648
Index of the opportunity set for social well-being (1981=100)
100.0 91.8 86.4 88.0 95.1 91.6 93.8 92.1
Source: Author’s calculations based on Instituto Nacional de Estadística, Geografía e Informática national accounts data and national household income and expenditures surveys.
1 Calculated as 1 minus the value of the Gini coefficient.
2 This is the product of the TCAE value multiplied by the income equality value.
3 Calculated as 2 minus the value for excess extra-domestic work.
4 This is the quotient of the free time of the poor (defined as the poorest 75 percent of the population) divided by the free time of the non-poor (defined as the richest 25 percent of the population).
5 This is the product of the free-time value multiplied by the free-time equality value.
6 Calculated as 1 minus the educational gap.
7 This is the ratio of the educational achievement of the poor to the educational achievement of the non-poor.
8 This is the product of the educational achievement value multiplied by the educational equality value.
9 Simple average of the values for these two categories.
10 This is the product of the ETCAE value multiplied by the value reported in the preceding category.
Table 2 . Non-Egalitarian Opportunity Set for Social Well-being in Mexico, 1981–20001981 1984 1989 1992 1994 1996 1998 2000
Total consumption per adult equivalent (TCAE, in constant 1993 pesos)
15,561 14,279 13,785 14,967 15,232 13,660 14,651 15,858
Index of total consumption per adult equivalent (1981=100)
100.0 91.8 88.6 96.2 97.9 87.8 94.2 101.9
Free time1 0.936 0.936 0.942 0.915 1.009 0.970 0.954 0.895
Index of free time (1981=100) 100.0 100.0 100.7 97.8 107.8 103.6 101.9 95.6
Educational achievement2 0.700 0.700 0.764 0.783 0.789 0.821 0.832 0.874
Index of educational achievement (1981=100)
100.0 100.0 109.2 111.8 112.8 117.3 118.8 124.9
Combined free time and educational achievement3 0.818 0.818 0.853 0.849 0.899 0.895 0.893 0.885
Index of combined free time and educational achievement (1981=100)
100.0 100.0 104.3 103.8 110.0 109.5 109.2 108.2
Non-egalitarian opportunity set for social well-being (in constant 1993 pesos)4
12,726 11,677 11,760 12,701 13,696 12,228 13,079 14,030
Index of the non-egalitarian opportunity set for social well-being (1981=100)
100.0 91.8 92.4 99.8 107.6 96.1 102.8 110.2
Source: Table 1
1 Calculated as 2 minus the value for excess extra-domestic work.
2 Calculated as 1 minus the educational gap.
3 Simple average of the values for these two categories.
4 This is the product of the TCAE value multiplied by the value reported in the “combined free time and educational achievement” category.

Relatório de Atividades 2010
Conselho de Desenvolvimento Econômico e Social
59
3. Poverty measurement and stratification as indicators of the Achievement Set for Social Well-Being
3.1. The Methodology for social stratification and measurement of poverty: The Integrated Poverty Measurement Method
The integrated poverty measurement method combines two previously existing methodologies and adds a new one. It combines the poverty line procedure based on the normative basket of essential satisfiers (see the next subsection), and the improved version of the unsatisfied basic needs method (see Boltvinik 1992c and Government of Bolivia 1994), and adds the time-poverty dimension. Its foundation is the conception of a household’s sources of well-being (set forth in the first section of this paper) and the consequent critique of the poverty line and unsatisfied basic needs methodologies.
In brief, this critique holds that the main limitation of both the poverty line and unsatisfied basic needs methods is that they proceed as if satisfaction of basic needs depended only upon a couple of well-being sources. The poverty line method, for instance, assumes that needs satisfaction depends only upon current income or households’ current private consumption. Similarly, in its usual applications in Latin America, the unsatisfied basic needs method assumes that need satisfaction depends only upon basic asset holdings (housing) or rights of access to free or subsidized services (piped water, sewerage, children’s attendance at primary school). Implicitly, therefore, it does not consider any of the other sources of well-being.
The integrated poverty measurement method was developed to account fully for all well-being sources. In order to achieve full complementarity of the three methods on which the IPMM rests, it is necessary to specify which needs are to be assessed by the unsatisfied basic needs method and which are to be assessed by the poverty line method. In principle, all needs whose satisfaction in most households depends predominantly upon public expenditure (consumption and investment), household patrimony (accumulated assets), should be assessed directly by the unsatisfied basic needs method. Needs whose satisfaction depends essentially upon current private consumption should be assessed by the poverty line method. Time is a well-being source (or resource) which is essential for the satisfaction of a great variety of needs and hence concurs with both previous groups of needs. For instance, the satisfaction of the need for food depends both, in most households, on income and on availability of time, to cook. Education depends on both access to school and on the availability of time to attend school.
In applying the IPMM, the analysis assessed five dimensions of well-being via the unsatisfied basic needs or direct method, and one dimension (health care and social security) via a mixed procedure. The five dimensions assessed by the unsatisfied basic needs method were: (1) inadequacy of housing quality and quantity, an indicator constructed by multiplying the values for its two component elements: inadequacy of the building materials used in walls, roofs, and floors; and insufficiency of housing space per dweller (overcrowding), as measured by the relationship between the total number of rooms and total number of dwellers while taking into account the different types of household space (kitchen, bedrooms, living rooms, and so forth); (2) inadequacy of sanitary conditions, the weighted average of indicators for water supply, sewerage, and single-household toilet facilities; (3) inadequacy of other services, the weighted average of indicators for electricity and telephone (in the latter case, only in metropolitan areas); (4) inadequacy of basic patrimony (as in the case of income, an indicator of one of the sources of well-being rather than of a particular need), including appliances used for food preparation and conservation, personal hygiene, and recreation; (5) educational deprivation (the educational gap), measured by child school attendance and adult educational levels (where literacy acts as a controlling element).
As noted above, a mixed procedure was used to construct an indicator for inadequate access to health care and social security. For the population lacking access to social security, the poverty line was increased to include the cost of private health care and insurance. The satisfaction of all other needs was identified by the poverty line or indirect method, comparing households’ income per adult equivalent (with the poverty and extreme poverty lines also defined in terms of adult equivalents).
When applying the improved unsatisfied basic needs method, one starts by building an achievement indicator, which involves assigning scores to variables such as those mentioned above and defining the minimum norm for each dimension. This indicator is then standardized by dividing it by the normative score, so that the variable is expressed as a multiple of the norm. The variable thus loses the original unit of measurement in which it was expressed and becomes a pure number. The next step is to make uniform (insofar as it is possible) the range of variation in the standardized indicators by rescaling all values above 1 (the normative score) when there are values above 2, so that these values will range from 1 up to 2. The goal is for all indicators to vary from 0 to 2, with 1 as the normative value. The final step is to transform this achievement indicator into a deprivation indicator,
Relatório de Atividades 2010
Conselho de Desenvolvimento Econômico e Social
60
which is done by subtracting its value from 1. Deprivation indicators will thus vary from −1 to 1, with 0 as the normative value. It follows that positive values express deprivation and negative values express well-being. Unfortunately, because of the limited options built into survey questionnaires, it was not possible to achieve the complete range for all indicators. Therefore, the values of some deprivation indicators vary only from 0 to 1.
Following this approach, one obtains for each household six indicators of deprivation by the unsatisfied basic needs method, one by the poverty line method, and the mixed indicator. The synthesized indicators for each of the first five dimensions of unsatisfied basic needs (inadequacies of housing quality and quantity, sanitary conditions, other services, basic patrimony, and education) and the mixed indicator for health care and social security are combined as a weighted arithmetical mean to obtain the overall unsatisfied basic needs indicator for each household, which indicates the degree of dissatisfaction of the set of needs that is verified directly (or the intensity of unsatisfied basic needs poverty).
With respect to the time dimension, the indicator used is excess working time, an inverse indicator of available time for education, recreation, and domestic work, as well as an indicator of one of the sources of well-being. The excess work and the income indicators are combined into a time-income indicator by dividing income by an excess working time index, before comparing it with the poverty line to obtain a measure of the intensity of income-time poverty.
A system of cost-based weights, derived from the cost structure provided by the normative basket of essential satisfiers, is then used to integrate all of the indicators described above.
By thus integrating the income–time and the unsatisfied basic needs measures, one obtains an integrated poverty indicator for each household, which shows both whether the household is poor (or not poor) and the intensity of its poverty (or how much above the minimum conditions it is located). Once the poor and the non-poor populations have been identified by each of the partial methods and by the integrated method, one proceeds to (1) define three strata each for the poor population (according to the intensity of their poverty: indigents, very poor and moderately poor) and for the non-poor population (according to their degree of wealth: just above the norms, middle class and upper class), and (2) calculate the main poverty indices (incidence, intensity, and equivalent incidence) for each stratum and for the poor population as a whole.
3.2. The Income Poverty method Based on the Normative Basket of Essential Satisfiers (NBES)This poverty line methodology is known as the budget approach. The first step is to determine the basket of goods
and services required by a given household during a particular period (a year, for instance). In the case of consumer durable goods, one needs to distinguish between the quantities required and their annual use by the household, the former being larger than the latter. For example, a household requires a stove but uses, consumes, or depreciates only 0.10 stoves each year (if the stove’s useful life is estimated to be 10 years). In the case of nondurable goods such as food, both quantities are equal. The basket is defined by the vector of quantities of annual use. This vector must be multiplied by the prices for goods and services in order to obtain the annual cost of each item. The sum of the annual cost of all items yields the annual cost of the normative basket of essential satisfiers, which constitutes the poverty line. This cost is compared with the household’s income or consumption to determine whether or not the household is poor.
There are two main problems involved in calculating normative requirements. The first consists in defining the foundations for those normative requirements. In constructing the NBES, two main criteria were employed: Mexico’s social reality, as reflected in the list of goods and services frequently consumed by households; and Mexican law, which reflects a combination of reality and goals. The NBES is thus an operational definition expressing a concept of relative poverty.
The second difficulty is that the list of total requirements must be classified into two groups: those satisfiers that must be met through private consumption (that is, the satisfiers that must be produced by, or whose cost must be paid for by, households), and those satisfiers that are to be met through public expenditures (via government programs, public social security institutions, and so forth). Only satisfiers in the first group should form part of the poverty line, because this is to be compared with a household’s current income or private consumption expenditures.
At this point, there are two possibilities. The simplest one consists of defining a unique classification of satisfiers in both groups, which is then applied to all households. The second, though more laborious, option consists of specifying for each household a classification according to its particular circumstances where access to public transfers is concerned. The first approach was adopted when the NBES measure was constructed under the auspices of the General Coordination of the National Plan for Depressed Areas and Marginalized Groups (COPLAMAR) in the early 1980s in Mexico. The satisfiers that are to be met through public expenditures or social security were primary and secondary education, for both the school-age population and adults; health care services; and water supply and sewerage infrastructure. Access to these services would then be through public transfers. Households would have to take care of all other satisfiers, which means that access to these is through the market or through self-production.

Relatório de Atividades 2010
Conselho de Desenvolvimento Econômico e Social
61
Applying this single classification to all households facilitated the necessary calculations but underestimated the level of the poverty line because, for example, a household lacking free access to public health services has to pay for such expenses—even though these are not contemplated in the poverty line.
The resulting poverty line is then compared with household current income. Here again, COPLAMAR’s procedure was a simplified one. The poverty line was defined for the national average household size and age structure. A better and more accurate alternative would have been to define a poverty line for each household which takes into account both the age and sex structure of the household, its size and the economies of scale present in some areas of consumption.
When Income Poverty is a component of IPMM one does not compare the poverty line with current income but compares disposable income for the subset of needs whose potential satisfaction is being assessed by income, with the corresponding part of the poverty line: i.e. the cost of those items which are assumed that the households are to meet through private consumption.
3.3. An Empirical Illustration of the Achievement Set: Application of IPMM to Mexican Data Table 3 presents information concerning the incidence, intensity, and equivalent incidence of poverty in Mexico
in the period between 1984 and 1998, calculated by applying the integrated poverty measurement method (IPMM) to databases in which household income data have been previously adjusted to national accounts. It also presents disaggregated data on unsatisfied basic needs and poverty line–time components.
Table 3. Incidence, Intensity, and Equivalent Incidence of Poverty in Mexico, 1984–1998. Integrated Poverty Measurement Method
Year Percent Change
1984 1989 1992 19981984 1989
1989 1992
1992 1998
1984 1998
Integrated Poverty
Incidence 0.685 0.734 0.742 0.753 7.2 1.1 1.5 9.9
Intensity 0.391 0.435 0.455 0.479 11.3 4.6 5.3 22.5
Equivalent incidence 0.268 0.319 0.338 0.361 19.0 6.0 6.8 34.7
Unsatisfied Basic Needs Poverty
Incidence 0.750 0.701 0.707 0.677 −6.5 0.9 −4.2 −9.7
Intensity 0.466 0.454 0.467 0.479 −2.6 2.9 2.6 2.8
Equivalent incidence 0.349 0.318 0.330 0.313 −8.9 3.8 −5.2 −10.3
Income-Time Poverty
Incidence 0.508 0.628 0.649 0.694 23.6 3.3 6.9 36.6
Intensity 0.484 0.536 0.547 0.572 10.7 2.1 4.6 18.2
Equivalent incidence 0.246 0.336 0.355 0.397 36.6 5.7 11.8 61.4
Source: Author’s calculations from data bases from the Instituto Nacional de Estadística, Geografía e Informática’s national surveys of household income and expenditure for each of the years reported. Household income data have been adjusted to national accounts.
These data show that the proportion of poor people in Mexico’s total population rose from 68.5 percent in 1984 to 73.4 percent in 1989, 74.2 percent in 1992, and 75.3 percent in 1998. In other words, there was a relatively rapid rise in the incidence of poverty between 1984 and 1989 and an apparent stabilization between 1989 and 1998. In fact, this last period is comprised of three subperiods: stabilization, 1989–1994; rapid increase, 1994–1996; and substantial decrease, 1996–1998.
Comparably quantified evidence is missing for 1994, 1996, and 2000.22 In 1996 the incidence of poverty (as calculated by the IPMM) might have approximated 80 percent, and it might have declined to 72 percent by 2000. However, information about the level of poverty (again, as calculated by the IPMM) prior to the 1982 debt crisis is lacking. A huge increase must have occurred between 1981 and 1984, so that the 1984–1989 rise is only part of the growth that
22 The author has in fact used the integrated poverty measurement method to quantify the incidence of poverty for 1994, 1996, and 2000, but these calculations were performed without adjusting household income to national accounts. The results show that poverty increased sharply from 75.8 percent in 1994 to 81.9 percent in 1996, then reached a level of 80.3 percent in 1998 and fell significantly between 1998 and 2000, ending the period at 77.0 percent. If the 1994–1996 and 1998–2000 trends thus depicted were to be reproduced in the adjusted series, IPMM adjusted poverty calculated by the integrated poverty measurement method would have been 80.1 percent in 1996 and 72.3 percent in 2000.

Relatório de Atividades 2010
Conselho de Desenvolvimento Econômico e Social
62
occurred—which might have been as large as 10 percentage points over the 1981–1989 period. If this is in fact the real picture (and the strong income evidence for this period points in this direction23), then the incidence of integrated poverty experienced a very substantial increase during the 1981–1989 period, followed by stabilization (with some fluctuations) in the 1990s. This, then, is a pattern similar to the one previously discussed concerning income poverty.
Not only did the incidence of poverty expand during the 1984–1998 period, but there was also a change in its structure, with more people in extreme poverty and more indigence (strata not included in Table 3).24 The growth in indigence in fact explains the entire increase in the number of the poor. This implies a rise in the average intensity of poverty, and as Table 3 shows, poverty intensity did grow much faster than the incidence of poverty. Poverty intensity (or the average gap for integrated poverty) rose throughout the period, from 0.391 in 1984 to 0.435 in 1989, 0.455 in 1992, and 0.479 in 1998. Indeed, the whole structure of social stratification worsened. This change can be succinctly expressed: in 1984 there were four indigents for every member of the upper class, while in 1998 there were almost seven; in 1984 there were two indigents for every member of the middle class, and in 1998 there were three.
Because not all the poor are equally poor, simply adding up the number of poor is like adding apples and oranges. It is useful, therefore, to shift our focus from the incidence of poverty to the equivalent incidence of poverty, using instead of the number of poor people the number of equivalent poor (that is, the standardized number of poor individuals). If we multiply the number of poor individuals in a household or in a stratum by their average gap, we estimate the deprivation mass of the group; dividing this product by the total population, we derive the equivalent incidence or deprivation mass per capita. Table 11.6 shows that the equivalent incidence of poverty (as measured by the IPMM) grew very rapidly over the 1984–1998 period, from 0.268 in 1984 to 0.361 in 1998. This represented a substantial 19.0 percent increase between 1984 and 1989 and smaller increases between 1989 and 1992 and between 1992 and 1998.
In the author’s view, the IPMM is the poverty measurement method that most appropriately grasps the magnitude of poverty. It does so because it considers five of the six sources of welfare outlined at the beginning of this First Part. On the other hand, the best practice for quantifying poverty whenever income or consumption expenditures are involved is to adjust survey income data to national accounts. Finally, the equivalent incidence of poverty is the most adequate aggregate measure of poverty for a nation or any given set of households.25 On all these grounds, one must conclude that poverty grew substantially (by 34.7 percent) in Mexico between 1984 and 1998 (Table 3).
As explained in the previous subsection, the basic components of integrated poverty, as calculated by the IPMM, are unsatisfied basic needs (a direct measure of the actual dissatisfaction of a set of needs) and income-time poverty (an indirect measure of potential satisfaction of another set of needs, whose welfare sources are current income and available time). Table 3 disaggregates the incidence, intensity, and equivalent incidence of unsatisfied basic needs and income-time poverty for the 1984–1998 period. Most notable are the inverse trajectories of unsatisfied basic needs and income-time poverty. The incidence of poverty as measured by the unsatisfied basic needs indicator declined significantly between 1984 and 1989 (from 75.0 to 70.1 percent), stabilized between 1989 and 1992, and then decreased again to 67.7 percent in 1998. Its 1998 level was substantially (9.7 percent) below the 1984 level. In contrast, both the incidence of income poverty (not shown in table 3) and the incidence of income-time poverty rose throughout this period, especially between 1984 and 1989.26
In which components of the integrated poverty measure did the deprivation mass increase? Although the intensity of unsatisfied basic needs declined slightly between 1984 and 1989 (from 0.466 to 0.454 in 1989), the relative gap for income-time poverty grew substantially, from 0.484 in 1984 to 0.536 in 1989 (Table 3). Intensities in
23 In Damián (2003) evidence for income poverty (using the NBES) shows that it increased from 48.5 in 1981 (estimated) to 64% in 1989. 24 Indigence is defined here as a situation in which a household meets less than half of social norms. Extreme poverty is defined as being below two-thirds of those norms.25 This is not a fashionable statement. Indices like those constructed by Sen (1981: chap. 3 and appendix C) and by Foster, Greer, and Thorbecke (1984), which take into account income distribution among the poor, give the gap of the poorest a greater weight than its numerical value would grant directly. Both indices assume decreasing marginal welfare (or utility) at all levels of income. This is implicitly formulated in the “weak transfer” axiom (one of the three axioms from which Sen derived his index), which states that a pure transfer of income from a richer (but poor) person to a poor person below the poverty line—without making either cross the poverty line—must reduce the poverty measure (Sen 1981: 186). The transfer implies an increase in the richer person’s level of poverty and a decrease in the poverty level of the poorest. If the richer person is also below the poverty line (the only case of interest, as otherwise the equivalent incidence indicator meets the axiom), the only valid reason to argue that the decrease in the poverty level of the poorer person will be larger than the increase in the poverty level of the richer person is that marginal welfare (utility) is a decreasing function throughout. This, however, is disputable. For arguments along these lines and for alternative positions, see Desai 1992 and Boltvinick 1993: 636–38.26 Income poverty (as measured here as a component of IPMM) rose abruptly between 1984 and 1989, from 41.3 to 55.6 percent. Income poverty as measured here, using a poverty line derived from the normative basket of essential satisfiers (NBES), differs from that measured by applying only the income poverty method in its NBES variant. The difference results from subtracting (in IPMM) from the NBES the total cost of those items in the budget (such as housing) that were directly accounted for in the measurement of unsatisfied basic needs. At the same time, expenses for these categories were subtracted from household income, so that what is being contrasted is disposable income for a set of needs versus the cost of satisfying those needs at the normative level. See subsections 3.1 and 3.2 above.
Relatório de Atividades 2010
Conselho de Desenvolvimento Econômico e Social
63
both categories increased slightly between 1989 and 1992, and between 1992 and 1998 the intensity of unsatisfied basic needs rose slightly while the intensity of income-time poverty increased substantially. Over the 1984–1998 period as a whole, although the intensity of unsatisfied basic needs poverty remained almost constant (a 2.8 percent increase), the intensity of income-time poverty increased significantly (18.2 percent). As a result of these changes, while poverty intensity in these two dimensions was quite similar in the initial year (less than a 4 percent difference), there was a wide gap by the end of the period (19.4 percent higher for income-time poverty).
Table 3 summarizes the average annual rate of change in the incidence, intensity, and equivalent incidence of integrated, unsatisfied basic needs, and income-time poverties in Mexico for the 1984–1989, 1989–1992, and 1992–1998 subperiods and for the 1984–1998 period as a whole. The data show that the deprivation mass per capita under the integrated poverty measurement method increased by 34.7 percent over the entire period, and that this shift resulted from a 61.4 percent increase in the income-time deprivation mass and a 10.3 percent drop in the unsatisfied basic needs deprivation mass. In other words, the decline in the latter was insufficient to offset the brutal increase in the former. Because the increase in the intensity of integrated poverty (22.5 percent) was greater than the growth of its incidence (9.9 percent), the magnitude of the increase in intensity explains a larger proportion of the overall change.
This conclusion highlights the limitations of employing the incidence of poverty as an isolated indicator, as well as the importance of taking intensity and equivalent incidence into account. Between 1984 and 1989, when unsatisfied basic needs poverty and income-time poverty followed very different trajectories, these differences appeared in both the incidence and intensity measures. While the incidence of unsatisfied basic needs poverty declined by 6.5 percent, the incidence of income-time poverty rose by 23.6 percent. And while the intensity of unsatisfied basic needs poverty fell by 2.6 percent, the intensity of income-time poverty rose 10.7 percent. In this case, too, the decline in the unsatisfied basic needs category was not sufficient to compensate for the rise in income-time poverty, so that both the incidence and the intensity of the integrated poverty measure rose (by 7.2 percent and 11.3 percent, respectively). Once again, the greatest increase was in intensity, which turned out to be the foremost contributor to the increase in the deprivation mass.
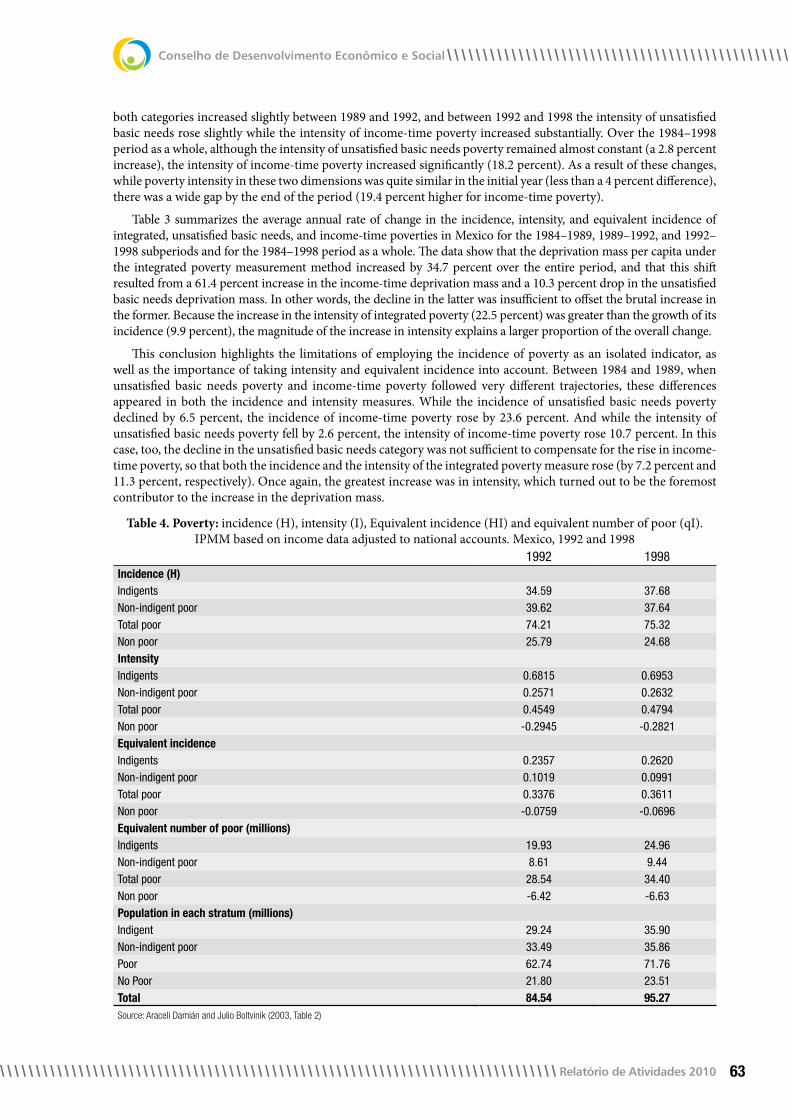
Table 4. Poverty: incidence (H), intensity (I), Equivalent incidence (HI) and equivalent number of poor (qI). IPMM based on income data adjusted to national accounts. Mexico, 1992 and 1998
1992 1998Incidence (H)Indigents 34.59 37.68Non-indigent poor 39.62 37.64Total poor 74.21 75.32Non poor 25.79 24.68IntensityIndigents 0.6815 0.6953Non-indigent poor 0.2571 0.2632Total poor 0.4549 0.4794Non poor -0.2945 -0.2821Equivalent incidenceIndigents 0.2357 0.2620Non-indigent poor 0.1019 0.0991Total poor 0.3376 0.3611Non poor -0.0759 -0.0696Equivalent number of poor (millions)Indigents 19.93 24.96Non-indigent poor 8.61 9.44Total poor 28.54 34.40Non poor -6.42 -6.63Population in each stratum (millions)Indigent 29.24 35.90Non-indigent poor 33.49 35.86Poor 62.74 71.76No Poor 21.80 23.51Total 84.54 95.27Source: Araceli Damián and Julio Boltvinik (2003, Table 2)

Relatório de Atividades 2010
Conselho de Desenvolvimento Econômico e Social
64
Table 4 shows the compact stratification of the population in three strata: indigents, non-indigent poor and non-poor in 1992 and 1998. The relative weight of each strata (which can be seen in the upper block of the table), or incidence (H), is a simplified way of evaluating the Achievement Set. A slight deterioration during the period can be deduced from the incidence of each stratum: as the worse off, the indigents, increase and the other two strata decrease, although in small proportions. The intensity of poverty (I) shows an additional characteristic of the deterioration process observed in the period (second block in Table 4): within each stratum, the poverty intensity (or gap between the observed average situation and the threshold) of the two strata of the poor increases, i.e. they become poorer, again in small proportions, while the negative indicator of the non poor diminishes its negative value, thus diminishing its well-being. The combined effects of both previous blocks are shown in the third block where equivalent incidence (HI) is calculated. The small apparent increases now become larger as equivalent poverty incidence (total poor) increases in almost 10% or 3 percentage points. This is reflected in the fourth block, where an increase in almost 6 million in the number of equivalent poor in a period where the growth of population is less than 11million as can be seen in the fifth and last block.
4. Conclusions from the First Part
The empirical application of the two components of the Social Progress Index here presented for the period 1981-2000 for Mexico, has shown that the Opportunity Set and the Achievement Set move together as expected.
In section 2 we observed that the OSSW decreased in Mexico in the period 1981-2000: from 100 in 1981 to 92.1 in 2000 in index terms and from 5,046 1993 pesos to 4,648 pesos per equivalent adult. We also noted that the inequality dimensions included in the three constituent indicators of OSSW are determinant in this evolution of OSSW, as the non egalitarian OSSW (NEOSSW) increases from 100.0 to 110.2. This contrast is explained by the fact that the three indicators of equality (of total consumption, free time and education) included in OSSW but not included in NEOSSW, decrease during the period (i.e. inequality increases in the three dimensions).
In section 3, the IPMM (Integrated Poverty Measurement Method) which is also a stratification method, stratifying households and their members on the base of their standard of living, was adopted as an expression of the Achievement Set of the Social Progress Index. Although the period of analysis is not exactly the same as that of the Opportunity Set, it is similar and the evidence also shows deterioration between 1984 and 1998, which can be synthesized in the equivalent incidence of poverty, which moved from 0.268 in 1984 to 0.36a in 1998, a relative increase of 35%. The evolution of stratification, analysed in a shorter period (1992-1998), deteriorates significantly, thus moving in a different direction than OSWW, which improves in this shorter period. This contradiction is due to the higher weight that egalitarian time and egalitarian education have in OSSW than in IPMM, as both improved during the 1992-1998 period while Egalitarian Total Consumption deteriorated. It also reflects a restriction, imposed in IPMM but not in OSSW: that the availability of free time above the norm amongst income-poor households should not be reflected in a better position in the income-time composite indicator.
Second part: a view of social progress from beyond the paradigm of economic well-being. A new approach to poverty and human flourishing
5. Introduction
Until 2003-2004, I used to refer to myself as a “povertologist.” Systematic reflection on the bases of poverty undertaken in the first part of Broadening Our Look. A New Approach to Poverty and Human Flourishing (Boltvinick, in preparation; henceforth referred as Broadening Our Look) has increasingly led me to think that poverty should not be studied in isolation. Although I continue to maintain the view of poverty (which I now call economic) as the situation below a normative cut-off point on the axis of living standards, I now regard this axis as the economic perspective of the axis of human flourishing, whose constitutive elements are human needs and capacities. I also hold, as I have done for many years, that in order to properly support these needs (to which I have now added capacities) one needs a clear vision of what a human being is, of his essence and what makes him different (and what makes him similar) to other animals. I have conceived of this shift towards the more general and more abstract as Broadening Our Look, hence the title of my book in preparation. Precisely because the concepts of poverty and living standards assume a partial look of human beings, they must be based on a total look. Truth, as Hegel used to say, is the whole.
Relatório de Atividades 2010
Conselho de Desenvolvimento Econômico e Social
65
I have begun with Marxist philosophical anthropology, seeking the essential features of the human being. I have tried to understand how this human essence manifests itself in history, although this task has been completed to a far lesser extent than the previous one. The understanding thus obtained is the basis that makes it possible to identify the constitutive elements of human flourishing.
The arguments wielded throughout the First Part of Broadening our Look have led me to opt for a vision of human flourishing as the development of human capacities and needs, understood as an interactive unit of the human beings passive and active sides. I have reviewed several theories of human needs and evaluated their strong and weak points. In the first three sections of Chapter 11 of Broadening our Look, I have comparatively analysed the needs schemes postulated by the analysed authors, their answers to the foundational questions and their handling of analytical spaces. In Chapter 10 of Broadening our Look, I analysed the currents of thought that reject human needs (or hate the concept, as David Wiggins says), as well as those which problematise them, and I have critically appraised both. On the basis of Marx-Márkus, Wiggins, Doyal and Gough, Max Neef, Maslow, Fromm, I have shown that the concept of human need is essential to understand our species and to evaluate the human condition. These reflections, discussion, critique and reply has strengthened my conviction that human needs are an irreplaceable concept; that they cannot be replaced by desires, preferences, capabilities or functionings. But I have learnt with Marx, Márkus, Heller, Maslow, Fromm, Maccoby, Max Neef, Doyal and Gough, Terrail and Nussbaum that human beings need to go beyond the satisfaction of their deficiency needs. That for human flourishing, for a person to achieve his potential, the satisfaction of deficiency needs is a necessary but not a sufficient condition. That it is necessary, that through work or love or a combination of both, the person actualises his potential as a human being and as a creature who shares the essence of the species: his potential for universality, freedom, creativity and consciousness.
Economic poverty is only the first obstacle to be overcome to make this possible. But it is an obstacle that the vast majority of the world’s inhabitants have yet to overcome. Afterwards there are many more obstacles, the most important of which is alienation. If the only thing the immense majority of the people in the world possess is their own mind and bodies, with the skills and knowledge, however much or little, that they have been able to develop, they must sell them to survive. If the only thing a person has is used by someone else for 8 or more hours a day, what is the person? If this use of his human capacities by another person does not make him feel fulfilled, if he does not feel that his essential forces are transforming the world and himself, if he only feels tiredness and boredom, if he regards the result of his work as something alien and it is in fact alien, since it belongs to the boss, what is the point in receiving enough payment to survive, if the next day, and the next year, the situation will be the same? This is what Marx called alienation. Poverty and alienation are the two main obstacles to human flourishing.
The hope of many human beings, who live to survive, is based on free time. Fleeing from the work they do to survive, they think like Luis Buñuel, when he produced films he called “feeding films” or Kafka, who wrote in the spare time left over from a job he hated, that in their free time they will be able to do what they always wanted to do or become what they always wanted to be. Most, however, end up casting that valuable free time in front of the TV watching junk programmes that impoverish their intellect.
These reflections highlight the importance of broadening our look. This is the most important lesson drawn from the complex research involved in the First Part of Broadening our Look. I have concluded, for example, that dealing directly with the living standard axis is a mistake, since it does not even allow us to correctly identify the economic requirements derived from human needs, because, having begun where we began, we do not know what human needs are. How are we going to define the poverty threshold if we do not even know what human beings need? It is hardly surprising, then, that the procedures for defining this threshold are increasingly the reflection of total arbitrariness: this is the case of the World Bank, the OECD and the European Union. In these last two institutions, arbitrariness takes the form of defining a proportion of the mean or median household income as the poverty line. Those that have run away from the challenge of knowing, understanding and measuring poverty have no other choice but to take a route like this.
The reflection undertaken in the First Part of this book has made me think that the individual factor that most severely restricts the development of this line of research in academia is researchers’ fear of being discredited for daring to incorporate normative judgements into their analysis. Despite being conceptually defeated, logical positivism continues to dominate scientific research in the social sciences. It has also been impoverished by economists’ domination of the subject of poverty. Economists are perhaps the professionals most fearful of incorporating normative judgements into their work and the least prepared to do so rationally.
This section contains the key ideas of a radically new path for the study of poverty, closely linked to the concept of human flourishing.
Relatório de Atividades 2010
Conselho de Desenvolvimento Econômico e Social
66
6. Constitutive Elements of the Human Flourishing Axis (HFA)
In the remainder of this section I will: 1) distinguish between economic poverty and human poverty; 2) distinguish two conceptual axes: that of human flourishing and that of living standards; 3) identify human poverty on the axis of human flourishing and economic poverty on the axis of living standards; 4) define the development and expansion of human needs and capacities as the constitutive element of the human flourishing axis; and 5) each of the axes will be sub-divided according to two criteria: the level of aggregation (societal and individual) and the existential dimension (circumstantial and structural states of being). The distinction between the dimensions of structural and circumstantial being are related to the degree of permanence of the features studied, with transitory or circumstantial conditions grouped within the category of circumstantial being and the more permanent or essential features being classed under structural being. They correspond to what in Spanish is called estar and ser.
I have developed the conception of human poverty, which obviously has its counterpart in the concept of human wealth, on the basis of one of Marx’s ideas explained by György Márkus, as described in Chapter 2 of Broadening our Look. Márkus has provided a superb interpretation of Marx’s conception of the human being, undertaken from the perspective of philosophical anthropology. This interpretation shows how the mediated nature of human work (in other words, aimed only at the indirect satisfaction of human needs, through mediations) and which contrasts with the beast that directly seizes the prey on which it feeds, creates the possibility of the constant expansion of human activities until they become universal, whereby the human being turns all of nature and all the non-natural objects created by himself into objects of his activity and therefore of his capacities and needs. From this, one can derive an essential feature of the human being, his/her tendency towards universality, expressed in the constant expansion of human needs and capacities.
For Marx, this mediated nature of work is what makes human history possible, not only because it permits the accumulation of tools, other means of production and constructions, enabling the new generations to start at the point their predecessors reached, but also because the mediated nature of human work creates the possibility, by overcoming the animal fusion between subject and object of needs, of human consciousness both of the world that surrounds him/her and the consciousness of her/himself, from which another essential feature of the human being is derived, that of being a conscious being, a consciousness that tends towards universality, meaning that the human being is a creature with a potentially universal consciousness.
That is why the history of the human being can be seen, at least for the species as a whole, as the trajectory of the universalisation of his activities, his capacities, his needs, his social self and his consciousness. Thus for Marx, stressing needs for a moment, a rich human being is one who needs a lot while a poor man is one who needs very little:
“From a material point of view. wealth consists merely of the multiplicity and variety of needs.” 27
By applying this conception, we arrive at a double criterion of poverty: being structurally poor and being circumstantially poor. Individuals that need little are structurally poor. Those that fail to satisfy their needs, whatever their level, are circumstantially poor. Those that are both circumstantially and structurally poor are in the worst human condition. At the other extreme, those that need a lot and also satisfy these broad needs are structurally and circumstantially rich.28 This approach has not been used. It has not even been discussed in the extensive bibliography on poverty. We usually begin with the same set of needs for all members of society29 and then measure their degree of satisfaction. This places us within the dimension of being circumstantially poor.
It is time to eliminate the unilateral emphasis on needs. Once again, I quote Márkus, who has said that:
“It is very characteristic of the Marxist conception of man that it does not strictly separate needs from capacities and instead regards them as reciprocally conditioned determinations of the concrete, active individual. In Economic-Philosophical Manuscripts, Marx often refers to the two together using the term “essential forces” (Wesenskräfte). Man is an active creature, in other words, capable of satisfying his needs exclusively through the development of certain capacities, and therefore the transformation of his already developed faculties or capacities into
27 Karl Marx, Grundrisse, vol. I, pp. 425-426; quoted by György Márkus, op. cit. p. 25.28 They are not, necessarily, the conventionally rich. They could include artists, scientists, spiritual leaders and some (probably a few) politicians. 29 The same set of needs can incorporate quantitative and qualitative differences between individuals regarding the requirements of satisfiers.

Relatório de Atividades 2010
Conselho de Desenvolvimento Econômico e Social
67
real activity is a specific need for him... The abyss or gap between capacities and needs is a consequence of the division of labour and of alienation”30 .
The conception I have adopted of human poverty and wealth refers therefore to the development of human essential forces. A person who is structurally humanly poor is one who has not developed his essential forces; one who is circumstantially poor is one who does not meet his needs and/or does not apply his capacities.
Economic poverty can be seen as part of the conceptual living standard axis. Economic poverty occurs below a certain living standard threshold. The living standard axis, in turn, is the economic perspective of the broader conceptual human flourishing axis. In order for living standards and economic poverty to be concepts with their own specificity, they must reduce their field of interest (reduce their object of study) so that they will refer to no more but no less than the economic perspective of human flourishing.
The foundational search for the definition of the constitutive elements of the human flourishing axis usually refers to theories of human needs (to which, as I have pointed out, it is necessary to add human capacities), which in turn, at least for certain authors among which I include myself, refers to an even more basic question on human essence, which places us within the sphere of philosophical anthropology. Graph 1 shows the two conceptual axes and their links as well as the operation of cut-off and the cut-off point, the last of which defines the threshold defining the poor from the non-poor.
An answer to the question on the human essence provides better tools for answering the question on the constitutive elements, or contents, of the conceptual human flourishing axis. But it is not on this conceptual axis that we have to establish the cut-off point that distinguishes the economic poor from the non-economic poor, but rather on the of living standard axis. The difference between the two axes lies in the fact that on the flourishing axis, if we adopt as our answer that human needs and capacities are the constitutive element, we have the human being with all his needs and capacities, the whole human being, seen from all perspectives, whereas in the of living standard axis although it continues to contain the entire human being, it is now only seen from an economic perspective, in other words, from the point of view of economic resources and conditions.
LIVING STANDARD AXIS: THE ENTIRE HUMAN BEING SEEN FROM THE ECONOMIC PERSPECTIVE ONLY
Economic Poverty
Threshold
Poor Non
HUMAN FLOURISHING AXIS: THE ENTIRE HUMAN BEING SEEN FROM MULTIPLE PERSPECTIVES
CUT-OFF OPERATION
CUT
Graph 1. Conceptuales Axes of Human Flourishing and Living Standard
It is necessary to specify the difference between the approach adopted here and the usual one. In the first, the point is not to cut-off needs or dimensions of human well-being and be left just with the improperly called material dimensions of life but rather to cut-off perspectives in order to be left, on the of living standard axis, only with the economic perspective, which, in its normative dimension refers to the economic requirements of human needs and capacities (resources and opportunities). Human needs such as love, whose central satisfiers are relationships rather than goods and services, are not eliminated through the cut-off operation described here, as is usually done, but by reducing perspectives so that we are left only with the economic perspective, we stop being interested in psychological and sociological aspects (to mention just a few) of love and are left with its economic requirements alone. We thereby limit economic poverty, conceived of as such a low living standard that it is incompatible with human dignity, in the same way as it is reduced in everyday language, so that it does not include all human suffering,
30 György Márkus, op. cit. Note n° 25, chapter “Man as a Universal, Natural Being”, p.34. I have preferred to translate this paragraph from the Spanish translation as the English version is not very clear. This conception recalls that of Max Neef et al., “Needs evince the constant tension between lack and potentiality”, but greatly exceeds it. This contrasts sharply with Amartya Sen’s position on capabilities and functionings. Note the phrase on the need to transform into real activity (apply) his already developed capacities, which coincides with the concept of self-actualization of Abraham Maslow, and which constitutes yet another element in the dynamics of interaction between needs and capacities.
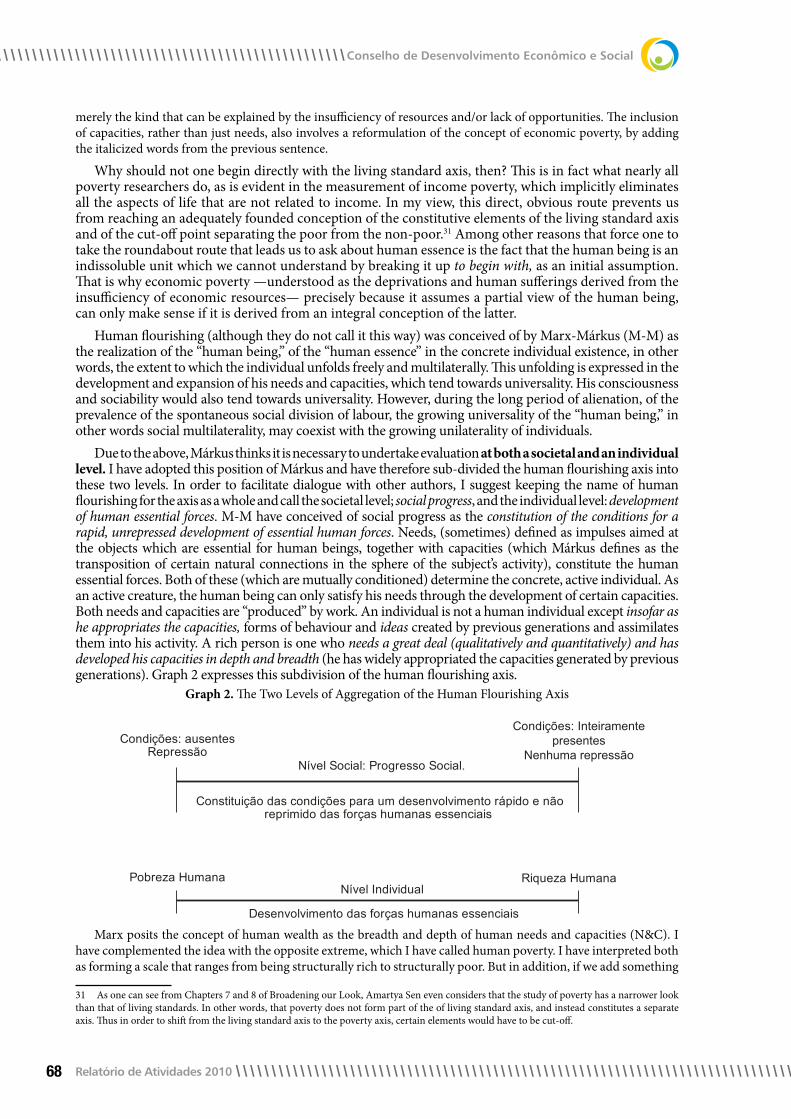
Relatório de Atividades 2010
Conselho de Desenvolvimento Econômico e Social
68
merely the kind that can be explained by the insufficiency of resources and/or lack of opportunities. The inclusion of capacities, rather than just needs, also involves a reformulation of the concept of economic poverty, by adding the italicized words from the previous sentence.
Why should not one begin directly with the living standard axis, then? This is in fact what nearly all poverty researchers do, as is evident in the measurement of income poverty, which implicitly eliminates all the aspects of life that are not related to income. In my view, this direct, obvious route prevents us from reaching an adequately founded conception of the constitutive elements of the living standard axis and of the cut-off point separating the poor from the non-poor.31 Among other reasons that force one to take the roundabout route that leads us to ask about human essence is the fact that the human being is an indissoluble unit which we cannot understand by breaking it up to begin with, as an initial assumption. That is why economic poverty —understood as the deprivations and human sufferings derived from the insufficiency of economic resources— precisely because it assumes a partial view of the human being, can only make sense if it is derived from an integral conception of the latter.
Human flourishing (although they do not call it this way) was conceived of by Marx-Márkus (M-M) as the realization of the “human being,” of the “human essence” in the concrete individual existence, in other words, the extent to which the individual unfolds freely and multilaterally. This unfolding is expressed in the development and expansion of his needs and capacities, which tend towards universality. His consciousness and sociability would also tend towards universality. However, during the long period of alienation, of the prevalence of the spontaneous social division of labour, the growing universality of the “human being,” in other words social multilaterality, may coexist with the growing unilaterality of individuals.
Due to the above, Márkus thinks it is necessary to undertake evaluation at both a societal and an individual level. I have adopted this position of Márkus and have therefore sub-divided the human flourishing axis into these two levels. In order to facilitate dialogue with other authors, I suggest keeping the name of human flourishing for the axis as a whole and call the societal level; social progress, and the individual level: development of human essential forces. M-M have conceived of social progress as the constitution of the conditions for a rapid, unrepressed development of essential human forces. Needs, (sometimes) defined as impulses aimed at the objects which are essential for human beings, together with capacities (which Márkus defines as the transposition of certain natural connections in the sphere of the subject’s activity), constitute the human essential forces. Both of these (which are mutually conditioned) determine the concrete, active individual. As an active creature, the human being can only satisfy his needs through the development of certain capacities. Both needs and capacities are “produced” by work. An individual is not a human individual except insofar as he appropriates the capacities, forms of behaviour and ideas created by previous generations and assimilates them into his activity. A rich person is one who needs a great deal (qualitatively and quantitatively) and has developed his capacities in depth and breadth (he has widely appropriated the capacities generated by previous generations). Graph 2 expresses this subdivision of the human flourishing axis.
Nível Social: Progresso Social.
Condições: ausentesCondições: Inteiramente
presentesNenhuma repressãoRepressão
Constituição das condições para um desenvolvimento rápido e não reprimido das forças humanas essenciais
Nível IndividualPobreza Humana
Desenvolvimento das forças humanas essenciais
Riqueza Humana
Graph 2. The Two Levels of Aggregation of the Human Flourishing Axis
Marx posits the concept of human wealth as the breadth and depth of human needs and capacities (N&C). I have complemented the idea with the opposite extreme, which I have called human poverty. I have interpreted both as forming a scale that ranges from being structurally rich to structurally poor. But in addition, if we add something
31 As one can see from Chapters 7 and 8 of Broadening our Look, Amartya Sen even considers that the study of poverty has a narrower look than that of living standards. In other words, that poverty does not form part of the of living standard axis, and instead constitutes a separate axis. Thus in order to shift from the living standard axis to the poverty axis, certain elements would have to be cut-off.
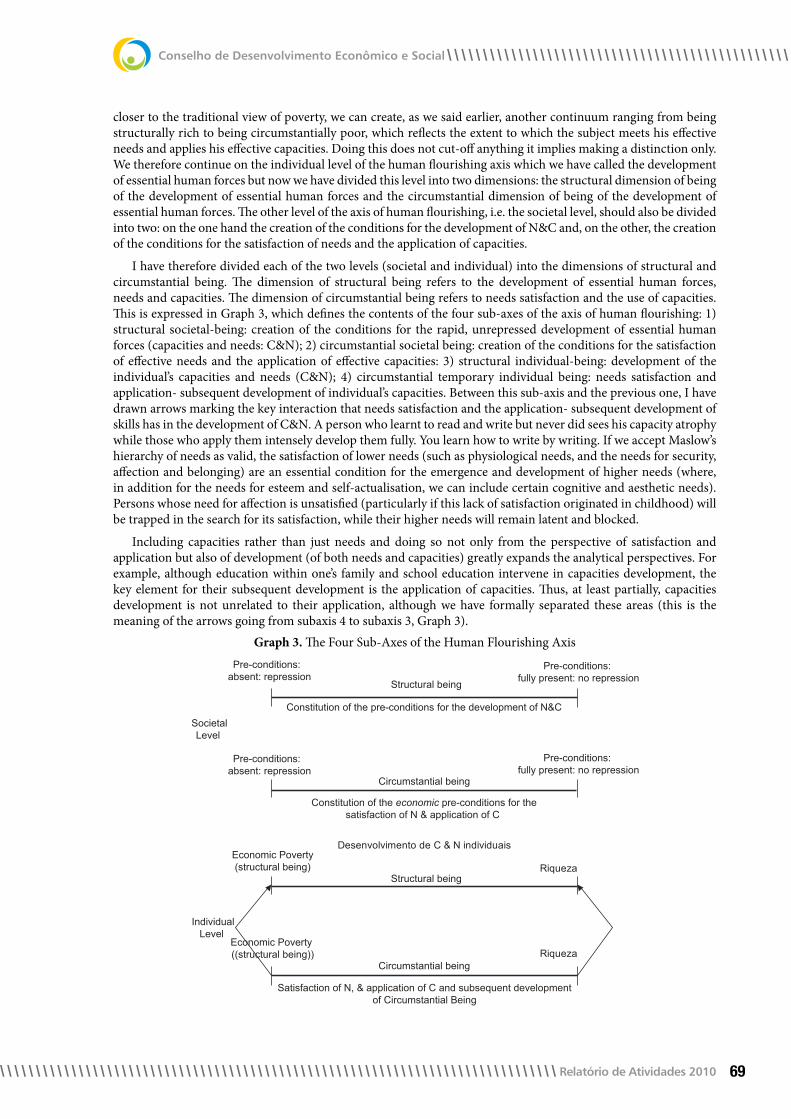
Relatório de Atividades 2010
Conselho de Desenvolvimento Econômico e Social
69
closer to the traditional view of poverty, we can create, as we said earlier, another continuum ranging from being structurally rich to being circumstantially poor, which reflects the extent to which the subject meets his effective needs and applies his effective capacities. Doing this does not cut-off anything it implies making a distinction only. We therefore continue on the individual level of the human flourishing axis which we have called the development of essential human forces but now we have divided this level into two dimensions: the structural dimension of being of the development of essential human forces and the circumstantial dimension of being of the development of essential human forces. The other level of the axis of human flourishing, i.e. the societal level, should also be divided into two: on the one hand the creation of the conditions for the development of N&C and, on the other, the creation of the conditions for the satisfaction of needs and the application of capacities.
I have therefore divided each of the two levels (societal and individual) into the dimensions of structural and circumstantial being. The dimension of structural being refers to the development of essential human forces, needs and capacities. The dimension of circumstantial being refers to needs satisfaction and the use of capacities. This is expressed in Graph 3, which defines the contents of the four sub-axes of the axis of human flourishing: 1) structural societal-being: creation of the conditions for the rapid, unrepressed development of essential human forces (capacities and needs: C&N); 2) circumstantial societal being: creation of the conditions for the satisfaction of effective needs and the application of effective capacities: 3) structural individual-being: development of the individual’s capacities and needs (C&N); 4) circumstantial temporary individual being: needs satisfaction and application- subsequent development of individual’s capacities. Between this sub-axis and the previous one, I have drawn arrows marking the key interaction that needs satisfaction and the application- subsequent development of skills has in the development of C&N. A person who learnt to read and write but never did sees his capacity atrophy while those who apply them intensely develop them fully. You learn how to write by writing. If we accept Maslow’s hierarchy of needs as valid, the satisfaction of lower needs (such as physiological needs, and the needs for security, affection and belonging) are an essential condition for the emergence and development of higher needs (where, in addition for the needs for esteem and self-actualisation, we can include certain cognitive and aesthetic needs). Persons whose need for affection is unsatisfied (particularly if this lack of satisfaction originated in childhood) will be trapped in the search for its satisfaction, while their higher needs will remain latent and blocked.
Including capacities rather than just needs and doing so not only from the perspective of satisfaction and application but also of development (of both needs and capacities) greatly expands the analytical perspectives. For example, although education within one’s family and school education intervene in capacities development, the key element for their subsequent development is the application of capacities. Thus, at least partially, capacities development is not unrelated to their application, although we have formally separated these areas (this is the meaning of the arrows going from subaxis 4 to subaxis 3, Graph 3).
Economic Poverty(structural being)
Economic Poverty ((structural being))
Desenvolvimento de C & N individuais
IndividualLevel
Satisfaction of N, & application of C and subsequent developmentof Circumstantial Being
Riqueza
Riqueza
Constitution of the pre-conditions for the development of N&C
Pre-conditions: absent: repression
Pre-conditions: absent: repression
Structural being
Structural being
Pre-conditions: fully present: no repression
Pre-conditions: fully present: no repression
SocietalLevel
Circumstantial being
Circumstantial being
Constitution of the economic pre-conditions for thesatisfaction of N & application of C
Graph 3. The Four Sub-Axes of the Human Flourishing Axis

Relatório de Atividades 2010
Conselho de Desenvolvimento Econômico e Social
70
We are used to think of needs in terms of satisfaction. We think of them in static terms, as if a person always had the same needs and as if they were not developed throughout their lifetime, as if a newborn baby had the same needs as an adult. In order to explain what is meant by the development of needs, we can begin by talking about their breadth and depth. If, for example, we take Maslow’s scheme of needs (physiological needs, safety needs, love and belonging, esteem, self-actualisation, plus two groups of needs not included in the hierarchy: cognitive and aesthetic) then clearly not all adults have developed the seven needs: The “poor in economic terms” (the more extreme their poverty, the more emphatic what follows is) may be dominated by physiological needs and safety needs, while the other needs may not almost exist. Other persons that are not poor in economic terms may have been trapped in an unmet need, such as affection, and may not have developed the need for self-actualisation. Many do not develop aesthetic needs while as for cognitive needs, the majority remains at the elementary level, namely the levels associated with the satisfaction of initial basic needs. It is therefore possible to speak of the development of needs as regards their breadth. A person with broadly developed needs will have the seven needs in Maslow’s theory, and in his life growth motivation will predominate, with self-actualisation being the dominant need. Note that self-actualisation is a very different need than deficiency needs, because their main satisfier is the subject’s own activity, in which he applies (and further develops) his fundamental capacities. It is a more elaborate way of expressing the need, noted by Márkus, of putting his already developed capacities into play.
But by development of needs, we must also understand their qualitative development, their progressive humanization or perhaps more clearly, their deepening. Take the need for understanding or as in the Erich Fromm formulation, the need for a frame of orientation and devotion. Many people cling to the religious education they received and regard this need as having been satisfied. Conversely, for others, it is an endless search. Juan, the physical anthropologist I invented in Broadening our Look to illustrate my new approach, soon discarded the Biblical myth of Adam and Eve and strove passionately to understand deeply the origin of human beings. There is therefore a broad range within this need and virtually in all needs, including physiological ones, which are always humanized in human beings, as shown by the gourmet’s attitude towards food. When Marx says that a rich person is one that needs a great deal, he is (perhaps) thinking more in the sense of deepening and humanization than in the sense of the breadth and expansion of needs.
Thus, for sub-axes 1 and 2 of the human flourishing axis (HFA), we must not only think, as we tend to, about the social conditions for the satisfaction of needs, but also about those required for the application of capacities. Above all, we must now add the conditions for the development of need and capacities. And we must not do so in a mechanical sense: more education equals more capacities, which is inaccurate because it is static, but in a dynamic sense that takes into account, for example, of the fact that in Mexico, due to the country’s technological dependence, engineers undertake activities associated with operating industrial plants and perhaps with detailed engineering but are almost never involved in basic engineering tasks, far less in technological innovation activities. As these engineers are also the university professors that train the upcoming generations, their own limitations in the application of their capacities (which prevents their subsequent development) is reflected in their students’ level of training. In this example, technological dependence at the national level, which should be analysed by specific branch of activity (since, for example, the situation is different in the construction industry and therefore in civil engineers’ actual levels of training) are an example of the analyses that must be carried out in sub-axis 1 to deal with the pre-conditions for the development of capacities at the societal level. In other words, we should not only speak of individual capacities but also of national capacities. The latter must be contrasted with what we could call the capacities of the species.
7. Cutting off perspectives from the Four Sub-Axes of the Human Flourishing Axis
Let us see if it is useful to reduce perspectives by performing a cut-off in the human flourishing axis that will leave us only with the economic perspective. If we were to eliminate complete needs, as is usually done with the logic which states that there are material and immaterial needs, the sense of the concept of human wealth, of the person that needs a lot and has developed his capacities a great deal, would lose meaning. If we were to do this, a rich person would become a person that needs many material goods for a few needs. (With respect to capacities a usual cut-off operation is not practiced because capacities have not been incorporated into the academic study of poverty despite Sen). Since we would not cut-off food, it would seem that we believe that a structurally rich person is one that needs more than the usual amount of food for his personal characteristics: a glutton. A person who is circumstantially rich would be one that satisfied these expanded needs for food: a fat person. Or less crudely, a gourmet who needs extremely sophisticated food. In this case, rather than true human wealth, we would be identifying expensive tastes or at best, human flourishing in the area of pleasure.
This reasserts, then, the fact that one should not eliminate needs or dimensions of human life and instead,

Relatório de Atividades 2010
Conselho de Desenvolvimento Econômico e Social
71
reduce perspectives, as noted in the first part of this section. If we eliminate perspectives in order to be left with the economic perspective only, we would have the axis of the economic perspective of human flourishing, which we could tentatively continue to call the living standards axis. Let us keep the two levels within this axis and the two dimensions within each one to see if they make sense. At the societal level, what we would have is the constitution of economic pre-conditions: of the development of N&C in the dimension of structural being and of the pre-conditions of the satisfaction of needs and the application of capacities in the dimension of circumstantial being. This makes a lot of sense. At the individual level, in the dimension of structural being, we would have the economic perspective of the development of essential human forces, whereas in the dimension of being, we would have the economic perspective of the satisfaction of needs and application of capacities, as expressed in Graph 4.
In order to clarify this, let us rephrase it as follows. By performing a cut-off in the four sub-axes of the human flourishing axis (HFA) in order to isolate the economic perspective (but in the broad sense of “economic”) one creates a living standard axis (LSA) subdivided into four sub-axes, parallel to those of the HFA: 1) the societal sub-axis of structural being, which consists of the constitution of economic preconditions for the development of essential human forces (N&C); 2) the societal sub-axis of circumstantial being, which consists of the establishment of economic pre-conditions for the satisfaction of needs and the application of capacities; 3) the individual sub-axis of structural being, access to economic conditions and resources (or sources of well-being) compared with the requirements of conditions and resources for the development of capacities and needs corresponding to Sub-Axis 3 of the HFA; this sub-axis identifies economic poverty/wealth on the dimension of structural being; 4) the individual sub-axis of circumstantial being, access to economic conditions and resources (or sources of well-being) compared with the conditions and requirements for the satisfaction of needs and the application of effective capacities corresponding to Sub-Axis 4 of the HFA: this sub-axis identifies economic poverty/wealth in the dimension of circumstantial being. When situations of economic poverty are identified in Sub-axis 3 or 4, this is likely to be the explanation of the human poverty identified in the respective sub-axes of the HFA.
Structural Being
Constitution of the economic pre-conditions for the development of C&NSocietal
Level
Pre-conditions absent: repression
Ser estrutural
Economic Perspective of the Development of individual C & N
Economic Perspective of Individual Satisfaction of N & Application of C
Economic Wealth(structural being)
Individual Level
Circumstantial Being
Economic Poverty ((structural being))
Economic Wealth(circumstantial being)
Pre-conditions absent: repression
Pre-conditions: fully present: no repression
Pre-conditions: fully present: no repression
Circumstantial being
Constitution of the pre-conditions for the satisfaction of needs and the application of capacities.
Human Poverty
Graph 4. The four sub-axes of the living standard axis
Note that in sub-axes 3 and 4 of the LSA, the evaluation is carried out (from the economic perspective) of economic conditions required for the possibility of that what was established in the respective sub-axes of HFA. From the economic perspective, we now have to consider, at this individual level, not only the resources to satisfy effective needs, but also the conditions (or opportunities) for applying effective capacities (such as employment, work characteristics, like: capacities that it mobilizes and develops, and its level of alienation). This happens in sub-axis 4 of the LSA. As for sub-axis 3 on the same axis, we must consider the resources that individuals require at different stages of life in order to develop their capacities and another thing, which is far more difficult, the individual (and familial) economic perspective of needs development. The corresponding sub-axis of the HFA includes, for example, the general cultural environment which, for example, can influence whether individuals have a greater or lesser need to seek new frames of orientation and devotion or are satisfied by the visions of official religion. For example,

Relatório de Atividades 2010
Conselho de Desenvolvimento Econômico e Social
72
comparing the cultural environment of the Franco era in Spain with the situation today shows that today’s situation improves the probabilities for a search of frames of orientation and devotion that go beyond Catholicism.
The cultural wealth or poverty of the media to which most of the population effectively has access is a determining factor in needs development. A more general example and one that is more important in countries such as Mexico is the satisfaction of basic needs (let us begin with Maslow’s three first needs: physiological, security and love and belonging). If these needs are not satisfied for a significant sector of the population, the other needs will not develop or only slightly. Thus, in sub-axis 3, we see the conditions of satisfaction of the basic needs of individuals as a precondition for the development of needs. Once this level has been overcome, the economic conditions that limit needs development would be analysed. For example, if nourishment is satisfied with traditional diets and exquisite food is reserved for large celebrations among the popular strata, while “fast food” is gaining ground in the population’s diets, particularly among children, the possibilities of developing the food need in the gourmet direction are limited. If good music, the plastic arts and literature are ignored in the media and appreciation for them is not promoted, we cannot expect aesthetic needs to develop.
But most important, if the media promote the function of human labour as a means of obtaining income and a person’s worth or success is judged by the amount of income obtained rather than by their degree of self-actualisation, then national culture does not promote the need for self-actualisation which, as Maccoby points out, are not even achieved by the top ranking employees of transnational companies in the area of high technology (See Broadening our Look, Chapter 5). What is very difficult to achieve and what hardly anyone achieves, full or nearly full self-actualisation tends to be discarded from the population’s aspirations. Hardly anyone aspires to self-actualisation. Opportunities for creative work are an essential feature at the societal level in the determination of the actual possibilities of human flourishing.
In order to clarify matters a little, let us take up the example of Juan and analyse his condition in the two axes. Juan is a 35-year-old man who is deeply motivated to understand the evolution of species, particularly that of homo sapiens (which constitutes his fundamental cognitive and self-actualisation need. That is why he pursued and obtained a doctorate in physical anthropology. Moreover, like everyone else, he has developed, to an average level, the universal human needs: physiological, security, affection, love, self-esteem and self-actualisation, to use Maslow’s scheme.
The following paragraphs describe Juan’s possible locations on the four individual sub-axes, two on the HFA and two on the LSA:
In terms of the HFA sub-axis 3, the sub-axis of individual structural being in human poverty/wealth, Juan is 1. at a high level, near the top end of human wealth, since he needs a lot and has highly developed capacities. He is structurally rich in human terms.In terms of sub-axis 4 of HFA, Juan could be in two opposite conditions: 2.
He manages to work as a physical anthropologist, engaging in fieldwork, which entails a constant a) challenge and encourages him to increasingly develop his capacities. Juan is applying and developing his best capacities and becomes realized as a full human being. He has also achieved human wealth as regards circumstantial being. Within this option, in terms of the economic resources to which he may have access, let’s posit dichotomous possibilities: economic poverty or non economic poverty in terms of whether he has the economic resources to be able to satisfy his needs, including that of self-actualisation.
The salary he earns is enough for the economic requirements of both of the sub-axis of structural and i) circumstantial being of the HFA, which in this case coincide, in which case his situation in the LSA, on both sub-axis 3 and 4, is non-economic poverty, which enables him to have sufficient resources to be able to adequately satisfy his deficiency needs and undertake activities (such as travel), purchase goods (books, records, computer, home Internet access) which support his personal development.
In this situation, which combines 1, 2a and i), Juan is in an optimal human situation: he is both structurally and circumstantially rich in human terms and has no economic restrictions on his flourishing (although he may have many restrictions on satisfying his desires, whims and pressure to compete with his neighbours or family, etc.). According to this scheme, it is possible to reach an optimal level of human flourishing without being economically rich. Non-economic poverty suffices, understood as having the resources and conditions to be able to meet all the person’s needs.
His salary is insufficient. He is in ii) economic poverty in relation to both sub-axis 3 and sub-axis 4 of the HFA, which in this case coincide. He lacks the economic resources both to be able to fully satisfy his deficiency needs and to complement his personal development.

Relatório de Atividades 2010
Conselho de Desenvolvimento Econômico e Social
73
In this situation, Juan is in a contradiction that may become extremely tense and may limit his development in other areas (such as having a family, for example), which may lead to disastrous solutions, such as accepting a better paid job yet one without opportunities for self-actualisation.
He does not manage to work as a physical anthropologist. He does not manage to apply his capacities b) and does not continue developing as a human being. In the circumstantial being on the HFA, he is classified as being in a situation of human poverty. Despite being structurally humanly rich, Juan is (circumstantially) humanly poor. Since the conditions to enable Juan’s structural being to coincide with those of his circumstantial being have not been met, one might be inclined to assume that the only relevant needs are those that coincide with his circumstantial state. However, Juan’s deepest aspirations will continue to exist, for some time at least, and in the options that follow, iva and ivb, in which he does have some kind of work, he will try to cultivate his vocation for physical anthropology one way or another. That is why, in the HFA, it is useful to evaluate his situation both in relation to the requirements in axis 3 of human flourishing, of what Juan is (structurally), and in terms of 4, which reflects his current effective situation. In this situation, unlike in a), he needs to get a job first.
Thus, three options are created: He does not get a job, he gets a job with an adequate salary and he gets a job with an inadequate salary.
He does not get a job. He is unemployed. In economic terms, he ends up in iii) extreme economic poverty, in both sub-axis 3 and sub-axis 4 of the LSA. Not only is the need for self-actualisation unmet, but also the need for esteem and security and physiological needs; his amorous relations and his need for belonging may also be affected. If he has no family support or does not wish to depend on it and lives in a society in which there is no unemployment benefit, or any other form of support for people without income, he will become dominated by his physiological needs and seek survival by begging or similar means or through illegal activities. He would be a humanly (structurally) rich person, who is (circumstantially) humanly poor and is in a structural and circumstantial state of extreme economic poverty.He gets a job (as a bureaucrat) in which he actualises or mobilizes some secondary capacities but not iv) his fundamental ones. He thereby manages to maintain his self-esteem at a minimal indispensable level. Note that here, in comparison with iii), the difference is created by an economic condition (whether or not he gets a job, in nearly any field) and this difference is what determines the situation of the first four basic needs. At this point, it is worth positing the two options regarding salaries:
iva) The salary is inadequate for the economic requirements of both subaxes 3 and 4 of the HFA. He lives in economic poverty, but unlike iii) it is not extreme poverty. A humanly rich person, who is in a circumstantial humanly poor state, is economically both structurally and circumstantially poor.
ivb) The salary is adequate for the economic requirements of subaxes 3 and 4. He is not poor in economic terms and can, with better opportunities than in iva try to cultivate his vocation as an activity in his free time. A humanly rich person, who is in a circumstantial humanly poor state, and is not economically poor.
As a result of the comparison between economic requirements —in terms of resources and conditions (opportunities) derived from the corresponding dimension on the HFA — and the resources and conditions effectively achieved by him, Juan will be located on the two dimensions (structural and circumstantial being) of the LSA. In the structural dimension of living standards Juan will be located as a result of the comparison between the economic requirements (resources and opportunities) of his structural state of being (which can only be identified on the HFA) and the economic conditions he has effectively achieved. The economic requirements of Juan’s structural being would be higher than those of the average person (since they include anthropological trips, books on the subject, and the need for a computer and access to Internet). The Juan who does not manage to work as a physical anthropologist, who ends up working as a bureaucrat to subsist (if he is married and has children, his subsistence requirements will greatly increase), in a job in which he is not self-actualised, can try to maintain physical anthropology as an interest in his free time. The economic requirements of his vocation will continue to be present, but now as a free-time activity.32 On the axis of circumstantial being, then, Juan’s deep needs become diluted and all that remains are the common requirements of family life, in which Juan will not be distinguished,
32 Writing novels, stories, poetry or plays may be a free-time activity that leads to self-actualization, as in the case of Kafka. It is far more difficult and in fact virtually impossible to achieve something similar in physical anthropology, whose central activity involves fieldwork and/or access to fossil remains.
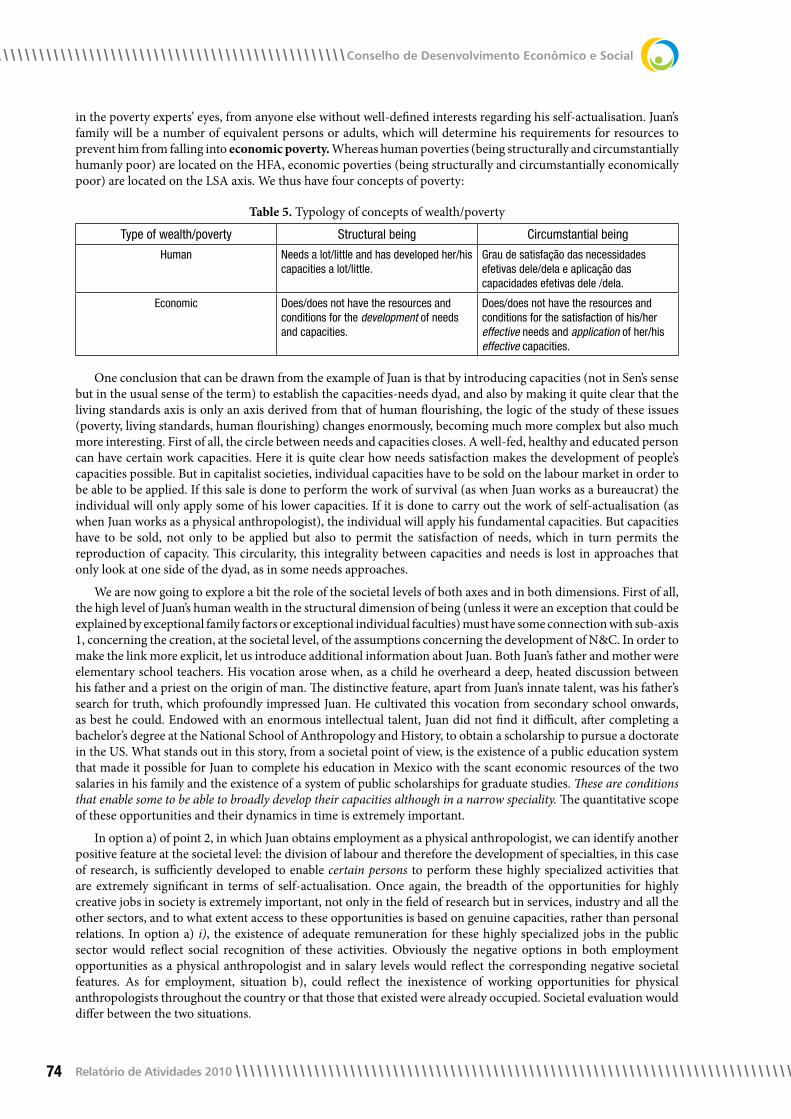
Relatório de Atividades 2010
Conselho de Desenvolvimento Econômico e Social
74
in the poverty experts’ eyes, from anyone else without well-defined interests regarding his self-actualisation. Juan’s family will be a number of equivalent persons or adults, which will determine his requirements for resources to prevent him from falling into economic poverty. Whereas human poverties (being structurally and circumstantially humanly poor) are located on the HFA, economic poverties (being structurally and circumstantially economically poor) are located on the LSA axis. We thus have four concepts of poverty:
Table 5. Typology of concepts of wealth/poverty
Type of wealth/poverty Structural being Circumstantial being
Human Needs a lot/little and has developed her/his capacities a lot/little.
Grau de satisfação das necessidades efetivas dele/dela e aplicação das capacidades efetivas dele /dela.
Economic Does/does not have the resources and conditions for the development of needs and capacities.
Does/does not have the resources and conditions for the satisfaction of his/her effective needs and application of her/his effective capacities.
One conclusion that can be drawn from the example of Juan is that by introducing capacities (not in Sen’s sense but in the usual sense of the term) to establish the capacities-needs dyad, and also by making it quite clear that the living standards axis is only an axis derived from that of human flourishing, the logic of the study of these issues (poverty, living standards, human flourishing) changes enormously, becoming much more complex but also much more interesting. First of all, the circle between needs and capacities closes. A well-fed, healthy and educated person can have certain work capacities. Here it is quite clear how needs satisfaction makes the development of people’s capacities possible. But in capitalist societies, individual capacities have to be sold on the labour market in order to be able to be applied. If this sale is done to perform the work of survival (as when Juan works as a bureaucrat) the individual will only apply some of his lower capacities. If it is done to carry out the work of self-actualisation (as when Juan works as a physical anthropologist), the individual will apply his fundamental capacities. But capacities have to be sold, not only to be applied but also to permit the satisfaction of needs, which in turn permits the reproduction of capacity. This circularity, this integrality between capacities and needs is lost in approaches that only look at one side of the dyad, as in some needs approaches.
We are now going to explore a bit the role of the societal levels of both axes and in both dimensions. First of all, the high level of Juan’s human wealth in the structural dimension of being (unless it were an exception that could be explained by exceptional family factors or exceptional individual faculties) must have some connection with sub-axis 1, concerning the creation, at the societal level, of the assumptions concerning the development of N&C. In order to make the link more explicit, let us introduce additional information about Juan. Both Juan’s father and mother were elementary school teachers. His vocation arose when, as a child he overheard a deep, heated discussion between his father and a priest on the origin of man. The distinctive feature, apart from Juan’s innate talent, was his father’s search for truth, which profoundly impressed Juan. He cultivated this vocation from secondary school onwards, as best he could. Endowed with an enormous intellectual talent, Juan did not find it difficult, after completing a bachelor’s degree at the National School of Anthropology and History, to obtain a scholarship to pursue a doctorate in the US. What stands out in this story, from a societal point of view, is the existence of a public education system that made it possible for Juan to complete his education in Mexico with the scant economic resources of the two salaries in his family and the existence of a system of public scholarships for graduate studies. These are conditions that enable some to be able to broadly develop their capacities although in a narrow speciality. The quantitative scope of these opportunities and their dynamics in time is extremely important.
In option a) of point 2, in which Juan obtains employment as a physical anthropologist, we can identify another positive feature at the societal level: the division of labour and therefore the development of specialties, in this case of research, is sufficiently developed to enable certain persons to perform these highly specialized activities that are extremely significant in terms of self-actualisation. Once again, the breadth of the opportunities for highly creative jobs in society is extremely important, not only in the field of research but in services, industry and all the other sectors, and to what extent access to these opportunities is based on genuine capacities, rather than personal relations. In option a) i), the existence of adequate remuneration for these highly specialized jobs in the public sector would reflect social recognition of these activities. Obviously the negative options in both employment opportunities as a physical anthropologist and in salary levels would reflect the corresponding negative societal features. As for employment, situation b), could reflect the inexistence of working opportunities for physical anthropologists throughout the country or that those that existed were already occupied. Societal evaluation would differ between the two situations.
Relatório de Atividades 2010
Conselho de Desenvolvimento Econômico e Social
75
If prevented from working in his specialty Juan failed to obtain a job, option iii), this could be reflecting structural problems in the economy that fails to achieve full employment, which causes great harm to many people. Even if an unemployed person does not experience poverty, because of the non-basic assets he has accumulated or family support, the personal harm to his self-esteem and self-actualisation could be severe. Once again, if he gets a job as a bureaucrat, which is the option posited and the options regarding the adequacy of his salary, these would reflect the basic characteristics of the conditions that social development creates for the development of capacities and needs and for the application of capacities and needs satisfaction.
This exposition suffices to show that an entirely new approach is in the making for the study of human flourishing, and as part of it, of the four types of poverty analysed.
8. The New approach and the Challenge of Measurement
New concepts are generally difficult to measure. In this section of the paper I identify some of the measurement challenges posed by the new approach. It is a first draft of something which requires a lot of additional work.
A list of measurement challenges is the following: 1. Regarding economic poverties, should one move from current economic poverty to the two economic poverties identified in the new approach, or conserving the cur-rent economic poverty, to three economic poverties? 2. Identifying and measuring the development of needs. 3. A typology of capacities is required. 4. Identifying and measuring the development and application of capacities at the individual level. 5. How to arrive at an overall measure that reflects, at the individual level, all the dimensions involved: needs (development & satisfaction), capacities (development and application). 6. How to deal with the societal level? How is one to judge about the constitution of the pre-conditions for the development of the human essential forces (HEF). How to identify the repression (or stimulation) of the development of HEF?.
In Table 6 the first point is broached. In columns (2) to (4) the three types of wealths/ poverties are included. It is then argued what is needed to move from column (4), which constitutes current measurement, to column (3), the circumstantial (estar) being wealth/poverty and to (2), the structural wealth/poverty being. As stated in Table 5, to move from (4) to (3) one needs to add application of effective capacities and replace the standard package of needs by effective needs. To move from (4) to (2), one needs to abandon the standard package of needs and switch to individual development of needs and also one has to add individual development of capacities. The question remains whether one should retain the current poverty measurement, and thus have three poverty measures or whether one should stay only with the two new economic poverties/wealths only.
On point 2, development of needs can be seen in two dimensions: extension & deepening. Extension: one could attempt to arrive, on the base of a chosen needs scheme (e.g. Maslow’s) and applying survey questionnaires, at a dichotomic score for each need: developed, not developed, and count for each individual the number of needs he/she has developed. With respect to deepening a multichotomic score could be developed on the base of in depth qualitative interviews (e.g. not developed at all, slightly, medium, high, very high development). The final score for an individual would be a bi-dimensional one reflecting both dimensions of the development of needs: number of needs developed and degree of development of each need.
On 3, A typology of capacities is required, as far as I know, there is nothing about capacities that resembles theo-ries of needs. Nussbaum has distinguished: basic (innate); internal (developed through life); and combined capa-bilities (internal plus external conditions). A more thematic typology (compatible with the Nussbaum distinctions) could be something like: abilities (know how’s); cognitive; artistic; affective; and social/civic/political capacities.
On 4, identifying and measuring the development and application of capacities at the individual level, once a capacities typology has been built, the empirical identification (through surveys and in depth qualitative in-terviews, of the development of capacities at the individual level should be no problem. Measuring the degree of development of a specific capacity can also be done through qualitative interviews. The goal would be to identify the level of this development in a scale such as null, very low, low, medium, high, very high. In trying to go from the list of developed capacities (and the degree of development of each one) to the overall characterisation of the individual in terms of development of capacities, one has to confront the question of the value of multi-dimensional vs. one-dimensional human wealth. Is medium development of capacities in many areas worth more than very high development of one capacity or in one area of capacities?
On 5, how to arrive at an overall measure that reflects, at the individual level, all the dimensions involved: needs (development & satisfaction), capacities (development and application, the individual will be characterised by four indicators: 1. development of needs, 2. satisfaction of needs, 3. development of capacities and 4. application of capacities. Numbers 1 & 3 represent the development of HEF or the wealth/poverty location in the structural

Relatório de Atividades 2010
Conselho de Desenvolvimento Econômico e Social
76
(ser) scale. Numbers 2 & 4 will represent his location in the circumstantial (estar) dimension of the HFA. This can either stand as a four dimensional representation (mathematical or graphical) or an attempt can be made to arrive at a single qualitative characterisation or at a single number. In the last case, the problem of weighting appears. The most neutral possibility is equal weights to all four dimensions. I don’t have (for the moment) a satisfactory solution to arrive at a single number.
Lastly, the most difficult issue is 6, How to deal with the societal level? How is one to judge about the constitu-tion of the pre-conditions for the development of the human essential forces (HEF). How to identify the repression (or stimulation) of the development of HEF? A critical approach is certainly required and there does not seem to be easily replicable paths. The type of analysis, although embedded in the best of Marxism and critical theory, has to be built and some techniques and analytical styles discovered as one goes through. The last two large paragraphs of section 7 show some of the elements that would be involved in this type of analysis.
Table 6. Economic Wealth/ Poverty: Moving from IPMM current measurement (should it be maintained?) to Circumstantial and Structural Being Economic Poverties
Type of wealth/ poverty (1) Structural (ser) Being (2) Circumstantial (estar) Being (3)
Current IPMM measurement (4)
Economic Needs a lot/little and has developed her/his capacities a lot/little
Degree of satisfaction of her/his effective needs and application of his/her effective capacities
Degree of satisfaction of a standard package of needs and application of capacities is not included.
In order to move from column (4) to (3) one needs to add application of effective capacities and replace the standard package of needs by effective needs. In order to move from (4) to (2), one needs to add individual development of capacities, abandon the standard package of needs and switch to individual development of needs.
Randall WrayProfessor of Economics at University of Missouri, Senior Fellow, Center for Full Employment and Price Stability, Visitant Scholar at Jerome Levy Economics Institute of Bard College, Former President of the Association for Institutional Thought (AFIT) and former Head of Association for Evolutionary Economics (AFEE); Ph.D. and Masters in Economics from the University of Washington
What should banks do? A Minskian analysis
Before we can reform the financial system, we need to understand what banks do, or, better, what banks should do. This paper will examine the later work of Hyman Minsky at the Levy Institute on his project titled “Reconstituting the United States’ Financial Structure”. This led to a number of Levy working papers and also to a draft book manuscript that was left uncompleted. Much of this work was devoted to his thoughts on the role that banks do play and should play in the economy. To put it as simply as possible, Minsky always insisted that the proper role of the financial system was to promote the “capital development” of the economy. By this he did not simply mean that banks should finance investment in physical capital. Rather, he was concerned with creating a financial structure that would be conducive to economic development to improve living standards, broadly defined.
In many of his writings associated with this project Minsky emphasized six main points:
a capitalist economy is a financial system;1. neoclassical economics is not useful because it denies that the financial system matters;2. the financial structure has become much more fragile;3. this fragility makes it likely that stagnation or even a deep depression is possible;4. a stagnant capitalist economy will not promote capital development;5. however, this can be avoided by apt reform of the financial structure in conjunction with apt use of fiscal 6. powers of the government.
Central to his argument is the understanding of banking that he developed over his career. Just as the financial system changed (and with it, the capitalist economy changed), Minsky’s views evolved. I will focus on his papers and manuscripts from 1992 to his last major contribution in 1996 (Minsky 1996, his Veblen-Commons award paper). In this paper I will focus on Minsky’s general approach to financial institutions and policy; I will not provide specific recommendations for policy reform.