july 20, 2018 abb india (abb) -...
TRANSCRIPT

Initiating Coverage
ICICI Securities Ltd | Retail Equity Research
July 20, 2018
Leader in automation technology…
ABB India (ABB) is an Indian subsidiary (75%) of Swedish-Swiss based
global company ABB Ltd. With over 69 years of domestic operations,
ABB’s key business segment includes power grids (transformers, sub-
stations, HVDC, grid stabilisation/automation systems), electrification
products (switchgears, solar inverters, EV chargers), robotics and motion
(industrial robots, drives, motors, generators) and industrial automation
(process automation, enterprise solutions) serving customers in utilities,
industry and transport & infrastructure. With strong competencies and
technology leadership in most of the above segments, proven expertise
in execution, healthy b/s and large anticipated spends in these segments,
we believe ABB will deliver a healthy performance, going forward.
Capex in power T&D, smart grid solutions, railways gives strong visibility
We believe ABB will be a key beneficiary of planned capex spends of
| 2,60,000 crore in FY17-22E in the T&D segment. Under-investment in the
T&D segment, upgradation to high voltage network and 'Power for all'
initiative of current governments is likely to help ABB keep its order book
ticking. ABB, a pioneer in smart grid solutions, is also likely to benefit
from improved allocation in smart-grid programmes (| 980 crore in
Twelfth Plan) due to accelerated pace of addition in renewables (175 GW
by FY22E). Electrification of railways, 30,000 ckm by FY22E by spending
~| 35,000 crore, introduction of electric locomotives (~| 10,000 crore
opportunity), spends on network expansion/ de-congestion and slew of
metro projects across the country are likely to open up opportunities for
ABB’s best-in-class electrification and power solutions (transformers,
turbochargers, etc.) Thus, we expect these key segments, i.e. power grids
and electrification to grow at 9.5% and 13.9%, respectively, in CY17-19E.
Industry solutions, renewables, E-cars to bring new growth opportunities
ABB's industrial solutions segment is also poised to grow at 9.5% CAGR
with a pick-up of industrial capex and high value-added propositions like
ABB AbilityTM. On the renewables front, ABB's leadership in solar
inverters, step-up transformers and grid stabilisation systems is likely to
open opportunities of over | 8500 crore in FY19-22E. In the E-mobility
segment, ABB's technical prowess in charging infrastructure space is also
to augur well for the company. With all cylinders firing and robust existing
order book of | 11,628 crore, we believe ABB will clock revenue, EBITDA
and PAT growth of 14%, 20.5% and 21.3% CAGR, respectively, in CY17-
19E. ABB has always traded at premium multiples due to its strong
technical capabilities (15-year average P/E at 58x). We value the company
at 48x CY19E earnings (20% discount to average P/E) to arrive at a target
price of | 1400. We initiate coverage with a BUY recommendation.
Exhibit 1: Valuation Metrics
(| crore) CY15 CY16 CY17 CY18E CY19E
Revenues 8,140 8,648 9,087 10,378 11,819
EBITDA 713 747 736 880 1,068
Net Profit 300 376 420 505 619.3
EPS (|) 14.2 17.8 19.8 23.9 29.2
P/E (x) 80.6 64.2 57.5 47.8 39.0
Price / Book (x) 8.0 7.4 6.7 6.1 5.4
EV/EBITDA (x) 33.9 31.6 30.8 25.8 21.0
RoCE (%) 11.9 17.5 23.2 24.8 25.5
RoE (%) 10.0 11.4 11.6 12.7 13.9
Source: Company, ICICI Direct Research
ABB India (ABB) | 1140
| 1200
Rating Matrix
Rating Matrix
Rating : Buy
Target : | 1400
Target Period : 12 - 15 months
Potential Upside : 23%
Key Financials
| Crore CY16 CY17 CY18E CY19E
Revenue 8,648 9,087 10,378 11,819
EBITDA 747 736 880 1,068
EBITDA margin 8.6% 8.1% 8.5% 9.0%
Net Profit 376 420 505 619
EPS (|) 17.8 19.8 23.9 29.2
Valuation Summary
(x) CY16 CY17 CY18E CY19E
P/E 64.2 57.5 47.8 39.0
Target P/E 78.8 70.6 58.7 47.9
EV / EBITDA 31.6 30.8 25.8 21.0
P/BV 7.4 6.7 6.1 5.4
RoNW (%) 11 11.6 12.7 13.9
RoCE (%) 17.5 23.2 24.8 25.5
Stock Data
Stock Data
Average Volumes (shares) 55031
Market Capitalization | 24158 Crore
Total Debt (CY17) | 8 Crore
Cash and Investments (CY17) | 1491.6 crore
EV (CY17) | 22673.9 Crore
52 week H/L (BSE) (|) 1744 / 1123
Equity capital | 42.4 Crore
Face value | 2
MF Holding (%) 5.8
FII Holding (%) 3.1
Promoter Holding (%) 75
Price Performance
Return (%) 1M 3M 6M 12M
ABB India Ltd (4.2) (7.4) (27.0) (20.4)
Siemens Ltd (5.3) (11.3) (27.4) (30.4)
GE T&D India Ltd (6.6) (25.9) (32.6) (10.6)
Price Movement
6,000
7,000
8,000
9,000
10,000
11,000
12,000
0
300
600
900
1,200
1,500
1,800
Jul-18Jan-
18
Aug-
17
Feb-
17
Aug-
16
Feb-
16
Aug-
15
ABB (R.H.S) Nifty (L.H.S)
Research Analyst
Chirag J Shah
Sagar K Gandhi
Page 2 ICICI Securities Ltd | Retail Equity Research
Company background
ABB India (ABB) is a technology company that offers solutions for power
grids, electrification products, industrial automation and robotics &
motion. It serves customers in utilities, industry, transportation and
infrastructure. With over 125 years of history, ABB India’s parent
company i.e. the ABB group has been at the forefront of innovation and
industrial digitalisation, driving the energy and fourth-industrial
revolutions. In the energy (utilities) space, ABB is one of the world’s
leading power engineering companies. The company provides solutions
for energy-efficient generation, transmission and distribution (T&D) of
electricity, thereby increasing productivity in industrial, commercial &
utility operations. On the automation side, ABB offers solutions ranging
from simple light switches to robots for painting cars or packing food, and
from huge electrical transformers to control systems that manage entire
industrial networks and factories. These solutions help enhance reliability,
industrial productivity and thereby improve energy efficiency. Thus, ABB
has emerged as a leader in connected and enabled industrial equipment
and systems with an installed base of more than 70,000 control systems
connecting ~70 million devices.
On the renewable side, ABB India (and ABB group) offer a complete
portfolio of services for the renewable energy industry that covers
virtually any requirement from individual components for a wind turbine
installation to turnkey delivery of onshore or offshore grid connection
schemes. ABB is also a global leader in solar inverter technology and has
been powering solar projects across locally and globally, spanning the
entire solar photovoltaic (PV) value chain. About 50% of India’s solar
energy generated passes through ABB equipment. Out of the country’s
current installed solar capacity of 21.6 GW, utility scale projects would
comprise 6.5 GW. The company has supplied inverters to this.
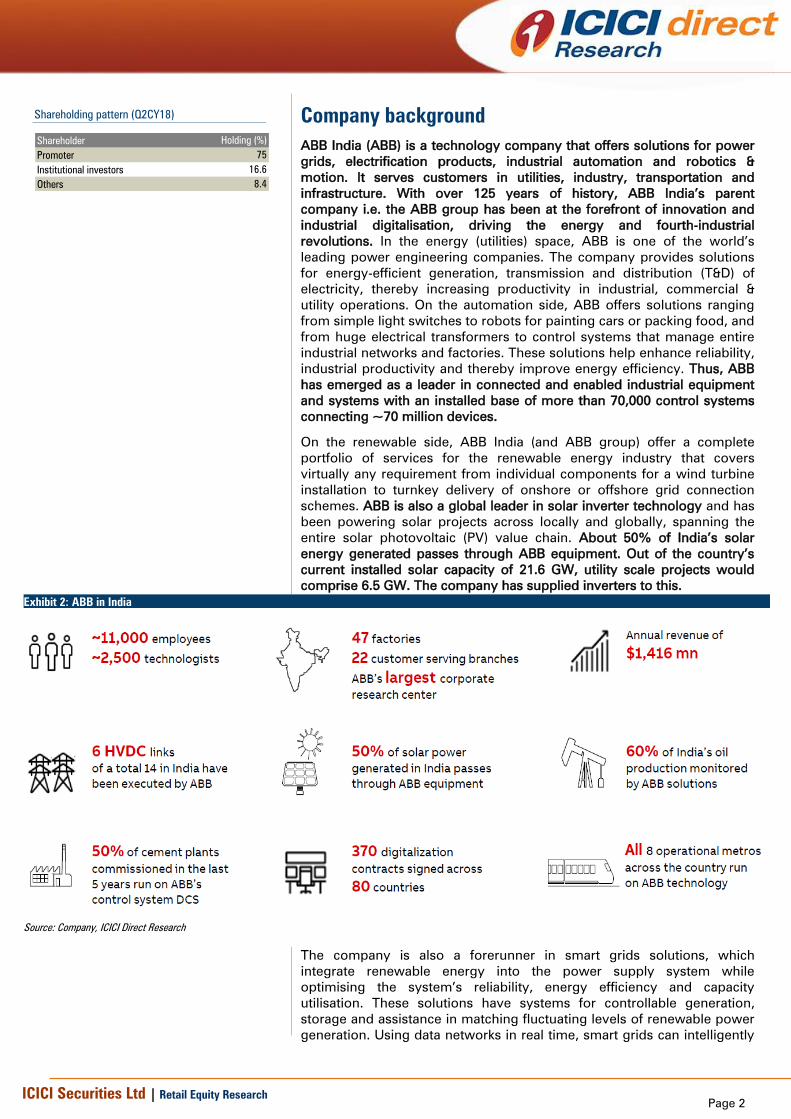
Exhibit 2: ABB in India
Source: Company, ICICI Direct Research
The company is also a forerunner in smart grids solutions, which
integrate renewable energy into the power supply system while
optimising the system’s reliability, energy efficiency and capacity
utilisation. These solutions have systems for controllable generation,
storage and assistance in matching fluctuating levels of renewable power
generation. Using data networks in real time, smart grids can intelligently
Shareholding pattern (Q2CY18)
Shareholder Holding (%)
Promoter 75
Institutional investors 16.6
Others 8.4

Page 3 ICICI Securities Ltd | Retail Equity Research
and automatically control these increasingly complex power systems. The
ABB group is a pioneer in micro grid technology with more than 30 global
installations across a diverse range of applications serving remote
communities, islanded grids, utility grid support and industrial campuses.
Brief history of ABB India
ABB’s origins in India go back several decades when Asea was set up as
an agency in 1928. The company was incorporated in 1949 as the
Hindustan Electric Company and later became Hindustan Brown Boveri
(HBB) in 1965. Following the amalgamation with Asea Ltd in 1989 it
became Asea Brown Boveri. The name was changed to ABB Ltd in 2003.
Today, ABB has a local presence with 47 factories across nine
manufacturing locations and 22 sales & marketing offices across India.
The company’s major plants are at Bangalore, Faridabad, Haridwar,
Mumbai, Nashik and Vadodara. ABB India also exports to over 100
countries and has employee strength of 5590 (permanent) employees.
Exhibit 3: Brief history and key milestones of ABB India
2013-17
2001- 12
1949-881989- 2000
• Co. renamed as Asea Brown Boveri Ltd in
1989 after merger of Asea, Sweden & BBC
Brown Boveri, Switzerland
• Commissioned first high voltage direct
current transmission link for connecting
Northern & Western power grids
• Commissioned process control system for
petrochemical complex for RIL Ltd
• Launched new 400 KV transformers
• Wins order for power products, automaton
systems for Delhi International Airport
Terminal (T3)
• Sets up state-of-the-art manufacturing
facility near Bangalore
• Inaugurates global wind power generator
factory in India
• Inaugurates new facility for miniature
circuit breakers, residual current circuit
breakers and surge protection devices
• Incorporated as Hindustan Electric Co. Ltd in
1949 to manufacture power products
(transformers, electric motors, conductors,
furnaces, etc)
• Name changed to Hindustan Brown Boveri
after collaboration with Switzerland's Brown
Boveri in 1965
• Pioneered manufacture of industrial steam
engines, switch gears, relays and signals for
railways, etc.
• Receives order from PGCIL to construct
switchgear substation to boost transmission
capacity in the southern region. Name
changed to ABB India Ltd
• Introduced first 800kV converter transformer.
Integrates power from world’s largest solar
plants to national transmission grid
• Doubles solar inverter manufacturing
capacity. Wins order to supply 1600
transformers to railways
Source: Company, ICICI Direct Research
The parent company was started by Charles Brown and
Walter Boveri in Switzerland in 1891.

Page 4 ICICI Securities Ltd | Retail Equity Research
ABB’s business segments, revenue break-up & clientele
ABB’s business segments
ABB’s business can be broadly classified into four main segments, ‘power
grids’, ‘electrification products’, ‘robotics and motion’ and ‘industrial
automation’. The company’s business segments are organised around
products and (system) solutions provided to its customers, including
utilities, industries, channel partners & original equipment manufacturers.
Exhibit 4: ABB’s offerings for customers
Source: Company, ICICI Direct Research
Exhibit 5: ABB’s key business segments
Power Grids
ABB's key business segments
Electrification Products
Industrial Automation
Robotics & Motion
Source: Company, ICICI Direct Research
ABB’s revenue segmentation/break-up
Over the last three fiscals (CY15-17), the break-down of ABB’s average
operating revenues is as follows: As seen in the above exhibit, ABB earns
majority of its revenue from the power grids segment (~41%) followed by
electrification products (~24%), robotics & motions (~22%) and industrial
automation (~16%).
Exhibit 6: Revenue segmentation
Revenue break-up CY15 CY16 CY17 CY15-17
Power Grids 3533 3691 3832 11056
As % of total 43.4 40.2 40.9 41.4
Robotics and Motion 2062 1936 1936 5934
As % of total 25.3 21.1 20.6 22.2
Electrification Products 1651 2390 2439 6480
As % of total 20.3 26.0 26.0 24.3
Industrial Automation 1337 1485 1409 4231
As % of total 16.4 16.2 15.0 15.8
Total 8140 9184 9375 26699
Source: Company, ICICI Direct Research
Exhibit 7: ABB’s key business segments
Revenue break-up CY15-17
Power Grids
41%
Robotics and
Motion
21%
Electrification
Products
23%
Industrial
Automation
15%
`
Source: Company, ICICI Direct Research
ABB derives its revenues from three major segments – products, projects
and services. The first two segments together contribute ~93% of
revenues while services contribute the remaining ~7%. In the products
and projects segments, the major products and projects that ABB offers is
exhibited below. In each category such as electric drives, electric motors,
switch gears, transformers (power transformers, distribution
transformers, traction transformers), HVDC transmission projects, solar
Page 5 ICICI Securities Ltd | Retail Equity Research
invertors, ABB faces competition from a variety of local and global players
like Siemens, GE T&D, Danfoss, Bhel, ATB motors, WEG, Leroy Somer,
Schneider, L&T, Stelmec, TBEA, CG Power, TRIL, Toshiba, Aston
transformers AS, Bemag Transformers, Bowers Electricals, Daihen
Corporation, SMA, TMEIC, Hitachi, Delta, Sungrow, Gamesa Solar,
Huawei, etc.
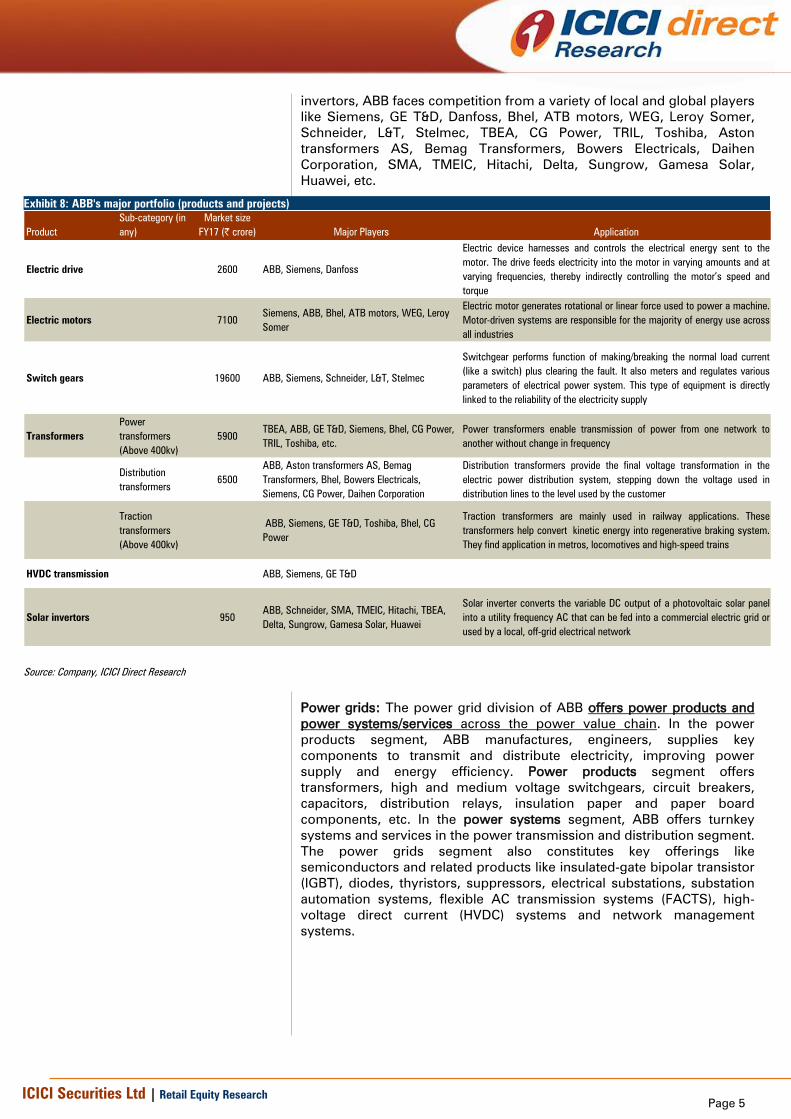
Exhibit 8: ABB's major portfolio (products and projects)
Product
Sub-category (in
any)
Market size
FY17 (| crore) Major Players Application
Electric drive 2600 ABB, Siemens, Danfoss
Electric device harnesses and controls the electrical energy sent to the
motor. The drive feeds electricity into the motor in varying amounts and at
varying frequencies, thereby indirectly controlling the motor’s speed and
torque
Electric motors 7100
Siemens, ABB, Bhel, ATB motors, WEG, Leroy
Somer
Electric motor generates rotational or linear force used to power a machine.
Motor-driven systems are responsible for the majority of energy use across
all industries
Switch gears 19600 ABB, Siemens, Schneider, L&T, Stelmec
Switchgear performs function of making/breaking the normal load current
(like a switch) plus clearing the fault. It also meters and regulates various
parameters of electrical power system. This type of equipment is directly
linked to the reliability of the electricity supply
Transformers
Power
transformers
(Above 400kv)
5900
TBEA, ABB, GE T&D, Siemens, Bhel, CG Power,
TRIL, Toshiba, etc.
Power transformers enable transmission of power from one network to
another without change in frequency
Distribution
transformers
6500
ABB, Aston transformers AS, Bemag
Transformers, Bhel, Bowers Electricals,
Siemens, CG Power, Daihen Corporation
Distribution transformers provide the final voltage transformation in the
electric power distribution system, stepping down the voltage used in
distribution lines to the level used by the customer
Traction
transformers
(Above 400kv)
ABB, Siemens, GE T&D, Toshiba, Bhel, CG
Power
Traction transformers are mainly used in railway applications. These
transformers help convert kinetic energy into regenerative braking system.
They find application in metros, locomotives and high-speed trains
HVDC transmission ABB, Siemens, GE T&D
Solar invertors 950
ABB, Schneider, SMA, TMEIC, Hitachi, TBEA,
Delta, Sungrow, Gamesa Solar, Huawei
Solar inverter converts the variable DC output of a photovoltaic solar panel
into a utility frequency AC that can be fed into a commercial electric grid or
used by a local, off-grid electrical network
Source: Company, ICICI Direct Research
Power grids: The power grid division of ABB offers power products and
power systems/services across the power value chain. In the power
products segment, ABB manufactures, engineers, supplies key
components to transmit and distribute electricity, improving power
supply and energy efficiency. Power products segment offers
transformers, high and medium voltage switchgears, circuit breakers,
capacitors, distribution relays, insulation paper and paper board
components, etc. In the power systems segment, ABB offers turnkey
systems and services in the power transmission and distribution segment.
The power grids segment also constitutes key offerings like
semiconductors and related products like insulated-gate bipolar transistor
(IGBT), diodes, thyristors, suppressors, electrical substations, substation
automation systems, flexible AC transmission systems (FACTS), high-
voltage direct current (HVDC) systems and network management
systems.

Page 6 ICICI Securities Ltd | Retail Equity Research
Exhibit 9: Power grids – Offerings
Power Grids
• Control Systems
• Power Converters &
Inverters
• Power Plant
Automation &
Optimisation
• Turbine Control
• Turnkey Power Plant
Solutions
• FACTS
• HVDC
• Microgrids
Substations and
Electrification
• AIS Substations
• GIS Substations
• Hybrid Substations
• Mobile Substations
• Containerised&
Prefabricated
Substations
• Energy Storage
Solutions
Semiconductors
• IGBT & Diode
Modules
• Press-pack IGBT
Modules
• Insulated gate-
commutated
thyristors (IGCT)
• Thyristors
• Diodes
• Gate turn-off
thyristors (GTO)
• Silicon surge voltage
Substations Automation
Protection & Control
• Substation Automation
Systems
• Substation Automation
Products
• Distribution
Automation Systems
• Distribution
Automation Products
Source: Company, ICICI Direct Research
Electrification products: Electrification products segment (EP) includes
medium voltage and low voltage products like circuit breakers, switches,
control products, wiring accessories, enclosures and cable systems to
protect people, installations and electronic equipment from electrical
overload. The division further makes KNX systems that integrate and
automate a building’s electrical installations, ventilation systems and
security & data communication networks. KNX systems are standardised
OSI-based network communications protocols for building automation
systems. Electrification products also incorporate an electrification
solutions unit that manufactures low voltage switchgear and motor
control centres. Customers for electrification product include a wide
range of industry and utility operations, plus commercial and residential
buildings. Over the last couple of years, the electrification products
division has seen portfolio expansion with the inclusion of
Solar business (solar inverters, micro grid solutions, energy
storage solutions, etc),
Power quality businesses (UPS, switches, etc) and
Electric vehicle charging (standard chargers, fast chargers)
ABB group (parent co of ABB India) acquired GE Industrial
Solutions to gain a foothold in the electrification product
space in the US and Europe. The acquisition process is
underway and is likely to be over by H2CY18…

Page 7 ICICI Securities Ltd | Retail Equity Research
Exhibit 10: Electrification Products –Offerings
Medium voltage
products
• Modular systems
• Switchgears
• Apparatus
• Distribution
automation &
protection
• Services
Low voltage
products/systems
• Electrical
installation
• Electrical
distribution
• Automation
control &
protection
• Building
technologies
Solar inverters
• String inverters
• Turnkey stations
• Software tools
• Central inverters
• Energy storage
Solutions
• Microgrid solutions
• Legacy inverters
• Monitoring &
communication
EV charging
infrastructure
• Multi-standard
fast chargers
• Single-standard
fast chargers
• Highway & en
route fast
chargers
• Chargers for EV
dealers &
commercial
locations
UPS & power
conditioning
• UPS systems
• Power & voltage
conditioners
• Static switches
• Power distribution
• DC chargers
Source: Company, ICICI Direct Research
Industrial automation: The main focus in this business segment is on
providing customers with integrated solutions for better control of
industrial systems and/or plant optimisation. Products offered in this
segment include control systems, measurement products, turbo-
chargers, programmable logic controllers, etc. The industries serviced
here include oil & gas, power, chemicals, pharmaceuticals, pulp & paper,
metals & minerals, marine, etc. The idea behind offering industrial
automation solutions to clients is to improve their asset productivity and
reduce cost via energy savings.
Exhibit 11: Industrial automation –Offerings
Control systems
• Control room
Consolidation
• Safety systems
• Compact product
suite
• ABB ability Symphony
plus
• ABB ability system
800xA
Turbochargers
• Turbochargers for low,
medium & high speed
engines in marine, oil &
gas, power generation,
earthmoving & mining
equipment & rail
• Efficiency enhancement
technologies such as
high-pressure tuning,
valve control
management, variable
turbine geometry &
waste heat recovery
systems
Measurement products
• Actuators
• Diesel engine
monitoring
• Web tension
measurement
• Thickness gauging
• positioners
• Level measurement
products
• Roll force
measurement
Programmable logic
controllers
• PLCs
• Automation builder
• ZenonIoTSoftware
• Control panels
• Legacy products
Source: Company, ICICI Direct Research
Page 8 ICICI Securities Ltd | Retail Equity Research
To fill some gaps in the company’s portfolio, the ABB group acquired
B&R, an Austrian company for offerings in factory automation and
machine automation.
Robotics & motion: ABB is a leading supplier of industrial robots. It has
installed more than 160,000 robots worldwide. It is also a leading supplier
of robot software, peripheral equipment, modular manufacturing cells and
services for tasks such as welding, handling, assembly, painting and
finishing, picking, packing, palletising and machine tending. ABB’s
robotics and motion solutions help manufacturers improve productivity,
product quality and worker safety. Industries where ABB has already
provided robotic solutions are automotive, plastics, metal fabrication,
foundry, electronics, machine tools, pharmaceutical, food & beverage, etc.
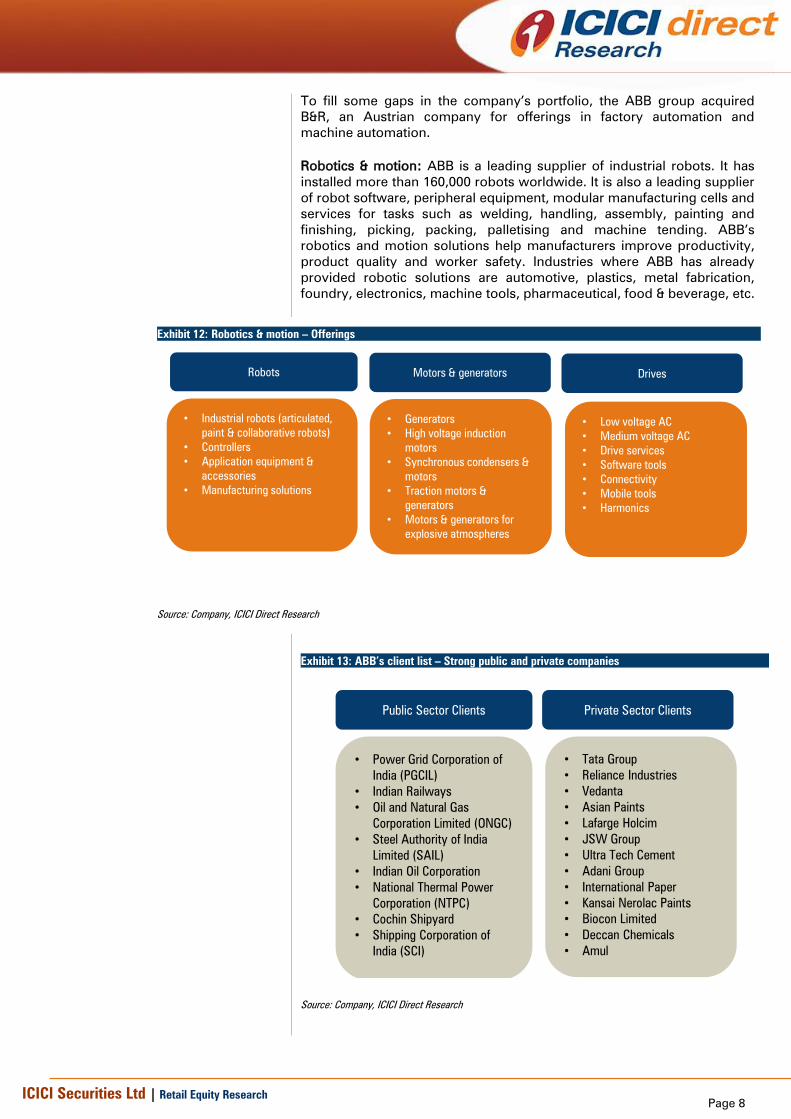
Exhibit 12: Robotics & motion – Offerings
Robots
• Industrial robots (articulated,
paint & collaborative robots)
• Controllers
• Application equipment &
accessories
• Manufacturing solutions
Motors & generators
• Generators
• High voltage induction
motors
• Synchronous condensers &
motors
• Traction motors &
generators
• Motors & generators for
explosive atmospheres
Drives
• Low voltage AC
• Medium voltage AC
• Drive services
• Software tools
• Connectivity
• Mobile tools
• Harmonics
Source: Company, ICICI Direct Research
Exhibit 13: ABB’s client list – Strong public and private companies
Public Sector Clients
• Power Grid Corporation of
India (PGCIL)
• Indian Railways
• Oil and Natural Gas
Corporation Limited (ONGC)
• Steel Authority of India
Limited (SAIL)
• Indian Oil Corporation
• National Thermal Power
Corporation (NTPC)
• Cochin Shipyard
• Shipping Corporation of
India (SCI)
Private Sector Clients
• Tata Group
• Reliance Industries
• Vedanta
• Asian Paints
• Lafarge Holcim
• JSW Group
• Ultra Tech Cement
• Adani Group
• International Paper
• Kansai Nerolac Paints
• Biocon Limited
• Deccan Chemicals
• Amul
Source: Company, ICICI Direct Research
Page 9 ICICI Securities Ltd | Retail Equity Research
Investment Rationale
Leveraging upcoming capex spend in T&D segment
The Indian power sector has significantly evolved over the past 10-15
years with successive governments moving steadily on a ‘Power for all’
initiative. Towards this, subsequent governments have formulated a
number of policies and spent huge sums building capacities in the power
value chain (generation, transmission & distribution). While capacities in
the ‘generation’ segment have been built at a significant pace,
transmission and distribution (T&D) capacities have lagged in pace over
the last decade. As exhibited in the table below, capacities in the
generation segment have grown at 8.9% CAGR in FY08-18. In the same
period, capacities in the T&D segment have grown at only 6.3% and
8.5%, respectively. For a fully strengthened network, additions in the T&D
segment should outpace generation segment growth.
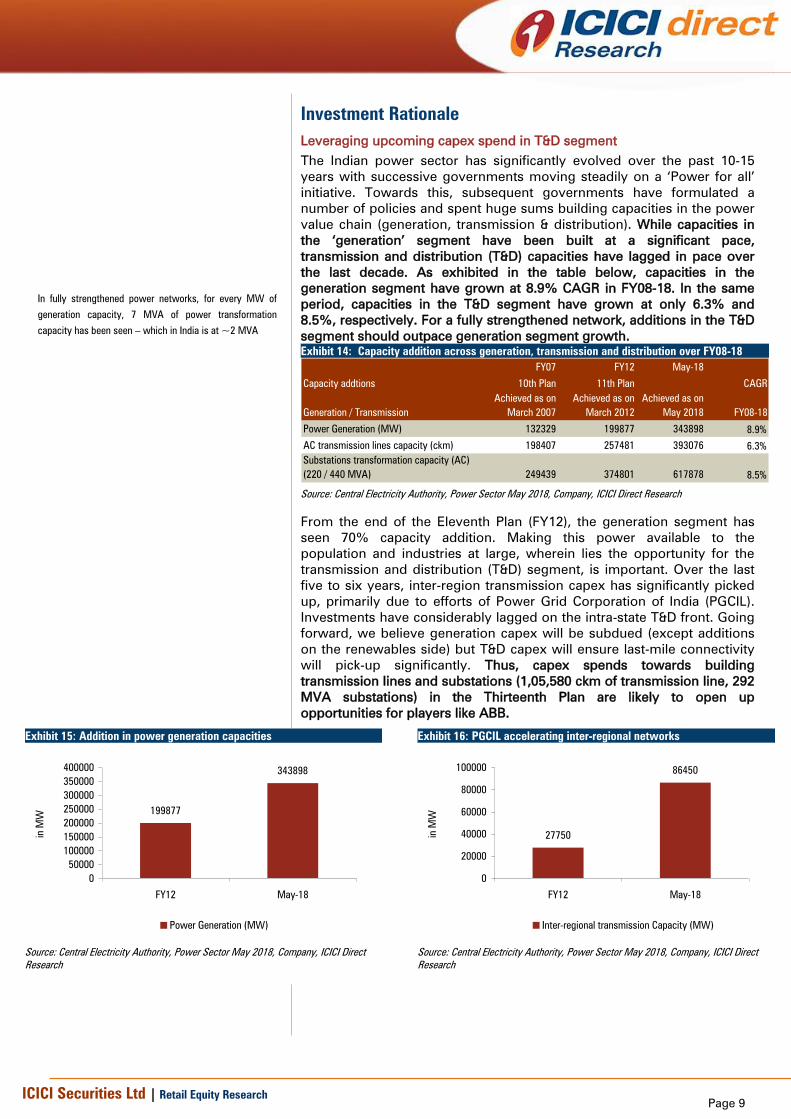
Exhibit 14: Capacity addition across generation, transmission and distribution over FY08-18
FY07 FY12 May-18
Capacity addtions 10th Plan 11th Plan CAGR
Generation / Transmission
Achieved as on
March 2007
Achieved as on
March 2012
Achieved as on
May 2018 FY08-18
Power Generation (MW) 132329 199877 343898 8.9%
AC transmission lines capacity (ckm) 198407 257481 393076 6.3%
Substations transformation capacity (AC)
(220 / 440 MVA) 249439 374801 617878 8.5%
Source: Central Electricity Authority, Power Sector May 2018, Company, ICICI Direct Research
From the end of the Eleventh Plan (FY12), the generation segment has
seen 70% capacity addition. Making this power available to the
population and industries at large, wherein lies the opportunity for the
transmission and distribution (T&D) segment, is important. Over the last
five to six years, inter-region transmission capex has significantly picked
up, primarily due to efforts of Power Grid Corporation of India (PGCIL).
Investments have considerably lagged on the intra-state T&D front. Going
forward, we believe generation capex will be subdued (except additions
on the renewables side) but T&D capex will ensure last-mile connectivity
will pick-up significantly. Thus, capex spends towards building
transmission lines and substations (1,05,580 ckm of transmission line, 292
MVA substations) in the Thirteenth Plan are likely to open up
opportunities for players like ABB.
Exhibit 15: Addition in power generation capacities
199877
343898
0
50000
100000
150000
200000
250000
300000
350000
400000
FY12 May-18
in M
W
Power Generation (MW)
Source: Central Electricity Authority, Power Sector May 2018, Company, ICICI Direct
Research
Exhibit 16: PGCIL accelerating inter-regional networks
27750
86450
0
20000
40000
60000
80000
100000
FY12 May-18
in M
W
Inter-regional transmission Capacity (MW)
Source: Central Electricity Authority, Power Sector May 2018, Company, ICICI Direct
Research
In fully strengthened power networks, for every MW of
generation capacity, 7 MVA of power transformation
capacity has been seen – which in India is at ~2 MVA

Page 10 ICICI Securities Ltd | Retail Equity Research
Exhibit 17: Addition in transmission capacities
257481
393076
0
100000
200000
300000
400000
500000
FY12 May-18
in M
W
AC transmission lines capacity (ckm)
1.5x
Source: Central Electricity Authority, Power Sector May 2018, Company, ICICI Direct
Research
Exhibit 18: Addition in substation trans capacities
374801
617878
0
100000
200000
300000
400000
500000
600000
700000
FY12 May-18
in M
W
Substations transformation capacity (AC) (220 / 440
MVA)
Source: Central Electricity Authority, Power Sector May 2018, Company, ICICI Direct
Research
Exhibit 19: Expected transmission systems addition during Thirteenth Plan
Expected % Growth
10th Plan
till FY07
11th Plan
till FY12
12th Plan
till FY17 Additon in 13th Plan
13th Plan
Till FY22E
In 13th plan over
12th
TRANSMISSION LINES
(a) HVDC ± 500kV/800 kV Bipole Ckm 5872 9432 15535 4280 19815 27.6%
(b) 765 kV Ckm 2184 5250 29431 27300 56731 92.8%
(c) 400 kV Ckm 75722 106819 157644 46000 203644 29.2%
(d) 230/220kV Ckm 114629 135980 162325 28000 190325 17.2%
Total–Transmission Lines Ckm 198407 257481 364935 105580 470515 28.9%
SUBSTATIONS
(a) 765 kV MVA 0 25000 155000 114000 269000 73.5%
(b) 400 kV MVA 92942 151027 234372 103000 337372 43.9%
(c) 230/220 kV MVA 156497 223774 298265 75000 373265 25.1%
Total – Substations MVA 249439 399801 687637 292000 979637 42.5%
HVDC
(a)Bi-pole link capacity MW 5000 6750 13500 14000 27500 103.7%
(b) Back-to back capacity MW 3000 3000 3000 0 3000 0.0%
Total - HVDC MW 8000 9750 16500 14000 30500 84.8%
Achieved
Source: Central Electricity Authority, National Electricity Plan Vol-II (Transmission), Central Electricity Authority, Power Sector April-2018, Company, ICICI Direct Research
Graduation to higher voltage networks entail additional spends
India is steadily moving towards a higher voltage line in its transmission
network. This is primarily to reduce losses while transmitting power over
long distances on low voltage networks. Reduction in losses is also very
important as India is planning a substantial increase in capacity inter-
regionally i.e. power transmission over long distance transmission lines.
Capacity in this segment is likely to grow from the current ~86 GW to 127
GW in FY22E.

Page 11 ICICI Securities Ltd | Retail Equity Research
Exhibit 20: Capacity addition in inter-regional networks in FY18-22E
FY12 May-18 Mar-22
Capacity addtions 11th Plan CAGR
Generation / Transmission
Achieved as on
March 2012
Achieved as on
May 2018
Targetted
achievement FY18-22E
Inter-regional transmission Capacity (MW) 27750 86450 127000 10.1%
Source: Central Electricity Authority, Power Sector May 2018, Company, ICICI Direct Research
In terms of the current transmission line network, the country has
3,93,076 circuit kilometre (ckm) of transmission lines, including both
alternating current (AC) and direct current (DC) as on May 2018. Of the
total transmission network, 220 ckm and 400 ckm transmission lines
constitute 90.6% of the total network (refer exhibit below). Similarly, the
total substation transformation capacity is at 8,34,878 MVA, of which 220
MVA and 400 MVA substations comprise 76.1% of total capacity. To
improve the efficiency of the entire power value chain, this necessitates
spends on graduating lower networks to higher ones with corresponding
spends on transformation capacity.
Exhibit 21: Graduation to higher voltage networks entails additional spends
FY07 FY12 May-18
Voltage 6th Plan 7th Plan 8th Plan 9th Plan 10th Plan 11th Plan
Transmission system Type (KV) level Unit
Achieved as on
March 2007
Achieved as on
March 2012
Achieved as on
May 2018
765 ckm 0 0 0 1160 2184 5250 35301
400 ckm 6029 19824 36142 49378 75722 106819 172263
220 ckm 46005 59631 79600 96993 114629 135980 169956
Total ckm 52034 79455 115742 147531 192535 248049 377520
(220 ckm+400 ckm) as % of total
transmission lines90.6%
HVDC ckm 0 0 1634 4738 5872 9432 15556
Total (AC+HVDC) ckm 52034 79455 117376 152269 198407 257481 393076
765 MVA 0 0 0 0 0 25000 194500
400 MVA 9330 21580 40865 60380 92942 151027 284197
220 MVA 37291 53742 84177 116363 156497 223774 333681
Total AC MVA 46621 75322 125042 176743 249439 399801 812378
(220 MVA+400 MVA) as % of total
substation transformation capacity76.1%
HVDC MW 0 0 0 5200 8200 9750 22500
AC+HVDC 46621 75322 125042 181943 257639 409551 834878
Inter-regional transmission Capacity MW 14050 27750 86450
AC Transmission lines
AC Substations Transformation Capacity
Source: Central Electricity Authority, National Electricity Plan Vol-II (Transmission), Central Electricity Authority, Power Sector April-2018, Company, ICICI Direct Research
Focus on loss reduction by state electricity boards (SEBs) to benefit ABB
Going forward, SEB’s efforts towards increasing network efficiency by
reducing AT&C losses would entail significant spends. This is likely to
open up opportunities for players like ABB given its strong portfolio in
network management systems and grid stabilisation systems such as
flexible AC systems (FACTS) and static compensators (STATCOM). Intra-
state and distribution segment capex had not picked up over the past
many years due the weak state of SEB finances. However, with
government policies and incentives in place, like launch of Ujjwal Discom
Assurance Yojana (UDAY) in November, 2015, we believe we should see
gradual progress over the next two to three years. The same is also
visible in the aggregate performance of discoms over the last two to three
years. The AT&C loss (aggregate technical and commercial loss) was at

Page 12 ICICI Securities Ltd | Retail Equity Research
21.8% in 2015-16. With the implementation of Uday over the last two and
a half years, the current AT & C losses were at 18.7%.
Going forward, as projected by Central Electricity Authority, National
Electricity Plan, the T&D segment is likely to see spends of ~ | 2,60,000
crore in 2017-22E. Of the total amount, around | 1, 60,000 crore is likely to
be spent by states and the rest by PGCIL. Considering ABB’s strong
product portfolio and long-standing presence in this segment, we believe
its power grids are likely to do well over the coming few years.
High voltage direct current (HVDC) transmission – ABB a pioneer
HVDC has emerged as the key technology for inter-connecting regions
and countries for electricity transfer as it helps transmit more power with
fewer infrastructure. The network also helps in synchronising electricity
generated from different sources. HVDC also helps connect power plants
to distant load dispatch centres and facilitates development of energy
highways to transfer large amounts of power over long distances.
In FY16-17, ABB won a mega HVDC project worth over | 4350 crore to
deliver a transmission link that will have the capacity to bring electricity to
~8 crore people. The Raigarh-Pugalur 800 kilovolt (kV) ultrahigh-voltage
direct current (UHVDC) system will connect Raigarh in Central India to
Pugalur in Tamil Nadu.
The 1,830 km link is among the longest in the world. With a capacity of
6,000 MW – the equivalent of more than six large power plants – it will be
enough to meet the electricity needs of over 8 crore people in India. The
two-way link will integrate thermal and wind energy for transmission of
power to high consumption centres located thousands of kilometre away,
supporting electricity demand in the south, when wind strength is low,
and transmitting clean energy to the north, when there is excess wind
power. This mega project is expected to be completed in 2019. The
turnkey project encompasses design, engineering, supply, installation &
commissioning while major equipment supplies include the complete
UHVDC stations, including transformers, converter valves, cooling
systems, as well as control and protection technology.
ABB has an impressive HVDC track-record in India, where it introduced
the technology over 25 years ago with the Vindhyachal project in 1989.
Raigarh-Pugalur is ABB’s sixth HVDC project in India and the second
UHVDC installation, following the multi-terminal North-East Agra link. The
1,728 km long North-East Agra UHVDC link is the world’s highest HVDC
transmission system as well as the first to have three converter stations.
The UHVDC link transmits ~6,000 MW of clean hydroelectric power from
the north east region of the country to Agra, Uttar Pradesh.
Going forward, while there are no major domestic HVDC orders in the
pipeline, some orders in the form of inter-country projects may be
finalised. They include,
Katihar (India)-Parbatipur (Bangladesh)-Bornagar (India) 765kv DC line
along with 500 MW HVDC back-to-back terminal at Parbatipur. The
total project is likely to be $ 700 million or ~| 5000 crore
500 MW HVDC bipole lines between Madurai (India) and New
Anuradhapura (Sri Lanka). The HVDC link would measure ~285 km,
including 50 km of submarine cables. The project cost is likely to be
~| 5500 crore
Overall, we estimate ABB’s ‘power grids’ division to grow at a CAGR of
9.5% in CY17-19E.
ABB India is the only Indian manufacturer to successfully
test 765 kV generator step up and tie transformers at
KEMA. The company achieved another milestone of
releasing the first batch of locally manufactured 400 kV gas
insulated switchgear (GIS) bays for the largest
transmission network in the country
Page 13 ICICI Securities Ltd | Retail Equity Research
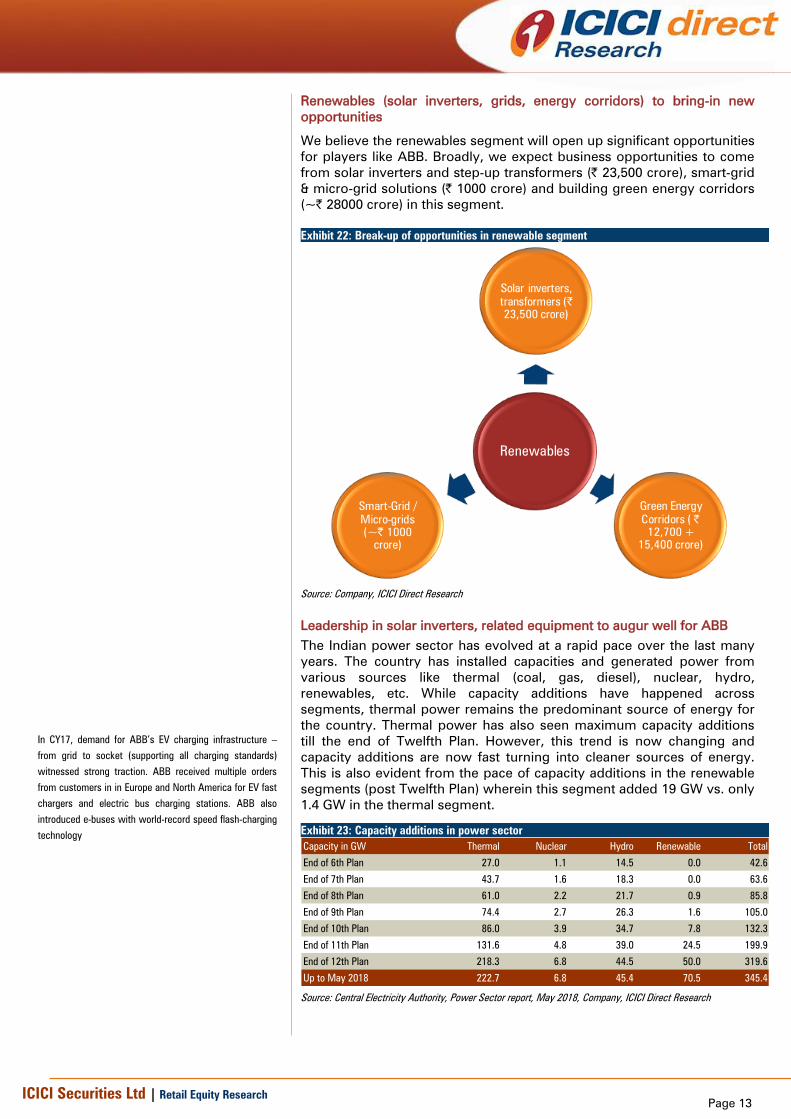
Renewables (solar inverters, grids, energy corridors) to bring-in new
opportunities
We believe the renewables segment will open up significant opportunities
for players like ABB. Broadly, we expect business opportunities to come
from solar inverters and step-up transformers (| 23,500 crore), smart-grid
& micro-grid solutions (| 1000 crore) and building green energy corridors
(~| 28000 crore) in this segment.
Exhibit 22: Break-up of opportunities in renewable segment
Renewables
Solar inverters,
transformers (|
23,500 crore)
Green Energy
Corridors ( |
12,700 +
15,400 crore)
Smart-Grid /
Micro-grids
(~| 1000
crore)
Source: Company, ICICI Direct Research
Leadership in solar inverters, related equipment to augur well for ABB
The Indian power sector has evolved at a rapid pace over the last many
years. The country has installed capacities and generated power from
various sources like thermal (coal, gas, diesel), nuclear, hydro,
renewables, etc. While capacity additions have happened across
segments, thermal power remains the predominant source of energy for
the country. Thermal power has also seen maximum capacity additions
till the end of Twelfth Plan. However, this trend is now changing and
capacity additions are now fast turning into cleaner sources of energy.
This is also evident from the pace of capacity additions in the renewable
segments (post Twelfth Plan) wherein this segment added 19 GW vs. only
1.4 GW in the thermal segment.
Exhibit 23: Capacity additions in power sector
Capacity in GW Thermal Nuclear Hydro Renewable Total
End of 6th Plan 27.0 1.1 14.5 0.0 42.6
End of 7th Plan 43.7 1.6 18.3 0.0 63.6
End of 8th Plan 61.0 2.2 21.7 0.9 85.8
End of 9th Plan 74.4 2.7 26.3 1.6 105.0
End of 10th Plan 86.0 3.9 34.7 7.8 132.3
End of 11th Plan 131.6 4.8 39.0 24.5 199.9
End of 12th Plan 218.3 6.8 44.5 50.0 319.6
Up to May 2018 222.7 6.8 45.4 70.5 345.4
Source: Central Electricity Authority, Power Sector report, May 2018, Company, ICICI Direct Research
In CY17, demand for ABB’s EV charging infrastructure –
from grid to socket (supporting all charging standards)
witnessed strong traction. ABB received multiple orders
from customers in in Europe and North America for EV fast
chargers and electric bus charging stations. ABB also
introduced e-buses with world-record speed flash-charging
technology
Page 14 ICICI Securities Ltd | Retail Equity Research
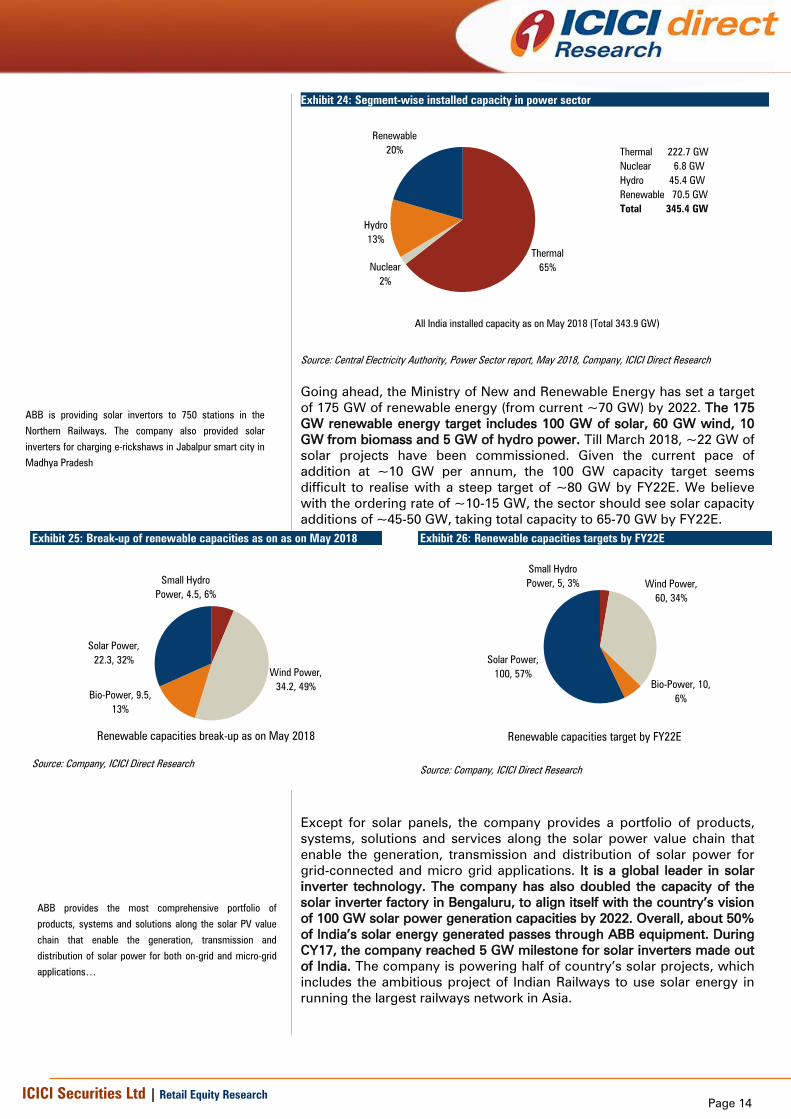
Exhibit 24: Segment-wise installed capacity in power sector
All India installed capacity as on May 2018 (Total 343.9 GW)
Thermal
65%Nuclear
2%
Hydro
13%
Renewable
20% Thermal 222.7 GW
Nuclear 6.8 GW
Hydro 45.4 GW
Renewable 70.5 GW
Total 345.4 GW
Source: Central Electricity Authority, Power Sector report, May 2018, Company, ICICI Direct Research
Going ahead, the Ministry of New and Renewable Energy has set a target
of 175 GW of renewable energy (from current ~70 GW) by 2022. The 175
GW renewable energy target includes 100 GW of solar, 60 GW wind, 10
GW from biomass and 5 GW of hydro power. Till March 2018, ~22 GW of
solar projects have been commissioned. Given the current pace of
addition at ~10 GW per annum, the 100 GW capacity target seems
difficult to realise with a steep target of ~80 GW by FY22E. We believe
with the ordering rate of ~10-15 GW, the sector should see solar capacity
additions of ~45-50 GW, taking total capacity to 65-70 GW by FY22E.
Exhibit 25: Break-up of renewable capacities as on as on May 2018
Renewable capacities break-up as on May 2018
Solar Power,
22.3, 32%
Bio-Power, 9.5,
13%
Wind Power,
34.2, 49%
Small Hydro
Power, 4.5, 6%
Source: Company, ICICI Direct Research
Exhibit 26: Renewable capacities targets by FY22E
Renewable capacities target by FY22E
Small Hydro
Power, 5, 3% Wind Power,
60, 34%
Bio-Power, 10,
6%
Solar Power,
100, 57%
Source: Company, ICICI Direct Research
Except for solar panels, the company provides a portfolio of products,
systems, solutions and services along the solar power value chain that
enable the generation, transmission and distribution of solar power for
grid-connected and micro grid applications. It is a global leader in solar
inverter technology. The company has also doubled the capacity of the
solar inverter factory in Bengaluru, to align itself with the country’s vision
of 100 GW solar power generation capacities by 2022. Overall, about 50%
of India’s solar energy generated passes through ABB equipment. During
CY17, the company reached 5 GW milestone for solar inverters made out
of India. The company is powering half of country’s solar projects, which
includes the ambitious project of Indian Railways to use solar energy in
running the largest railways network in Asia.
ABB is providing solar invertors to 750 stations in the
Northern Railways. The company also provided solar
inverters for charging e-rickshaws in Jabalpur smart city in
Madhya Pradesh
ABB provides the most comprehensive portfolio of
products, systems and solutions along the solar PV value
chain that enable the generation, transmission and
distribution of solar power for both on-grid and micro-grid
applications…
Page 15 ICICI Securities Ltd | Retail Equity Research
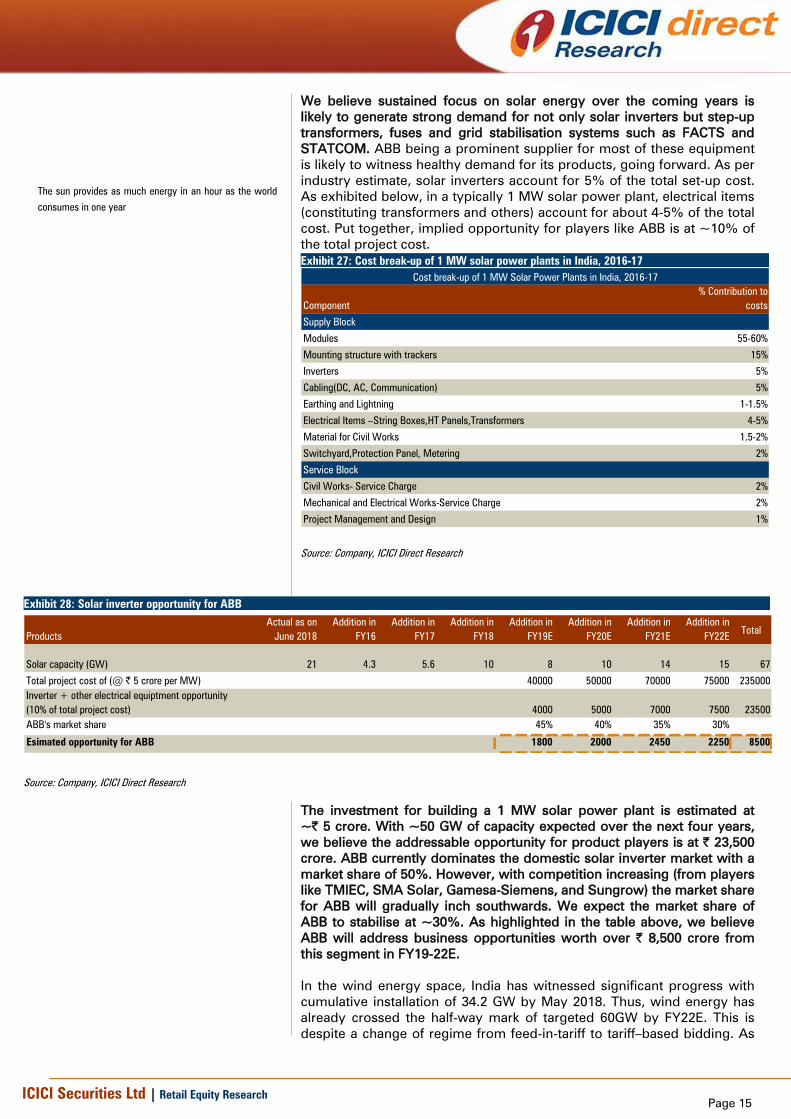
We believe sustained focus on solar energy over the coming years is
likely to generate strong demand for not only solar inverters but step-up
transformers, fuses and grid stabilisation systems such as FACTS and
STATCOM. ABB being a prominent supplier for most of these equipment
is likely to witness healthy demand for its products, going forward. As per
industry estimate, solar inverters account for 5% of the total set-up cost.
As exhibited below, in a typically 1 MW solar power plant, electrical items
(constituting transformers and others) account for about 4-5% of the total
cost. Put together, implied opportunity for players like ABB is at ~10% of
the total project cost.
Exhibit 27: Cost break-up of 1 MW solar power plants in India, 2016-17
Component
% Contribution to
costs
Supply Block
Modules 55-60%
Mounting structure with trackers 15%
Inverters 5%
Cabling(DC, AC, Communication) 5%
Earthing and Lightning 1-1.5%
Electrical Items –String Boxes,HT Panels,Transformers 4-5%
Material for Civil Works 1.5-2%
Switchyard,Protection Panel, Metering 2%
Service Block
Civil Works- Service Charge 2%
Mechanical and Electrical Works-Service Charge 2%
Project Management and Design 1%
Cost break-up of 1 MW Solar Power Plants in India, 2016-17
Source: Company, ICICI Direct Research
Exhibit 28: Solar inverter opportunity for ABB
Products
Actual as on
June 2018
Addition in
FY16
Addition in
FY17
Addition in
FY18
Addition in
FY19E
Addition in
FY20E
Addition in
FY21E
Addition in
FY22ETotal
Solar capacity (GW) 21 4.3 5.6 10 8 10 14 15 67
Total project cost of (@ | 5 crore per MW) 40000 50000 70000 75000 235000
Inverter + other electrical equiptment opportunity
(10% of total project cost) 4000 5000 7000 7500 23500
ABB's market share 45% 40% 35% 30%
Esimated opportunity for ABB 1800 2000 2450 2250 8500
Source: Company, ICICI Direct Research
The investment for building a 1 MW solar power plant is estimated at
~| 5 crore. With ~50 GW of capacity expected over the next four years,
we believe the addressable opportunity for product players is at | 23,500
crore. ABB currently dominates the domestic solar inverter market with a
market share of 50%. However, with competition increasing (from players
like TMIEC, SMA Solar, Gamesa-Siemens, and Sungrow) the market share
for ABB will gradually inch southwards. We expect the market share of
ABB to stabilise at ~30%. As highlighted in the table above, we believe
ABB will address business opportunities worth over | 8,500 crore from
this segment in FY19-22E.
In the wind energy space, India has witnessed significant progress with
cumulative installation of 34.2 GW by May 2018. Thus, wind energy has
already crossed the half-way mark of targeted 60GW by FY22E. This is
despite a change of regime from feed-in-tariff to tariff–based bidding. As
The sun provides as much energy in an hour as the world
consumes in one year
Page 16 ICICI Securities Ltd | Retail Equity Research
wind energy has now emerged as very competitive with respect to other
energy sources, we believe it is now quickly likely to move into
industrialisation phase. Volumes are set to grow with 8-10 GW auctions
each year. While ABB has not made any significant strides in this area in
India, the company possesses strong capabilities across the value chain.
Parent ABB offers the complete portfolio of offerings, from individual
components for a wind turbine installation to the turnkey delivery of
onshore or offshore grid connection schemes.
Additionally, newer areas like wind-solar hybrid, offshore wind farms and
power evacuation corridors are also areas that ABB can significantly
capitalise on given competencies in its global portfolio. The Centre has
planned such energy corridors for building large scale capacities on the
renewable side. The cost estimate for these green energy corridors -
intrastate and interstate transmission systems are pegged at | 12,700
crore and | 15,400 crore, respectively.
ABB’s smart-grid and micro-grid solutions
The company is a forerunner in smart grids solutions, which integrates
renewable energy into the power supply system while optimising the
system’s reliability, energy efficiency and capacity utilisation. These
solutions have systems for controllable generation and storage and assist
in matching fluctuating levels of renewable power generation. Using data
networks in real time, smart grids can intelligently and automatically
control these increasingly complex power systems. The ABB Group is a
pioneer in micro grid technology with more than 30 global installations
across a diverse range of applications serving remote communities,
islanded grids, utility grid support and industrial campuses. This
innovative micro grid solution has now been extended for community use
by ABB. This has been done in a way such that it aids communities to
enjoy stable and cost-effective continuity of power while minimising the
environmental impact. We believe these smart-grid and micro-grid
solutions will provide additional lever of growth for ABB, going forward.
With improving allocations every year (~| 980 crore in the Twelfth Plan
for NSGM activities), we see an improving outlook for this segment in
coming years.
What is a Micro-grid?
Micro-grid is a localised group of electricity sources and
loads that normally operate connected to and synchronous
with the traditional centralised electrical grid (macro-grid),
but can also disconnect to ‘island mode’ and function
autonomously as physical and/or economic conditions
dictate
In this way, a micro-grid can effectively integrate various
sources of distributed generation; especially renewable
energy sources, and can supply emergency power,
changing between island and connected modes
What is a smart-grid?
A smart grid is an electrical grid, which allows a variety of
operational and energy measures like smart meters, smart
appliances, renewable energy resources and energy
efficient resources
Page 17 ICICI Securities Ltd | Retail Equity Research
Capitalising on railway electrification/modernisation programmes
ABB has been a key partner of Indian Railways over the past many years
with a suite of traction solutions. For example, 52% of diesel locomotives
of India run on ABB turbochargers. ABB’s technology offerings in this
segment have helped Indian Railways evolve in various areas like
electrification, clean energy, safety, speed, robustness, etc. ABB group’s
global leadership in railway and transportation technologies ensure that
ABB (India) continue to develop and deploy the latest in the future of
transportation technologies in the fourth largest railway network in the
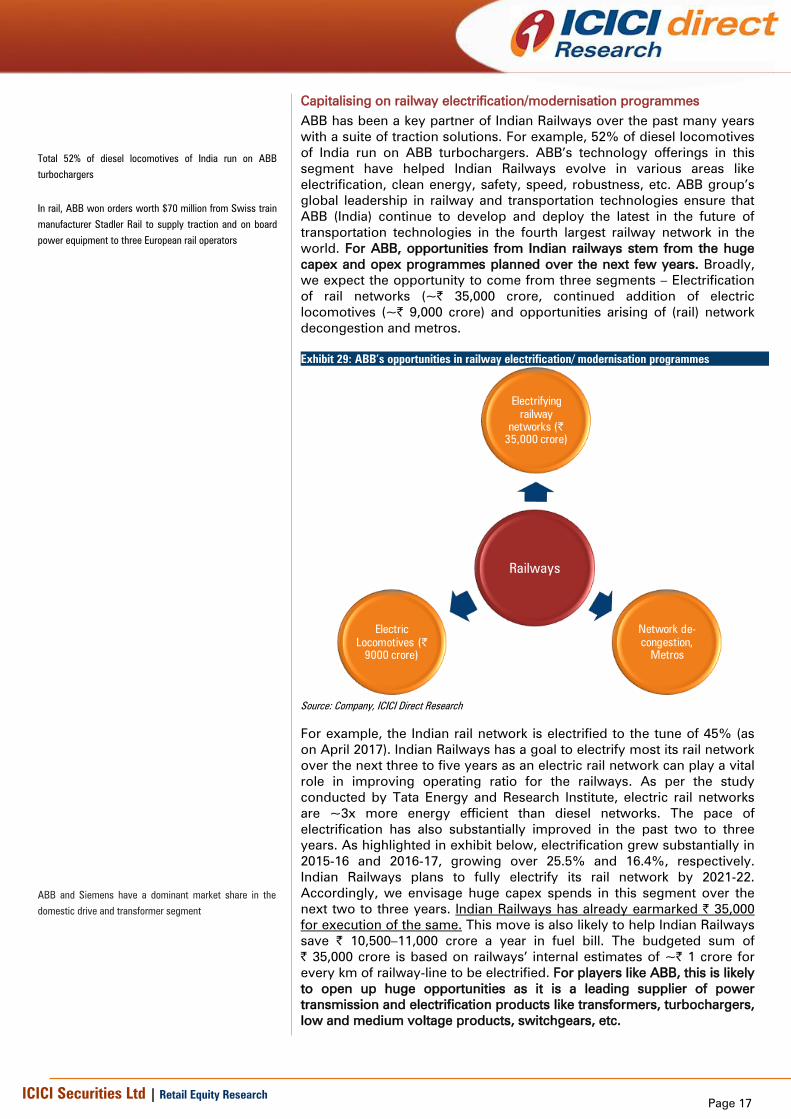
world. For ABB, opportunities from Indian railways stem from the huge
capex and opex programmes planned over the next few years. Broadly,
we expect the opportunity to come from three segments – Electrification
of rail networks (~| 35,000 crore, continued addition of electric
locomotives (~| 9,000 crore) and opportunities arising of (rail) network
decongestion and metros.
Exhibit 29: ABB’s opportunities in railway electrification/ modernisation programmes
Railways
Electrifying
railway
networks (|
35,000 crore)
Network de-
congestion,
Metros
Electric
Locomotives (|
9000 crore)
Source: Company, ICICI Direct Research
For example, the Indian rail network is electrified to the tune of 45% (as
on April 2017). Indian Railways has a goal to electrify most its rail network
over the next three to five years as an electric rail network can play a vital
role in improving operating ratio for the railways. As per the study
conducted by Tata Energy and Research Institute, electric rail networks
are ~3x more energy efficient than diesel networks. The pace of
electrification has also substantially improved in the past two to three
years. As highlighted in exhibit below, electrification grew substantially in
2015-16 and 2016-17, growing over 25.5% and 16.4%, respectively.
Indian Railways plans to fully electrify its rail network by 2021-22.
Accordingly, we envisage huge capex spends in this segment over the
next two to three years. Indian Railways has already earmarked | 35,000
for execution of the same. This move is also likely to help Indian Railways
save | 10,500–11,000 crore a year in fuel bill. The budgeted sum of
| 35,000 crore is based on railways’ internal estimates of ~| 1 crore for
every km of railway-line to be electrified. For players like ABB, this is likely
to open up huge opportunities as it is a leading supplier of power
transmission and electrification products like transformers, turbochargers,
low and medium voltage products, switchgears, etc.
In rail, ABB won orders worth $70 million from Swiss train
manufacturer Stadler Rail to supply traction and on board
power equipment to three European rail operators
Total 52% of diesel locomotives of India run on ABB
turbochargers
ABB and Siemens have a dominant market share in the
domestic drive and transformer segment

Page 18 ICICI Securities Ltd | Retail Equity Research
Exhibit 30: Electrification of Indian railways
Plan Period 1948-2012 2012-13 2013-14 2014-15 2015-16 2016-17
R.km. Electrified 21836 1317 1350 1378 1730 2013
Growth YoY (%) 2.5% 2.1% 25.5% 16.4%
R.km. Cumulative 22224 23541 24891 26269 27999 30012
Total R.km.: 66,687, Total electrified: 45%
Source: Central organisation for railway electrification, Company, ICICI Direct Research
For ABB, the next big area of opportunity is electric locomotives. Over the
next five years, Indian Railways needs ~5,000 more electric locomotives
to move all trains on electric traction. It has ~5,399 electric locomotives at
present and is able to add ~250 every year. Together for locos, coaches
and wagons, Indian Railways has already allocated ~| 1 lakh crore for
FY17-22E. Indian Railways has already awarded a large contract to
procure 1000 electric locomotives over the next 10 years to Alstom India
(now taken over by GE). Indian railways is also planning to convert
existing diesel locos into electric ones and ramp-up the existing electric-
loco production by doubling facilities at Varanasi and Chittaranjan
Locomotive Works (CLW) in West Bengal. ABB is already supplying
traction equipment to CLW for several years. The company has also
received order to supply 1600 traction transformers installation in
Alstom’s electric locomotives. As exhibited below, an electric locomotive
houses several critical electrical equipment like motors, transformers,
rectifiers, inverters, etc. The cost of electronic devices in a modern
locomotive is ~50% of the cost of the vehicle. ABB is already a major
supplier of these systems to rolling stock manufacturers around the
world. With Indian railways moving swiftly towards procurement of
electric locomotives, we believe companies like ABB are likely to see
sustained business momentum over the next three to five years. We peg
this opportunity at | 9000 crore over CY18-22E.
Exhibit 31: Electrical equipment in electric locomotive
Source: Indian railways document – Story of growth and modernisation, Company, ICICI Direct Research
More than half the world’s electrical locomotives and train
sets are powered by ABB transformers
Page 19 ICICI Securities Ltd | Retail Equity Research
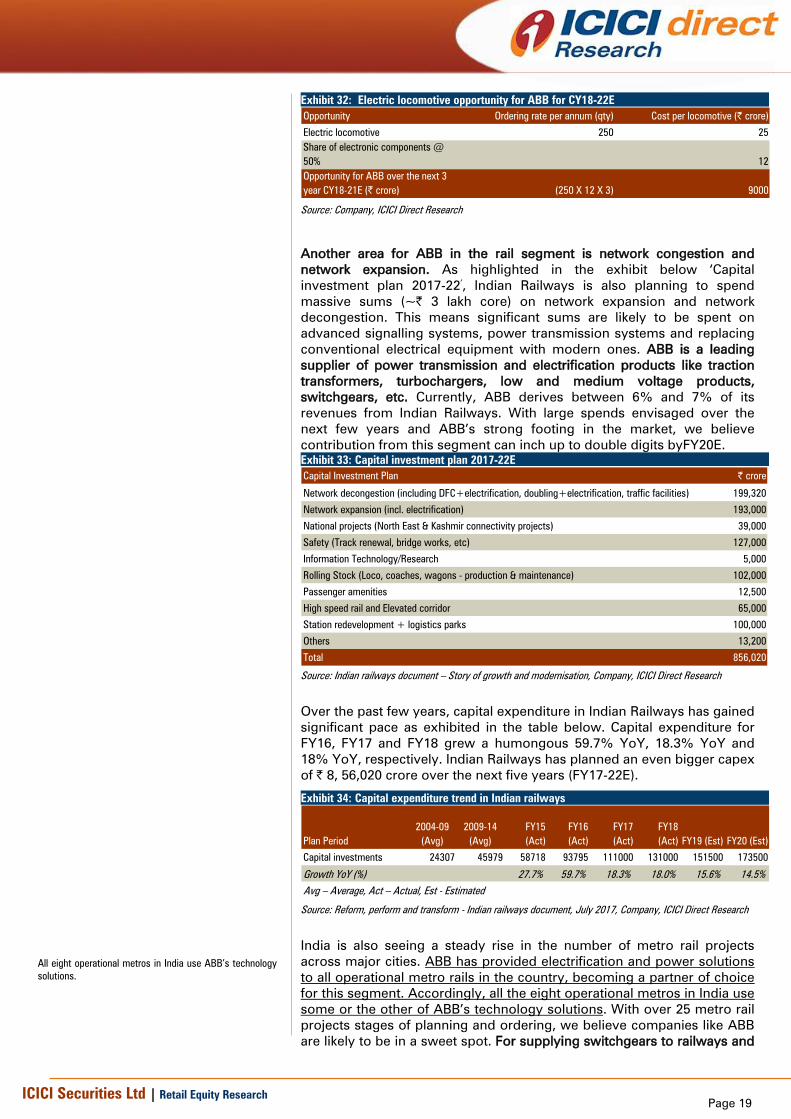
Exhibit 32: Electric locomotive opportunity for ABB for CY18-22E
Opportunity Ordering rate per annum (qty) Cost per locomotive (| crore)
Electric locomotive 250 25
Share of electronic components @
50% 12
Opportunity for ABB over the next 3
year CY18-21E (| crore) (250 X 12 X 3) 9000
Source: Company, ICICI Direct Research
Another area for ABB in the rail segment is network congestion and
network expansion. As highlighted in the exhibit below ‘Capital
investment plan 2017-22’, Indian Railways is also planning to spend
massive sums (~| 3 lakh core) on network expansion and network
decongestion. This means significant sums are likely to be spent on
advanced signalling systems, power transmission systems and replacing
conventional electrical equipment with modern ones. ABB is a leading
supplier of power transmission and electrification products like traction
transformers, turbochargers, low and medium voltage products,
switchgears, etc. Currently, ABB derives between 6% and 7% of its
revenues from Indian Railways. With large spends envisaged over the
next few years and ABB’s strong footing in the market, we believe
contribution from this segment can inch up to double digits byFY20E.
Exhibit 33: Capital investment plan 2017-22E
Capital Investment Plan | crore
Network decongestion (including DFC+electrification, doubling+electrification, traffic facilities) 199,320
Network expansion (incl. electrification) 193,000
National projects (North East & Kashmir connectivity projects) 39,000
Safety (Track renewal, bridge works, etc) 127,000
Information Technology/Research 5,000
Rolling Stock (Loco, coaches, wagons - production & maintenance) 102,000
Passenger amenities 12,500
High speed rail and Elevated corridor 65,000
Station redevelopment + logistics parks 100,000
Others 13,200
Total 856,020
Source: Indian railways document – Story of growth and modernisation, Company, ICICI Direct Research
Over the past few years, capital expenditure in Indian Railways has gained
significant pace as exhibited in the table below. Capital expenditure for
FY16, FY17 and FY18 grew a humongous 59.7% YoY, 18.3% YoY and
18% YoY, respectively. Indian Railways has planned an even bigger capex
of | 8, 56,020 crore over the next five years (FY17-22E).
Exhibit 34: Capital expenditure trend in Indian railways
Plan Period
2004-09
(Avg)
2009-14
(Avg)
FY15
(Act)
FY16
(Act)
FY17
(Act)
FY18
(Act) FY19 (Est) FY20 (Est)
Capital investments 24307 45979 58718 93795 111000 131000 151500 173500
Growth YoY (%) 27.7% 59.7% 18.3% 18.0% 15.6% 14.5%
Avg – Average, Act – Actual, Est - Estimated
Source: Reform, perform and transform - Indian railways document, July 2017, Company, ICICI Direct Research
India is also seeing a steady rise in the number of metro rail projects
across major cities. ABB has provided electrification and power solutions
to all operational metro rails in the country, becoming a partner of choice
for this segment. Accordingly, all the eight operational metros in India use
some or the other of ABB’s technology solutions. With over 25 metro rail
projects stages of planning and ordering, we believe companies like ABB
are likely to be in a sweet spot. For supplying switchgears to railways and
All eight operational metros in India use ABB’s technology
solutions.

Page 20 ICICI Securities Ltd | Retail Equity Research
metros, ABB has set up a state-of-the-art green field manufacturing facility
(in India in 2013) to manufacture gas insulated switchgear (GIS) from
72.5kV to 420kV as per common global design platform. This facility is
also likely be used to supply 800kV GIS.
ABB - At the forefront of ‘Fourth Industrial Revolution’
The first Industrial Revolution was driven by the steam engine and
mechanisation, the second by Henry Ford’s assembly line and the third in
the 1970s, when computers revolutionised the workplace. Now, the three
have amalgamated, putting technology companies like ABB at the cusp of
Industry 4.0, an age where ‘smart devices’ really are smart enough to
assume major control over the machines of manufacturing and
distribution. ABB’s industrial automation division offers ‘cyber-physical
production systems’ in which sensor-laden ‘smart products’ tell machines
how they should be processed. Processes, thus now govern themselves
in a decentralised, modular system. Smart embedded devices start
working together wirelessly either directly or via the Internet ‘cloud’ – the
Internet of Things (IoT) – to revolutionise production. ABB provides
products, systems and services that increase industrial productivity and
energy efficiency for a wide range of industrial applications. ABB’s robots,
drives and servo motors provide a high level of flexible and reliable
automation solutions. ABB’s automation solutions help its clients improve
uptime, product quality and workplace safety while reducing energy
consumption and waste.
Digital ABB to cater to industrial/process automation opportunities
ABB expects huge opportunities to come from the digitisation space,
going forward. This is on account of the value proposition the company is
likely to offer in this space. The management statements indicate this is
going to be the most value-add space in coming years. Traditionally, ABB
has been supplying assets to the customer installed base to improve
efficiencies and productivity. However, with digitisation at the forefront of
new industrial revolution, this is likely to change, going forward. ABB
plans to offer (or is already offering) digitisation solutions like internet of
things (IoT), machine learning (ML) and artificial intelligence (AI). These
three put together form the critical layers of the digitisation process.
Together, or in parts, these layers help increase operational efficiency,
reliability, predictability and overall productivity of the system.
Accordingly, ABB has launched a digital platform ABB Ability. It is an
open platform that allows ABB to work with its industrial customers to co-
create solutions. For ABB Ability, a leading cement producer of India has
already engaged ABB for improving its productivity and efficiency.
Creating digital opportunities by staying ahead of curve – ABB Ability™
ABB Ability™ is an open, globally available, digital-industrial ecosystem
with cloud infrastructure for customers, partners, suppliers and
developers. It is a unified, cross-industry capable enterprise solution
(launched in March 2017). Leveraging its large installed base of connected
systems and devices, ABB has launched more than 210 ABB Ability™
solutions. These have a secure, open-architecture system, ranging from
edge to cloud. Going forward, ABB Ability™ is likely to be central to ABB’s
strategy to drive growth through expansion of high value-added solutions
and services.
ABB has implemented automations solutions in Asia’s
third largest paint company, Asian Paints. ABB executed
design, engineering, project management, installation,
commissioning and service of the integrated manufacturing
execution systems (MES) and distributed control system
(DCS) of this new plant. This greenfield facility has
production capacity of 225,000 kilo litre per annum (kl/a)
water based paint, 70,000 kl/a of solvent based paint and
5,000 kl/a of machine colorants. Having around 42,000
input-output points (I/Os), ABB implemented end-to-end
solution that controls and integrates plant processes from
raw material receipt, storage and transportation to paint
manufacture and packing
ABB Ability™ - A cloud-based operating system for the
industrial internet of things (IIOT)

Page 21 ICICI Securities Ltd | Retail Equity Research
Exhibit 35: ABB has over 210+ ABB Ability™ solutions
Source: Company, ICICI Direct Research
Exhibit 36: ABB Ability™: Industry-leading digital solution
Source: Company, ICICI Direct Research
To build a leading/ world-class platform, ABB has announced a
partnership with Microsoft to build a platform for digitalisation and act as
partners for driving futuristic industrial solutions. ABB Ability, thus, brings
together digital capabilities as one unified offer.
Industrial automation, Robotics & Motion to grow at ~10% CAGR in
CY17-19E
Industry estimates suggest India’s factory and industrial automation
market has grown at 10-11% CAGR in FY17-22E. With automation
systems with advanced features being deployed in all major sectors such
as automotive, chemicals, manufacturing, mining, etc, to perform a
number of complex tasks and consistently provide customers with
superior quality products, this market is poised to grow at an accelerated
rate, going forward. Further, growing adoption of energy saving control
equipment such as energy efficient motor systems is also expected to
propel the adoption of factory automation in India in coming years. This
industry in India is worth ~| 12,000 crore and has the potential to grow
15-20% given the existing capacity addition in infrastructure, energy and
other sectors. Accordingly, we estimate ABB’s ‘industrial automation’ and
‘robotics and motion’ segment to also grow at least ~10% CAGR in the
next few years (industrial automation 9.5% CAGR, robotics and
automation 10.8% CAGR).
Exhibit 37: Industrial automation market size FY12-17
7250
12000
0
2000
4000
6000
8000
10000
12000
14000
FY12 FY13 FY14 FY15 FY16 FY17
| c
rore
Market Size FY12-17 (| crore)
10.6% CAGR
Source: Confederation of Indian Industry, Factory automation document 2017,
Company, ICICI Direct Research
Exhibit 38: Estimated industrial automation market size FY17-22E
12000
26500
0
5000
10000
15000
20000
25000
30000
FY17 FY18 FY19 FY20 FY21 FY22
| c
rore
Market Size FY17-22E (| crore)
17.2% CAGR
Source: Confederation of Indian Industry, Factory automation document 2017,
Company, ICICI Direct Research
Page 22 ICICI Securities Ltd | Retail Equity Research
E-cars to bring accelerated growth opportunities
To facilitate quick adoption of electric vehicles and encourage large scale
electric mobility, the Government of India has formulated two national-
level programmes;
National Electric Mobility Mission Plan (NEMMP) &
Faster Adoption & Manufacturing of (Hybrid) & Electric Vehicles in
India (FAME)
These programmes, designed in a way that help in realising the
governments vision of 100% electrification of vehicles by 2030 are likely
to open accelerated opportunities for technology companies like ABB.
ABB is one of the world’s leading suppliers of EV charging stations with a
range of products from flash chargers to standard chargers. As a global
player in EV fast-charging solutions, ABB has more than 6,000 units
installed across more than 55 countries. Also, ABB’s fast chargers are
used by all Indian, global OEMS to test their vehicles. Given that charging
infrastructure is vital to realising government’s vision. This area is likely to
witness accelerated spends, going forward. ABB has already proven its
competencies in this segment in developed geographies like US and
Europe, with large orders inflow and execution in both countries.
To walk the talk, the Government of India, through its state-run enterprise
Energy Efficiency Services Ltd (EESL), has also awarded a contract to
procure 10,000 electric vehicles for various government departments. It
has also invited bids for 4500 electric vehicle charging stations (for which
ABB has also bid). With most domestic and international auto majors
announcing new launches in this segment, we believe strong charging
infrastructure will be the need of the hour, going ahead. ABB’s technical
prowess and heads-up start in this segment, we believe, will significantly
benefit the company in CY18E-22E.
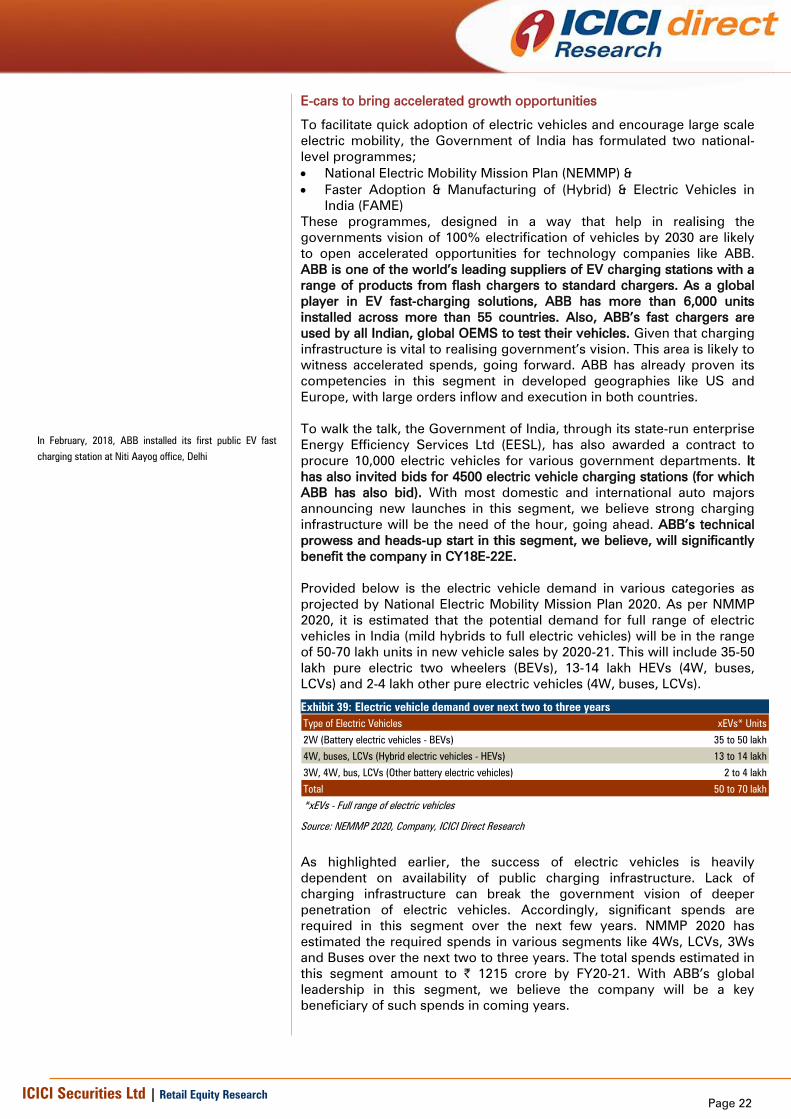
Provided below is the electric vehicle demand in various categories as
projected by National Electric Mobility Mission Plan 2020. As per NMMP
2020, it is estimated that the potential demand for full range of electric
vehicles in India (mild hybrids to full electric vehicles) will be in the range
of 50-70 lakh units in new vehicle sales by 2020-21. This will include 35-50
lakh pure electric two wheelers (BEVs), 13-14 lakh HEVs (4W, buses,
LCVs) and 2-4 lakh other pure electric vehicles (4W, buses, LCVs).
Exhibit 39: Electric vehicle demand over next two to three years
Type of Electric Vehicles xEVs* Units
2W (Battery electric vehicles - BEVs) 35 to 50 lakh
4W, buses, LCVs (Hybrid electric vehicles - HEVs) 13 to 14 lakh
3W, 4W, bus, LCVs (Other battery electric vehicles) 2 to 4 lakh
Total 50 to 70 lakh
*xEVs - Full range of electric vehicles
Source: NEMMP 2020, Company, ICICI Direct Research
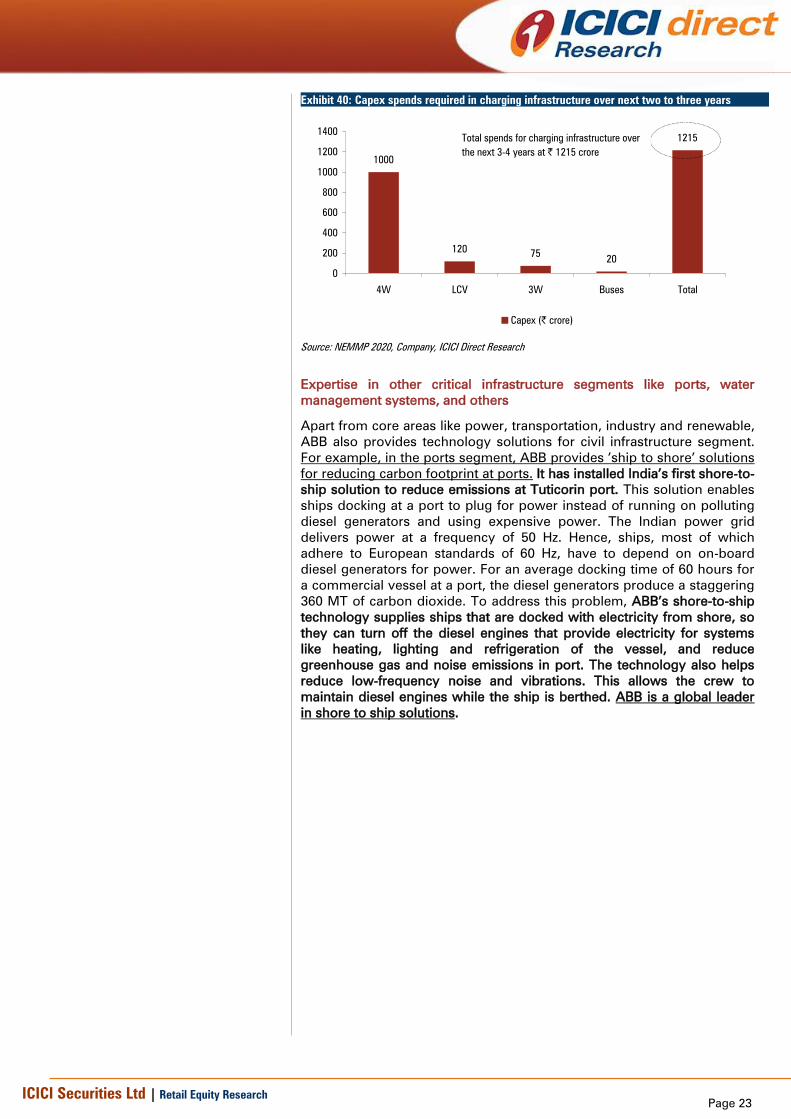
As highlighted earlier, the success of electric vehicles is heavily
dependent on availability of public charging infrastructure. Lack of
charging infrastructure can break the government vision of deeper
penetration of electric vehicles. Accordingly, significant spends are
required in this segment over the next few years. NMMP 2020 has
estimated the required spends in various segments like 4Ws, LCVs, 3Ws
and Buses over the next two to three years. The total spends estimated in
this segment amount to | 1215 crore by FY20-21. With ABB’s global
leadership in this segment, we believe the company will be a key
beneficiary of such spends in coming years.
In February, 2018, ABB installed its first public EV fast
charging station at Niti Aayog office, Delhi
Page 23 ICICI Securities Ltd | Retail Equity Research
Exhibit 40: Capex spends required in charging infrastructure over next two to three years
1000
12075
20
1215
0
200
400
600
800
1000
1200
1400
4W LCV 3W Buses Total
Capex (| crore)
Total spends for charging infrastructure over
the next 3-4 years at | 1215 crore
Source: NEMMP 2020, Company, ICICI Direct Research
Expertise in other critical infrastructure segments like ports, water
management systems, and others
Apart from core areas like power, transportation, industry and renewable,
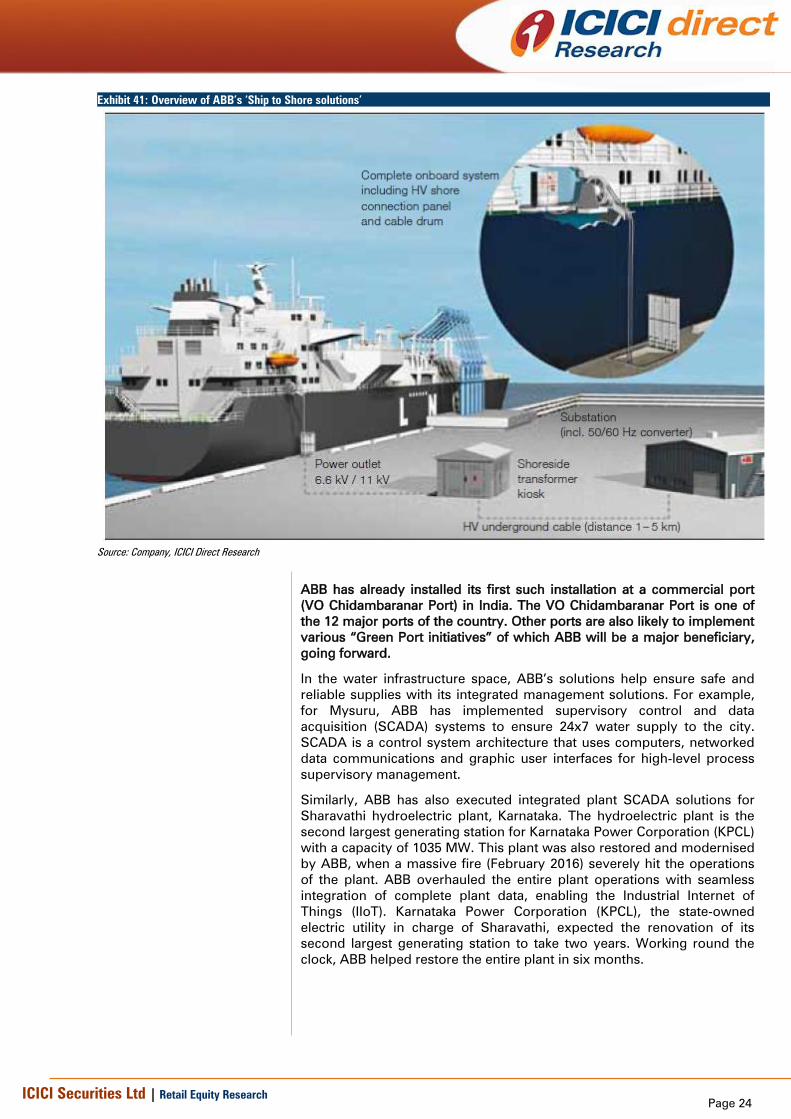
ABB also provides technology solutions for civil infrastructure segment.
For example, in the ports segment, ABB provides ’ship to shore’ solutions
for reducing carbon footprint at ports. It has installed India’s first shore-to-
ship solution to reduce emissions at Tuticorin port. This solution enables
ships docking at a port to plug for power instead of running on polluting
diesel generators and using expensive power. The Indian power grid
delivers power at a frequency of 50 Hz. Hence, ships, most of which
adhere to European standards of 60 Hz, have to depend on on-board
diesel generators for power. For an average docking time of 60 hours for
a commercial vessel at a port, the diesel generators produce a staggering
360 MT of carbon dioxide. To address this problem, ABB’s shore-to-ship
technology supplies ships that are docked with electricity from shore, so
they can turn off the diesel engines that provide electricity for systems
like heating, lighting and refrigeration of the vessel, and reduce
greenhouse gas and noise emissions in port. The technology also helps
reduce low-frequency noise and vibrations. This allows the crew to
maintain diesel engines while the ship is berthed. ABB is a global leader
in shore to ship solutions.
Page 24 ICICI Securities Ltd | Retail Equity Research
Exhibit 41: Overview of ABB’s ‘Ship to Shore solutions’
Source: Company, ICICI Direct Research
ABB has already installed its first such installation at a commercial port
(VO Chidambaranar Port) in India. The VO Chidambaranar Port is one of
the 12 major ports of the country. Other ports are also likely to implement
various “Green Port initiatives” of which ABB will be a major beneficiary,
going forward.
In the water infrastructure space, ABB’s solutions help ensure safe and
reliable supplies with its integrated management solutions. For example,
for Mysuru, ABB has implemented supervisory control and data
acquisition (SCADA) systems to ensure 24x7 water supply to the city.
SCADA is a control system architecture that uses computers, networked
data communications and graphic user interfaces for high-level process
supervisory management.
Similarly, ABB has also executed integrated plant SCADA solutions for
Sharavathi hydroelectric plant, Karnataka. The hydroelectric plant is the
second largest generating station for Karnataka Power Corporation (KPCL)
with a capacity of 1035 MW. This plant was also restored and modernised
by ABB, when a massive fire (February 2016) severely hit the operations
of the plant. ABB overhauled the entire plant operations with seamless
integration of complete plant data, enabling the Industrial Internet of
Things (IIoT). Karnataka Power Corporation (KPCL), the state-owned
electric utility in charge of Sharavathi, expected the renovation of its
second largest generating station to take two years. Working round the
clock, ABB helped restore the entire plant in six months.
Page 25 ICICI Securities Ltd | Retail Equity Research
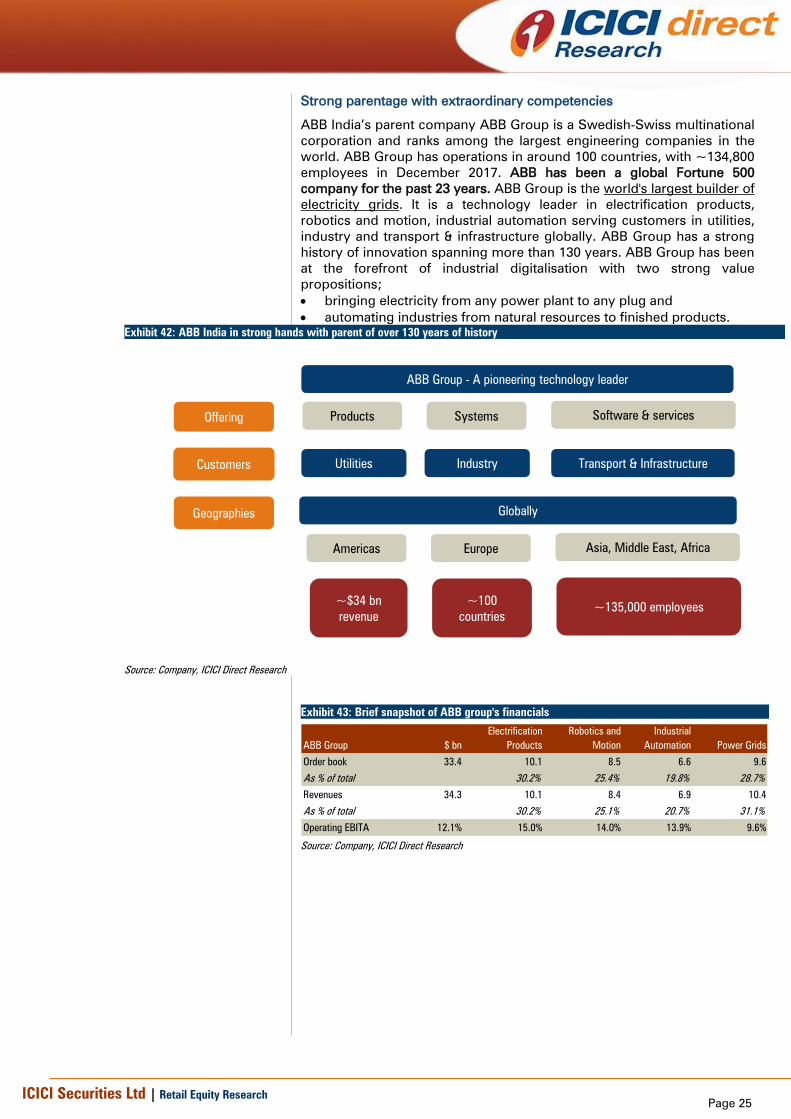
Strong parentage with extraordinary competencies
ABB India’s parent company ABB Group is a Swedish-Swiss multinational
corporation and ranks among the largest engineering companies in the
world. ABB Group has operations in around 100 countries, with ~134,800
employees in December 2017. ABB has been a global Fortune 500
company for the past 23 years. ABB Group is the world's largest builder of
electricity grids. It is a technology leader in electrification products,
robotics and motion, industrial automation serving customers in utilities,
industry and transport & infrastructure globally. ABB Group has a strong
history of innovation spanning more than 130 years. ABB Group has been
at the forefront of industrial digitalisation with two strong value
propositions;
bringing electricity from any power plant to any plug and
automating industries from natural resources to finished products.
Exhibit 42: ABB India in strong hands with parent of over 130 years of history
ProductsOffering
Customers
Geographies
ABB Group - A pioneering technology leader
Utilities
Globally
Industry Transport & Infrastructure
Systems Software & services
Americas Europe Asia, Middle East, Africa
~$34 bn
revenue
~100
countries
~135,000 employees
Source: Company, ICICI Direct Research
Exhibit 43: Brief snapshot of ABB group's financials
ABB Group $ bn
Electrification
Products
Robotics and
Motion
Industrial
Automation Power Grids
Order book 33.4 10.1 8.5 6.6 9.6
As % of total 30.2% 25.4% 19.8% 28.7%
Revenues 34.3 10.1 8.4 6.9 10.4
As % of total 30.2% 25.1% 20.7% 31.1%
Operating EBITA 12.1% 15.0% 14.0% 13.9% 9.6%
Source: Company, ICICI Direct Research

Page 26 ICICI Securities Ltd | Retail Equity Research
Financials
Revenues to grow at 14% CAGR in CY17-19E
We expect revenues to increase from | 9,087 crore in CY17 to | 11,819
crore in CY19E at 14% CAGR in CY17-19E. We expect revenue growth on
the back of improved execution from all key segments, viz. power grids,
electrification products, robotics and motion and industrial automation.
We expect these segments to grow at a CAGR of 9.5%, 13.9%, 10.8% and
9.5%, respectively. Order inflows in these segments are also expected to
grow healthy at 14%, 12%, 15% and 15.5%, respectively, in CY17-19E.
Exhibit 44: Revenue trend
8,1408,648
9,087
10,378
11,819
-
2,000
4,000
6,000
8,000
10,000
12,000
14,000
CY15 CY16 CY17 CY18E CY19E
| c
rore
Revenue
Source: Company, ICICI Direct Research
Exhibit 45: Order inflow trend
8405
12792
9720
11029
12618
0
2000
4000
6000
8000
10000
12000
14000
CY15 CY16 CY17 CY18E CY19E
| c
rore
Total order inflows
Source: Company, ICICI Direct Research
Exhibit 46: Order backlog trend
8137
1213211747
1239913198
0
2000
4000
6000
8000
10000
12000
14000
CY15 CY16 CY17 CY18E CY19E
| c
rore
Total order backlog
Source: Company, ICICI Direct Research
We expect ABB to report revenue growth of 14% CAGR in
CY17-19E on the back of improved execution from all key
segments, viz. power grids, electrification products, robotics
and motion & industrial automation. We expect these
segments to grow at 9.5%, 13.9%, 10.8% and 9.5% CAGR,
respectively

Page 27 ICICI Securities Ltd | Retail Equity Research
Exhibit 47: Segment-wise contribution to total order inflows
14.2%
20.7% 20.9% 21.0%
19.7%18.0%
25.2% 24.7%
38.2%
57.6%
38.1% 38.0% 38.2%
27.4%
25.5%
14.7%10.2%
15.7% 15.9% 16.1%
0%
20%
40%
60%
80%
100%
CY15 CY16 CY17 CY18E CY19E
%
Power Grid Robotics and Motion
Electrification Products Industrial Automation
Source: Company, ICICI Direct Research
Exhibit 48: Segment-wise contribution in order backlogs
55.8%
70.0% 65.5% 61.7% 59.7%
22.2%
13.4%14.7%
15.8% 17.0%
8.8%8.5% 10.0% 11.1% 10.0%
13.2%8.1% 9.8% 11.3% 13.3%
0%
20%
40%
60%
80%
100%
CY15 CY16 CY17 CY18E CY19E
%
Power Grid Robotics and Motion
Electrification Products Industrial Automation
Source: Company, ICICI Direct Research
Going forward, we expect ABB to clock revenues of | 4591 crore from the
power grid segment, | 3162 crore from electrification products segment,
| 2377 crore from the robotics and motion segment and | 1689 crore
from the industrial automation segment. EBIT margins in the power grids
segment are expected to be stable at ~5.7%, electrification products
segment at ~11.7%, robotics & motion segment at ~8.5% and industrial
automation segment at ~11.4%. We estimate power grids, electrification
products, robotics and motion and industrial automation to contribute
39%, 20%, 27% and 14% to the topline, respectively, in CY19E.
Exhibit 49: Power grids revenue and EBIT trend
35333691
3832
4234
4591
6.16.3
4.6
5.7
5.7
0
1000
2000
3000
4000
5000
CY15 CY16 CY17 CY18E CY19E
| c
rore
0
1
2
3
4
5
6
7
%
Power Grid EBIT Margins (%)
Source: Company, ICICI Direct Research
Exhibit 50: Electrification products revenue and EBIT trend
1651
2390 24392574
3162
11.6
11.9 11.511.7
11.7
0
500
1000
1500
2000
2500
3000
3500
CY15 CY16 CY17 CY18E CY19E
| c
rore
5
6
7
8
9
10
11
12
13
14
%
Electrification Products EBIT Margins (%)
Source: Company, ICICI Direct Research
Exhibit 51: Robotics & motion revenue and EBIT trend
20621936 1936
2068
2377
8.28.4
8.9
8.5 8.5
0
500
1000
1500
2000
2500
CY15 CY16 CY17 CY18E CY19E
| c
rore
5
6
7
8
9
10
%
Robotics and Motion EBIT Margins (%)
Source: Company, ICICI Direct Research
Exhibit 52: Industrial automation revenue and EBIT trend
1326
14851409
1502
168911.612.1
10.6 11.4
11.4
0
500
1000
1500
2000
CY15 CY16 CY17 CY18E CY19E
| c
rore
5
6
7
8
9
10
11
12
13
14
%
Industrial Automation EBIT Margins (%)
Source: Company, ICICI Direct Research

Page 28 ICICI Securities Ltd | Retail Equity Research
Exhibit 53: Revenue segmentation (%)
41% 39% 40% 41% 39%
24%20% 20% 20% 20%
19%25% 25% 25% 27%
15% 16% 15% 14% 14%
0%
10%
20%
30%
40%
50%
60%
70%
80%
90%
100%
CY15 CY16 CY17 CY18E CY19E
Power Grid Robotics and Motion
Electrification Products Industrial Automation
Source: Company, ICICI Direct Research
EBITDA to grow at 20.5% CAGR in CY17-19E; margins to improve
The operating income grew at 11.9% CAGR in CY13-17. This was despite
subdued growth of 4.2% in revenue over the same period. This was
mainly due to a reduction in input prices. Raw material cost as a
percentage of sales declined from 63.8% in CY13 to 59.7% in CY17.
Accordingly, EBITDA margins increased from 6.1% to 8.1% in CY17.
CY16 and CY17 witnessed some drop in margins (8.6% in CY16 and 8.1%
in CY17 from 8.8% in CY15), due to higher contribution from the projects
segment of the business.
Going forward, we expect this trend to reverse on the back of hardening
commodity prices. We expect this cost to be ~60% of revenue in coming
years. Despite an increase in operating costs, we expect the EBITDA
margins of the company to improve. This is due to increasing
contribution of high margin ‘electrification products’ in the topline.
Accordingly, we expect it to inch up to 8.9% in CY19E. Overall, higher
contribution by sale of products and increase in local content is also like
to support margins, going forward. Thus, we expect EBITDA margins of
8.4% and 8.9% in CY18E and CY19E, respectively. We expect absolute
EBITDA to grow at 20.5% CAGR in CY17-19E vs. 11.9% in CY13-17. Thus,
we expect ABB to report absolute EBITDA of | 1068 crore in CY19E.
Exhibit 54: EBITDA and EBITDA margin trend
713 747 736
880
1,068
8.8
8.6
8.1
8.5
9.0
-
200
400
600
800
1,000
1,200
CY15 CY16 CY17 CY18E CY19E
| c
rore
7.6
7.8
8.0
8.2
8.4
8.6
8.8
9.0
9.2
%
EBITDA EBITDA margin (%)
Source: Company, ICICI Direct Research
We expect EBITDA margins of 8.4% and 8.9% in CY18E and
CY19E, respectively. We expect absolute EBITDA to grow at
20.5% CAGR in CY17-19E
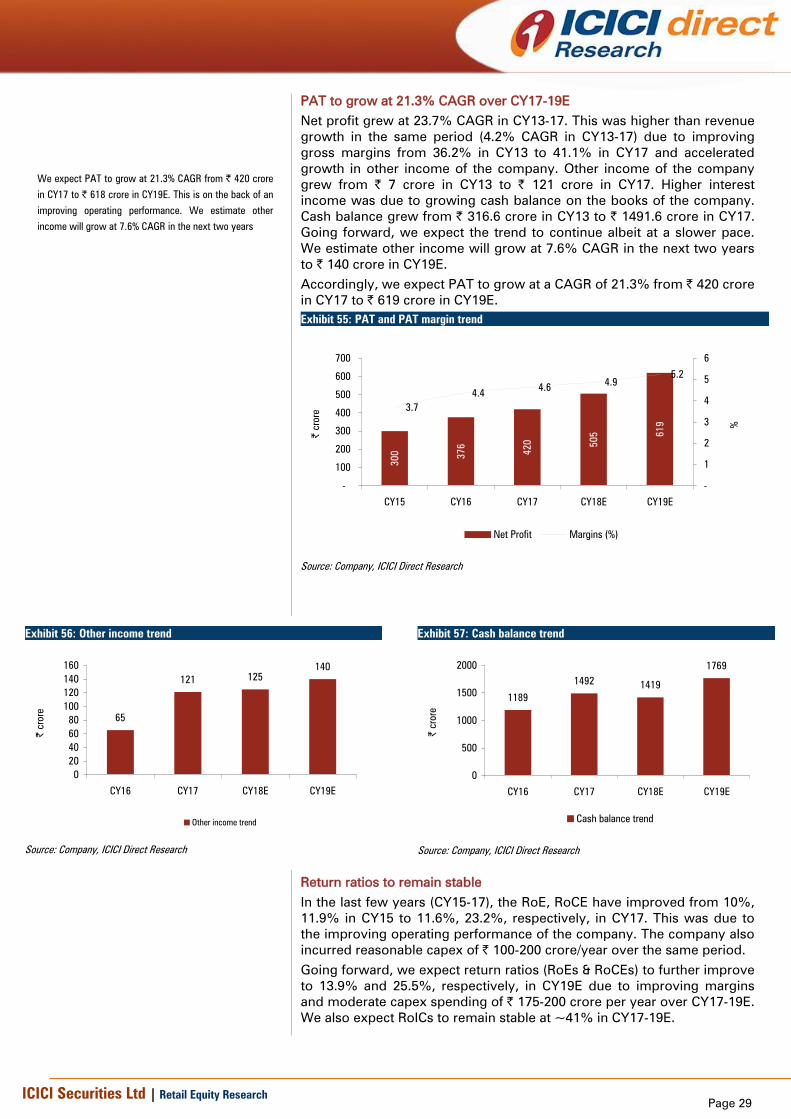
Page 29 ICICI Securities Ltd | Retail Equity Research
PAT to grow at 21.3% CAGR over CY17-19E
Net profit grew at 23.7% CAGR in CY13-17. This was higher than revenue
growth in the same period (4.2% CAGR in CY13-17) due to improving
gross margins from 36.2% in CY13 to 41.1% in CY17 and accelerated
growth in other income of the company. Other income of the company
grew from | 7 crore in CY13 to | 121 crore in CY17. Higher interest
income was due to growing cash balance on the books of the company.
Cash balance grew from | 316.6 crore in CY13 to | 1491.6 crore in CY17.
Going forward, we expect the trend to continue albeit at a slower pace.
We estimate other income will grow at 7.6% CAGR in the next two years
to | 140 crore in CY19E.
Accordingly, we expect PAT to grow at a CAGR of 21.3% from | 420 crore
in CY17 to | 619 crore in CY19E.
Exhibit 55: PAT and PAT margin trend
300
376
420 505 6
19
3.7
4.44.6
4.9
5.2
-
100
200
300
400
500
600
700
CY15 CY16 CY17 CY18E CY19E
| c
rore
-
1
2
3
4
5
6
%
Net Profit Margins (%)
Source: Company, ICICI Direct Research
Exhibit 56: Other income trend
65
121 125
140
0
20
40
60
80
100
120
140
160
CY16 CY17 CY18E CY19E
| c
rore
Other income trend
Source: Company, ICICI Direct Research
Exhibit 57: Cash balance trend
1189
14921419
1769
0
500
1000
1500
2000
CY16 CY17 CY18E CY19E
| c
rore
Cash balance trend
Source: Company, ICICI Direct Research
Return ratios to remain stable
In the last few years (CY15-17), the RoE, RoCE have improved from 10%,
11.9% in CY15 to 11.6%, 23.2%, respectively, in CY17. This was due to
the improving operating performance of the company. The company also
incurred reasonable capex of | 100-200 crore/year over the same period.
Going forward, we expect return ratios (RoEs & RoCEs) to further improve
to 13.9% and 25.5%, respectively, in CY19E due to improving margins
and moderate capex spending of | 175-200 crore per year over CY17-19E.
We also expect RoICs to remain stable at ~41% in CY17-19E.
We expect PAT to grow at 21.3% CAGR from | 420 crore
in CY17 to | 618 crore in CY19E. This is on the back of an
improving operating performance. We estimate other
income will grow at 7.6% CAGR in the next two years

Page 30 ICICI Securities Ltd | Retail Equity Research
Exhibit 58: Return ratios to improve
13.3
23.7
41.2
38.7
41.9
11.9
17.5
23.2
24.8 25.5
10.011.4 11.6
12.713.9
-
5
10
15
20
25
30
35
40
45
CY15 CY16 CY17 CY18E CY19E
%RoCE (%) RoE (%) RoIC (%)
Source: Company, ICICI Direct Research
Stable cash flows; CFO/EBITDA at 0.4-0.7x
The company is expected to generate stable cash flows over the next two
years. We estimate CFOs of | 334 crore and | 797 crore in CY18E and
CY19E, respectively. The free cash flow (FCF) generation is likely to be
healthy at | 154 crore and | 597 crore in CY18E and CY19E, respectively.
Net cash as a percentage of net worth is also likely to remain stable at
~40% in CY19E.
Exhibit 59: CFO/EBITDA trend
417
1402
1299
334
797
713747 736
880
1068
0.6
1.9
1.8
0.4
0.7
0
200
400
600
800
1000
1200
1400
1600
CY15 CY16 CY17 CY18E CY19E
| c
rore
0.0
0.2
0.4
0.6
0.8
1.0
1.2
1.4
1.6
1.8
2.0
(x)
CFO EBITDA CFO:EBITDA
Source: Company, ICICI Direct Research

Page 31 ICICI Securities Ltd | Retail Equity Research
Exhibit 60: Strong FCF generation, FCF yield
346
1271
1128
597
1541.4
5.34.7
0.6
2.5
0
200
400
600
800
1000
1200
1400
CY15 CY16 CY17 CY18E CY19E
| c
rore
0.0
1.0
2.0
3.0
4.0
5.0
6.0
7.0
8.0
9.0
10.0
%
FCF FCF Yield
Source: Company, ICICI Direct Research
Exhibit 61: Net cash as percentage of net worth (47% in CY20E)
574
1189
14921419
1769
19
36
41
36
40
0
500
1000
1500
2000
CY15 CY16 CY17 CY18E CY19E
| c
rore
0
10
20
30
40
50
%
Net Cash As %age of Networth
Source: Company, ICICI Direct Research
ABB’s working capital is likely to remain stable at ~60 days in CY17-19E.
Going forward, we expect dividend payouts at 20-30% in CY17-19E.
Exhibit 62: Dividend payout to be 20-30% going forward
17.819.8
23.9
4.0 4.4 5.0 5.5
29.2
2322
21
19
0.0
5.0
10.0
15.0
20.0
25.0
30.0
35.0
CY16 CY17 CY18E CY19E
| p
er s
hare
0
5
10
15
20
25
%
EPS DPS Dividend Payout
Source: Company, ICICI Direct Research
Exhibit 63: Working capital, best-in-class despite large and lumpy orders
40 46
45
45
125
112
115
115
89 1
09
100
100
76
49
60
60
0
50
100
150
CY16 CY17 CY18E CY19E
Days
0
20
40
60
80
100
NW
C d
ays
Inventory Days Debtor Days
Creditor Days Net Working Capital Days
Source: Company, ICICI Direct Research

Page 32 ICICI Securities Ltd | Retail Equity Research
Risks & concerns
Competition from similar large players in various segments
ABB faces stiff competition from larger players like Siemens, GE T&D,
Schneider, Toshiba, etc. Though the company has a strong product
portfolio, it has witnessed pricing pressure for many of its product
categories due to competitive products offered by MNC peers. The table
below exhibits product-wise competition that ABB faces from leading
large players.
Exhibit 64: Segment-wise competition from several players
Products Sub-category (in any) Players in competition
Electric drive ABB, Siemens, Danfoss
Electric motors
Siemens, ABB, BHEL, ATB motors, WEG, Leroy
Somer
Switch Gears ABB, Siemens, Schneider, L&T, Stelmec
Transformers Power transformers
(Above 400kv) TBEA, ABB, GE T&D, Siemens, BHEL,
CG Power, TRIL, Toshiba, etc.
Distribution transformers
Traction transformers
(Above 400kv) ABB, Siemens, GE T&D, Toshiba,
BHEL, CG Power
HVDC transmission ABB, Siemens, GE T&D
Solar invertors
ABB, Schneider, SMA, TMEIC, Hitachi, TBEA, Delta,
Sungrow, Gamesa Solar, Huawei
Source: Company, ICICI Direct Research
Also, for larger projects like HVDC transmission, ABB faces stiff
competition from players like Siemens and GE T&D.
Capex slowdown in utilities/SEBs, delay in railways/metro ordering
Revenue from the utilities and railway/metro segment constitute over
~50% of the topline. This segment also forms a significant portion of the
order book at ~70% of the CY17 order book. Thus, any delay or
slowdown in execution of existing orders or awarding of new orders may
hamper the performance of the company. As these orders are
government orders, ABB faces significant uncertainty over their timelines
and decision-making. The sluggish pace of turnaround in SEBs may also
hamper ABB’s prospects in this segment.
Increases in price of raw materials
ABB’s product portfolio consists of electric equipment like motors, switch
gears, transformers, etc where the raw material used is copper,
aluminium, steel, etc. Electrical products/equipment are expensive assets
in a power transaction network (about 50-60% of total cost). Accordingly,
cost escalation on the raw material side leads to an increase in input
costs for the company, which the company may be unable to able to
pass, leading to adverse impact on profitability of the company. For
example, in CY11 and CY12, raw material costs for ABB had spiked to
63.4 and 62%, respectively, due to a sharp increase in raw materials
prices. Accordingly, the company witnessed a dip in EBIDTA margins
during the year (4.5% and 4.4% in CY11 and CY12, respectively).
Alternatively, in CY15-17, ABB’s raw material costs formed 53-56% of
revenue, when prices of raw material were subdued. EBITDA margins
also revived to 8-8.8% during the same period.
Increase in royalty from parent company
All major R&D efforts of ABB India and group companies have been
pooled centrally and executed at the group level. Accordingly, ABB and
other group companies are billed by the respective (ABB) parent
companies for the transfer of technology know-how or payment of
royalties for the existing technologies under use. As exhibited below,
royalty and technology fees for ABB India have increased consistently in
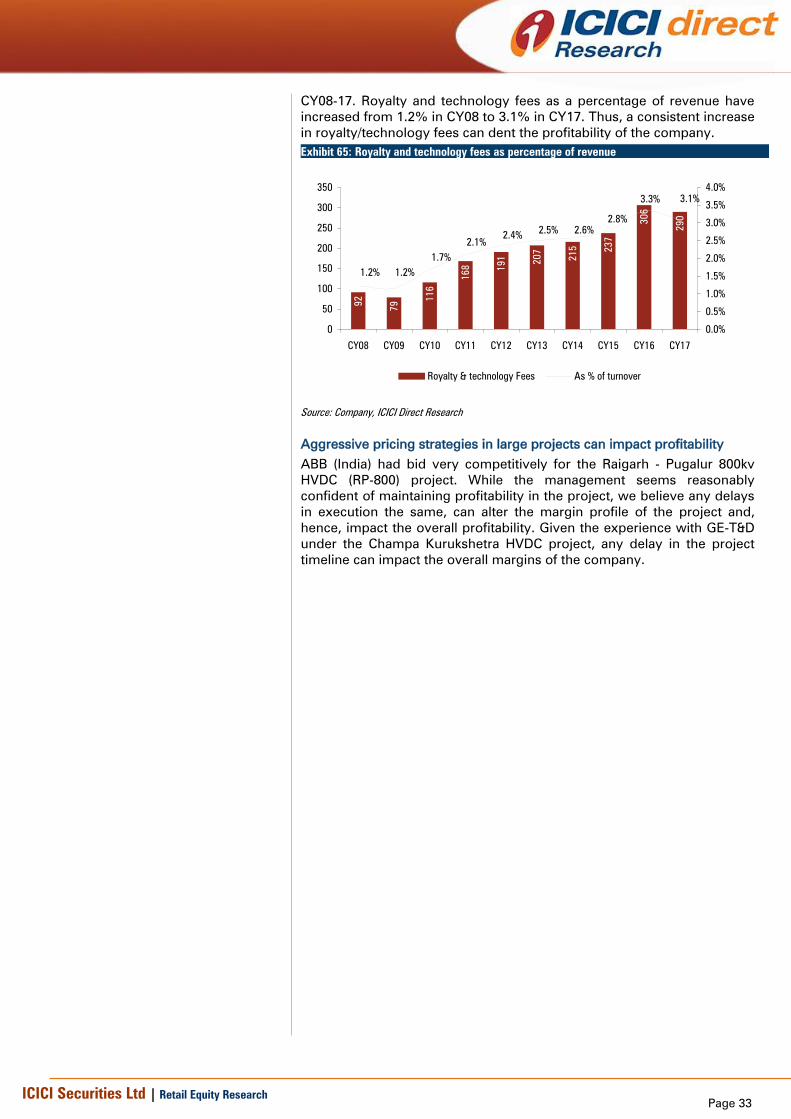
Page 33 ICICI Securities Ltd | Retail Equity Research
CY08-17. Royalty and technology fees as a percentage of revenue have
increased from 1.2% in CY08 to 3.1% in CY17. Thus, a consistent increase
in royalty/technology fees can dent the profitability of the company.
Exhibit 65: Royalty and technology fees as percentage of revenue
92
79
116
168 191
207
215 237
306
290
1.2% 1.2%
1.7%
2.1%
2.4%2.5% 2.6%
2.8%
3.3% 3.1%
0
50
100
150
200
250
300
350
CY08 CY09 CY10 CY11 CY12 CY13 CY14 CY15 CY16 CY17
0.0%
0.5%
1.0%
1.5%
2.0%
2.5%
3.0%
3.5%
4.0%
Royalty & technology Fees As % of turnover
Source: Company, ICICI Direct Research
Aggressive pricing strategies in large projects can impact profitability
ABB (India) had bid very competitively for the Raigarh - Pugalur 800kv
HVDC (RP-800) project. While the management seems reasonably
confident of maintaining profitability in the project, we believe any delays
in execution the same, can alter the margin profile of the project and,
hence, impact the overall profitability. Given the experience with GE-T&D
under the Champa Kurukshetra HVDC project, any delay in the project
timeline can impact the overall margins of the company.
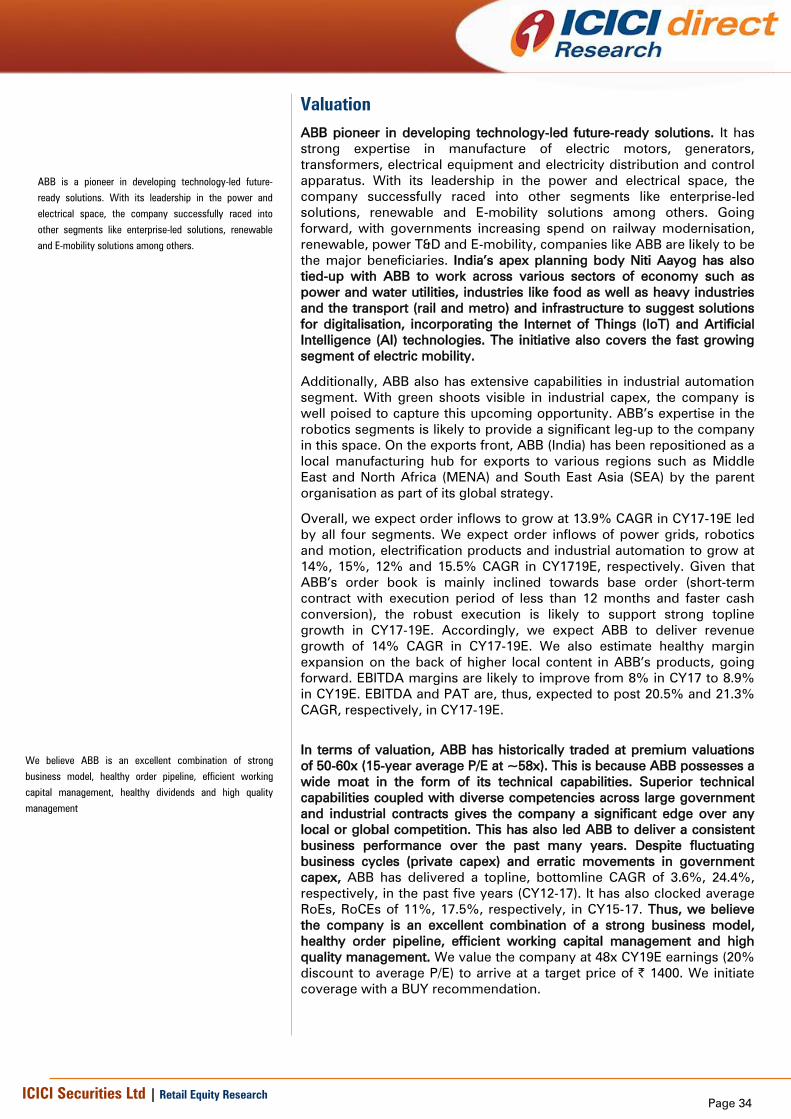
Page 34 ICICI Securities Ltd | Retail Equity Research
Valuation
ABB pioneer in developing technology-led future-ready solutions. It has
strong expertise in manufacture of electric motors, generators,
transformers, electrical equipment and electricity distribution and control
apparatus. With its leadership in the power and electrical space, the
company successfully raced into other segments like enterprise-led
solutions, renewable and E-mobility solutions among others. Going
forward, with governments increasing spend on railway modernisation,
renewable, power T&D and E-mobility, companies like ABB are likely to be
the major beneficiaries. India’s apex planning body Niti Aayog has also
tied-up with ABB to work across various sectors of economy such as
power and water utilities, industries like food as well as heavy industries
and the transport (rail and metro) and infrastructure to suggest solutions
for digitalisation, incorporating the Internet of Things (IoT) and Artificial
Intelligence (AI) technologies. The initiative also covers the fast growing
segment of electric mobility.
Additionally, ABB also has extensive capabilities in industrial automation
segment. With green shoots visible in industrial capex, the company is
well poised to capture this upcoming opportunity. ABB’s expertise in the
robotics segments is likely to provide a significant leg-up to the company
in this space. On the exports front, ABB (India) has been repositioned as a
local manufacturing hub for exports to various regions such as Middle
East and North Africa (MENA) and South East Asia (SEA) by the parent
organisation as part of its global strategy.
Overall, we expect order inflows to grow at 13.9% CAGR in CY17-19E led
by all four segments. We expect order inflows of power grids, robotics
and motion, electrification products and industrial automation to grow at
14%, 15%, 12% and 15.5% CAGR in CY1719E, respectively. Given that
ABB’s order book is mainly inclined towards base order (short-term
contract with execution period of less than 12 months and faster cash
conversion), the robust execution is likely to support strong topline
growth in CY17-19E. Accordingly, we expect ABB to deliver revenue
growth of 14% CAGR in CY17-19E. We also estimate healthy margin
expansion on the back of higher local content in ABB’s products, going
forward. EBITDA margins are likely to improve from 8% in CY17 to 8.9%
in CY19E. EBITDA and PAT are, thus, expected to post 20.5% and 21.3%
CAGR, respectively, in CY17-19E.
In terms of valuation, ABB has historically traded at premium valuations
of 50-60x (15-year average P/E at ~58x). This is because ABB possesses a
wide moat in the form of its technical capabilities. Superior technical
capabilities coupled with diverse competencies across large government
and industrial contracts gives the company a significant edge over any
local or global competition. This has also led ABB to deliver a consistent
business performance over the past many years. Despite fluctuating
business cycles (private capex) and erratic movements in government
capex, ABB has delivered a topline, bottomline CAGR of 3.6%, 24.4%,
respectively, in the past five years (CY12-17). It has also clocked average
RoEs, RoCEs of 11%, 17.5%, respectively, in CY15-17. Thus, we believe
the company is an excellent combination of a strong business model,
healthy order pipeline, efficient working capital management and high
quality management. We value the company at 48x CY19E earnings (20%
discount to average P/E) to arrive at a target price of | 1400. We initiate
coverage with a BUY recommendation.
ABB is a pioneer in developing technology-led future-
ready solutions. With its leadership in the power and
electrical space, the company successfully raced into
other segments like enterprise-led solutions, renewable
and E-mobility solutions among others.
We believe ABB is an excellent combination of strong
business model, healthy order pipeline, efficient working
capital management, healthy dividends and high quality
management
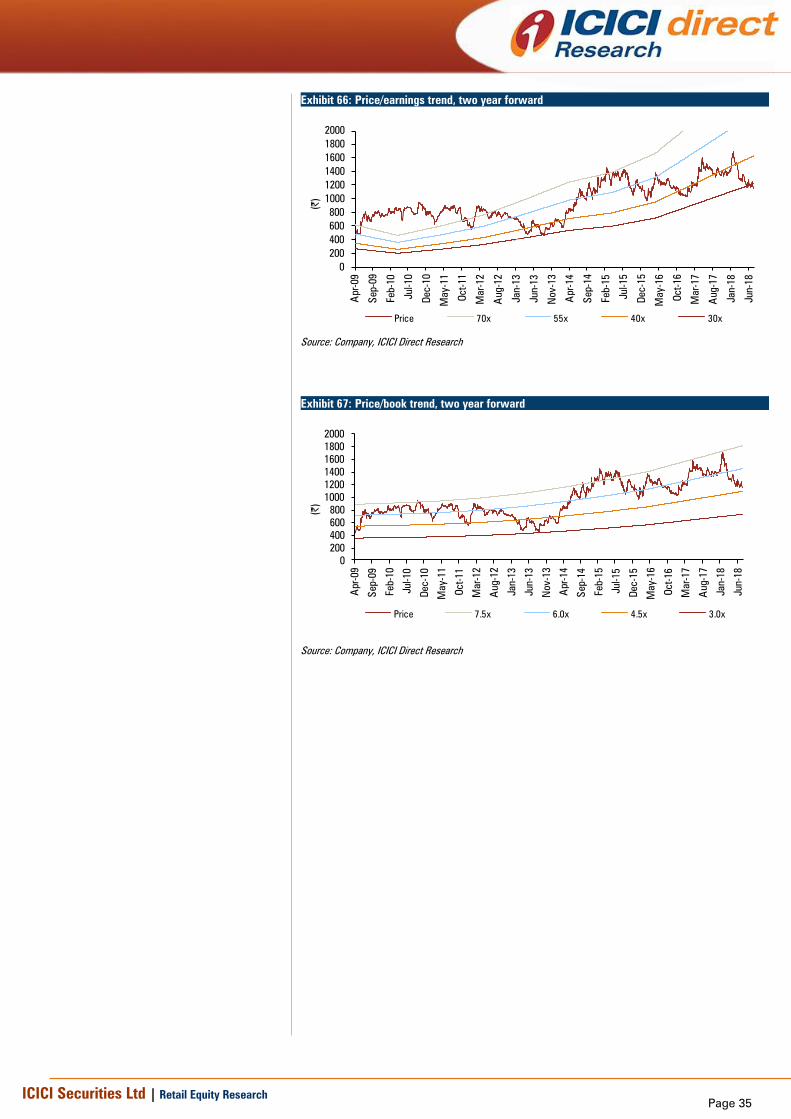
Page 35 ICICI Securities Ltd | Retail Equity Research
Exhibit 66: Price/earnings trend, two year forward
0
200
400
600
800
1000
1200
1400
1600
1800
2000
Apr-09
Sep-09
Feb-10
Jul-10
Dec-10
May-11
Oct-11
Mar-12
Aug-12
Jan-13
Jun-13
Nov-13
Apr-14
Sep-14
Feb-15
Jul-15
Dec-15
May-16
Oct-16
Mar-17
Aug-17
Jan-18
Jun-18
(|)
Price 70x 55x 40x 30x
Source: Company, ICICI Direct Research
Exhibit 67: Price/book trend, two year forward
0
200
400
600
800
1000
1200
1400
1600
1800
2000
Apr-09
Sep-09
Feb-10
Jul-10
Dec-10
May-11
Oct-11
Mar-12
Aug-12
Jan-13
Jun-13
Nov-13
Apr-14
Sep-14
Feb-15
Jul-15
Dec-15
May-16
Oct-16
Mar-17
Aug-17
Jan-18
Jun-18
(|)
Price 7.5x 6.0x 4.5x 3.0x
Source: Company, ICICI Direct Research
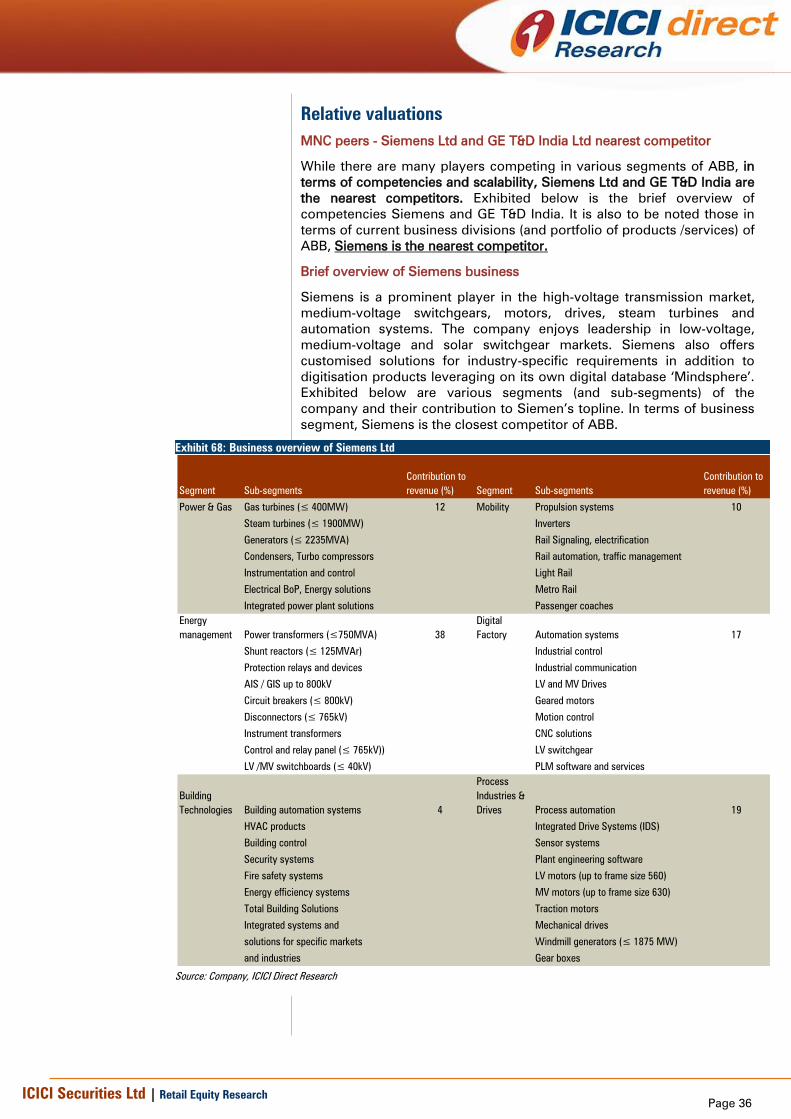
Page 36 ICICI Securities Ltd | Retail Equity Research
Relative valuations
MNC peers - Siemens Ltd and GE T&D India Ltd nearest competitor
While there are many players competing in various segments of ABB, in
terms of competencies and scalability, Siemens Ltd and GE T&D India are
the nearest competitors. Exhibited below is the brief overview of
competencies Siemens and GE T&D India. It is also to be noted those in
terms of current business divisions (and portfolio of products /services) of
ABB, Siemens is the nearest competitor.
Brief overview of Siemens business
Siemens is a prominent player in the high-voltage transmission market,
medium-voltage switchgears, motors, drives, steam turbines and
automation systems. The company enjoys leadership in low-voltage,
medium-voltage and solar switchgear markets. Siemens also offers
customised solutions for industry-specific requirements in addition to
digitisation products leveraging on its own digital database ‘Mindsphere’.
Exhibited below are various segments (and sub-segments) of the
company and their contribution to Siemen’s topline. In terms of business
segment, Siemens is the closest competitor of ABB.
Exhibit 68: Business overview of Siemens Ltd
Segment Sub-segments
Contribution to
revenue (%) Segment Sub-segments
Contribution to
revenue (%)
Power & Gas Gas turbines (≤ 400MW) 12 Mobility Propulsion systems 10
Steam turbines (≤ 1900MW) Inverters
Generators (≤ 2235MVA) Rail Signaling, electrification
Condensers, Turbo compressors Rail automation, traffic management
Instrumentation and control Light Rail
Electrical BoP, Energy solutions Metro Rail
Integrated power plant solutions Passenger coaches
Energy
management Power transformers (≤750MVA) 38
Digital
Factory Automation systems 17
Shunt reactors (≤ 125MVAr) Industrial control
Protection relays and devices Industrial communication
AIS / GIS up to 800kV LV and MV Drives
Circuit breakers (≤ 800kV) Geared motors
Disconnectors (≤ 765kV) Motion control
Instrument transformers CNC solutions
Control and relay panel (≤ 765kV)) LV switchgear
LV /MV switchboards (≤ 40kV) PLM software and services
Building
Technologies Building automation systems 4
Process
Industries &
Drives Process automation 19
HVAC products Integrated Drive Systems (IDS)
Building control Sensor systems
Security systems Plant engineering software
Fire safety systems LV motors (up to frame size 560)
Energy efficiency systems MV motors (up to frame size 630)
Total Building Solutions Traction motors
Integrated systems and Mechanical drives
solutions for specific markets Windmill generators (≤ 1875 MW)
and industries Gear boxes
Source: Company, ICICI Direct Research
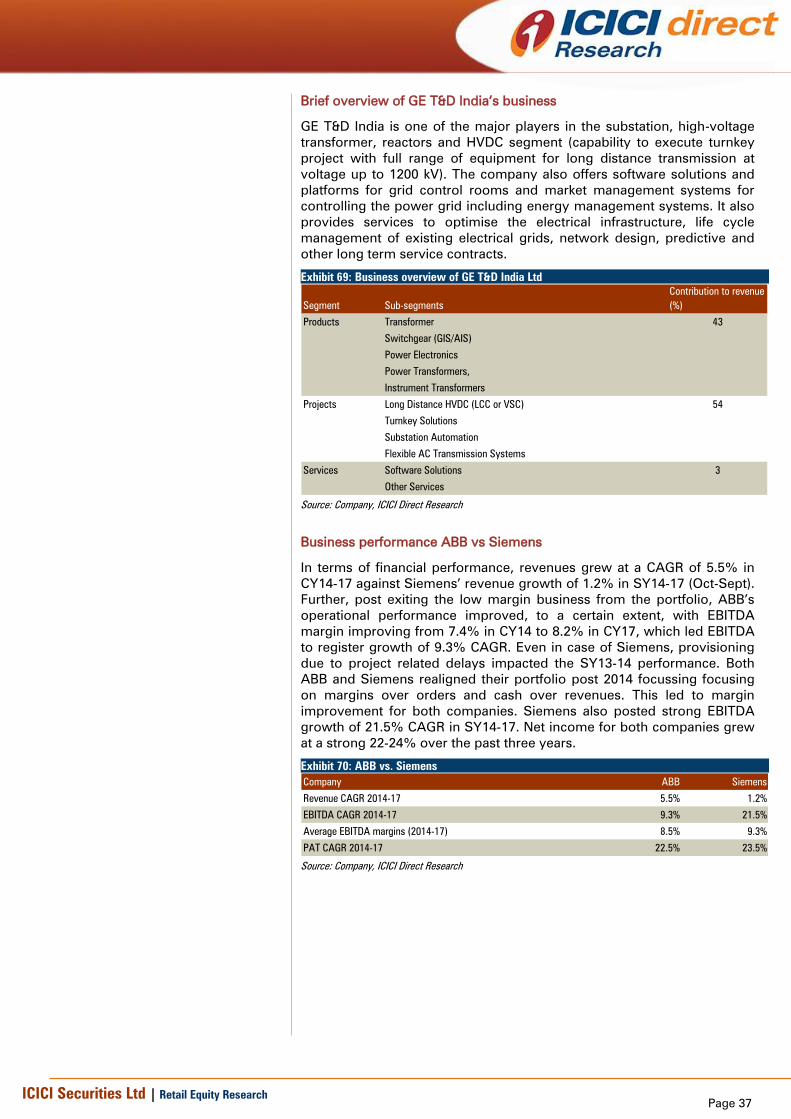
Page 37 ICICI Securities Ltd | Retail Equity Research
Brief overview of GE T&D India’s business
GE T&D India is one of the major players in the substation, high-voltage
transformer, reactors and HVDC segment (capability to execute turnkey
project with full range of equipment for long distance transmission at
voltage up to 1200 kV). The company also offers software solutions and
platforms for grid control rooms and market management systems for
controlling the power grid including energy management systems. It also
provides services to optimise the electrical infrastructure, life cycle
management of existing electrical grids, network design, predictive and
other long term service contracts.
Exhibit 69: Business overview of GE T&D India Ltd
Segment Sub-segments
Contribution to revenue
(%)
Products Transformer 43
Switchgear (GIS/AIS)
Power Electronics
Power Transformers,
Instrument Transformers
Projects Long Distance HVDC (LCC or VSC) 54
Turnkey Solutions
Substation Automation
Flexible AC Transmission Systems
Services Software Solutions 3
Other Services
Source: Company, ICICI Direct Research
Business performance ABB vs Siemens
In terms of financial performance, revenues grew at a CAGR of 5.5% in
CY14-17 against Siemens’ revenue growth of 1.2% in SY14-17 (Oct-Sept).
Further, post exiting the low margin business from the portfolio, ABB’s
operational performance improved, to a certain extent, with EBITDA
margin improving from 7.4% in CY14 to 8.2% in CY17, which led EBITDA
to register growth of 9.3% CAGR. Even in case of Siemens, provisioning
due to project related delays impacted the SY13-14 performance. Both
ABB and Siemens realigned their portfolio post 2014 focussing focusing
on margins over orders and cash over revenues. This led to margin
improvement for both companies. Siemens also posted strong EBITDA
growth of 21.5% CAGR in SY14-17. Net income for both companies grew
at a strong 22-24% over the past three years.
Exhibit 70: ABB vs. Siemens
Company ABB Siemens
Revenue CAGR 2014-17 5.5% 1.2%
EBITDA CAGR 2014-17 9.3% 21.5%
Average EBITDA margins (2014-17) 8.5% 9.3%
PAT CAGR 2014-17 22.5% 23.5%
Source: Company, ICICI Direct Research

Page 38 ICICI Securities Ltd | Retail Equity Research
Exhibit 71: ABB vs. Peers
Cash Networth FY15 FY16 FY17 FY15 FY16 FY17 FY15 FY16 FY17 FY15 FY16 FY17
GE T&D India Ltd 7373 100 3711 3297 4052 314 90 40 8.5 2.7 1.0 121 35 -87
Siemens Ltd 33689 0 10338 10578 10783 1021 1020 1054 9.9 9.6 9.8 1147 2883 1137
ABB India Ltd 24189 4 8015 8509 8961 747 746 763 9.3 8.8 8.5 300 374 420
Company
PAT
Market Cap Debt
Sales EBITDA MarginEBITDA
Source: Company, Bloomberg, ICICI Direct Research
*ABB follows Jan-Dec reporting, thus FY numbers for ABB reflects numbers for CY. Similarly, Siemens follows Oct-Sept reporting, thus FY numbers for Siemens reflects numbers for SY
Exhibit 72: ABB vs. Peers
FY18 FY19E FY20E FY18 FY19E FY20E FY18 FY19E FY20E FY18 FY19E FY20E
GE T&D India Ltd 7373 33.9 28.8 25.9 16.9 17.5 16.9 6.0 5.2 4.6 18.8 19.3 18.6
Siemens Ltd 33689 37.8 29.4 27.0 22.8 19.2 15.9 4.2 3.8 3.5 15.7 12.3 13.3
ABB India Ltd 24189 43.3 35.6 30.5 17.7 14.9 17.2 5.9 5.2 4.6 12.2 19.0 16.4
P/BV ROE
Company Market Cap
P/E EV/EBITDA
Source: Company, Bloomberg, ICICI Direct Research
*ABB follows Jan-Dec reporting, thus FY numbers for ABB reflects numbers for CY. Similarly, Siemens follows Oct-Sept reporting, thus FY numbers for Siemens reflects numbers for SY
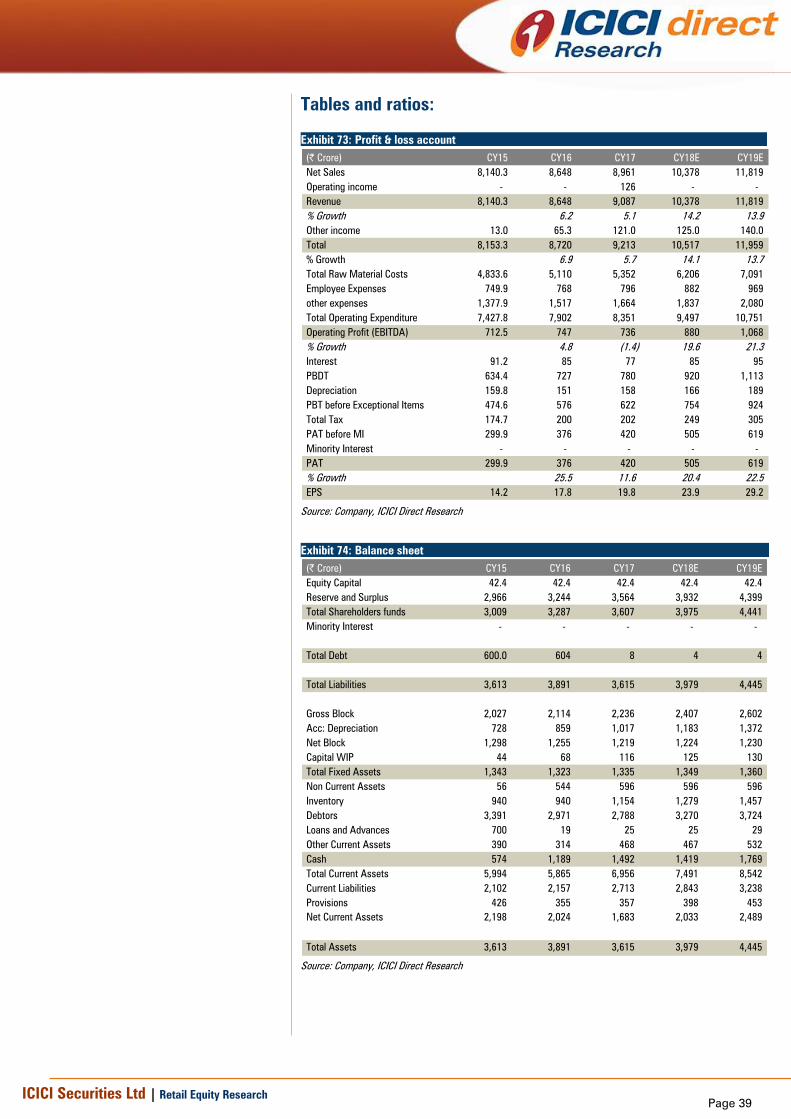
Page 39 ICICI Securities Ltd | Retail Equity Research
Tables and ratios:
Exhibit 73: Profit & loss account
(| Crore) CY15 CY16 CY17 CY18E CY19E
Net Sales 8,140.3 8,648 8,961 10,378 11,819
Operating income - - 126 - -
Revenue 8,140.3 8,648 9,087 10,378 11,819
% Growth 6.2 5.1 14.2 13.9
Other income 13.0 65.3 121.0 125.0 140.0
Total 8,153.3 8,720 9,213 10,517 11,959
% Growth 6.9 5.7 14.1 13.7
Total Raw Material Costs 4,833.6 5,110 5,352 6,206 7,091
Employee Expenses 749.9 768 796 882 969
other expenses 1,377.9 1,517 1,664 1,837 2,080
Total Operating Expenditure 7,427.8 7,902 8,351 9,497 10,751
Operating Profit (EBITDA) 712.5 747 736 880 1,068
% Growth 4.8 (1.4) 19.6 21.3
Interest 91.2 85 77 85 95
PBDT 634.4 727 780 920 1,113
Depreciation 159.8 151 158 166 189
PBT before Exceptional Items 474.6 576 622 754 924
Total Tax 174.7 200 202 249 305
PAT before MI 299.9 376 420 505 619
Minority Interest - - - - -
PAT 299.9 376 420 505 619
% Growth 25.5 11.6 20.4 22.5
EPS 14.2 17.8 19.8 23.9 29.2
Source: Company, ICICI Direct Research
Exhibit 74: Balance sheet
(| Crore) CY15 CY16 CY17 CY18E CY19E
Equity Capital 42.4 42.4 42.4 42.4 42.4
Reserve and Surplus 2,966 3,244 3,564 3,932 4,399
Total Shareholders funds 3,009 3,287 3,607 3,975 4,441
Minority Interest - - - - -
Total Debt 600.0 604 8 4 4
Total Liabilities 3,613 3,891 3,615 3,979 4,445
Gross Block 2,027 2,114 2,236 2,407 2,602
Acc: Depreciation 728 859 1,017 1,183 1,372
Net Block 1,298 1,255 1,219 1,224 1,230
Capital WIP 44 68 116 125 130
Total Fixed Assets 1,343 1,323 1,335 1,349 1,360
Non Current Assets 56 544 596 596 596
Inventory 940 940 1,154 1,279 1,457
Debtors 3,391 2,971 2,788 3,270 3,724
Loans and Advances 700 19 25 25 29
Other Current Assets 390 314 468 467 532
Cash 574 1,189 1,492 1,419 1,769
Total Current Assets 5,994 5,865 6,956 7,491 8,542
Current Liabilities 2,102 2,157 2,713 2,843 3,238
Provisions 426 355 357 398 453
Net Current Assets 2,198 2,024 1,683 2,033 2,489
Total Assets 3,613 3,891 3,615 3,979 4,445
Source: Company, ICICI Direct Research
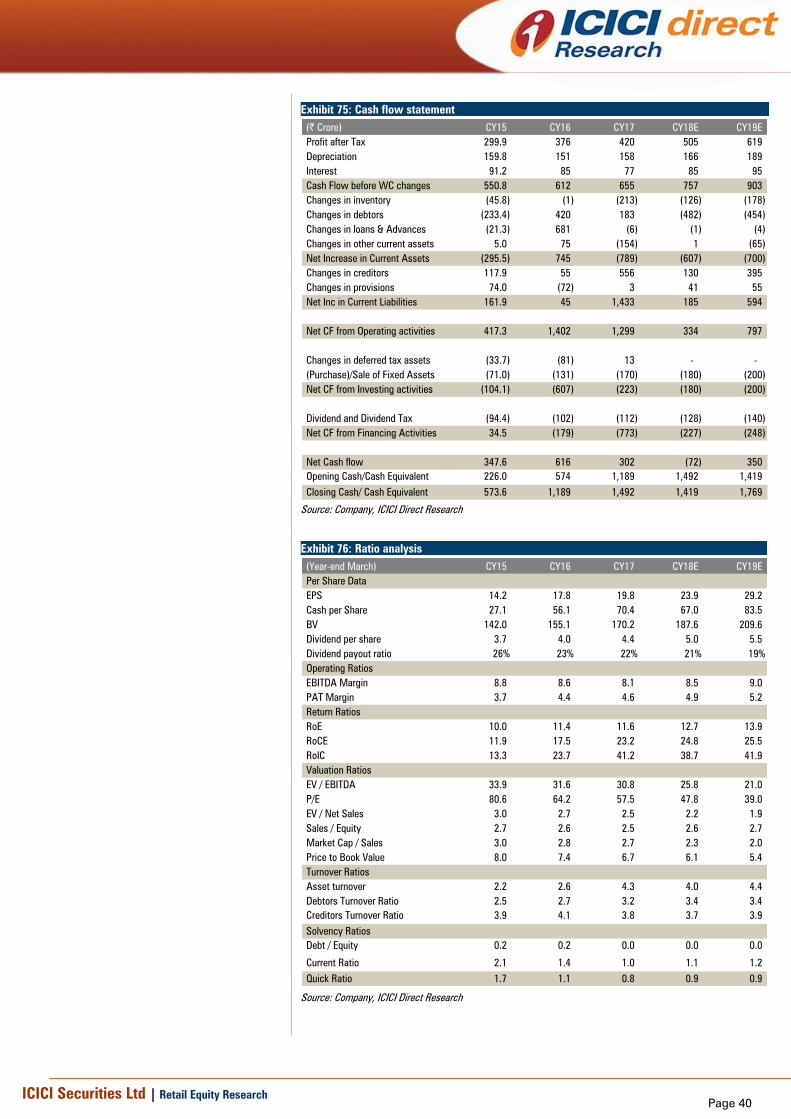
Page 40 ICICI Securities Ltd | Retail Equity Research
Exhibit 75: Cash flow statement
(| Crore) CY15 CY16 CY17 CY18E CY19E
Profit after Tax 299.9 376 420 505 619
Depreciation 159.8 151 158 166 189
Interest 91.2 85 77 85 95
Cash Flow before WC changes 550.8 612 655 757 903
Changes in inventory (45.8) (1) (213) (126) (178)
Changes in debtors (233.4) 420 183 (482) (454)
Changes in loans & Advances (21.3) 681 (6) (1) (4)
Changes in other current assets 5.0 75 (154) 1 (65)
Net Increase in Current Assets (295.5) 745 (789) (607) (700)
Changes in creditors 117.9 55 556 130 395
Changes in provisions 74.0 (72) 3 41 55
Net Inc in Current Liabilities 161.9 45 1,433 185 594
Net CF from Operating activities 417.3 1,402 1,299 334 797
Changes in deferred tax assets (33.7) (81) 13 - -
(Purchase)/Sale of Fixed Assets (71.0) (131) (170) (180) (200)
Net CF from Investing activities (104.1) (607) (223) (180) (200)
Dividend and Dividend Tax (94.4) (102) (112) (128) (140)
Net CF from Financing Activities 34.5 (179) (773) (227) (248)
Net Cash flow 347.6 616 302 (72) 350
Opening Cash/Cash Equivalent 226.0 574 1,189 1,492 1,419
Closing Cash/ Cash Equivalent 573.6 1,189 1,492 1,419 1,769
Source: Company, ICICI Direct Research
Exhibit 76: Ratio analysis
(Year-end March) CY15 CY16 CY17 CY18E CY19E
Per Share Data
EPS 14.2 17.8 19.8 23.9 29.2
Cash per Share 27.1 56.1 70.4 67.0 83.5
BV 142.0 155.1 170.2 187.6 209.6
Dividend per share 3.7 4.0 4.4 5.0 5.5
Dividend payout ratio 26% 23% 22% 21% 19%
Operating Ratios
EBITDA Margin 8.8 8.6 8.1 8.5 9.0
PAT Margin 3.7 4.4 4.6 4.9 5.2
Return Ratios
RoE 10.0 11.4 11.6 12.7 13.9
RoCE 11.9 17.5 23.2 24.8 25.5
RoIC 13.3 23.7 41.2 38.7 41.9
Valuation Ratios
EV / EBITDA 33.9 31.6 30.8 25.8 21.0
P/E 80.6 64.2 57.5 47.8 39.0
EV / Net Sales 3.0 2.7 2.5 2.2 1.9
Sales / Equity 2.7 2.6 2.5 2.6 2.7
Market Cap / Sales 3.0 2.8 2.7 2.3 2.0
Price to Book Value 8.0 7.4 6.7 6.1 5.4
Turnover Ratios
Asset turnover 2.2 2.6 4.3 4.0 4.4
Debtors Turnover Ratio 2.5 2.7 3.2 3.4 3.4
Creditors Turnover Ratio 3.9 4.1 3.8 3.7 3.9
Solvency Ratios
Debt / Equity 0.2 0.2 0.0 0.0 0.0
Current Ratio 2.1 1.4 1.0 1.1 1.2
Quick Ratio 1.7 1.1 0.8 0.9 0.9
Source: Company, ICICI Direct Research

Page 41 ICICI Securities Ltd | Retail Equity Research
RATING RATIONALE
ICICI Direct endeavours to provide objective opinions and recommendations. ICICI Direct assigns ratings to its
stocks according to their notional target price vs. current market price and then categorises them as Strong
Buy, Buy, Hold and Sell. The performance horizon is two years unless specified and the notional target price is
defined as the analysts' valuation for a stock.
Strong Buy: >15%/20% for large caps/midcaps, respectively, with high conviction;
Buy: >10%/15% for large caps/midcaps, respectively;
Hold: Up to +/-10%;
Sell: -10% or more;
Pankaj Pandey Head – Research [email protected]
ICICI Direct Research Desk,
ICICI Securities Limited,
1st Floor, Akruti Trade Centre,
Road No 7, MIDC,
Andheri (East)
Mumbai – 400 093

Page 42 ICICI Securities Ltd | Retail Equity Research
Disclaimer
ANALYST CERTIFICATION
We /I, Chirag Shah PGDBM; Sagar Gandhi MBA (Finance), Research Analysts, authors and the names subscribed to this report, hereby certify that all of the views expressed in this research report
accurately reflect our views about the subject issuer(s) or securities. We also certify that no part of our compensation was, is, or will be directly or indirectly related to the specific recommendation(s) or
view(s) in this report.
Terms & conditions and other disclosures:
ICICI Securities Limited (ICICI Securities) is a full-service, integrated investment banking and is, inter alia, engaged in the business of stock brokering and distribution of financial products. ICICI Securities Limited is a Sebi registered Research Analyst with Sebi Registration Number – INH000000990. ICICI Securities is a wholly-owned subsidiary of ICICI Bank which is India’s largest private sector bank and has its various subsidiaries engaged in businesses of housing finance, asset management, life insurance, general insurance, venture capital fund management, etc. (“associates”), the details in respect of which are available on www.icicibank.com.
ICICI Securities is one of the leading merchant bankers/ underwriters of securities and participate in virtually all securities trading markets in India. We and our associates might have investment banking and other business relationship with a significant percentage of companies covered by our Investment Research Department. ICICI Securities generally prohibits its analysts, persons reporting to analysts and their relatives from maintaining a financial interest in the securities or derivatives of any companies that the analysts cover.
The information and opinions in this report have been prepared by ICICI Securities and are subject to change without any notice. The report and information contained herein is strictly confidential and meant solely for the selected recipient and may not be altered in any way, transmitted to, copied or distributed, in part or in whole, to any other person or to the media or reproduced in any form, without prior written consent of ICICI Securities. While we would endeavour to update the information herein on a reasonable basis, ICICI Securities is under no obligation to update or keep the information current. Also, there may be regulatory, compliance or other reasons that may prevent ICICI Securities from doing so. Non-rated securities indicate that rating on a particular security has been suspended temporarily and such suspension is in compliance with applicable regulations and/or ICICI Securities policies, in circumstances where ICICI Securities might be acting in an advisory capacity to this company, or in certain other circumstances.
This report is based on information obtained from public sources and sources believed to be reliable, but no independent verification has been made nor is its accuracy or completeness guaranteed. This report and information herein is solely for informational purpose and shall not be used or considered as an offer document or solicitation of offer to buy or sell or subscribe for securities or other financial instruments. Though disseminated to all the customers simultaneously, not all customers may receive this report at the same time. ICICI Securities will not treat recipients as customers by virtue of their receiving this report. Nothing in this report constitutes investment, legal, accounting and tax advice or a representation that any investment or strategy is suitable or appropriate to your specific circumstances. The securities discussed and opinions expressed in this report may not be suitable for all investors, who must make their own investment decisions, based on their own investment objectives, financial positions and needs of specific recipient. This may not be taken in substitution for the exercise of independent judgment by any recipient. The recipient should independently evaluate the investment risks. The value and return on investment may vary because of changes in interest rates, foreign exchange rates or any other reason. ICICI Securities accepts no liabilities whatsoever for any loss or damage of any kind arising out of the use of this report. Past performance is not necessarily a guide to future performance. Investors are advised to see Risk Disclosure Document to understand the risks associated before investing in the securities markets. Actual results may differ materially from those set forth in projections. Forward-looking statements are not predictions and may be subject to change without notice.
ICICI Securities or its associates might have managed or co-managed public offering of securities for the subject company or might have been mandated by the subject company for any other assignment in the past twelve months.
ICICI Securities or its associates might have received any compensation from the companies mentioned in the report during the period preceding twelve months from the date of this report for services in respect of managing or co-managing public offerings, corporate finance, investment banking or merchant banking, brokerage services or other advisory service in a merger or specific transaction.
ICICI Securities or its associates might have received any compensation for products or services other than investment banking or merchant banking or brokerage services from the companies mentioned in the report in the past twelve months.
ICICI Securities encourages independence in research report preparation and strives to minimize conflict in preparation of research report. ICICI Securities or its associates or its analysts did not receive any compensation or other benefits from the companies mentioned in the report or third party in connection with preparation of the research report. Accordingly, neither ICICI Securities nor Research Analysts and their relatives have any material conflict of interest at the time of publication of this report.
It is confirmed that Chirag Shah PGDBM; Sagar Gandhi MBA (Finance), Research Analysts of this report have not received any compensation from the companies mentioned in the report in the preceding twelve months.
Compensation of our Research Analysts is not based on any specific merchant banking, investment banking or brokerage service transactions.
ICICI Securities or its subsidiaries collectively or Research Analysts or their relatives do not own 1% or more of the equity securities of the Company mentioned in the report as of the last day of the month preceding the publication of the research report.
Since associates of ICICI Securities are engaged in various financial service businesses, they might have financial interests or beneficial ownership in various companies including the subject company/companies mentioned in this report.
It is confirmed that Chirag Shah PGDBM; Sagar Gandhi MBA (Finance), Research Analysts do not serve as an officer, director or employee of the companies mentioned in the report.
ICICI Securities may have issued other reports that are inconsistent with and reach different conclusion from the information presented in this report.
Neither the Research Analysts nor ICICI Securities have been engaged in market making activity for the companies mentioned in the report.
We submit that no material disciplinary action has been taken on ICICI Securities by any Regulatory Authority impacting Equity Research Analysis activities.
This report is not directed or intended for distribution to, or use by, any person or entity who is a citizen or resident of or located in any locality, state, country or other jurisdiction, where such distribution, publication, availability or use would be contrary to law, regulation or which would subject ICICI Securities and affiliates to any registration or licensing requirement within such jurisdiction. The securities described herein may or may not be eligible for sale in all jurisdictions or to certain category of investors. Persons in whose possession this document may come are required to inform themselves of and to observe such restriction.