july 2011 groundwater and surface water sampling … · sampling at the naturita, colorado,...
TRANSCRIPT

July 2011 Groundwater and Surface Water Sampling at the Naturita, Colorado, Processing Site November 2011
LMS/NAP/S00711

This page intentionally left blank
U.S. Department of Energy DVP—July 2011, Naturita, Colorado November 2011 RIN 11073963 Page i
Contents Sampling Event Summary ...............................................................................................................1 Naturita, Colorado, Processing Site Sample Location Map ............................................................3 Data Assessment Summary ..............................................................................................................5
Water Sampling Field Activities Verification Checklist .............................................................7 Laboratory Performance Assessment ..........................................................................................9 Sampling Quality Control Assessment ......................................................................................16 Certification ...............................................................................................................................19
Attachment 1—Assessment of Anomalous Data Potential Outliers Report Attachment 2—Data Presentation Groundwater Quality Data Surface Water Quality Data Equipment Blank Data Static Water Level Data Hydrographs Time-Concentration Graphs Attachment 3—Sampling and Analysis Work Order Attachment 4—Trip Report

DVP—July 2011, Naturita, Colorado U.S. Department of Energy RIN 11073963 November 2011 Page ii
This page intentionally left blank


DVP—July 2011, Naturita, Colorado U.S. Department of Energy RIN 11073963 November 2011 Page 2
This page intentionally left blank

U.S. Department of Energy DVP—July 2011, Naturita, Colorado November 2011 RIN 11073963 Page 3
Naturita, Colorado, Processing Site Sample Location Map

DVP—July 2011, Naturita, Colorado U.S. Department of Energy RIN 11073963 November 2011 Page 4
This page intentionally left blank

U.S. Department of Energy DVP—July 2011, Naturita, Colorado November 2011 RIN 11073963 Page 5
Data Assessment Summary

DVP—July 2011, Naturita, Colorado U.S. Department of Energy RIN 11073963 November 2011 Page 6
This page intentionally left blank

U.S. D
epartment of Energy
D
VP—
July 2011, Naturita, C
olorado N
ovember 2011
R
IN 11073963
Page 7
Water Sampling Field Activities Verification Checklist
Project Naturita, CO Date(s) of Water Sampling July 26, 2011
Date(s) of Verification September 29, 2011 Name of Verifier Gretchen Baer
Response
(Yes, No, NA) Comments
1. Is the SAP the primary document directing field procedures? Yes
List other documents, SOPs, instructions. Work Order Letter dated June 6, 2011. 2. Were the sampling locations specified in the planning documents sampled? Yes 3. Was a pre-trip calibration conducted as specified in the above-named
documents? Yes Pre-trip calibration was performed on July 26, 2011. 4. Was an operational check of the field equipment conducted daily? Yes
Did the operational checks meet criteria? Yes 5. Were the number and types (alkalinity, temperature, specific conductance,
pH, turbidity, DO, ORP) of field measurements taken as specified? Yes 6. Was the category of the well documented? Yes 7. Were the following conditions met when purging a Category I well:
Was one pump/tubing volume purged prior to sampling? Yes
Did the water level stabilize prior to sampling? Yes Did pH, specific conductance, and turbidity measurements stabilize prior to
sampling? Yes
Was the flow rate less than 500 mL/min? Yes If a portable pump was used, was there a 4-hour delay between pump
installation and sampling? NA

DV
P—July 2011, N
aturita, Colorado
U
.S. Departm
ent of Energy R
IN 11073963
N
ovember 2011
Page 8
Water Sampling Field Activities Verification Checklist (continued)
Response (Yes, No, NA) Comments
8. Were the following conditions met when purging a Category II well:
Was the flow rate less than 500 mL/min? NA
Was one pump/tubing volume removed prior to sampling? NA 9. Were duplicates taken at a frequency of one per 20 samples? Yes Duplicate samples were collected from 0718. 10. Were equipment blanks taken at a frequency of one per 20 samples that were
collected with nondedicated equipment? Yes One equipment blank was collected. 11. Were trip blanks prepared and included with each shipment of VOC samples? NA 12. Were QC samples assigned a fictitious site identification number? Yes Location IDs 2517 and 2986 were used for QC samples. Was the true identity of the samples recorded on the Quality Assurance
Sample Log or in the Field Data Collection System (FDCS) report? Yes QC samples are also listed in the trip report. 13. Were samples collected in the containers specified? Yes 14. Were samples filtered and preserved as specified? Yes 15. Were the number and types of samples collected as specified? Yes 16. Were chain of custody records completed and was sample custody
maintained? Yes 17. Are field data sheets signed and dated by both team members (hardcopies) or
are dates present for the “Date Signed” fields (FDCS)? Yes
18. Was all other pertinent information documented on the field data sheets? Yes 19. Was the presence or absence of ice in the cooler documented at every sample
location? Yes 20. Were water levels measured at the locations specified in the planning
documents? Yes
U.S. Department of Energy DVP—July 2011, Naturita, Colorado November 2011 RIN 11073963 Page 9
Laboratory Performance Assessment General Information
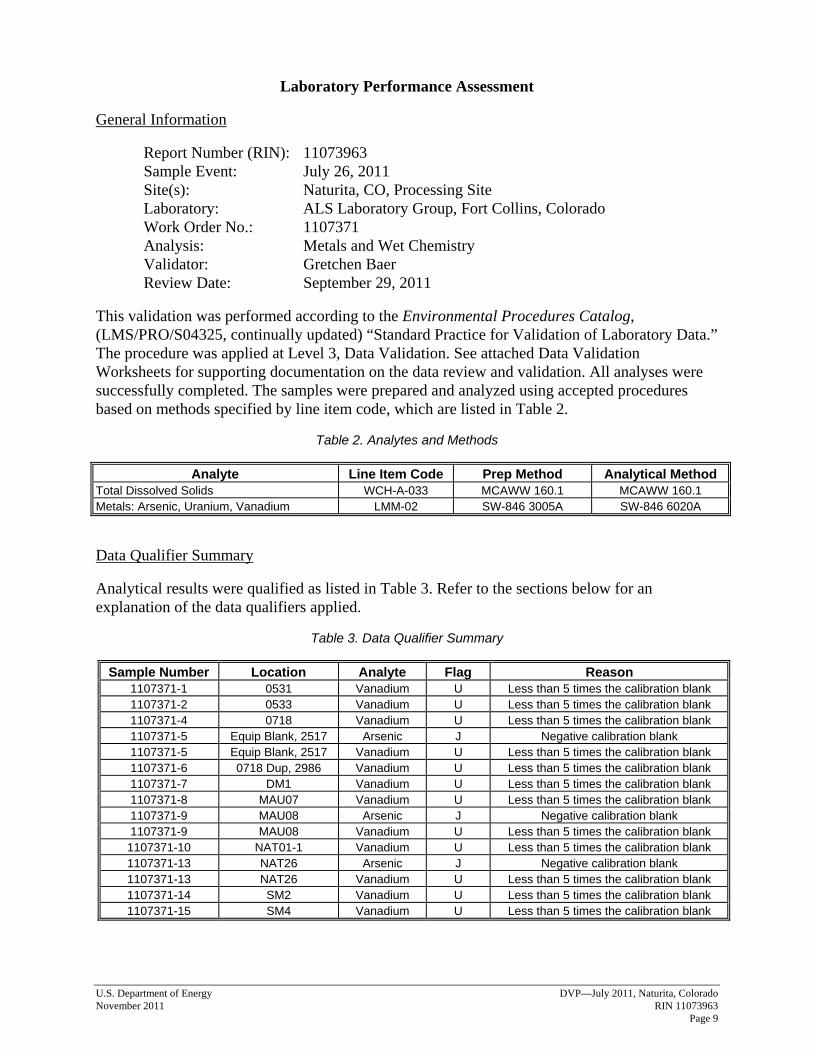
Report Number (RIN): 11073963 Sample Event: July 26, 2011 Site(s): Naturita, CO, Processing Site Laboratory: ALS Laboratory Group, Fort Collins, Colorado Work Order No.: 1107371 Analysis: Metals and Wet Chemistry Validator: Gretchen Baer Review Date: September 29, 2011
This validation was performed according to the Environmental Procedures Catalog, (LMS/PRO/S04325, continually updated) “Standard Practice for Validation of Laboratory Data.” The procedure was applied at Level 3, Data Validation. See attached Data Validation Worksheets for supporting documentation on the data review and validation. All analyses were successfully completed. The samples were prepared and analyzed using accepted procedures based on methods specified by line item code, which are listed in Table 2.
Table 2. Analytes and Methods
Analyte Line Item Code Prep Method Analytical Method Total Dissolved Solids WCH-A-033 MCAWW 160.1 MCAWW 160.1 Metals: Arsenic, Uranium, Vanadium LMM-02 SW-846 3005A SW-846 6020A Data Qualifier Summary Analytical results were qualified as listed in Table 3. Refer to the sections below for an explanation of the data qualifiers applied.
Table 3. Data Qualifier Summary
Sample Number Location Analyte Flag Reason 1107371-1 0531 Vanadium U Less than 5 times the calibration blank 1107371-2 0533 Vanadium U Less than 5 times the calibration blank 1107371-4 0718 Vanadium U Less than 5 times the calibration blank 1107371-5 Equip Blank, 2517 Arsenic J Negative calibration blank 1107371-5 Equip Blank, 2517 Vanadium U Less than 5 times the calibration blank 1107371-6 0718 Dup, 2986 Vanadium U Less than 5 times the calibration blank 1107371-7 DM1 Vanadium U Less than 5 times the calibration blank 1107371-8 MAU07 Vanadium U Less than 5 times the calibration blank 1107371-9 MAU08 Arsenic J Negative calibration blank 1107371-9 MAU08 Vanadium U Less than 5 times the calibration blank 1107371-10 NAT01-1 Vanadium U Less than 5 times the calibration blank 1107371-13 NAT26 Arsenic J Negative calibration blank 1107371-13 NAT26 Vanadium U Less than 5 times the calibration blank 1107371-14 SM2 Vanadium U Less than 5 times the calibration blank 1107371-15 SM4 Vanadium U Less than 5 times the calibration blank

DVP—July 2011, Naturita, Colorado U.S. Department of Energy RIN 11073963 November 2011 Page 10
Sample Shipping/Receiving ALS Laboratory Group in Fort Collins, Colorado, received 15 water samples on July 28, 2011, accompanied by a Chain of Custody form. The Chain of Custody form was checked to confirm that all of the samples were listed with sample collection dates and times, and that signatures and dates were present indicating sample relinquishment and receipt. The Chain of Custody form was complete with no errors or omissions. A copy of the air waybill was included with the receiving documentation. Preservation and Holding Times The sample shipment was received intact with the temperature inside the iced cooler at 0.8 °C, which complies with requirements. All samples were received in the correct container types and had been preserved correctly for the requested analyses and all samples were analyzed within the applicable holding times. Laboratory Instrument Calibration Compliance requirements for satisfactory instrument calibration are established to ensure that the instrument is capable of producing acceptable qualitative and quantitative data for all analytes. Initial calibration demonstrates that the instrument is capable of acceptable performance in the beginning of the analytical run and of producing a linear curve. Compliance requirements for continuing calibration checks are established to ensure that the instrument continues to be capable of producing acceptable qualitative and quantitative data. All laboratory instrument calibrations were performed correctly in accordance with the cited methods. Method MCAWW 160.1 There are no calibration requirements associated with the determination of total dissolved solids. Method SW-846 6020 Calibrations were performed on August 4, 2011, using four calibration standards. The calibration curve correlation coefficient values were greater than 0.995 and–with the exception of vanadium–the absolute values of the intercepts were less than 3 times the method detection limit (MDL). For vanadium, all detects were either greater than 3 times the intercept or have been qualified with a “U” flag (not detected), so no further data qualification is necessary. Calibration and laboratory spike standards were prepared from independent sources. Initial and continuing calibration verification checks were made at the required frequency resulting in four verification checks. All calibration checks met the acceptance criteria. Reporting limit verification checks were made at the required frequency to verify the linearity of the calibration curve near the practical quantitation limit (PQL) and all results were within the acceptance range. Mass calibration and resolution verifications were performed at the beginning of each analytical run in accordance with the analytical procedure. Internal standard recoveries associated with requested analytes were stable and within acceptable ranges.
U.S. Department of Energy DVP—July 2011, Naturita, Colorado November 2011 RIN 11073963 Page 11
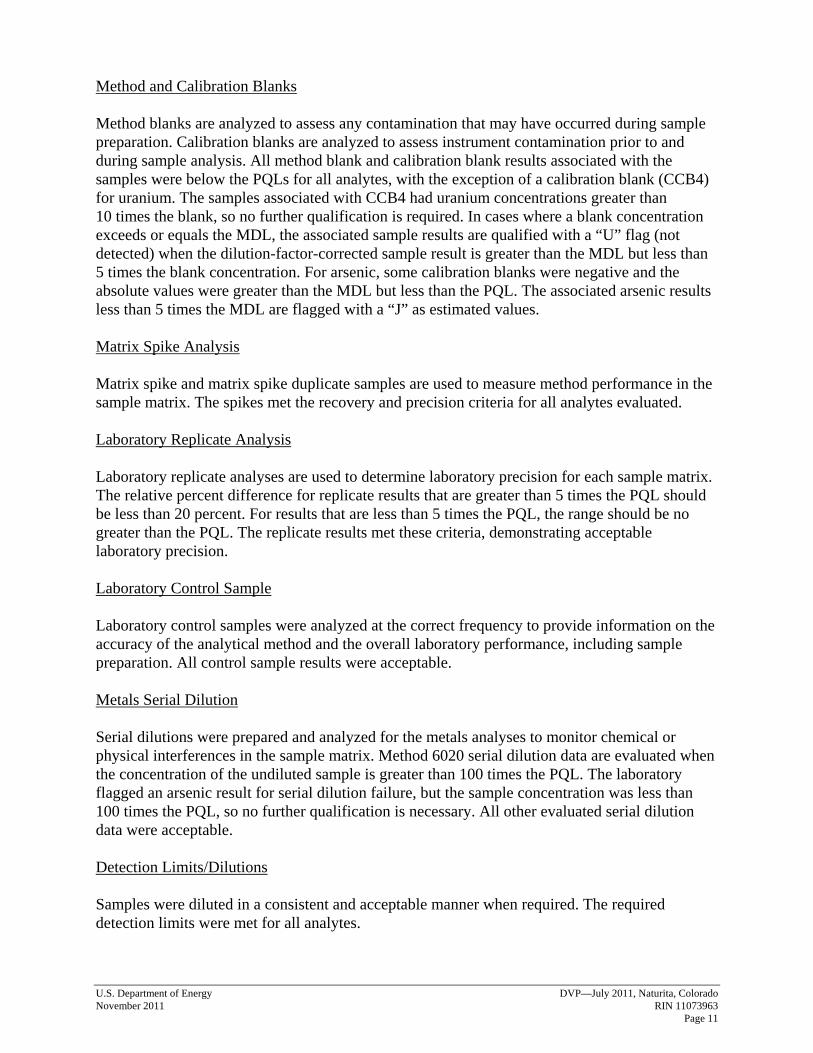
Method and Calibration Blanks Method blanks are analyzed to assess any contamination that may have occurred during sample preparation. Calibration blanks are analyzed to assess instrument contamination prior to and during sample analysis. All method blank and calibration blank results associated with the samples were below the PQLs for all analytes, with the exception of a calibration blank (CCB4) for uranium. The samples associated with CCB4 had uranium concentrations greater than 10 times the blank, so no further qualification is required. In cases where a blank concentration exceeds or equals the MDL, the associated sample results are qualified with a “U” flag (not detected) when the dilution-factor-corrected sample result is greater than the MDL but less than 5 times the blank concentration. For arsenic, some calibration blanks were negative and the absolute values were greater than the MDL but less than the PQL. The associated arsenic results less than 5 times the MDL are flagged with a “J” as estimated values. Matrix Spike Analysis Matrix spike and matrix spike duplicate samples are used to measure method performance in the sample matrix. The spikes met the recovery and precision criteria for all analytes evaluated. Laboratory Replicate Analysis Laboratory replicate analyses are used to determine laboratory precision for each sample matrix. The relative percent difference for replicate results that are greater than 5 times the PQL should be less than 20 percent. For results that are less than 5 times the PQL, the range should be no greater than the PQL. The replicate results met these criteria, demonstrating acceptable laboratory precision. Laboratory Control Sample Laboratory control samples were analyzed at the correct frequency to provide information on the accuracy of the analytical method and the overall laboratory performance, including sample preparation. All control sample results were acceptable. Metals Serial Dilution Serial dilutions were prepared and analyzed for the metals analyses to monitor chemical or physical interferences in the sample matrix. Method 6020 serial dilution data are evaluated when the concentration of the undiluted sample is greater than 100 times the PQL. The laboratory flagged an arsenic result for serial dilution failure, but the sample concentration was less than 100 times the PQL, so no further qualification is necessary. All other evaluated serial dilution data were acceptable. Detection Limits/Dilutions Samples were diluted in a consistent and acceptable manner when required. The required detection limits were met for all analytes.

DVP—July 2011, Naturita, Colorado U.S. Department of Energy RIN 11073963 November 2011 Page 12
Completeness Results were reported in the correct units for all analytes requested using contract-required laboratory qualifiers. Electronic Data Deliverable (EDD) File A revised EDD file arrived on October 11, 2011, in response to Request for Information #11-3308. The revision included minor corrections to some metals results. The data were reloaded into SEEPro on October 17, 2011. The Sample Management System EDD validation module was used to verify that the EDD file was complete and in compliance with requirements. The module compares the contents of the file to the requested analyses to ensure all and only the requested data are delivered. The contents of the EDD were manually examined to verify that the sample results accurately reflect the data contained in the sample data package.
U.S. Department of Energy DVP—July 2011, Naturita, Colorado November 2011 RIN 11073963 Page 13

DV
P—July 2011, N
aturita, Colorado
U
.S. Departm
ent of Energy R
IN 11073963
N
ovember 2011
Page 14

U.S. D
epartment of Energy
D
VP—
July 2011, Naturita, C
olorado N
ovember 2011
R
IN 11073963
Page 15
DVP—July 2011, Naturita, Colorado U.S. Department of Energy RIN 11073963 November 2011 Page 16
Sampling Quality Control Assessment The following information summarizes and assesses quality control for this sampling event. Sampling Protocol All wells were sampled with dedicated tubing using the low-flow purge procedure. Sample results for all wells were qualified with an “F” flag in the database, indicating the wells were purged and sampled using the low-flow sampling method. All wells met the Category I criteria. Surface water locations were sampled using container immersion or a peristaltic pump and tubing reel. Equipment Blank An equipment blank (field ID 2517) was collected after decontamination of equipment used to collect some samples. There were no target analytes detected in the equipment blank. (Vanadium was detected in the equipment blank by the laboratory but this result was qualified during data validation with a “U” flag as not detected for its presence in the calibration blanks). The equipment blank results indicate adequate decontamination of the sampling equipment. Field Duplicate Analysis Field duplicate samples are collected and analyzed as an indication of overall precision of the measurement process. The precision observed includes both field and laboratory precision and has more variability than laboratory duplicates, which measure only laboratory performance. The relative percent difference for duplicate results that are greater than 5 times the PQL should be less than 20 percent. For results that are less than 5 times the PQL, the range should be no greater than the PQL. A duplicate sample (field ID 2986) was collected from location 0718. The duplicate results met the criteria, demonstrating acceptable overall precision.

U.S. Department of Energy DVP—July 2011, Naturita, Colorado November 2011 RIN 11073963 Page 17

DVP—July 2011, Naturita, Colorado U.S. Department of Energy RIN 11073963 November 2011 Page 18


DVP—July 2011, Naturita, Colorado U.S. Department of Energy RIN 11073963 November 2011 Page 20
This page intentionally left blank

Page 21
Attachment 1 Assessment of Anomalous Data

Page 22
This page intentionally left blank
Page 23
Potential Outliers Report

Page 24
This page intentionally left blank

Page 25
Potential Outliers Report Potential outliers are measurements that are extremely large or small relative to the rest of the data and, therefore, are suspected of misrepresenting the population from which they were collected. Potential outliers may result from transcription errors, data-coding errors, or measurement system problems. However, outliers may also represent true extreme values of a distribution and indicate more variability in the population than was expected. Statistical outlier tests give probabilistic evidence that an extreme value does not "fit" with the distribution of the remainder of the data and is therefore a statistical outlier. These tests should only be used to identify data points that require further investigation. The tests alone cannot determine whether a statistical outlier should be discarded or corrected within a data set. There are three steps involved in identifying extreme values or outliers:
1. Identify extreme values that may be potential outliers by generating the Outliers Report using the Sample Management System from data in the SEEPro database. The application compares the new data set with historical data and lists the new data that fall outside the historical data range. A determination is also made if the data are normally distributed using the Shapiro-Wilk Test.
2. Apply the appropriate statistical test. Dixon's Extreme Value test is used to test for statistical outliers when the sample size is less than or equal to 25. This test considers both extreme values that are much smaller than the rest of the data (case 1) and extreme values that are much larger than the rest of the data (case 2). This test is valid only if the data without the suspected outlier are normally distributed. Rosner's Test is a parametric test that is used to detect outliers for sample sizes of 25 or more. This test also assumes that the data without the suspected outliers are normally distributed.
3. Scientifically review statistical outliers and decide on their disposition.
One result was identified as potentially anomalous. The uranium result for location MAU07 had a concentration lower than previously observed. The sample was analyzed twice at different dilutions and the results from the two runs were in close agreement. Also, the uranium analysis was performed concurrently with arsenic and vanadium and neither of those results was anomalous. These observations indicate that an analytical error is unlikely. Potential anomalies in the field parameters were also examined for patterns of repeated high or low bias, which suggest a systematic error due to instrument malfunction. No such patterns were found. The data for this RIN are acceptable as qualified.

Page 26
Data Validation Outliers Report - No Field Parameters Comparison: All Historical Data Laboratory: ALS Laboratory Group RIN: 11073963 Report Date: 11/2/2011
Current Historical Maximum Historical Minimum Number of Statistical Qualifiers Qualifiers Qualifiers Data Points Outlier
Site Code
Location Code
Sample ID
Sample Date
Analyte Result Lab Data Result Lab Data Result Lab Data N N Below Detect
NAT01 MAU07 N001 07/26/2011 Total Dissolved Solids 1000 F 2300 F 1200 F 14 0 No
NAT01 MAU07 N001 07/26/2011 Uranium 0.19 F 0.906 DI 0.327 DI 20 0 Yes
NAT01 MAU08 N001 07/26/2011 Total Dissolved Solids 1700 F 4300 FQ 2100 F 14 0 No
NAT01 MAU08 N001 07/26/2011 Uranium 0.61 F 1.71 DI 0.73 F 21 0 No
NAT01 NAT01-1 N001 07/26/2011 Total Dissolved Solids 1400 F 1870 1500 F 13 0 No
NAT01 NAT01-1 N001 07/26/2011 Uranium 0.55 F 1.31 DI 0.62 F 22 0 No
NAT01 NAT02 N001 07/26/2011 Uranium 0.13 F 0.638 DI 0.14 F 21 0 No
NAT01 NAT08 N001 07/26/2011 Total Dissolved Solids 1200 F 1620 1250 F 16 0 No
NAT01 NAT08 N001 07/26/2011 Uranium 0.31 F 1.24 DI 0.34 F 24 0 No
NAT01 NAT26 N001 07/26/2011 Uranium 1.1 F 2.51 DI 1.2 F 19 0 No
NAT01 SM2 0001 07/26/2011 Uranium 0.00062 0.005 0.0008 14 0 No
NAT01 SM4 0001 07/26/2011 Uranium 0.00068 0.00476 0.0008 15 0 No
STATISTICAL TESTS: The distribution of the data is tested for normality or lognormality using the Shapiro-Wilk Test Outliers are identified using Dixon's Test when there are 25 or fewer data points. Outliers are identified using Rosner's Test when there are 26 or more data points. See Data Quality Assessment: Statistical Methods for Practitioners, EPA QC/G-9S, February 2006.

Page 27
Attachment 2 Data Presentation

Page 28
This page intentionally left blank

Page 29
Groundwater Quality Data

Page 30
This page intentionally left blank

Page 31
Groundwater Quality Data by Location (USEE100) FOR SITE NAT01, Naturita Processing Site REPORT DATE: 10/18/2011 Location: 0715 WELL
Parameter Units Sample Date ID
Depth Range (Ft BLS) Result Qualifiers
Lab Data QA Detection
Limit Uncertainty
Alkalinity, Total (as CaCO3) mg/L 07/26/2011 N001 5.49 - 10.42 237 F #
Arsenic mg/L 07/26/2011 N001 5.49 - 10.42 0.0046 F # 0.00003
Oxidation Reduction Potential mV 07/26/2011 N001 5.49 - 10.42 20.2 F #
pH s.u. 07/26/2011 N001 5.49 - 10.42 7.28 F #
Specific Conductance umhos/cm 07/26/2011 N001 5.49 - 10.42 1245 F #
Temperature C 07/26/2011 N001 5.49 - 10.42 16.4 F #
Total Dissolved Solids mg/L 07/26/2011 N001 5.49 - 10.42 980 F # 20
Turbidity NTU 07/26/2011 N001 5.49 - 10.42 2.84 F #
Uranium mg/L 07/26/2011 N001 5.49 - 10.42 0.11 F # 0.0000058
Vanadium mg/L 07/26/2011 N001 5.49 - 10.42 0.0034 F # 0.00003

Page 32
Groundwater Quality Data by Location (USEE100) FOR SITE NAT01, Naturita Processing Site REPORT DATE: 10/18/2011 Location: 0718 WELL
Parameter Units Sample Date ID
Depth Range (Ft BLS) Result Qualifiers
Lab Data QA Detection
Limit Uncertainty
Alkalinity, Total (as CaCO3) mg/L 07/26/2011 N001 8.6 - 18.6 335 F #
Arsenic mg/L 07/26/2011 N001 8.6 - 18.6 0.004 F # 0.000015
Arsenic mg/L 07/26/2011 N002 8.6 - 18.6 0.0035 F # 0.000015
Oxidation Reduction Potential mV 07/26/2011 N001 8.6 - 18.6 129.6 F #
pH s.u. 07/26/2011 N001 8.6 - 18.6 7.01 F #
Specific Conductance umhos/cm 07/26/2011 N001 8.6 - 18.6 1596 F #
Temperature C 07/26/2011 N001 8.6 - 18.6 13.55 F #
Total Dissolved Solids mg/L 07/26/2011 N001 8.6 - 18.6 1300 F # 40
Total Dissolved Solids mg/L 07/26/2011 N002 8.6 - 18.6 1400 F # 40
Turbidity NTU 07/26/2011 N001 8.6 - 18.6 8.08 F #
Uranium mg/L 07/26/2011 N001 8.6 - 18.6 0.049 F # 0.0000029
Uranium mg/L 07/26/2011 N002 8.6 - 18.6 0.05 F # 0.0000029
Vanadium mg/L 07/26/2011 N001 8.6 - 18.6 0.00043 UF # 0.000015
Vanadium mg/L 07/26/2011 N002 8.6 - 18.6 0.0006 UF # 0.000015

Page 33
Groundwater Quality Data by Location (USEE100) FOR SITE NAT01, Naturita Processing Site REPORT DATE: 10/18/2011 Location: DM1 WELL
Parameter Units Sample Date ID
Depth Range (Ft BLS) Result Qualifiers
Lab Data QA Detection
Limit Uncertainty
Alkalinity, Total (as CaCO3) mg/L 07/26/2011 N001 2.67 - 7.67 184 F #
Arsenic mg/L 07/26/2011 N001 2.67 - 7.67 0.0014 F # 0.000015
Oxidation Reduction Potential mV 07/26/2011 N001 2.67 - 7.67 23.7 F #
pH s.u. 07/26/2011 N001 2.67 - 7.67 7.09 F #
Specific Conductance umhos/cm 07/26/2011 N001 2.67 - 7.67 514 F #
Temperature C 07/26/2011 N001 2.67 - 7.67 18.26 F #
Total Dissolved Solids mg/L 07/26/2011 N001 2.67 - 7.67 350 F # 20
Turbidity NTU 07/26/2011 N001 2.67 - 7.67 5.16 F #
Uranium mg/L 07/26/2011 N001 2.67 - 7.67 0.0026 F # 0.0000029
Vanadium mg/L 07/26/2011 N001 2.67 - 7.67 0.00045 UF # 0.000015
Page 34
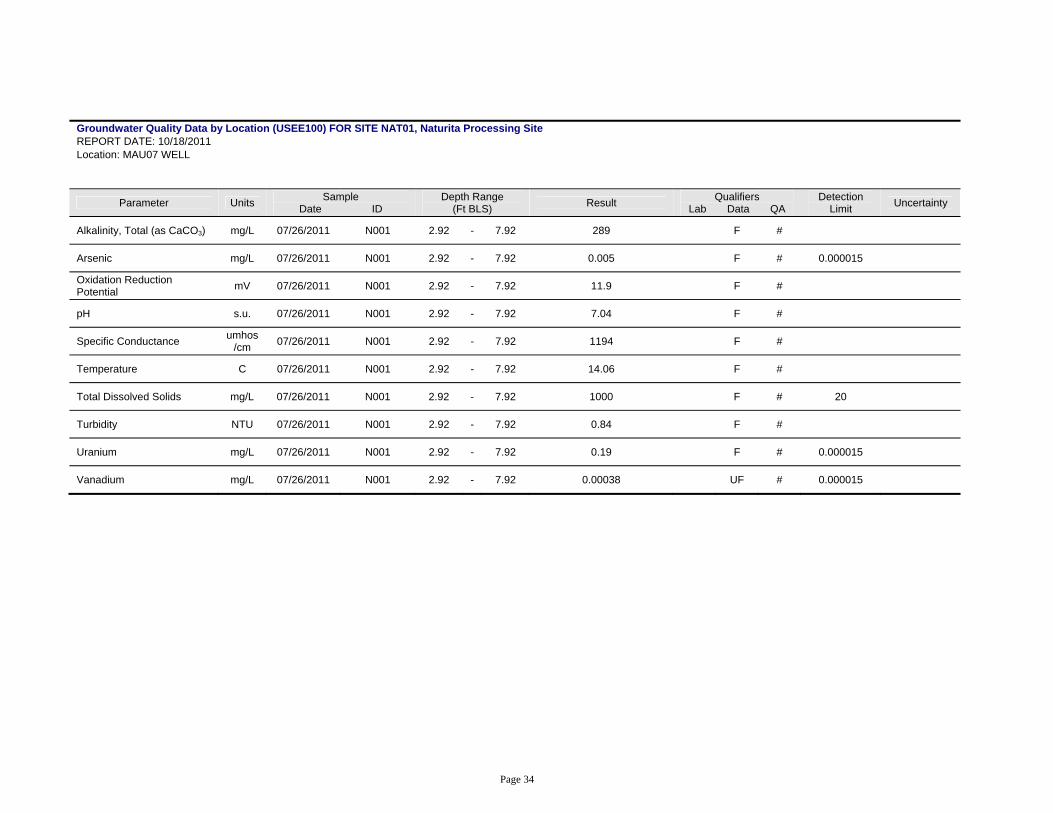
Groundwater Quality Data by Location (USEE100) FOR SITE NAT01, Naturita Processing Site REPORT DATE: 10/18/2011 Location: MAU07 WELL
Parameter Units Sample Date ID
Depth Range (Ft BLS) Result Qualifiers
Lab Data QA Detection
Limit Uncertainty
Alkalinity, Total (as CaCO3) mg/L 07/26/2011 N001 2.92 - 7.92 289 F #
Arsenic mg/L 07/26/2011 N001 2.92 - 7.92 0.005 F # 0.000015
Oxidation Reduction Potential mV 07/26/2011 N001 2.92 - 7.92 11.9 F #
pH s.u. 07/26/2011 N001 2.92 - 7.92 7.04 F #
Specific Conductance umhos/cm 07/26/2011 N001 2.92 - 7.92 1194 F #
Temperature C 07/26/2011 N001 2.92 - 7.92 14.06 F #
Total Dissolved Solids mg/L 07/26/2011 N001 2.92 - 7.92 1000 F # 20
Turbidity NTU 07/26/2011 N001 2.92 - 7.92 0.84 F #
Uranium mg/L 07/26/2011 N001 2.92 - 7.92 0.19 F # 0.000015
Vanadium mg/L 07/26/2011 N001 2.92 - 7.92 0.00038 UF # 0.000015

Page 35
Groundwater Quality Data by Location (USEE100) FOR SITE NAT01, Naturita Processing Site REPORT DATE: 10/18/2011 Location: MAU08 WELL
Parameter Units Sample Date ID
Depth Range (Ft BLS) Result Qualifiers
Lab Data QA Detection
Limit Uncertainty
Alkalinity, Total (as CaCO3) mg/L 07/26/2011 N001 6.17 - 11.17 403 F #
Arsenic mg/L 07/26/2011 N001 6.17 - 11.17 0.00086 FJ # 0.000015
Oxidation Reduction Potential mV 07/26/2011 N001 6.17 - 11.17 50.7 F #
pH s.u. 07/26/2011 N001 6.17 - 11.17 7.07 F #
Specific Conductance umhos/cm 07/26/2011 N001 6.17 - 11.17 2328 F #
Temperature C 07/26/2011 N001 6.17 - 11.17 15.66 F #
Total Dissolved Solids mg/L 07/26/2011 N001 6.17 - 11.17 1700 F # 40
Turbidity NTU 07/26/2011 N001 6.17 - 11.17 3.63 F #
Uranium mg/L 07/26/2011 N001 6.17 - 11.17 0.61 F # 0.000029
Vanadium mg/L 07/26/2011 N001 6.17 - 11.17 0.00057 UF # 0.000015

Page 36
Groundwater Quality Data by Location (USEE100) FOR SITE NAT01, Naturita Processing Site REPORT DATE: 10/18/2011 Location: NAT01-1 WELL
Parameter Units Sample Date ID
Depth Range (Ft BLS) Result Qualifiers
Lab Data QA Detection
Limit Uncertainty
Alkalinity, Total (as CaCO3) mg/L 07/26/2011 N001 17 - 17.5 315 F #
Arsenic mg/L 07/26/2011 N001 17 - 17.5 0.0088 F # 0.000074
Oxidation Reduction Potential mV 07/26/2011 N001 17 - 17.5 1.5 F #
pH s.u. 07/26/2011 N001 17 - 17.5 7.12 F #
Specific Conductance umhos/cm 07/26/2011 N001 17 - 17.5 1788 F #
Temperature C 07/26/2011 N001 17 - 17.5 14.36 F #
Total Dissolved Solids mg/L 07/26/2011 N001 17 - 17.5 1400 F # 40
Turbidity NTU 07/26/2011 N001 17 - 17.5 2.33 F #
Uranium mg/L 07/26/2011 N001 17 - 17.5 0.55 F # 0.000029
Vanadium mg/L 07/26/2011 N001 17 - 17.5 0.0039 UF # 0.000076

Page 37
Groundwater Quality Data by Location (USEE100) FOR SITE NAT01, Naturita Processing Site REPORT DATE: 10/18/2011 Location: NAT02 WELL
Parameter Units Sample Date ID
Depth Range (Ft BLS) Result Qualifiers
Lab Data QA Detection
Limit Uncertainty
Alkalinity, Total (as CaCO3) mg/L 07/26/2011 N001 6.42 - 11.42 217 F #
Arsenic mg/L 07/26/2011 N001 6.42 - 11.42 0.0067 F # 0.000074
Oxidation Reduction Potential mV 07/26/2011 N001 6.42 - 11.42 -1.7 F #
pH s.u. 07/26/2011 N001 6.42 - 11.42 7.21 F #
Specific Conductance umhos/cm 07/26/2011 N001 6.42 - 11.42 929 F #
Temperature C 07/26/2011 N001 6.42 - 11.42 15.6 F #
Total Dissolved Solids mg/L 07/26/2011 N001 6.42 - 11.42 690 F # 20
Turbidity NTU 07/26/2011 N001 6.42 - 11.42 6.43 F #
Uranium mg/L 07/26/2011 N001 6.42 - 11.42 0.13 F # 0.000015
Vanadium mg/L 07/26/2011 N001 6.42 - 11.42 0.56 F # 0.000076

Page 38
Groundwater Quality Data by Location (USEE100) FOR SITE NAT01, Naturita Processing Site REPORT DATE: 10/18/2011 Location: NAT08 WELL
Parameter Units Sample Date ID
Depth Range (Ft BLS) Result Qualifiers
Lab Data QA Detection
Limit Uncertainty
Alkalinity, Total (as CaCO3) mg/L 07/26/2011 N001 6.3 - 11.3 267 F #
Arsenic mg/L 07/26/2011 N001 6.3 - 11.3 0.025 F # 0.000074
Oxidation Reduction Potential mV 07/26/2011 N001 6.3 - 11.3 18.8 F #
pH s.u. 07/26/2011 N001 6.3 - 11.3 7.08 F #
Specific Conductance umhos/cm 07/26/2011 N001 6.3 - 11.3 1510 F #
Temperature C 07/26/2011 N001 6.3 - 11.3 14.84 F #
Total Dissolved Solids mg/L 07/26/2011 N001 6.3 - 11.3 1200 F # 40
Turbidity NTU 07/26/2011 N001 6.3 - 11.3 6.18 F #
Uranium mg/L 07/26/2011 N001 6.3 - 11.3 0.31 F # 0.000015
Vanadium mg/L 07/26/2011 N001 6.3 - 11.3 2.2 F # 0.000076

Page 39
Groundwater Quality Data by Location (USEE100) FOR SITE NAT01, Naturita Processing Site REPORT DATE: 10/18/2011 Location: NAT26 WELL
Parameter Units Sample Date ID
Depth Range (Ft BLS) Result Qualifiers
Lab Data QA Detection
Limit Uncertainty
Alkalinity, Total (as CaCO3) mg/L 07/26/2011 N001 10.67 - 15.67 411 F #
Arsenic mg/L 07/26/2011 N001 10.67 - 15.67 0.00028 B FJ # 0.000074
Oxidation Reduction Potential mV 07/26/2011 N001 10.67 - 15.67 97 F #
pH s.u. 07/26/2011 N001 10.67 - 15.67 7.15 F #
Specific Conductance umhos/cm 07/26/2011 N001 10.67 - 15.67 3177 F #
Temperature C 07/26/2011 N001 10.67 - 15.67 15.06 F #
Total Dissolved Solids mg/L 07/26/2011 N001 10.67 - 15.67 2500 F # 80
Turbidity NTU 07/26/2011 N001 10.67 - 15.67 1.04 F #
Uranium mg/L 07/26/2011 N001 10.67 - 15.67 1.1 F # 0.00015
Vanadium mg/L 07/26/2011 N001 10.67 - 15.67 0.0025 UF # 0.000076
SAMPLE ID CODES: 000X = Filtered sample (0.45 µm). N00X = Unfiltered sample. X = replicate number. LAB QUALIFIERS: * Replicate analysis not within control limits. > Result above upper detection limit. A TIC is a suspected aldol-condensation product. B Inorganic: Result is between the IDL and CRDL. Organic: Analyte also found in method blank. C Pesticide result confirmed by GC-MS. D Analyte determined in diluted sample. E Inorganic: Estimate value because of interference, see case narrative. Organic: Analyte exceeded calibration range of the GC-MS. H Holding time expired, value suspect. I Increased detection limit due to required dilution. J Estimated N Inorganic or radiochemical: Spike sample recovery not within control limits. Organic: Tentatively identified compound (TIC).

Page 40
P > 25% difference in detected pesticide or Aroclor concentrations between 2 columns. U Analytical result below detection limit. W Post-digestion spike outside control limits while sample absorbance < 50% of analytical spike absorbance. X,Y,Z Laboratory defined qualifier, see case narrative. DATA QUALIFIERS: F Low flow sampling method used. G Possible grout contamination, pH > 9. J Estimated value. L Less than 3 bore volumes purged prior to sampling. Q Qualitative result due to sampling technique. R Unusable result. U Parameter analyzed for but was not detected. X Location is undefined. QA QUALIFIER: # Validated according to quality assurance guidelines.
Page 41
Surface Water Quality Data

Page 42
This page intentionally left blank

Page 43
Surface Water Quality Data by Location (USEE102) FOR SITE NAT01, Naturita Processing Site REPORT DATE: 10/18/2011 Location: 0531 SURFACE LOCATION SURFACE WATER LOCATION
Parameter Units Sample Date ID Result Qualifiers
Lab Data QA Detection
Limit Uncertainty
Alkalinity, Total (as CaCO3) mg/L 07/26/2011 N001 107 #
Arsenic mg/L 07/26/2011 N001 0.00083 E # 0.000015
Oxidation Reduction Potential mV 07/26/2011 N001 58.7 #
pH s.u. 07/26/2011 N001 8.4 #
Specific Conductance umhos/cm 07/26/2011 N001 363 #
Temperature C 07/26/2011 N001 18.65 #
Total Dissolved Solids mg/L 07/26/2011 N001 260 # 20
Turbidity NTU 07/26/2011 N001 17.1 #
Uranium mg/L 07/26/2011 N001 0.00071 # 0.0000029
Vanadium mg/L 07/26/2011 N001 0.00054 U # 0.000015

Page 44
Surface Water Quality Data by Location (USEE102) FOR SITE NAT01, Naturita Processing Site REPORT DATE: 10/18/2011 Location: 0533 SURFACE LOCATION SURFACE WATER LOCATION
Parameter Units Sample Date ID Result Qualifiers
Lab Data QA Detection
Limit Uncertainty
Alkalinity, Total (as CaCO3) mg/L 07/26/2011 0001 87 #
Arsenic mg/L 07/26/2011 0001 0.00066 # 0.000015
Total Dissolved Solids mg/L 07/26/2011 0001 280 # 20
Uranium mg/L 07/26/2011 0001 0.0007 # 0.0000029
Vanadium mg/L 07/26/2011 0001 0.00056 U # 0.000015
Oxidation Reduction Potential mV 07/26/2011 N001 184.9 #
pH s.u. 07/26/2011 N001 6.94 #
Specific Conductance umhos/cm 07/26/2011 N001 425 #
Temperature C 07/26/2011 N001 19.61 #
Turbidity NTU 07/26/2011 N001 24.5 #
Page 45
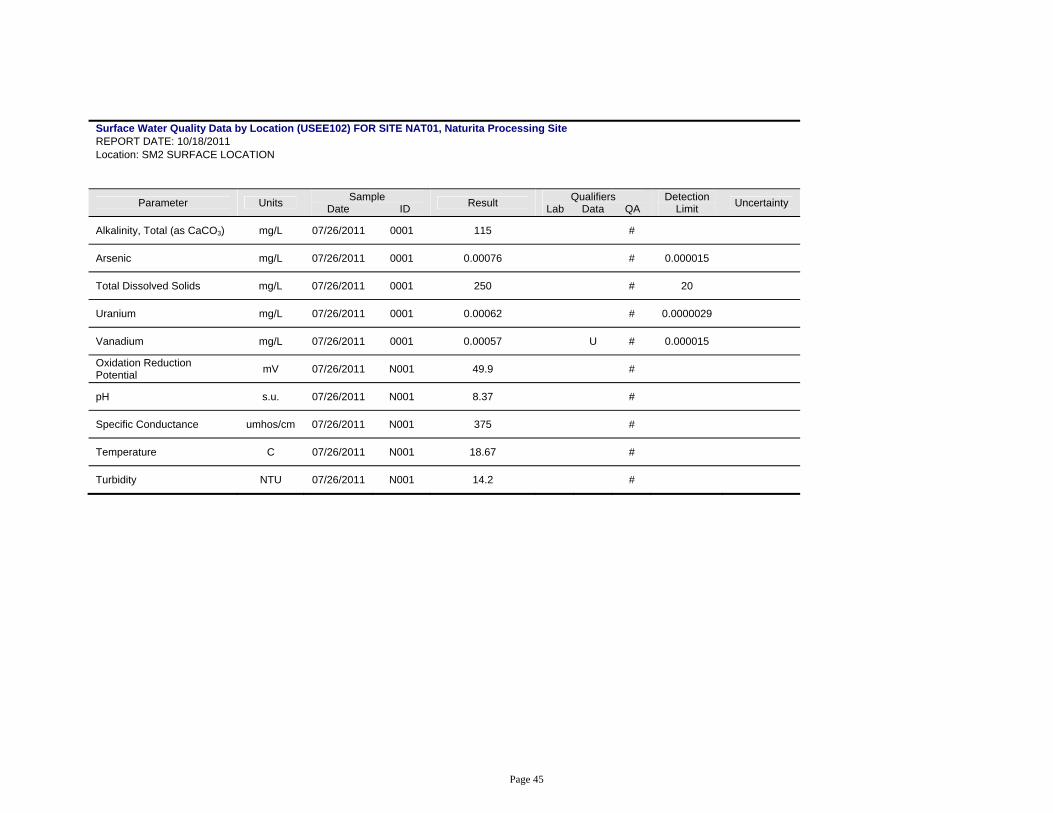
Surface Water Quality Data by Location (USEE102) FOR SITE NAT01, Naturita Processing Site REPORT DATE: 10/18/2011 Location: SM2 SURFACE LOCATION
Parameter Units Sample Date ID Result Qualifiers
Lab Data QA Detection
Limit Uncertainty
Alkalinity, Total (as CaCO3) mg/L 07/26/2011 0001 115 #
Arsenic mg/L 07/26/2011 0001 0.00076 # 0.000015
Total Dissolved Solids mg/L 07/26/2011 0001 250 # 20
Uranium mg/L 07/26/2011 0001 0.00062 # 0.0000029
Vanadium mg/L 07/26/2011 0001 0.00057 U # 0.000015
Oxidation Reduction Potential mV 07/26/2011 N001 49.9 #
pH s.u. 07/26/2011 N001 8.37 #
Specific Conductance umhos/cm 07/26/2011 N001 375 #
Temperature C 07/26/2011 N001 18.67 #
Turbidity NTU 07/26/2011 N001 14.2 #

Page 46
Surface Water Quality Data by Location (USEE102) FOR SITE NAT01, Naturita Processing Site REPORT DATE: 10/18/2011 Location: SM4 SURFACE LOCATION
Parameter Units Sample Date ID Result Qualifiers
Lab Data QA Detection
Limit Uncertainty
Alkalinity, Total (as CaCO3) mg/L 07/26/2011 0001 114 #
Arsenic mg/L 07/26/2011 0001 0.00082 # 0.000015
Total Dissolved Solids mg/L 07/26/2011 0001 240 # 20
Uranium mg/L 07/26/2011 0001 0.00068 # 0.0000029
Vanadium mg/L 07/26/2011 0001 0.00062 U # 0.000015
Oxidation Reduction Potential mV 07/26/2011 N001 -1.1 #
pH s.u. 07/26/2011 N001 8.31 #
Specific Conductance umhos/cm 07/26/2011 N001 363 #
Temperature C 07/26/2011 N001 20.85 #
Turbidity NTU 07/26/2011 N001 21.8 #
SAMPLE ID CODES: 000X = Filtered sample (0.45 µm). N00X = Unfiltered sample. X = replicate number. LAB QUALIFIERS: * Replicate analysis not within control limits. > Result above upper detection limit. A TIC is a suspected aldol-condensation product. B Inorganic: Result is between the IDL and CRDL. Organic: Analyte also found in method blank. C Pesticide result confirmed by GC-MS. D Analyte determined in diluted sample. E Inorganic: Estimate value because of interference, see case narrative. Organic: Analyte exceeded calibration range of the GC-MS. H Holding time expired, value suspect. I Increased detection limit due to required dilution. J Estimated N Inorganic or radiochemical: Spike sample recovery not within control limits. Organic: Tentatively identified compound (TIC). P > 25% difference in detected pesticide or Aroclor concentrations between 2 columns. U Analytical result below detection limit. W Post-digestion spike outside control limits while sample absorbance < 50% of analytical spike absorbance. X,Y,Z Laboratory defined qualifier, see case narrative. DATA QUALIFIERS: F Low flow sampling method used. G Possible grout contamination, pH > 9. J Estimated value. L Less than 3 bore volumes purged prior to sampling. Q Qualitative result due to sampling technique. R Unusable result. U Parameter analyzed for but was not detected. X Location is undefined. QA QUALIFIER: # Validated according to quality assurance guidelines.

Page 47
Equipment Blank Data

Page 48
This page intentionally left blank

Page 49
BLANKS REPORT LAB: PARAGON/ALS LABORATORY GROUP (Fort Collins, CO) RIN: 11073963 Report Date: 10/18/2011
Parameter Site Code
Location ID
Sample Date ID Units Result Qualifiers
Lab Data Detection
Limit Uncertainty Sample Type
Arsenic NAT01 0999 07/26/2011 N001 mg/L 0.000015 U J 0.000015 E
Total Dissolved Solids NAT01 0999 07/26/2011 N001 mg/L 20 U 20 E
Uranium NAT01 0999 07/26/2011 N001 mg/L 0.0000029 U 0.0000029 E
Vanadium NAT01 0999 07/26/2011 N001 mg/L 0.000096 B U 0.000015 E
SAMPLE ID CODES: 000X = Filtered sample (0.45 µm). N00X = Unfiltered sample. X = replicate number. LAB QUALIFIERS: * Replicate analysis not within control limits. > Result above upper detection limit. A TIC is a suspected aldol-condensation product. B Inorganic: Result is between the IDL and CRDL. Organic: Analyte also found in method blank. C Pesticide result confirmed by GC-MS. D Analyte determined in diluted sample. E Inorganic: Estimate value because of interference, see case narrative. Organic: Analyte exceeded calibration range of the GC-MS. H Holding time expired, value suspect. I Increased detection limit due to required dilution. J Estimated N Inorganic or radiochemical: Spike sample recovery not within control limits. Organic: Tentatively identified compound (TIC). P > 25% difference in detected pesticide or Aroclor concentrations between 2 columns. U Analytical result below detection limit. W Post-digestion spike outside control limits while sample absorbance < 50% of analytical spike absorbance. X,Y,Z Laboratory defined qualifier, see case narrative. DATA QUALIFIERS: F Low flow sampling method used. G Possible grout contamination, pH > 9. J Estimated value. L Less than 3 bore volumes purged prior to sampling. Q Qualitative result due to sampling technique. R Unusable result. U Parameter analyzed for but was not detected. X Location is undefined. SAMPLE TYPES: E Equipment Blank.

Page 50
This page intentionally left blank

Page 51
Static Water Level Data

Page 52
This page intentionally left blank

Page 53
STATIC WATER LEVELS (USEE700) FOR SITE NAT01, Naturita Processing Site REPORT DATE: 10/18/2011
Location Code
Flow Code
Top of Casing
Elevation (Ft)
Measurement Date Time
Depth From Top of
Casing (Ft)
Water Elevation
(Ft)
Water Level Flag
0715 07/26/2011 11:58:55 6.41 NA E
0718 07/26/2011 11:13:35 10.79 NA E
DM1 5310.81 07/26/2011 15:35:56 7.84 5302.97
MAU07 5280.88 07/26/2011 12:33:11 6 5274.88
MAU08 5291.19 07/26/2011 12:57:07 10.84 5280.35
NAT01-1 5295.46 07/26/2011 13:48:57 12.22 5283.24
NAT02 5294.09 07/26/2011 14:49:58 6.84 5287.25
NAT08 5292.73 07/26/2011 14:31:47 7.11 5285.62
NAT26 5300.21 07/26/2011 13:25:54 16.55 5283.66
FLOW CODES: B BACKGROUND C CROSS GRADIENT D DOWN GRADIENT F OFF SITE N UNKNOWN O ON SITE U UPGRADIENT WATER LEVEL FLAGS: D Dry F FLOWING E TOP OF CASING ELEVATION DATA NOT AVAILABLE

Page 54
This page intentionally left blank

Page 55
Hydrographs

Page 56
This page intentionally left blank

Page 57
Naturita Processing Site Hydrograph
5270
5275
5280
5285
5290
5295
5300
5305
5310
1998
1999
2000
2001
2002
2003
2004
2005
2006
2007
2008
2009
2010
2011
2012
Date
Wat
er E
leva
tion
(ft)
DM1MAU07MAU08NAT01-1NAT02NAT08NAT26
Location
-

Page 58
Naturita Processing Site Hydrograph
LOCATIONS WHERE TOP OF CASING ELEVATION DATA ARE NOT AVAILABLE
-40
-35
-30
-25
-20
-15
-10
-5
0
1998
1999
2000
2001
2002
2003
2004
2005
2006
2007
2008
2009
2010
2011
2012
Date
Wat
er E
leva
tion
(ft)
07150718
Location
-

Page 59
Time-Concentration Graphs

Page 60
This page intentionally left blank

Page 61
Naturita Processing Site--Groundwater Locations Uranium Concentration
Proposed Alternate Concentration Limit (PACL) = 3.0 mg/L
0
0.5
1
1.5
2
2.5
3
2000
2001
2002
2003
2004
2005
2006
2007
2008
2009
2010
2011
2012
Date
Ura
nium
(mg/
L)
07150718DM1MAU07MAU08NAT01-1NAT02NAT08NAT26PACL
Location

Page 62
Naturita Processing Site--Groundwater Locations Vanadium Concentration
Proposed Alternate Concentration Limit (PACL) = 6.0 mg/L
0
1
2
3
4
5
6
7
2000
2001
2002
2003
2004
2005
2006
2007
2008
2009
2010
2011
2012
Date
Vana
dium
(mg/
L)
NAT02NAT08PACL
Location

Page 63
Naturita Processing Site--Groundwater Locations Vanadium Concentration
Proposed Alternate Concentration Limit (PACL) = 6.0 mg/L
0
0.01
0.02
0.03
0.04
0.05
0.06
0.07
0.08
0.09
0.1
2000
2001
2002
2003
2004
2005
2006
2007
2008
2009
2010
2011
2012
Date
Vana
dium
(mg/
L)
07150718DM1MAU07MAU08NAT01-1NAT26
Location

Page 64
Naturita Processing Site--Surface Water Locations Uranium Concentration
Proposed Alternate Concentration Limit (PACL) = 3.0 mg/L
0
0.005
0.01
0.015
0.02
0.025
0.03
2002
2003
2004
2005
2006
2007
2008
2009
2010
2011
2012
Date
Ura
nium
(mg/
L) 05310533SM2SM4
Location

Page 65
Naturita Processing Site--Surface Water Locations Vanadium Concentration
Proposed Alternate Concentration Limit (PACL) = 6.0 mg/L
0
0.005
0.01
0.015
0.02
0.025
0.03
2002
2003
2004
2005
2006
2007
2008
2009
2010
2011
2012
Date
Van
adiu
m (m
g/L)
05310533SM2SM4
Location

Page 66
This page intentionally left blank

Page 67
Attachment 3 Sampling and Analysis Work Order

Page 68
This page intentionally left blank

Page 69

Page 70

Page 71

Page 72

Page 73
Attachment 4 Trip Report

Page 74
This page intentionally left blank

Page 75

Page 76