junction temperature in light-emitting diodes … · a tri-chromatic white led source (consisting...
TRANSCRIPT
1
Junction temperature in light-emitting diodes assessed by different methods
S. Chhajeda, Y. Xib, Th. Gessmanna, J.-Q. Xib, J. M. Shaha, J. K. Kima, and E. F. Schuberta,b*
Future Chips Constellation
a Department of Electrical, Computer, and Systems Engineering b Department of Physics, Applied Physics, and Astronomy
Rensselaer Polytechnic Institute, Troy, NY 12180
ABSTRACT
The junction temperature of red (AlGaInP), green (GaInN), blue (GaInN), and ultraviolet (GaInN) light-emitting diodes (LEDs) is measured using the temperature coefficients of the diode forward voltage and of the emission-peak energy. The junction temperature increases linearly with DC current as the current is increased from 10 mA to 100 mA. For comparison, the emission-peak-shift method is also used to measure the junction temperature. The emission-peak-shift method is in good agreement with the forward-voltage method. The carrier temperature is measured by the high-energy-slope method, which is found to be much higher than the lattice temperature at the junction. Analysis of the experimental methods reveals that the forward-voltage method is the most sensitive and its accuracy is estimated to be ± 3 °C. The peak position of the spectra is influenced by alloy broadening, polarization, and quantum confined Stark effect thereby limiting the accuracy of the emission-peak-shift method to ±15 °C. A detailed analysis of the temperature dependence of a tri-chromatic white LED source (consisting of three types of LEDs) is performed. The analysis reveals that the chromaticity point shifts towards the blue, the color-rendering index (CRI) decreases, the color temperature increases, and the luminous efficacy decreases as the junction temperature increases. A high CRI > 80 can be maintained, by adjusting the LED power so that the chromaticity point is conserved.
1. INTRODUCTION
The junction temperature of LEDs directly or indirectly affects internal efficiency, maximum output power, reliability, peak wavelength, and spectral width. Various indirect techniques and models have been used for junction-temperature measurements of laser diodes including micro Raman spectroscopy1, threshold voltage2, thermal resistance3, photothermal reflectance microscopy (PRM)4, electroluminescence5, and photoluminescence6. A non-contact method based on the emission peak ratio has been demonstrated for a white dichromatic LED source.7
In this paper, the junction temperature and carrier temperature of red, green, blue, and ultraviolet (UV) LEDs are reported using the forward-voltage, emission-peak-shift, and high-energy-slope method. The experimental results show that the diode forward-voltage method is the most accurate and can be used for electronic and optoelectronic devices with a pn-junction. The change in CRI, luminous efficacy, correlated color temperature (CCT), and chromaticity coordinates of a trichromatic LED-based white light source is determined. These parameters strongly change with temperature and can render the source unsuitable for certain applications. This problem can be alleviated by changing the input power of individual LEDs, which maintains the CRI and luminous efficacy of the source at high values.
The diode forward voltage can be used to assess the junction temperature of pn-junction diodes. The forward-voltage method consists of two series of measurements, a calibration measurement and the actual junction-temperature measurement. In the calibration measurement, a pulsed forward current (with duty cycle 0.1 %) drives the LED sample located in a temperature-controlled oven. The small duty cycle ensures that the junction temperature is equal to the ambient temperature. An oscilloscope is used to measure the forward voltage Vf of the LED sample at different oven temperatures. The calibration measurement serves as the reference for the deduction of the junction temperature from DC measurement and establishes the relation between the forward voltage and the junction temperature. Xi and coworkers have previously shown8-10 that the junction-voltage temperature coefficient is given by
* Electronic email: [email protected]; phone 1 518 276-8775; fax 1 518 276-8042

2
ek
TE
eeTEeV
TV 3
dd1
dd ggjj −+
−= , (1)
where Vj is the junction voltage, Eg is the band gap energy, e is the unit charge, and k is Boltzmann’s constant. Furthermore, the temperature coefficient of the diode forward voltage for a device having an appreciable series resistance, caused by the neutral regions of the semiconductor, is given by
resistortoduejunctiontodue
IRkT
SkTEek
TE
eeTEeV
TV
⎟⎟⎠
⎞⎜⎜⎝
⎛ +−⎟⎟
⎠
⎞⎜⎜⎝
⎛−+
−= s2
aggjf 2213
dd1
dd
, (2)
where the second summand on the right-hand side of the equation is due to a thermally activated resistor. The meaning of the variables is: Ea is the dopant activation energy of the series resistor; S comes from the temperature dependence of the mobility: µp ∝ TS; and Rs is the series resistance. The series resistance can be caused by the neutral n-type or p-type region of the diode. The contribution of the series resistance can be significant, particularly in UV LEDs. Although Eqs. (1) and (2) are very useful, a calibration measurement is still needed for practical junction temperature measurements.
The peak energy of optical emission from a bulk semiconductor, for band-to-band recombination, is given by hνpeak = Eg + (1/2)kT. Because dEg/dT is much larger than d(1/2)kT/dT, the peak energy versus temperature can be derived from the Varshni equation
T
TEEg +−=βα 2
0 , (3)
where α and β are the Varshni parameters. Hence, the junction temperature of LEDs can be evaluated by measuring the peak position of the emission spectrum. In order to increase the accuracy of the method, a calibration measurement is used. In the calibration measurement of diode forward voltage, and the emission peak energy is recorded.
The Boltzmann distribution of carriers, applicable to the high-energy part of the emission spectrum, results in an exponential dependence of the emission intensity on energy according to
⎟⎟
⎠
⎞
⎜⎜
⎝
⎛ ν−∝
c exp
kThI , (4)
where Tc is the carrier temperature. The slope of the high-energy part of the spectrum is thus given by
c
1lnkTdh
Id−∝
ν. (5)
Thus, the carrier temperature can be directly inferred from the high-energy slope. Because the carrier temperature is generally higher than the junction temperature, e.g. due to high-energy injection of carriers into the active region, this method gives an upper limit for the actual junction temperature. 11
2. EXPERIMENTAL RESULTS
To demonstrate the viability of the methods, the junction temperature of red (AlGaInP), green (GaInN), blue (GaInN), and ultraviolet (GaInN) LEDs is determined. Equipment for the experiments included a HP 214B pulse generator, a Wisconsin oven with thermal sensor, a Tektronix TDS 3054B four channel color digital oscilloscope, an Ando AQ-6315A optical spectrum analyzer, an Agilent E3649A DC power supply, and a HP 34401A multimeter to measure the DC forward voltage.
Figure 1 shows the calibration results of the diode forward-voltage method. A linear decrease in Vf with respect to Tj is observed at temperatures ranging from room temperature to 120 °C in steps of 20 °C. The forward voltage drop is recorded at current levels ranging from 10 mA to 100 mA in steps of 10 mA. The temperature coefficient of the diode forward voltage can be obtained from Figure 1. The coefficient dVf /dT is equal to – 2.3 mV/K for the UV LED sample

3
(λ = 375 nm), – 5 mV/K for the blue LED sample (λ = 455 nm), – 3.8 mV/K for the green LED sample (λ = 530 nm), and – 1.5 mV/K for the red LED sample (λ = 605 nm).
Fig. 1: Calibration curves of forward voltage versus oven temperature for UV, blue, green, and red LEDs at
different values of pulsed current.
Fig. 2: Calibration curves of peak wavelength versus oven temperature for UV, blue, green, and red LEDs at
different values of pulsed current. The separation in the curves corresponding to different values of current at a given temperature in case of III-nitride based UV, blue, and green LEDs is due to the quantum confined Stark effect.

4
Figure 2 shows the calibration plots for the emission-peak-shift method. We notice that the peak wavelength of III-nitride-based LEDs moves towards shorter wavelengths with increasing drive current even when the temperature is maintained constant. This shift is not observed in case of III-phosphide red LEDs. This blue shift in case of the III-nitride based LEDs is due to the piezoelectricity-induced quantum confined Stark effect.12 We also notice that red shift of the peak wavelength of the red LED with increasing oven temperature is greater compared to the shift in the blue and green LEDs.
Fig. 3: Electroluminescence spectra of GaInN blue LED at 20 and 100 mA. Dashed lines represent the linear fit to
the high-energy side of the spectrum where carrier distribution can be approximated by the Boltzmann function.
In the high-energy-slope method, electroluminescence spectra of LEDs are obtained at various predetermined
current levels. Figure 3 shows the emission spectrum of a blue GaInN LED for DC current values of 20 mA and 100 mA. Note the increase in carrier temperature at the higher DC current. Data from the high-energy side of the spectrum near the peak energy is used for the calculation of the carrier temperature because at even higher energies, the optical signal is compromised by self-absorption effects.
Fig. 4: Plots of junction temperature versus DC current for UV, blue, green, and red LEDs. The forward-voltage
method is most accurate.
5
Figure 4 shows the comparison of results from all three methods of junction temperature measurement for UV, blue, green, and red LEDs. The results from the first two methods, i.e. diode-forward-voltage and emission-peak-shift, are in good agreement with each other. Note that the forward voltage method provides the most accurate values of the junction temperature. The carrier temperature obtained from the high-energy-slope method is much higher than the junction temperature. As explained above, the high-energy-slope method is based on the Boltzmann distribution of carriers. The high-energy-slope method may even overestimate the carrier temperature due to alloy broadening effects which lower the high-energy slope and increase the apparent carrier temperature.
Blue Green Red
dλpeak/dT 0.0389 nm/°C 0.0308 nm/°C 0.1562 nm/°C d∆λ /dT 0.0466 nm/°C 0.0625 nm/°C 0.1812 nm/°C
Tchar 493 K 379 K 209 K
Table 1: Experimentally determined temperature coefficients of various LED parameters.
Experimentally determined values of temperature coefficients of various LED parameters and the characteristic temperatures for different LEDs are shown in Table 1. The charactistic temperature Tchar allows one to express the temperature dependence of the LED emission power according to I = I300K exp[–(T – 300K)/Tchar].13 Note that all LEDs show a red shift with increasing temperature.
Theoretically a spectral width of 1.8kT is expected for the thermally broadened emission spectrum. However, due to other broadening mechanisms, like alloy broadening, the observed values of spectral width at room temperature in III-nitride LEDs are 5kT – 8kT. This broadening in the emission spectrum results in the movement of the chromaticity point away from the perimeter towards the center of the chromaticity diagram thereby reducing the size of the color gamut.
Experimental spectra can be fitted very well with the Gaussian function. The spectral power density function of an LED is then given by
( )⎥⎥⎥⎥
⎦
⎤
⎢⎢⎢⎢
⎣
⎡
σ
λλ⎟⎠⎞
⎜⎝⎛ −
πσ=λ ⎟⎟
⎠
⎞⎜⎜⎝
⎛ − peak2
21exp
21PP , (6)
where
2ln22
2peak
hc
E∆λσ = , (7)
and P is the total optical power of the LED and ∆E is the FWHM of the emission spectrum. Therefore the spectral power density function for a tri-chromatic LED-based white light source is given by
)( )( )( )( redgreenbluewhite λ+λ+λ=λ PPP P . (8)
The luminous efficacy of this source can be calculated using
( )
∫∫
λ
λ
λλ
λλλ⎟⎠⎞
⎜⎝⎛=
d)(
d)(
Wlm683
white
white
P
VPLE . (9)
To calculate the CRI of the tri-chromatic LED-based white light source, the CIE 1976 (u’, v’) uniform chromaticity coordinates are used. The reference light source chosen is a Planckian radiator with color temperature of 6500 K. The calculation procedure defined by CIE is followed.14 Adaptive color shift is taken into account for CRI calculations at 50 °C and 80 °C where the chromaticity coordinates of the tri-chromatic LED-based white light source slightly depart
6
from the Planckian locus.
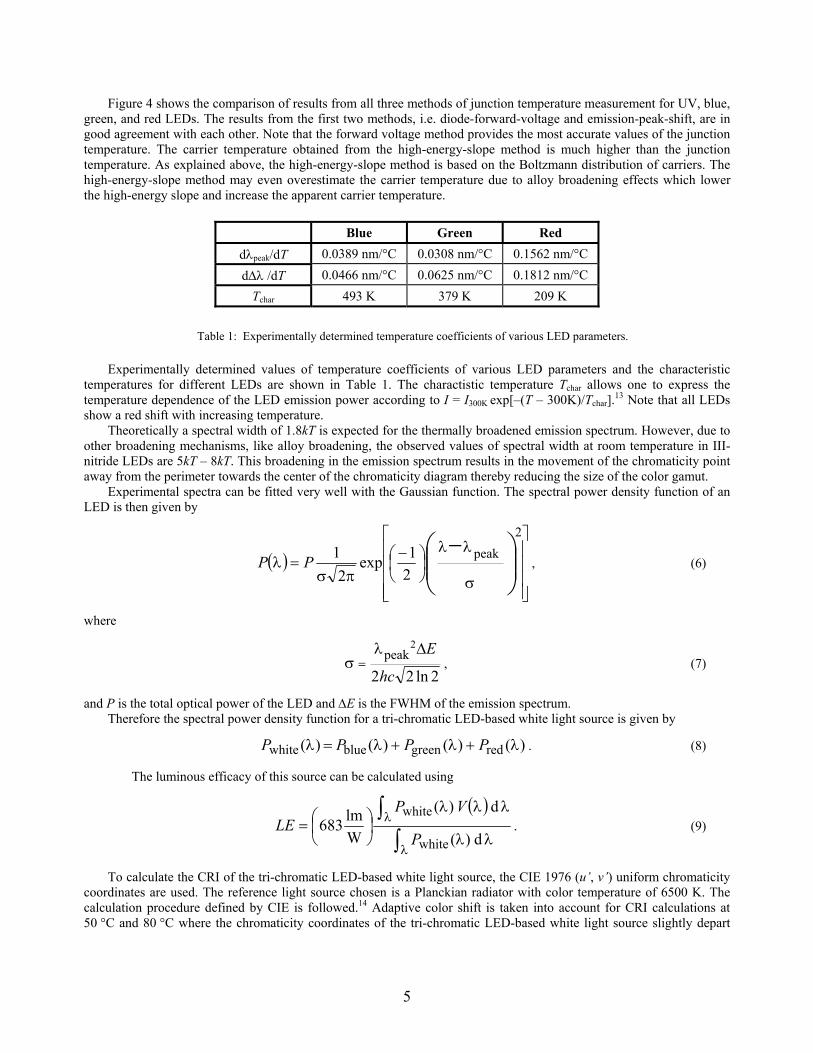
Fig. 5: Emission spectrum for tri-chromatic LED-based white light source with different junction temperature. The electrical power ratio of these LEDs is constant so that the color temperature/correlated color temperature of the light source changes as shown in Table 2.
λpeak 455 nm 530 nm 605 nm
∆λ 23.9 nm 46.6 nm 19.2 nm
∆E 5.5 kT 7.9 kT 2.5 kT 20 °C
Pint 1 W 1.067 W 0.786 W
(x, y) = (0.315, 0.327) CRI = 84 LE = 319 lm/W TC = 6500 K
λpeak 456.2 nm 530.9 nm 609.7 nm
∆λ 25.3 nm 48.5 nm 24.64 nm
∆E 5.8 kT 8.2 kT 3.2 kT Pint (before power
adjustment) 0.941 W 0.986 W 0.681 W 50 °C
Pint (after power adjustment) 1 W 1.08 W 0.801 W
(x, y) = (0.307, 0.323) TCC = 6900 K CRI = 80 (80) LE = 307 lm/W Changing power ratio TC = 6500 K CRI = 85 LE = 311 lm/W
λpeak 457.4 nm 531.8 nm 614.4 nm
∆λ 26.7 nm 50.4 nm 30.08 nm
∆E 6.1 kT 8.5 kT 3.9 kT
Pint (before power adjustment)
0.885 W 0.911 W 0.590 W 80 °C
Pint (after power adjustment)
1 W 1.079 W 0.834 W
(x, y) = (0.296, 0.320) TCC = 7200 K CRI = 72 (70) LE = 297 lm/W Changing power ratio TC = 6500 K CRI = 81 LE = 302 lm/W
Table 2: Values of peak wavelength, spectral width, and powers of individual LEDs for different values of junction temperature. Calculated values of CRI and luminous efficacy for each temperature are given.
The change in the LED temperature results in change in the spectrum of the tri-chromatic LED-based white light
source, as shown in Figure 5. Data from Table 1 is used to calculate the values of various LED parameters including the chromaticity coordinates, CRI, and luminous efficacy values at 20 °C, 50 °C and 80 °C. These values are listed in
7
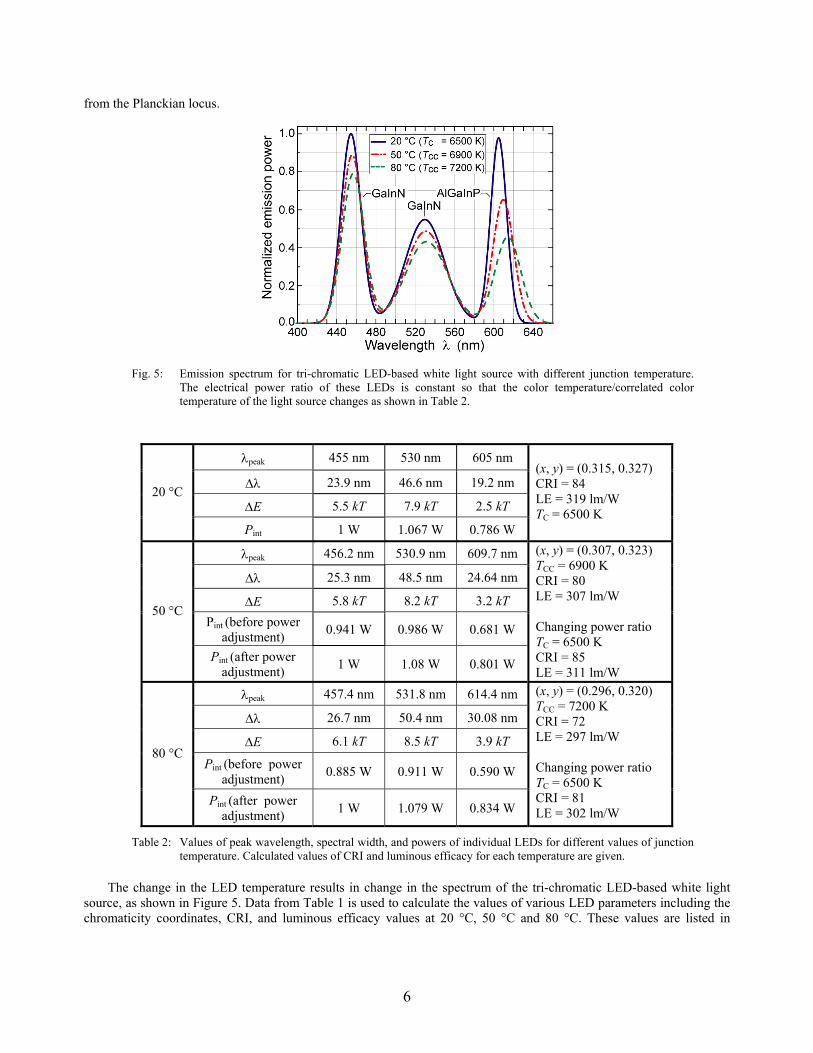
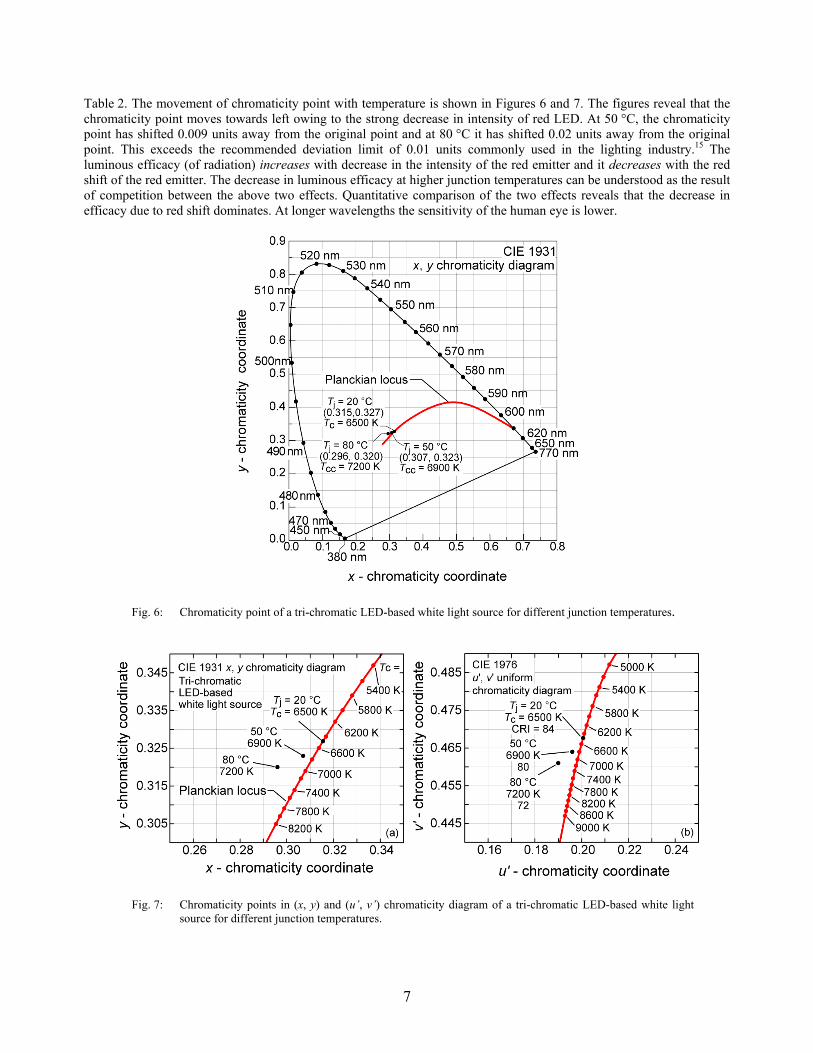
Table 2. The movement of chromaticity point with temperature is shown in Figures 6 and 7. The figures reveal that the chromaticity point moves towards left owing to the strong decrease in intensity of red LED. At 50 °C, the chromaticity point has shifted 0.009 units away from the original point and at 80 °C it has shifted 0.02 units away from the original point. This exceeds the recommended deviation limit of 0.01 units commonly used in the lighting industry.15 The luminous efficacy (of radiation) increases with decrease in the intensity of the red emitter and it decreases with the red shift of the red emitter. The decrease in luminous efficacy at higher junction temperatures can be understood as the result of competition between the above two effects. Quantitative comparison of the two effects reveals that the decrease in efficacy due to red shift dominates. At longer wavelengths the sensitivity of the human eye is lower.
Fig. 6: Chromaticity point of a tri-chromatic LED-based white light source for different junction temperatures.
Fig. 7: Chromaticity points in (x, y) and (u’, v’) chromaticity diagram of a tri-chromatic LED-based white light source for different junction temperatures.
8
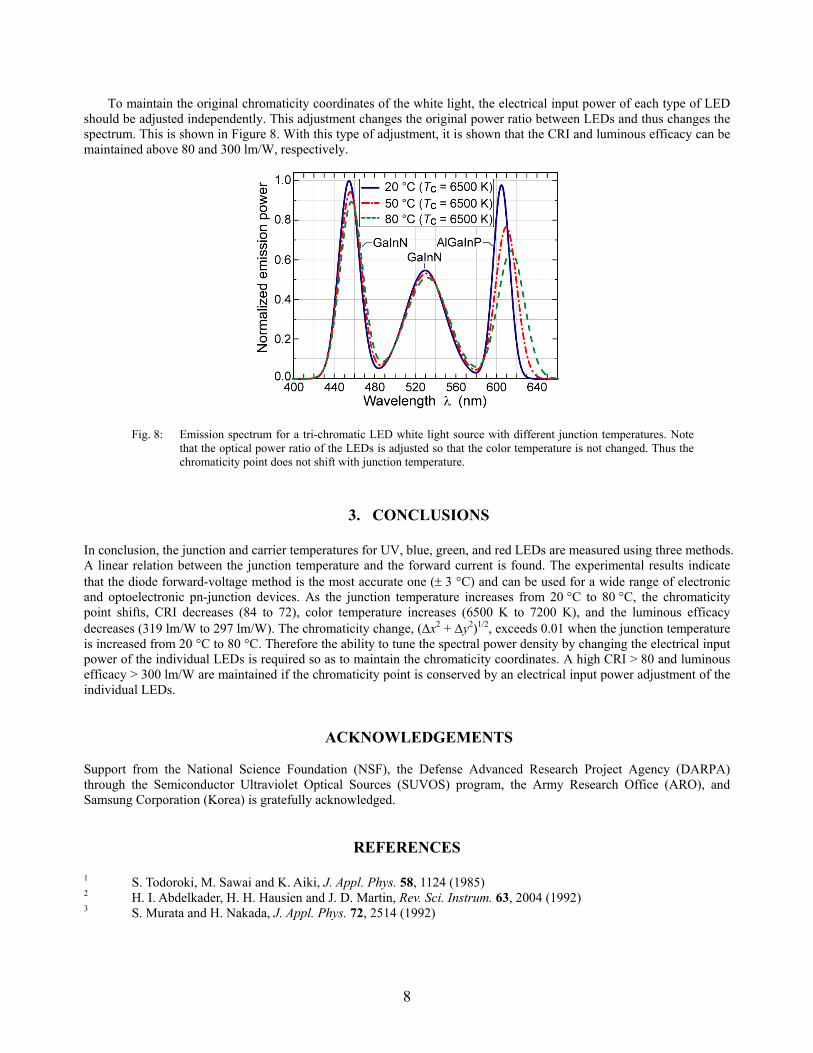
To maintain the original chromaticity coordinates of the white light, the electrical input power of each type of LED should be adjusted independently. This adjustment changes the original power ratio between LEDs and thus changes the spectrum. This is shown in Figure 8. With this type of adjustment, it is shown that the CRI and luminous efficacy can be maintained above 80 and 300 lm/W, respectively.
Fig. 8: Emission spectrum for a tri-chromatic LED white light source with different junction temperatures. Note that the optical power ratio of the LEDs is adjusted so that the color temperature is not changed. Thus the chromaticity point does not shift with junction temperature.
3. CONCLUSIONS
In conclusion, the junction and carrier temperatures for UV, blue, green, and red LEDs are measured using three methods. A linear relation between the junction temperature and the forward current is found. The experimental results indicate that the diode forward-voltage method is the most accurate one (± 3 °C) and can be used for a wide range of electronic and optoelectronic pn-junction devices. As the junction temperature increases from 20 °C to 80 °C, the chromaticity point shifts, CRI decreases (84 to 72), color temperature increases (6500 K to 7200 K), and the luminous efficacy decreases (319 lm/W to 297 lm/W). The chromaticity change, (∆x2 + ∆y2)1/2, exceeds 0.01 when the junction temperature is increased from 20 °C to 80 °C. Therefore the ability to tune the spectral power density by changing the electrical input power of the individual LEDs is required so as to maintain the chromaticity coordinates. A high CRI > 80 and luminous efficacy > 300 lm/W are maintained if the chromaticity point is conserved by an electrical input power adjustment of the individual LEDs.
ACKNOWLEDGEMENTS
Support from the National Science Foundation (NSF), the Defense Advanced Research Project Agency (DARPA) through the Semiconductor Ultraviolet Optical Sources (SUVOS) program, the Army Research Office (ARO), and Samsung Corporation (Korea) is gratefully acknowledged.
REFERENCES
1 S. Todoroki, M. Sawai and K. Aiki, J. Appl. Phys. 58, 1124 (1985) 2 H. I. Abdelkader, H. H. Hausien and J. D. Martin, Rev. Sci. Instrum. 63, 2004 (1992) 3 S. Murata and H. Nakada, J. Appl. Phys. 72, 2514 (1992)
9
4 P. W. Epperlein, in Proceedings of 17th International Symposium of Gallium Arsenide and Related Compounds, IOP Conference Series (IOP, London, 1990), 112, 633
5 P. W. Epperlein and G. L. Bona, Appl. Phys. Lett. 62, 3074 (1993) 6 D. C. Hall, L. Goldberg and D. Mehuys, Appl. Phys. Lett. 61, 384 (1992) 7 Y. Gu and N. Narendran, Proc. SPIE 5187, 107 (2004) 8 Y. Xi, Th. Gessmann, J.-Q. Xi, J. K. Kim, J. M. Shah, E. F. Schubert, A. J. Fischer, M. H. Crawford, K. H. A.
Bogart, and A. A. Allerman, submitted to Jpn. J. Appl. Phys. (2005) 9 Y. Xi and E. F. Schubert, Appl. Phys. Lett. 85, 2163 (2004) 10 Y. Xi, J.-Q. Xi, Th. Gessmann, J. M. Shah, J. K. Kim, E. F. Schubert, A. J. Fischer, M. H. Crawford, K. H. A.
Bogart, and A. A. Allerman, Appl. Phys. Lett. 86, 031907 (2005) 11 E. F. Schubert, Light Emitting Diodes (Cambridge University Press, Cambridge, U.K., 2003) 12 S. Chhajed, Y. Xi, Y.-L. Li, Th. Gessmann, E. F Schubert, submitted to J. Appl. Phys. (in print 2005) 13 T. Takeuchi, S. Sota, M. Katsuragawa, M. Komori, H. Takeuchi, H. Amano, and I. Akasaki Jpn. J. Appl. Phys.
36, 382 (1997) 14 CIE publication 13.3-1995 (1995) 15 A. Duggal “Organic electroluminescent devices for solid state lighting” “Organic electroluminescence” edited
by Zakya Kafafi (Marcel Dekker, New York, 2005)