june 14-20, 2004 center for rural strategies …june 14-20, 2004 center for rural strategies...
TRANSCRIPT

June 14-20, 2004 Center for Rural Strategies Greenberg Quinlan Rosner CORE 2WAY 3WAY VOTE VOTE 2000 Core Total Voter Kerry Bush Kerry Bush Gore Bush Vote Summary Table ... Total answering (536) (471) (224) (276) (210) (263) (184) (277) 2-3-2 PARTY Dem 35 35 67 9 69 9 74 9 Ind 28 28 25 28 24 27 22 28 Rep 37 37 8 63 8 65 4 63 3-1-3 PARTY Dem 43 44 82 12 84 11 90 12 Ind 10 9 6 9 6 9 5 9 Rep 47 47 12 79 10 80 4 79 11 2WAY Kerry 42 43 100 - 99 - 92 9 Bush 51 52 - 100 0 100 4 88 Other 1 1 - - - - 1 1 Und/Ref 5 4 - - 0 0 3 2 13 3WAY Kerry 39 40 93 0 100 - 89 9 Bush 49 49 - 95 - 100 4 84 Nader 5 5 5 2 - - 3 3 Other 1 0 - - - - - - Und/Ref 6 5 2 3 - - 4 4 Vote Difference Table ... Total answering (536) (471) (224) (276) (210) (263) (184) (277) 2-3-2 PARTY Dem-Rep -2 -1 58 -54 61 -56 71 -53 3-1-3 PARTY Dem-Rep -5 -3 71 -67 73 -69 86 -67 11 2WAY Kerry-Bush -10 -9 100 -100 99 -100 88 -78 13 3WAY Kerry-Bush -10 -9 93 -95 100 -100 85 -76 President/3-WAY Ticket Splitters ... Total answering (536) (471) (224) (276) (210) (263) (184) (277) Kerry2WAY/Not Kerry3WAY 3 3 7 - - - 3 1 Bush2WAY/Not Bush3WAY 3 3 - 5 0 - 1 4 Kerry3WAY/Not Kerry2WAY 0 0 - 0 1 - 1 - Bush3WAY/Not Bush2WAY 0 - - - - 0 - 0 Nader/Kerry 2 2 5 - - - 2 0 Nader/Bush 1 1 - 2 - - 1 1
Page 1

Greenberg Quinlan Rosner Center for Rural Strategies June 14-20, 2004 PARTY ID PARTY/IDEO IDEOLOGY DIRECTION Mod Ind Lib Lib Cons No Mod Cons Total Dem Ind Rep Dem Dem lean Rep Rep Lib Mod Cons Right Wrong Vote Summary Table ... Total answering (536) (185) (152) (198) (78) (142) (52) (92) (159) (97) (202) (219) (232) (259) 2-3-2 PARTY Dem 35 100 - - 86 77 - - - 69 36 17 10 57 Ind 28 - 100 - 14 23 100 32 17 21 38 22 28 27 Rep 37 - - 100 - - - 68 83 10 26 60 62 16 3-1-3 PARTY Dem 43 100 29 - 100 100 - - - 80 49 20 12 71 Ind 10 - 34 - - - 100 - - 5 13 7 11 8 Rep 47 - 37 100 - - - 100 100 14 39 73 77 20 11 2WAY Kerry 42 81 38 9 94 74 27 18 6 79 50 18 4 78 Bush 51 14 50 88 5 20 46 75 92 15 43 76 91 15 Other 1 1 3 1 - 2 8 1 - 1 1 1 1 2 Und/Ref 5 4 9 3 1 4 19 5 2 4 5 5 3 5 13 3WAY Kerry 39 78 33 8 91 70 23 17 4 77 47 16 4 73 Bush 49 12 46 86 4 18 46 68 91 12 40 74 89 14 Nader 5 4 9 4 3 6 12 9 3 4 8 4 1 8 Other 1 - 2 - - - 4 - - - 0 - 1 - Und/Ref 6 6 11 2 3 7 15 5 3 6 5 6 5 5 Vote Difference Table ... Total answering (536) (185) (152) (198) (78) (142) (52) (92) (159) (97) (202) (219) (232) (259) 2-3-2 PARTY Dem-Rep -2 100 - -100 86 77 - -68 -83 59 9 -43 -51 41 3-1-3 PARTY Dem-Rep -5 100 -8 -100 100 100 - -100 -100 66 10 -53 -65 51 11 2WAY Kerry-Bush -10 66 -13 -79 88 54 -19 -57 -87 64 7 -58 -88 63 13 3WAY Kerry-Bush -10 65 -13 -78 87 52 -23 -51 -87 65 6 -58 -85 59 President/3-WAY Ticket Splitters ... Total answering (536) (185) (152) (198) (78) (142) (52) (92) (159) (97) (202) (219) (232) (259) Kerry2WAY/Not Kerry3WAY 3 4 5 1 3 6 4 1 2 2 4 2 - 5 Bush2WAY/Not Bush3WAY 3 2 4 3 1 2 - 7 3 3 3 2 3 2 Kerry3WAY/Not Kerry2WAY 0 1 - - - 1 - - - - 0 0 0 0 Bush3WAY/Not Bush2WAY 0 - - 1 - - - - 1 - - 0 0 - Nader/Kerry 2 3 3 1 3 4 2 1 1 2 3 1 - 4 Nader/Bush 1 1 1 2 - 1 - 4 1 1 1 1 - 2
Page 2

June 14-20, 2004 Center for Rural Strategies Greenberg Quinlan Rosner GENDER AGE GENERATIONS GENDER/AGE 18 - 30 - 40 - 50 - Over Sil Young Young Older Older Total Men Women 29 39 49 64 64 Gen X Boom ent Women Men Women Men Vote Summary Table ... Total answering (536) (251) (285) (65) (62) (102) (176) (124) (61) (237) (146) (109) (120) (170) (130) 2-3-2 PARTY Dem 35 29 39 42 34 30 33 38 34 32 34 37 33 42 26 Ind 28 37 21 23 21 27 38 20 23 31 30 16 33 23 41 Rep 37 34 40 35 45 41 29 42 43 36 36 47 35 35 33 3-1-3 PARTY Dem 43 40 45 46 42 39 41 48 43 39 47 43 41 47 40 Ind 10 12 8 11 2 9 16 4 5 13 8 5 10 10 13 Rep 47 48 47 43 56 52 43 48 52 48 45 52 49 43 47 11 2WAY Kerry 42 39 44 45 42 39 40 45 39 39 43 46 38 44 41 Bush 51 56 48 51 56 54 52 48 59 54 49 49 58 48 54 Other 1 1 2 3 - - 2 2 - 1 1 1 1 2 1 Und/Ref 5 4 6 2 2 7 6 6 2 5 6 5 3 6 5 13 3WAY Kerry 39 36 42 38 42 37 38 42 36 37 40 42 36 42 36 Bush 49 53 46 48 55 50 50 46 56 51 49 47 54 45 52 Nader 5 6 5 9 2 5 7 3 7 5 5 5 6 5 5 Other 1 - 1 2 - - - 1 - - - 1 - 1 - Und/Ref 6 6 6 3 2 8 5 8 2 6 6 6 4 6 6 Vote Difference Table ... Total answering (536) (251) (285) (65) (62) (102) (176) (124) (61) (237) (146) (109) (120) (170) (130) 2-3-2 PARTY Dem-Rep -2 -5 -0 6 -11 -11 4 -4 -8 -3 -1 -10 -3 6 -7 3-1-3 PARTY Dem-Rep -5 -8 -2 3 -15 -13 -2 1 -10 -8 2 -9 -8 4 -7 11 2WAY Kerry-Bush -10 -17 -4 -6 -15 -15 -12 -2 -20 -15 -6 -3 -21 -4 -13 13 3WAY Kerry-Bush -10 -17 -4 -9 -13 -13 -12 -4 -20 -14 -10 -5 -18 -3 -16 President/3-WAY Ticket Splitters ... Total answering (536) (251) (285) (65) (62) (102) (176) (124) (61) (237) (146) (109) (120) (170) (130) Kerry2WAY/Not Kerry3WAY 3 4 2 9 - 2 2 3 5 2 3 4 3 1 5 Bush2WAY/Not Bush3WAY 3 3 2 3 2 4 2 2 3 3 1 2 4 2 2 Kerry3WAY/Not Kerry2WAY 0 1 - 3 - - - - 2 - - - 2 - - Bush3WAY/Not Bush2WAY 0 0 - - - - - 1 - - 1 - - - 1 Nader/Kerry 2 3 1 8 - 2 1 2 5 1 2 4 3 - 3 Nader/Bush 1 1 1 - 2 1 2 1 2 2 - - 2 2 1
Page 3

Greenberg Quinlan Rosner Center for Rural Strategies June 14-20, 2004 EDUCATION GENDER/EDUC AGE/EDUC NON COLL H.S. No No Young Older or Post Coll Coll Coll Coll Coll No Young No Older Young Older Young Older Total less H.S. grad Men Men Women Women Coll Coll Coll Coll Women Women Men Men Vote Summary Table ... Total answering (536) (198) (149) (186) (98) (151) (88) (196) (146) (81) (197) (103) (73) (119) (73) (78) 2-3-2 PARTY Dem 35 38 32 33 23 32 43 38 34 35 37 31 34 41 34 31 Ind 28 28 28 29 40 35 17 22 26 21 28 35 16 24 36 35 Rep 37 34 40 38 37 32 39 40 40 43 35 34 49 34 30 35 3-1-3 PARTY Dem 43 44 39 44 38 41 50 43 41 42 44 45 40 46 42 40 Ind 10 11 11 9 10 13 7 9 10 2 10 14 5 10 15 10 Rep 47 45 50 48 52 46 43 48 49 56 46 42 55 44 42 50 11 2WAY Kerry 42 45 35 44 43 36 45 44 40 43 41 45 47 43 34 38 Bush 51 48 58 51 52 59 49 47 55 52 50 50 49 46 62 56 Other 1 2 2 1 1 1 1 3 1 - 2 2 1 3 1 - Und/Ref 5 6 5 4 4 4 5 6 3 5 7 3 3 8 3 5 13 3WAY Kerry 39 42 32 41 40 32 43 42 37 41 39 42 42 42 32 33 Bush 49 45 55 49 50 56 49 44 51 51 48 50 47 43 56 55 Nader 5 5 5 5 7 5 3 6 5 5 5 6 4 7 7 3 Other 1 - 2 - - - - 2 1 - 1 - 1 1 - - Und/Ref 6 8 5 4 3 7 5 7 5 4 8 3 5 8 5 9 Vote Difference Table ... Total answering (536) (198) (149) (186) (98) (151) (88) (196) (146) (81) (197) (103) (73) (119) (73) (78) 2-3-2 PARTY Dem-Rep -2 4 -8 -5 -13 - 5 -3 -5 -9 3 -3 -15 7 4 -4 3-1-3 PARTY Dem-Rep -5 -1 -11 -4 -14 -5 7 -5 -8 -14 -3 3 -15 3 - -10 11 2WAY Kerry-Bush -10 -3 -23 -6 -9 -23 -3 -4 -15 -9 -9 -6 -3 -3 -27 -18 13 3WAY Kerry-Bush -10 -3 -23 -8 -10 -23 -6 -3 -14 -10 -9 -8 -4 -1 -25 -22 President/3-WAY Ticket Splitters ... Total answering (536) (198) (149) (186) (98) (151) (88) (196) (146) (81) (197) (103) (73) (119) (73) (78) Kerry2WAY/Not Kerry3WAY 3 4 3 3 3 5 2 2 4 2 3 3 4 1 4 5 Bush2WAY/Not Bush3WAY 3 4 3 1 2 4 - 3 4 1 3 1 3 3 5 3 Kerry3WAY/Not Kerry2WAY 0 1 - - - 1 - - 1 - - - - - 1 - Bush3WAY/Not Bush2WAY 0 1 - - - 1 - - - - 1 - - - - 1 Nader/Kerry 2 2 3 2 3 3 1 2 3 2 1 2 4 - 3 3 Nader/Bush 1 1 2 1 2 1 - 2 1 1 2 1 - 3 1 -
Page 4

June 14-20, 2004 Center for Rural Strategies Greenberg Quinlan Rosner MARITAL MARITAL/GENDER GUNS Sep SepDv Marr Sin Div Marr Unmar Marr Widow Unmar 3 or Total ied gle Widow Men Men Women Women Women None 1-2 more Vote Summary Table ... Total answering (536) (357) (70) (107) (184) (67) (173) (78) (110) (276) (75) (135) 2-3-2 PARTY Dem 35 32 39 41 28 31 36 47 45 40 41 27 Ind 28 28 33 25 35 43 21 19 19 25 23 35 Rep 37 39 29 34 37 25 42 33 35 34 36 38 3-1-3 PARTY Dem 43 41 46 49 40 42 42 54 51 48 48 36 Ind 10 10 11 9 11 13 9 10 8 11 5 10 Rep 47 50 43 42 49 45 50 36 41 42 47 54 11 2WAY Kerry 42 38 54 46 38 42 39 50 54 51 44 30 Bush 51 56 37 45 59 48 54 41 38 43 49 64 Other 1 1 3 2 - 3 2 1 2 2 1 - Und/Ref 5 4 6 7 3 7 5 8 6 4 5 5 13 3WAY Kerry 39 36 50 44 34 40 38 47 50 47 44 30 Bush 49 54 36 42 55 46 52 37 35 42 47 61 Nader 5 5 9 5 4 9 5 3 5 6 4 4 Other 1 0 1 1 - - 1 1 2 0 - - Und/Ref 6 5 4 8 6 4 5 12 8 5 5 5 Vote Difference Table ... Total answering (536) (357) (70) (107) (184) (67) (173) (78) (110) (276) (75) (135) 2-3-2 PARTY Dem-Rep -2 -8 10 7 -9 6 -6 14 10 6 5 -11 3-1-3 PARTY Dem-Rep -5 -9 3 7 -10 -3 -8 18 10 6 1 -18 11 2WAY Kerry-Bush -10 -18 17 1 -21 -6 -15 9 15 8 -5 -34 13 3WAY Kerry-Bush -10 -18 14 2 -21 -6 -14 10 15 5 -3 -31 President/3-WAY Ticket Splitters ... Total answering (536) (357) (70) (107) (184) (67) (173) (78) (110) (276) (75) (135) Kerry2WAY/Not Kerry3WAY 3 3 6 2 4 3 1 3 4 4 1 1 Bush2WAY/Not Bush3WAY 3 3 1 4 3 3 2 4 3 1 4 4 Kerry3WAY/Not Kerry2WAY 0 0 1 - 1 1 - - - 0 1 - Bush3WAY/Not Bush2WAY 0 - - 1 - 1 - - - - 1 - Nader/Kerry 2 2 4 - 3 1 1 - 2 3 1 1 Nader/Bush 1 1 1 2 1 3 1 1 1 0 1 1
Page 5

Greenberg Quinlan Rosner Center for Rural Strategies June 14-20, 2004 RELIGION INCOME CONG DIST Devt Main Irreg Dev $30K $50K $75K Evan line Main Cath out Under to to or Safe Safe Total gelcl Prot line olic Cthlc $30K $50K $75K more Dem Rep Swing Vote Summary Table ... Total answering (536) (77) (143) (104) (111) (51) (143) (118) (109) (77) (205) (233) (98) 2-3-2 PARTY Dem 35 16 41 40 37 27 41 32 39 27 33 34 39 Ind 28 19 33 37 32 33 28 35 23 25 30 29 24 Rep 37 65 26 23 31 39 31 33 39 48 37 37 37 3-1-3 PARTY Dem 43 18 56 58 44 37 48 44 44 36 41 41 49 Ind 10 6 8 9 16 18 11 11 8 5 11 10 7 Rep 47 75 36 34 40 45 41 45 48 58 47 49 44 11 2WAY Kerry 42 17 52 55 44 41 47 45 43 35 39 41 49 Bush 51 82 41 39 51 53 42 48 55 62 51 55 46 Other 1 1 - - - - 2 2 - 1 2 0 3 Und/Ref 5 - 6 6 5 6 9 5 2 1 8 4 2 13 3WAY Kerry 39 16 50 52 41 43 43 44 41 34 37 39 44 Bush 49 81 39 38 47 49 40 47 53 62 49 53 40 Nader 5 1 4 6 7 2 7 5 3 4 5 5 7 Other 1 - 1 1 - - 1 - - - 1 - - Und/Ref 6 3 6 4 5 6 9 4 3 - 7 3 9 Vote Difference Table ... Total answering (536) (77) (143) (104) (111) (51) (143) (118) (109) (77) (205) (233) (98) 2-3-2 PARTY Dem-Rep -2 -49 15 17 6 -12 9 -1 - -21 -4 -3 2 3-1-3 PARTY Dem-Rep -5 -57 20 24 5 -8 6 -1 -4 -22 -6 -8 5 11 2WAY Kerry-Bush -10 -65 11 15 -7 -12 5 -3 -12 -27 -12 -13 3 13 3WAY Kerry-Bush -10 -65 10 14 -5 -6 3 -3 -12 -29 -12 -14 4 President/3-WAY Ticket Splitters ... Total answering (536) (77) (143) (104) (111) (51) (143) (118) (109) (77) (205) (233) (98) Kerry2WAY/Not Kerry3WAY 3 1 3 3 4 - 6 1 2 1 2 3 5 Bush2WAY/Not Bush3WAY 3 1 2 2 5 4 3 2 2 - 2 2 6 Kerry3WAY/Not Kerry2WAY 0 - - - 1 2 1 - - - 0 0 - Bush3WAY/Not Bush2WAY 0 - - - - - 1 - - - 0 - - Nader/Kerry 2 - 1 2 3 - 4 1 1 1 2 2 2 Nader/Bush 1 - 1 1 3 2 1 1 1 - 1 0 2
Page 6

June 14-20, 2004 Center for Rural Strategies Greenberg Quinlan Rosner REGION REGION COLL NCEC REGION East West Indus Sun North North Deep Mntn Paci North Cent trial belt Total Cntrl Cntrl South State fic east ral South West Coast Htlnd Grwth Vote Summary Table ... Total answering (536) (120) (134) (64) (61) (84) (56) (254) (81) (145) (140) (223) (80) 2-3-2 PARTY Dem 35 28 40 36 38 35 32 34 36 36 34 31 36 Ind 28 32 33 34 15 26 25 32 31 21 26 34 20 Rep 37 41 28 30 48 38 43 34 33 42 40 35 44 3-1-3 PARTY Dem 43 41 45 44 41 40 45 43 44 41 42 40 40 Ind 10 7 16 16 5 10 5 11 12 8 8 12 8 Rep 47 53 40 41 54 50 50 46 43 52 50 48 53 11 2WAY Kerry 42 39 45 34 43 44 46 42 35 43 45 40 39 Bush 51 56 49 48 52 50 52 52 51 51 51 54 55 Other 1 - 1 5 - 1 2 1 5 1 1 0 - Und/Ref 5 5 5 13 5 5 - 5 10 5 3 5 6 13 3WAY Kerry 39 36 43 33 41 40 45 39 32 41 42 37 35 Bush 49 53 46 47 48 50 48 50 48 49 49 52 50 Nader 5 6 5 3 8 7 2 6 2 8 5 5 8 Other 1 1 1 2 - - - 1 1 - - 1 - Und/Ref 6 4 5 16 3 2 5 5 16 3 4 5 8 Vote Difference Table ... Total answering (536) (120) (134) (64) (61) (84) (56) (254) (81) (145) (140) (223) (80) 2-3-2 PARTY Dem-Rep -2 -13 12 6 -10 -4 -11 - 2 -6 -6 -3 -8 3-1-3 PARTY Dem-Rep -5 -12 5 3 -13 -10 -5 -3 1 -11 -8 -8 -13 11 2WAY Kerry-Bush -10 -17 -4 -14 -10 -6 -5 -10 -16 -8 -6 -13 -16 13 3WAY Kerry-Bush -10 -18 -4 -14 -7 -10 -4 -10 -16 -8 -7 -14 -15 President/3-WAY Ticket Splitters ... Total answering (536) (120) (134) (64) (61) (84) (56) (254) (81) (145) (140) (223) (80) Kerry2WAY/Not Kerry3WAY 3 3 2 3 2 4 4 3 4 3 4 3 4 Bush2WAY/Not Bush3WAY 3 3 2 2 5 1 4 2 2 3 2 2 5 Kerry3WAY/Not Kerry2WAY 0 - - 2 - - 2 - 1 - 1 - - Bush3WAY/Not Bush2WAY 0 - - - - 1 - - - 1 1 - - Nader/Kerry 2 3 1 2 2 4 - 2 1 3 2 3 3 Nader/Bush 1 2 1 - 3 1 - 1 - 2 1 1 3
Page 7

Greenberg Quinlan Rosner Center for Rural Strategies June 14-20, 2004 CORE 2WAY 3WAY VOTE VOTE 2000 Core Total Voter Kerry Bush Kerry Bush Gore Bush Q4 Voted 2000 election ... Total answering (536) (471) (224) (276) (210) (263) (184) (277) Voted 93 100 93 94 94 94 100 100 Ineligible/too young 4 - 4 3 3 3 - - Did not vote 2 - 3 1 3 2 - - (Can’t remember/DK/Ref) 1 - - 1 - 1 - - Q5 Whether voted in 2002 ... Total answering (536) (471) (224) (276) (210) (263) (184) (277) Voted 87 90 87 87 87 88 90 90 Did not vote 11 7 11 10 11 9 8 6 (Can’t remember/DK) 3 3 2 3 2 3 2 4 Q6 Chance of voting in 2004 ... Total answering (536) (471) (224) (276) (210) (263) (184) (277) Almost certain 94 100 96 94 95 94 95 95 Probably 6 - 4 6 5 6 5 5 Electorate ... Total answering (536) (471) (224) (276) (210) (263) (184) (277) Core voter 88 100 90 89 90 88 95 95 Not Core Voter 12 - 10 11 10 12 5 5 Opinion elites ... Total answering (536) (471) (224) (276) (210) (263) (184) (277) Opinion Elites 5 6 5 6 5 6 7 6 Non Opinion Elites 95 94 95 94 95 94 93 94 Q7 Direction of the country ... Total answering (536) (471) (224) (276) (210) (263) (184) (277) Right direction 43 43 4 77 5 79 6 70 Wrong track 48 48 91 14 90 14 88 21 (DK/Ref) 8 8 5 9 5 8 7 8 Right - Wrong -5 -5 -87 62 -86 65 -82 49 Q8 Bush job approval ... Total Answering (536) (471) (224) (276) (210) (263) (184) (277) Strongly approve 36 37 0 69 0 71 1 64 Somewhat approve 16 15 4 24 5 23 5 21 Somewhat disapprove 13 12 24 3 22 3 22 6 Strongly disapprove 30 32 69 1 70 1 71 5 (DK/Ref) 4 4 3 3 3 2 2 4 Total approve 52 52 5 92 5 94 5 84 Total disapprove 44 44 92 4 92 4 92 12 Approve - disapprove 8 8 -88 88 -87 90 -87 73
Page 8

June 14-20, 2004 Center for Rural Strategies Greenberg Quinlan Rosner PARTY ID PARTY/IDEO IDEOLOGY DIRECTION Mod Ind Lib Lib Cons No Mod Cons Total Dem Ind Rep Dem Dem lean Rep Rep Lib Mod Cons Right Wrong Q4 Voted 2000 election ... Total answering (536) (185) (152) (198) (78) (142) (52) (92) (159) (97) (202) (219) (232) (259) Voted 93 95 91 94 95 96 88 89 96 92 93 95 94 93 Ineligible/too young 4 4 4 3 5 1 6 4 3 5 3 3 3 3 Did not vote 2 2 3 2 - 3 2 4 1 2 2 2 1 3 (Can’t remember/DK/Ref) 1 - 1 2 - - 4 2 1 1 1 0 1 1 Q5 Whether voted in 2002 ... Total answering (536) (185) (152) (198) (78) (142) (52) (92) (159) (97) (202) (219) (232) (259) Voted 87 86 86 87 88 86 85 83 91 89 84 89 87 87 Did not vote 11 12 11 10 10 11 12 14 7 10 12 9 11 10 (Can’t remember/DK) 3 2 3 3 1 3 4 3 3 1 4 2 2 3 Q6 Chance of voting in 2004 ... Total answering (536) (185) (152) (198) (78) (142) (52) (92) (159) (97) (202) (219) (232) (259) Almost certain 94 95 93 93 97 94 90 91 94 96 94 93 93 95 Probably 6 5 7 7 3 6 10 9 6 4 6 7 7 5 Electorate ... Total answering (536) (185) (152) (198) (78) (142) (52) (92) (159) (97) (202) (219) (232) (259) Core voter 88 90 86 87 92 90 79 83 91 89 88 89 88 88 Not Core Voter 12 10 14 13 8 10 21 17 9 11 12 11 12 12 Opinion elites ... Total answering (536) (185) (152) (198) (78) (142) (52) (92) (159) (97) (202) (219) (232) (259) Opinion Elites 5 4 6 6 4 6 2 8 6 3 7 5 6 5 Non Opinion Elites 95 96 94 94 96 94 98 92 94 97 93 95 94 95 Q7 Direction of the country ... Total answering (536) (185) (152) (198) (78) (142) (52) (92) (159) (97) (202) (219) (232) (259) Right direction 43 13 42 72 4 16 48 57 77 11 36 64 100 - Wrong track 48 80 46 21 88 77 42 26 18 79 53 30 - 100 (DK/Ref) 8 7 12 7 8 7 10 17 4 9 11 6 - - Right - Wrong -5 -67 -4 52 -85 -61 6 30 59 -68 -18 34 100 -100 Q8 Bush job approval ... Total Answering (536) (185) (152) (198) (78) (142) (52) (92) (159) (97) (202) (219) (232) (259) Strongly approve 36 6 32 67 1 8 31 46 75 8 25 59 74 6 Somewhat approve 16 7 24 19 3 11 23 33 16 9 21 15 21 9 Somewhat disapprove 13 24 13 4 26 21 13 7 4 22 16 8 3 21 Strongly disapprove 30 59 27 7 69 54 25 13 2 59 35 14 1 61 (DK/Ref) 4 4 5 3 1 6 8 2 3 2 3 5 2 3 Total approve 52 14 55 86 4 19 54 78 91 18 46 74 94 15 Total disapprove 44 83 40 11 95 75 38 20 6 80 50 21 4 81 Approve - disapprove 8 -69 15 76 -91 -56 15 59 84 -63 -4 52 91 -66
Page 9
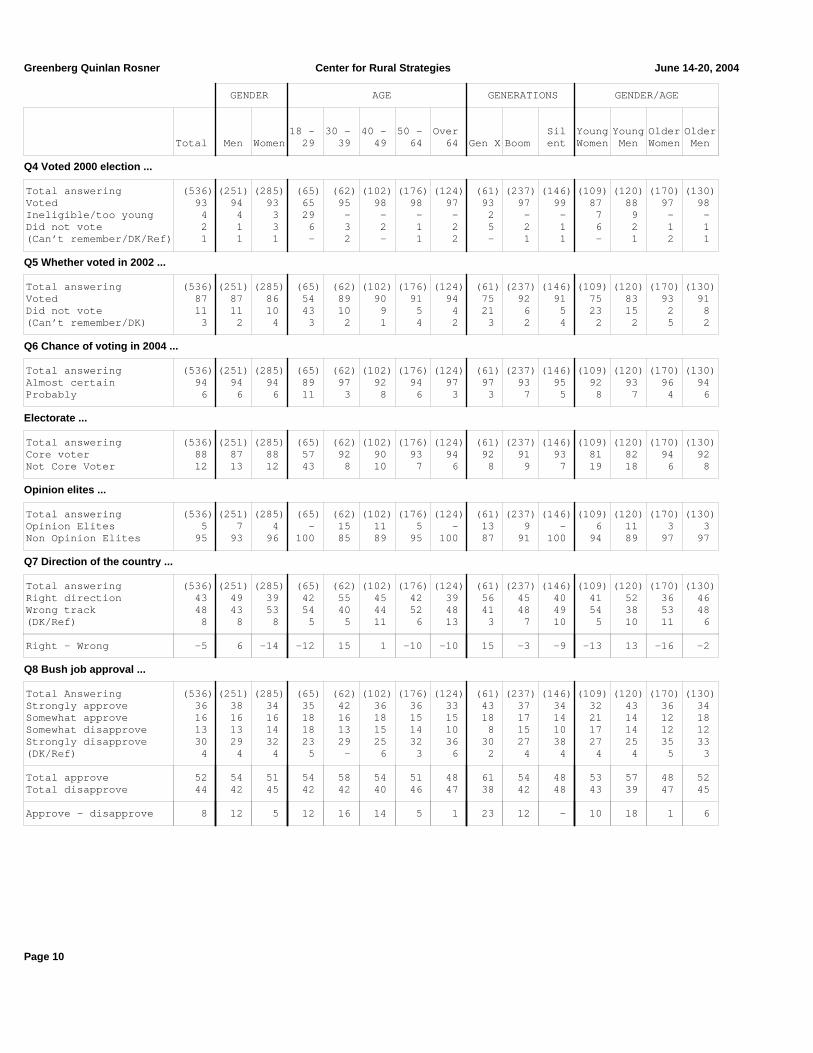
Greenberg Quinlan Rosner Center for Rural Strategies June 14-20, 2004 GENDER AGE GENERATIONS GENDER/AGE 18 - 30 - 40 - 50 - Over Sil Young Young Older Older Total Men Women 29 39 49 64 64 Gen X Boom ent Women Men Women Men Q4 Voted 2000 election ... Total answering (536) (251) (285) (65) (62) (102) (176) (124) (61) (237) (146) (109) (120) (170) (130) Voted 93 94 93 65 95 98 98 97 93 97 99 87 88 97 98 Ineligible/too young 4 4 3 29 - - - - 2 - - 7 9 - - Did not vote 2 1 3 6 3 2 1 2 5 2 1 6 2 1 1 (Can’t remember/DK/Ref) 1 1 1 - 2 - 1 2 - 1 1 - 1 2 1 Q5 Whether voted in 2002 ... Total answering (536) (251) (285) (65) (62) (102) (176) (124) (61) (237) (146) (109) (120) (170) (130) Voted 87 87 86 54 89 90 91 94 75 92 91 75 83 93 91 Did not vote 11 11 10 43 10 9 5 4 21 6 5 23 15 2 8 (Can’t remember/DK) 3 2 4 3 2 1 4 2 3 2 4 2 2 5 2 Q6 Chance of voting in 2004 ... Total answering (536) (251) (285) (65) (62) (102) (176) (124) (61) (237) (146) (109) (120) (170) (130) Almost certain 94 94 94 89 97 92 94 97 97 93 95 92 93 96 94 Probably 6 6 6 11 3 8 6 3 3 7 5 8 7 4 6 Electorate ... Total answering (536) (251) (285) (65) (62) (102) (176) (124) (61) (237) (146) (109) (120) (170) (130) Core voter 88 87 88 57 92 90 93 94 92 91 93 81 82 94 92 Not Core Voter 12 13 12 43 8 10 7 6 8 9 7 19 18 6 8 Opinion elites ... Total answering (536) (251) (285) (65) (62) (102) (176) (124) (61) (237) (146) (109) (120) (170) (130) Opinion Elites 5 7 4 - 15 11 5 - 13 9 - 6 11 3 3 Non Opinion Elites 95 93 96 100 85 89 95 100 87 91 100 94 89 97 97 Q7 Direction of the country ... Total answering (536) (251) (285) (65) (62) (102) (176) (124) (61) (237) (146) (109) (120) (170) (130) Right direction 43 49 39 42 55 45 42 39 56 45 40 41 52 36 46 Wrong track 48 43 53 54 40 44 52 48 41 48 49 54 38 53 48 (DK/Ref) 8 8 8 5 5 11 6 13 3 7 10 5 10 11 6 Right - Wrong -5 6 -14 -12 15 1 -10 -10 15 -3 -9 -13 13 -16 -2 Q8 Bush job approval ... Total Answering (536) (251) (285) (65) (62) (102) (176) (124) (61) (237) (146) (109) (120) (170) (130) Strongly approve 36 38 34 35 42 36 36 33 43 37 34 32 43 36 34 Somewhat approve 16 16 16 18 16 18 15 15 18 17 14 21 14 12 18 Somewhat disapprove 13 13 14 18 13 15 14 10 8 15 10 17 14 12 12 Strongly disapprove 30 29 32 23 29 25 32 36 30 27 38 27 25 35 33 (DK/Ref) 4 4 4 5 - 6 3 6 2 4 4 4 4 5 3 Total approve 52 54 51 54 58 54 51 48 61 54 48 53 57 48 52 Total disapprove 44 42 45 42 42 40 46 47 38 42 48 43 39 47 45 Approve - disapprove 8 12 5 12 16 14 5 1 23 12 - 10 18 1 6
Page 10

June 14-20, 2004 Center for Rural Strategies Greenberg Quinlan Rosner EDUCATION GENDER/EDUC AGE/EDUC NON COLL H.S. No No Young Older or Post Coll Coll Coll Coll Coll No Young No Older Young Older Young Older Total less H.S. grad Men Men Women Women Coll Coll Coll Coll Women Women Men Men Q4 Voted 2000 election ... Total answering (536) (198) (149) (186) (98) (151) (88) (196) (146) (81) (197) (103) (73) (119) (73) (78) Voted 93 92 91 97 99 90 95 92 82 99 98 96 82 98 81 99 Ineligible/too young 4 7 4 - - 7 - 4 13 - - - 11 - 15 - Did not vote 2 1 5 1 - 2 2 3 5 1 1 1 7 1 3 1 (Can’t remember/DK/Ref) 1 1 1 2 1 1 2 1 1 - 1 3 - 1 1 - Q5 Whether voted in 2002 ... Total answering (536) (198) (149) (186) (98) (151) (88) (196) (146) (81) (197) (103) (73) (119) (73) (78) Voted 87 81 86 94 95 82 92 84 72 93 91 94 70 92 74 90 Did not vote 11 17 10 4 3 17 6 12 26 6 6 3 27 3 25 9 (Can’t remember/DK) 3 2 4 2 2 1 2 4 2 1 4 3 3 5 1 1 Q6 Chance of voting in 2004 ... Total answering (536) (198) (149) (186) (98) (151) (88) (196) (146) (81) (197) (103) (73) (119) (73) (78) Almost certain 94 93 92 96 97 91 94 94 92 94 94 97 92 96 92 91 Probably 6 7 8 4 3 9 6 6 8 6 6 3 8 4 8 9 Electorate ... Total answering (536) (198) (149) (186) (98) (151) (88) (196) (146) (81) (197) (103) (73) (119) (73) (78) Core voter 88 86 83 93 96 81 90 88 75 93 93 93 77 95 73 90 Not Core Voter 12 14 17 7 4 19 10 12 25 7 7 7 23 5 27 10 Opinion elites ... Total answering (536) (198) (149) (186) (98) (151) (88) (196) (146) (81) (197) (103) (73) (119) (73) (78) Opinion Elites 5 - - 16 17 - 14 - - 25 - 9 - - - - Non Opinion Elites 95 100 100 84 83 100 86 100 100 75 100 91 100 100 100 100 Q7 Direction of the country ... Total answering (536) (198) (149) (186) (98) (151) (88) (196) (146) (81) (197) (103) (73) (119) (73) (78) Right direction 43 38 46 47 49 49 45 36 46 49 38 47 40 32 52 46 Wrong track 48 52 46 46 44 42 48 56 47 43 52 48 58 55 36 47 (DK/Ref) 8 10 7 7 7 9 7 9 8 7 10 6 3 13 12 6 Right - Wrong -5 -14 - 2 5 7 -2 -20 -1 6 -15 -1 -18 -24 16 -1 Q8 Bush job approval ... Total Answering (536) (198) (149) (186) (98) (151) (88) (196) (146) (81) (197) (103) (73) (119) (73) (78) Strongly approve 36 32 39 38 39 38 38 33 37 40 34 38 34 32 40 36 Somewhat approve 16 19 19 11 9 21 14 17 20 14 18 9 19 15 21 22 Somewhat disapprove 13 15 12 13 14 13 13 14 15 16 13 12 15 14 15 10 Strongly disapprove 30 30 25 34 35 25 34 31 23 28 31 39 27 33 19 29 (DK/Ref) 4 4 5 3 3 4 2 5 5 2 5 3 4 6 5 3 Total approve 52 51 58 49 48 59 51 50 57 53 51 47 53 47 60 58 Total disapprove 44 45 37 48 49 37 47 45 38 44 44 50 42 47 34 40 Approve - disapprove 8 6 21 2 -1 22 5 5 18 9 7 -4 11 - 26 18
Page 11

Greenberg Quinlan Rosner Center for Rural Strategies June 14-20, 2004 MARITAL MARITAL/GENDER GUNS Sep SepDv Marr Sin Div Marr Unmar Marr Widow Unmar 3 or Total ied gle Widow Men Men Women Women Women None 1-2 more Q4 Voted 2000 election ... Total answering (536) (357) (70) (107) (184) (67) (173) (78) (110) (276) (75) (135) Voted 93 96 74 96 97 84 95 97 90 92 92 95 Ineligible/too young 4 1 20 1 1 13 1 - 5 5 1 2 Did not vote 2 2 4 2 1 3 3 1 3 2 5 1 (Can’t remember/DK/Ref) 1 1 1 1 1 - 1 1 2 1 1 1 Q5 Whether voted in 2002 ... Total answering (536) (357) (70) (107) (184) (67) (173) (78) (110) (276) (75) (135) Voted 87 88 76 91 89 82 87 92 86 84 91 87 Did not vote 11 9 24 7 9 16 9 5 12 12 9 11 (Can’t remember/DK) 3 3 - 3 2 1 4 3 2 4 - 2 Q6 Chance of voting in 2004 ... Total answering (536) (357) (70) (107) (184) (67) (173) (78) (110) (276) (75) (135) Almost certain 94 95 89 94 95 91 95 95 93 94 89 96 Probably 6 5 11 6 5 9 5 5 7 6 11 4 Electorate ... Total answering (536) (357) (70) (107) (184) (67) (173) (78) (110) (276) (75) (135) Core voter 88 91 66 91 92 75 91 92 85 87 83 90 Not Core Voter 12 9 34 9 8 25 9 8 15 13 17 10 Opinion elites ... Total answering (536) (357) (70) (107) (184) (67) (173) (78) (110) (276) (75) (135) Opinion Elites 5 7 3 1 9 1 6 1 2 5 3 9 Non Opinion Elites 95 93 97 99 91 99 94 99 98 95 97 91 Q7 Direction of the country ... Total answering (536) (357) (70) (107) (184) (67) (173) (78) (110) (276) (75) (135) Right direction 43 47 31 38 51 43 43 35 31 37 39 55 Wrong track 48 46 57 50 42 45 50 53 58 55 55 38 (DK/Ref) 8 7 11 11 7 12 6 13 11 8 7 7 Right - Wrong -5 1 -26 -12 8 -1 -7 -18 -27 -18 -16 17 Q8 Bush job approval ... Total Answering (536) (357) (70) (107) (184) (67) (173) (78) (110) (276) (75) (135) Strongly approve 36 39 24 35 40 31 37 32 30 30 31 43 Somewhat approve 16 17 16 12 17 15 18 12 13 14 19 21 Somewhat disapprove 13 13 20 11 13 15 13 12 15 13 17 13 Strongly disapprove 30 28 36 36 28 33 28 40 38 39 29 19 (DK/Ref) 4 3 4 6 3 6 4 5 5 3 4 4 Total approve 52 56 40 47 57 46 55 44 43 45 49 64 Total disapprove 44 41 56 48 40 48 41 51 53 52 47 32 Approve - disapprove 8 15 -16 -1 17 -1 14 -8 -10 -7 3 32
Page 12

June 14-20, 2004 Center for Rural Strategies Greenberg Quinlan Rosner RELIGION INCOME CONG DIST Devt Main Irreg Dev $30K $50K $75K Evan line Main Cath out Under to to or Safe Safe Total gelcl Prot line olic Cthlc $30K $50K $75K more Dem Rep Swing Q4 Voted 2000 election ... Total answering (536) (77) (143) (104) (111) (51) (143) (118) (109) (77) (205) (233) (98) Voted 93 99 94 92 89 86 94 90 97 94 95 93 93 Ineligible/too young 4 1 2 3 5 4 2 4 2 4 2 4 5 Did not vote 2 - 3 4 5 8 2 4 1 3 2 2 2 (Can’t remember/DK/Ref) 1 - 1 1 1 2 1 2 - - 1 1 - Q5 Whether voted in 2002 ... Total answering (536) (77) (143) (104) (111) (51) (143) (118) (109) (77) (205) (233) (98) Voted 87 90 87 85 88 86 86 86 86 92 88 85 89 Did not vote 11 5 10 13 10 12 12 12 9 6 9 13 8 (Can’t remember/DK) 3 5 3 3 2 2 2 3 5 1 3 2 3 Q6 Chance of voting in 2004 ... Total answering (536) (77) (143) (104) (111) (51) (143) (118) (109) (77) (205) (233) (98) Almost certain 94 97 92 91 93 90 91 93 96 96 94 93 97 Probably 6 3 8 9 7 10 9 7 4 4 6 7 3 Electorate ... Total answering (536) (77) (143) (104) (111) (51) (143) (118) (109) (77) (205) (233) (98) Core voter 88 96 88 86 83 78 85 85 94 90 89 86 90 Not Core Voter 12 4 12 14 17 22 15 15 6 10 11 14 10 Opinion elites ... Total answering (536) (77) (143) (104) (111) (51) (143) (118) (109) (77) (205) (233) (98) Opinion Elites 5 3 6 5 6 4 - - - 38 3 5 10 Non Opinion Elites 95 97 94 95 94 96 100 100 100 62 97 95 90 Q7 Direction of the country ... Total answering (536) (77) (143) (104) (111) (51) (143) (118) (109) (77) (205) (233) (98) Right direction 43 65 33 32 44 53 34 39 50 57 46 45 35 Wrong track 48 27 56 56 50 39 55 53 46 39 47 47 55 (DK/Ref) 8 8 11 13 6 8 11 8 5 4 7 9 10 Right - Wrong -5 38 -23 -24 -5 14 -20 -14 4 18 -1 -2 -20 Q8 Bush job approval ... Total Answering (536) (77) (143) (104) (111) (51) (143) (118) (109) (77) (205) (233) (98) Strongly approve 36 66 23 22 32 39 30 33 36 48 32 42 31 Somewhat approve 16 14 18 18 19 18 16 16 20 16 21 12 14 Somewhat disapprove 13 4 21 21 16 18 15 16 16 5 12 14 15 Strongly disapprove 30 13 33 33 29 24 35 31 27 29 30 28 36 (DK/Ref) 4 3 5 6 4 2 3 4 2 3 4 3 4 Total approve 52 81 41 40 51 57 46 49 56 64 54 54 45 Total disapprove 44 17 54 54 45 41 50 47 42 34 42 42 51 Approve - disapprove 8 64 -13 -13 6 16 -4 3 14 30 12 12 -6
Page 13

Greenberg Quinlan Rosner Center for Rural Strategies June 14-20, 2004 REGION REGION COLL NCEC REGION East West Indus Sun North North Deep Mntn Paci North Cent trial belt Total Cntrl Cntrl South State fic east ral South West Coast Htlnd Grwth Q4 Voted 2000 election ... Total answering (536) (120) (134) (64) (61) (84) (56) (254) (81) (145) (140) (223) (80) Voted 93 93 95 92 97 89 93 94 94 92 91 94 96 Ineligible/too young 4 3 3 5 3 5 4 3 4 4 4 3 4 Did not vote 2 3 2 - - 4 4 2 - 2 4 3 - (Can’t remember/DK/Ref) 1 1 - 3 - 2 - 0 2 1 1 0 - Q5 Whether voted in 2002 ... Total answering (536) (120) (134) (64) (61) (84) (56) (254) (81) (145) (140) (223) (80) Voted 87 83 90 94 85 82 89 86 93 83 85 86 88 Did not vote 11 13 8 3 11 17 9 11 5 14 14 11 9 (Can’t remember/DK) 3 4 2 3 3 1 2 3 2 2 1 3 4 Q6 Chance of voting in 2004 ... Total answering (536) (120) (134) (64) (61) (84) (56) (254) (81) (145) (140) (223) (80) Almost certain 94 94 93 94 98 90 93 94 95 94 91 94 99 Probably 6 6 7 6 2 10 7 6 5 6 9 6 1 Electorate ... Total answering (536) (120) (134) (64) (61) (84) (56) (254) (81) (145) (140) (223) (80) Core voter 88 88 89 86 95 81 86 89 89 87 83 89 95 Not Core Voter 12 12 11 14 5 19 14 11 11 13 17 11 5 Opinion elites ... Total answering (536) (120) (134) (64) (61) (84) (56) (254) (81) (145) (140) (223) (80) Opinion Elites 5 5 3 2 11 7 5 4 4 9 6 4 9 Non Opinion Elites 95 95 97 98 89 93 95 96 96 91 94 96 91 Q7 Direction of the country ... Total answering (536) (120) (134) (64) (61) (84) (56) (254) (81) (145) (140) (223) (80) Right direction 43 48 40 48 48 44 32 44 46 46 39 46 50 Wrong track 48 46 48 42 44 50 61 47 46 48 54 45 39 (DK/Ref) 8 6 13 9 8 6 7 9 9 7 6 9 11 Right - Wrong -5 3 -8 6 3 -6 -29 -3 - -2 -15 0 11 Q8 Bush job approval ... Total Answering (536) (120) (134) (64) (61) (84) (56) (254) (81) (145) (140) (223) (80) Strongly approve 36 37 34 38 43 33 34 35 38 37 34 36 44 Somewhat approve 16 23 16 13 7 17 11 20 16 12 14 21 9 Somewhat disapprove 13 13 13 17 16 11 16 13 15 13 13 13 16 Strongly disapprove 30 25 34 27 33 32 36 30 26 32 34 27 26 (DK/Ref) 4 3 4 6 2 7 4 3 5 5 6 3 5 Total approve 52 60 50 50 49 50 45 55 54 50 48 57 53 Total disapprove 44 38 46 44 49 43 52 42 41 46 46 40 43 Approve - disapprove 8 23 4 6 - 7 -7 13 14 4 1 17 10
Page 14

June 14-20, 2004 Center for Rural Strategies Greenberg Quinlan Rosner CORE 2WAY 3WAY VOTE VOTE 2000 Core Total Voter Kerry Bush Kerry Bush Gore Bush Q9-10 Summary: Thermometer Means ... Total Answering (536) (471) (224) (276) (210) (263) (184) (277) 9 George W. Bush 56.0 55.7 24.0 82.8 23.7 83.6 24.7 77.4 10 John Kerry 44.6 45.0 72.4 22.5 73.8 21.9 72.9 25.7 Summary: Thermometers...Warm/Cool/ID ... Total Answering (536) (471) (224) (276) (210) (263) (184) (277) 9 George W. Bush Warm 52 52 9 89 10 90 11 81 Cool 35 36 75 5 75 4 74 11 Neutral 12 10 16 5 14 5 14 8 ID 99 99 100 100 99 100 99 100 Don’t ID 1 1 0 0 1 0 1 - Warm - Cool 17 16 -66 85 -66 86 -63 70 Mean 56.0 55.7 24.0 82.8 23.7 83.6 24.7 77.4 10 John Kerry Warm 35 36 73 8 76 7 73 12 Cool 43 43 6 72 5 74 6 68 Neutral 17 16 18 14 17 14 19 15 ID 95 95 97 95 98 95 98 95 Don’t ID 5 5 3 5 2 5 2 5 Warm - Cool -8 -7 67 -65 71 -67 67 -56 Mean 44.6 45.0 72.4 22.5 73.8 21.9 72.9 25.7 Q11 Kerry vs. Bush ... Total answering (536) (471) (224) (276) (210) (263) (184) (277) John Kerry 39 40 94 - 94 - 89 8 Lean John Kerry 2 2 6 - 5 - 3 1 George Bush 48 49 - 94 0 96 3 84 Lean George Bush 3 3 - 6 - 4 2 4 (Other) 1 1 - - - - 1 1 (Undecided) 3 3 - - - - 2 2 (Ref) 2 1 - - 0 0 1 0 Total John Kerry 42 43 100 - 99 - 92 9 Total George Bush 51 52 - 100 0 100 4 88 Total (Other) 1 1 - - - - 1 1 Kerry - Bush -10 -9 100 -100 99 -100 88 -78 Q13 3-way Presidential vote ... Total answering (536) (471) (224) (276) (210) (263) (184) (277) John Kerry 39 40 93 0 100 - 89 9 George Bush 49 49 - 95 - 100 4 84 Ralph Nader 5 5 5 2 - - 3 3 (Undecided) 5 4 2 2 - - 4 3 (Other candidate) 1 0 - - - - - - (Ref) 1 1 - 1 - - - 1 Kerry - Bush -10 -9 93 -95 100 -100 85 -76
Page 15

Greenberg Quinlan Rosner Center for Rural Strategies June 14-20, 2004 PARTY ID PARTY/IDEO IDEOLOGY DIRECTION Mod Ind Lib Lib Cons No Mod Cons Total Dem Ind Rep Dem Dem lean Rep Rep Lib Mod Cons Right Wrong Q9-10 Summary: Thermometer Means ... Total Answering (536) (185) (152) (198) (78) (142) (52) (92) (159) (97) (202) (219) (232) (259) 9 George W. Bush 56.0 29.5 57.3 79.4 24.4 32.6 57.3 70.8 83.4 31.5 51.3 71.6 84.2 29.4 10 John Kerry 44.6 70.4 41.9 21.6 74.0 65.5 40.0 32.8 18.5 66.3 53.1 27.4 23.1 62.9 Summary: Thermometers...Warm/Cool/ID ... Total Answering (536) (185) (152) (198) (78) (142) (52) (92) (159) (97) (202) (219) (232) (259) 9 George W. Bush Warm 52 17 53 83 10 21 52 75 87 19 47 72 90 16 Cool 35 68 29 10 74 61 25 13 8 63 38 20 5 67 Neutral 12 14 16 6 14 15 21 11 5 16 15 7 4 16 ID 99 98 99 99 99 98 98 99 100 98 100 99 99 99 Don’t ID 1 2 1 1 1 2 2 1 - 2 0 1 1 1 Warm - Cool 17 -50 24 73 -64 -40 27 62 79 -44 9 52 85 -51 Mean 56.0 29.5 57.3 79.4 24.4 32.6 57.3 70.8 83.4 31.5 51.3 71.6 84.2 29.4 10 John Kerry Warm 35 68 28 10 77 61 23 16 6 64 43 16 9 59 Cool 43 11 43 72 9 14 46 55 78 16 30 66 71 20 Neutral 17 18 22 12 13 21 21 20 11 15 21 12 14 18 ID 95 97 93 93 99 96 90 91 95 96 95 94 94 97 Don’t ID 5 3 7 7 1 4 10 9 5 4 5 6 6 3 Warm - Cool -8 57 -15 -63 68 46 -23 -39 -72 47 13 -51 -62 38 Mean 44.6 70.4 41.9 21.6 74.0 65.5 40.0 32.8 18.5 66.3 53.1 27.4 23.1 62.9 Q11 Kerry vs. Bush ... Total answering (536) (185) (152) (198) (78) (142) (52) (92) (159) (97) (202) (219) (232) (259) John Kerry 39 78 33 8 92 70 21 16 5 77 46 17 3 76 Lean John Kerry 2 2 5 1 1 4 6 2 1 2 4 1 1 3 George Bush 48 12 44 86 4 17 44 68 90 13 40 73 88 14 Lean George Bush 3 2 6 2 1 3 2 7 3 2 3 3 3 2 (Other) 1 1 3 1 - 2 8 1 - 1 1 1 1 2 (Undecided) 3 2 7 2 - 3 15 5 1 2 5 2 2 4 (Ref) 2 2 2 1 1 1 4 - 1 2 - 2 2 1 Total John Kerry 42 81 38 9 94 74 27 18 6 79 50 18 4 78 Total George Bush 51 14 50 88 5 20 46 75 92 15 43 76 91 15 Total (Other) 1 1 3 1 - 2 8 1 - 1 1 1 1 2 Kerry - Bush -10 66 -13 -79 88 54 -19 -57 -87 64 7 -58 -88 63 Q13 3-way Presidential vote ... Total answering (536) (185) (152) (198) (78) (142) (52) (92) (159) (97) (202) (219) (232) (259) John Kerry 39 78 33 8 91 70 23 17 4 77 47 16 4 73 George Bush 49 12 46 86 4 18 46 68 91 12 40 74 89 14 Ralph Nader 5 4 9 4 3 6 12 9 3 4 8 4 1 8 (Undecided) 5 5 9 2 3 6 12 4 3 4 5 5 3 5 (Other candidate) 1 - 2 - - - 4 - - - 0 - 1 - (Ref) 1 1 2 1 - 1 4 1 1 2 - 1 2 0 Kerry - Bush -10 65 -13 -78 87 52 -23 -51 -87 65 6 -58 -85 59
Page 16

June 14-20, 2004 Center for Rural Strategies Greenberg Quinlan Rosner GENDER AGE GENERATIONS GENDER/AGE 18 - 30 - 40 - 50 - Over Sil Young Young Older Older Total Men Women 29 39 49 64 64 Gen X Boom ent Women Men Women Men Q9-10 Summary: Thermometer Means ... Total Answering (536) (251) (285) (65) (62) (102) (176) (124) (61) (237) (146) (109) (120) (170) (130) 9 George W. Bush 56.0 56.4 55.6 57.0 59.3 57.3 55.7 54.0 58.0 57.2 54.9 56.8 58.6 55.6 54.3 10 John Kerry 44.6 42.2 46.9 47.1 47.0 44.1 44.1 43.6 45.7 44.1 43.9 46.7 44.9 46.9 40.1 Summary: Thermometers...Warm/Cool/ID ... Total Answering (536) (251) (285) (65) (62) (102) (176) (124) (61) (237) (146) (109) (120) (170) (130) 9 George W. Bush Warm 52 55 49 51 58 59 49 48 59 55 47 51 61 49 49 Cool 35 34 36 31 34 34 36 38 31 34 38 35 32 37 36 Neutral 12 10 13 17 6 5 15 12 7 11 14 12 6 14 14 ID 99 99 99 98 98 98 100 98 97 99 99 98 98 99 99 Don’t ID 1 1 1 2 2 2 - 2 3 1 1 2 2 1 1 Warm - Cool 17 21 13 20 24 25 14 10 28 21 9 17 29 12 13 Mean 56.0 56.4 55.6 57.0 59.3 57.3 55.7 54.0 58.0 57.2 54.9 56.8 58.6 55.6 54.3 10 John Kerry Warm 35 33 37 35 37 37 34 35 31 35 34 38 36 37 30 Cool 43 47 40 40 39 38 45 46 43 42 45 37 41 41 52 Neutral 17 16 17 15 18 20 18 14 15 19 16 18 18 16 15 ID 95 96 94 91 94 95 97 94 89 96 94 93 94 95 97 Don’t ID 5 4 6 9 6 5 3 6 11 4 6 7 6 5 3 Warm - Cool -8 -14 -2 -5 -2 -1 -12 -11 -11 -6 -11 1 -5 -4 -22 Mean 44.6 42.2 46.9 47.1 47.0 44.1 44.1 43.6 45.7 44.1 43.9 46.7 44.9 46.9 40.1 Q11 Kerry vs. Bush ... Total answering (536) (251) (285) (65) (62) (102) (176) (124) (61) (237) (146) (109) (120) (170) (130) John Kerry 39 35 43 43 39 35 39 43 36 37 40 44 33 42 38 Lean John Kerry 2 4 1 2 3 4 2 2 3 3 3 2 4 1 3 George Bush 48 52 45 48 56 49 48 45 57 51 45 47 54 44 51 Lean George Bush 3 4 3 3 - 5 4 2 2 3 4 2 4 4 3 (Other) 1 1 2 3 - - 2 2 - 1 1 1 1 2 1 (Undecided) 3 3 4 - 2 5 5 2 - 4 4 3 3 4 3 (Ref) 2 1 2 2 - 2 1 4 2 1 2 2 1 3 2 Total John Kerry 42 39 44 45 42 39 40 45 39 39 43 46 38 44 41 Total George Bush 51 56 48 51 56 54 52 48 59 54 49 49 58 48 54 Total (Other) 1 1 2 3 - - 2 2 - 1 1 1 1 2 1 Kerry - Bush -10 -17 -4 -6 -15 -15 -12 -2 -20 -15 -6 -3 -21 -4 -13 Q13 3-way Presidential vote ... Total answering (536) (251) (285) (65) (62) (102) (176) (124) (61) (237) (146) (109) (120) (170) (130) John Kerry 39 36 42 38 42 37 38 42 36 37 40 42 36 42 36 George Bush 49 53 46 48 55 50 50 46 56 51 49 47 54 45 52 Ralph Nader 5 6 5 9 2 5 7 3 7 5 5 5 6 5 5 (Undecided) 5 5 4 3 2 6 4 6 2 5 5 4 4 4 5 (Other candidate) 1 - 1 2 - - - 1 - - - 1 - 1 - (Ref) 1 0 2 - - 2 1 2 - 1 1 2 - 2 1 Kerry - Bush -10 -17 -4 -9 -13 -13 -12 -4 -20 -14 -10 -5 -18 -3 -16
Page 17

Greenberg Quinlan Rosner Center for Rural Strategies June 14-20, 2004 EDUCATION GENDER/EDUC AGE/EDUC NON COLL H.S. No No Young Older or Post Coll Coll Coll Coll Coll No Young No Older Young Older Young Older Total less H.S. grad Men Men Women Women Coll Coll Coll Coll Women Women Men Men Q9-10 Summary: Thermometer Means ... Total Answering (536) (198) (149) (186) (98) (151) (88) (196) (146) (81) (197) (103) (73) (119) (73) (78) 9 George W. Bush 56.0 53.7 60.4 55.2 53.9 58.4 56.7 55.2 58.6 56.9 55.4 54.3 56.4 55.0 61.0 56.0 10 John Kerry 44.6 46.7 40.6 46.1 43.1 41.8 49.5 45.8 44.6 48.3 43.7 44.3 44.4 46.7 44.8 39.2 Summary: Thermometers...Warm/Cool/ID ... Total Answering (536) (198) (149) (186) (98) (151) (88) (196) (146) (81) (197) (103) (73) (119) (73) (78) 9 George W. Bush Warm 52 48 57 52 52 58 52 48 58 56 49 50 52 46 63 53 Cool 35 37 30 38 37 32 39 36 33 33 35 41 36 35 30 33 Neutral 12 13 12 9 11 9 7 15 9 9 16 10 12 18 5 13 ID 99 98 99 99 100 99 98 99 99 98 99 100 100 99 99 99 Don’t ID 1 2 1 1 - 1 2 1 1 2 1 - - 1 1 1 Warm - Cool 17 12 27 15 15 26 14 12 25 22 14 9 16 11 33 19 Mean 56.0 53.7 60.4 55.2 53.9 58.4 56.7 55.2 58.6 56.9 55.4 54.3 56.4 55.0 61.0 56.0 10 John Kerry Warm 35 35 30 40 36 31 44 34 34 42 32 38 34 34 34 28 Cool 43 40 50 40 43 49 36 41 42 33 46 45 41 40 42 55 Neutral 17 19 15 16 18 15 14 18 18 19 17 15 19 18 16 14 ID 95 94 95 96 97 95 94 93 94 94 95 97 95 93 93 97 Don’t ID 5 6 5 4 3 5 6 7 6 6 5 3 5 7 7 3 Warm - Cool -8 -6 -19 - -7 -18 8 -7 -8 9 -14 -7 -7 -6 -8 -27 Mean 44.6 46.7 40.6 46.1 43.1 41.8 49.5 45.8 44.6 48.3 43.7 44.3 44.4 46.7 44.8 39.2 Q11 Kerry vs. Bush ... Total answering (536) (198) (149) (186) (98) (151) (88) (196) (146) (81) (197) (103) (73) (119) (73) (78) John Kerry 39 42 33 41 38 34 45 42 37 41 40 42 44 41 30 37 Lean John Kerry 2 3 2 3 5 3 - 2 3 2 2 3 3 2 4 1 George Bush 48 44 55 48 49 55 48 44 51 51 47 48 47 42 56 54 Lean George Bush 3 4 3 2 3 4 1 4 4 1 4 3 3 4 5 3 (Other) 1 2 2 1 1 1 1 3 1 - 2 2 1 3 1 - (Undecided) 3 3 3 4 4 3 3 3 2 4 4 3 1 4 3 3 (Ref) 2 3 2 1 - 1 1 3 1 1 4 - 1 4 - 3 Total John Kerry 42 45 35 44 43 36 45 44 40 43 41 45 47 43 34 38 Total George Bush 51 48 58 51 52 59 49 47 55 52 50 50 49 46 62 56 Total (Other) 1 2 2 1 1 1 1 3 1 - 2 2 1 3 1 - Kerry - Bush -10 -3 -23 -6 -9 -23 -3 -4 -15 -9 -9 -6 -3 -3 -27 -18 Q13 3-way Presidential vote ... Total answering (536) (198) (149) (186) (98) (151) (88) (196) (146) (81) (197) (103) (73) (119) (73) (78) John Kerry 39 42 32 41 40 32 43 42 37 41 39 42 42 42 32 33 George Bush 49 45 55 49 50 56 49 44 51 51 48 50 47 43 56 55 Ralph Nader 5 5 5 5 7 5 3 6 5 5 5 6 4 7 7 3 (Undecided) 5 6 4 3 3 7 3 4 5 2 6 3 4 4 5 8 (Other candidate) 1 - 2 - - - - 2 1 - 1 - 1 1 - - (Ref) 1 2 1 1 - 1 1 3 1 1 3 - 1 3 - 1 Kerry - Bush -10 -3 -23 -8 -10 -23 -6 -3 -14 -10 -9 -8 -4 -1 -25 -22
Page 18

June 14-20, 2004 Center for Rural Strategies Greenberg Quinlan Rosner MARITAL MARITAL/GENDER GUNS Sep SepDv Marr Sin Div Marr Unmar Marr Widow Unmar 3 or Total ied gle Widow Men Men Women Women Women None 1-2 more Q9-10 Summary: Thermometer Means ... Total Answering (536) (357) (70) (107) (184) (67) (173) (78) (110) (276) (75) (135) 9 George W. Bush 56.0 58.8 49.2 51.3 58.9 49.5 58.8 51.0 51.1 50.0 58.9 62.6 10 John Kerry 44.6 42.4 52.3 48.3 41.1 45.4 43.8 51.5 52.7 49.7 45.8 40.7 Summary: Thermometers...Warm/Cool/ID ... Total Answering (536) (357) (70) (107) (184) (67) (173) (78) (110) (276) (75) (135) 9 George W. Bush Warm 52 56 43 45 57 49 55 41 41 44 55 62 Cool 35 33 40 40 32 39 34 41 41 43 32 26 Neutral 12 10 16 13 10 10 10 15 16 11 12 10 ID 99 99 99 98 99 99 99 97 98 99 99 99 Don’t ID 1 1 1 2 1 1 1 3 2 1 1 1 Warm - Cool 17 23 3 5 25 10 21 - - 1 23 36 Mean 56.0 58.8 49.2 51.3 58.9 49.5 58.8 51.0 51.1 50.0 58.9 62.6 10 John Kerry Warm 35 33 43 38 32 36 34 40 43 40 36 30 Cool 43 47 33 36 48 43 46 31 29 37 40 47 Neutral 17 17 17 16 18 12 16 18 19 16 21 19 ID 95 96 93 90 97 91 95 88 91 93 97 97 Don’t ID 5 4 7 10 3 9 5 12 9 7 3 3 Warm - Cool -8 -14 10 3 -16 -7 -12 9 14 3 -4 -17 Mean 44.6 42.4 52.3 48.3 41.1 45.4 43.8 51.5 52.7 49.7 45.8 40.7 Q11 Kerry vs. Bush ... Total answering (536) (357) (70) (107) (184) (67) (173) (78) (110) (276) (75) (135) John Kerry 39 36 50 43 35 36 38 49 52 47 41 30 Lean John Kerry 2 2 4 3 3 6 1 1 2 3 3 - George Bush 48 53 33 42 55 43 51 37 35 40 48 61 Lean George Bush 3 3 4 3 3 4 3 4 3 3 1 4 (Other) 1 1 3 2 - 3 2 1 2 2 1 - (Undecided) 3 3 3 4 3 4 3 4 3 4 1 2 (Ref) 2 1 3 4 1 3 2 4 4 1 4 3 Total John Kerry 42 38 54 46 38 42 39 50 54 51 44 30 Total George Bush 51 56 37 45 59 48 54 41 38 43 49 64 Total (Other) 1 1 3 2 - 3 2 1 2 2 1 - Kerry - Bush -10 -18 17 1 -21 -6 -15 9 15 8 -5 -34 Q13 3-way Presidential vote ... Total answering (536) (357) (70) (107) (184) (67) (173) (78) (110) (276) (75) (135) John Kerry 39 36 50 44 34 40 38 47 50 47 44 30 George Bush 49 54 36 42 55 46 52 37 35 42 47 61 Ralph Nader 5 5 9 5 4 9 5 3 5 6 4 4 (Undecided) 5 4 4 6 5 4 3 8 5 5 3 3 (Other candidate) 1 0 1 1 - - 1 1 2 0 - - (Ref) 1 1 - 3 1 - 2 4 3 0 3 2 Kerry - Bush -10 -18 14 2 -21 -6 -14 10 15 5 -3 -31
Page 19

Greenberg Quinlan Rosner Center for Rural Strategies June 14-20, 2004 RELIGION INCOME CONG DIST Devt Main Irreg Dev $30K $50K $75K Evan line Main Cath out Under to to or Safe Safe Total gelcl Prot line olic Cthlc $30K $50K $75K more Dem Rep Swing Q9-10 Summary: Thermometer Means ... Total Answering (536) (77) (143) (104) (111) (51) (143) (118) (109) (77) (205) (233) (98) 9 George W. Bush 56.0 78.1 50.6 51.1 55.7 59.7 53.9 54.1 58.3 61.0 55.4 58.9 50.2 10 John Kerry 44.6 27.4 53.5 51.9 48.7 46.2 50.4 46.2 47.3 39.1 43.5 45.6 44.7 Summary: Thermometers...Warm/Cool/ID ... Total Answering (536) (77) (143) (104) (111) (51) (143) (118) (109) (77) (205) (233) (98) 9 George W. Bush Warm 52 79 45 45 50 57 48 47 59 62 49 57 45 Cool 35 13 41 42 32 27 38 36 35 29 35 33 43 Neutral 12 8 14 13 17 14 11 16 6 6 14 10 10 ID 99 100 99 100 99 98 97 100 100 97 98 100 98 Don’t ID 1 - 1 - 1 2 3 - - 3 2 0 2 Warm - Cool 17 66 4 3 19 29 10 11 24 34 15 24 2 Mean 56.0 78.1 50.6 51.1 55.7 59.7 53.9 54.1 58.3 61.0 55.4 58.9 50.2 10 John Kerry Warm 35 18 44 43 39 35 37 36 42 32 34 35 37 Cool 43 64 29 31 37 39 34 41 40 52 43 42 44 Neutral 17 13 21 19 22 22 20 19 16 12 16 18 14 ID 95 95 94 93 97 96 91 96 98 96 93 96 95 Don’t ID 5 5 6 7 3 4 9 4 2 4 7 4 5 Warm - Cool -8 -45 15 13 2 -4 3 -5 2 -19 -9 -7 -7 Mean 44.6 27.4 53.5 51.9 48.7 46.2 50.4 46.2 47.3 39.1 43.5 45.6 44.7 Q11 Kerry vs. Bush ... Total answering (536) (77) (143) (104) (111) (51) (143) (118) (109) (77) (205) (233) (98) John Kerry 39 16 48 49 41 37 44 42 40 34 37 39 46 Lean John Kerry 2 1 5 6 4 4 3 3 3 1 2 2 3 George Bush 48 77 38 38 47 49 38 45 52 61 48 52 41 Lean George Bush 3 5 3 2 5 4 3 3 3 1 2 3 5 (Other) 1 1 - - - - 2 2 - 1 2 0 3 (Undecided) 3 - 4 4 3 4 4 4 2 1 5 2 2 (Ref) 2 - 2 2 2 2 5 1 - - 3 2 - Total John Kerry 42 17 52 55 44 41 47 45 43 35 39 41 49 Total George Bush 51 82 41 39 51 53 42 48 55 62 51 55 46 Total (Other) 1 1 - - - - 2 2 - 1 2 0 3 Kerry - Bush -10 -65 11 15 -7 -12 5 -3 -12 -27 -12 -13 3 Q13 3-way Presidential vote ... Total answering (536) (77) (143) (104) (111) (51) (143) (118) (109) (77) (205) (233) (98) John Kerry 39 16 50 52 41 43 43 44 41 34 37 39 44 George Bush 49 81 39 38 47 49 40 47 53 62 49 53 40 Ralph Nader 5 1 4 6 7 2 7 5 3 4 5 5 7 (Undecided) 5 3 4 2 4 4 8 3 3 - 6 3 7 (Other candidate) 1 - 1 1 - - 1 - - - 1 - - (Ref) 1 - 2 2 1 2 1 1 - - 1 1 2 Kerry - Bush -10 -65 10 14 -5 -6 3 -3 -12 -29 -12 -14 4
Page 20

June 14-20, 2004 Center for Rural Strategies Greenberg Quinlan Rosner REGION REGION COLL NCEC REGION East West Indus Sun North North Deep Mntn Paci North Cent trial belt Total Cntrl Cntrl South State fic east ral South West Coast Htlnd Grwth Q9-10 Summary: Thermometer Means ... Total Answering (536) (120) (134) (64) (61) (84) (56) (254) (81) (145) (140) (223) (80) 9 George W. Bush 56.0 61.7 51.4 60.4 56.5 52.6 52.9 56.3 60.3 54.2 52.7 58.6 61.2 10 John Kerry 44.6 44.4 45.6 44.0 43.4 45.2 45.3 45.1 43.0 44.5 45.3 43.6 42.2 Summary: Thermometers...Warm/Cool/ID ... Total Answering (536) (120) (134) (64) (61) (84) (56) (254) (81) (145) (140) (223) (80) 9 George W. Bush Warm 52 58 51 52 51 48 45 54 54 49 46 57 56 Cool 35 23 41 31 39 40 41 32 32 40 41 29 33 Neutral 12 20 7 13 8 11 13 13 10 10 11 14 9 ID 99 100 99 95 98 99 98 100 96 99 99 100 98 Don’t ID 1 - 1 5 2 1 2 0 4 1 1 0 3 Warm - Cool 17 35 10 20 11 7 4 22 22 9 6 28 24 Mean 56.0 61.7 51.4 60.4 56.5 52.6 52.9 56.3 60.3 54.2 52.7 58.6 61.2 10 John Kerry Warm 35 36 36 28 33 40 34 36 30 37 38 35 29 Cool 43 43 43 38 46 44 41 43 41 45 43 44 45 Neutral 17 16 19 22 11 12 21 17 20 12 16 17 14 ID 95 95 97 88 90 96 96 96 90 94 96 96 88 Don’t ID 5 5 3 13 10 4 4 4 10 6 4 4 13 Warm - Cool -8 -8 -7 -9 -13 -4 -7 -7 -11 -8 -5 -9 -16 Mean 44.6 44.4 45.6 44.0 43.4 45.2 45.3 45.1 43.0 44.5 45.3 43.6 42.2 Q11 Kerry vs. Bush ... Total answering (536) (120) (134) (64) (61) (84) (56) (254) (81) (145) (140) (223) (80) John Kerry 39 34 43 31 41 43 46 39 31 42 44 37 36 Lean John Kerry 2 5 1 3 2 1 - 3 4 1 1 4 3 George Bush 48 51 46 47 49 48 48 48 48 48 48 50 51 Lean George Bush 3 5 2 2 3 2 4 4 2 3 3 4 4 (Other) 1 - 1 5 - 1 2 1 5 1 1 0 - (Undecided) 3 3 4 8 3 2 - 4 6 3 1 4 4 (Ref) 2 2 1 5 2 2 - 2 4 2 1 2 3 Total John Kerry 42 39 45 34 43 44 46 42 35 43 45 40 39 Total George Bush 51 56 49 48 52 50 52 52 51 51 51 54 55 Total (Other) 1 - 1 5 - 1 2 1 5 1 1 0 - Kerry - Bush -10 -17 -4 -14 -10 -6 -5 -10 -16 -8 -6 -13 -16 Q13 3-way Presidential vote ... Total answering (536) (120) (134) (64) (61) (84) (56) (254) (81) (145) (140) (223) (80) John Kerry 39 36 43 33 41 40 45 39 32 41 42 37 35 George Bush 49 53 46 47 48 50 48 50 48 49 49 52 50 Ralph Nader 5 6 5 3 8 7 2 6 2 8 5 5 8 (Undecided) 5 3 4 13 3 1 5 3 14 2 3 4 6 (Other candidate) 1 1 1 2 - - - 1 1 - - 1 - (Ref) 1 2 1 3 - 1 - 2 2 1 1 1 1 Kerry - Bush -10 -18 -4 -14 -7 -10 -4 -10 -16 -8 -7 -14 -15
Page 21

Greenberg Quinlan Rosner Center for Rural Strategies June 14-20, 2004 CORE 2WAY 3WAY VOTE VOTE 2000 Core Total Voter Kerry Bush Kerry Bush Gore Bush Q2 Respondent gender ... Total answering (536) (471) (224) (276) (210) (263) (184) (277) Male 47 46 44 51 43 51 40 50 Female 53 54 56 49 57 49 60 50 Q16 Party ID ... Total answering (536) (471) (224) (276) (210) (263) (184) (277) Strong Dem 23 25 50 4 51 3 59 3 Weak Dem 11 10 16 6 17 5 15 7 Ind-lean Dem 8 9 16 3 15 2 16 3 Ind 10 9 6 9 6 9 5 9 Ind-lean Rep 10 10 4 16 3 15 1 16 Weak Rep 10 9 5 14 5 14 3 15 Strong Rep 27 27 3 49 3 51 1 48 (DK/Ref) 0 0 - - - - - - 2-3-2 Dem 35 35 67 9 69 9 74 9 Ind 28 28 25 28 24 27 22 28 Rep 37 37 8 63 8 65 4 63 Dem-Rep -2 -1 58 -54 61 -56 71 -53 3-1-3 Dem 43 44 82 12 84 11 90 12 Ind 10 9 6 9 6 9 5 9 Rep 47 47 12 79 10 80 4 79 Dem-Rep -5 -3 71 -67 73 -69 86 -67 Gender Party ID ... Total answering (536) (471) (224) (276) (210) (263) (184) (277) Dem Men 14 13 25 5 26 5 27 5 Dem Women 21 22 42 4 42 4 48 5 Ind Men 17 17 16 18 13 18 12 18 Ind Women 11 10 10 9 10 9 10 10 Rep Men 16 16 4 27 3 28 1 27 Rep Women 21 21 4 36 4 37 3 35 Q19 Ideology ... Total answering (536) (471) (224) (276) (210) (263) (184) (277) Liberal 18 18 34 5 36 5 35 5 Moderate 38 38 45 32 45 31 45 32 Conservative 41 41 17 61 17 62 16 61 (DK/Ref) 3 3 3 3 3 3 3 2 Party Ideology ... Total answering (536) (471) (224) (276) (210) (263) (184) (277) Liberal Dem 15 15 33 1 34 1 35 2 Mod/Cons Dem 26 27 47 10 47 10 53 10 Lib/Mod Rep 17 16 8 25 8 24 3 25 Conservative Rep 30 31 4 53 3 55 1 53
Page 22

June 14-20, 2004 Center for Rural Strategies Greenberg Quinlan Rosner PARTY ID PARTY/IDEO IDEOLOGY DIRECTION Mod Ind Lib Lib Cons No Mod Cons Total Dem Ind Rep Dem Dem lean Rep Rep Lib Mod Cons Right Wrong Q2 Respondent gender ... Total answering (536) (185) (152) (198) (78) (142) (52) (92) (159) (97) (202) (219) (232) (259) Male 47 39 61 43 44 44 56 49 47 45 46 48 53 42 Female 53 61 39 57 56 56 44 51 53 55 54 52 47 58 Q16 Party ID ... Total answering (536) (185) (152) (198) (78) (142) (52) (92) (159) (97) (202) (219) (232) (259) Strong Dem 23 68 - - 68 48 - - - 55 23 10 4 43 Weak Dem 11 32 - - 18 30 - - - 14 13 7 6 14 Ind-lean Dem 8 - 29 - 14 23 - - - 11 13 3 2 14 Ind 10 - 34 - - - 100 - - 5 13 7 11 8 Ind-lean Rep 10 - 37 - - - - 32 17 4 12 12 15 5 Weak Rep 10 - - 27 - - - 34 14 8 11 11 11 8 Strong Rep 27 - - 73 - - - 35 69 2 15 50 50 8 (DK/Ref) 0 - - - - - - - - - - - 0 - 2-3-2 Dem 35 100 - - 86 77 - - - 69 36 17 10 57 Ind 28 - 100 - 14 23 100 32 17 21 38 22 28 27 Rep 37 - - 100 - - - 68 83 10 26 60 62 16 Dem-Rep -2 100 - -100 86 77 - -68 -83 59 9 -43 -51 41 3-1-3 Dem 43 100 29 - 100 100 - - - 80 49 20 12 71 Ind 10 - 34 - - - 100 - - 5 13 7 11 8 Rep 47 - 37 100 - - - 100 100 14 39 73 77 20 Dem-Rep -5 100 -8 -100 100 100 - -100 -100 66 10 -53 -65 51 Gender Party ID ... Total answering (536) (185) (152) (198) (78) (142) (52) (92) (159) (97) (202) (219) (232) (259) Dem Men 14 39 - - 32 30 - - - 26 12 8 6 22 Dem Women 21 61 - - 54 47 - - - 43 23 9 5 36 Ind Men 17 - 61 - 12 13 56 22 10 14 23 13 18 15 Ind Women 11 - 39 - 3 9 44 10 7 6 15 9 10 12 Rep Men 16 - - 43 - - - 27 37 5 10 27 29 5 Rep Women 21 - - 57 - - - 41 46 5 16 33 32 11 Q19 Ideology ... Total answering (536) (185) (152) (198) (78) (142) (52) (92) (159) (97) (202) (219) (232) (259) Liberal 18 36 13 5 100 - 10 15 - 100 - - 5 30 Moderate 38 39 51 27 - 69 50 85 - - 100 - 31 42 Conservative 41 21 32 67 - 31 31 - 100 - - 100 60 25 (DK/Ref) 3 4 4 2 - - 10 - - - - - 4 3 Party Ideology ... Total answering (536) (185) (152) (198) (78) (142) (52) (92) (159) (97) (202) (219) (232) (259) Liberal Dem 15 36 7 - 100 - - - - 80 - - 1 27 Mod/Cons Dem 26 59 21 - - 100 - - - - 49 20 10 42 Lib/Mod Rep 17 - 19 32 - - - 100 - 14 39 - 22 9 Conservative Rep 30 - 18 67 - - - - 100 - - 73 53 11
Page 23

Greenberg Quinlan Rosner Center for Rural Strategies June 14-20, 2004 GENDER AGE GENERATIONS GENDER/AGE 18 - 30 - 40 - 50 - Over Sil Young Young Older Older Total Men Women 29 39 49 64 64 Gen X Boom ent Women Men Women Men Q2 Respondent gender ... Total answering (536) (251) (285) (65) (62) (102) (176) (124) (61) (237) (146) (109) (120) (170) (130) Male 47 100 - 46 55 55 45 40 56 51 43 - 100 - 100 Female 53 - 100 54 45 45 55 60 44 49 57 100 - 100 - Q16 Party ID ... Total answering (536) (251) (285) (65) (62) (102) (176) (124) (61) (237) (146) (109) (120) (170) (130) Strong Dem 23 18 28 22 23 15 26 28 18 22 26 21 17 32 20 Weak Dem 11 11 12 20 11 16 7 10 16 11 8 16 16 9 6 Ind-lean Dem 8 11 6 5 8 9 8 10 8 7 13 6 8 5 14 Ind 10 12 8 11 2 8 16 4 5 13 8 4 10 10 13 Ind-lean Rep 10 14 7 8 11 11 14 6 10 12 10 6 14 8 14 Weak Rep 10 9 11 11 10 16 7 10 10 10 11 17 8 7 10 Strong Rep 27 25 29 25 35 25 22 31 33 26 25 29 27 28 23 (DK/Ref) 0 - 0 - - 1 - - - 0 - 1 - - - 2-3-2 Dem 35 29 39 42 34 30 33 38 34 32 34 37 33 42 26 Ind 28 37 21 23 21 27 38 20 23 31 30 16 33 23 41 Rep 37 34 40 35 45 41 29 42 43 36 36 47 35 35 33 Dem-Rep -2 -5 -0 6 -11 -11 4 -4 -8 -3 -1 -10 -3 6 -7 3-1-3 Dem 43 40 45 46 42 39 41 48 43 39 47 43 41 47 40 Ind 10 12 8 11 2 8 16 4 5 13 8 4 10 10 13 Rep 47 48 47 43 56 52 43 48 52 48 45 52 49 43 47 Dem-Rep -5 -8 -2 3 -15 -13 -2 1 -10 -8 2 -9 -8 4 -7 Gender Party ID ... Total answering (536) (251) (285) (65) (62) (102) (176) (124) (61) (237) (146) (109) (120) (170) (130) Dem Men 14 29 - 22 16 15 11 12 20 14 8 - 33 - 26 Dem Women 21 - 39 20 18 16 22 26 15 18 26 37 - 42 - Ind Men 17 37 - 12 15 22 22 11 15 20 19 - 33 - 41 Ind Women 11 - 21 11 6 6 16 9 8 11 11 16 - 23 - Rep Men 16 34 - 12 24 19 13 17 21 17 16 - 35 - 33 Rep Women 21 - 40 23 21 23 16 25 21 19 20 47 - 35 - Q19 Ideology ... Total answering (536) (251) (285) (65) (62) (102) (176) (124) (61) (237) (146) (109) (120) (170) (130) Liberal 18 18 19 20 16 16 19 18 18 17 18 18 16 18 19 Moderate 38 37 39 43 45 37 39 30 48 38 36 40 42 38 32 Conservative 41 42 40 32 39 45 39 48 34 43 42 39 40 41 45 (DK/Ref) 3 4 3 5 - 2 3 5 - 2 4 2 3 4 5 Party Ideology ... Total answering (536) (251) (285) (65) (62) (102) (176) (124) (61) (237) (146) (109) (120) (170) (130) Liberal Dem 15 14 15 17 13 14 15 15 15 13 16 17 13 15 15 Mod/Cons Dem 26 25 28 28 29 25 25 30 28 25 29 26 28 31 22 Lib/Mod Rep 17 18 16 14 29 17 16 14 25 17 14 18 20 15 15 Conservative Rep 30 30 29 28 27 35 26 33 28 31 30 34 28 27 32
Page 24

June 14-20, 2004 Center for Rural Strategies Greenberg Quinlan Rosner EDUCATION GENDER/EDUC AGE/EDUC NON COLL H.S. No No Young Older or Post Coll Coll Coll Coll Coll No Young No Older Young Older Young Older Total less H.S. grad Men Men Women Women Coll Coll Coll Coll Women Women Men Men Q2 Respondent gender ... Total answering (536) (198) (149) (186) (98) (151) (88) (196) (146) (81) (197) (103) (73) (119) (73) (78) Male 47 44 42 53 100 100 - - 50 56 40 50 - - 100 100 Female 53 56 58 47 - - 100 100 50 44 60 50 100 100 - - Q16 Party ID ... Total answering (536) (198) (149) (186) (98) (151) (88) (196) (146) (81) (197) (103) (73) (119) (73) (78) Strong Dem 23 25 21 23 15 20 32 26 18 20 28 25 19 31 16 23 Weak Dem 11 13 11 10 8 13 11 12 16 15 9 6 15 10 18 8 Ind-lean Dem 8 7 7 11 14 9 7 5 7 7 7 14 5 5 8 9 Ind 10 11 11 8 10 13 6 9 10 1 10 14 5 10 15 10 Ind-lean Rep 10 11 10 10 15 14 5 8 9 12 12 8 5 9 12 15 Weak Rep 10 11 9 10 10 9 10 11 13 12 8 9 18 8 8 9 Strong Rep 27 23 32 27 27 24 28 29 27 31 26 25 32 27 22 26 (DK/Ref) 0 - - 1 - - 1 - - 1 - - - - - - 2-3-2 Dem 35 38 32 33 23 32 43 38 34 35 37 31 34 41 34 31 Ind 28 28 28 29 40 35 17 22 26 21 28 35 16 24 36 35 Rep 37 34 40 38 37 32 39 40 40 43 35 34 49 34 30 35 Dem-Rep -2 4 -8 -5 -13 - 5 -3 -5 -9 3 -3 -15 7 4 -4 3-1-3 Dem 43 44 39 44 38 41 50 43 41 42 44 45 40 46 42 40 Ind 10 11 11 8 10 13 6 9 10 1 10 14 5 10 15 10 Rep 47 45 50 48 52 46 43 48 49 56 46 42 55 44 42 50 Dem-Rep -5 -1 -11 -4 -14 -5 7 -5 -8 -14 -3 3 -15 3 - -10 Gender Party ID ... Total answering (536) (198) (149) (186) (98) (151) (88) (196) (146) (81) (197) (103) (73) (119) (73) (78) Dem Men 14 15 13 12 23 32 - - 17 16 12 10 - - 34 31 Dem Women 21 23 19 20 - - 43 38 17 19 25 21 34 41 - - Ind Men 17 14 17 21 40 35 - - 18 15 14 25 - - 36 35 Ind Women 11 14 10 8 - - 17 22 8 6 15 10 16 24 - - Rep Men 16 16 11 19 37 32 - - 15 25 14 16 - - 30 35 Rep Women 21 18 29 18 - - 39 40 25 19 21 18 49 34 - - Q19 Ideology ... Total answering (536) (198) (149) (186) (98) (151) (88) (196) (146) (81) (197) (103) (73) (119) (73) (78) Liberal 18 16 19 20 20 16 19 18 16 19 18 20 16 19 16 15 Moderate 38 34 40 39 37 36 42 37 40 42 34 37 40 35 41 32 Conservative 41 45 38 38 41 43 35 42 40 38 44 39 42 42 38 47 (DK/Ref) 3 5 3 3 2 5 3 3 3 1 4 4 1 3 4 5 Party Ideology ... Total answering (536) (198) (149) (186) (98) (151) (88) (196) (146) (81) (197) (103) (73) (119) (73) (78) Liberal Dem 15 11 16 18 16 12 19 14 12 19 14 17 14 14 11 13 Mod/Cons Dem 26 31 21 25 20 26 31 27 27 23 27 27 25 29 30 23 Lib/Mod Rep 17 15 19 18 21 16 14 17 18 21 15 15 19 16 18 14 Conservative Rep 30 29 32 30 31 30 28 30 29 35 30 26 36 27 23 36
Page 25

Greenberg Quinlan Rosner Center for Rural Strategies June 14-20, 2004 MARITAL MARITAL/GENDER GUNS Sep SepDv Marr Sin Div Marr Unmar Marr Widow Unmar 3 or Total ied gle Widow Men Men Women Women Women None 1-2 more Q2 Respondent gender ... Total answering (536) (357) (70) (107) (184) (67) (173) (78) (110) (276) (75) (135) Male 47 52 54 27 100 100 - - - 32 48 73 Female 53 48 46 73 - - 100 100 100 68 52 27 Q16 Party ID ... Total answering (536) (357) (70) (107) (184) (67) (173) (78) (110) (276) (75) (135) Strong Dem 23 19 30 34 17 22 21 38 38 31 23 13 Weak Dem 11 13 9 7 11 9 14 9 7 9 19 13 Ind-lean Dem 8 9 7 7 11 10 6 6 5 8 7 10 Ind 10 10 11 9 11 13 8 10 8 11 5 9 Ind-lean Rep 10 10 14 8 13 19 8 3 5 7 11 16 Weak Rep 10 8 14 13 9 10 8 10 15 11 7 8 Strong Rep 27 31 14 21 28 15 34 23 20 24 29 30 (DK/Ref) 0 0 - - - - 1 - - - - 1 2-3-2 Dem 35 32 39 41 28 31 36 47 45 40 41 27 Ind 28 28 33 25 35 43 21 19 19 25 23 35 Rep 37 39 29 34 37 25 42 33 35 34 36 38 Dem-Rep -2 -8 10 7 -9 6 -6 14 10 6 5 -11 3-1-3 Dem 43 41 46 49 40 42 42 54 51 48 48 36 Ind 10 10 11 9 11 13 8 10 8 11 5 9 Rep 47 50 43 42 49 45 50 36 41 42 47 54 Dem-Rep -5 -9 3 7 -10 -3 -8 18 10 6 1 -18 Gender Party ID ... Total answering (536) (357) (70) (107) (184) (67) (173) (78) (110) (276) (75) (135) Dem Men 14 15 20 7 28 31 - - - 11 16 20 Dem Women 21 17 19 35 - - 36 47 45 29 25 7 Ind Men 17 18 24 11 35 43 - - - 11 19 27 Ind Women 11 10 9 14 - - 21 19 19 14 4 8 Rep Men 16 19 10 9 37 25 - - - 9 13 26 Rep Women 21 20 19 24 - - 42 33 35 25 23 12 Q19 Ideology ... Total answering (536) (357) (70) (107) (184) (67) (173) (78) (110) (276) (75) (135) Liberal 18 16 21 22 17 19 16 22 24 22 19 13 Moderate 38 37 46 34 35 42 40 36 36 37 45 41 Conservative 41 44 30 38 45 34 42 36 35 38 35 41 (DK/Ref) 3 3 3 6 3 4 2 6 5 3 1 4 Party Ideology ... Total answering (536) (357) (70) (107) (184) (67) (173) (78) (110) (276) (75) (135) Liberal Dem 15 13 19 17 13 15 13 18 19 18 16 10 Mod/Cons Dem 26 26 26 29 25 24 27 33 30 28 31 24 Lib/Mod Rep 17 16 23 16 17 21 16 13 17 15 19 23 Conservative Rep 30 33 20 24 32 24 34 21 22 26 28 30
Page 26

June 14-20, 2004 Center for Rural Strategies Greenberg Quinlan Rosner RELIGION INCOME CONG DIST Devt Main Irreg Dev $30K $50K $75K Evan line Main Cath out Under to to or Safe Safe Total gelcl Prot line olic Cthlc $30K $50K $75K more Dem Rep Swing Q2 Respondent gender ... Total answering (536) (77) (143) (104) (111) (51) (143) (118) (109) (77) (205) (233) (98) Male 47 40 43 43 52 57 38 53 52 58 45 50 43 Female 53 60 57 57 48 43 62 47 48 42 55 50 57 Q16 Party ID ... Total answering (536) (77) (143) (104) (111) (51) (143) (118) (109) (77) (205) (233) (98) Strong Dem 23 6 29 29 22 16 31 18 22 21 21 23 29 Weak Dem 11 9 13 12 15 12 9 14 17 6 11 12 10 Ind-lean Dem 8 3 15 17 7 10 7 12 6 9 9 7 10 Ind 10 6 8 9 16 18 11 11 8 5 11 10 7 Ind-lean Rep 10 10 10 11 9 6 10 12 9 10 10 12 7 Weak Rep 10 8 13 11 9 12 10 10 8 6 10 10 10 Strong Rep 27 57 13 13 22 27 21 23 30 42 27 27 27 (DK/Ref) 0 - - - - - - - - - 0 - - 2-3-2 Dem 35 16 41 40 37 27 41 32 39 27 33 34 39 Ind 28 19 33 37 32 33 28 35 23 25 30 29 24 Rep 37 65 26 23 31 39 31 33 39 48 37 37 37 Dem-Rep -2 -49 15 17 6 -12 9 -1 - -21 -4 -3 2 3-1-3 Dem 43 18 56 58 44 37 48 44 44 36 41 41 49 Ind 10 6 8 9 16 18 11 11 8 5 11 10 7 Rep 47 75 36 34 40 45 41 45 48 58 47 49 44 Dem-Rep -5 -57 20 24 5 -8 6 -1 -4 -22 -6 -8 5 Gender Party ID ... Total answering (536) (77) (143) (104) (111) (51) (143) (118) (109) (77) (205) (233) (98) Dem Men 14 6 11 12 16 14 15 14 16 14 14 13 14 Dem Women 21 9 30 29 21 14 25 18 23 13 19 21 24 Ind Men 17 6 22 24 21 22 17 21 13 19 15 21 13 Ind Women 11 13 11 13 12 12 11 14 10 5 15 8 11 Rep Men 16 27 10 8 15 22 6 18 24 25 16 16 15 Rep Women 21 38 16 15 15 18 26 15 15 23 21 21 21 Q19 Ideology ... Total answering (536) (77) (143) (104) (111) (51) (143) (118) (109) (77) (205) (233) (98) Liberal 18 5 27 26 13 10 17 25 17 16 16 17 26 Moderate 38 14 43 46 47 31 34 41 42 39 40 39 29 Conservative 41 79 27 23 36 55 40 34 40 45 40 41 42 (DK/Ref) 3 1 3 5 5 4 8 1 1 - 3 3 4 Party Ideology ... Total answering (536) (77) (143) (104) (111) (51) (143) (118) (109) (77) (205) (233) (98) Liberal Dem 15 4 23 22 10 8 14 20 14 13 12 14 22 Mod/Cons Dem 26 14 31 34 32 27 29 23 30 23 28 25 26 Lib/Mod Rep 17 6 17 18 17 10 13 21 15 22 16 20 13 Conservative Rep 30 69 17 14 22 33 26 24 33 36 31 28 30
Page 27

Greenberg Quinlan Rosner Center for Rural Strategies June 14-20, 2004 REGION REGION COLL NCEC REGION East West Indus Sun North North Deep Mntn Paci North Cent trial belt Total Cntrl Cntrl South State fic east ral South West Coast Htlnd Grwth Q2 Respondent gender ... Total answering (536) (120) (134) (64) (61) (84) (56) (254) (81) (145) (140) (223) (80) Male 47 46 49 45 46 49 45 47 46 48 47 48 50 Female 53 54 51 55 54 51 55 53 54 52 53 52 50 Q16 Party ID ... Total answering (536) (120) (134) (64) (61) (84) (56) (254) (81) (145) (140) (223) (80) Strong Dem 23 18 27 25 31 20 23 22 23 25 21 21 29 Weak Dem 11 10 13 11 7 14 9 11 12 11 12 11 8 Ind-lean Dem 8 13 5 8 3 6 13 9 9 5 9 9 4 Ind 10 7 16 16 5 8 5 11 12 7 7 12 8 Ind-lean Rep 10 12 12 11 7 12 7 12 10 10 10 13 9 Weak Rep 10 11 6 6 8 12 20 8 9 10 15 9 9 Strong Rep 27 30 22 23 39 26 23 26 25 32 25 26 35 (DK/Ref) 0 - - - - 1 - - - 1 1 - - 2-3-2 Dem 35 28 40 36 38 35 32 34 36 36 34 31 36 Ind 28 32 33 34 15 26 25 32 31 21 26 34 20 Rep 37 41 28 30 48 38 43 34 33 42 40 35 44 Dem-Rep -2 -13 12 6 -10 -4 -11 - 2 -6 -6 -3 -8 3-1-3 Dem 43 41 45 44 41 40 45 43 44 41 42 40 40 Ind 10 7 16 16 5 8 5 11 12 7 7 12 8 Rep 47 53 40 41 54 50 50 46 43 52 50 48 53 Dem-Rep -5 -12 5 3 -13 -10 -5 -3 1 -11 -8 -8 -13 Gender Party ID ... Total answering (536) (120) (134) (64) (61) (84) (56) (254) (81) (145) (140) (223) (80) Dem Men 14 9 16 17 11 12 14 13 19 12 13 12 14 Dem Women 21 18 23 19 26 23 18 21 17 24 21 20 23 Ind Men 17 20 20 20 11 18 11 20 17 15 15 22 16 Ind Women 11 12 13 14 3 8 14 12 14 6 11 13 4 Rep Men 16 17 12 8 23 19 20 14 10 21 19 15 20 Rep Women 21 24 16 22 25 19 23 20 23 21 21 19 24 Q19 Ideology ... Total answering (536) (120) (134) (64) (61) (84) (56) (254) (81) (145) (140) (223) (80) Liberal 18 14 21 16 21 17 20 18 17 19 18 15 20 Moderate 38 43 37 34 36 44 30 40 31 41 39 42 35 Conservative 41 38 37 48 43 38 45 38 49 40 41 38 45 (DK/Ref) 3 5 4 2 - 1 5 5 2 1 3 5 - Party Ideology ... Total answering (536) (120) (134) (64) (61) (84) (56) (254) (81) (145) (140) (223) (80) Liberal Dem 15 11 18 9 20 13 18 15 10 16 15 12 18 Mod/Cons Dem 26 27 25 33 21 27 25 26 32 25 26 26 23 Lib/Mod Rep 17 21 16 8 16 24 14 19 9 21 20 20 15 Conservative Rep 30 31 22 33 38 26 34 26 35 31 29 27 38
Page 28

June 14-20, 2004 Center for Rural Strategies Greenberg Quinlan Rosner CORE 2WAY 3WAY VOTE VOTE 2000 Core Total Voter Kerry Bush Kerry Bush Gore Bush Q24 Age ... Total answering (536) (471) (224) (276) (210) (263) (184) (277) 18 - 24 7 3 8 6 7 6 4 4 25 - 29 5 5 5 6 5 5 4 4 30 - 34 5 5 6 4 6 4 4 6 35 - 39 7 7 6 8 6 9 7 8 40 - 44 8 8 7 9 7 9 5 10 45 - 49 11 11 11 11 11 11 10 12 50 - 54 12 12 9 14 9 14 9 15 55 - 59 10 11 11 10 11 10 14 9 60 - 64 11 11 12 10 12 10 14 10 Over 64 23 25 25 21 25 22 27 21 (No answer) 1 1 1 1 1 1 1 1 18 - 29 12 8 13 12 12 12 8 8 30 - 39 12 12 12 13 12 13 11 14 40 - 49 19 20 18 20 18 19 16 22 50 - 64 33 35 32 33 32 33 37 34 Over 64 23 25 25 21 25 22 27 21 18 - 49 43 39 42 45 42 44 35 44 50 and over 56 59 57 55 57 55 64 55 Gender Age ... Total answering (536) (471) (224) (276) (210) (263) (184) (277) Young Women 20 19 22 19 22 19 19 20 Young Men 22 21 20 25 20 25 16 24 Older Women 32 34 33 29 34 29 41 29 Older Men 24 25 24 25 22 26 23 26 Generations ... Total answering (536) (471) (224) (276) (210) (263) (184) (277) Generation Y 8 4 9 8 9 8 4 5 Generation X 11 12 11 13 10 13 9 13 Boom Generation 44 46 42 46 42 46 43 48 Silent Generation 27 29 28 26 28 27 33 27 G.I. Generation 8 8 10 6 10 5 10 5
Page 29
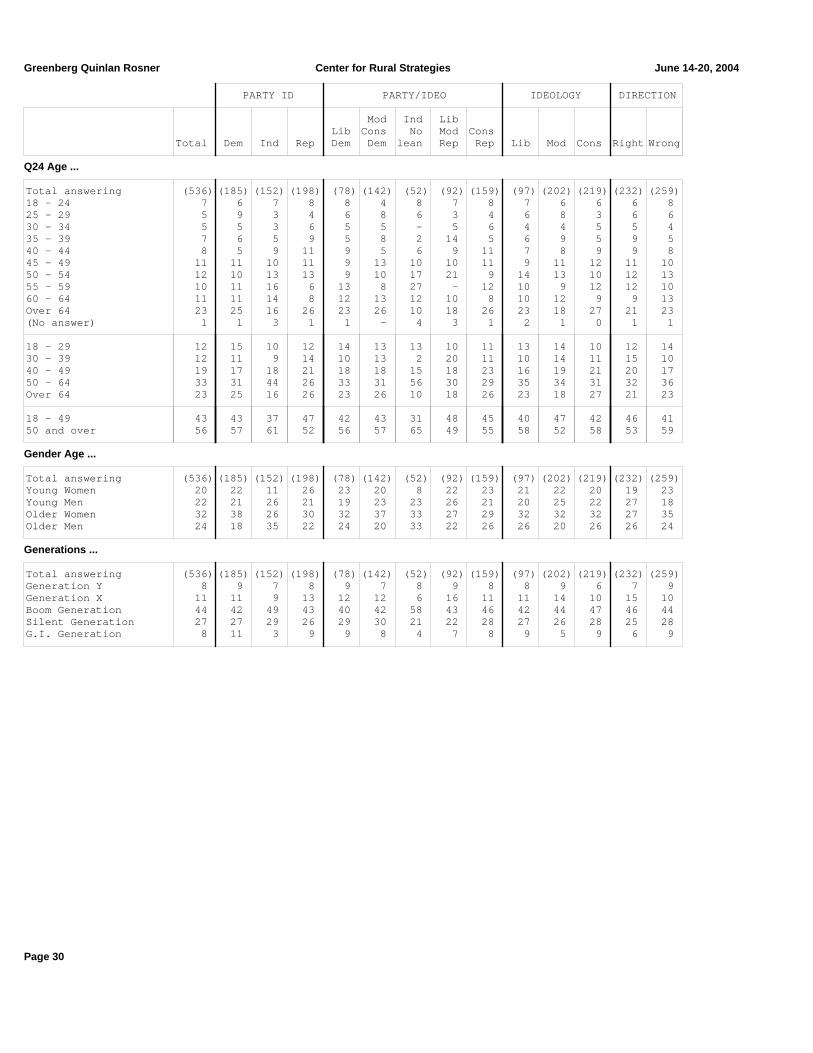
Greenberg Quinlan Rosner Center for Rural Strategies June 14-20, 2004 PARTY ID PARTY/IDEO IDEOLOGY DIRECTION Mod Ind Lib Lib Cons No Mod Cons Total Dem Ind Rep Dem Dem lean Rep Rep Lib Mod Cons Right Wrong Q24 Age ... Total answering (536) (185) (152) (198) (78) (142) (52) (92) (159) (97) (202) (219) (232) (259) 18 - 24 7 6 7 8 8 4 8 7 8 7 6 6 6 8 25 - 29 5 9 3 4 6 8 6 3 4 6 8 3 6 6 30 - 34 5 5 3 6 5 5 - 5 6 4 4 5 5 4 35 - 39 7 6 5 9 5 8 2 14 5 6 9 5 9 5 40 - 44 8 5 9 11 9 5 6 9 11 7 8 9 9 8 45 - 49 11 11 10 11 9 13 10 10 11 9 11 12 11 10 50 - 54 12 10 13 13 9 10 17 21 9 14 13 10 12 13 55 - 59 10 11 16 6 13 8 27 - 12 10 9 12 12 10 60 - 64 11 11 14 8 12 13 12 10 8 10 12 9 9 13 Over 64 23 25 16 26 23 26 10 18 26 23 18 27 21 23 (No answer) 1 1 3 1 1 - 4 3 1 2 1 0 1 1 18 - 29 12 15 10 12 14 13 13 10 11 13 14 10 12 14 30 - 39 12 11 9 14 10 13 2 20 11 10 14 11 15 10 40 - 49 19 17 18 21 18 18 15 18 23 16 19 21 20 17 50 - 64 33 31 44 26 33 31 56 30 29 35 34 31 32 36 Over 64 23 25 16 26 23 26 10 18 26 23 18 27 21 23 18 - 49 43 43 37 47 42 43 31 48 45 40 47 42 46 41 50 and over 56 57 61 52 56 57 65 49 55 58 52 58 53 59 Gender Age ... Total answering (536) (185) (152) (198) (78) (142) (52) (92) (159) (97) (202) (219) (232) (259) Young Women 20 22 11 26 23 20 8 22 23 21 22 20 19 23 Young Men 22 21 26 21 19 23 23 26 21 20 25 22 27 18 Older Women 32 38 26 30 32 37 33 27 29 32 32 32 27 35 Older Men 24 18 35 22 24 20 33 22 26 26 20 26 26 24 Generations ... Total answering (536) (185) (152) (198) (78) (142) (52) (92) (159) (97) (202) (219) (232) (259) Generation Y 8 9 7 8 9 7 8 9 8 8 9 6 7 9 Generation X 11 11 9 13 12 12 6 16 11 11 14 10 15 10 Boom Generation 44 42 49 43 40 42 58 43 46 42 44 47 46 44 Silent Generation 27 27 29 26 29 30 21 22 28 27 26 28 25 28 G.I. Generation 8 11 3 9 9 8 4 7 8 9 5 9 6 9
Page 30

June 14-20, 2004 Center for Rural Strategies Greenberg Quinlan Rosner GENDER AGE GENERATIONS GENDER/AGE 18 - 30 - 40 - 50 - Over Sil Young Young Older Older Total Men Women 29 39 49 64 64 Gen X Boom ent Women Men Women Men Q24 Age ... Total answering (536) (251) (285) (65) (62) (102) (176) (124) (61) (237) (146) (109) (120) (170) (130) 18 - 24 7 6 7 55 - - - - - - - 19 13 - - 25 - 29 5 6 5 45 - - - - 36 - - 13 13 - - 30 - 34 5 6 3 - 40 - - - 41 - - 8 13 - - 35 - 39 7 7 7 - 60 - - - 23 10 - 17 15 - - 40 - 44 8 10 7 - - 44 - - - 19 - 18 21 - - 45 - 49 11 12 9 - - 56 - - - 24 - 24 26 - - 50 - 54 12 11 12 - - - 36 - - 27 - - - 21 22 55 - 59 10 11 10 - - - 32 - - 21 5 - - 17 21 60 - 64 11 10 11 - - - 32 - - - 39 - - 19 19 Over 64 23 20 26 - - - - 100 - - 56 - - 44 38 (No answer) 1 0 2 - - - - - - - - - - - - 18 - 29 12 12 12 100 - - - - 36 - - 32 25 - - 30 - 39 12 14 10 - 100 - - - 64 10 - 26 28 - - 40 - 49 19 22 16 - - 100 - - - 43 - 42 47 - - 50 - 64 33 32 34 - - - 100 - - 47 44 - - 56 62 Over 64 23 20 26 - - - - 100 - - 56 - - 44 38 18 - 49 43 48 38 100 100 100 - - 100 53 - 100 100 - - 50 and over 56 52 60 - - - 100 100 - 47 100 - - 100 100 Gender Age ... Total answering (536) (251) (285) (65) (62) (102) (176) (124) (61) (237) (146) (109) (120) (170) (130) Young Women 20 - 38 54 45 45 - - 44 24 - 100 - - - Young Men 22 48 - 46 55 55 - - 56 28 - - 100 - - Older Women 32 - 60 - - - 55 60 - 24 57 - - 100 - Older Men 24 52 - - - - 45 40 - 23 43 - - - 100 Generations ... Total answering (536) (251) (285) (65) (62) (102) (176) (124) (61) (237) (146) (109) (120) (170) (130) Generation Y 8 8 8 66 - - - - - - - 22 16 - - Generation X 11 14 9 34 63 - - - 100 - - 25 28 - - Boom Generation 44 49 40 - 37 100 64 - - 100 - 53 56 34 42 Silent Generation 27 25 29 - - - 36 66 - - 100 - - 49 48 G.I. Generation 8 5 11 - - - - 34 - - - - - 18 9
Page 31

Greenberg Quinlan Rosner Center for Rural Strategies June 14-20, 2004 EDUCATION GENDER/EDUC AGE/EDUC NON COLL H.S. No No Young Older or Post Coll Coll Coll Coll Coll No Young No Older Young Older Young Older Total less H.S. grad Men Men Women Women Coll Coll Coll Coll Women Women Men Men Q24 Age ... Total answering (536) (198) (149) (186) (98) (151) (88) (196) (146) (81) (197) (103) (73) (119) (73) (78) 18 - 24 7 9 9 3 2 9 3 9 21 6 - - 25 - 18 - 25 - 29 5 5 6 5 5 6 5 5 13 11 - - 14 - 12 - 30 - 34 5 2 4 8 9 5 7 2 7 19 - - 4 - 10 - 35 - 39 7 6 8 8 8 7 7 7 16 17 - - 18 - 14 - 40 - 44 8 8 9 8 9 10 7 7 20 19 - - 19 - 21 - 45 - 49 11 11 8 12 12 13 13 8 23 28 - - 21 - 26 - 50 - 54 12 10 14 12 9 13 15 11 - - 21 21 - 18 - 24 55 - 59 10 10 9 12 13 9 10 10 - - 17 21 - 17 - 18 60 - 64 11 12 8 11 12 9 10 12 - - 18 20 - 19 - 17 Over 64 23 26 23 20 18 21 23 28 - - 44 37 - 45 - 41 (No answer) 1 2 1 1 1 - 1 2 - - - - - - - - 18 - 29 12 14 15 8 7 15 8 14 34 17 - - 38 - 30 - 30 - 39 12 8 12 16 17 11 14 8 23 36 - - 22 - 23 - 40 - 49 19 19 17 20 21 23 19 15 43 47 - - 40 - 47 - 50 - 64 33 32 32 35 35 30 35 33 - - 56 63 - 55 - 59 Over 64 23 26 23 20 18 21 23 28 - - 44 37 - 45 - 41 18 - 49 43 40 45 44 46 48 41 37 100 100 - - 100 - 100 - 50 and over 56 59 54 55 53 52 58 61 - - 100 100 - 100 - 100 Gender Age ... Total answering (536) (198) (149) (186) (98) (151) (88) (196) (146) (81) (197) (103) (73) (119) (73) (78) Young Women 20 19 23 19 - - 41 37 50 44 - - 100 - - - Young Men 22 21 21 24 46 48 - - 50 56 - - - - 100 - Older Women 32 35 34 27 - - 58 61 - - 60 50 - 100 - - Older Men 24 24 21 28 53 52 - - - - 40 50 - - - 100 Generations ... Total answering (536) (198) (149) (186) (98) (151) (88) (196) (146) (81) (197) (103) (73) (119) (73) (78) Generation Y 8 10 11 4 4 10 3 11 25 9 - - 29 - 21 - Generation X 11 8 11 15 16 11 13 8 23 33 - - 22 - 23 - Boom Generation 44 41 44 48 48 49 48 37 53 58 36 41 49 31 56 42 Silent Generation 27 31 24 26 27 25 26 31 - - 49 48 - 50 - 47 G.I. Generation 8 9 8 6 4 5 9 11 - - 15 12 - 18 - 10
Page 32

June 14-20, 2004 Center for Rural Strategies Greenberg Quinlan Rosner MARITAL MARITAL/GENDER GUNS Sep SepDv Marr Sin Div Marr Unmar Marr Widow Unmar 3 or Total ied gle Widow Men Men Women Women Women None 1-2 more Q24 Age ... Total answering (536) (357) (70) (107) (184) (67) (173) (78) (110) (276) (75) (135) 18 - 24 7 2 36 2 1 19 3 1 13 9 4 4 25 - 29 5 6 9 - 5 7 8 - 1 5 7 7 30 - 34 5 6 4 1 7 4 5 - 1 5 3 5 35 - 39 7 8 9 1 9 3 8 - 5 5 9 12 40 - 44 8 8 14 5 10 9 6 6 8 7 11 9 45 - 49 11 12 6 9 13 10 11 6 6 10 9 15 50 - 54 12 14 1 12 13 6 14 12 9 9 8 16 55 - 59 10 11 9 11 10 12 11 12 9 12 8 7 60 - 64 11 11 4 15 10 10 12 14 11 11 11 14 Over 64 23 21 7 42 21 16 20 46 35 27 29 13 (No answer) 1 1 1 2 - 1 2 3 2 1 1 - 18 - 29 12 9 44 2 7 27 11 1 14 14 11 10 30 - 39 12 14 13 2 16 7 13 - 5 10 12 17 40 - 49 19 20 20 14 23 19 17 13 15 17 20 24 50 - 64 33 35 14 38 33 28 37 37 29 32 27 36 Over 64 23 21 7 42 21 16 20 46 35 27 29 13 18 - 49 43 43 77 18 46 54 41 14 34 41 43 51 50 and over 56 56 21 80 54 45 57 83 65 58 56 49 Gender Age ... Total answering (536) (357) (70) (107) (184) (67) (173) (78) (110) (276) (75) (135) Young Women 20 20 37 10 - - 41 14 34 27 19 13 Young Men 22 24 40 7 46 54 - - - 14 24 39 Older Women 32 28 9 61 - - 57 83 65 41 32 15 Older Men 24 28 13 20 54 45 - - - 18 24 34 Generations ... Total answering (536) (357) (70) (107) (184) (67) (173) (78) (110) (276) (75) (135) Generation Y 8 4 39 2 3 21 5 1 14 10 7 6 Generation X 11 14 14 1 15 10 13 - 4 12 11 13 Boom Generation 44 49 34 35 52 40 47 31 31 39 39 54 Silent Generation 27 26 10 43 26 24 27 44 34 30 31 24 G.I. Generation 8 6 1 18 5 3 7 22 16 9 12 3
Page 33

Greenberg Quinlan Rosner Center for Rural Strategies June 14-20, 2004 RELIGION INCOME CONG DIST Devt Main Irreg Dev $30K $50K $75K Evan line Main Cath out Under to to or Safe Safe Total gelcl Prot line olic Cthlc $30K $50K $75K more Dem Rep Swing Q24 Age ... Total answering (536) (77) (143) (104) (111) (51) (143) (118) (109) (77) (205) (233) (98) 18 - 24 7 4 7 9 5 6 10 4 4 5 4 9 6 25 - 29 5 3 3 4 6 6 3 9 8 1 5 5 7 30 - 34 5 6 3 4 6 8 3 6 6 8 7 3 3 35 - 39 7 3 8 7 7 12 4 9 10 9 6 8 5 40 - 44 8 10 7 6 8 10 6 10 6 13 6 10 10 45 - 49 11 10 11 12 12 8 9 10 15 16 9 12 12 50 - 54 12 14 11 12 13 - 8 11 13 18 12 11 13 55 - 59 10 6 10 11 16 20 9 7 16 17 13 8 11 60 - 64 11 13 13 14 6 4 12 14 8 8 11 11 9 Over 64 23 29 26 23 21 27 33 19 14 4 24 23 21 (No answer) 1 1 - - - - 1 - - 1 2 0 1 18 - 29 12 6 10 13 11 12 13 14 12 6 10 14 13 30 - 39 12 9 11 11 14 20 8 15 17 17 13 12 8 40 - 49 19 21 18 17 20 18 15 20 21 29 15 21 22 50 - 64 33 34 34 37 35 24 29 31 37 43 36 30 34 Over 64 23 29 26 23 21 27 33 19 14 4 24 23 21 18 - 49 43 36 40 40 44 49 36 49 50 52 38 47 44 50 and over 56 62 60 60 56 51 62 51 50 47 60 53 55 Gender Age ... Total answering (536) (77) (143) (104) (111) (51) (143) (118) (109) (77) (205) (233) (98) Young Women 20 21 21 20 20 24 21 20 25 19 19 21 21 Young Men 22 16 19 20 24 25 15 29 25 32 19 25 22 Older Women 32 38 36 37 28 20 40 26 23 21 35 28 35 Older Men 24 25 24 23 28 31 22 25 28 26 25 25 20 Generations ... Total answering (536) (77) (143) (104) (111) (51) (143) (118) (109) (77) (205) (233) (98) Generation Y 8 4 9 12 6 8 11 7 4 5 5 11 8 Generation X 11 9 9 9 14 16 8 14 17 16 14 10 9 Boom Generation 44 43 40 39 51 43 33 45 56 65 41 45 49 Silent Generation 27 35 34 35 25 27 35 30 22 12 29 25 29 G.I. Generation 8 8 8 6 4 6 11 4 2 1 9 9 4
Page 34

June 14-20, 2004 Center for Rural Strategies Greenberg Quinlan Rosner REGION REGION COLL NCEC REGION East West Indus Sun North North Deep Mntn Paci North Cent trial belt Total Cntrl Cntrl South State fic east ral South West Coast Htlnd Grwth Q24 Age ... Total answering (536) (120) (134) (64) (61) (84) (56) (254) (81) (145) (140) (223) (80) 18 - 24 7 8 6 6 7 8 4 7 6 8 6 7 8 25 - 29 5 5 4 5 10 5 4 5 6 7 4 4 10 30 - 34 5 8 5 2 5 4 4 6 1 4 4 7 4 35 - 39 7 10 4 3 2 8 14 7 5 6 11 7 1 40 - 44 8 6 11 2 10 12 5 9 5 11 9 8 9 45 - 49 11 15 10 11 8 7 13 13 9 8 9 13 10 50 - 54 12 10 11 11 13 13 14 11 11 13 14 12 11 55 - 59 10 8 16 14 8 8 7 12 12 8 8 10 9 60 - 64 11 10 10 16 13 5 16 10 12 8 9 10 14 Over 64 23 19 20 30 23 29 20 20 31 26 25 20 24 (No answer) 1 2 1 2 2 1 - 2 1 1 1 2 1 18 - 29 12 13 10 11 16 13 7 12 12 14 11 12 18 30 - 39 12 18 9 5 7 12 18 13 6 10 14 13 5 40 - 49 19 21 22 13 18 19 18 21 14 19 19 22 19 50 - 64 33 28 37 41 34 26 38 33 36 30 31 32 34 Over 64 23 19 20 30 23 29 20 20 31 26 25 20 24 18 - 49 43 52 41 28 41 44 43 46 32 43 44 47 41 50 and over 56 47 57 70 57 55 57 52 67 56 56 52 58 Gender Age ... Total answering (536) (120) (134) (64) (61) (84) (56) (254) (81) (145) (140) (223) (80) Young Women 20 32 15 6 20 23 23 23 9 21 23 23 16 Young Men 22 20 26 22 21 21 20 23 23 21 21 23 25 Older Women 32 22 35 47 33 27 32 29 44 30 29 27 33 Older Men 24 25 22 23 25 27 25 24 22 26 26 25 25 Generations ... Total answering (536) (120) (134) (64) (61) (84) (56) (254) (81) (145) (140) (223) (80) Generation Y 8 11 6 8 8 10 5 8 7 9 8 9 10 Generation X 11 16 11 5 13 11 9 13 6 12 10 14 11 Boom Generation 44 42 49 38 41 45 50 45 38 43 47 45 40 Silent Generation 27 23 23 38 33 20 36 23 37 26 26 22 34 G.I. Generation 8 7 10 11 3 13 - 8 10 9 8 9 4
Page 35

Greenberg Quinlan Rosner Center for Rural Strategies June 14-20, 2004 CORE 2WAY 3WAY VOTE VOTE 2000 Core Total Voter Kerry Bush Kerry Bush Gore Bush Q14 Education ... Total answering (536) (471) (224) (276) (210) (263) (184) (277) 1 - 11th grade 6 5 7 5 6 5 6 5 High School graduate 31 31 33 30 33 29 34 28 Non-college post H.S. 3 3 4 3 4 2 4 3 Some college 25 23 19 29 19 29 18 27 College graduate 24 24 23 24 22 25 22 26 Post-graduate school 11 12 14 10 14 10 15 10 (DK/Ref) 1 1 0 - 1 - 1 1 H.S. or less 37 36 40 34 40 34 40 33 Post H.S. 28 26 23 32 23 31 22 30 College graduate 35 37 37 34 37 35 38 36 Gender Education ... Total answering (536) (471) (224) (276) (210) (263) (184) (277) Non Coll Men 28 26 25 32 23 32 22 29 Coll Men 18 20 19 18 19 19 17 20 Non Coll Women 37 37 38 34 39 33 40 34 Coll Women 16 17 18 16 18 16 20 16 Age Education ... Total answering (536) (471) (224) (276) (210) (263) (184) (277) Young Non Coll 27 23 26 29 26 29 19 27 Young College 15 16 16 15 16 16 16 17 Older Non Coll 37 39 36 36 36 36 43 36 Older College 19 20 21 19 20 19 21 19 Young Non Coll Men 14 11 11 16 11 16 8 13 Older Non Coll Men 15 15 13 16 12 16 14 16 Young Non Coll Women 14 12 15 13 15 13 11 13 Older Non Coll Women 22 24 23 20 24 19 29 20
Page 36

June 14-20, 2004 Center for Rural Strategies Greenberg Quinlan Rosner PARTY ID PARTY/IDEO IDEOLOGY DIRECTION Mod Ind Lib Lib Cons No Mod Cons Total Dem Ind Rep Dem Dem lean Rep Rep Lib Mod Cons Right Wrong Q14 Education ... Total answering (536) (185) (152) (198) (78) (142) (52) (92) (159) (97) (202) (219) (232) (259) 1 - 11th grade 6 5 7 6 5 4 8 5 7 7 3 7 4 6 High School graduate 31 35 30 29 22 39 33 27 29 25 31 34 28 34 Non-college post H.S. 3 3 3 3 6 1 - 5 3 5 3 2 2 4 Some college 25 23 24 28 24 21 31 25 27 25 26 24 28 23 College graduate 24 22 24 25 22 25 21 26 23 22 27 21 28 21 Post-graduate school 11 11 11 11 21 8 8 10 11 16 9 11 10 12 (DK/Ref) 1 1 1 - - 1 - 1 - - 1 0 - 1 H.S. or less 37 41 36 34 27 43 40 33 36 32 34 41 32 40 Post H.S. 28 26 27 30 31 23 31 30 30 30 29 26 30 27 College graduate 35 33 36 35 42 33 29 36 35 38 36 32 38 33 Gender Education ... Total answering (536) (185) (152) (198) (78) (142) (52) (92) (159) (97) (202) (219) (232) (259) Non Coll Men 28 26 35 25 23 28 37 26 28 25 27 30 32 24 Coll Men 18 12 26 18 21 14 19 23 19 21 18 18 21 17 Non Coll Women 37 40 28 40 35 37 35 37 37 37 36 37 30 42 Coll Women 16 21 10 17 22 19 10 13 16 18 18 14 17 16 Age Education ... Total answering (536) (185) (152) (198) (78) (142) (52) (92) (159) (97) (202) (219) (232) (259) Young Non Coll 27 27 25 29 23 28 29 29 27 25 29 27 29 26 Young College 15 15 11 18 19 13 2 18 18 15 17 14 17 14 Older Non Coll 37 39 37 34 35 37 38 33 38 36 33 40 32 40 Older College 19 17 24 18 22 20 27 16 17 22 19 18 21 19 Young Non Coll Men 14 14 17 11 10 15 21 14 11 12 15 13 16 10 Older Non Coll Men 15 13 18 14 13 13 15 12 18 12 12 17 16 14 Young Non Coll Women 14 14 8 18 13 13 8 15 16 12 14 14 13 16 Older Non Coll Women 22 26 19 21 22 25 23 21 20 24 21 23 16 25
Page 37

Greenberg Quinlan Rosner Center for Rural Strategies June 14-20, 2004 GENDER AGE GENERATIONS GENDER/AGE 18 - 30 - 40 - 50 - Over Sil Young Young Older Older Total Men Women 29 39 49 64 64 Gen X Boom ent Women Men Women Men Q14 Education ... Total answering (536) (251) (285) (65) (62) (102) (176) (124) (61) (237) (146) (109) (120) (170) (130) 1 - 11th grade 6 7 5 3 - 4 6 10 - 5 6 2 3 6 10 High School graduate 31 28 34 38 24 32 30 31 26 30 36 33 31 34 26 Non-college post H.S. 3 3 3 3 3 2 3 3 5 3 3 2 3 4 3 Some college 25 22 27 32 26 24 23 24 23 25 21 30 23 26 21 College graduate 24 25 22 15 29 25 26 21 26 25 24 22 25 22 25 Post-graduate school 11 14 9 6 18 12 11 10 18 12 10 11 13 8 15 (DK/Ref) 1 1 0 2 - 1 - - 2 0 - - 2 - - H.S. or less 37 35 39 42 24 36 36 42 26 34 42 35 34 41 36 Post H.S. 28 25 30 35 29 25 27 27 28 28 25 32 27 29 24 College graduate 35 39 31 22 47 37 37 31 44 38 34 33 38 30 40 Gender Education ... Total answering (536) (251) (285) (65) (62) (102) (176) (124) (61) (237) (146) (109) (120) (170) (130) Non Coll Men 28 60 - 34 27 33 26 26 28 31 25 - 61 - 60 Coll Men 18 39 - 11 27 21 19 15 26 20 18 - 38 - 40 Non Coll Women 37 - 69 43 26 28 37 44 26 31 41 67 - 70 - Coll Women 16 - 31 11 19 17 18 16 18 18 16 33 - 30 - Age Education ... Total answering (536) (251) (285) (65) (62) (102) (176) (124) (61) (237) (146) (109) (120) (170) (130) Young Non Coll 27 29 26 77 53 62 - - 54 32 - 67 61 - - Young College 15 18 13 22 47 37 - - 44 20 - 33 38 - - Older Non Coll 37 31 42 - - - 63 69 - 30 66 - - 70 60 Older College 19 21 18 - - - 37 31 - 18 34 - - 30 40 Young Non Coll Men 14 29 - 34 27 33 - - 28 17 - - 61 - - Older Non Coll Men 15 31 - - - - 26 26 - 14 25 - - - 60 Young Non Coll Women 14 - 26 43 26 28 - - 26 15 - 67 - - - Older Non Coll Women 22 - 42 - - - 37 44 - 16 41 - - 70 -
Page 38

June 14-20, 2004 Center for Rural Strategies Greenberg Quinlan Rosner EDUCATION GENDER/EDUC AGE/EDUC NON COLL H.S. No No Young Older or Post Coll Coll Coll Coll Coll No Young No Older Young Older Young Older Total less H.S. grad Men Men Women Women Coll Coll Coll Coll Women Women Men Men Q14 Education ... Total answering (536) (198) (149) (186) (98) (151) (88) (196) (146) (81) (197) (103) (73) (119) (73) (78) 1 - 11th grade 6 16 - - - 11 - 7 4 - 12 - 3 9 5 17 High School graduate 31 84 - - - 47 - 49 50 - 47 - 49 49 51 44 Non-college post H.S. 3 - 11 - - 5 - 4 4 - 5 - 3 5 5 5 Some college 25 - 89 - - 36 - 40 42 - 36 - 45 37 38 35 College graduate 24 - - 68 65 - 72 - - 67 - 69 - - - - Post-graduate school 11 - - 32 35 - 28 - - 33 - 31 - - - - (DK/Ref) 1 - - - - - - - - - - - - - - - H.S. or less 37 100 - - - 58 - 56 54 - 59 - 52 58 56 60 Post H.S. 28 - 100 - - 42 - 44 46 - 41 - 48 42 44 40 College graduate 35 - - 100 100 - 100 - - 100 - 100 - - - - Gender Education ... Total answering (536) (198) (149) (186) (98) (151) (88) (196) (146) (81) (197) (103) (73) (119) (73) (78) Non Coll Men 28 44 42 - - 100 - - 50 - 40 - - - 100 100 Coll Men 18 - - 53 100 - - - - 56 - 50 - - - - Non Coll Women 37 56 58 - - - - 100 50 - 60 - 100 100 - - Coll Women 16 - - 47 - - 100 - - 44 - 50 - - - - Age Education ... Total answering (536) (198) (149) (186) (98) (151) (88) (196) (146) (81) (197) (103) (73) (119) (73) (78) Young Non Coll 27 40 45 - - 48 - 37 100 - - - 100 - 100 - Young College 15 - - 44 46 - 41 - - 100 - - - - - - Older Non Coll 37 59 54 - - 52 - 61 - - 100 - - 100 - 100 Older College 19 - - 55 53 - 58 - - - - 100 - - - - Young Non Coll Men 14 21 21 - - 48 - - 50 - - - - - 100 - Older Non Coll Men 15 24 21 - - 52 - - - - 40 - - - - 100 Young Non Coll Women 14 19 23 - - - - 37 50 - - - 100 - - - Older Non Coll Women 22 35 34 - - - - 61 - - 60 - - 100 - -
Page 39

Greenberg Quinlan Rosner Center for Rural Strategies June 14-20, 2004 MARITAL MARITAL/GENDER GUNS Sep SepDv Marr Sin Div Marr Unmar Marr Widow Unmar 3 or Total ied gle Widow Men Men Women Women Women None 1-2 more Q14 Education ... Total answering (536) (357) (70) (107) (184) (67) (173) (78) (110) (276) (75) (135) 1 - 11th grade 6 4 4 14 7 7 1 15 12 8 5 3 High School graduate 31 31 36 30 29 27 33 29 35 29 28 37 Non-college post H.S. 3 3 3 3 4 1 2 4 4 2 3 5 Some college 25 26 24 21 23 19 29 24 25 24 31 22 College graduate 24 25 21 21 25 27 25 22 18 25 21 22 Post-graduate school 11 12 9 10 13 15 10 5 6 12 12 10 (DK/Ref) 1 - 3 - - 3 - - - 0 - - H.S. or less 37 34 40 44 35 34 34 45 47 37 33 40 Post H.S. 28 29 27 24 27 21 31 28 28 25 33 27 College graduate 35 37 30 32 38 42 35 27 25 37 33 33 Gender Education ... Total answering (536) (357) (70) (107) (184) (67) (173) (78) (110) (276) (75) (135) Non Coll Men 28 32 30 15 62 55 - - - 16 27 50 Coll Men 18 20 21 12 38 42 - - - 15 21 22 Non Coll Women 37 31 37 53 - - 65 73 75 47 40 17 Coll Women 16 17 9 20 - - 35 27 25 22 12 10 Age Education ... Total answering (536) (357) (70) (107) (184) (67) (173) (78) (110) (276) (75) (135) Young Non Coll 27 27 54 10 30 27 24 12 28 26 27 33 Young College 15 17 20 7 16 24 17 3 5 14 16 18 Older Non Coll 37 36 13 56 32 28 40 59 45 36 39 34 Older College 19 20 9 24 22 16 17 24 19 22 17 15 Young Non Coll Men 14 15 23 2 30 27 - - - 7 13 26 Older Non Coll Men 15 17 7 13 32 28 - - - 9 13 24 Young Non Coll Women 14 11 31 8 - - 24 12 28 19 13 7 Older Non Coll Women 22 19 6 43 - - 40 59 45 28 25 10
Page 40

June 14-20, 2004 Center for Rural Strategies Greenberg Quinlan Rosner RELIGION INCOME CONG DIST Devt Main Irreg Dev $30K $50K $75K Evan line Main Cath out Under to to or Safe Safe Total gelcl Prot line olic Cthlc $30K $50K $75K more Dem Rep Swing Q14 Education ... Total answering (536) (77) (143) (104) (111) (51) (143) (118) (109) (77) (205) (233) (98) 1 - 11th grade 6 6 6 5 7 6 15 2 1 - 4 6 10 High School graduate 31 35 25 30 31 25 39 32 30 17 33 33 21 Non-college post H.S. 3 3 5 4 4 2 5 3 3 - 3 3 2 Some college 25 23 27 29 28 31 20 33 21 23 24 24 28 College graduate 24 25 24 24 21 24 15 19 28 36 25 21 26 Post-graduate school 11 8 13 9 10 12 5 11 17 22 8 12 13 (DK/Ref) 1 - - - - - 1 - - 1 1 - - H.S. or less 37 42 31 35 38 31 54 34 31 17 37 39 32 Post H.S. 28 26 32 33 32 33 25 36 24 23 28 27 30 College graduate 35 32 37 33 31 35 20 31 45 58 34 34 39 Gender Education ... Total answering (536) (77) (143) (104) (111) (51) (143) (118) (109) (77) (205) (233) (98) Non Coll Men 28 27 26 28 34 29 29 34 29 22 28 30 23 Coll Men 18 13 17 15 18 27 8 19 23 35 16 20 19 Non Coll Women 37 40 37 39 35 35 50 36 26 18 37 36 38 Coll Women 16 19 20 17 13 8 12 11 22 23 18 14 19 Age Education ... Total answering (536) (77) (143) (104) (111) (51) (143) (118) (109) (77) (205) (233) (98) Young Non Coll 27 23 24 30 30 33 29 35 27 25 25 31 23 Young College 15 13 15 11 14 16 7 14 23 26 12 16 20 Older Non Coll 37 43 38 38 40 31 49 35 28 14 39 35 37 Older College 19 19 22 22 16 20 13 16 22 32 21 18 18 Young Non Coll Men 14 10 12 15 16 16 11 19 15 14 12 16 10 Older Non Coll Men 15 17 14 13 18 14 17 15 15 8 16 14 13 Young Non Coll Women 14 13 13 14 14 18 17 16 12 10 13 15 13 Older Non Coll Women 22 26 24 25 22 18 31 19 14 6 23 21 23
Page 41

Greenberg Quinlan Rosner Center for Rural Strategies June 14-20, 2004 REGION REGION COLL NCEC REGION East West Indus Sun North North Deep Mntn Paci North Cent trial belt Total Cntrl Cntrl South State fic east ral South West Coast Htlnd Grwth Q14 Education ... Total answering (536) (120) (134) (64) (61) (84) (56) (254) (81) (145) (140) (223) (80) 1 - 11th grade 6 3 7 9 7 4 5 5 10 5 4 5 9 High School graduate 31 38 30 30 16 32 32 33 33 26 32 34 19 Non-college post H.S. 3 3 3 5 3 1 4 3 4 2 2 3 5 Some college 25 23 25 23 30 25 27 24 22 27 26 23 30 College graduate 24 21 22 28 26 26 23 21 27 26 25 21 24 Post-graduate school 11 11 13 3 18 12 9 12 2 14 11 13 14 (DK/Ref) 1 1 1 2 - - - 1 1 - - 1 - H.S. or less 37 41 37 39 23 36 38 39 43 30 36 39 28 Post H.S. 28 27 28 28 33 26 30 27 26 29 28 26 35 College graduate 35 32 35 31 44 38 32 33 30 41 36 33 38 Gender Education ... Total answering (536) (120) (134) (64) (61) (84) (56) (254) (81) (145) (140) (223) (80) Non Coll Men 28 27 28 31 20 29 34 28 32 25 31 28 28 Coll Men 18 19 19 13 26 20 11 19 12 23 16 20 23 Non Coll Women 37 41 36 36 36 33 34 38 37 34 34 38 35 Coll Women 16 13 16 19 18 18 21 14 17 18 19 13 15 Age Education ... Total answering (536) (120) (134) (64) (61) (84) (56) (254) (81) (145) (140) (223) (80) Young Non Coll 27 35 24 22 18 30 29 29 25 25 29 30 24 Young College 15 17 16 5 23 14 14 17 6 18 14 16 18 Older Non Coll 37 33 40 44 36 31 39 36 43 33 34 35 38 Older College 19 14 18 27 21 24 18 16 23 23 21 16 20 Young Non Coll Men 14 13 13 17 7 13 18 13 19 10 15 13 14 Older Non Coll Men 15 14 15 14 13 15 16 15 14 14 16 15 14 Young Non Coll Women 14 23 10 5 11 17 11 16 6 14 14 17 10 Older Non Coll Women 22 18 25 30 23 15 23 22 30 19 19 21 24
Page 42

June 14-20, 2004 Center for Rural Strategies Greenberg Quinlan Rosner CORE 2WAY 3WAY VOTE VOTE 2000 Core Total Voter Kerry Bush Kerry Bush Gore Bush Q15 Marital status ... Total answering (536) (471) (224) (276) (210) (263) (184) (277) Married 67 69 61 73 61 73 62 73 Single 13 10 17 9 17 10 13 8 Separated/Divorced 10 10 11 8 11 8 11 9 Widowed 10 11 11 9 11 9 14 9 (DK/Ref) 0 0 - 0 - 0 - 1 Sep/Div/Wid 20 21 22 17 22 17 25 18 Gender Marital status ... Total answering (536) (471) (224) (276) (210) (263) (184) (277) Married Women 32 33 30 34 31 34 33 34 Single Women 6 4 9 4 9 4 7 3 Sep/Div/Wid Women 15 15 17 12 18 11 21 12 Married Men 34 36 31 39 30 39 29 39 Unmarried Men 13 11 13 12 13 12 10 11 Unmarried Women 21 20 26 15 26 15 28 15 Q20 Religious identification ... Total answering (536) (471) (224) (276) (210) (263) (184) (277) Protestant 53 55 48 58 49 59 51 60 Catholic 21 20 22 21 22 20 20 19 Jewish 0 0 0 - 0 - - - (Other/none/Ref) 26 25 30 21 29 21 29 21 Q21 Protestant probe ... Total answering (285) (258) (107) (161) (102) (156) (93) (165) Fundamentalist 12 12 6 17 6 17 4 16 Evangelical 23 24 12 30 13 31 14 30 Charismatic/Pentecostal 10 10 7 12 6 12 3 15 Moderate to liberal 38 39 55 27 56 26 59 26 (Something else) 3 3 3 4 3 4 3 3 (DK/Ref) 14 12 17 11 17 10 16 10 Q22 How often attending services ... Total answering (536) (471) (224) (276) (210) (263) (184) (277) Every week 42 42 31 52 32 52 33 50 Once or twice a month 15 16 17 14 16 15 19 13 Several times a year 12 11 13 12 13 12 10 14 Hardly ever 24 23 32 17 31 16 30 17 (Never) 5 5 6 3 6 3 6 4 (DK/Ref) 2 2 1 2 1 2 2 2 Religion groupings ... Total Answering (536) (471) (224) (276) (210) (263) (184) (277) Devout Evangelical 14 16 6 23 6 24 4 24 Irregular Evangelical 7 7 4 9 4 10 4 9 Devout Mainline 7 8 8 7 8 6 10 7 Irregular Mainline 19 19 25 15 26 15 27 14 Devout Catholic 10 8 9 10 10 10 9 8 Irregular Catholic 8 8 8 10 7 10 7 9 Other/DK 34 34 40 27 39 27 39 28 Total Evangelical 24 25 12 34 12 35 11 36 Total Mainline 29 30 36 24 37 24 40 23 Total Catholic 21 20 22 21 22 20 20 19 Total Other 26 26 30 21 30 21 29 21
Page 43

Greenberg Quinlan Rosner Center for Rural Strategies June 14-20, 2004 PARTY ID PARTY/IDEO IDEOLOGY DIRECTION Mod Ind Lib Lib Cons No Mod Cons Total Dem Ind Rep Dem Dem lean Rep Rep Lib Mod Cons Right Wrong Q15 Marital status ... Total answering (536) (185) (152) (198) (78) (142) (52) (92) (159) (97) (202) (219) (232) (259) Married 67 62 66 71 60 65 65 63 74 60 66 71 72 64 Single 13 15 15 10 17 13 15 17 9 15 16 10 9 15 Separated/Divorced 10 11 11 8 14 8 13 11 7 15 10 7 9 10 Widowed 10 13 7 10 9 13 6 8 9 9 8 11 9 10 (DK/Ref) 0 - 1 1 - - - 1 1 - 0 0 0 - Sep/Div/Wid 20 24 18 18 23 22 19 18 16 25 18 19 18 21 Gender Marital status ... Total answering (536) (185) (152) (198) (78) (142) (52) (92) (159) (97) (202) (219) (232) (259) Married Women 32 34 24 37 29 33 27 29 37 28 34 33 32 34 Single Women 6 7 4 7 9 5 2 10 5 9 6 5 3 9 Sep/Div/Wid Women 15 20 10 13 18 18 15 11 10 18 14 13 12 16 Married Men 34 28 42 34 31 32 38 34 37 32 32 38 40 30 Unmarried Men 13 11 19 9 13 11 17 15 10 13 14 11 13 12 Unmarried Women 21 27 14 20 27 23 17 21 15 27 20 18 15 25 Q20 Religious identification ... Total answering (536) (185) (152) (198) (78) (142) (52) (92) (159) (97) (202) (219) (232) (259) Protestant 53 48 48 62 47 53 40 54 62 47 50 61 55 49 Catholic 21 22 24 17 14 25 35 21 15 14 26 18 21 21 Jewish 0 - - 1 - - - 1 - - 0 - - 0 (Other/none/Ref) 26 30 28 20 38 23 25 24 23 38 24 21 24 29 Q21 Protestant probe ... Total answering (285) (89) (73) (123) (37) (75) (21) (50) (99) (46) (100) (133) (128) (127) Fundamentalist 12 8 8 17 3 9 10 8 20 4 8 18 16 8 Evangelical 23 13 10 37 5 16 14 20 38 7 19 32 30 16 Charismatic/Pentecostal 10 4 14 11 - 5 19 12 14 4 5 15 12 9 Moderate to liberal 38 56 47 20 84 47 43 38 13 76 45 20 27 49 (Something else) 3 2 3 4 - 4 - 2 5 - 3 5 5 2 (DK/Ref) 14 16 19 10 8 19 14 20 9 9 20 11 9 17 Q22 How often attending services ... Total answering (536) (185) (152) (198) (78) (142) (52) (92) (159) (97) (202) (219) (232) (259) Every week 42 34 36 55 28 35 40 30 64 27 31 60 54 32 Once or twice a month 15 18 14 13 13 20 15 15 11 11 19 12 14 17 Several times a year 12 9 14 12 13 10 4 21 11 16 14 9 12 12 Hardly ever 24 31 23 16 38 27 27 26 9 36 28 14 16 30 (Never) 5 5 8 3 6 6 10 3 3 6 5 4 3 7 (DK/Ref) 2 2 4 2 1 2 4 4 1 3 2 2 1 2 Religion groupings ... Total Answering (536) (185) (152) (198) (78) (142) (52) (92) (159) (97) (202) (219) (232) (259) Devout Evangelical 14 6 10 25 4 8 10 5 33 4 5 28 22 8 Irregular Evangelical 7 4 4 12 - 6 4 13 9 2 8 8 8 5 Devout Mainline 7 9 6 7 13 7 6 7 6 11 6 7 6 8 Irregular Mainline 19 23 25 12 29 25 17 21 9 28 24 11 14 22 Devout Catholic 10 8 11 10 5 10 17 5 11 5 8 13 12 8 Irregular Catholic 8 10 10 6 4 11 12 13 3 5 14 4 8 9 Other/DK 34 41 34 28 45 34 35 36 28 44 34 30 31 39 Total Evangelical 24 12 15 41 4 16 17 22 45 7 16 40 32 16 Total Mainline 29 36 33 21 44 37 23 33 17 40 34 21 23 33 Total Catholic 21 22 24 17 14 25 35 21 15 14 26 18 21 21 Total Other 26 30 28 21 38 23 25 25 23 38 25 21 24 30 Page 44

June 14-20, 2004 Center for Rural Strategies Greenberg Quinlan Rosner GENDER AGE GENERATIONS GENDER/AGE 18 - 30 - 40 - 50 - Over Sil Young Young Older Older Total Men Women 29 39 49 64 64 Gen X Boom ent Women Men Women Men Q15 Marital status ... Total answering (536) (251) (285) (65) (62) (102) (176) (124) (61) (237) (146) (109) (120) (170) (130) Married 67 73 61 48 82 72 71 60 82 74 64 65 70 58 77 Single 13 15 11 48 15 14 6 4 16 10 5 24 23 4 7 Separated/Divorced 10 8 11 2 3 15 14 8 2 14 13 9 7 13 10 Widowed 10 3 16 2 - - 9 28 - 2 18 1 - 25 6 (DK/Ref) 0 - 1 2 - - - - - - - 1 - - - Sep/Div/Wid 20 12 27 3 3 15 23 36 2 16 32 10 7 38 16 Gender Marital status ... Total answering (536) (251) (285) (65) (62) (102) (176) (124) (61) (237) (146) (109) (120) (170) (130) Married Women 32 - 61 29 35 29 36 28 38 34 32 65 - 58 - Single Women 6 - 11 22 10 6 2 2 7 4 2 24 - 4 - Sep/Div/Wid Women 15 - 27 2 - 10 16 29 - 10 23 10 - 38 - Married Men 34 73 - 18 47 42 35 31 44 40 32 - 70 - 77 Unmarried Men 13 27 - 28 8 13 11 9 11 11 11 - 30 - 23 Unmarried Women 21 - 39 23 10 16 18 31 7 14 25 34 - 42 - Q20 Religious identification ... Total answering (536) (251) (285) (65) (62) (102) (176) (124) (61) (237) (146) (109) (120) (170) (130) Protestant 53 47 59 37 50 53 55 63 43 50 62 52 43 64 50 Catholic 21 23 19 18 24 22 22 19 25 24 19 20 23 18 24 Jewish 0 0 - - - - - 1 - - - - - - 1 (Other/none/Ref) 26 30 22 45 26 25 23 18 33 26 19 28 34 18 25 Q21 Protestant probe ... Total answering (285) (117) (168) (24) (31) (54) (96) (78) (26) (119) (90) (57) (52) (109) (65) Fundamentalist 12 15 10 8 19 11 9 14 23 10 12 7 19 12 11 Evangelical 23 18 26 13 16 31 20 27 15 24 23 32 13 24 22 Charismatic/Pentecostal 10 9 10 8 13 6 16 4 8 14 7 7 10 11 9 Moderate to liberal 38 47 32 33 35 37 46 33 35 39 42 35 37 31 55 (Something else) 3 3 3 - 6 4 4 1 8 4 2 2 6 4 2 (DK/Ref) 14 8 18 38 10 11 5 21 12 9 13 18 15 18 2 Q22 How often attending services ... Total answering (536) (251) (285) (65) (62) (102) (176) (124) (61) (237) (146) (109) (120) (170) (130) Every week 42 40 45 37 44 39 37 55 43 37 49 44 36 45 44 Once or twice a month 15 12 18 18 13 18 15 12 16 16 13 18 15 18 9 Several times a year 12 16 8 14 13 19 10 8 16 13 10 11 20 6 12 Hardly ever 24 24 23 20 24 21 30 19 18 27 23 23 20 24 28 (Never) 5 6 5 8 5 4 5 4 5 6 3 4 7 5 5 (DK/Ref) 2 3 2 3 2 - 3 2 2 1 3 - 3 2 2 Religion groupings ... Total Answering (536) (251) (285) (65) (62) (102) (176) (124) (61) (237) (146) (109) (120) (170) (130) Devout Evangelical 14 12 16 8 11 16 15 18 11 14 18 15 10 17 15 Irregular Evangelical 7 5 9 3 6 8 7 9 3 8 5 7 5 10 5 Devout Mainline 7 6 8 3 8 8 6 10 7 7 8 8 5 8 8 Irregular Mainline 19 18 21 20 18 18 22 19 15 17 25 19 18 22 18 Devout Catholic 10 12 8 9 16 9 7 11 13 9 10 11 11 6 12 Irregular Catholic 8 9 7 8 6 9 11 5 10 11 6 6 9 8 9 Other/DK 34 38 31 49 34 33 32 27 41 34 27 33 43 28 33 Total Evangelical 24 20 27 11 24 25 24 28 20 24 26 24 18 30 21 Total Mainline 29 27 32 26 26 27 30 35 23 26 36 28 25 34 29 Total Catholic 21 23 19 18 24 22 22 19 25 24 19 20 23 18 24 Total Other 26 30 22 45 26 25 23 19 33 26 19 28 34 18 26
Page 45

Greenberg Quinlan Rosner Center for Rural Strategies June 14-20, 2004 EDUCATION GENDER/EDUC AGE/EDUC NON COLL H.S. No No Young Older or Post Coll Coll Coll Coll Coll No Young No Older Young Older Young Older Total less H.S. grad Men Men Women Women Coll Coll Coll Coll Women Women Men Men Q15 Marital status ... Total answering (536) (198) (149) (186) (98) (151) (88) (196) (146) (81) (197) (103) (73) (119) (73) (78) Married 67 62 69 70 71 75 69 57 66 73 65 69 56 58 75 76 Single 13 14 13 11 15 14 7 13 26 17 5 6 30 3 22 6 Separated/Divorced 10 10 6 13 12 6 15 10 7 10 9 17 11 9 3 9 Widowed 10 14 11 5 1 5 9 19 1 - 21 9 1 29 - 9 (DK/Ref) 0 - 1 - - - - 1 1 - - - 1 - - - Sep/Div/Wid 20 24 17 18 13 11 24 29 8 10 30 25 12 39 3 18 Gender Marital status ... Total answering (536) (198) (149) (186) (98) (151) (88) (196) (146) (81) (197) (103) (73) (119) (73) (78) Married Women 32 29 36 33 - - 69 57 28 37 35 29 56 58 - - Single Women 6 9 6 3 - - 7 13 15 5 2 2 30 3 - - Sep/Div/Wid Women 15 18 15 11 - - 24 29 6 2 23 18 12 39 - - Married Men 34 33 33 38 71 75 - - 38 36 30 40 - - 75 76 Unmarried Men 13 12 9 15 29 25 - - 12 20 10 11 - - 25 24 Unmarried Women 21 26 21 15 - - 31 42 21 7 25 20 42 42 - - Q20 Religious identification ... Total answering (536) (198) (149) (186) (98) (151) (88) (196) (146) (81) (197) (103) (73) (119) (73) (78) Protestant 53 55 54 50 42 49 59 59 47 48 61 52 49 66 44 54 Catholic 21 21 23 18 20 25 16 20 23 20 22 17 21 20 25 26 Jewish 0 1 - - - 1 - - - - 1 - - - - 1 (Other/none/Ref) 26 24 22 32 38 25 25 21 31 32 16 30 30 14 32 19 Q21 Protestant probe ... Total answering (285) (108) (81) (93) (41) (74) (52) (115) (68) (39) (120) (54) (36) (78) (32) (42) Fundamentalist 12 11 14 12 10 18 13 9 16 8 10 15 8 9 25 12 Evangelical 23 27 21 20 20 18 21 29 22 26 26 17 33 27 9 24 Charismatic/Pentecostal 10 17 5 6 7 11 6 12 9 8 13 6 8 13 9 12 Moderate to liberal 38 31 42 45 54 45 38 30 35 38 36 50 31 29 41 48 (Something else) 3 3 1 5 5 3 6 2 1 8 3 4 - 3 3 2 (DK/Ref) 14 12 17 11 5 7 15 19 16 13 13 9 19 19 13 2 Q22 How often attending services ... Total answering (536) (198) (149) (186) (98) (151) (88) (196) (146) (81) (197) (103) (73) (119) (73) (78) Every week 42 38 46 44 44 38 44 44 37 46 45 44 42 45 32 44 Once or twice a month 15 14 13 18 13 11 24 15 14 21 13 16 15 16 14 9 Several times a year 12 11 14 11 16 16 5 10 18 12 9 10 15 7 21 12 Hardly ever 24 28 19 22 18 27 25 22 23 19 26 24 22 24 23 31 (Never) 5 6 5 4 5 6 2 6 7 2 5 5 5 5 8 4 (DK/Ref) 2 2 3 2 3 2 - 3 1 - 3 2 - 3 3 1 Religion groupings ... Total Answering (536) (198) (149) (186) (98) (151) (88) (196) (146) (81) (197) (103) (73) (119) (73) (78) Devout Evangelical 14 16 13 13 10 14 17 16 12 12 17 15 14 17 11 17 Irregular Evangelical 7 10 5 5 4 5 7 10 6 6 9 5 8 11 4 6 Devout Mainline 7 4 8 10 8 5 13 6 3 14 8 8 4 8 1 9 Irregular Mainline 19 18 23 18 16 19 20 21 21 14 20 22 21 22 22 17 Devout Catholic 10 8 11 10 14 10 5 9 12 10 8 10 12 8 11 9 Irregular Catholic 8 9 9 8 4 13 11 6 8 9 10 7 4 7 11 14 Other/DK 34 35 31 35 43 34 27 33 38 36 28 34 37 29 40 28 Total Evangelical 24 30 21 19 15 23 24 29 22 20 29 19 25 32 19 26 Total Mainline 29 25 33 31 27 26 35 30 25 28 31 33 25 34 25 28 Total Catholic 21 21 23 18 20 25 16 20 23 20 22 17 21 20 25 26 Total Other 26 24 22 32 38 26 25 21 31 32 17 30 30 14 32 21 Page 46

June 14-20, 2004 Center for Rural Strategies Greenberg Quinlan Rosner MARITAL MARITAL/GENDER GUNS Sep SepDv Marr Sin Div Marr Unmar Marr Widow Unmar 3 or Total ied gle Widow Men Men Women Women Women None 1-2 more Q15 Marital status ... Total answering (536) (357) (70) (107) (184) (67) (173) (78) (110) (276) (75) (135) Married 67 100 - - 100 - 100 - - 59 67 77 Single 13 - 100 - - 57 - - 29 14 12 13 Separated/Divorced 10 - - 50 - 31 - 41 29 12 12 6 Widowed 10 - - 50 - 12 - 59 42 14 9 4 (DK/Ref) 0 - - - - - - - - 0 - - Sep/Div/Wid 20 - - 100 - 43 - 100 71 26 21 10 Gender Marital status ... Total answering (536) (357) (70) (107) (184) (67) (173) (78) (110) (276) (75) (135) Married Women 32 48 - - - - 100 - - 37 36 20 Single Women 6 - 46 - - - - - 29 9 3 4 Sep/Div/Wid Women 15 - - 73 - - - 100 71 22 13 3 Married Men 34 52 - - 100 - - - - 22 31 57 Unmarried Men 13 - 54 27 - 100 - - - 9 17 16 Unmarried Women 21 - 46 73 - - - 100 100 31 16 7 Q20 Religious identification ... Total answering (536) (357) (70) (107) (184) (67) (173) (78) (110) (276) (75) (135) Protestant 53 51 47 64 46 49 57 65 62 53 53 53 Catholic 21 23 17 16 27 13 18 19 18 20 20 24 Jewish 0 0 - - 1 - - - - - - 1 (Other/none/Ref) 26 26 36 21 27 37 24 15 20 27 27 23 Q21 Protestant probe ... Total answering (285) (183) (33) (68) (84) (33) (99) (51) (68) (145) (40) (71) Fundamentalist 12 14 9 9 15 12 12 8 7 9 18 13 Evangelical 23 27 9 19 20 12 32 20 18 19 28 24 Charismatic/Pentecostal 10 10 9 10 11 6 9 12 12 12 5 11 Moderate to liberal 38 39 30 41 45 52 33 35 31 39 43 39 (Something else) 3 3 3 3 5 - 2 4 4 3 - 4 (DK/Ref) 14 8 39 18 4 18 11 22 28 17 8 8 Q22 How often attending services ... Total answering (536) (357) (70) (107) (184) (67) (173) (78) (110) (276) (75) (135) Every week 42 47 26 36 46 22 49 42 37 45 41 35 Once or twice a month 15 14 20 17 10 18 18 14 18 14 13 19 Several times a year 12 11 13 13 15 19 8 10 9 10 15 16 Hardly ever 24 20 31 30 21 33 20 27 29 24 28 22 (Never) 5 5 4 5 7 1 3 6 6 5 1 7 (DK/Ref) 2 2 6 - 2 6 3 - - 2 1 1 Religion groupings ... Total Answering (536) (357) (70) (107) (184) (67) (173) (78) (110) (276) (75) (135) Devout Evangelical 14 18 4 10 14 7 21 10 8 13 16 13 Irregular Evangelical 7 5 7 12 4 7 7 13 12 6 9 10 Devout Mainline 7 8 3 7 8 1 8 9 8 10 4 4 Irregular Mainline 19 16 27 25 15 25 17 24 26 19 21 21 Devout Catholic 10 11 7 6 14 6 8 8 6 11 12 7 Irregular Catholic 8 9 4 7 10 6 8 8 6 7 5 13 Other/DK 34 32 47 32 35 46 30 28 33 35 32 30 Total Evangelical 24 26 13 24 21 15 31 26 23 21 27 25 Total Mainline 29 25 34 39 24 34 27 40 39 32 27 27 Total Catholic 21 23 17 16 27 13 18 19 18 20 20 24 Total Other 26 26 36 21 28 37 24 15 20 27 27 24
Page 47

Greenberg Quinlan Rosner Center for Rural Strategies June 14-20, 2004 RELIGION INCOME CONG DIST Devt Main Irreg Dev $30K $50K $75K Evan line Main Cath out Under to to or Safe Safe Total gelcl Prot line olic Cthlc $30K $50K $75K more Dem Rep Swing Q15 Marital status ... Total answering (536) (77) (143) (104) (111) (51) (143) (118) (109) (77) (205) (233) (98) Married 67 82 61 56 73 76 41 75 83 83 70 65 63 Single 13 4 15 18 11 10 16 13 11 9 9 16 14 Separated/Divorced 10 3 13 13 9 4 19 9 6 3 9 9 12 Widowed 10 12 12 13 6 8 24 3 1 4 11 9 10 (DK/Ref) 0 - - - 1 2 - - - 1 1 - - Sep/Div/Wid 20 14 24 26 15 12 43 12 6 6 20 19 22 Gender Marital status ... Total answering (536) (77) (143) (104) (111) (51) (143) (118) (109) (77) (205) (233) (98) Married Women 32 48 31 29 29 27 20 36 40 31 36 29 34 Single Women 6 1 8 10 5 2 10 4 4 4 4 9 3 Sep/Div/Wid Women 15 10 18 18 14 12 32 6 4 5 14 12 20 Married Men 34 34 30 27 44 49 21 39 42 52 34 36 30 Unmarried Men 13 6 13 16 8 8 17 14 10 6 11 14 13 Unmarried Women 21 12 27 28 18 14 42 10 7 9 19 21 23 Q20 Religious identification ... Total answering (536) (77) (143) (104) (111) (51) (143) (118) (109) (77) (205) (233) (98) Protestant 53 100 100 100 - - 56 47 57 51 52 55 50 Catholic 21 - - - 100 100 17 24 26 22 22 19 20 Jewish 0 - - - - - - 1 - - - 0 - (Other/none/Ref) 26 - - - - - 27 29 17 27 25 25 30 Q21 Protestant probe ... Total answering (285) (77) (143) (104) (0) (0) (80) (55) (62) (39) (107) (129) (49) Fundamentalist 12 26 - - - - 8 18 15 10 14 12 8 Evangelical 23 52 - - - - 24 18 19 23 21 22 31 Charismatic/Pentecostal 10 22 - - - - 15 13 5 8 8 13 4 Moderate to liberal 38 - 72 72 - - 33 44 48 36 39 35 45 (Something else) 3 - 6 5 - - 3 2 3 8 2 5 - (DK/Ref) 14 - 22 23 - - 19 5 10 15 16 13 12 Q22 How often attending services ... Total answering (536) (77) (143) (104) (111) (51) (143) (118) (109) (77) (205) (233) (98) Every week 42 100 27 - 51 100 40 36 46 44 43 43 39 Once or twice a month 15 - 20 28 20 - 17 14 16 16 15 13 19 Several times a year 12 - 16 22 11 - 10 16 13 8 11 13 11 Hardly ever 24 - 33 45 18 - 23 27 19 27 23 23 26 (Never) 5 - 3 4 - - 7 4 6 5 6 5 3 (DK/Ref) 2 - 1 1 - - 2 3 1 - 2 2 2 Religion groupings ... Total Answering (536) (77) (143) (104) (111) (51) (143) (118) (109) (77) (205) (233) (98) Devout Evangelical 14 100 - - - - 12 13 17 14 15 15 12 Irregular Evangelical 7 - - - - - 9 8 5 5 4 9 7 Devout Mainline 7 - 27 - - - 6 4 10 9 7 7 8 Irregular Mainline 19 - 73 100 - - 20 19 24 16 20 19 19 Devout Catholic 10 - - - 46 100 8 9 14 10 11 10 5 Irregular Catholic 8 - - - 40 - 4 13 11 9 9 6 10 Other/DK 34 - - - 14 - 41 34 19 36 35 33 38 Total Evangelical 24 100 - - - - 26 23 22 21 22 26 21 Total Mainline 29 - 100 100 - - 30 24 35 30 30 30 29 Total Catholic 21 - - - 100 100 17 24 26 22 22 19 20 Total Other 26 - - - - - 27 30 17 27 25 25 30 Page 48

June 14-20, 2004 Center for Rural Strategies Greenberg Quinlan Rosner REGION REGION COLL NCEC REGION East West Indus Sun North North Deep Mntn Paci North Cent trial belt Total Cntrl Cntrl South State fic east ral South West Coast Htlnd Grwth Q15 Marital status ... Total answering (536) (120) (134) (64) (61) (84) (56) (254) (81) (145) (140) (223) (80) Married 67 68 67 64 62 65 70 68 65 64 67 68 61 Single 13 13 13 8 20 14 11 13 9 17 13 13 18 Separated/Divorced 10 7 10 11 8 14 13 8 10 12 14 8 8 Widowed 10 12 10 17 8 6 7 11 16 7 6 11 13 (DK/Ref) 0 1 - - 2 - - 0 - 1 - 0 1 Sep/Div/Wid 20 18 19 28 16 20 20 19 26 19 20 18 20 Gender Marital status ... Total answering (536) (120) (134) (64) (61) (84) (56) (254) (81) (145) (140) (223) (80) Married Women 32 33 34 31 31 27 36 33 32 29 31 33 26 Single Women 6 8 3 2 8 11 4 6 2 10 8 6 6 Sep/Div/Wid Women 15 12 15 22 13 13 16 13 20 13 14 12 16 Married Men 34 35 34 33 31 38 34 34 33 35 36 35 35 Unmarried Men 13 11 15 13 15 11 11 13 12 12 11 13 15 Unmarried Women 21 20 18 23 21 24 20 19 22 23 22 18 23 Q20 Religious identification ... Total answering (536) (120) (134) (64) (61) (84) (56) (254) (81) (145) (140) (223) (80) Protestant 53 53 56 73 26 46 61 54 72 38 52 51 36 Catholic 21 29 24 8 25 13 21 26 7 18 16 29 21 Jewish 0 - - - - 1 - - - 1 1 - - (Other/none/Ref) 26 18 20 19 49 39 18 19 21 43 31 20 43 Q21 Protestant probe ... Total answering (285) (63) (75) (47) (16) (39) (34) (138) (58) (55) (73) (114) (29) Fundamentalist 12 5 13 17 19 13 6 9 19 15 10 9 14 Evangelical 23 24 24 13 38 23 29 24 12 27 26 23 24 Charismatic/Pentecostal 10 16 7 6 - 10 9 11 10 7 10 12 3 Moderate to liberal 38 41 41 40 25 33 38 41 38 31 36 40 34 (Something else) 3 - 1 6 - 10 3 1 5 7 7 1 7 (DK/Ref) 14 14 13 17 19 10 15 14 16 13 12 15 17 Q22 How often attending services ... Total answering (536) (120) (134) (64) (61) (84) (56) (254) (81) (145) (140) (223) (80) Every week 42 50 42 53 43 27 38 46 51 34 31 46 40 Once or twice a month 15 15 22 14 15 7 16 19 11 10 11 19 15 Several times a year 12 10 12 16 13 13 7 11 15 13 11 10 16 Hardly ever 24 20 21 9 21 39 29 20 15 32 35 20 20 (Never) 5 3 3 5 5 10 7 3 6 8 9 3 6 (DK/Ref) 2 3 - 3 3 4 4 1 2 3 4 1 3 Religion groupings ... Total Answering (536) (120) (134) (64) (61) (84) (56) (254) (81) (145) (140) (223) (80) Devout Evangelical 14 15 15 19 5 11 18 15 21 8 14 14 8 Irregular Evangelical 7 8 7 3 7 7 7 7 5 7 7 7 5 Devout Mainline 7 8 8 14 - 6 9 8 11 3 7 7 - Irregular Mainline 19 21 21 25 8 15 23 21 25 12 19 20 19 Devout Catholic 10 17 13 5 5 2 11 15 4 3 6 16 5 Irregular Catholic 8 12 10 2 5 7 9 11 2 6 8 12 4 Other/DK 34 21 25 33 70 51 23 23 32 59 40 24 60 Total Evangelical 24 23 25 27 15 21 27 24 30 19 24 22 15 Total Mainline 29 29 31 47 11 25 34 30 42 19 29 29 21 Total Catholic 21 29 24 8 25 13 21 26 7 18 16 29 21 Total Other 26 18 20 19 49 40 18 19 21 44 31 20 43
Page 49

Greenberg Quinlan Rosner Center for Rural Strategies June 14-20, 2004 CORE 2WAY 3WAY VOTE VOTE 2000 Core Total Voter Kerry Bush Kerry Bush Gore Bush Q23 Candidate voted for in 2000 ... Total answering (501) (471) (209) (260) (198) (247) (184) (277) Gore 37 37 81 3 83 3 100 - Bush 55 56 12 93 12 95 - 100 Nader 3 3 4 1 2 0 - - (Other candidate) 1 1 0 1 1 1 - - (DK/Ref) 4 3 2 2 3 1 - - Gore - Bush -19 -19 68 -90 71 -92 100 -100 Q25 Number of guns owned ... Total answering (536) (471) (224) (276) (210) (263) (184) (277) None 51 51 63 43 61 44 63 43 1-2 14 13 15 13 16 13 15 13 3-9 18 19 13 23 14 23 13 23 10 or more 7 7 5 8 5 8 5 8 (DK/Ref) 9 10 4 12 4 11 5 12 Q26 Racial/ethnic group ... Total answering (536) (471) (224) (276) (210) (263) (184) (277) White 89 89 88 92 89 92 88 91 African-American 1 1 2 - 2 - 3 0 Hispanic or Latino 4 4 6 3 5 3 5 3 Native American 1 1 1 1 1 1 1 1 Asian 0 0 1 - 1 - 1 - (Other) 3 3 3 3 2 3 3 3 (DK/Ref) 1 1 - 2 - 2 - 2 Race Gender ... Total answering (536) (471) (224) (276) (210) (263) (184) (277) White Men 42 41 38 47 37 46 34 46 White Women 47 48 50 45 51 45 54 45 Black Men 1 1 0 - 1 - 1 - Black Women 1 1 1 - 1 - 2 0 Hispanic Men 2 2 3 1 2 2 2 2 Hispanic Women 2 2 3 1 2 1 3 1 Race Age ... Total answering (536) (471) (224) (276) (210) (263) (184) (277) White 18-39 22 18 22 23 22 23 18 20 White 40-49 17 17 15 18 16 17 14 19 White 50-64 29 31 29 30 29 30 33 30 White 65+ 21 23 21 20 21 21 23 21 Black 18-39 0 0 0 - 1 - 1 - Black 40-49 0 0 0 - 0 - - 0 Black 65+ 1 1 1 - 1 - 2 - Hispanic 18-39 1 1 2 1 1 1 1 1 Hispanic 40-49 1 1 2 1 1 1 1 1 Hispanic 50-64 2 2 2 1 1 1 3 1 Hispanic 65+ 0 0 0 - 0 - 1 -
Page 50

June 14-20, 2004 Center for Rural Strategies Greenberg Quinlan Rosner PARTY ID PARTY/IDEO IDEOLOGY DIRECTION Mod Ind Lib Lib Cons No Mod Cons Total Dem Ind Rep Dem Dem lean Rep Rep Lib Mod Cons Right Wrong Q23 Candidate voted for in 2000 ... Total answering (501) (175) (139) (186) (74) (136) (46) (82) (152) (89) (188) (208) (219) (240) Gore 37 78 29 4 86 71 22 7 1 73 44 14 5 67 Bush 55 15 55 94 7 21 52 85 97 17 47 81 89 25 Nader 3 3 4 2 4 4 4 4 1 7 3 1 1 5 (Other candidate) 1 1 3 - - - 4 1 1 1 1 0 1 1 (DK/Ref) 4 3 9 1 3 4 17 2 1 2 5 3 4 3 Gore - Bush -19 63 -27 -90 80 50 -30 -78 -95 56 -3 -66 -84 43 Q25 Number of guns owned ... Total answering (536) (185) (152) (198) (78) (142) (52) (92) (159) (97) (202) (219) (232) (259) None 51 60 46 48 65 54 56 46 45 64 50 48 44 59 1-2 14 17 11 14 15 16 8 15 13 14 17 12 13 16 3-9 18 13 21 20 12 15 15 22 21 14 18 19 24 14 10 or more 7 6 10 6 5 8 8 12 4 4 9 6 8 5 (DK/Ref) 9 4 12 13 3 6 13 5 16 3 5 14 12 6 Q26 Racial/ethnic group ... Total answering (536) (185) (152) (198) (78) (142) (52) (92) (159) (97) (202) (219) (232) (259) White 89 88 88 91 91 86 83 86 94 91 87 89 91 88 African-American 1 3 1 1 1 3 2 1 - 1 1 1 0 2 Hispanic or Latino 4 5 5 4 5 5 8 4 3 4 6 3 3 5 Native American 1 1 1 1 - 1 2 2 1 1 1 1 1 2 Asian 0 1 - - - 1 - - - - 0 0 0 0 (Other) 3 2 4 2 3 4 2 3 2 3 1 4 3 3 (DK/Ref) 1 - 2 2 - - 4 3 1 - 2 1 2 1 Race Gender ... Total answering (536) (185) (152) (198) (78) (142) (52) (92) (159) (97) (202) (219) (232) (259) White Men 42 35 53 40 40 36 46 42 45 42 39 43 47 36 White Women 47 54 35 51 51 50 37 43 48 48 48 46 43 51 Black Men 1 1 1 - - 1 2 - - - - 1 0 1 Black Women 1 2 - 1 1 1 - 1 - 1 1 - - 1 Hispanic Men 2 2 4 2 1 3 6 2 1 1 4 1 2 2 Hispanic Women 2 3 1 2 4 2 2 2 1 3 2 2 1 3 Race Age ... Total answering (536) (185) (152) (198) (78) (142) (52) (92) (159) (97) (202) (219) (232) (259) White 18-39 22 24 16 24 23 23 12 25 22 23 25 19 25 22 White 40-49 17 16 14 19 17 15 12 16 21 15 16 19 18 15 White 50-64 29 28 39 22 31 27 48 26 26 31 30 27 28 31 White 65+ 21 21 16 24 19 21 10 16 25 20 16 24 19 20 Black 18-39 0 1 - - - 1 - - - - - 1 - 1 Black 40-49 0 - 1 1 - - 2 1 - - 0 0 0 0 Black 65+ 1 2 - - 1 1 - - - 1 1 - - 1 Hispanic 18-39 1 1 1 1 1 1 2 3 - 1 2 - 1 1 Hispanic 40-49 1 1 2 1 - 3 2 - 1 - 2 1 1 2 Hispanic 50-64 2 2 1 2 3 1 4 1 1 2 1 1 1 2 Hispanic 65+ 0 1 - 1 1 - - - 1 1 - 0 - 0
Page 51

Greenberg Quinlan Rosner Center for Rural Strategies June 14-20, 2004 GENDER AGE GENERATIONS GENDER/AGE 18 - 30 - 40 - 50 - Over Sil Young Young Older Older Total Men Women 29 39 49 64 64 Gen X Boom ent Women Men Women Men Q23 Candidate voted for in 2000 ... Total answering (501) (235) (266) (42) (59) (100) (173) (120) (57) (230) (144) (95) (106) (165) (128) Gore 37 31 42 36 36 29 39 42 30 34 42 37 28 45 34 Bush 55 59 52 52 64 62 54 48 63 58 52 58 63 49 55 Nader 3 3 2 7 - 2 2 3 5 2 3 2 3 2 4 (Other candidate) 1 1 1 - - - 1 2 - 1 1 - - 1 2 (DK/Ref) 4 6 3 5 - 7 3 5 2 4 2 3 6 3 5 Gore - Bush -19 -28 -11 -17 -29 -33 -15 -7 -33 -24 -10 -21 -35 -4 -22 Q25 Number of guns owned ... Total answering (536) (251) (285) (65) (62) (102) (176) (124) (61) (237) (146) (109) (120) (170) (130) None 51 35 66 62 44 45 49 60 52 45 56 69 32 66 38 1-2 14 14 14 12 15 15 11 18 13 12 16 13 15 14 14 3-9 18 28 9 17 21 18 23 12 18 21 17 8 28 10 29 10 or more 7 11 4 5 16 14 5 2 11 10 5 7 16 2 6 (DK/Ref) 9 12 7 5 5 9 11 9 5 12 6 3 10 8 13 Q26 Racial/ethnic group ... Total answering (536) (251) (285) (65) (62) (102) (176) (124) (61) (237) (146) (109) (120) (170) (130) White 89 89 89 92 92 88 88 89 92 89 89 94 88 87 90 African-American 1 1 1 2 2 2 - 2 3 1 2 1 3 2 - Hispanic or Latino 4 5 4 5 5 6 5 2 5 5 3 4 7 4 3 Native American 1 1 1 - - 2 1 2 - 2 1 1 1 2 1 Asian 0 - 1 - - - 1 1 - - 1 - - 1 - (Other) 3 4 1 - 2 1 4 4 - 2 4 - 2 2 6 (DK/Ref) 1 0 2 2 - 1 1 1 - 1 - 1 1 2 - Race Gender ... Total answering (536) (251) (285) (65) (62) (102) (176) (124) (61) (237) (146) (109) (120) (170) (130) White Men 42 89 - 40 48 48 40 37 49 46 40 - 88 - 90 White Women 47 - 89 52 44 40 48 52 43 43 49 94 - 87 - Black Men 1 1 - 2 2 1 - - 3 0 - - 3 - - Black Women 1 - 1 - - 1 - 2 - 0 2 1 - 2 - Hispanic Men 2 5 - 3 3 4 2 - 3 3 1 - 7 - 3 Hispanic Women 2 - 4 2 2 2 3 2 2 3 2 4 - 4 - Race Age ... Total answering (536) (251) (285) (65) (62) (102) (176) (124) (61) (237) (146) (109) (120) (170) (130) White 18-39 22 22 21 92 92 - - - 92 9 - 56 47 - - White 40-49 17 20 14 - - 88 - - - 38 - 38 41 - - White 50-64 29 28 29 - - - 88 - - 41 39 - - 49 55 White 65+ 21 18 22 - - - - 89 - - 50 - - 38 35 Black 18-39 0 1 - 2 2 - - - 3 - - - 2 - - Black 40-49 0 0 0 - - 2 - - - 1 - 1 1 - - Black 65+ 1 - 1 - - - - 2 - - 2 - - 2 - Hispanic 18-39 1 2 1 5 5 - - - 5 - - 2 3 - - Hispanic 40-49 1 2 1 - - 6 - - - 3 - 2 3 - - Hispanic 50-64 2 2 2 - - - 5 - - 3 1 - - 3 3 Hispanic 65+ 0 - 1 - - - - 2 - - 1 - - 1 -
Page 52

June 14-20, 2004 Center for Rural Strategies Greenberg Quinlan Rosner EDUCATION GENDER/EDUC AGE/EDUC NON COLL H.S. No No Young Older or Post Coll Coll Coll Coll Coll No Young No Older Young Older Young Older Total less H.S. grad Men Men Women Women Coll Coll Coll Coll Women Women Men Men Q23 Candidate voted for in 2000 ... Total answering (501) (182) (135) (181) (97) (136) (84) (181) (119) (80) (194) (99) (60) (117) (59) (77) Gore 37 40 30 38 33 29 44 41 29 36 41 39 33 46 25 32 Bush 55 50 62 55 58 60 52 52 62 59 51 54 62 47 63 57 Nader 3 2 3 3 5 2 1 3 2 4 3 3 2 3 2 3 (Other candidate) 1 1 1 1 2 1 - 1 - - 1 2 - 1 - 1 (DK/Ref) 4 7 4 2 2 8 2 3 7 1 5 2 3 3 10 6 Gore - Bush -19 -10 -32 -17 -25 -30 -8 -11 -33 -23 -10 -14 -28 -1 -37 -25 Q25 Number of guns owned ... Total answering (536) (198) (149) (186) (98) (151) (88) (196) (146) (81) (197) (103) (73) (119) (73) (78) None 51 52 47 55 43 29 68 66 49 49 51 59 71 64 27 31 1-2 14 13 17 13 16 13 10 15 14 15 15 13 14 16 14 13 3-9 18 19 19 17 23 32 10 9 17 21 20 15 7 10 27 36 10 or more 7 9 6 6 7 13 6 3 14 9 3 5 7 1 21 6 (DK/Ref) 9 8 11 8 10 13 6 7 6 6 11 9 1 9 11 14 Q26 Racial/ethnic group ... Total answering (536) (198) (149) (186) (98) (151) (88) (196) (146) (81) (197) (103) (73) (119) (73) (78) White 89 86 89 93 91 89 95 87 89 95 87 91 92 84 86 91 African-American 1 3 1 - - 1 - 2 2 - 2 - 1 3 3 - Hispanic or Latino 4 6 5 2 3 5 - 6 6 2 5 1 5 6 7 4 Native American 1 2 2 - - 1 - 2 1 - 2 - 1 3 1 1 Asian 0 - 1 1 - - 1 1 - - 1 1 - 1 - - (Other) 3 3 2 3 5 3 1 2 1 - 3 6 - 3 3 4 (DK/Ref) 1 1 1 2 1 - 2 2 - 2 1 1 - 2 - - Race Gender ... Total answering (536) (198) (149) (186) (98) (151) (88) (196) (146) (81) (197) (103) (73) (119) (73) (78) White Men 42 37 40 48 91 89 - - 43 52 36 45 - - 86 91 White Women 47 49 49 45 - - 95 87 46 43 51 47 92 84 - - Black Men 1 1 - - - 1 - - 1 - - - - - 3 - Black Women 1 2 1 - - - - 2 1 - 2 - 1 3 - - Hispanic Men 2 3 1 2 3 5 - - 3 2 2 1 - - 7 4 Hispanic Women 2 3 3 - - - - 6 3 - 4 - 5 6 - - Race Age ... Total answering (536) (198) (149) (186) (98) (151) (88) (196) (146) (81) (197) (103) (73) (119) (73) (78) White 18-39 22 19 26 22 21 23 22 21 53 49 - - 58 - 48 - White 40-49 17 14 17 20 21 19 18 13 36 46 - - 34 - 38 - White 50-64 29 29 26 32 31 27 34 28 - - 48 58 - 45 - 53 White 65+ 21 23 20 18 16 20 20 23 - - 39 33 - 39 - 38 Black 18-39 0 1 - - - 1 - - 1 - - - - - 1 - Black 40-49 0 1 - - - 1 - 1 1 - - - 1 - 1 - Black 65+ 1 1 1 - - - - 2 - - 2 - - 3 - - Hispanic 18-39 1 2 1 1 2 1 - 1 3 2 - - 3 - 3 - Hispanic 40-49 1 2 1 - - 2 - 1 3 - - - 3 - 4 - Hispanic 50-64 2 2 3 1 1 2 - 3 - - 4 1 - 4 - 4 Hispanic 65+ 0 1 1 - - - - 1 - - 1 - - 2 - -
Page 53

Greenberg Quinlan Rosner Center for Rural Strategies June 14-20, 2004 MARITAL MARITAL/GENDER GUNS Sep SepDv Marr Sin Div Marr Unmar Marr Widow Unmar 3 or Total ied gle Widow Men Men Women Women Women None 1-2 more Q23 Candidate voted for in 2000 ... Total answering (501) (344) (52) (103) (179) (56) (165) (76) (99) (255) (69) (128) Gore 37 33 46 45 30 34 36 50 52 45 39 25 Bush 55 59 44 49 60 55 58 43 42 47 54 68 Nader 3 3 4 2 3 4 2 1 2 4 1 2 (Other candidate) 1 1 - - 2 - 1 - - 1 - 1 (DK/Ref) 4 4 6 5 5 7 2 5 4 3 6 5 Gore - Bush -19 -26 2 -4 -30 -21 -21 7 9 -1 -14 -43 Q25 Number of guns owned ... Total answering (536) (357) (70) (107) (184) (67) (173) (78) (110) (276) (75) (135) None 51 46 57 66 33 39 60 78 77 100 - - 1-2 14 14 13 15 13 19 16 13 11 - 100 - 3-9 18 21 16 10 30 24 12 5 5 - - 72 10 or more 7 8 9 3 12 7 4 - 4 - - 28 (DK/Ref) 9 11 6 6 13 10 9 4 3 - - - Q26 Racial/ethnic group ... Total answering (536) (357) (70) (107) (184) (67) (173) (78) (110) (276) (75) (135) White 89 91 81 88 90 87 92 86 85 90 91 90 African-American 1 1 1 3 1 1 1 4 3 2 - 1 Hispanic or Latino 4 3 11 3 4 6 2 4 6 4 4 5 Native American 1 1 1 1 1 - 1 1 2 0 1 2 Asian 0 - - 2 - - - 3 2 0 1 - (Other) 3 3 1 4 4 4 1 3 2 3 3 1 (DK/Ref) 1 1 3 - - 1 2 - 1 1 - 1 Race Gender ... Total answering (536) (357) (70) (107) (184) (67) (173) (78) (110) (276) (75) (135) White Men 42 46 44 25 90 87 - - - 28 41 66 White Women 47 45 37 63 - - 92 86 85 62 49 24 Black Men 1 1 1 - 1 1 - - - 1 - 1 Black Women 1 0 - 3 - - 1 4 3 1 - - Hispanic Men 2 2 6 - 4 6 - - - 1 4 2 Hispanic Women 2 1 6 3 - - 2 4 6 2 - 3 Race Age ... Total answering (536) (357) (70) (107) (184) (67) (173) (78) (110) (276) (75) (135) White 18-39 22 22 47 4 21 27 24 1 17 23 21 24 White 40-49 17 18 16 13 20 18 16 12 12 15 17 21 White 50-64 29 31 13 34 29 25 32 32 25 28 24 33 White 65+ 21 19 4 36 20 15 19 38 28 24 27 11 Black 18-39 0 0 1 - 1 1 - - - 0 - 1 Black 40-49 0 1 - - 1 - 1 - - 1 - - Black 65+ 1 - - 3 - - - 4 3 1 - - Hispanic 18-39 1 0 7 - 1 4 - - 2 1 1 1 Hispanic 40-49 1 1 3 1 2 1 - 1 2 1 1 1 Hispanic 50-64 2 2 - 2 2 - 2 3 2 1 1 1 Hispanic 65+ 0 0 1 - - - 1 - 1 - - 1
Page 54

June 14-20, 2004 Center for Rural Strategies Greenberg Quinlan Rosner RELIGION INCOME CONG DIST Devt Main Irreg Dev $30K $50K $75K Evan line Main Cath out Under to to or Safe Safe Total gelcl Prot line olic Cthlc $30K $50K $75K more Dem Rep Swing Q23 Candidate voted for in 2000 ... Total answering (501) (76) (135) (96) (99) (44) (135) (106) (106) (72) (194) (216) (91) Gore 37 11 50 52 37 36 43 36 37 33 33 36 46 Bush 55 88 42 40 54 52 44 58 58 64 55 57 52 Nader 3 - 1 1 6 5 4 4 3 1 4 2 2 (Other candidate) 1 - 1 1 - - 1 1 2 - 2 0 - (DK/Ref) 4 1 6 6 3 7 8 2 - 1 6 5 - Gore - Bush -19 -78 8 13 -16 -16 -1 -22 -22 -31 -22 -21 -5 Q25 Number of guns owned ... Total answering (536) (77) (143) (104) (111) (51) (143) (118) (109) (77) (205) (233) (98) None 51 45 55 50 50 57 58 44 60 42 51 49 58 1-2 14 16 13 15 14 18 17 17 9 12 12 18 7 3-9 18 17 17 19 17 16 14 24 20 25 22 15 15 10 or more 7 6 8 9 12 4 4 8 8 14 5 9 7 (DK/Ref) 9 16 7 7 7 6 7 7 3 8 10 8 12 Q26 Racial/ethnic group ... Total answering (536) (77) (143) (104) (111) (51) (143) (118) (109) (77) (205) (233) (98) White 89 100 100 100 86 100 83 94 98 86 87 90 90 African-American 1 - - - - - 5 - - - 3 0 - Hispanic or Latino 4 - - - 13 - 5 3 1 9 4 3 6 Native American 1 - - - 2 - 3 - - 1 0 2 - Asian 0 - - - - - 1 - - - 0 0 - (Other) 3 - - - - - 2 3 1 4 3 2 3 (DK/Ref) 1 - - - - - - - - - 1 1 1 Race Gender ... Total answering (536) (77) (143) (104) (111) (51) (143) (118) (109) (77) (205) (233) (98) White Men 42 40 43 43 47 57 32 47 51 47 39 45 38 White Women 47 60 57 57 39 43 51 47 47 39 48 45 52 Black Men 1 - - - - - 2 - - - 1 - - Black Women 1 - - - - - 3 - - - 1 0 - Hispanic Men 2 - - - 5 - 1 3 - 8 2 2 3 Hispanic Women 2 - - - 8 - 3 - 1 1 2 2 3 Race Age ... Total answering (536) (77) (143) (104) (111) (51) (143) (118) (109) (77) (205) (233) (98) White 18-39 22 16 22 23 23 31 19 27 28 21 21 23 20 White 40-49 17 21 18 17 16 18 11 19 21 25 13 19 19 White 50-64 29 34 34 37 29 24 25 29 35 36 30 28 28 White 65+ 21 29 26 23 18 27 27 19 14 3 22 19 21 Black 18-39 0 - - - - - 1 - - - 1 - - Black 40-49 0 - - - - - 1 - - - 1 - - Black 65+ 1 - - - - - 2 - - - 1 0 - Hispanic 18-39 1 - - - 2 - 1 1 - 3 1 1 1 Hispanic 40-49 1 - - - 3 - 2 1 - 3 1 1 1 Hispanic 50-64 2 - - - 6 - 1 1 1 4 2 - 4 Hispanic 65+ 0 - - - 2 - 1 - - - - 1 -
Page 55

Greenberg Quinlan Rosner Center for Rural Strategies June 14-20, 2004 REGION REGION COLL NCEC REGION East West Indus Sun North North Deep Mntn Paci North Cent trial belt Total Cntrl Cntrl South State fic east ral South West Coast Htlnd Grwth Q23 Candidate voted for in 2000 ... Total answering (501) (112) (127) (59) (59) (75) (52) (239) (76) (134) (127) (209) (77) Gore 37 30 43 36 41 32 42 37 33 36 36 34 36 Bush 55 61 51 51 51 59 54 56 55 55 57 57 52 Nader 3 4 1 2 5 5 2 2 1 5 4 2 4 (Other candidate) 1 1 2 2 - - - 1 3 - - 1 1 (DK/Ref) 4 4 3 10 3 4 2 4 8 4 3 4 6 Gore - Bush -19 -30 -8 -15 -10 -27 -12 -18 -22 -19 -20 -23 -16 Q25 Number of guns owned ... Total answering (536) (120) (134) (64) (61) (84) (56) (254) (81) (145) (140) (223) (80) None 51 53 51 53 51 48 55 52 52 49 51 51 50 1-2 14 14 16 13 8 17 11 15 14 13 14 16 9 3-9 18 19 14 25 25 23 5 17 22 23 16 17 25 10 or more 7 8 7 5 3 5 13 7 7 4 8 8 5 (DK/Ref) 9 6 11 5 13 8 16 9 5 10 11 9 11 Q26 Racial/ethnic group ... Total answering (536) (120) (134) (64) (61) (84) (56) (254) (81) (145) (140) (223) (80) White 89 97 93 80 77 82 93 95 84 80 86 94 79 African-American 1 - - 9 - 1 - - 7 1 1 - 1 Hispanic or Latino 4 1 2 3 18 6 2 2 2 11 4 2 16 Native American 1 1 1 3 - 1 - 1 2 1 1 1 - Asian 0 - - 2 - 1 - - 1 1 1 - - (Other) 3 - 3 2 3 6 4 2 1 5 5 2 3 (DK/Ref) 1 2 - 2 2 2 2 1 1 2 2 1 1 Race Gender ... Total answering (536) (120) (134) (64) (61) (84) (56) (254) (81) (145) (140) (223) (80) White Men 42 44 46 36 36 39 39 45 38 38 39 46 39 White Women 47 53 47 44 41 43 54 50 46 42 47 48 40 Black Men 1 - - 5 - - - - 4 - - - 1 Black Women 1 - - 5 - 1 - - 4 1 1 - - Hispanic Men 2 - 1 3 7 5 2 0 2 6 4 0 8 Hispanic Women 2 1 1 - 11 1 - 1 - 6 1 1 9 Race Age ... Total answering (536) (120) (134) (64) (61) (84) (56) (254) (81) (145) (140) (223) (80) White 18-39 22 29 19 11 18 23 25 24 15 21 24 24 18 White 40-49 17 20 19 9 15 15 16 20 11 15 16 20 14 White 50-64 29 28 34 34 25 21 32 31 31 23 26 30 26 White 65+ 21 19 19 23 18 23 20 19 26 21 21 19 20 Black 18-39 0 - - 3 - - - - 2 - - - - Black 40-49 0 - - 2 - 1 - - 1 1 1 - 1 Black 65+ 1 - - 5 - - - - 4 - - - - Hispanic 18-39 1 1 - 2 5 1 - 0 1 3 1 0 5 Hispanic 40-49 1 - 1 2 2 2 - 1 1 2 1 1 3 Hispanic 50-64 2 - 1 - 8 2 2 0 - 5 2 0 6 Hispanic 65+ 0 - - - 3 - - - - 1 - - 3
Page 56

June 14-20, 2004 Center for Rural Strategies Greenberg Quinlan Rosner CORE 2WAY 3WAY VOTE VOTE 2000 Core Total Voter Kerry Bush Kerry Bush Gore Bush Q28 Income ... Total Answering (536) (471) (224) (276) (210) (263) (184) (277) Less than $10K 5 5 5 4 5 4 7 4 $10K to under $20K 10 10 13 7 12 7 13 6 $20K to under $30K 11 12 12 11 12 11 13 12 $30K to under $50K 22 21 24 21 25 21 21 22 $50K to under $75K 20 22 21 22 21 22 21 22 $75K to under $100K 9 9 9 10 10 11 9 10 $100K or more 5 5 3 7 3 8 4 6 (Ref) 14 15 9 17 9 16 10 17 (DK) 3 1 4 1 4 1 3 1 Less than $30K 27 26 30 22 29 22 32 22 $30K to under $50K 22 21 24 21 25 21 21 22 $50K to under $75K 20 22 21 22 21 22 21 22 $75K or more 14 15 12 17 12 18 13 17 Region ... Total answering (536) (471) (224) (276) (210) (263) (184) (277) New England 5 5 8 4 7 4 7 4 Middle Atlantic 5 5 4 7 5 6 5 6 East North Central 22 23 21 24 20 24 18 25 West North Central 25 25 27 24 27 24 30 23 Deep South 12 12 10 11 10 11 11 11 Border States 3 4 3 4 2 3 2 4 Mountain States 11 12 12 12 12 11 13 11 Pacific 16 14 17 15 16 16 13 16 Northeast 10 10 12 11 12 10 12 10 Central 47 48 48 48 48 48 48 48 South 15 15 13 15 12 15 14 15 West 27 27 28 27 28 27 26 27 Safe/swing district ... Total answering (536) (471) (224) (276) (210) (263) (184) (277) Safe Dem District 38 39 36 38 36 38 35 39 Swing District 18 19 21 16 20 15 23 17 Safe Rep District 43 42 43 46 43 47 42 44 NCEC Region ... Total answering (536) (471) (224) (276) (210) (263) (184) (277) Coast 26 25 28 26 28 26 25 26 Industrial Heartland 42 42 40 43 40 44 39 43 Rural Heartland 9 9 10 8 10 8 11 9 Sunbelt 8 8 8 7 9 7 9 7 Sunbelt Growth 15 16 14 16 13 15 15 14
Page 57

Greenberg Quinlan Rosner Center for Rural Strategies June 14-20, 2004 PARTY ID PARTY/IDEO IDEOLOGY DIRECTION Mod Ind Lib Lib Cons No Mod Cons Total Dem Ind Rep Dem Dem lean Rep Rep Lib Mod Cons Right Wrong Q28 Income ... Total Answering (536) (185) (152) (198) (78) (142) (52) (92) (159) (97) (202) (219) (232) (259) Less than $10K 5 5 7 4 4 5 8 3 6 5 3 6 4 5 $10K to under $20K 10 14 11 7 8 14 15 5 8 7 10 10 8 13 $20K to under $30K 11 13 8 12 14 11 8 12 9 13 10 10 9 12 $30K to under $50K 22 21 27 20 31 19 25 27 18 30 24 18 20 24 $50K to under $75K 20 23 16 21 19 23 17 17 23 19 23 20 23 19 $75K to under $100K 9 9 7 11 9 9 6 12 10 8 10 10 11 9 $100K or more 5 2 5 8 4 4 2 7 8 4 5 6 8 3 (Ref) 14 10 15 16 10 12 13 14 18 11 11 18 16 11 (DK) 3 4 3 2 1 4 6 2 1 2 3 2 1 4 Less than $30K 27 31 26 23 26 30 31 21 23 26 24 26 21 30 $30K to under $50K 22 21 27 20 31 19 25 27 18 30 24 18 20 24 $50K to under $75K 20 23 16 21 19 23 17 17 23 19 23 20 23 19 $75K or more 14 11 13 19 13 13 8 18 18 12 15 16 19 12 Region ... Total answering (536) (185) (152) (198) (78) (142) (52) (92) (159) (97) (202) (219) (232) (259) New England 5 5 7 5 6 7 4 2 5 5 4 6 3 8 Middle Atlantic 5 4 3 8 6 3 2 7 7 6 4 5 5 5 East North Central 22 18 25 25 17 23 15 27 23 18 25 21 25 21 West North Central 25 29 29 19 31 24 40 24 19 29 25 23 23 25 Deep South 12 12 14 10 8 15 19 5 13 10 11 14 13 10 Border States 3 3 2 4 3 4 - 2 4 4 1 4 3 4 Mountain States 11 12 6 15 15 9 6 11 14 13 11 12 13 10 Pacific 16 16 14 16 14 16 13 22 14 14 18 15 16 16 Northeast 10 10 9 12 13 10 6 9 12 11 8 11 8 13 Central 47 46 54 43 47 46 56 51 42 46 50 44 48 46 South 15 16 16 14 10 18 19 8 18 14 12 18 16 14 West 27 28 20 31 29 25 19 33 28 28 29 26 28 27 Safe/swing district ... Total answering (536) (185) (152) (198) (78) (142) (52) (92) (159) (97) (202) (219) (232) (259) Safe Dem District 38 36 40 38 31 41 42 35 40 34 41 38 41 37 Swing District 18 21 16 18 28 18 13 14 18 26 14 19 15 21 Safe Rep District 43 43 44 43 41 42 44 51 42 40 46 43 45 42 NCEC Region ... Total answering (536) (185) (152) (198) (78) (142) (52) (92) (159) (97) (202) (219) (232) (259) Coast 26 25 24 28 27 26 19 30 26 26 27 26 24 29 Industrial Heartland 42 38 50 39 35 40 50 48 38 35 46 39 44 39 Rural Heartland 9 12 6 9 15 10 6 5 8 15 5 9 6 11 Sunbelt 8 9 10 7 5 11 13 3 9 7 8 10 9 9 Sunbelt Growth 15 16 11 18 18 13 12 13 19 16 14 16 17 12
Page 58

June 14-20, 2004 Center for Rural Strategies Greenberg Quinlan Rosner GENDER AGE GENERATIONS GENDER/AGE 18 - 30 - 40 - 50 - Over Sil Young Young Older Older Total Men Women 29 39 49 64 64 Gen X Boom ent Women Men Women Men Q28 Income ... Total Answering (536) (251) (285) (65) (62) (102) (176) (124) (61) (237) (146) (109) (120) (170) (130) Less than $10K 5 2 8 11 - 1 5 8 2 3 8 6 2 9 2 $10K to under $20K 10 11 10 12 3 10 9 15 3 9 11 9 8 9 14 $20K to under $30K 11 8 14 6 15 11 10 15 15 8 15 13 8 15 8 $30K to under $50K 22 25 19 25 29 24 21 19 28 22 24 22 28 18 22 $50K to under $75K 20 23 18 20 29 23 23 12 30 26 16 25 23 15 23 $75K to under $100K 9 11 8 5 13 15 13 1 13 14 3 10 13 7 9 $100K or more 5 7 3 3 8 7 6 2 7 7 3 4 8 2 6 (Ref) 14 11 16 8 3 10 13 25 3 10 18 7 8 21 14 (DK) 3 2 4 11 - 1 1 4 - 1 1 5 3 3 1 Less than $30K 27 22 31 29 18 22 24 38 20 20 34 28 18 34 25 $30K to under $50K 22 25 19 25 29 24 21 19 28 22 24 22 28 18 22 $50K to under $75K 20 23 18 20 29 23 23 12 30 26 16 25 23 15 23 $75K or more 14 18 11 8 21 22 19 2 20 21 6 14 21 9 15 Region ... Total answering (536) (251) (285) (65) (62) (102) (176) (124) (61) (237) (146) (109) (120) (170) (130) New England 5 5 6 3 10 5 5 6 7 5 8 6 6 6 5 Middle Atlantic 5 5 5 3 6 5 7 3 2 7 6 6 3 5 6 East North Central 22 22 23 25 34 25 19 19 31 21 19 35 20 15 23 West North Central 25 26 24 22 19 28 28 22 25 27 21 18 29 28 23 Deep South 12 12 12 11 5 8 15 15 5 10 16 4 12 18 12 Border States 3 3 3 5 3 3 2 5 3 3 4 3 4 4 2 Mountain States 11 11 12 15 6 11 12 11 13 11 14 11 11 12 12 Pacific 16 16 15 17 16 16 13 19 15 16 12 17 15 14 18 Northeast 10 10 11 6 16 10 12 9 8 12 14 12 9 11 11 Central 47 48 47 46 53 53 47 40 56 49 40 53 49 43 46 South 15 15 15 15 8 11 16 20 8 13 21 6 16 21 14 West 27 27 27 32 23 26 24 31 28 27 25 28 26 25 29 Safe/swing district ... Total answering (536) (251) (285) (65) (62) (102) (176) (124) (61) (237) (146) (109) (120) (170) (130) Safe Dem District 38 37 40 31 44 29 41 40 46 36 40 35 33 42 40 Swing District 18 17 20 20 13 22 19 17 15 20 19 19 18 20 15 Safe Rep District 43 47 41 49 44 49 40 43 39 44 40 46 49 38 45 NCEC Region ... Total answering (536) (251) (285) (65) (62) (102) (176) (124) (61) (237) (146) (109) (120) (170) (130) Coast 26 26 26 23 32 25 24 28 23 28 25 29 24 24 28 Industrial Heartland 42 43 40 40 48 47 40 35 51 42 34 48 43 35 42 Rural Heartland 9 8 10 11 8 9 9 10 8 9 10 8 10 11 6 Sunbelt 8 7 10 5 5 4 11 11 3 7 12 3 6 14 8 Sunbelt Growth 15 16 14 22 6 15 15 15 15 14 18 12 17 15 15
Page 59

Greenberg Quinlan Rosner Center for Rural Strategies June 14-20, 2004 EDUCATION GENDER/EDUC AGE/EDUC NON COLL H.S. No No Young Older or Post Coll Coll Coll Coll Coll No Young No Older Young Older Young Older Total less H.S. grad Men Men Women Women Coll Coll Coll Coll Women Women Men Men Q28 Income ... Total Answering (536) (198) (149) (186) (98) (151) (88) (196) (146) (81) (197) (103) (73) (119) (73) (78) Less than $10K 5 7 5 2 1 2 3 10 5 - 8 4 8 11 1 3 $10K to under $20K 10 17 7 6 7 14 5 12 10 7 15 5 10 13 10 18 $20K to under $30K 11 15 11 8 4 11 11 15 14 5 13 10 16 14 11 12 $30K to under $50K 22 20 28 19 23 26 15 21 28 21 21 18 26 19 30 23 $50K to under $75K 20 17 17 26 26 21 27 14 20 31 16 23 18 13 22 21 $75K to under $100K 9 5 9 15 14 9 15 5 9 16 5 14 7 4 11 6 $100K or more 5 2 3 10 13 3 6 2 4 9 1 11 4 - 4 1 (Ref) 14 12 16 14 11 11 17 16 5 11 20 15 4 23 7 15 (DK) 3 5 2 1 - 3 1 5 5 - 3 1 7 3 4 1 Less than $30K 27 39 24 16 12 27 19 37 28 12 36 18 34 38 22 32 $30K to under $50K 22 20 28 19 23 26 15 21 28 21 21 18 26 19 30 23 $50K to under $75K 20 17 17 26 26 21 27 14 20 31 16 23 18 13 22 21 $75K or more 14 7 12 24 28 11 20 7 13 25 6 24 11 4 15 8 Region ... Total answering (536) (198) (149) (186) (98) (151) (88) (196) (146) (81) (197) (103) (73) (119) (73) (78) New England 5 5 7 5 3 7 7 5 8 2 5 7 5 5 10 4 Middle Atlantic 5 6 5 5 3 6 7 5 3 7 7 3 3 6 4 8 East North Central 22 25 21 20 23 21 17 25 29 25 20 17 37 18 21 22 West North Central 25 25 25 25 27 25 24 24 22 27 27 23 19 28 25 26 Deep South 12 13 12 11 8 13 14 12 10 4 14 17 4 16 15 12 Border States 3 5 2 2 2 4 2 4 4 2 4 2 3 4 5 3 Mountain States 11 7 13 15 16 8 13 11 8 17 11 13 10 12 5 10 Pacific 16 15 15 17 17 16 17 14 17 15 13 19 19 11 15 17 Northeast 10 11 11 10 6 13 14 10 11 10 11 10 8 11 14 12 Central 47 49 46 46 50 46 41 49 51 52 47 40 56 46 45 47 South 15 18 14 13 10 17 16 15 14 6 18 18 7 20 21 14 West 27 22 28 32 34 24 30 26 25 32 24 32 29 23 21 27 Safe/swing district ... Total answering (536) (198) (149) (186) (98) (151) (88) (196) (146) (81) (197) (103) (73) (119) (73) (78) Safe Dem District 38 38 38 37 33 38 42 38 35 30 41 42 36 39 34 42 Swing District 18 16 19 20 19 15 22 19 16 25 18 17 18 19 14 17 Safe Rep District 43 46 42 42 48 46 36 43 49 46 41 41 47 41 52 41 NCEC Region ... Total answering (536) (198) (149) (186) (98) (151) (88) (196) (146) (81) (197) (103) (73) (119) (73) (78) Coast 26 26 26 27 23 28 31 24 28 25 24 29 27 22 29 28 Industrial Heartland 42 44 40 40 45 42 34 43 46 44 40 35 51 39 41 42 Rural Heartland 9 10 9 8 7 9 9 10 9 10 10 7 8 12 10 8 Sunbelt 8 9 7 9 6 7 13 9 4 4 10 14 3 12 5 8 Sunbelt Growth 15 11 19 16 18 15 14 14 13 17 15 16 11 16 15 14
Page 60

June 14-20, 2004 Center for Rural Strategies Greenberg Quinlan Rosner MARITAL MARITAL/GENDER GUNS Sep SepDv Marr Sin Div Marr Unmar Marr Widow Unmar 3 or Total ied gle Widow Men Men Women Women Women None 1-2 more Q28 Income ... Total Answering (536) (357) (70) (107) (184) (67) (173) (78) (110) (276) (75) (135) Less than $10K 5 1 13 13 1 4 1 18 18 8 1 2 $10K to under $20K 10 7 11 21 8 21 7 15 15 10 17 7 $20K to under $30K 11 8 9 23 8 10 9 26 22 12 13 10 $30K to under $50K 22 25 21 13 25 25 25 9 11 19 27 28 $50K to under $75K 20 25 17 7 25 16 25 5 7 24 13 23 $75K to under $100K 9 12 6 3 14 3 10 4 5 7 7 16 $100K or more 5 6 4 2 8 4 3 1 2 4 5 6 (Ref) 14 15 9 15 12 9 17 18 15 12 13 7 (DK) 3 1 10 4 - 6 2 4 6 4 3 1 Less than $30K 27 17 33 57 16 36 17 59 55 30 32 19 $30K to under $50K 22 25 21 13 25 25 25 9 11 19 27 28 $50K to under $75K 20 25 17 7 25 16 25 5 7 24 13 23 $75K or more 14 18 10 5 22 7 14 5 6 12 12 22 Region ... Total answering (536) (357) (70) (107) (184) (67) (173) (78) (110) (276) (75) (135) New England 5 6 6 5 5 6 6 5 5 7 3 3 Middle Atlantic 5 5 3 6 5 3 5 6 5 5 5 4 East North Central 22 23 21 21 23 19 23 18 22 23 23 24 West North Central 25 25 26 24 24 30 26 26 22 25 29 21 Deep South 12 11 7 17 11 12 12 18 14 12 11 14 Border States 3 3 3 3 3 3 3 3 3 3 4 4 Mountain States 11 11 17 9 10 13 11 10 12 11 7 13 Pacific 16 15 17 16 17 13 13 14 18 14 19 17 Northeast 10 11 9 10 10 9 12 12 10 11 8 7 Central 47 48 47 45 47 49 49 44 44 48 52 45 South 15 15 10 20 15 15 15 21 16 15 15 18 West 27 26 34 25 28 27 24 24 30 26 25 30 Safe/swing district ... Total answering (536) (357) (70) (107) (184) (67) (173) (78) (110) (276) (75) (135) Safe Dem District 38 40 27 38 38 33 42 37 35 38 33 41 Swing District 18 17 20 21 16 19 19 26 21 21 9 16 Safe Rep District 43 43 53 41 46 48 39 37 45 42 57 42 NCEC Region ... Total answering (536) (357) (70) (107) (184) (67) (173) (78) (110) (276) (75) (135) Coast 26 26 26 26 28 22 25 26 28 26 27 24 Industrial Heartland 42 43 41 38 43 43 42 35 37 41 47 41 Rural Heartland 9 9 9 9 8 9 10 12 9 10 9 8 Sunbelt 8 8 4 11 7 7 10 12 9 9 8 9 Sunbelt Growth 15 14 20 15 15 18 12 17 16 14 9 18
Page 61

Greenberg Quinlan Rosner Center for Rural Strategies June 14-20, 2004 RELIGION INCOME CONG DIST Devt Main Irreg Dev $30K $50K $75K Evan line Main Cath out Under to to or Safe Safe Total gelcl Prot line olic Cthlc $30K $50K $75K more Dem Rep Swing Q28 Income ... Total Answering (536) (77) (143) (104) (111) (51) (143) (118) (109) (77) (205) (233) (98) Less than $10K 5 3 6 5 4 4 19 - - - 4 6 5 $10K to under $20K 10 10 10 12 10 10 39 - - - 10 12 6 $20K to under $30K 11 9 10 12 9 10 42 - - - 10 13 9 $30K to under $50K 22 19 19 21 25 22 - 100 - - 23 21 23 $50K to under $75K 20 25 26 25 25 29 - - 100 - 21 19 21 $75K to under $100K 9 14 8 7 8 4 - - - 65 8 9 12 $100K or more 5 - 5 5 7 12 - - - 35 4 5 6 (Ref) 14 19 14 13 8 8 - - - - 16 13 12 (DK) 3 - 2 2 4 2 - - - - 2 2 4 Less than $30K 27 22 26 28 23 24 100 - - - 25 31 20 $30K to under $50K 22 19 19 21 25 22 - 100 - - 23 21 23 $50K to under $75K 20 25 26 25 25 29 - - 100 - 21 19 21 $75K or more 14 14 13 12 15 16 - - - 100 13 14 18 Region ... Total answering (536) (77) (143) (104) (111) (51) (143) (118) (109) (77) (205) (233) (98) New England 5 3 8 8 6 4 5 4 5 6 3 - 22 Middle Atlantic 5 10 5 5 5 8 6 4 7 4 1 10 2 East North Central 22 23 24 24 32 39 25 19 24 23 24 27 7 West North Central 25 26 27 27 29 33 27 26 28 18 20 27 32 Deep South 12 16 17 15 5 6 15 6 11 9 22 8 1 Border States 3 6 3 4 1 - 2 5 3 4 6 - 4 Mountain States 11 4 3 5 14 6 8 14 10 17 5 8 32 Pacific 16 12 13 13 10 4 12 21 13 18 18 20 - Northeast 10 13 13 13 11 12 11 8 12 10 4 10 24 Central 47 49 51 51 60 73 52 46 51 42 44 54 39 South 15 22 20 19 5 6 17 11 14 13 28 8 5 West 27 16 16 17 23 10 20 35 23 35 23 28 32 Safe/swing district ... Total answering (536) (77) (143) (104) (111) (51) (143) (118) (109) (77) (205) (233) (98) Safe Dem District 38 39 38 38 41 43 36 40 40 34 100 - - Swing District 18 16 19 18 18 10 14 19 19 23 - - 100 Safe Rep District 43 45 43 43 41 47 50 41 40 43 - 100 - NCEC Region ... Total answering (536) (77) (143) (104) (111) (51) (143) (118) (109) (77) (205) (233) (98) Coast 26 25 25 25 21 16 23 30 25 29 22 30 24 Industrial Heartland 42 40 42 43 59 71 47 39 42 38 44 51 15 Rural Heartland 9 16 12 12 3 2 7 12 12 8 6 3 28 Sunbelt 8 12 10 6 3 4 10 3 10 5 18 4 - Sunbelt Growth 15 8 10 14 15 8 13 16 11 21 10 12 33
Page 62

June 14-20, 2004 Center for Rural Strategies Greenberg Quinlan Rosner REGION REGION COLL NCEC REGION East West Indus Sun North North Deep Mntn Paci North Cent trial belt Total Cntrl Cntrl South State fic east ral South West Coast Htlnd Grwth Q28 Income ... Total Answering (536) (120) (134) (64) (61) (84) (56) (254) (81) (145) (140) (223) (80) Less than $10K 5 3 5 9 5 4 5 4 9 4 4 4 4 $10K to under $20K 10 14 10 8 7 11 11 12 9 9 11 13 8 $20K to under $30K 11 13 13 16 8 6 13 13 12 7 9 13 11 $30K to under $50K 22 19 23 11 26 30 18 21 16 28 25 21 24 $50K to under $75K 20 22 22 19 18 17 23 22 19 17 19 21 15 $75K to under $100K 9 10 6 8 13 11 9 8 10 12 10 8 11 $100K or more 5 5 4 3 8 6 5 5 2 7 6 5 9 (Ref) 14 13 13 22 13 14 13 13 19 14 14 13 16 (DK) 3 2 2 5 2 2 4 2 5 2 3 2 3 Less than $30K 27 30 28 33 20 20 29 29 30 20 24 30 23 $30K to under $50K 22 19 23 11 26 30 18 21 16 28 25 21 24 $50K to under $75K 20 22 22 19 18 17 23 22 19 17 19 21 15 $75K or more 14 15 10 11 21 17 14 13 12 19 16 13 20 Region ... Total answering (536) (120) (134) (64) (61) (84) (56) (254) (81) (145) (140) (223) (80) New England 5 - - - - - 52 - - - 21 - - Middle Atlantic 5 - - - - - 48 - - - 19 - - East North Central 22 100 - - - - - 47 - - - 54 - West North Central 25 - 100 - - - - 53 - - - 46 - Deep South 12 - - 100 - - - - 79 - - - 24 Border States 3 - - - - - - - 21 - - - - Mountain States 11 - - - 100 - - - - 42 - - 76 Pacific 16 - - - - 100 - - - 58 60 - - Northeast 10 - - - - - 100 - - - 40 - - Central 47 100 100 - - - - 100 - - - 100 - South 15 - - 100 - - - - 100 - - - 24 West 27 - - - 100 100 - - - 100 60 - 76 Safe/swing district ... Total answering (536) (120) (134) (64) (61) (84) (56) (254) (81) (145) (140) (223) (80) Safe Dem District 38 41 31 70 18 44 16 35 72 33 33 40 25 Swing District 18 6 23 2 51 - 43 15 6 21 17 7 40 Safe Rep District 43 53 46 28 31 56 41 50 22 46 50 53 35 NCEC Region ... Total answering (536) (120) (134) (64) (61) (84) (56) (254) (81) (145) (140) (223) (80) Coast 26 - - - - 100 100 - - 58 100 - - Industrial Heartland 42 100 77 - - - - 88 - - - 100 - Rural Heartland 9 - 23 - - - - 12 21 - - - - Sunbelt 8 - - 70 - - - - 56 - - - - Sunbelt Growth 15 - - 30 100 - - - 23 42 - - 100
Page 63
