june 2005 visitor profile – the beaches of fort myers ...research data services, inc. 405 north...
TRANSCRIPT

RESEARCH DATA SERVICES, INC. 405 NORTH REO STREET • SUITE 100
TAMPA, FLORIDA 33609 TEL (813) 254-2975 • FAX (813) 254-2986
TOLL FREE (800) 330-6584 FT. MYERS (239) 332-4404
June 2005 Visitor Profile – The Beaches of Fort Myers - Sanibel
Sanibel & Captiva Islands, Fort Myers Beach, Fort Myers, Bonita Springs & Estero,
Cape Coral, Pine Island, Boca Grande & Outer Islands, North Fort Myers, Lehigh Acres.
Prepared for:
Lee County Board of County Commissioners and
Lee County Visitor and Convention Bureau
Prepared by:
Walter J. Klages, Ph.D. President
Research Data Services, Inc. www.KlagesGroup.com
August 5, 2005

Lee County June 2005 Visitor Profile
Research Data Services, Inc. Page 1 June 2005 Visitor Profile © Copyright 2005. All Rights Reserved. FCD – T
www.KlagesGroup.com
Executive Summary: June 2005
1. In June 2005, the expenditures of visitors staying at the Beaches of Fort Myers - Sanibel increased by 6.0%,
(Tourism’s total economic impact -- 2004: $137,305,296; 2005: $145,489,886). In the same vein, occupancy expanded by 2.9 points and average daily rates (ADR’s) grew by 5.3%.
2. Lee’s core markets in the Northeast, Midwest, and Europe provided visitation stability this June. Specifically,
June’s primary feeder markets are:
June Rel. 2004 Rel. 2005 Visitor Origin % Visitor # % Visitor # % ∆ Florida 20.2% 31,018 20.5% 31,759 +2.4
Southeast 10.1 15,509 9.7 15,028 -3.1
Northeast 24.0 36,853 23.9 37,027 +0.5
Midwest 31.6 48,523 32.5 50,350 +3.8
Canada 0.8 1,228 0.6 930 -24.3
Europe 10.0 15,355 10.1 15,647 +1.9
Markets of Opportunity 3.3 5,067 2.7 4,183 -17.4
Total 100.0 153,553 100.0 154,924 +0.9

Lee County June 2005 Visitor Profile
Research Data Services, Inc. Page 2 June 2005 Visitor Profile © Copyright 2005. All Rights Reserved. FCD – T
www.KlagesGroup.com
3. This June, the rank order of primary DMA’s is as follows:
June 2004
June 2005 ’04 Rank
1. New York 9.1% 1. New York 9.3% 1
2. Miami/Ft. Lauderdale 8.7 2. Miami/Ft. Lauderdale 9.0 2
3. Chicago 7.3 3. Chicago 7.1 3
4. Tampa/St. Petersburg 5.1 4. Tampa/St. Petersburg 5.5 4
5. Orlando/Daytona Beach 4.4 5. Philadelphia 4.7 8
6. Detroit 4.3 6. Orlando/Daytona Beach 4.5 5
7. Boston 3.9 7. Detroit 4.2 6
8. Philadelphia 3.8 8. Cleveland 3.8 --
9. Cincinnati 3.4 9. Boston 3.6 7
10. West Palm Beach/Ft. Pierce 3.3 10. Cincinnati 3.5 9
11. Atlanta 3.3 11. Indianapolis 3.5 -- 4. This June, the impact of Southwest Florida International Airport (RSW) on Lee visitation increased significantly.
Fully 49.3% of all visitors deplane at RSW (2004: 46.1% of all visitors). 5. During the month of June, the repeat visitors to the Beaches of Fort Myers - Sanibel grew significantly (Repeat
Visitation 2004: 56.4%; 2005: 60.5%). Importantly, over half (54.8%) of all visitors plan to return to Lee next year (2004: 49.8%).
6. Nine of every ten visitors (90.4%) select the Beaches of Fort Myers – Sanibel as a destination prior to leaving
home (2004: 86.5%). 7. The importance of the Internet as an avenue of information distribution for Lee’s tourism industry continues to
grow. Fully 91.3% of Lee visitors use the Internet and fully 70.2% of ALL visitors obtain travel information on-line. Additionally, over half (58.9%) say they buy travel services on-line.

June 2005 Visitor Profile – The Beaches of Fort Myers - Sanibel
Research Data Services, Inc. - * - June 2005 Visitor Profile © Copyright 2005 All Rights Reserved. FCD – T
www.KlagesGroup.com
The Beaches of Fort Myers - Sanibel: 2005 June Visitor Profile

June 2005 Visitor Profile – The Beaches of Fort Myers - Sanibel
Research Data Services, Inc. - 1 - June 2005 Visitor Profile
© Copyright 2005. All Rights Reserved. FCD – T www.KlagesGroup.com
Visitor Annual YEAR TO DATE % ∆ June % ∆ Volume 2004 2004 2005 04/05 2004 2005 04/05Visitors (#) 2,026,921 1,403,214 1,378,796 -1.7 153,553 154,924 +0.9 Room Nights n/a 3,355,788 3,233,845 -3.6 395,506 392,040 -0.9 Direct Exp. ($) $1,164,594,233 $819,301,567 $844,179,673 +3.0 $81,743,940 $86,616,590 +6.0
Visitor Origin (in Thousands)
31.031.8
15.5 15.0
36.9 37.0
48.5 50.4
1.2 0.9
15.415.6
5.1 4.2
0.0
10.0
20.0
30.0
40.0
50.0
60.0#
FL SE NE MW CAN EUR MO
2004 2005
June Room Rates (by Size)
72.0 76.487.5 92.6
110.2117.5
105.2 108.1
0.0
25.0
50.0
75.0
100.0
125.0
$
< 20 units 21-50 51-100 101+ units
2004 2005
June Occupancy June Room Rate Size Category 2004 2005 Point ∆ 2004 2005 % ∆ < 20 units 77.1% 78.5% +1.4 $71.99 $76.37 +6.1 21-50 units 71.6 75.2 +3.6 87.45 92.63 +5.9 51-100 units 71.4 73.4 +2.0 110.16 117.47 +6.6 101 + units 65.3 68.7 +3.4 105.22 108.13 +2.8
June 2005 Share of Total Market (%)
20.5
9.7
23.9
32.5
0.6
10.12.7
FLSENEMWCANEURMO
Monthly Winter Monthly Industry (Weighted) Jan. Feb. Mar. Apr. Season May Jun. Occupancy 2005 83.1% 93.3% 95.8% 84.1% 89.1% 78.4% 72.2% Occupancy 2004 80.6 92.4 95.3 83.5 88.0 74.4 69.3 ∆ Points +2.5 +0.9 +0.5 +0.6 +1.1 +4.0 +2.9 ADR 2005 $126.03 $158.53 $156.14 $116.62 $139.33 $97.81 $98.17 ADR 2004 116.90 146.09 143.29 114.89 130.29 91.88 93.25 ∆ Percent +7.8% +8.5% +9.0% +1.5% +6.9% +6.5% +5.3%
Visitor Annual Market Share June 2004 June 2005 Origin 2003 2004 % Share Visitor # % Share Visitor # % Add VisFlorida 12.6% 11.4% 20.2% 31,018 20.5% 31,759 +2.4 Southeast 7.0 6.8 10.1 15,509 9.7 15,028 -3.1 Northeast 28.4 28.9 24.0 36,853 23.9 37,027 +0.5 Midwest 37.9 38.5 31.6 48,523 32.5 50,350 +3.8 Canada 2.3 2.3 0.8 1,228 0.6 930 -24.3 Europe 8.4 8.9 10.0 15,355 10.1 15,647 +1.9 Markets of Opp. 3.4 3.2 3.3 5,067 2.7 4,183 -17.4 Total 100.0% 100.0% 100.0 153,553 100.0 154,924 +0.9
June Occupancy (by Size)
77.1 78.5 71.6 75.2 71.4 73.465.3 68.7
0.0
20.0
40.0
60.0
80.0
100.0
%
< 20 units 21-50 51-100 101+ units
2004 2005

June 2005 Visitor Profile -- Lee County
Research Data Services, Inc. - 2 - June 2005 Visitor Profile © Copyright 2005. All Rights Reserved. FCD – T
www.KlagesGroup.com
June 2004 June 2005 Transportation Mode (H/M/C/C + In-Home) Plane 59.6% 62.0% Rental Car 56.7 57.7 Personal Car 40.9 37.1 Airport Deplaned Southwest Florida International 77.3% 79.5% Orlando International 7.8 9.2 Tampa International 7.9 6.9 Miami International 4.8 2.8 Car Rental Location Fort Myers 75.1% 76.9% Orlando 7.9 9.5 Tampa 9.7 7.4 Miami 6.0 2.9
June 2004 June 2005 Purpose of Trip A. Visitor Profile Data Vacation 98.2% 98.7% Visit Friends and Relatives 11.9 11.2
B. Occupancy Survey Data Business Meetings/ Conferences 19.5% 22.6% First Visit to (% yes) Lee County 43.6% 39.5% Florida 7.9 6.2 First Time Visitors (by Region) Florida 33.6% 32.3% Southeast 40.9 40.0 Northeast 48.9 41.6 Midwest 32.9 31.4 Europe 70.2 52.6 Markets of Opportunity 52.9 56.3
Transportation
59.6 62.056.7 57.7
40.937.1
0.0
10.0
20.0
30.0
40.0
50.0
60.0
70.0
Plane Rental Personal Car
2004 2005
Airport Deplaned
77.3 79.5
7.8 9.2 7.9 6.9 4.8 2.8
0.0
30.0
60.0
90.0
SW FL Orlando Tampa Miami
2004 2005
First Time Visitor to Lee (% Yes)
7.9 6.2
35.733.3
0.05.0
10.015.020.025.030.035.040.045.050.0
2004 2005
New Market Share Gain From FL
39.5 43.6
%
%
%

June 2005 Visitor Profile -- Lee County
Research Data Services, Inc. - 3 - June 2005 Visitor Profile © Copyright 2005. All Rights Reserved. FCD – T
www.KlagesGroup.com
June 2004 June 2005 Average Repeat Visits to Lee 3.2 3.3 Information Sources (Multiple Response) Internet 70.3% 71.4% Previous Visit 54.0 58.0 Recommendations 49.5 42.6 Print Media 13.4 10.3 Travel Agent 6.2 4.4 Business Contacts 2.6 1.6 Assisted by Travel Agent 18.5% 12.2% Travel Agent Assisted with Airline Reservations 64.4% 51.9% Vacation Packages (Including fly/drive) 25.9 36.3 Hotel/Motel Reservations 39.7 30.3 Reservations Before Leaving Home 86.5% 90.4% None 11.7 7.6 Percent With No Reservations or Reservations Made Less than 7 Days In Advance of Arrival 23.8% 20.9%
June ’04 June ‘05 Out-of- Out-of- June ’04 June ‘05 State State Floridian Floridian Length of Stay (days) Away from Home 10.1 10.0 3.8 3.9 In Florida 9.2 9.0 N/A N/A In Lee County 5.7 5.6 3.7 3.8
% Staying 4 Days or Less in Lee 33.3% 29.2% 68.2% 66.7%
Party Size 2.7 2.7 3.1 3.1
Information Sources (Top Five)
70.3 71.4
54.058.049.5
42.6
13.4 10.3 6.2 4.4
0.0
20.0
40.0
60.0
80.0
Internet Previous Recomm. Print Travel Ag.
2004 2005
Reservations
86.5 90.4
11.7 7.6
0.010.020.030.040.050.060.070.080.090.0
100.0
Before None
2004 2005
Length of Stay in Lee County (days)
5.7 5.6
3.7 3.8
0.0
1.0
2.0
3.0
4.0
5.0
6.0
Out-of-State Floridian
2004 2005days
%
%
June 2005 Visitor Profile -- Lee County
Research Data Services, Inc. - 4 - June 2005 Visitor Profile © Copyright 2005. All Rights Reserved. FCD – T
www.KlagesGroup.com
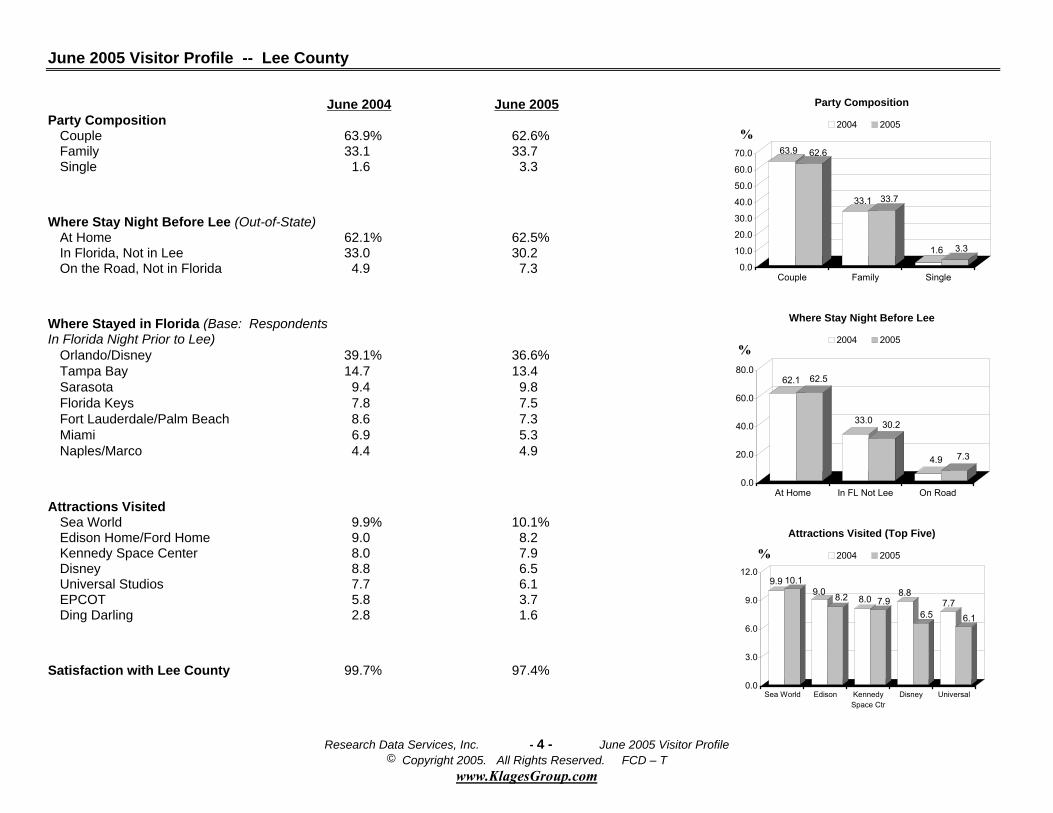
June 2004 June 2005 Party Composition Couple 63.9% 62.6% Family 33.1 33.7 Single 1.6 3.3
Where Stay Night Before Lee (Out-of-State) At Home 62.1% 62.5% In Florida, Not in Lee 33.0 30.2 On the Road, Not in Florida 4.9 7.3
Where Stayed in Florida (Base: Respondents In Florida Night Prior to Lee) Orlando/Disney 39.1% 36.6% Tampa Bay 14.7 13.4 Sarasota 9.4 9.8 Florida Keys 7.8 7.5 Fort Lauderdale/Palm Beach 8.6 7.3 Miami 6.9 5.3 Naples/Marco 4.4 4.9
Attractions Visited Sea World 9.9% 10.1% Edison Home/Ford Home 9.0 8.2 Kennedy Space Center 8.0 7.9 Disney 8.8 6.5 Universal Studios 7.7 6.1 EPCOT 5.8 3.7 Ding Darling 2.8 1.6
Satisfaction with Lee County 99.7% 97.4%
Party Composition
63.9 62.6
33.1 33.7
1.6 3.3
0.0
10.0
20.0
30.0
40.0
50.0
60.0
70.0
Couple Family Single
2004 2005
Where Stay Night Before Lee
62.1 62.5
33.0 30.2
4.9 7.3
0.0
20.0
40.0
60.0
80.0
At Home In FL Not Lee On Road
2004 2005
Attractions Visited (Top Five)
9.9 10.19.0 8.2 8.0 7.9
8.8
6.57.7
6.1
0.0
3.0
6.0
9.0
12.0
Sea World Edison KennedySpace Ctr
Disney Universal
2004 2005
%
%
%

June 2005 Visitor Profile -- Lee County
Research Data Services, Inc. - 5 - June 2005 Visitor Profile © Copyright 2005. All Rights Reserved. FCD – T
www.KlagesGroup.com
June 2004 June 2005 Features Liked Most about Lee Beaches 79.3% 82.7% Rest/Relaxation/Quiet 60.2 62.9 Climate 44.3 49.6 Tropical Atmosphere 45.5 39.5 Not Commercial 15.2 21.3 Restaurants 5.2 16.7 Clean Environment 17.5 16.2 Safety 2.3 2.0 Features Liked Least about Lee No Specific Complaints 82.8% 73.4% Weather 3.0 10.1 Insects 6.1 7.6 Congestion/Over-Population 1.9 1.7 June 2004 June 2005 Expense Relative to Expectations More Expensive 3.0% 4.4% Less Expensive 1.5 2.0 As Expected 92.1 90.4 Recommend Lee to Friends/Relatives (% yes) 90.9% 88.6% Plan to Return (% yes) To Local Area 90.4% 91.8% Next Year (Base: Return to Local Area) 55.1 59.7 Median Age Head of Household (years) 48.3 49.5 Median Annual Household Income $78,512 $80,761
Features Liked Most (Top Five)
79.3 82.7
60.262.9
44.349.6
45.539.5
15.221.3
0.0
30.0
60.0
90.0
Beaches R & R Climate Trop.Atmos.
NotComm.
2004 2005
Expense Relative to Expectations
3.0 4.4 1.5 2.0
92.1 90.4
0.0
20.0
40.0
60.0
80.0
100.0
More Less Same
2004 2005
Plan to Return
90.4 91.8
55.1 59.7
0.0
20.0
40.0
60.0
80.0
100.0
To Local Area Next Year
2004 2005%
%
%

June 2005 Visitor Profile -- Lee County
Research Data Services, Inc. - 6 - June 2005 Visitor Profile © Copyright 2005. All Rights Reserved. FCD – T
www.KlagesGroup.com
June 2004 June 2005 Average Number of (per year) Getaway Trips 2.6 2.8 Vacations 1.9 1.9 Out-of-State Visitor Party Budget (Lee Stay: Food/Lodging/Entertainment) Total $1,212.24 $1,273.13 Per Person/Trip 448.98 471.53 Per Person/Day 78.77 84.20 Out-of-State Visitor Party Budget Breakout (Lee Stay) Accommodations $635.14 $666.46 Food/Entertainment 445.20 473.01 Rental Car 248.51 257.62 Retail Purchases 143.39 144.79 See/Read/Hear Lee Message 42.9% 41.3% Type of Message Seen Internet 78.9% 78.3% Travel Guides/Visitor Guides/Brochures 42.9 42.0 Newspapers 18.3 20.1 Magazines 10.0 11.0 Television 4.5 6.1 Influenced by Lee Message (Base: Respondents Reporting See/Read/Hear Message) 78.7% 82.5%
Budget Breakout
635.1666.5
445.2 473.0
248.5 257.6
143.4144.8
0.0
200.0
400.0
600.0
800.0
Accomm Food/Ent Rental Retail
2004 2005
Influenced by Message
78.7 82.5
0.0
30.0
60.0
90.0
% Yes
2004 2005
See/Hear/Read Message
42.9 41.3
0.0
10.0
20.0
30.0
40.0
50.0
% Yes
2004 2005
Type of Message Seen
78.9 78.3
42.9 42.0
18.320.110.0 11.0
4.5 6.1
0.0
30.0
60.0
90.0
Web TG/VG News Mags T.V.
2004 2005%
% %
$

June 2005 Visitor Profile -- Lee County
Research Data Services, Inc. - 7 - June 2005 Visitor Profile © Copyright 2005. All Rights Reserved. FCD – T
www.KlagesGroup.com
June 2004 June 2005 Occupation Professional/Technical 47.6% 48.2% Executive/Managerial 17.6 17.0 Retired 12.9 14.4 Salesman/Buyer 10.4 11.9 Craft/Factory 6.5 6.3 June 2004 June 2005 Have Internet Access 90.2% 91.3% Use Internet to: (Base: Respondents who have Internet access) Obtain Travel Information 75.6% 76.9% Book Travel Reservations On-line 54.8 64.5 Book Lodging Reservations: (Base: Respondents who book travel reservations on-line) 53.9% 53.4%
Computer Use
90.2 91.3
75.6 76.9
54.864.5
53.9 53.4
0.0
20.0
40.0
60.0
80.0
100.0
InternetAccess
Obtain TravelInfo
Book Reserv. Book Lodging
2004 2005
Occupation
47.6 48.2
17.617.012.9 14.4
10.411.96.5 6.3
0.0
10.0
20.0
30.0
40.0
50.0
60.0
Prof/Tech Exe/Mgr Retired Sales Craft
2004 2005
%
%

June 2005 Visitor Profile – The Beaches of Fort Myers - Sanibel
Research Data Services, Inc. - 8 - June 2005 Visitor Profile © Copyright 2005. All Rights Reserved. FCD – T
www.KlagesGroup.com
Lee County Origin Markets
2002 – 2003 Percent Changes (By Same Month Last Year)
Origin Mkts Jan. Feb. Mar. Apr. May Jun. Jul. Aug. Sep. Oct. Nov. Dec. Florida -22.0 -16.1 +4.9 -8.3 -1.5 +3.4 +4.6 +4.3 +0.4 -9.2 +4.0 +9.9 Southeast +15.6 -0.1 +5.3 +9.0 -13.3 -1.1 +3.0 -2.4 +7.7 -1.2 +0.1 +3.9 Northeast -2.2 -3.7 +2.1 +0.5 +9.2 +17.8 +10.5 +9.9 +5.8 +6.2 -0.7 +4.4 Midwest +0.1 +0.5 -4.1 +1.3 +7.9 +3.5 +9.2 +7.7 +7.6 +6.9 +6.3 +7.8 Canada +18.1 -5.4 +11.3 +10.3 -29.9 +25.0 -7.3 -20.9 -8.2 +14.9 -3.5 +12.9 Europe +22.9 +3.0 -19.6 +8.9 +13.7 +14.4 +10.4 +6.2 -4.4 +7.9 +11.6 +13.0 Mkts of Opp. +9.9 -6.1 +8.8 +24.1 +29.0 +4.1 +21.2 -7.0 -3.4 -0.4 -7.8 -11.1 TOTAL +1.7 -2.1 -1.4 +1.9 +5.2 +7.1 +8.1 +5.4 +3.3 +3.5 +3.2 +6.6
2003 – 2004 Percent Changes (By Same Month Last Year)
Origin Mkts Jan. Feb. Mar. Apr. May Jun. Jul. Aug. Sep. Oct. Nov. Dec. Florida +3.4 -1.5 +0.8 +0.7 -11.9 -3.7 -1.5 -49.0 -9.9 -12.8 -10.8 +8.4 Southeast -0.7 +4.6 +5.6 +3.1 -0.8 +11.9 -3.4 -38.6 +5.1 -2.5 -15.4 -17.3 Northeast +9.1 +11.7 +6.2 +5.9 +4.7 +10.0 +9.8 -65.6 -44.3 -11.0 -2.0 -4.0 Midwest +6.9 +9.6 +5.1 +8.3 +3.9 +7.4 +10.9 -55.4 -36.7 -6.0 -3.9 -7.1 Canada -0.2 +5.0 -10.9 +14.8 +21.6 +21.5 +23.9 -58.3 -52.5 -22.0 -24.9 +7.5 Europe +10.9 +6.2 +5.6 +10.8 +11.5 +11.9 +11.8 -22.9 -0.9 -4.6 +0.2 +17.4 Mkts of Opp. -20.7 -10.1 -18.8 +3.9 +8.9 +3.2 +3.3 -44.9 -9.9 -11.8 -9.9 +12.2 TOTAL +5.7 +8.9 +3.9 +6.6 +1.4 +6.4 +6.2 -49.9 -24.0 -8.3 -5.3 -3.3
2004 – 2005 Percent Changes (By Same Month Last Year)
Origin Mkts Jan. Feb. Mar. Apr. May Jun. Jul. Aug. Sep. Oct. Nov. Dec. Florida -11.1 -17.7 -19.6 -8.5 +1.9 +2.4 Southeast -6.2 -0.3 -10.8 -6.8 +5.2 -3.1 Northeast -1.8 -5.6 -2.0 +0.2 +2.5 +0.5 Midwest -7.1 -1.3 -1.6 -1.3 -2.3 +3.8 Canada +9.0 +8.5 +3.2 +5.2 +9.3 -24.3 Europe +17.1 +14.8 +9.1 +6.8 +4.3 +1.9 Mkts of Opp. +13.8 +8.0 -22.6 -19.9 -9.6 -17.4 TOTAL -2.5 -2.3 -3.2 -1.8 +0.9 +0.9

June 2005 Visitor Profile – The Beaches of Fort Myers - Sanibel
Research Data Services, Inc. - 9 - June 2005 Visitor Profile © Copyright 2005. All Rights Reserved. FCD – T
www.KlagesGroup.com
Influential Factors in Choosing Lee
Influential Factors Jul. ‘04 Aug ‘04 Sep. ‘04 Oct. ‘04 Nov. ‘04 Dec. ‘04 Jan. ‘05 Feb. ‘05 Mar. ‘05 Apr. ‘05 May ‘05 Jun. ‘05 Jun. ‘04 Uncommercialized Beaches 94.8% N/A 89.2% 89.0% 94.9% 90.7% 92.6% 92.7% 93.4% 92.3% 91.5% 96.0% 93.7% Safe Destination 96.7 N/A 91.1 97.4 97.6 98.6 97.7 98.9 98.4 99.7 95.4 95.3 95.6 Complete Relaxation 90.6 N/A 84.4 88.7 87.2 86.1 87.1 85.8 85.0 87.4 90.4 90.9 94.7 Good Value for the Money 90.5 N/A 81.9 90.9 89.0 92.2 91.1 87.2 89.2 94.7 90.0 90.6 91.4 Quiet Atmosphere 86.2 N/A 91.2 91.7 93.3 92.3 94.4 94.6 95.4 90.7 87.5 88.6 91.0 Reasonably Priced Lodging 83.7 N/A 86.4 81.9 79.8 81.6 78.3 79.9 80.9 83.1 82.6 85.5 90.6 Sunning on the Beach 83.1 N/A 67.9 72.4 80.6 80.9 80.2 80.1 85.5 80.1 83.7 84.8 80.7 Family Atmosphere 84.6 N/A 70.5 74.7 70.9 79.4 76.1 78.6 73.3 76.4 76.2 82.8 81.3 Warm Weather 77.0 N/A 82.3 93.9 93.0 98.0 99.2 99.3 99.4 99.8 98.0 82.7 80.2 White Sand Beaches with Shelling 86.4 N/A 73.3 73.5 79.0 82.3 83.0 86.2 81.2 80.7 80.9 81.4 82.0 Clean, Unspoiled Environment 82.2 N/A 72.4 67.2 67.4 76.5 71.6 77.7 77.6 76.2 78.2 79.5 88.9 Tropical Plants/Animals 76.0 N/A 68.2 68.6 68.7 73.2 73.1 77.3 76.8 75.8 75.2 78.9 85.7 Affordable Dining 71.4 N/A 67.5 69.1 70.8 66.2 70.6 72.5 69.8 69.0 67.1 73.4 76.1 Upscale Accommodations 75.3 N/A 64.3 71.8 71.2 74.0 73.8 69.5 72.8 71.8 74.9 72.9 70.3
Influential Factors in Choosing Lee (Top Five) -- June
93.7 96.0 95.6 95.394.7 90.9 91.4 90.6 91.0 88.6
0.0
20.0
40.0
60.0
80.0
100.0
Unc. Beach Safe Relaxation Good Value Quiet
2004 2005
%
June 2005 Visitor Profile – The Beaches of Fort Myers - Sanibel
Research Data Services, Inc. - 10 - June 2005 Visitor Profile © Copyright 2005. All Rights Reserved. FCD – T
www.KlagesGroup.com
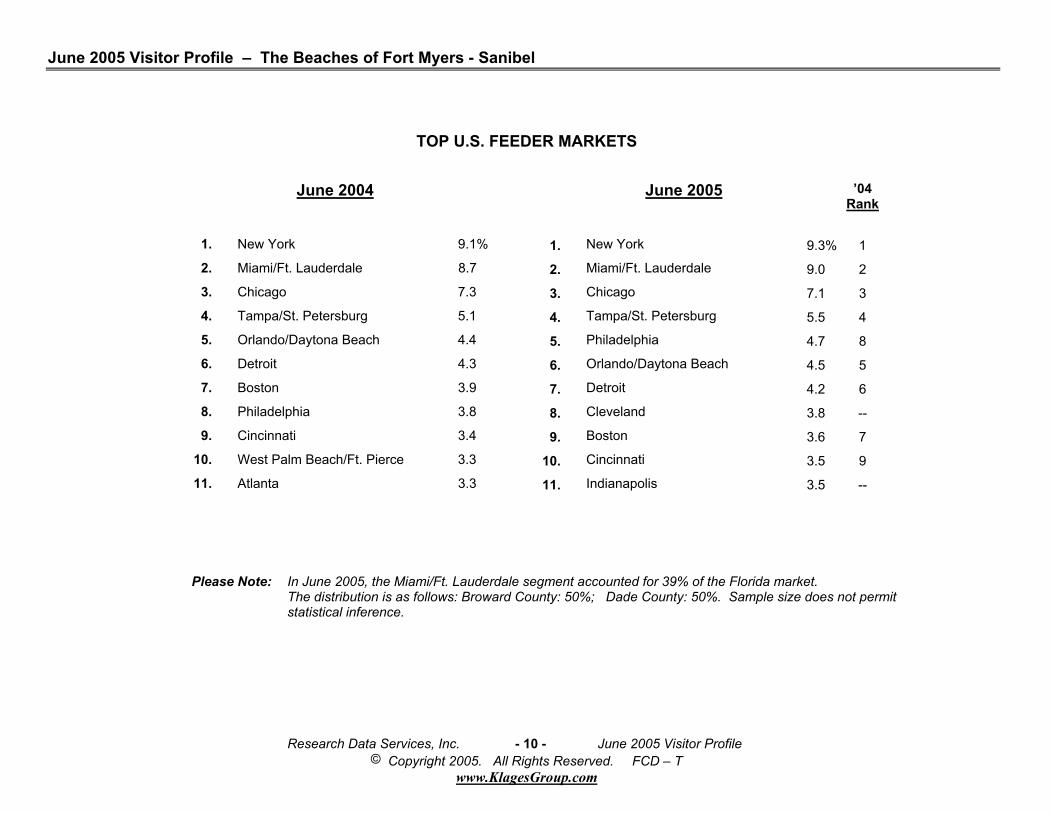
TOP U.S. FEEDER MARKETS
June 2004
June 2005
’04 Rank
1. New York 9.1% 1. New York 9.3% 1 2. Miami/Ft. Lauderdale 8.7 2. Miami/Ft. Lauderdale 9.0 2 3. Chicago 7.3 3. Chicago 7.1 3 4. Tampa/St. Petersburg 5.1 4. Tampa/St. Petersburg 5.5 4 5. Orlando/Daytona Beach 4.4 5. Philadelphia 4.7 8 6. Detroit 4.3 6. Orlando/Daytona Beach 4.5 5 7. Boston 3.9 7. Detroit 4.2 6 8. Philadelphia 3.8 8. Cleveland 3.8 -- 9. Cincinnati 3.4 9. Boston 3.6 7
10. West Palm Beach/Ft. Pierce 3.3 10. Cincinnati 3.5 9 11. Atlanta 3.3 11. Indianapolis 3.5 --
Please Note: In June 2005, the Miami/Ft. Lauderdale segment accounted for 39% of the Florida market. The distribution is as follows: Broward County: 50%; Dade County: 50%. Sample size does not permit statistical inference.

June 2005 Visitor Profile – The Beaches of Fort Myers - Sanibel
Research Data Services, Inc. - 11 - June 2005 Visitor Profile © Copyright 2005. All Rights Reserved. FCD – T
www.KlagesGroup.com
Lee County Occupancy Barometer: 2005
1. Compared to last year, OVER THE NEXT THREE MONTHS, Hotel/Motel/Condominium managers report RESERVATIONS UP OR THE SAME for:
Jul. ‘04 Aug. ‘04 Sep. ‘04 Oct. ‘04 Nov. ‘04 Dec. ‘04 Jan. ‘05 Feb. ‘05 Mar. ‘05 Apr. ‘05 May ‘05 Jun. ‘05 Jun. ‘04
U.S. OOS Travelers 90.1% N/A 75.8% 79.6% 79.3% 66.7% 83.6% 86.5% 84.2% 84.9% 85.8% 89.8% 87.9%
Floridian Travelers 91.5 N/A 79.4 79.1 77.8 75.4 85.3 85.1 85.7 82.7 88.9 94.0 90.9
Canadian Travelers 70.0 N/A 75.0 74.3 68.2 62.9 78.9 78.5 78.9 75.5 75.0 71.2 74.0
European Travelers 84.2 N/A 78.6 75.7 80.1 74.6 87.5 83.5 85.2 84.0 78.3 76.6 81.5
Reservations: June 2004 - 2005
87.9 89.8 90.9 94.0
74.0 71.2
81.576.6
0.0
20.0
40.0
60.0
80.0
100.0
%
OOS Floridian Canadian European
2004 2005
%

June 2005 Visitor Profile – The Beaches of Fort Myers - Sanibel
Research Data Services, Inc. - 12 - June 2005 Visitor Profile © Copyright 2005. All Rights Reserved. FCD – T
www.KlagesGroup.com
2. OVER THE NEXT THREE MONTHS (compared to the same period last year) industry managers EXPECT “growth” or “stability” for the following market segments:
Jul. ‘04 Aug.’04 Sep. ‘04 Oct. ‘04 Nov. ‘04 Dec. ‘04 Jan. ‘05 Feb. ‘05 Mar. ‘05 Apr. ‘05 May ‘05 Jun. ‘05 June ‘04
Leisure Travelers 93.9% N/A 78.1% 88.9% 87.5% 81.7% 89.7% 89.5% 90.0% 85.0% 90.9% 90.9% 91.7%
Business Travelers 91.4 N/A 87.1 90.6 86.8 86.0 94.8 94.6 93.6 91.9 92.7 91.7 92.8
Conferences/
Business Meetings 87.2 N/A 87.0 83.3 83.5 81.3 85.7 87.9 89.9 88.5 91.0 92.6 91.2
Travel and Tour 88.5 N/A 82.6 80.8 82.8 75.0 84.4 88.9 90.0 87.3 88.0 90.0 90.6
Expectations: June 2004 - 2005
91.7 90.9 92.8 91.7
0
20
40
60
80
100%
Leisure Business
2004 2005
%

Lee County Visitor Origins (Actual Number of Visitors) 2002 - 2005
Monthly YTD Monthly YTD Monthly YTD Monthly YTD Monthly YTD Monthly YTD Monthly YTD Monthly YTD
Jan 11,498 11,498 8,964 8,964 9,269 9,269 8,238 8,238 13,989 13,989 16,174 16,174 16,067 16,067 15,070 15,070
Feb 12,862 24,360 10,797 19,761 10,634 19,903 8,747 16,985 13,125 27,114 13,111 29,285 13,712 29,779 13,668 28,738
Mar 18,684 43,044 19,591 39,352 19,750 39,653 15,881 32,866 17,497 44,611 18,421 47,706 19,447 49,226 17,352 46,090
Apr 35,294 78,338 32,356 71,708 32,587 72,240 29,809 62,675 16,765 61,376 18,275 65,981 18,849 68,075 17,572 63,662
Winter 78,338 78,338 71,708 71,708 72,240 72,240 62,675 62,675 61,376 61,376 65,981 65,981 68,075 68,075 63,662 63,662
May 31,107 109,445 30,632 102,340 26,977 99,217 27,490 90,165 7,513 68,889 6,515 72,496 6,463 74,538 6,802 70,464
June 31,129 140,574 32,197 134,537 31,018 130,235 31,759 121,924 14,015 82,904 13,861 86,357 15,509 90,047 15,028 85,492
July 37,639 178,213 39,357 173,894 38,764 168,999 16,264 99,168 16,748 103,105 16,181 106,228
Aug 27,504 205,717 28,685 202,579 14,628 183,627 7,928 107,096 7,739 110,844 4,755 110,983
Spr/Sum 127,379 205,717 130,871 202,579 111,387 183,627 45,720 107,096 44,863 110,844 42,908 110,983
Sep 20,566 226,283 20,641 223,220 18,603 202,230 5,782 112,878 6,227 117,071 6,547 117,530
Oct 12,761 239,044 11,593 234,813 10,114 212,344 5,136 118,014 5,072 122,143 4,946 122,476
Nov 12,105 251,149 12,594 247,407 11,230 223,574 6,860 124,874 6,869 129,012 5,812 128,288
Dec 4,033 255,182 4,434 251,841 4,808 228,382 9,829 134,703 10,211 139,223 8,447 136,735
Fall 49,465 255,182 49,262 251,841 44,755 228,382 27,607 134,703 28,379 139,223 25,752 136,735
TOTAL 255,182 251,841 228,382 134,703 139,223 136,735
2004
Florida Southeast
2003 200520052002 200220042003
Research Data Services, Inc. - 13 - June 2005 Visitor Profile© Copyright 2005. All Rights Reserved. FCD - T
www.KlagesGroup.com
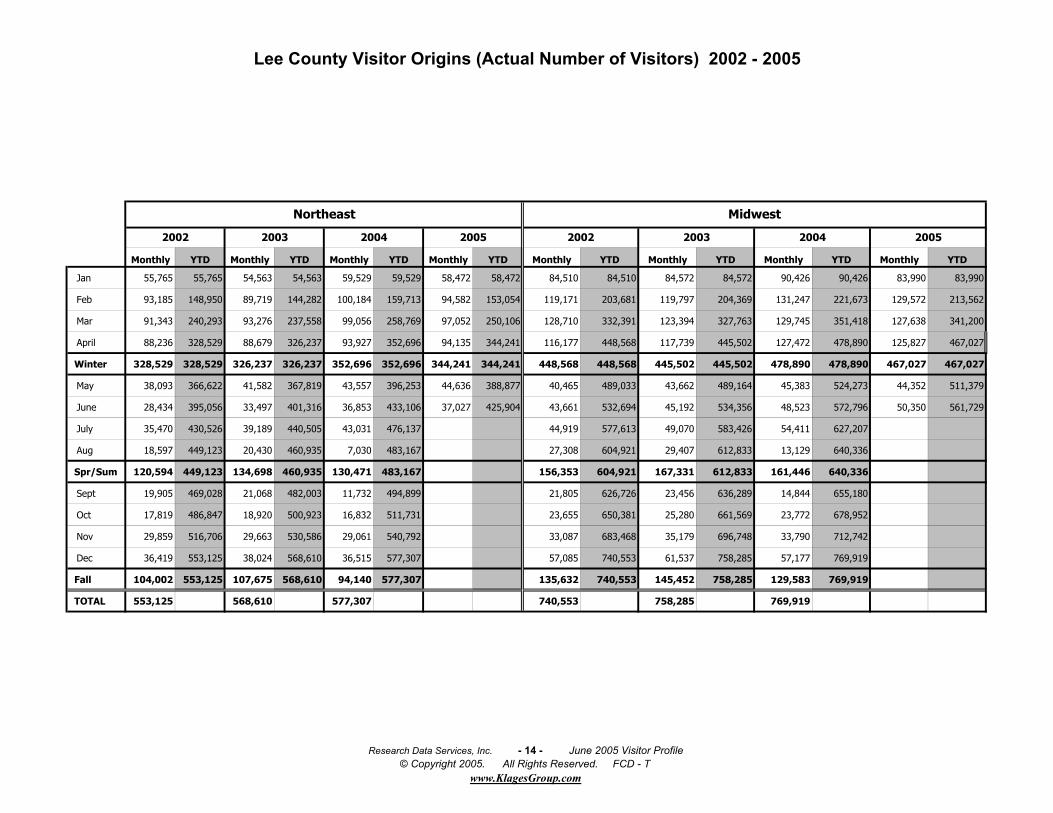
Lee County Visitor Origins (Actual Number of Visitors) 2002 - 2005
Monthly YTD Monthly YTD Monthly YTD Monthly YTD Monthly YTD Monthly YTD Monthly YTD Monthly YTD
Jan 55,765 55,765 54,563 54,563 59,529 59,529 58,472 58,472 84,510 84,510 84,572 84,572 90,426 90,426 83,990 83,990
Feb 93,185 148,950 89,719 144,282 100,184 159,713 94,582 153,054 119,171 203,681 119,797 204,369 131,247 221,673 129,572 213,562
Mar 91,343 240,293 93,276 237,558 99,056 258,769 97,052 250,106 128,710 332,391 123,394 327,763 129,745 351,418 127,638 341,200
April 88,236 328,529 88,679 326,237 93,927 352,696 94,135 344,241 116,177 448,568 117,739 445,502 127,472 478,890 125,827 467,027
Winter 328,529 328,529 326,237 326,237 352,696 352,696 344,241 344,241 448,568 448,568 445,502 445,502 478,890 478,890 467,027 467,027
May 38,093 366,622 41,582 367,819 43,557 396,253 44,636 388,877 40,465 489,033 43,662 489,164 45,383 524,273 44,352 511,379
June 28,434 395,056 33,497 401,316 36,853 433,106 37,027 425,904 43,661 532,694 45,192 534,356 48,523 572,796 50,350 561,729
July 35,470 430,526 39,189 440,505 43,031 476,137 44,919 577,613 49,070 583,426 54,411 627,207
Aug 18,597 449,123 20,430 460,935 7,030 483,167 27,308 604,921 29,407 612,833 13,129 640,336
Spr/Sum 120,594 449,123 134,698 460,935 130,471 483,167 156,353 604,921 167,331 612,833 161,446 640,336
Sept 19,905 469,028 21,068 482,003 11,732 494,899 21,805 626,726 23,456 636,289 14,844 655,180
Oct 17,819 486,847 18,920 500,923 16,832 511,731 23,655 650,381 25,280 661,569 23,772 678,952
Nov 29,859 516,706 29,663 530,586 29,061 540,792 33,087 683,468 35,179 696,748 33,790 712,742
Dec 36,419 553,125 38,024 568,610 36,515 577,307 57,085 740,553 61,537 758,285 57,177 769,919
Fall 104,002 553,125 107,675 568,610 94,140 577,307 135,632 740,553 145,452 758,285 129,583 769,919
TOTAL 553,125 568,610 577,307 740,553 758,285 769,919
2003 2004
Northeast
2005
Midwest
2002 2003 20052004 2002
Research Data Services, Inc. - 14 - June 2005 Visitor Profile© Copyright 2005. All Rights Reserved. FCD - T
www.KlagesGroup.com
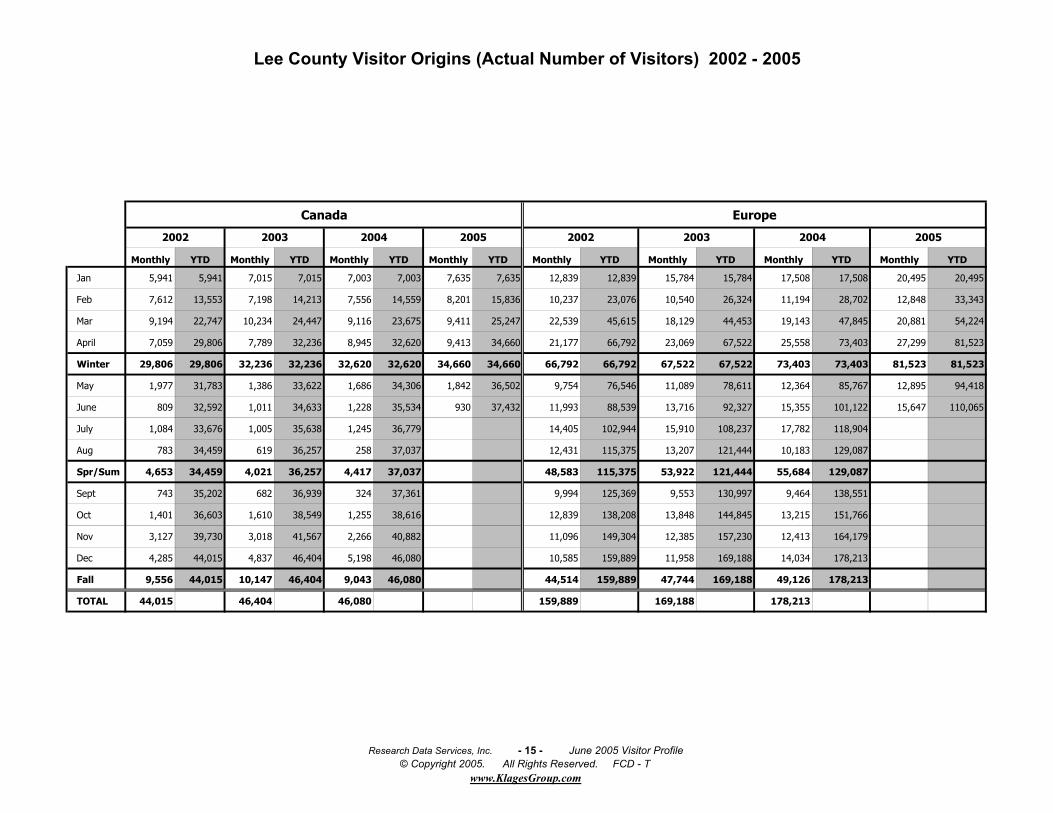
Lee County Visitor Origins (Actual Number of Visitors) 2002 - 2005
Canada Europe
Monthly YTD Monthly YTD Monthly YTD Monthly YTD Monthly YTD Monthly YTD Monthly YTD Monthly YTD
Jan 5,941 5,941 7,015 7,015 7,003 7,003 7,635 7,635 12,839 12,839 15,784 15,784 17,508 17,508 20,495 20,495
Feb 7,612 13,553 7,198 14,213 7,556 14,559 8,201 15,836 10,237 23,076 10,540 26,324 11,194 28,702 12,848 33,343
Mar 9,194 22,747 10,234 24,447 9,116 23,675 9,411 25,247 22,539 45,615 18,129 44,453 19,143 47,845 20,881 54,224
April 7,059 29,806 7,789 32,236 8,945 32,620 9,413 34,660 21,177 66,792 23,069 67,522 25,558 73,403 27,299 81,523
Winter 29,806 29,806 32,236 32,236 32,620 32,620 34,660 34,660 66,792 66,792 67,522 67,522 73,403 73,403 81,523 81,523
May 1,977 31,783 1,386 33,622 1,686 34,306 1,842 36,502 9,754 76,546 11,089 78,611 12,364 85,767 12,895 94,418
June 809 32,592 1,011 34,633 1,228 35,534 930 37,432 11,993 88,539 13,716 92,327 15,355 101,122 15,647 110,065
July 1,084 33,676 1,005 35,638 1,245 36,779 14,405 102,944 15,910 108,237 17,782 118,904
Aug 783 34,459 619 36,257 258 37,037 12,431 115,375 13,207 121,444 10,183 129,087
Spr/Sum 4,653 34,459 4,021 36,257 4,417 37,037 48,583 115,375 53,922 121,444 55,684 129,087
Sept 743 35,202 682 36,939 324 37,361 9,994 125,369 9,553 130,997 9,464 138,551
Oct 1,401 36,603 1,610 38,549 1,255 38,616 12,839 138,208 13,848 144,845 13,215 151,766
Nov 3,127 39,730 3,018 41,567 2,266 40,882 11,096 149,304 12,385 157,230 12,413 164,179
Dec 4,285 44,015 4,837 46,404 5,198 46,080 10,585 159,889 11,958 169,188 14,034 178,213
Fall 9,556 44,015 10,147 46,404 9,043 46,080 44,514 159,889 47,744 169,188 49,126 178,213
TOTAL 44,015 46,404 46,080 159,889 169,188 178,213
200420022004 200520032002 2003 2005
Research Data Services, Inc. - 15 - June 2005 Visitor Profile© Copyright 2005. All Rights Reserved. FCD - T
www.KlagesGroup.com

Lee County Visitor Origins (Actual Number of Visitors) 2002 - 2005
TOTAL
Monthly YTD Monthly YTD Monthly YTD Monthly YTD Monthly YTD Monthly YTD Monthly YTD Monthly YTD
Jan 7,090 7,090 7,795 7,795 6,179 6,179 7,033 7,033 191,632 191,632 194,867 194,867 205,981 205,981 200,933 200,933
Feb 6,300 13,390 5,913 13,708 5,317 11,496 5,741 12,774 262,492 454,124 257,075 451,942 279,844 485,825 273,359 474,292
Mar 8,600 21,990 9,357 23,065 7,596 19,092 5,882 18,656 296,567 750,691 292,402 744,344 303,853 789,678 294,097 768,389
April 9,412 31,402 11,684 34,749 12,140 31,232 9,727 28,383 294,120 1,044,811 299,591 1,043,935 319,478 1,109,156 313,782 1,082,171
Winter 31,402 31,402 34,749 34,749 31,232 31,232 28,383 28,383 1,044,811 1,044,811 1,043,935 1,043,935 1,109,156 1,109,156 1,082,171 1,082,171
May 2,900 34,302 3,742 38,491 4,075 35,307 3,684 32,067 131,809 1,176,620 138,608 1,182,543 140,505 1,249,661 141,701 1,223,872
June 4,716 39,018 4,909 43,400 5,067 40,374 4,183 36,250 134,757 1,311,377 144,383 1,326,926 153,553 1,403,214 154,924 1,378,796
July 5,111 44,129 6,197 49,597 6,401 46,775 154,892 1,466,269 167,476 1,494,402 177,815 1,581,029
Aug 3,328 47,457 3,095 52,692 1,706 48,481 97,879 1,564,148 103,182 1,597,584 51,689 1,632,718
Spr/Sum 16,055 47,457 17,943 52,692 17,249 48,481 519,337 1,564,148 553,649 1,597,584 523,562 1,632,718
Sept 3,799 51,256 3,668 56,360 3,306 51,787 82,594 1,646,742 85,295 1,682,879 64,820 1,697,538
Oct 4,202 55,458 4,187 60,547 3,691 55,478 77,813 1,724,555 80,510 1,763,389 73,825 1,771,363
Nov 4,741 60,199 4,371 64,918 3,940 59,418 100,875 1,825,430 104,079 1,867,468 98,512 1,869,875
Dec 3,780 63,979 3,359 68,277 3,768 63,186 126,016 1,951,446 134,360 2,001,828 129,947 1,999,822
Fall 16,522 63,979 15,585 68,277 14,705 63,186 387,298 1,951,446 404,244 2,001,828 367,104 1,999,822
TOTAL 63,979 68,277 63,186 1,951,446 2,001,828 1,999,822
2002 2003 20042004 20052002 2003 2005
Markets of Opportunity
Research Data Services, Inc. - 16 - June 2005 Visitor Profile© Copyright 2005. All Rights Reserved. FCD - T
www.KlagesGroup.com