june 2008 (updated sept 2008) iide research report: 200806-01
TRANSCRIPT

IIDEinstitute for international and development economics
RESEARCH REPORT
Stichting IIDE, Institute for International & Development Economics www.i4ide.org
Trade Impact Assessment of an EU-India Free Trade Agreement
Joseph Francois Hanna Norberg Annette Pelkmans-Balaoing
Prepared with support from the European Commission – DG Trade TRADE07/C1/C01 – Lot 1
JUNE 2008 (updated Sept 2008) IIDE research report: 200806-01
institute for international and development economics
IIDE 1
Executive Summary TRADE IMPACT ASSESSMENT OF AN EU-INDIA FREE TRADE AGREEMENT
This study analyses the effects of a potential Free Trade Agreement (FTA) between the EU27 and India. This is done using the IIDE Computable Equilibrium (ICE) model of the global economy.
Although the EU is India’s most important trading partner, and trade volumes have increased in the last decade, current levels of trade and investment are still low (in 2004, the bilateral trade volume amounted to €46 billion) and current levels of protection, especially on India’s part, are high.
In setting up the baseline for analysis with the ICE model, two major assumptions were made. First, in order to take into account India’s rapid economic growth, and shed light on the medium terms of the FTA, the baseline was projected to 2014. Secondly, the baseline assumes a successful completion of the Doha-Round. This implies that overall levels of protection on goods, especially on the EU’s part, and on agricultural goods in particular, are significantly lowered before a potential FTA is put in place.
Overall, our analysis shows that there are potential gains to be reaped from signing a bilateral FTA between the EU and India. For all employed liberalization scenarios, the FTA is expected to yield positive real income effects for both economies, both in the short- and long-run. The effects are, however, quite small due to the low levels of bilateral trade. In the short run, the real income gains in the EU are expected to range between €3 and €4,4 billion (higher for more ambitious liberalisation scenarios), which amount to less than 0.1 percent of GDP. In the long run, the effects of an FTA in the EU are much smaller. For the Indian economy, the short-term income effects in absolute measure are similar to those in the EU, but due to differences in the size of economies, the relative effect is bigger in India (ranging from 0.1 to 0.3 percent of GDP). In the long-run, the effects on the Indian economy are expected to be larger.
All measures taken to liberalise trade, i.e. tariff reductions, services liberalisation and measures taken to facilitate trade and reduce Non-tariff Barriers (NTBs) are important in realizing the gains from increased trade.
Given the low base trade, the global effects of even the most ambitious liberalisation scenarios are quite small. The negative repercussions of EU-Indian trade diversion have no substantial effect on anyone except India’s closest trading partners, namely Sri Lanka and Other South East Asia, implying a national income loss equivalent to 0.1 percent of GDP in the short run. In the long run, the effects, albeit larger, are still small.
The output changes across sectors are generally small for both economies, with the exception of the Wearing Apparel and Leather sectors in India, which are expected to increase between 15 and 30 percent. Electronic equipment and the Metal sectors are also expected to expand. These expansions are found to be sustained in the long run. For the EU, output in agricultural sectors are expected to expand, while manufacturing sectors in general contract somewhat, most notably so for Wearing Apparel and Leather, as a result of increased competition from India. These effects are very limited and fall over time.
The FTA is not expected to have any substantial effects on European wages. Indian wages are expected to increase between 1 and 1.5 percent in the short run, and a little more in the long run. The wage increase for skilled labor is very similar to the expected increase for unskilled labor. In terms of environmental impacts, the relatively small impact on the EU, and the relatively small share of India in global output and emissions, mean the impact on global CO2 emissions is negligible. Impacts range, between the various scenarios and time frames, from 0.01 to 0.04 percent of baseline global emissions. Changes in utilisation of natural resources in fisheries, forestry, and primary agriculture are also generally quite small. Fisheries stock utilisation remains more or less unchanged across all scenarios. In India, agricultural resource utilisation (land, water, etc.) actually drops slightly, while net effects are relatively small in the EU, with slight long-run drops in grain and oilseed production.
June 2008 (updated September 2008).
institute for international and development economics
IIDE 2
1. Background In this chapter, we lay the foundation for the analysis. In so doing, we begin with a brief background on current trade patterns and trade barriers currently in place between the EU and India. We then describe the model and the data on which we base the analysis, and define the underlying assumptions, as well as the scenarios, employed to model trade liberalisation.
1.1. Current Trading Landscape The EU27 is India’s most important trading partner. The EU accounts for approximately 20 percent of imports and exports (in goods) to India. Meanwhile a little less than 2 percent of extra-EU trade is with India, although this is increasing in importance. India is the EU’s ninth biggest trading partner. Production The aggregate production structure for India and the EU is summarised below in Table 1.1. . As can be seen in the table, roughly three-quarters of the EU’s value added is attributable to the service sectors and more than 20 percent to manufacturing. The primary sectors in the EU economy account for only 3 percent of total value added. Table 1.1 Current Production Structure (2004) India and EU27.
Share of Production Attributable to EU27 (%) India (%)
Agriculture, Forestry and Fishing 3.0 21.0 Manufacturing and Extraction 22.5 26.0 Services 74.5 53.0 Source: GTAP database, version 7.
In India, the service sectors account for a little more than 50 percent of total value added, while the remaining half is roughly divided between manufacturing and primary production, where the manufacturing sectors have a slightly larger share (26 and 21percent, respectively). Import Protection India has overall high levels of import protection, although this has fallen in recent years. In general, Indian tariffs are lower for imports from the EU than the overall average for imports from the rest of the world (ROW), and lower than average levels for the US. The highest levels of import protection are for Agriculture and Processed Foods, most notably so for Beverages and Tobacco products, Sugar and Vegetables, Fruits and Nuts. As could be expected, currently very little trade (less than 0.3 percent) takes place in these sectors. The EU has higher average levels of protection against Indian imports vis–a-vis the average for imports from the rest of the world. In general, protection against Indian imports follow the same pattern as with the ROW. The most protected sectors can be found in Processed Foods, followed by Agricultural goods, and Manufacturing. Other primary sectors have less import protection.
institute for international and development economics
IIDE 3
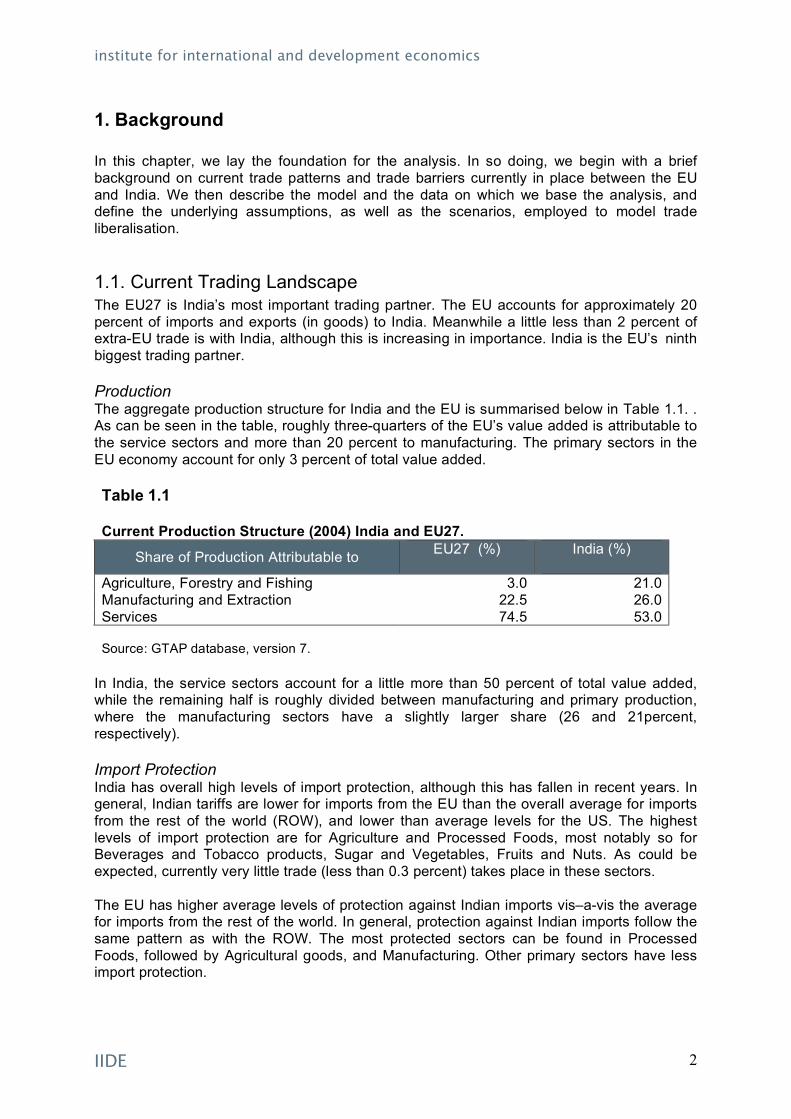
Table 1.2 Bilateral Import Protection Levels per Sector, 2004.
EU27 Protection on imports from
India (%)
India Protection on imports from
EU27 (%) PRIMARY
Cereal grains nec 53.6 6.1 Vegetables, fruit, nuts 0.9 44.8 Oil seeds 0.2 26.7 Livestock 9.7 6.7 Other agriculture 2.2 12.3 Forestry 1.0 10.6 Fishing 3.5 7.4 Coal 0.0 13.4 Oil 0.0 8.9 Gas 0.0 2.3 Minerals nec 0.0 15.0 Sugar 134.6 48.8 Processed foods 16.7 41.5 Beverages and tobacco 20.3 136.6
MANUFACTURING Textiles 7.4 15.7 Wearing apparel 8.6 14.9 Leather products 3.4 13.8 Wood products 0.1 15.0 Paper products, publishing 0.1 14.4 Petroleum, coal products 0.0 14.8 Chemical, rubber, plastic products 0.6 15.2 Mineral products nec. 1.1 15.0 Ferrous metals 0.0 18.9 Metals nec 1.7 15.0 Metal products 0.2 15.0 Motor vehicles and parts 4.1 31.3 Transport equipment nec 0.7 7.6 Electronic equipment 1.1 4.2 Machinery and equipment nec 0.1 14.2 Manufactures nec 0.0 15.0
SERVICES Construction 16.0 19.0 Trade 37.0 61.7 Transport 28.1 56.3 Communication 18.4 45.7 Financial Services nec 42.3 59.7 Insurance 35.8 59.7 Business Services nec 34.9 60.0 Recreational and other Services 27.6 60.7 Public Administration, Defense, Education, Health
37.0
61.7
Source: Tariffs for merchandise: GTAP database, version 7. Trade cost equivalents for services: Francois (2008)

institute for international and development economics
IIDE 4
Three sectors enjoy import protection of more than 100 percent, namely Bovine meat products (252 percent), Sugar (157 percent), and Processed rice (109 percent). Other sectors that are among the most highly protected are Paddy rice (59 percent), Dairy products (24 percent) and Beverages and Tobacco (19.9 percent). As a result, these sectors account for a very small share of imports. (The cumulative share of the 7 highest protected goods amount to less than 1.5 percent of European imports from India.) Our employed measures of import protection in services show that overall levels of protection in services are higher than corresponding levels of protection for traded goods. For the EU, the average estimated level is close to 30 percent, while the corresponding figure for India is in excess of 50 percent. For both the EU and India, Financial Services and Insurance are highly protected sectors, exhibiting levels of 35 to 42 percent in Europe and 60 percent in India, respectively. Relatively speaking, the service sectors with the lowest estimated levels of protection in Europe are Communication (18.4 percent) and Construction (16 percent). In India the service sector with the lowest estimated levels of protection is also Construction (19 percent). Current Trading Patterns The current patterns of exports for the EU and India, for bilateral trade and trade with the rest of the world, are summarised below in Table 1.3. Table 1.3 Current Trade (2004) Patterns, Percent Share of Exports by Sector and Destination.
EU27’s exports to India’s exports to World India World India Agriculture, Forestry and Fishing
1.8 0.3 3.9 3.3
Manufacturing and Extraction
76.8 65.3 77.9 63.0
Services 21.4 34.4 18.3 33.6 Source: GTAP database, version 7.
As can be seen in the table, three-quarters of the EU’s exports to the world consists of manufactured products, a little over 20 percent is attributable to Services, while less than 2 percent of exports originate from the Primary sectors. Meanwhile, exports to India are more concentrated around Services, which makes up for a little over one-third. A little less than two-thirds of the exports are in Manufacturing, while less than half a percent is in the primary sectors. India’s main import sectors are Minerals, Business Services and Machinery and equipment, which together account for more than 50 percent of Indian imports from the EU. Other important Indian import sectors are Chemical, Rubber and plastic products, Water transports and Financial services. Indian exports by destination also reveal that trade with the EU is more highly concentrated around services, than is the case with other exporting partners.

institute for international and development economics
IIDE 5
1.2. Foreign Direct Investment (FDI)
Basic Trends FDI inflows to Europe from India are very modest and averaged about 200 million Euros during the period 2001-2005, however the OECD (2006:1) also points out that these official statistics are very possibly underestimated as well. They also indicate a number of reason for the likelihood of Indian outflow of FDI is likely to increase rapidly. Among the European countries, Germany and United Kingdom were the major contributors of EU inflows of FDI to India in the period 2001-2005.
Indian growth rates in the last years have attracted a big increase in inflow of FDI. During the period 2001-2005, EU25 outward FDI stocks in India doubled (from 6 276 to 13 682 million Euros). According to the OECD (2006:1), these figures are likely to be an underestimate, since recently there have been liberalization measures implying that an increasing proportion of inward FDI now arrives unscreened via the “automatic route”, which requires only notification to the Central Bank. However, this obligation is not enforced and therefore widely ignored. OECD (2006:1) also points out that a large number of international information technology and communication companies have announced plans to increase their corporate presence in India, indicating that future investments in India are likely to continue to increase.
Table 1.4 Top Sectors Attracting Indian FDI Inflows: 2000-2007.
Rank: Sector: Share of total FDI inflow (%):
1 Services Sector (financial and non-financial) 20 2 Computer Software and Hardware 26 3 Telecommunications 8 4 Construction Activities 5
Source: Indian Government
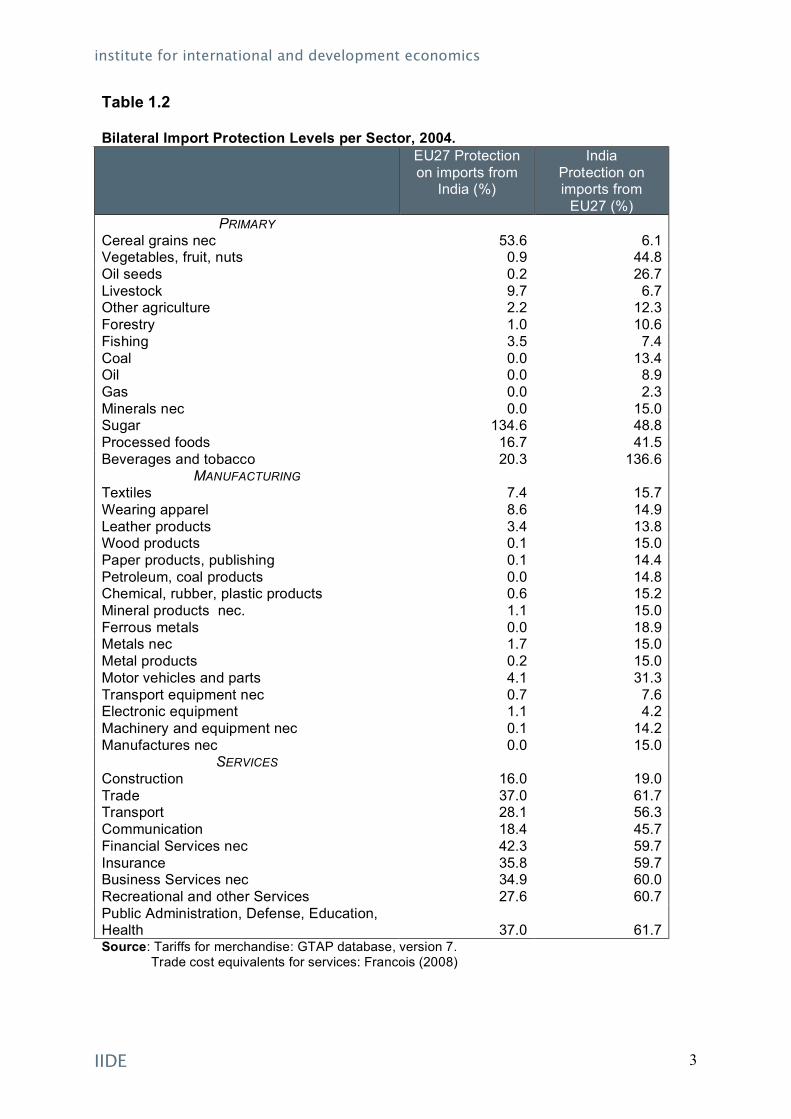
Policy By various measures, the OECD countries are generally the most open. In contrast, India is one of the most closed regimes. For example, in a number of key sectors India has maintained a continued policy of compulsory licensing. In theory, these are maintained or reasons “security, safety, strategic, social, and environment.” (WTO 2007). In practice these can be a significant impediment to foreign investment..
One measure of the impediment to inward FDI is the OECD’s Regulatory Restrictiveness Index (OECD 2006:2, 2007). Among the 42 countries surveyed (29 OECD members and 13 non-member countries), India is, together with China, the two countries with the highest levels of restrictions to FDI. India’s overall index of restrictiveness is estimated at 0.4. Table 1.5 below, shows the sector specific restrictiveness for FDI in India.
The FDI restrictiveness indicator in the table is set up to capture discrimination against foreign investment, i.e. capturing deviations from national treatment. The measure covers three categories of restrictions, namely limitations on foreign ownership, screening or
institute for international and development economics
IIDE 6
Table 1.5 Indian sectors subject to compulsory licensing.
Sector:
Distillation and brewing of alcoholic drinks Cigars and cigarettes of tobacco and manufactured tobacco substitutes Electronic aerospace and defence equipment: all types Industrial explosives, including detonation fuses, safety fuses, gun powder, nitrocellulose, and matches
Source: WTO (2007)
notification procedures and management and operational restrictions. These three measures are weighted according to importance and captured as an index. The index is measured on a 0 to 1 scale, where 0 represents full openness and 1 prohibition of FDI. The restriction pattern by industry is broadly similar across all countries in the sample. In general, the most restricted sectors are Electricity, Transport, Telecommunications and Finance. Meanwhile, Manufacturing, Tourism, Construction and Distribution are among those sectors that generally exhibit less restrictions to FDI.
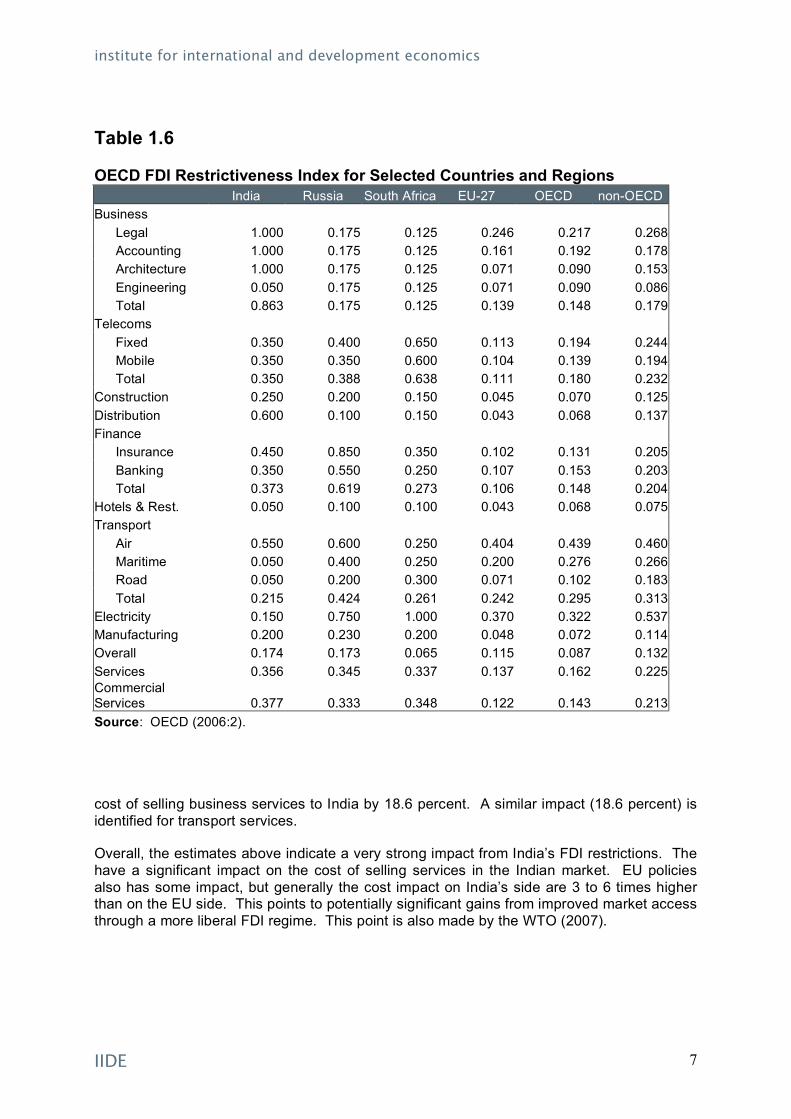
As can be seen from the Table, the Business Services sectors are those exhibiting the highest levels of restrictions to FDI, according to this measure. Looking at this sector on a more disaggregate level, the Legal, Accounting and Architecture sectors are all completely closed to foreign investments (i.e. here the index is equal to 1). Distribution, Telecom and Distribution and Finance are also among sectors that are highly regulated in terms of FDI. Despite the high levels of restriction, Business Services and Telecom are, together with Computer Software and Hardware, the top three sectors in terms of receiving FDI1. During the period 1991-2007, they received 20 and 8% of total Indian inward investment respectively. For comparison purposes, Table 1.6 also presents India’s level of restriction relative to a number of other emerging markets, in addition to the average across the EU27.
Policy Impact We next turn to a gravity-based analysis of the policy impact of India’s FDI regime. We focus on FDI restrictions in the service sector. This involves a gravity model of bilateral services trade, including trade with India. In this model (based on Francois 2008) we estimate the impact of FDI restrictions on services trade. The result of these impacts is then converted to trade costs (with the trade elasticities used for the CGE model employed in this report.)
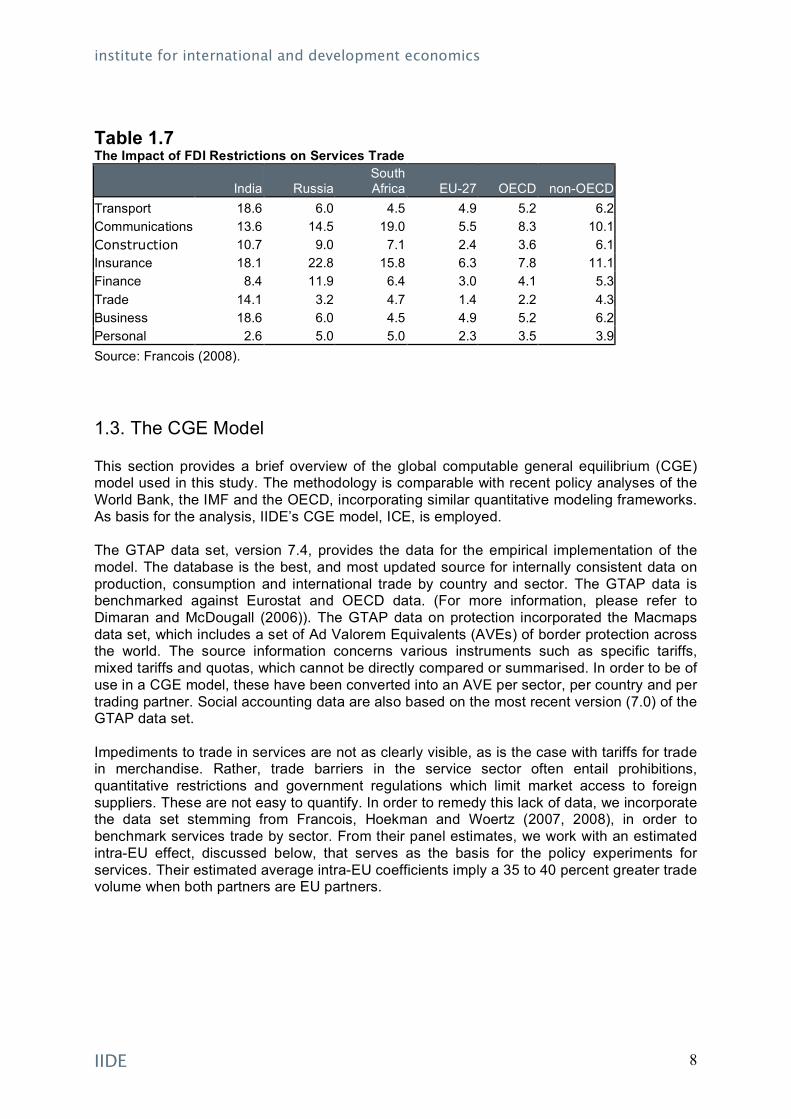
The estimates reported above provide and indication of the impact of the FDI regime in India on the ability of India’s trading partners to export services. Recall from the discussion above that these are the most important sectors, in a dynamic sense, for FDI in India. Reading across the columns, India’s restrictions on FDI in insurance raise the cost of selling insurance services in the Indian market by 18.1 percent. In contrast, the impact in the EU27 is only 2.4 percent. Similarly, the impact of Indian restrictions on FDI in business services is to raise the
1 According to the Indian Government’s “Fact Sheet on Foreign Direct Investment (FDI).”
institute for international and development economics
IIDE 7
Table 1.6 OECD FDI Restrictiveness Index for Selected Countries and Regions India Russia South Africa EU-27 OECD non-OECD Business
Legal 1.000 0.175 0.125 0.246 0.217 0.268 Accounting 1.000 0.175 0.125 0.161 0.192 0.178 Architecture 1.000 0.175 0.125 0.071 0.090 0.153 Engineering 0.050 0.175 0.125 0.071 0.090 0.086 Total 0.863 0.175 0.125 0.139 0.148 0.179
Telecoms Fixed 0.350 0.400 0.650 0.113 0.194 0.244 Mobile 0.350 0.350 0.600 0.104 0.139 0.194 Total 0.350 0.388 0.638 0.111 0.180 0.232
Construction 0.250 0.200 0.150 0.045 0.070 0.125 Distribution 0.600 0.100 0.150 0.043 0.068 0.137 Finance
Insurance 0.450 0.850 0.350 0.102 0.131 0.205 Banking 0.350 0.550 0.250 0.107 0.153 0.203 Total 0.373 0.619 0.273 0.106 0.148 0.204
Hotels & Rest. 0.050 0.100 0.100 0.043 0.068 0.075 Transport
Air 0.550 0.600 0.250 0.404 0.439 0.460 Maritime 0.050 0.400 0.250 0.200 0.276 0.266 Road 0.050 0.200 0.300 0.071 0.102 0.183 Total 0.215 0.424 0.261 0.242 0.295 0.313
Electricity 0.150 0.750 1.000 0.370 0.322 0.537 Manufacturing 0.200 0.230 0.200 0.048 0.072 0.114 Overall 0.174 0.173 0.065 0.115 0.087 0.132 Services 0.356 0.345 0.337 0.137 0.162 0.225 Commercial Services 0.377 0.333 0.348 0.122 0.143 0.213 Source: OECD (2006:2).
cost of selling business services to India by 18.6 percent. A similar impact (18.6 percent) is identified for transport services.
Overall, the estimates above indicate a very strong impact from India’s FDI restrictions. The have a significant impact on the cost of selling services in the Indian market. EU policies also has some impact, but generally the cost impact on India’s side are 3 to 6 times higher than on the EU side. This points to potentially significant gains from improved market access through a more liberal FDI regime. This point is also made by the WTO (2007).
institute for international and development economics
IIDE 8
Table 1.7 The Impact of FDI Restrictions on Services Trade
India Russia South Africa EU-27 OECD non-OECD
Transport 18.6 6.0 4.5 4.9 5.2 6.2 Communications 13.6 14.5 19.0 5.5 8.3 10.1 Construction 10.7 9.0 7.1 2.4 3.6 6.1 Insurance 18.1 22.8 15.8 6.3 7.8 11.1 Finance 8.4 11.9 6.4 3.0 4.1 5.3 Trade 14.1 3.2 4.7 1.4 2.2 4.3 Business 18.6 6.0 4.5 4.9 5.2 6.2 Personal 2.6 5.0 5.0 2.3 3.5 3.9
Source: Francois (2008).
1.3. The CGE Model This section provides a brief overview of the global computable general equilibrium (CGE) model used in this study. The methodology is comparable with recent policy analyses of the World Bank, the IMF and the OECD, incorporating similar quantitative modeling frameworks. As basis for the analysis, IIDE’s CGE model, ICE, is employed. The GTAP data set, version 7.4, provides the data for the empirical implementation of the model. The database is the best, and most updated source for internally consistent data on production, consumption and international trade by country and sector. The GTAP data is benchmarked against Eurostat and OECD data. (For more information, please refer to Dimaran and McDougall (2006)). The GTAP data on protection incorporated the Macmaps data set, which includes a set of Ad Valorem Equivalents (AVEs) of border protection across the world. The source information concerns various instruments such as specific tariffs, mixed tariffs and quotas, which cannot be directly compared or summarised. In order to be of use in a CGE model, these have been converted into an AVE per sector, per country and per trading partner. Social accounting data are also based on the most recent version (7.0) of the GTAP data set. Impediments to trade in services are not as clearly visible, as is the case with tariffs for trade in merchandise. Rather, trade barriers in the service sector often entail prohibitions, quantitative restrictions and government regulations which limit market access to foreign suppliers. These are not easy to quantify. In order to remedy this lack of data, we incorporate the data set stemming from Francois, Hoekman and Woertz (2007, 2008), in order to benchmark services trade by sector. From their panel estimates, we work with an estimated intra-EU effect, discussed below, that serves as the basis for the policy experiments for services. Their estimated average intra-EU coefficients imply a 35 to 40 percent greater trade volume when both partners are EU partners.
institute for international and development economics
IIDE 9
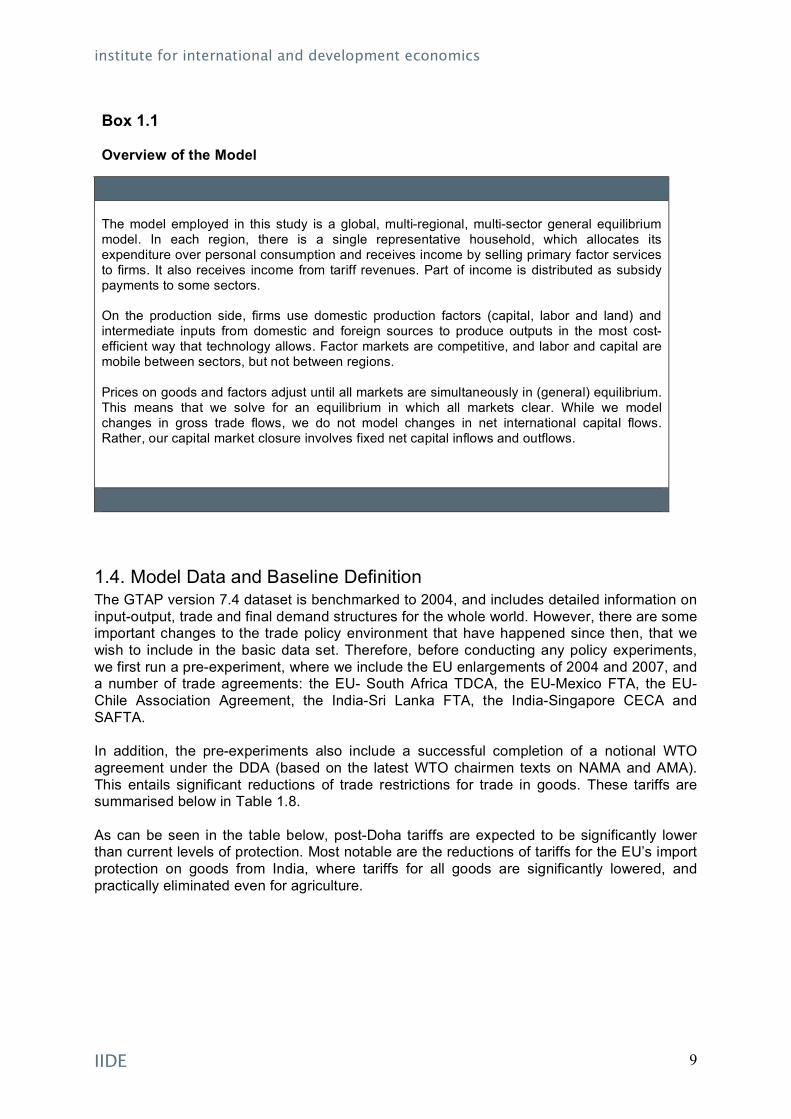
Box 1.1 Overview of the Model
The model employed in this study is a global, multi-regional, multi-sector general equilibrium model. In each region, there is a single representative household, which allocates its expenditure over personal consumption and receives income by selling primary factor services to firms. It also receives income from tariff revenues. Part of income is distributed as subsidy payments to some sectors. On the production side, firms use domestic production factors (capital, labor and land) and intermediate inputs from domestic and foreign sources to produce outputs in the most cost-efficient way that technology allows. Factor markets are competitive, and labor and capital are mobile between sectors, but not between regions. Prices on goods and factors adjust until all markets are simultaneously in (general) equilibrium. This means that we solve for an equilibrium in which all markets clear. While we model changes in gross trade flows, we do not model changes in net international capital flows. Rather, our capital market closure involves fixed net capital inflows and outflows.
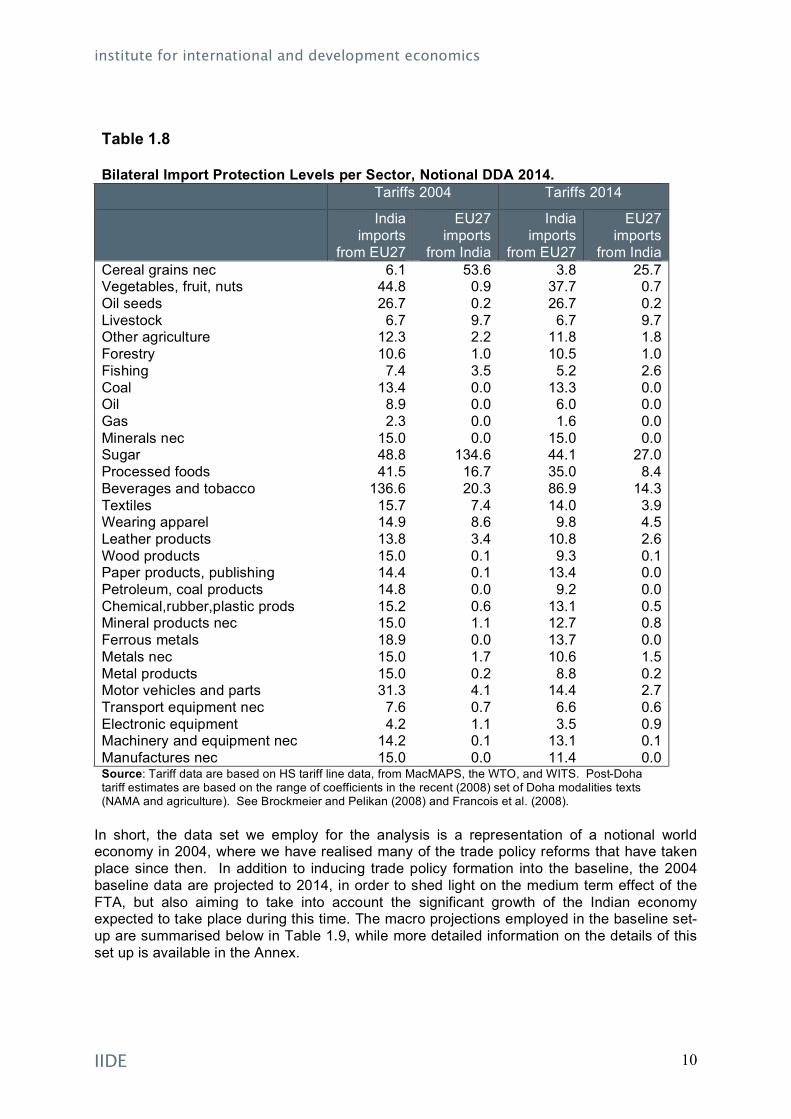
1.4. Model Data and Baseline Definition The GTAP version 7.4 dataset is benchmarked to 2004, and includes detailed information on input-output, trade and final demand structures for the whole world. However, there are some important changes to the trade policy environment that have happened since then, that we wish to include in the basic data set. Therefore, before conducting any policy experiments, we first run a pre-experiment, where we include the EU enlargements of 2004 and 2007, and a number of trade agreements: the EU- South Africa TDCA, the EU-Mexico FTA, the EU-Chile Association Agreement, the India-Sri Lanka FTA, the India-Singapore CECA and SAFTA. In addition, the pre-experiments also include a successful completion of a notional WTO agreement under the DDA (based on the latest WTO chairmen texts on NAMA and AMA). This entails significant reductions of trade restrictions for trade in goods. These tariffs are summarised below in Table 1.8. As can be seen in the table below, post-Doha tariffs are expected to be significantly lower than current levels of protection. Most notable are the reductions of tariffs for the EU’s import protection on goods from India, where tariffs for all goods are significantly lowered, and practically eliminated even for agriculture.
institute for international and development economics
IIDE 10
Table 1.8 Bilateral Import Protection Levels per Sector, Notional DDA 2014.
Tariffs 2004 Tariffs 2014
India imports
from EU27
EU27 imports
from India
India imports
from EU27
EU27 imports
from India Cereal grains nec 6.1 53.6 3.8 25.7 Vegetables, fruit, nuts 44.8 0.9 37.7 0.7 Oil seeds 26.7 0.2 26.7 0.2 Livestock 6.7 9.7 6.7 9.7 Other agriculture 12.3 2.2 11.8 1.8 Forestry 10.6 1.0 10.5 1.0 Fishing 7.4 3.5 5.2 2.6 Coal 13.4 0.0 13.3 0.0 Oil 8.9 0.0 6.0 0.0 Gas 2.3 0.0 1.6 0.0 Minerals nec 15.0 0.0 15.0 0.0 Sugar 48.8 134.6 44.1 27.0 Processed foods 41.5 16.7 35.0 8.4 Beverages and tobacco 136.6 20.3 86.9 14.3 Textiles 15.7 7.4 14.0 3.9 Wearing apparel 14.9 8.6 9.8 4.5 Leather products 13.8 3.4 10.8 2.6 Wood products 15.0 0.1 9.3 0.1 Paper products, publishing 14.4 0.1 13.4 0.0 Petroleum, coal products 14.8 0.0 9.2 0.0 Chemical,rubber,plastic prods 15.2 0.6 13.1 0.5 Mineral products nec 15.0 1.1 12.7 0.8 Ferrous metals 18.9 0.0 13.7 0.0 Metals nec 15.0 1.7 10.6 1.5 Metal products 15.0 0.2 8.8 0.2 Motor vehicles and parts 31.3 4.1 14.4 2.7 Transport equipment nec 7.6 0.7 6.6 0.6 Electronic equipment 4.2 1.1 3.5 0.9 Machinery and equipment nec 14.2 0.1 13.1 0.1 Manufactures nec 15.0 0.0 11.4 0.0 Source: Tariff data are based on HS tariff line data, from MacMAPS, the WTO, and WITS. Post-Doha tariff estimates are based on the range of coefficients in the recent (2008) set of Doha modalities texts (NAMA and agriculture). See Brockmeier and Pelikan (2008) and Francois et al. (2008).
In short, the data set we employ for the analysis is a representation of a notional world economy in 2004, where we have realised many of the trade policy reforms that have taken place since then. In addition to inducing trade policy formation into the baseline, the 2004 baseline data are projected to 2014, in order to shed light on the medium term effect of the FTA, but also aiming to take into account the significant growth of the Indian economy expected to take place during this time. The macro projections employed in the baseline set-up are summarised below in Table 1.9, while more detailed information on the details of this set up is available in the Annex.
institute for international and development economics
IIDE 11
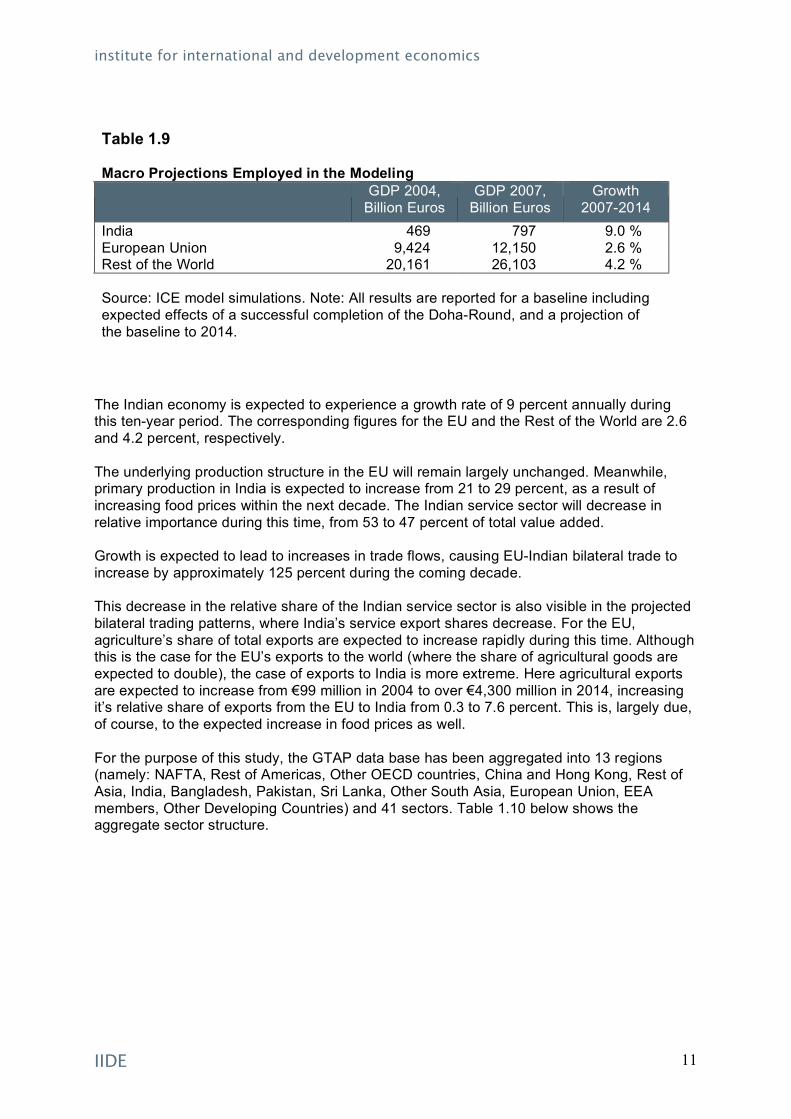
Table 1.9 Macro Projections Employed in the Modeling
GDP 2004, Billion Euros
GDP 2007, Billion Euros
Growth 2007-2014
India 469 797 9.0 % European Union 9,424 12,150 2.6 % Rest of the World 20,161 26,103 4.2 %
Source: ICE model simulations. Note: All results are reported for a baseline including expected effects of a successful completion of the Doha-Round, and a projection of the baseline to 2014.
The Indian economy is expected to experience a growth rate of 9 percent annually during this ten-year period. The corresponding figures for the EU and the Rest of the World are 2.6 and 4.2 percent, respectively. The underlying production structure in the EU will remain largely unchanged. Meanwhile, primary production in India is expected to increase from 21 to 29 percent, as a result of increasing food prices within the next decade. The Indian service sector will decrease in relative importance during this time, from 53 to 47 percent of total value added. Growth is expected to lead to increases in trade flows, causing EU-Indian bilateral trade to increase by approximately 125 percent during the coming decade. This decrease in the relative share of the Indian service sector is also visible in the projected bilateral trading patterns, where India’s service export shares decrease. For the EU, agriculture’s share of total exports are expected to increase rapidly during this time. Although this is the case for the EU’s exports to the world (where the share of agricultural goods are expected to double), the case of exports to India is more extreme. Here agricultural exports are expected to increase from €99 million in 2004 to over €4,300 million in 2014, increasing it’s relative share of exports from the EU to India from 0.3 to 7.6 percent. This is, largely due, of course, to the expected increase in food prices as well. For the purpose of this study, the GTAP data base has been aggregated into 13 regions (namely: NAFTA, Rest of Americas, Other OECD countries, China and Hong Kong, Rest of Asia, India, Bangladesh, Pakistan, Sri Lanka, Other South Asia, European Union, EEA members, Other Developing Countries) and 41 sectors. Table 1.10 below shows the aggregate sector structure.
institute for international and development economics
IIDE 12
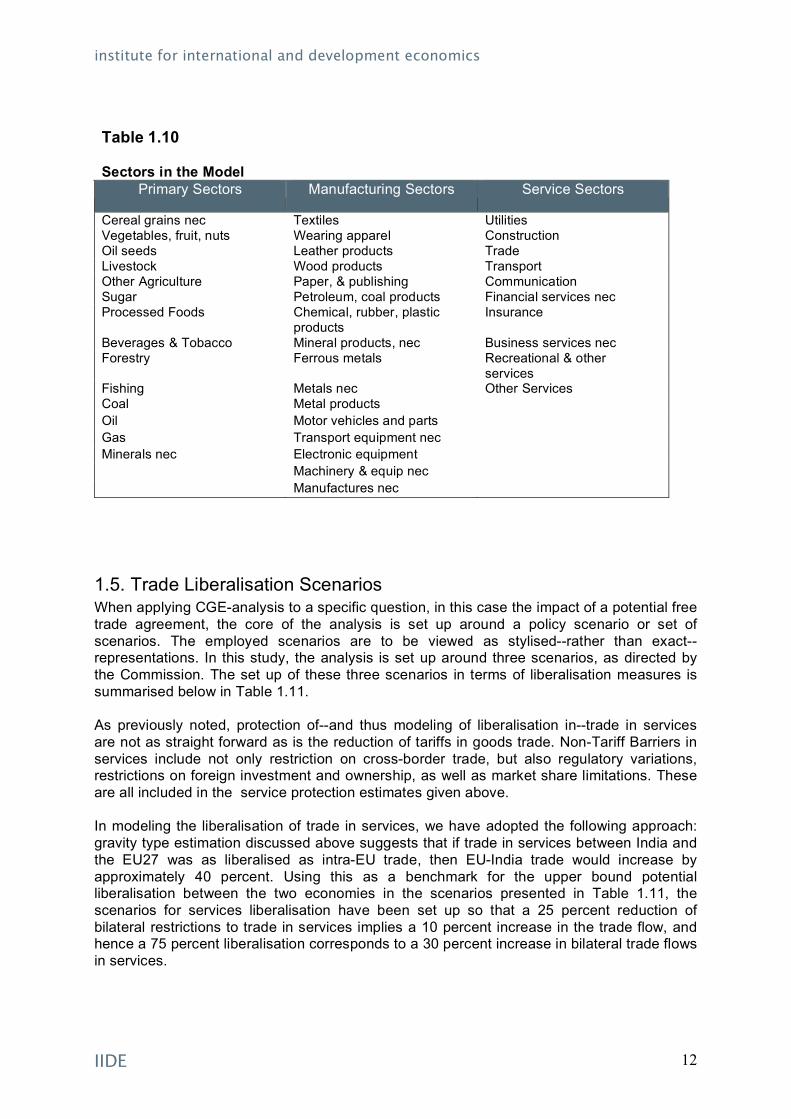
Table 1.10 Sectors in the Model
Primary Sectors Manufacturing Sectors Service Sectors
Cereal grains nec Textiles Utilities Vegetables, fruit, nuts Wearing apparel Construction Oil seeds Leather products Trade Livestock Wood products Transport Other Agriculture Paper, & publishing Communication Sugar Petroleum, coal products Financial services nec Processed Foods Chemical, rubber, plastic
products Insurance
Beverages & Tobacco Mineral products, nec Business services nec Forestry Ferrous metals Recreational & other
services Fishing Metals nec Other Services Coal Metal products Oil Motor vehicles and parts Gas Transport equipment nec Minerals nec Electronic equipment
Machinery & equip nec Manufactures nec
1.5. Trade Liberalisation Scenarios When applying CGE-analysis to a specific question, in this case the impact of a potential free trade agreement, the core of the analysis is set up around a policy scenario or set of scenarios. The employed scenarios are to be viewed as stylised--rather than exact-- representations. In this study, the analysis is set up around three scenarios, as directed by the Commission. The set up of these three scenarios in terms of liberalisation measures is summarised below in Table 1.11. As previously noted, protection of--and thus modeling of liberalisation in--trade in services are not as straight forward as is the reduction of tariffs in goods trade. Non-Tariff Barriers in services include not only restriction on cross-border trade, but also regulatory variations, restrictions on foreign investment and ownership, as well as market share limitations. These are all included in the service protection estimates given above. In modeling the liberalisation of trade in services, we have adopted the following approach: gravity type estimation discussed above suggests that if trade in services between India and the EU27 was as liberalised as intra-EU trade, then EU-India trade would increase by approximately 40 percent. Using this as a benchmark for the upper bound potential liberalisation between the two economies in the scenarios presented in Table 1.11, the scenarios for services liberalisation have been set up so that a 25 percent reduction of bilateral restrictions to trade in services implies a 10 percent increase in the trade flow, and hence a 75 percent liberalisation corresponds to a 30 percent increase in bilateral trade flows in services.
institute for international and development economics
IIDE 13
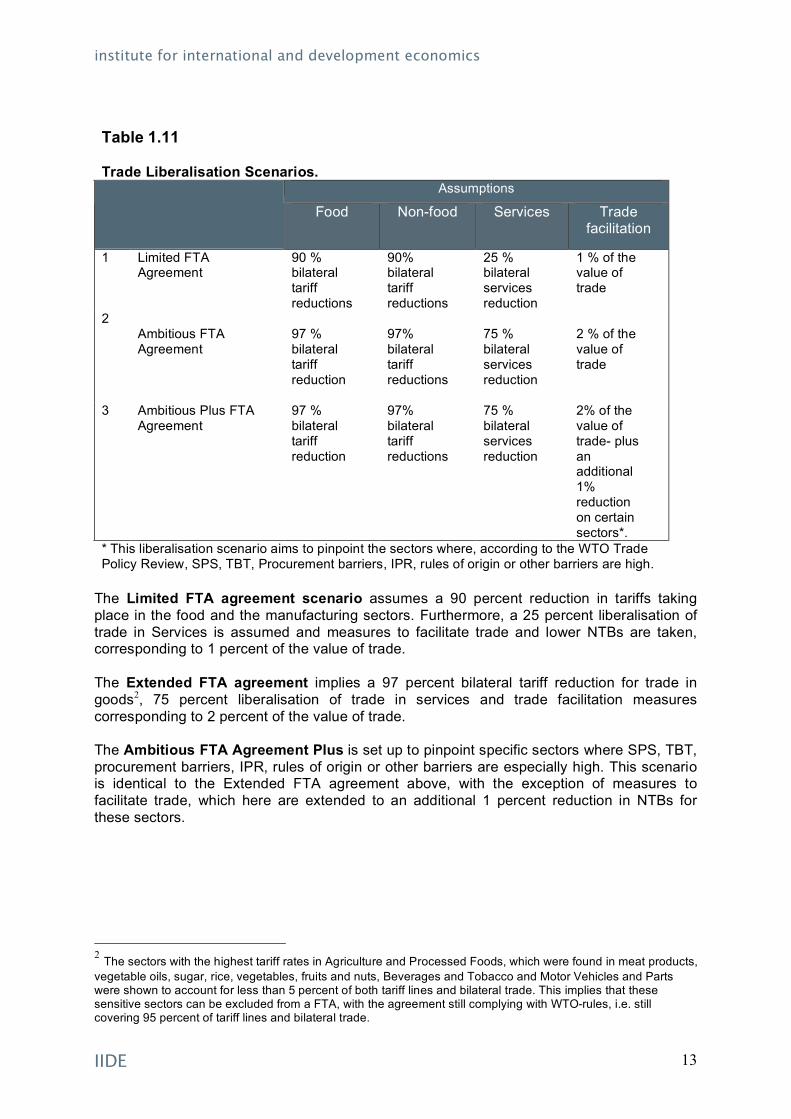
Table 1.11 Trade Liberalisation Scenarios.
Assumptions
Food Non-food Services Trade facilitation
1 Limited FTA Agreement
90 % bilateral tariff reductions
90% bilateral tariff reductions
25 % bilateral services reduction
1 % of the value of trade
2 Ambitious FTA Agreement
97 % bilateral tariff reduction
97% bilateral tariff reductions
75 % bilateral services reduction
2 % of the value of trade
3 Ambitious Plus FTA Agreement
97 % bilateral tariff reduction
97% bilateral tariff reductions
75 % bilateral services reduction
2% of the value of trade- plus an additional 1% reduction on certain sectors*.
* This liberalisation scenario aims to pinpoint the sectors where, according to the WTO Trade Policy Review, SPS, TBT, Procurement barriers, IPR, rules of origin or other barriers are high.
The Limited FTA agreement scenario assumes a 90 percent reduction in tariffs taking place in the food and the manufacturing sectors. Furthermore, a 25 percent liberalisation of trade in Services is assumed and measures to facilitate trade and lower NTBs are taken, corresponding to 1 percent of the value of trade. The Extended FTA agreement implies a 97 percent bilateral tariff reduction for trade in goods2, 75 percent liberalisation of trade in services and trade facilitation measures corresponding to 2 percent of the value of trade. The Ambitious FTA Agreement Plus is set up to pinpoint specific sectors where SPS, TBT, procurement barriers, IPR, rules of origin or other barriers are especially high. This scenario is identical to the Extended FTA agreement above, with the exception of measures to facilitate trade, which here are extended to an additional 1 percent reduction in NTBs for these sectors.
2 The sectors with the highest tariff rates in Agriculture and Processed Foods, which were found in meat products, vegetable oils, sugar, rice, vegetables, fruits and nuts, Beverages and Tobacco and Motor Vehicles and Parts were shown to account for less than 5 percent of both tariff lines and bilateral trade. This implies that these sensitive sectors can be excluded from a FTA, with the agreement still complying with WTO-rules, i.e. still covering 95 percent of tariff lines and bilateral trade.
institute for international and development economics
IIDE 14
2. Results We now turn to the results of the analysis, as outlined in Chapter 1. In this chapter, we focus on describing and discussing the main results, while more details are available in the Annex. The analysis of the effects of a potential FTA is set up in two steps. First there are the static effects, i.e. the trade, consumption, income and resource allocation effects that follow directly from the liberalisation of trade between India and the EU. Given the 2014 baseline, these short-run estimates provide an immediate assessment of imposing the FTA in 2014. In addition to the short-run effects, the FTA is also expected to give rise to a number of dynamic effects. A more liberal trading environment between the EU and India should enhance investment and innovation incentives, resulting in a faster pace of capital accumulation. These additional boosts to economic growth are expected to take a little longer to be fully realised, perhaps up to a decade. Thus, the analysis of the results are divided into three parts. First, we offer an overview/summary of the main results. The second part of this chapter focuses on the estimated short-run effects of the FTA, while the dynamic results are discussed in the third part of the chapter.
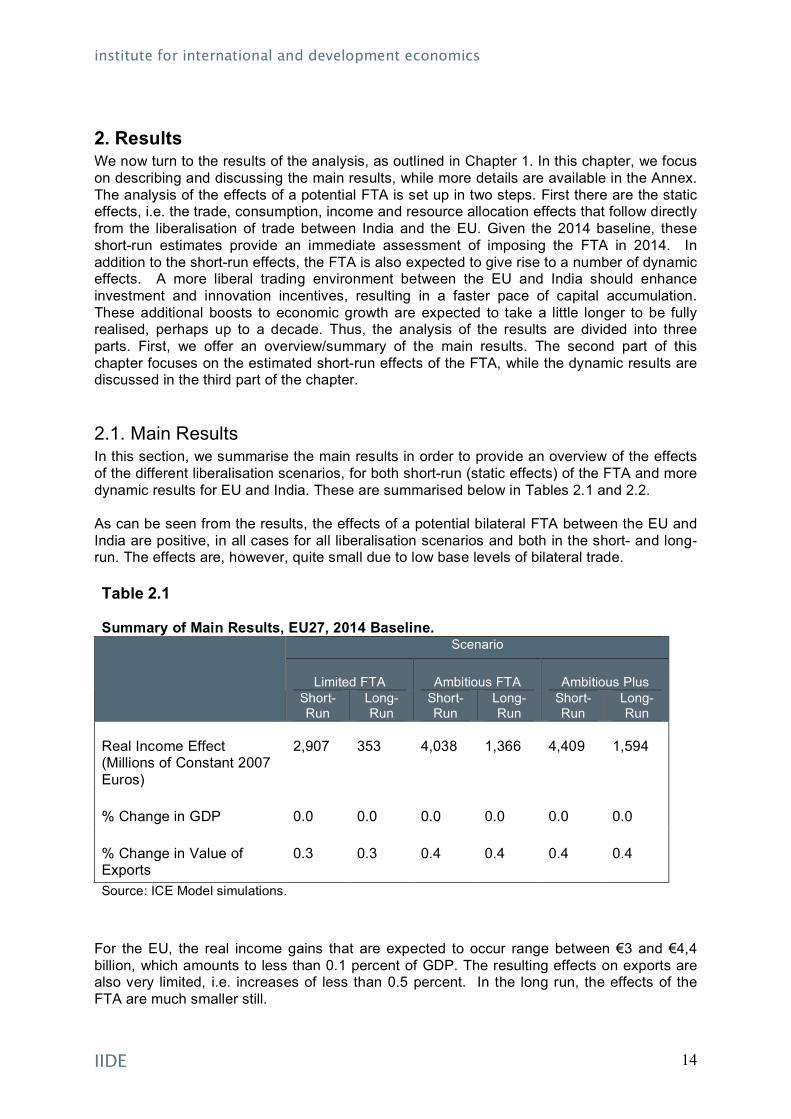
2.1. Main Results In this section, we summarise the main results in order to provide an overview of the effects of the different liberalisation scenarios, for both short-run (static effects) of the FTA and more dynamic results for EU and India. These are summarised below in Tables 2.1 and 2.2. As can be seen from the results, the effects of a potential bilateral FTA between the EU and India are positive, in all cases for all liberalisation scenarios and both in the short- and long- run. The effects are, however, quite small due to low base levels of bilateral trade. Table 2.1 Summary of Main Results, EU27, 2014 Baseline.
Scenario
Limited FTA
Ambitious FTA
Ambitious Plus
Short-Run
Long-Run
Short-Run
Long-Run
Short-Run
Long-Run
Real Income Effect (Millions of Constant 2007 Euros)
2,907 353 4,038 1,366 4,409 1,594
% Change in GDP 0.0 0.0 0.0 0.0 0.0 0.0
% Change in Value of Exports
0.3 0.3 0.4 0.4 0.4 0.4
Source: ICE Model simulations.
For the EU, the real income gains that are expected to occur range between €3 and €4,4 billion, which amounts to less than 0.1 percent of GDP. The resulting effects on exports are also very limited, i.e. increases of less than 0.5 percent. In the long run, the effects of the FTA are much smaller still.
institute for international and development economics
IIDE 15
Table 2.2 Summary of Main Results, India, 2014 Baseline.
Scenario
Limited FTA
Ambitious FTA
Ambitious Plus
Short-Run
Long-Run
Short-Run
Long-Run
Short-Run
Long-Run
Real Income Effect (Millions of Constant 2007 Euros)
1,462 9,571 4,268 15,938 4,987 17,704
% Change in GDP 0.1 1.0 0.3 1.5 0.3 1.5
% Change in Value of Exports
0.3 5.0 0.4 6.8 0.4 7.7
Source: ICE Model simulations
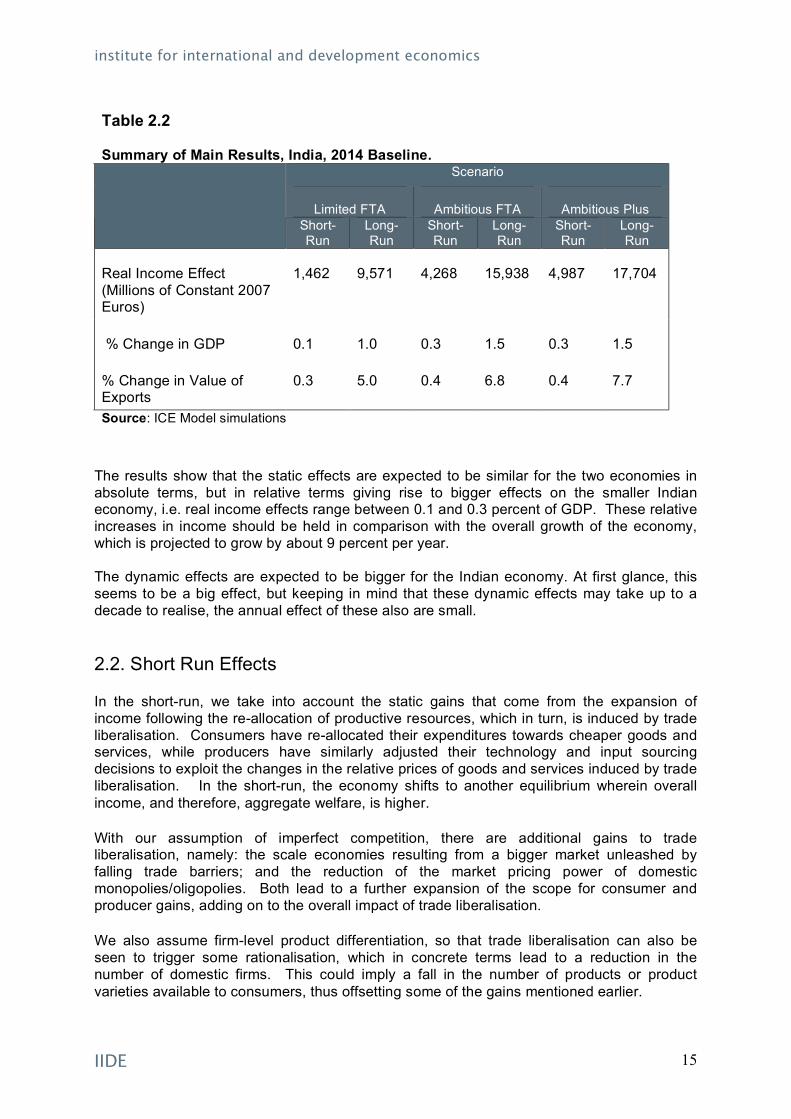
The results show that the static effects are expected to be similar for the two economies in absolute terms, but in relative terms giving rise to bigger effects on the smaller Indian economy, i.e. real income effects range between 0.1 and 0.3 percent of GDP. These relative increases in income should be held in comparison with the overall growth of the economy, which is projected to grow by about 9 percent per year. The dynamic effects are expected to be bigger for the Indian economy. At first glance, this seems to be a big effect, but keeping in mind that these dynamic effects may take up to a decade to realise, the annual effect of these also are small.
2.2. Short Run Effects
In the short-run, we take into account the static gains that come from the expansion of income following the re-allocation of productive resources, which in turn, is induced by trade liberalisation. Consumers have re-allocated their expenditures towards cheaper goods and services, while producers have similarly adjusted their technology and input sourcing decisions to exploit the changes in the relative prices of goods and services induced by trade liberalisation. In the short-run, the economy shifts to another equilibrium wherein overall income, and therefore, aggregate welfare, is higher.
With our assumption of imperfect competition, there are additional gains to trade liberalisation, namely: the scale economies resulting from a bigger market unleashed by falling trade barriers; and the reduction of the market pricing power of domestic monopolies/oligopolies. Both lead to a further expansion of the scope for consumer and producer gains, adding on to the overall impact of trade liberalisation.
We also assume firm-level product differentiation, so that trade liberalisation can also be seen to trigger some rationalisation, which in concrete terms lead to a reduction in the number of domestic firms. This could imply a fall in the number of products or product varieties available to consumers, thus offsetting some of the gains mentioned earlier.

institute for international and development economics
IIDE 16
Real Income Effects The estimations show that trade liberalisation is expected to have positive net income effects on both economies. As could be expected, the gains from liberalisation are higher the more trade barriers are removed, i.e. the gains in the Ambitious scenarios are greater than for the Limited FTA. The resulting effects in real income are summarised in Table 2.3. In absolute terms, the gains from increased bilateral openness is similar for both economies for all scenarios, ranging from €2 to €5 billion, but because of the difference in size in the economies, the relative effect is expected to be bigger for India (ranging from 0.1 to 0.3 percent of GDP). Table 2.3 Overview, Real Income Static Effects, Billions of 2007 Euros (% change from baseline)
Limited FTA Ambitious FTA
Ambitious Plus FTA
EU27 2,907 (0,0)
4,038 (0,0)
4,409 (0,0)
India 1,462 (0,1)
4,268 (0,3)
4,987 (0,3)
Source: ICE model simulations. Note: All results are reported for a baseline including expected effects of a successful completion of the Doha-Round, and a projection of baseline to 2014.
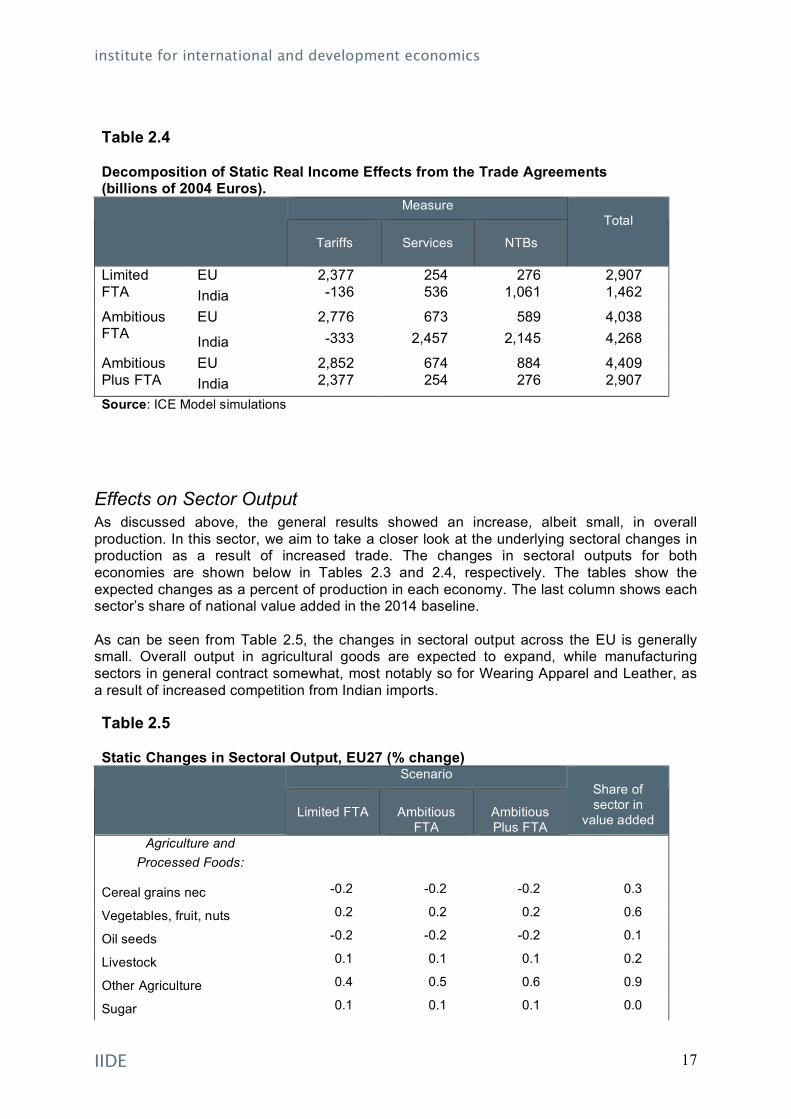
To find out more about the underlying reasons for the gains from trade, we decompose the effects with regards to each trade liberalisation measure, i.e. import protection in agriculture and food, import protection in manufacturing, barriers to trade in services as well as measures taken in order to liberalise trade. These are summarised below in Table 2.4. As can be seen in the table, for the EU, the greatest share of the gains from trade stems from the reduction of tariffs, while liberalisation of services and Non-Tariff Barriers (NTBs) are less important for realizing the gains from increased trade with India. For India, the measures taken to facilitate trade and lower NTBs are accountable for approximately half of the potential gains from a bilateral FTA with the EU. Comparing the outcome of the Ambitious to the Ambitious Plus scenarios, where the difference lies in the measures taken to lower NTBs/facilitate trade, this implies an increase in the Indian real income by increase of €700 million.
institute for international and development economics
IIDE 17
Table 2.4 Decomposition of Static Real Income Effects from the Trade Agreements (billions of 2004 Euros).
Measure
Tariffs
Services
NTBs
Total
EU 2,377 254 276 2,907 Limited FTA India -136 536 1,061 1,462
EU 2,776 673 589 4,038 Ambitious FTA India -333 2,457 2,145 4,268
EU 2,852 674 884 4,409 Ambitious Plus FTA India 2,377 254 276 2,907
Source: ICE Model simulations
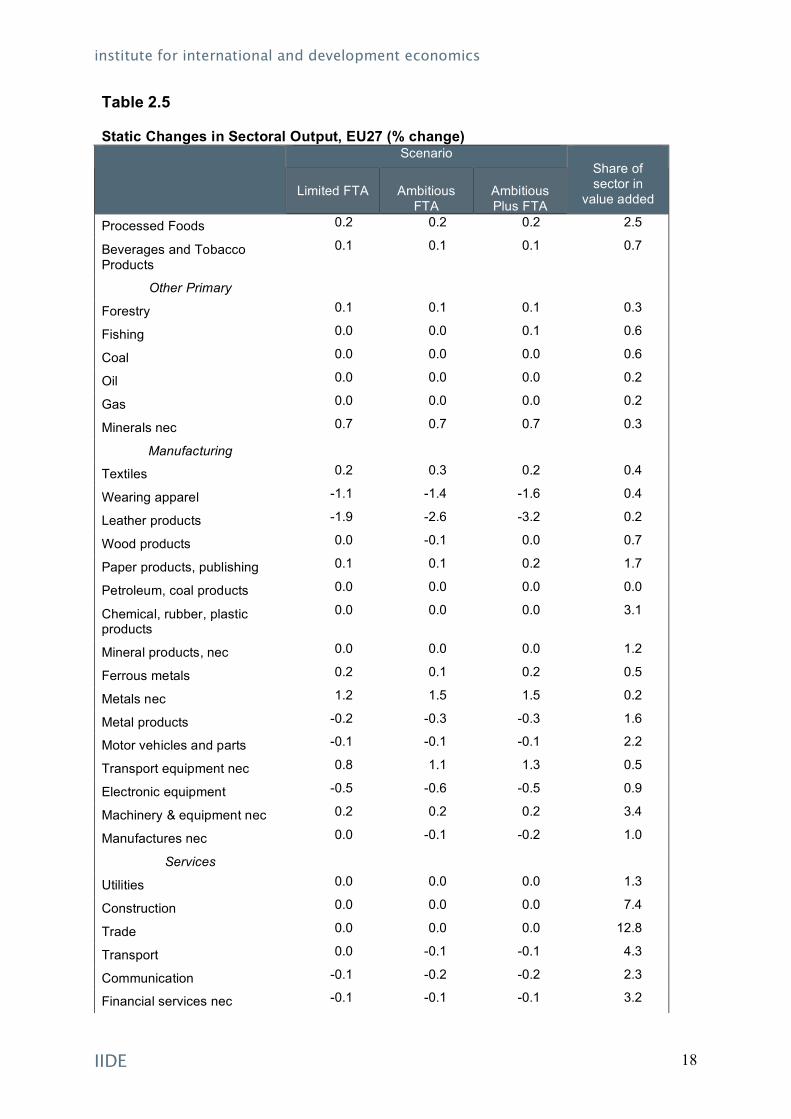
Effects on Sector Output As discussed above, the general results showed an increase, albeit small, in overall production. In this sector, we aim to take a closer look at the underlying sectoral changes in production as a result of increased trade. The changes in sectoral outputs for both economies are shown below in Tables 2.3 and 2.4, respectively. The tables show the expected changes as a percent of production in each economy. The last column shows each sector’s share of national value added in the 2014 baseline. As can be seen from Table 2.5, the changes in sectoral output across the EU is generally small. Overall output in agricultural goods are expected to expand, while manufacturing sectors in general contract somewhat, most notably so for Wearing Apparel and Leather, as a result of increased competition from Indian imports. Table 2.5 Static Changes in Sectoral Output, EU27 (% change)
Scenario
Limited FTA
Ambitious
FTA
Ambitious Plus FTA
Share of sector in
value added
Agriculture and Processed Foods:
Cereal grains nec -0.2 -0.2 -0.2 0.3
Vegetables, fruit, nuts 0.2 0.2 0.2 0.6
Oil seeds -0.2 -0.2 -0.2 0.1
Livestock 0.1 0.1 0.1 0.2
Other Agriculture 0.4 0.5 0.6 0.9
Sugar 0.1 0.1 0.1 0.0
institute for international and development economics
IIDE 18
Table 2.5 Static Changes in Sectoral Output, EU27 (% change)
Scenario
Limited FTA
Ambitious
FTA
Ambitious Plus FTA
Share of sector in
value added
Processed Foods 0.2 0.2 0.2 2.5
Beverages and Tobacco Products
0.1 0.1 0.1 0.7
Other Primary
Forestry 0.1 0.1 0.1 0.3
Fishing 0.0 0.0 0.1 0.6
Coal 0.0 0.0 0.0 0.6
Oil 0.0 0.0 0.0 0.2
Gas 0.0 0.0 0.0 0.2
Minerals nec 0.7 0.7 0.7 0.3
Manufacturing
Textiles 0.2 0.3 0.2 0.4
Wearing apparel -1.1 -1.4 -1.6 0.4
Leather products -1.9 -2.6 -3.2 0.2
Wood products 0.0 -0.1 0.0 0.7
Paper products, publishing 0.1 0.1 0.2 1.7
Petroleum, coal products 0.0 0.0 0.0 0.0
Chemical, rubber, plastic products
0.0 0.0 0.0 3.1
Mineral products, nec 0.0 0.0 0.0 1.2
Ferrous metals 0.2 0.1 0.2 0.5
Metals nec 1.2 1.5 1.5 0.2
Metal products -0.2 -0.3 -0.3 1.6
Motor vehicles and parts -0.1 -0.1 -0.1 2.2
Transport equipment nec 0.8 1.1 1.3 0.5
Electronic equipment -0.5 -0.6 -0.5 0.9
Machinery & equipment nec 0.2 0.2 0.2 3.4
Manufactures nec 0.0 -0.1 -0.2 1.0
Services
Utilities 0.0 0.0 0.0 1.3
Construction 0.0 0.0 0.0 7.4
Trade 0.0 0.0 0.0 12.8
Transport 0.0 -0.1 -0.1 4.3
Communication -0.1 -0.2 -0.2 2.3
Financial services nec -0.1 -0.1 -0.1 3.2
institute for international and development economics
IIDE 19
Table 2.5 Static Changes in Sectoral Output, EU27 (% change)
Scenario
Limited FTA
Ambitious
FTA
Ambitious Plus FTA
Share of sector in
value added
Insurance -0.1 -0.1 -0.1 1.1
Business services nec 0.0 0.0 0.0 11.3
Recreational and other services
0.0 0.0 0.0 7.7
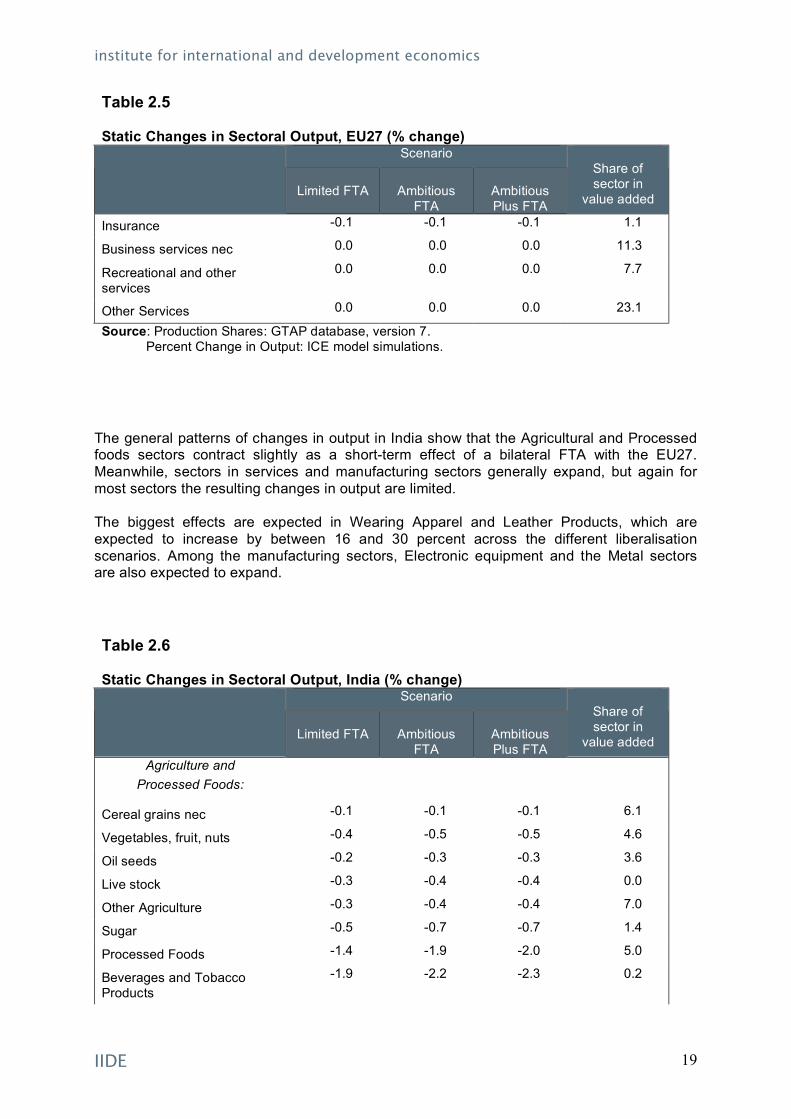
Other Services 0.0 0.0 0.0 23.1
Source: Production Shares: GTAP database, version 7. Percent Change in Output: ICE model simulations.
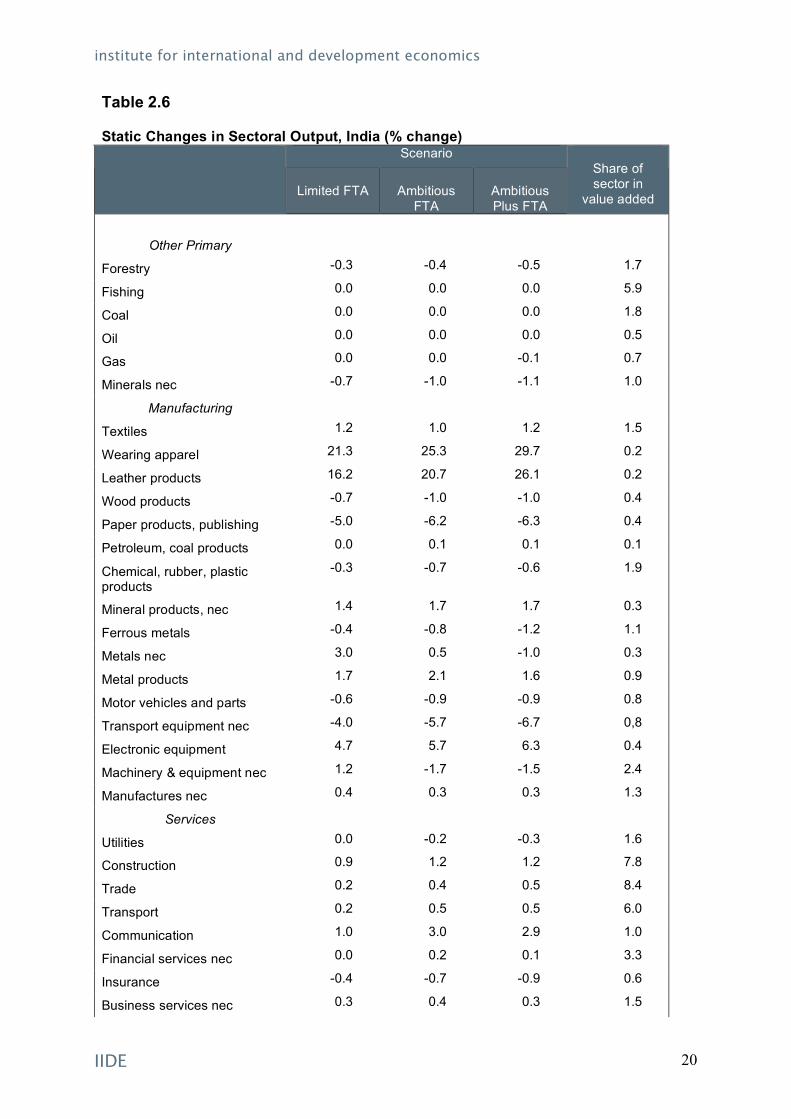
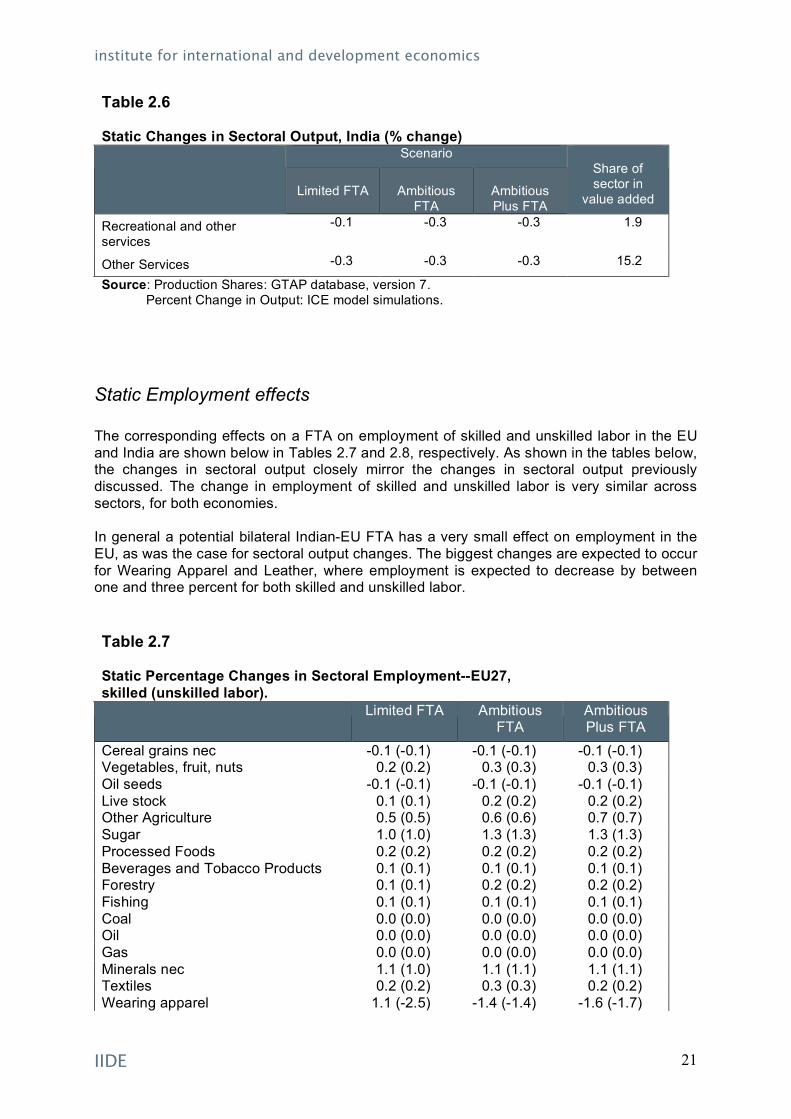
The general patterns of changes in output in India show that the Agricultural and Processed foods sectors contract slightly as a short-term effect of a bilateral FTA with the EU27. Meanwhile, sectors in services and manufacturing sectors generally expand, but again for most sectors the resulting changes in output are limited. The biggest effects are expected in Wearing Apparel and Leather Products, which are expected to increase by between 16 and 30 percent across the different liberalisation scenarios. Among the manufacturing sectors, Electronic equipment and the Metal sectors are also expected to expand. Table 2.6 Static Changes in Sectoral Output, India (% change)
Scenario
Limited FTA
Ambitious
FTA
Ambitious Plus FTA
Share of sector in
value added
Agriculture and Processed Foods:
Cereal grains nec -0.1 -0.1 -0.1 6.1
Vegetables, fruit, nuts -0.4 -0.5 -0.5 4.6
Oil seeds -0.2 -0.3 -0.3 3.6
Live stock -0.3 -0.4 -0.4 0.0
Other Agriculture -0.3 -0.4 -0.4 7.0
Sugar -0.5 -0.7 -0.7 1.4
Processed Foods -1.4 -1.9 -2.0 5.0
Beverages and Tobacco Products
-1.9 -2.2 -2.3 0.2
institute for international and development economics
IIDE 20
Table 2.6 Static Changes in Sectoral Output, India (% change)
Scenario
Limited FTA
Ambitious
FTA
Ambitious Plus FTA
Share of sector in
value added
Other Primary
Forestry -0.3 -0.4 -0.5 1.7
Fishing 0.0 0.0 0.0 5.9
Coal 0.0 0.0 0.0 1.8
Oil 0.0 0.0 0.0 0.5
Gas 0.0 0.0 -0.1 0.7
Minerals nec -0.7 -1.0 -1.1 1.0
Manufacturing
Textiles 1.2 1.0 1.2 1.5
Wearing apparel 21.3 25.3 29.7 0.2
Leather products 16.2 20.7 26.1 0.2
Wood products -0.7 -1.0 -1.0 0.4
Paper products, publishing -5.0 -6.2 -6.3 0.4
Petroleum, coal products 0.0 0.1 0.1 0.1
Chemical, rubber, plastic products
-0.3 -0.7 -0.6 1.9
Mineral products, nec 1.4 1.7 1.7 0.3
Ferrous metals -0.4 -0.8 -1.2 1.1
Metals nec 3.0 0.5 -1.0 0.3
Metal products 1.7 2.1 1.6 0.9
Motor vehicles and parts -0.6 -0.9 -0.9 0.8
Transport equipment nec -4.0 -5.7 -6.7 0,8
Electronic equipment 4.7 5.7 6.3 0.4
Machinery & equipment nec 1.2 -1.7 -1.5 2.4
Manufactures nec 0.4 0.3 0.3 1.3
Services
Utilities 0.0 -0.2 -0.3 1.6
Construction 0.9 1.2 1.2 7.8
Trade 0.2 0.4 0.5 8.4
Transport 0.2 0.5 0.5 6.0
Communication 1.0 3.0 2.9 1.0
Financial services nec 0.0 0.2 0.1 3.3
Insurance -0.4 -0.7 -0.9 0.6
Business services nec 0.3 0.4 0.3 1.5
institute for international and development economics
IIDE 21
Table 2.6 Static Changes in Sectoral Output, India (% change)
Scenario
Limited FTA
Ambitious
FTA
Ambitious Plus FTA
Share of sector in
value added
Recreational and other services
-0.1 -0.3 -0.3 1.9
Other Services -0.3 -0.3 -0.3 15.2
Source: Production Shares: GTAP database, version 7. Percent Change in Output: ICE model simulations.
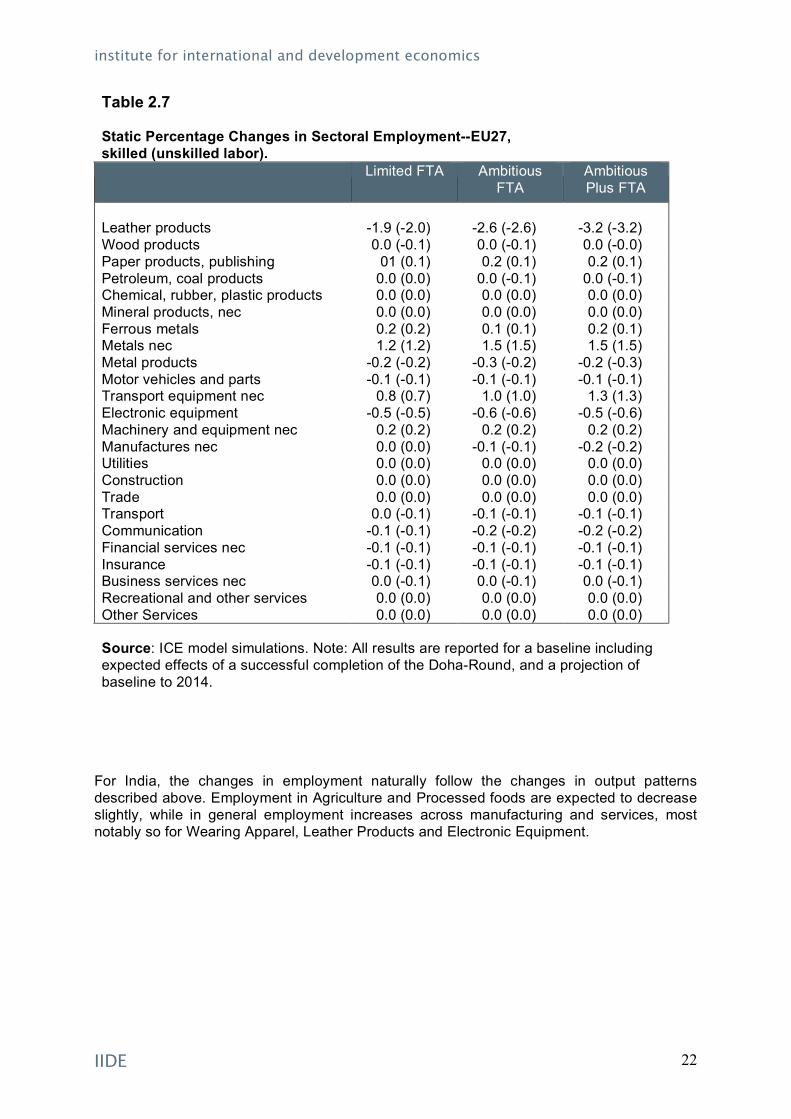
Static Employment effects The corresponding effects on a FTA on employment of skilled and unskilled labor in the EU and India are shown below in Tables 2.7 and 2.8, respectively. As shown in the tables below, the changes in sectoral output closely mirror the changes in sectoral output previously discussed. The change in employment of skilled and unskilled labor is very similar across sectors, for both economies. In general a potential bilateral Indian-EU FTA has a very small effect on employment in the EU, as was the case for sectoral output changes. The biggest changes are expected to occur for Wearing Apparel and Leather, where employment is expected to decrease by between one and three percent for both skilled and unskilled labor. Table 2.7 Static Percentage Changes in Sectoral Employment--EU27, skilled (unskilled labor).
Limited FTA Ambitious FTA
Ambitious Plus FTA
Cereal grains nec -0.1 (-0.1) -0.1 (-0.1) -0.1 (-0.1) Vegetables, fruit, nuts 0.2 (0.2) 0.3 (0.3) 0.3 (0.3) Oil seeds -0.1 (-0.1) -0.1 (-0.1) -0.1 (-0.1) Live stock 0.1 (0.1) 0.2 (0.2) 0.2 (0.2) Other Agriculture 0.5 (0.5) 0.6 (0.6) 0.7 (0.7) Sugar 1.0 (1.0) 1.3 (1.3) 1.3 (1.3) Processed Foods 0.2 (0.2) 0.2 (0.2) 0.2 (0.2) Beverages and Tobacco Products 0.1 (0.1) 0.1 (0.1) 0.1 (0.1) Forestry 0.1 (0.1) 0.2 (0.2) 0.2 (0.2) Fishing 0.1 (0.1) 0.1 (0.1) 0.1 (0.1) Coal 0.0 (0.0) 0.0 (0.0) 0.0 (0.0) Oil 0.0 (0.0) 0.0 (0.0) 0.0 (0.0) Gas 0.0 (0.0) 0.0 (0.0) 0.0 (0.0) Minerals nec 1.1 (1.0) 1.1 (1.1) 1.1 (1.1) Textiles 0.2 (0.2) 0.3 (0.3) 0.2 (0.2) Wearing apparel 1.1 (-2.5) -1.4 (-1.4) -1.6 (-1.7)
institute for international and development economics
IIDE 22
Table 2.7 Static Percentage Changes in Sectoral Employment--EU27, skilled (unskilled labor).
Limited FTA Ambitious FTA
Ambitious Plus FTA
Leather products -1.9 (-2.0) -2.6 (-2.6) -3.2 (-3.2) Wood products 0.0 (-0.1) 0.0 (-0.1) 0.0 (-0.0) Paper products, publishing 01 (0.1) 0.2 (0.1) 0.2 (0.1) Petroleum, coal products 0.0 (0.0) 0.0 (-0.1) 0.0 (-0.1) Chemical, rubber, plastic products 0.0 (0.0) 0.0 (0.0) 0.0 (0.0) Mineral products, nec 0.0 (0.0) 0.0 (0.0) 0.0 (0.0) Ferrous metals 0.2 (0.2) 0.1 (0.1) 0.2 (0.1) Metals nec 1.2 (1.2) 1.5 (1.5) 1.5 (1.5) Metal products -0.2 (-0.2) -0.3 (-0.2) -0.2 (-0.3) Motor vehicles and parts -0.1 (-0.1) -0.1 (-0.1) -0.1 (-0.1) Transport equipment nec 0.8 (0.7) 1.0 (1.0) 1.3 (1.3) Electronic equipment -0.5 (-0.5) -0.6 (-0.6) -0.5 (-0.6) Machinery and equipment nec 0.2 (0.2) 0.2 (0.2) 0.2 (0.2) Manufactures nec 0.0 (0.0) -0.1 (-0.1) -0.2 (-0.2) Utilities 0.0 (0.0) 0.0 (0.0) 0.0 (0.0) Construction 0.0 (0.0) 0.0 (0.0) 0.0 (0.0) Trade 0.0 (0.0) 0.0 (0.0) 0.0 (0.0) Transport 0.0 (-0.1) -0.1 (-0.1) -0.1 (-0.1) Communication -0.1 (-0.1) -0.2 (-0.2) -0.2 (-0.2) Financial services nec -0.1 (-0.1) -0.1 (-0.1) -0.1 (-0.1) Insurance -0.1 (-0.1) -0.1 (-0.1) -0.1 (-0.1) Business services nec 0.0 (-0.1) 0.0 (-0.1) 0.0 (-0.1) Recreational and other services 0.0 (0.0) 0.0 (0.0) 0.0 (0.0) Other Services 0.0 (0.0) 0.0 (0.0) 0.0 (0.0)
Source: ICE model simulations. Note: All results are reported for a baseline including expected effects of a successful completion of the Doha-Round, and a projection of baseline to 2014.
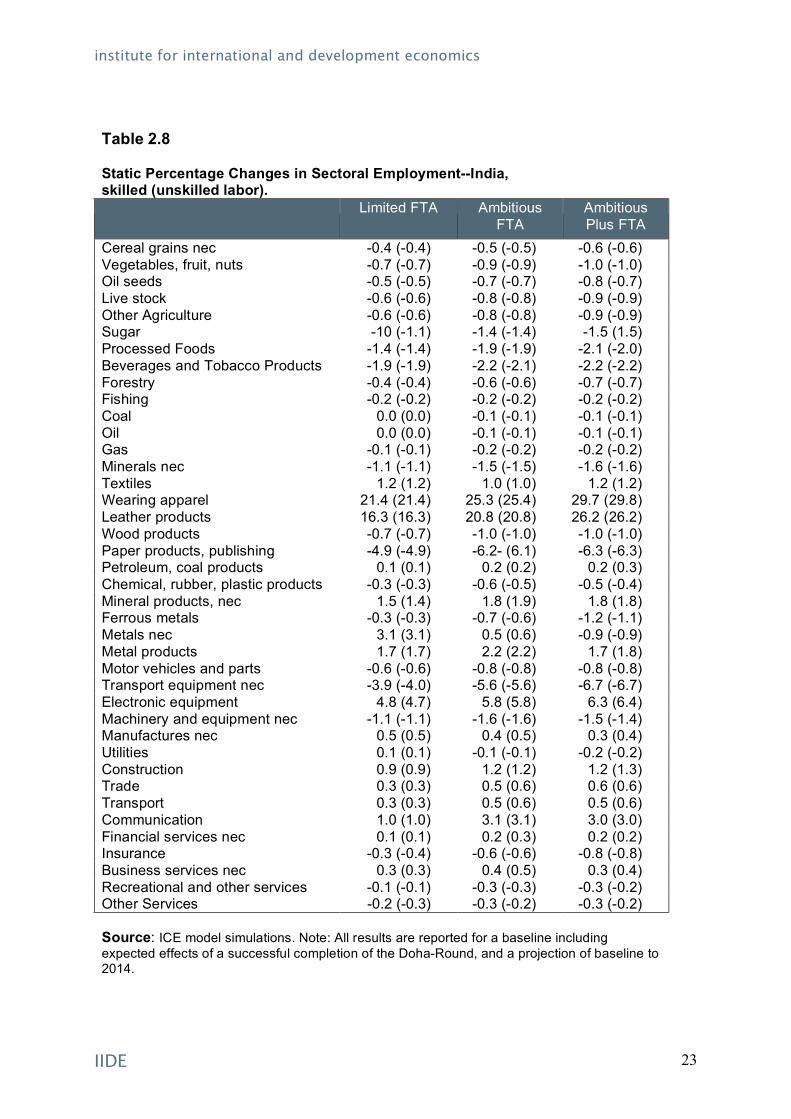
For India, the changes in employment naturally follow the changes in output patterns described above. Employment in Agriculture and Processed foods are expected to decrease slightly, while in general employment increases across manufacturing and services, most notably so for Wearing Apparel, Leather Products and Electronic Equipment.
institute for international and development economics
IIDE 23
Table 2.8 Static Percentage Changes in Sectoral Employment--India, skilled (unskilled labor).
Limited FTA Ambitious FTA
Ambitious Plus FTA
Cereal grains nec -0.4 (-0.4) -0.5 (-0.5) -0.6 (-0.6) Vegetables, fruit, nuts -0.7 (-0.7) -0.9 (-0.9) -1.0 (-1.0) Oil seeds -0.5 (-0.5) -0.7 (-0.7) -0.8 (-0.7) Live stock -0.6 (-0.6) -0.8 (-0.8) -0.9 (-0.9) Other Agriculture -0.6 (-0.6) -0.8 (-0.8) -0.9 (-0.9) Sugar -10 (-1.1) -1.4 (-1.4) -1.5 (1.5) Processed Foods -1.4 (-1.4) -1.9 (-1.9) -2.1 (-2.0) Beverages and Tobacco Products -1.9 (-1.9) -2.2 (-2.1) -2.2 (-2.2) Forestry -0.4 (-0.4) -0.6 (-0.6) -0.7 (-0.7) Fishing -0.2 (-0.2) -0.2 (-0.2) -0.2 (-0.2) Coal 0.0 (0.0) -0.1 (-0.1) -0.1 (-0.1) Oil 0.0 (0.0) -0.1 (-0.1) -0.1 (-0.1) Gas -0.1 (-0.1) -0.2 (-0.2) -0.2 (-0.2) Minerals nec -1.1 (-1.1) -1.5 (-1.5) -1.6 (-1.6) Textiles 1.2 (1.2) 1.0 (1.0) 1.2 (1.2) Wearing apparel 21.4 (21.4) 25.3 (25.4) 29.7 (29.8) Leather products 16.3 (16.3) 20.8 (20.8) 26.2 (26.2) Wood products -0.7 (-0.7) -1.0 (-1.0) -1.0 (-1.0) Paper products, publishing -4.9 (-4.9) -6.2- (6.1) -6.3 (-6.3) Petroleum, coal products 0.1 (0.1) 0.2 (0.2) 0.2 (0.3) Chemical, rubber, plastic products -0.3 (-0.3) -0.6 (-0.5) -0.5 (-0.4) Mineral products, nec 1.5 (1.4) 1.8 (1.9) 1.8 (1.8) Ferrous metals -0.3 (-0.3) -0.7 (-0.6) -1.2 (-1.1) Metals nec 3.1 (3.1) 0.5 (0.6) -0.9 (-0.9) Metal products 1.7 (1.7) 2.2 (2.2) 1.7 (1.8) Motor vehicles and parts -0.6 (-0.6) -0.8 (-0.8) -0.8 (-0.8) Transport equipment nec -3.9 (-4.0) -5.6 (-5.6) -6.7 (-6.7) Electronic equipment 4.8 (4.7) 5.8 (5.8) 6.3 (6.4) Machinery and equipment nec -1.1 (-1.1) -1.6 (-1.6) -1.5 (-1.4) Manufactures nec 0.5 (0.5) 0.4 (0.5) 0.3 (0.4) Utilities 0.1 (0.1) -0.1 (-0.1) -0.2 (-0.2) Construction 0.9 (0.9) 1.2 (1.2) 1.2 (1.3) Trade 0.3 (0.3) 0.5 (0.6) 0.6 (0.6) Transport 0.3 (0.3) 0.5 (0.6) 0.5 (0.6) Communication 1.0 (1.0) 3.1 (3.1) 3.0 (3.0) Financial services nec 0.1 (0.1) 0.2 (0.3) 0.2 (0.2) Insurance -0.3 (-0.4) -0.6 (-0.6) -0.8 (-0.8) Business services nec 0.3 (0.3) 0.4 (0.5) 0.3 (0.4) Recreational and other services -0.1 (-0.1) -0.3 (-0.3) -0.3 (-0.2) Other Services -0.2 (-0.3) -0.3 (-0.2) -0.3 (-0.2)
Source: ICE model simulations. Note: All results are reported for a baseline including expected effects of a successful completion of the Doha-Round, and a projection of baseline to 2014.

institute for international and development economics
IIDE 24
Static Effects on Wages
The resulting effects on wages are summarised below in Table 2.9. As shown in the table, the FTA is not expected to have any significant effect on the wages of European workers, whether skilled or unskilled. Table 2.9 Short-run Effect on European and Indian Wages.
Scenario
Limited FTA
Ambitious FTA
Ambitious Plus
India EU27 India EU27 India EU27
% Change in Unskilled Worker Wage
0.0 1.0 0.0 1.3 0.0 1.5
% Change in Skilled Worker Wage
0.0 0.9 0.0 1.3 0.0 1.4
Source: ICE Model simulations.
For India, wages are expected to increase by about 1 percent in the Limited Scenario and a little more for the Ambitious Scenarios. The estimated wage effects for skilled and unskilled labor are very similar.
Effects on Bilateral Trade Flows Here we focus on the resulting effect on bilateral trade flows. As can be seen below from Tables 2.10 and 2.11, trade flows are estimated to increase across all sectors for both the EU and India. Due to the set-up of the liberalisation of services, bilateral trade flows in all service sectors are expected to increase by 10 and 30 percent, respectively. As can be seen in Table 2.10, a bilateral FTA is expected to give rise to an increase in exports from the EU to India for all sectors, but most notably so for manufactured goods. Among these, the greatest increases are expected in Wearing Apparel, Leather, Gas, Metal industries and Electronic Equipment.

institute for international and development economics
IIDE 25
Table 2.10 Changes in Export Quantity, EU27 Exports to India (% change)
Scenario
Limited FTA
Ambitious
FTA
Ambitious Plus FTA
Share of sector in
bilateral trade
Cereal grains nec 11.3 16.7 16.5 0.0
Vegetables, fruit, nuts 7.2 10.2 10.1 0.5
Oil seeds 9.3 13.6 13.5 0.0
Live stock 6.3 9.6 9.5 0.0
Other Agriculture 11.9 17.3 22.6 4.6
Sugar 7.3 11.3 10.8 0.1
Processed Foods 17.4 21.6 26.2 1.4
Beverages and Tobacco Products
-1.1 -0.8 0.1 0.2
Forestry 7.2 11.2 10.7 0.5
Fishing 9.1 9.5 10.8 2.1
Coal 5.8 12.0 12.3 0.1
Oil 9.8 20.2 20.2 0.0
Gas 41.2 99.9 100.0 0.0
Minerals nec 4.3 5.5 5.6 26.7
Textiles 38.7 48.2 56.7 1.9
Wearing apparel 56.6 70.1 83.2 0.2
Leather products 43.7 57.8 73.0 0.3
Wood products 5.8 10.0 9.0 0.7
Paper products, publishing 1.1 3.8 3.0 1.8
Petroleum, coal products 3.2 6,6 6.6 0.2
Chemical, rubber, plastic products
11.2 16.7 22.8 4.6
Mineral products, nec 18.7 25.8 25.3 1.1
Ferrous metals 6.2 10.2 8.8 1.8
Metals nec 28.3 35.0 32.2 2.5
Metal products 11.2 17.5 15.9 0.5
Motor vehicles and parts 17.2 21,5 26.0 2.1
Transport equipment nec 9.5 14.2 20.8 3.9
Electronic equipment 24.7 35.7 46.2 1.6
Machinery and equipment nec
9.0 14.8 22.0 7.7
Manufactures nec 7.9 13.9 19.9 1.3
Utilities 10.0 30.0 30.0 0.8
Construction 10.0 30.0 30.0 3.5

institute for international and development economics
IIDE 26
Table 2.10 Changes in Export Quantity, EU27 Exports to India (% change)
Scenario
Limited FTA
Ambitious
FTA
Ambitious Plus FTA
Share of sector in
bilateral trade
Trade 10.0 30.0 30.0 0.4
Transport 10.0 30.0 30.0 4.5
Communication 10.0 30.0 30,0 1.0
Financial services nec 10.0 30.0 30.0 1.4
Insurance 10.0 30.0 30.0 0.8
Business services nec 10.0 30.0 30.0 16.2
Recreational and other services
10.0 30.0 30.0 1.6
Other Services 10.0 30.0 30.0 1.2
Source: ICE model simulations. .
Table 2.11 Changes in Export Quantity, Indian Exports to EU27 (% change)
Scenario
Limited FTA
Ambitious
FTA
Ambitious Plus FTA
Share of sector in
bilateral trade
Cereal grains nec 20.3 28.5 28.7 0.5
Vegetables, fruit, nuts 178.2 213.4 213.8 0.2
Oil seeds 176.4 214.3 214.8 0.0
Live stock 24.3 30.1 30.3 0.0
Other Agriculture 70.1 85.2 93.4 0.1
Sugar 473.9 607.9 611.0 0.1
Processed Foods 357.1 455.5 484.6 1.6
Beverages and Tobacco Products
245.6 300.7 306.8 0.0
Forestry 58.0 71.2 71.9 0.0
Fishing 11.6 16.1 18.1 0.0
Coal 106.2 127.9 127.4 0.0
Oil 89.8 117.9 118.0 0.0
Gas 125.3 222.8 222.9 0.0
Minerals nec 9.7 10.2 10.1 0.8
Textiles 148.4 187.5 207.4 3.2
institute for international and development economics
IIDE 27
Table 2.11 Changes in Export Quantity, Indian Exports to EU27 (% change)
Scenario
Limited FTA
Ambitious
FTA
Ambitious Plus FTA
Share of sector in
bilateral trade
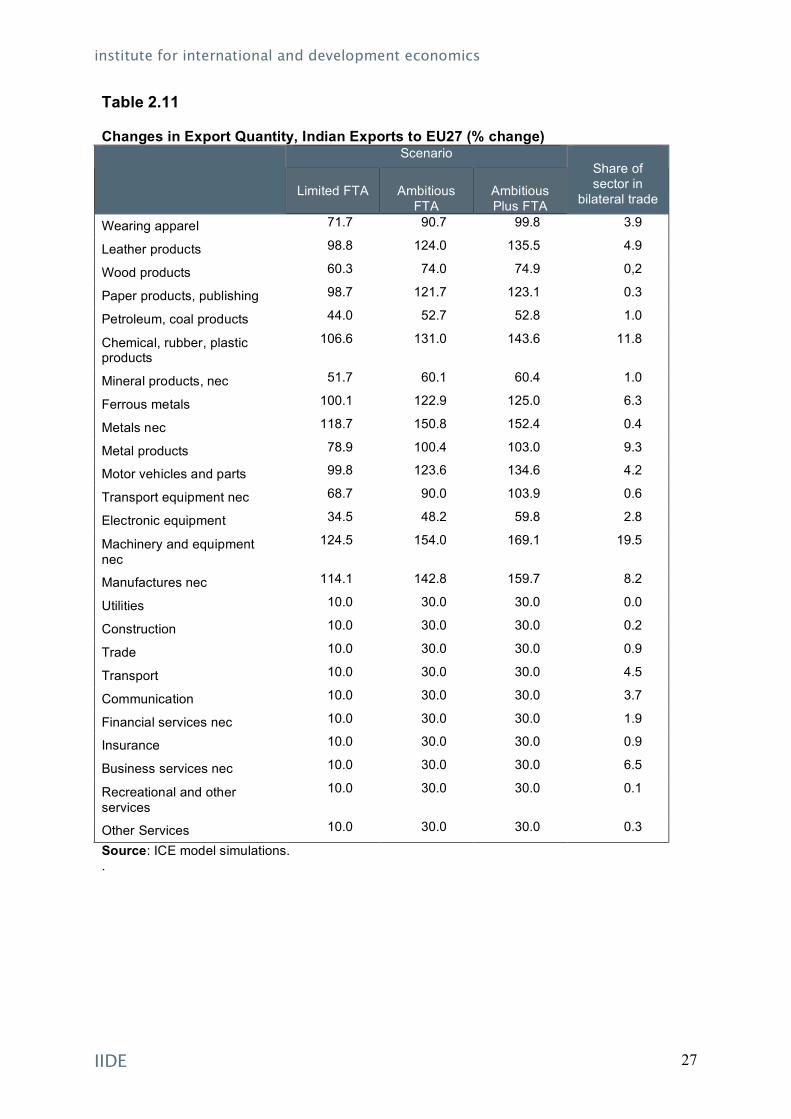
Wearing apparel 71.7 90.7 99.8 3.9
Leather products 98.8 124.0 135.5 4.9
Wood products 60.3 74.0 74.9 0,2
Paper products, publishing 98.7 121.7 123.1 0.3
Petroleum, coal products 44.0 52.7 52.8 1.0
Chemical, rubber, plastic products
106.6 131.0 143.6 11.8
Mineral products, nec 51.7 60.1 60.4 1.0
Ferrous metals 100.1 122.9 125.0 6.3
Metals nec 118.7 150.8 152.4 0.4
Metal products 78.9 100.4 103.0 9.3
Motor vehicles and parts 99.8 123.6 134.6 4.2
Transport equipment nec 68.7 90.0 103.9 0.6
Electronic equipment 34.5 48.2 59.8 2.8
Machinery and equipment nec
124.5 154.0 169.1 19.5
Manufactures nec 114.1 142.8 159.7 8.2
Utilities 10.0 30.0 30.0 0.0
Construction 10.0 30.0 30.0 0.2
Trade 10.0 30.0 30.0 0.9
Transport 10.0 30.0 30.0 4.5
Communication 10.0 30.0 30.0 3.7
Financial services nec 10.0 30.0 30.0 1.9
Insurance 10.0 30.0 30.0 0.9
Business services nec 10.0 30.0 30.0 6.5
Recreational and other services
10.0 30.0 30.0 0.1
Other Services 10.0 30.0 30.0 0.3
Source: ICE model simulations. .
institute for international and development economics
IIDE 28
(Does the following make sense?) Indian exports to the EU are expected to increase substantially, most notably for agricultural goods. Although these are sectors which, a priori, exhibit very low levels of exports, exports like sugar, for example, are expected to increase by up to 600 percent as a result of the FTA. The sectors which previously have been pointed out as having effects on output, Wearing apparel and Leather, are both expected to increase exports by approximately 100 percent.
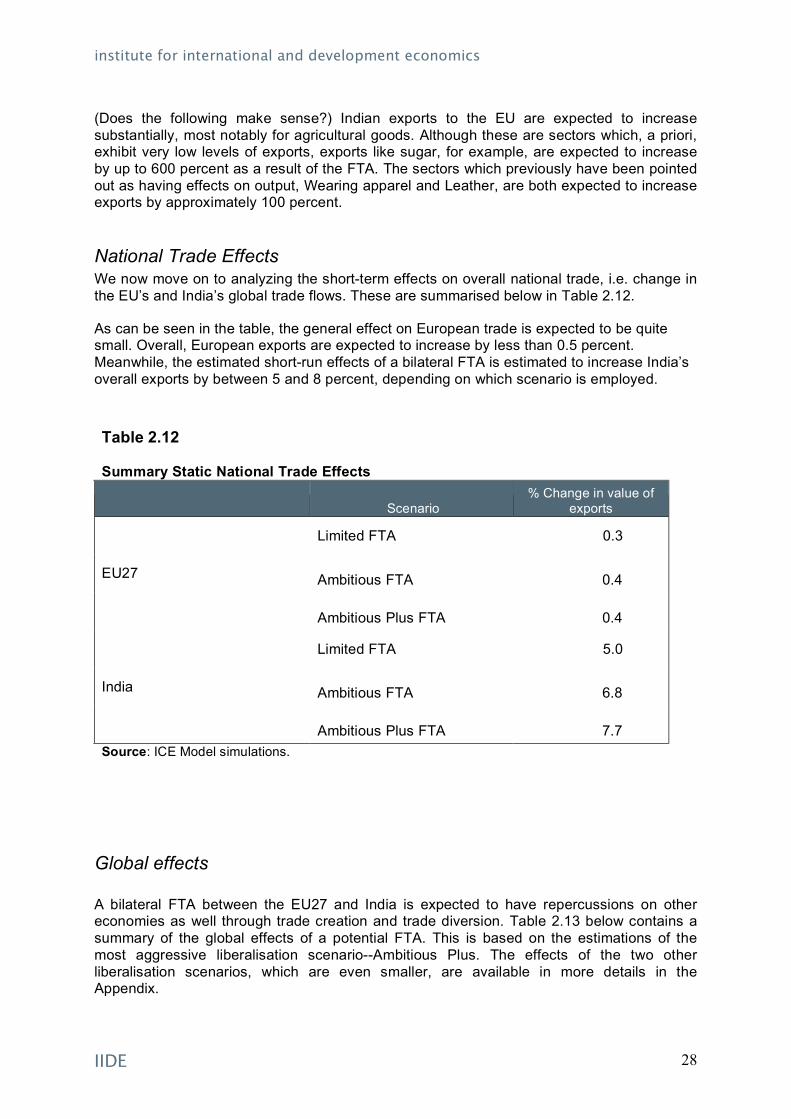
National Trade Effects We now move on to analyzing the short-term effects on overall national trade, i.e. change in the EU’s and India’s global trade flows. These are summarised below in Table 2.12.
As can be seen in the table, the general effect on European trade is expected to be quite small. Overall, European exports are expected to increase by less than 0.5 percent. Meanwhile, the estimated short-run effects of a bilateral FTA is estimated to increase India’s overall exports by between 5 and 8 percent, depending on which scenario is employed. Table 2.12 Summary Static National Trade Effects
Scenario % Change in value of
exports
Limited FTA 0.3
Ambitious FTA 0.4 EU27
Ambitious Plus FTA 0.4
Limited FTA 5.0
Ambitious FTA 6.8 India
Ambitious Plus FTA 7.7 Source: ICE Model simulations.
Global effects A bilateral FTA between the EU27 and India is expected to have repercussions on other economies as well through trade creation and trade diversion. Table 2.13 below contains a summary of the global effects of a potential FTA. This is based on the estimations of the most aggressive liberalisation scenario--Ambitious Plus. The effects of the two other liberalisation scenarios, which are even smaller, are available in more details in the Appendix.

institute for international and development economics
IIDE 29
As exhibited in the table, the global effects of even the most ambitious scenario is very small. There is no significant effect on GDP of any other than India’s closest trading partners. For Sri Lanka and Other South East Asia, the effect of trade diversion causes their exports to decrease by between one and one and a half percent, leading to a national income loss equivalent to about one-tenth of a percent of GDP.
Table 2.13 Third Country Effects, Ambitious Plus Scenario
National Income Effect million 2007 €
% Change in GDP
% Change in Value of Exports
Rest of World -3,615 -0.0 -0.1
Bangladesh -34 -0.0 -0.4
Pakistan -44 -0.0 -0.1
Sri Lanka -39 -0.0 -0.8
Other South Asia -32 -0.1 -1.3
Other Developing Countries -1,867 0.0 -0.1
Source: ICE model simulations. Note: All results are reported for a baseline including expected effects of a successful completion of the Doha-Round, and a projection of baseline to 2014.
2.3. Long Run/Dynamic Effects
In contrast with the static effects described above, we now consider the more long-run dynamic effects of an EU-India FTA. We no longer take aggregate capital as fixed, so that we now allow not only for changes in the sectoral allocation of capital stock, but also changes in the total stock of capital available. As mentioned earlier, theory predicts a rise in capital accumulation and innovation as a response to more liberal trading conditions,3 and specifically, to the economic growth following liberalisation. This assumption is also in line with the findings of Chakraborty and Basu (2002) showing the causality that runs from more Indian GDP growth to a rise in FDI. Theory, however, points to a two-way relationship both in the short- and long-run. Over the short-run, reduction of trade barriers attracts FDI which in turn affects growth via knowledge spill-over. In the long-run, technology transfer could be
3 In formal terms, consumers are modelled as optimizing their savings-consumption decisions across goods and services, and also over time, while firms are maximizing the present value of their future income flows.

institute for international and development economics
IIDE 30
expected to have positive structural effects on the receiving economy, and thus have a favourable impact on long-term growth as well.
The added impact of an EU-India FTA on capital accumulation, and thus on the long-run effects for the EU and the rest-of-the-world, appears to be trivial, although some impact is registered for India. This is hardly surprising given that barriers are higher in India to begin with, and therefore, the allocative and capital growth effects will be relatively more significant there as well. Hence, we focus in the following section on the results for the Indian economy, while the detailed results for the EU are reported in the Annex.
Income Effects Table 2.14 Overview, Real Income Dynamic/Long-Run Effects, Billions of 2007 Euros (% change from baseline)
Limited FTA Ambitious FTA
Ambitious Plus FTA
EU27 353 (0.0)
1,366 (0.0)
1,594 (0.0)
India 9,571 (1.0)
15,938 (1.5)
17,704 (1.6)
Source: ICE model simulations. Note: All results are reported for a baseline including expected effects of a successful completion of the Doha-Round, and a projection of baseline to 2014.
Over time, the FTA is expected to have a significant effect on the Indian economy. In addition to the initial, static effects, the FTA is expected to lead to long-run real income increases of between €10,000 and €18,000 million, which corresponds to an increase of somewhere between 1 and 1.6 percent of GDP. However, keeping in mind that this dynamic effect can take up to a decade to evolve, the yearly increase of between 0.1 and 0.15 percentage points are really quite small in comparison with the overall growth rate, which is expected to be around 9 percent per year.
Table 2.15 describes the decomposition of the dynamic real income effects resulting from the EU-India FTA. It is evident that tariff reduction, which was shown to have a limited effect on the short-term changes to the Indian economy, is the main factor for realizing the long-run gains to the Indian economy from a bilateral FTA with the EU. For the Limited FTA, tariff reductions account for close to two-thirds of the real income gains, and even in the most ambitious scenario, tariff reductions are still the most important liberalisation measure. Given the general equilibrium nature of the model used, the results here capture the many ways in which straightforward tariff liberalisation could affect overall incomes, and the difference between short- and long-run projects show the potential importance of taking into account the additional channels opened up by increased capital accumulation.
As expected, the relative impact of liberalisation in services is potentially bigger in the EU compared to India. Services are more important to the European economy, contributing more than 75 percent of total GDP, and around 70 percent of total employment, while for

institute for international and development economics
IIDE 31
India the relevant figures are 56 and 23 percent, respectively. One possible channel in which the opening up of Services via a FTA could impact on long-term incomes is through the competitive pressures unleashed by liberalisation, prompting providers to maintain market shares by undertaking higher levels of investment and innovation.
Table 2.15 Decomposition of Dynamic Real Income Effects from the Trade Agreements (billions of 2004 Euros).
Measure
Tariffs
Services
NTBs
Total
EU -141 666 -173 353 Limited FTA India 6,021 1,104 2,466 9,571
EU 42 1,647 -323 1,366 Ambitious FTA India 6,683 4,278 4,977 15,938
EU 141 1,648 -196 1,594 Ambitious Plus FTA India 6,776 4 256 6,672 17,704
Source: ICE Model simulations.
Output Effects
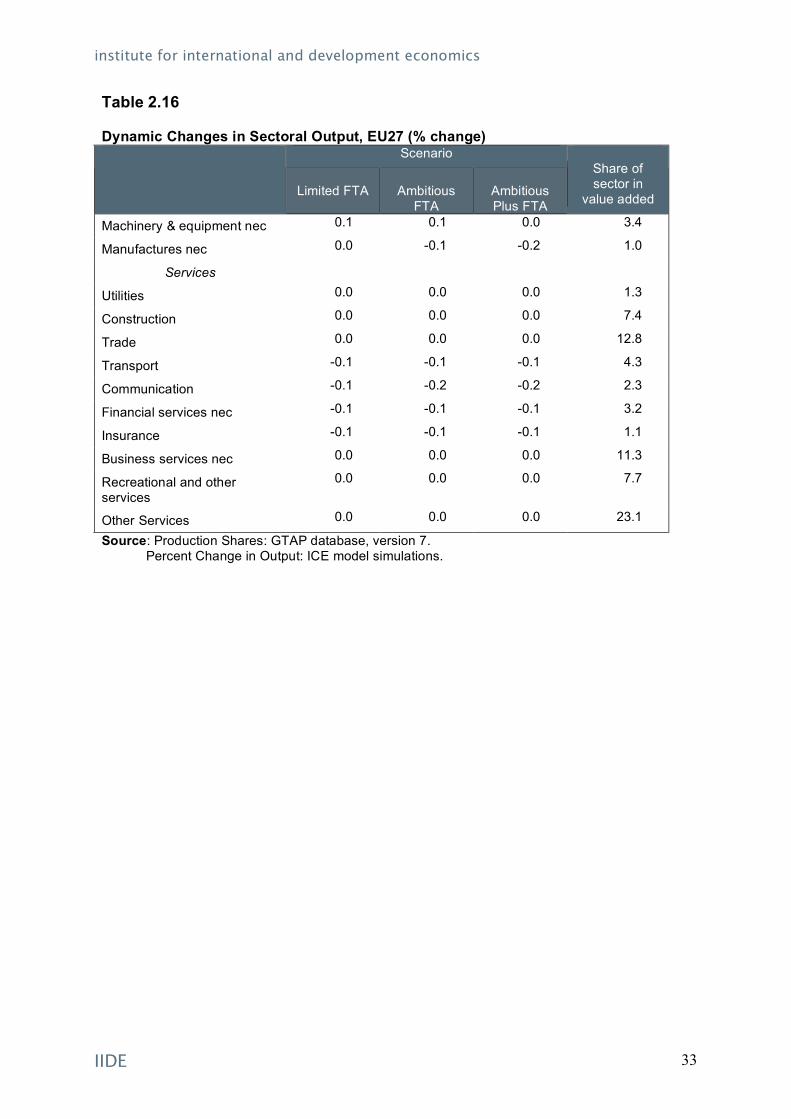
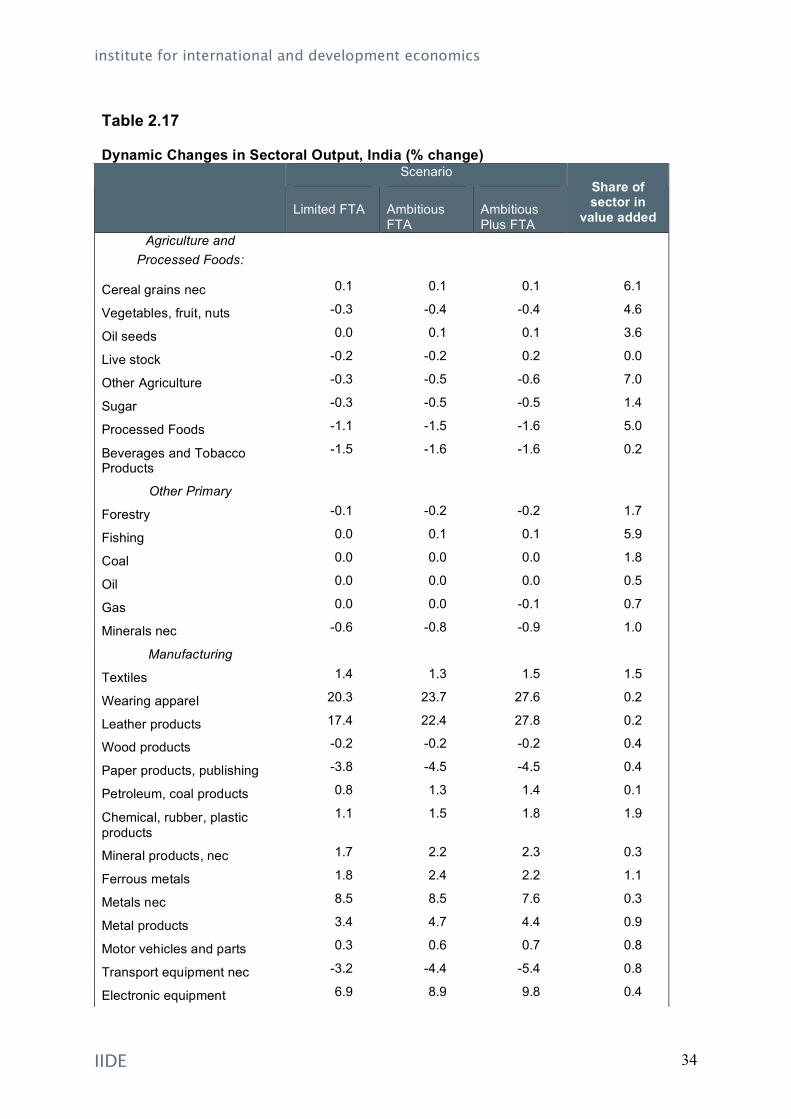
For the EU, one notes hardly any difference in the results of the static and dynamic experiments, especially where output effects are concerned. In some sectors, such as Textiles, Clothing and Leather, the slightly negative impact of bilateral liberalisation on EU output is somewhat tempered in the long-run. This is likely due to the increase in capital/technology investment as a response to greater competitive pressures from Indian imports. With India, however, the long-term impact on output is fairly more visible, as in the case of agriculture, and other manufacturing sectors such as Paper products/publishing, and Wood products. Indeed, for the more capital-intensive sectors such as Chemicals, the impact turned from negative to positive, while for other goods and services also with high capital intensity (e.g. Chemicals and Electronic products), there is a reasonable magnification of the favourable effect on output. Business and financial services have a particularly high capital-labour ratio, so that greater expansion of output is recorded once capital accumulation is taken into account in the long-run.

institute for international and development economics
IIDE 32
Table 2.16 Dynamic Changes in Sectoral Output, EU27 (% change)
Scenario
Limited FTA
Ambitious
FTA
Ambitious Plus FTA
Share of sector in
value added
Agriculture and Processed Foods:
Cereal grains nec -0.1 -0.2 -0.2 0.3
Vegetables, fruit, nuts 0.2 0.2 0.2 0.6
Oil seeds -0.1 -0.2 -0.2 0.1
Live stock 0.1 0.1 0.1 0.2
Other Agriculture 0.4 0.6 0.6 0.9
Sugar 0.8 1.1 1.1 0.0
Processed Foods 0.1 0.2 0.2 2.5
Beverages and Tobacco Products
0.1 0.1 0.1 0.7
Other Primary
Forestry 0.1 0.1 0.1 0.3
Fishing 0.0 0.0 0.1 0.6
Coal 0.0 0.0 0.0 0.6
Oil 0.0 0.0 0.0 0.2
Gas 0.0 0.0 0.0 0.2
Minerals nec 0.7 0.7 0.8 0.3
Manufacturing
Textiles 0.3 0.4 0.4 0.4
Wearing apparel -1.0 -1.2 -1.4 0.4
Leather products -2.0 -2.6 -3.3 0.2
Wood products 0.0 0.0 0.0 0.7
Paper products, publishing 0.1 0.1 0.1 1.7
Petroleum, coal products -0.1 -0.1 -0.1 0.0
Chemical, rubber, plastic products
0.0 -0.1 -0.1 3.1
Mineral products, nec 0.0 0.0 0.0 1.2
Ferrous metals 0.2 -0.1 0.2 0.5
Metals nec 1.1 1.4 1.4 0.2
Metal products -0.2 -0.4 -0.4 1.6
Motor vehicles and parts -0.1 -0.1 -0.1 2.2
Transport equipment nec 0.8 1.1 1.3 0.5
Electronic equipment -0.4 -0.5 -0.4 0.9
institute for international and development economics
IIDE 33
Table 2.16 Dynamic Changes in Sectoral Output, EU27 (% change)
Scenario
Limited FTA
Ambitious
FTA
Ambitious Plus FTA
Share of sector in
value added
Machinery & equipment nec 0.1 0.1 0.0 3.4
Manufactures nec 0.0 -0.1 -0.2 1.0
Services
Utilities 0.0 0.0 0.0 1.3
Construction 0.0 0.0 0.0 7.4
Trade 0.0 0.0 0.0 12.8
Transport -0.1 -0.1 -0.1 4.3
Communication -0.1 -0.2 -0.2 2.3
Financial services nec -0.1 -0.1 -0.1 3.2
Insurance -0.1 -0.1 -0.1 1.1
Business services nec 0.0 0.0 0.0 11.3
Recreational and other services
0.0 0.0 0.0 7.7
Other Services 0.0 0.0 0.0 23.1
Source: Production Shares: GTAP database, version 7. Percent Change in Output: ICE model simulations.
institute for international and development economics
IIDE 34
Table 2.17 Dynamic Changes in Sectoral Output, India (% change)
Scenario
Limited FTA
Ambitious FTA
Ambitious Plus FTA
Share of sector in
value added
Agriculture and Processed Foods:
Cereal grains nec 0.1 0.1 0.1 6.1
Vegetables, fruit, nuts -0.3 -0.4 -0.4 4.6
Oil seeds 0.0 0.1 0.1 3.6
Live stock -0.2 -0.2 0.2 0.0
Other Agriculture -0.3 -0.5 -0.6 7.0
Sugar -0.3 -0.5 -0.5 1.4
Processed Foods -1.1 -1.5 -1.6 5.0
Beverages and Tobacco Products
-1.5 -1.6 -1.6 0.2
Other Primary Forestry -0.1 -0.2 -0.2 1.7
Fishing 0.0 0.1 0.1 5.9
Coal 0.0 0.0 0.0 1.8
Oil 0.0 0.0 0.0 0.5
Gas 0.0 0.0 -0.1 0.7
Minerals nec -0.6 -0.8 -0.9 1.0
Manufacturing Textiles 1.4 1.3 1.5 1.5
Wearing apparel 20.3 23.7 27.6 0.2
Leather products 17.4 22.4 27.8 0.2
Wood products -0.2 -0.2 -0.2 0.4
Paper products, publishing -3.8 -4.5 -4.5 0.4
Petroleum, coal products 0.8 1.3 1.4 0.1
Chemical, rubber, plastic products
1.1 1.5 1.8 1.9
Mineral products, nec 1.7 2.2 2.3 0.3
Ferrous metals 1.8 2.4 2.2 1.1
Metals nec 8.5 8.5 7.6 0.3
Metal products 3.4 4.7 4.4 0.9
Motor vehicles and parts 0.3 0.6 0.7 0.8
Transport equipment nec -3.2 -4.4 -5.4 0.8
Electronic equipment 6.9 8.9 9.8 0.4

institute for international and development economics
IIDE 35
Table 2.17 Dynamic Changes in Sectoral Output, India (% change)
Scenario
Limited FTA
Ambitious FTA
Ambitious Plus FTA
Share of sector in
value added
Machinery & equipment nec 1.1 1.7 2.2 2.4
Manufactures nec 1.1 1.1 1.1 1.3
Services Utilities 1.1 1.4 1.5 1.6
Construction 1.1 1.6 1.7 7.8
Trade 1.0 1.5 1.6 8.4
Transport 1.0 1.6 1.7 6.0
Communication 2.0 4.5 4.5 1.0
Financial services nec 1.0 1.5 1.6 3.3
Insurance 0.9 1.2 1.2 0.6
Business services nec 1.0 1.6 1.6 1.5
Recreational and other services
0.6 0.8 0.9 1.9
Other Services 0.5 0.8 0.9 15.2
Source: Production Shares: GTAP database, version 7. Percent Change in Output: ICE model simulations.

institute for international and development economics
IIDE 36
Wage Effects
The effects on wages are summarised below in Table 2.18. Once again, the difference between the short- and long-run effects is trivial. There is some slight increase for India, especially under the Ambitious Plus Scenario for skilled wages, but overall, the dynamic effects can be considered to be skill-neutral: both skilled and unskilled wages rise in relatively the same proportions. Table 2.18 Long-run Effect on European and Indian Wages.
Scenario
Limited FTA
Ambitious FTA
Ambitious Plus
India EU27 India EU27 India EU27
% Change in Unskilled Worker Wage
0.0 1.0 0.0 1.5 0.0 1.6
% Change in Skilled Worker Wage
0.0 1.0 0.0 1.5 0.0 1.7
Source: ICE Model simulations.
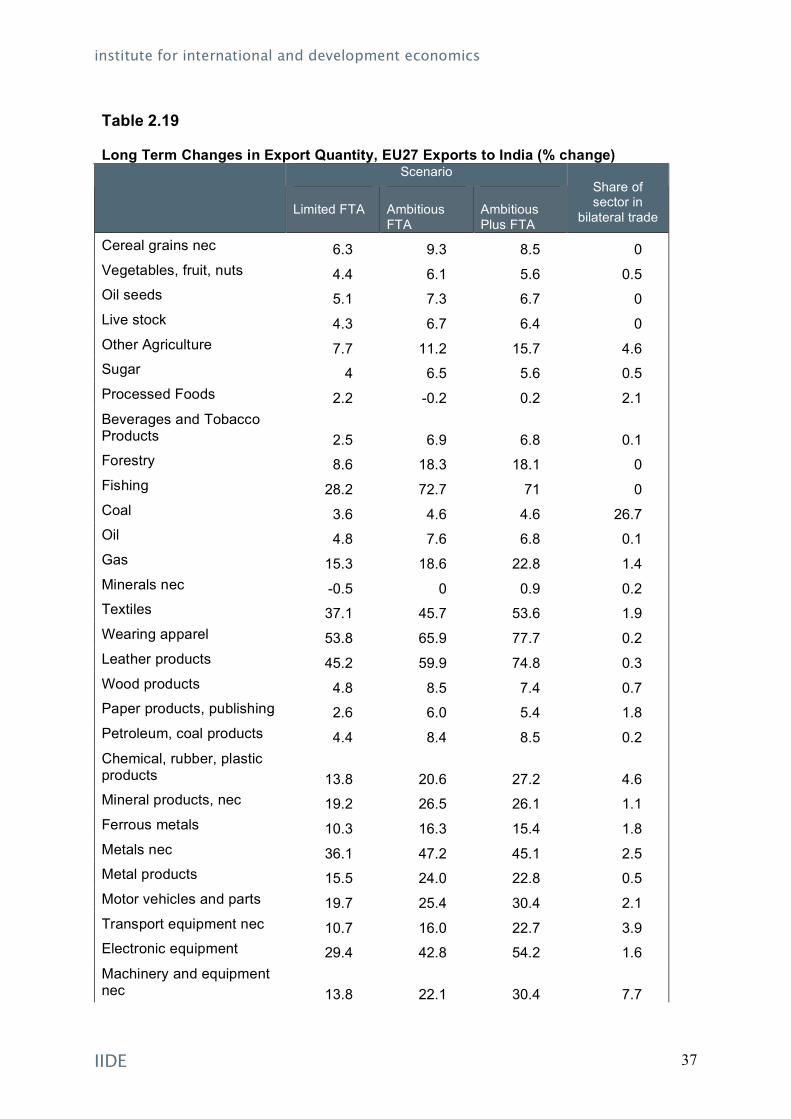
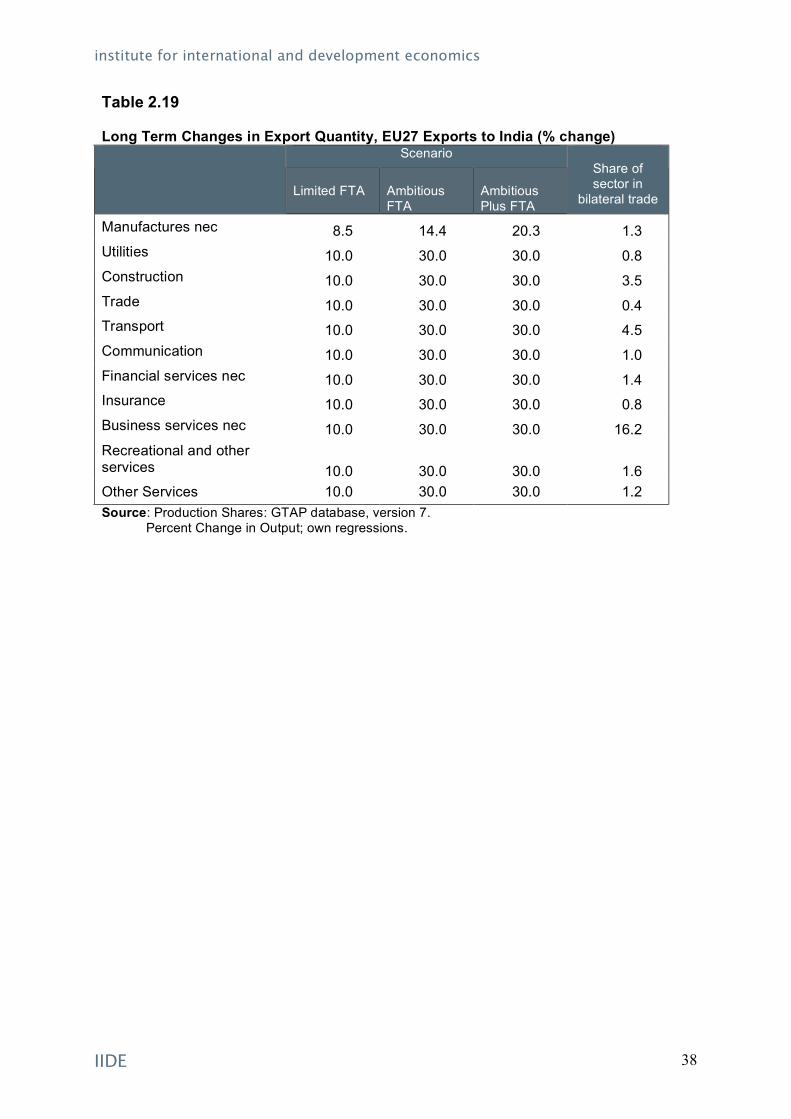
At first glance, it may seem peculiar that in the long-run dynamic experiment, the exports of the EU to India register lower growth rates compared to the short-run. Upon closer examination, however, one notes that in most of the important sectors for the EU, the dynamic effects are greater. For instance, exports of Chemicals, Rubber and plastic products expand by 22.8 percent in the short-run (under the most ambitious scenario), while allowing for dynamic effects leads to a 27.2 percent export increase. The additional impact is greatest for Motor vehicles and parts (30.4 percent compared to short-run effect of 26 percent), Electronic equipment (54.2 percent against 46.2 percent), and Machinery and other equipment (30.4 percent against 22.0 percent). These results seem to suggest that accounting for dynamic effects strengthens the process of sectoral specialisation towards products where comparative advantage might be the strongest. As to be expected, the first order effects of tariff liberalisation are strongest in the area of trade. All exports of India to the EU27 experience significant expansion in the long-run. It is worth noting, however, that export growth is lower in the long-run, precisely in the same sectors where the EU experienced the opposite effect. In chemical, rubber and plastic products, motor vehicles and parts, electronic equipment, and machinery and other equipment, the export performance of India is weaker in the long-run relative to the short-run. Bilateral liberalisation does seem to induce a shift in export patterns, and the dynamic analysis highlight such trends given that capital investment decisions are more sensitive to these structural changes. (
institute for international and development economics
IIDE 37
Table 2.19 Long Term Changes in Export Quantity, EU27 Exports to India (% change)
Scenario
Limited FTA
Ambitious FTA
Ambitious Plus FTA
Share of sector in
bilateral trade
Cereal grains nec 6.3 9.3 8.5 0 Vegetables, fruit, nuts 4.4 6.1 5.6 0.5 Oil seeds 5.1 7.3 6.7 0 Live stock 4.3 6.7 6.4 0 Other Agriculture 7.7 11.2 15.7 4.6 Sugar 4 6.5 5.6 0.5 Processed Foods 2.2 -0.2 0.2 2.1 Beverages and Tobacco Products 2.5 6.9 6.8 0.1 Forestry 8.6 18.3 18.1 0 Fishing 28.2 72.7 71 0 Coal 3.6 4.6 4.6 26.7 Oil 4.8 7.6 6.8 0.1 Gas 15.3 18.6 22.8 1.4 Minerals nec -0.5 0 0.9 0.2 Textiles 37.1 45.7 53.6 1.9 Wearing apparel 53.8 65.9 77.7 0.2 Leather products 45.2 59.9 74.8 0.3 Wood products 4.8 8.5 7.4 0.7 Paper products, publishing 2.6 6.0 5.4 1.8 Petroleum, coal products 4.4 8.4 8.5 0.2 Chemical, rubber, plastic products 13.8 20.6 27.2 4.6 Mineral products, nec 19.2 26.5 26.1 1.1 Ferrous metals 10.3 16.3 15.4 1.8 Metals nec 36.1 47.2 45.1 2.5 Metal products 15.5 24.0 22.8 0.5 Motor vehicles and parts 19.7 25.4 30.4 2.1 Transport equipment nec 10.7 16.0 22.7 3.9 Electronic equipment 29.4 42.8 54.2 1.6 Machinery and equipment nec 13.8 22.1 30.4 7.7
institute for international and development economics
IIDE 38
Table 2.19 Long Term Changes in Export Quantity, EU27 Exports to India (% change)
Scenario
Limited FTA
Ambitious FTA
Ambitious Plus FTA
Share of sector in
bilateral trade
Manufactures nec 8.5 14.4 20.3 1.3 Utilities 10.0 30.0 30.0 0.8 Construction 10.0 30.0 30.0 3.5 Trade 10.0 30.0 30.0 0.4 Transport 10.0 30.0 30.0 4.5 Communication 10.0 30.0 30.0 1.0 Financial services nec 10.0 30.0 30.0 1.4 Insurance 10.0 30.0 30.0 0.8 Business services nec 10.0 30.0 30.0 16.2 Recreational and other services 10.0 30.0 30.0 1.6 Other Services 10.0 30.0 30.0 1.2 Source: Production Shares: GTAP database, version 7. Percent Change in Output; own regressions.

institute for international and development economics
IIDE 39
Table 2.20 Long Term Changes in Export Quantity, Indian Exports to EU27 (% change)
Scenario
Limited FTA
Ambitious FTA
Ambitious Plus FTA
Share of sector in
bilateral trade
Cereal grains nec 26.2 37.5 38.6 0.5
Vegetables, fruit, nuts 173.7 208.8 210.1 0.2
Oil seeds 177.0 217.5 219.5 0.0
Live stock 27.1 34.3 34.9 0.0
Other Agriculture 74.3 91.9 100.8 0.1
Sugar 426.0 538.4 542.7 0.1
Processed Foods 328.5 414.0 439.6 1.6
Beverages and Tobacco Products 222.8 268.3 273.6 0.0
Forestry 61.6 76.7 78.0 0.0
Fishing 19.0 27.2 30.4 0.0
Coal 107.9 131.5 131.8 0.0
Oil 89.1 116.7 117.0 0.0
Gas 130.3 228.6 230.4 0.0
Minerals nec 10.7 11.7 11.7 0.8
Textiles 144.4 182.0 200.9 3.2
Wearing apparel 72.7 92.5 102.0 3.9
Leather products 94.5 117.5 128.2 4.9
Wood products 62.0 76.8 78.0 0.2
Paper products, publishing 95.0 116.3 117.7 0.3
Petroleum, coal products 43.0 51.3 51.4 1.0
Chemical, rubber, plastic products 101.3 123.2 134.7 11.8
Mineral products, nec 52.3 61.3 61.7 1.0
Ferrous metals 93.1 112.5 114.0 6.3
Metals nec 112.9 141.9 143.3 0.4
Metal products 72.8 91.0 92.9 9.3
Motor vehicles and parts 93.2 113.6 123.4 4.2
Transport equipment nec 66.9 87.2 100.6 0.6
Electronic equipment 31.6 43.8 54.6 2.8
Machinery and equipment nec 116.6 142.3 155.8 19.5
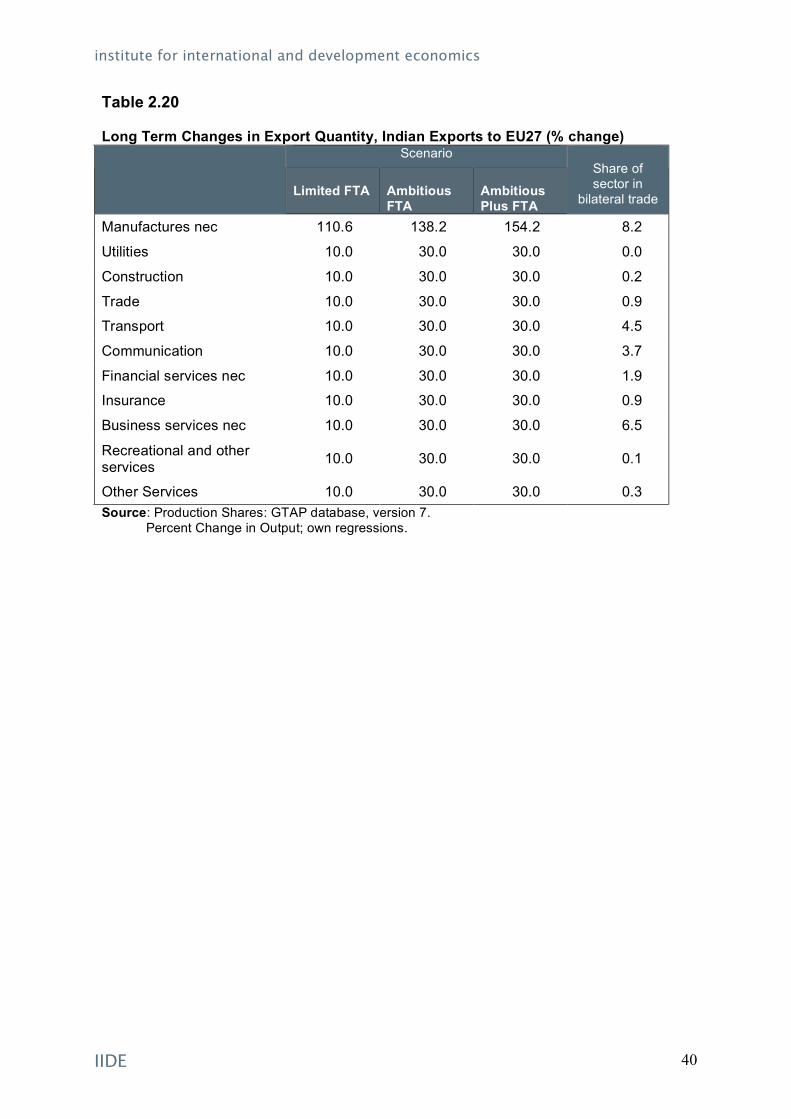
institute for international and development economics
IIDE 40
Table 2.20 Long Term Changes in Export Quantity, Indian Exports to EU27 (% change)
Scenario
Limited FTA
Ambitious FTA
Ambitious Plus FTA
Share of sector in
bilateral trade
Manufactures nec 110.6 138.2 154.2 8.2
Utilities 10.0 30.0 30.0 0.0
Construction 10.0 30.0 30.0 0.2
Trade 10.0 30.0 30.0 0.9
Transport 10.0 30.0 30.0 4.5
Communication 10.0 30.0 30.0 3.7
Financial services nec 10.0 30.0 30.0 1.9
Insurance 10.0 30.0 30.0 0.9
Business services nec 10.0 30.0 30.0 6.5
Recreational and other services 10.0 30.0 30.0 0.1
Other Services 10.0 30.0 30.0 0.3 Source: Production Shares: GTAP database, version 7. Percent Change in Output; own regressions.

institute for international and development economics
IIDE 41
Global Effects Table 2.21 Dynamic Third Country Effects, Ambitious Plus Scenario
National Income Effect million 2007 €
% Change in GDP
% Change in Value of Exports
Rest of World -18,948 -0.1 -0.1
Bangladesh -174 -0.3 -0.5
Pakistan -217 -0.2 -0.4
Sri Lanka -75 -0.3 -1.3
Other South Asia -42 -0.2 -1.3
Other Developing Countries -10,505 -0.1 -0.2
Source: ICE model simulations. Note: All results are reported for a baseline including expected effects of a successful completion of the Doha-Round, and a projection of baseline to 2014.
Given the extent of the remaining trade and non-trade barriers that non-EU/India countries still face in their dealings with the EU and particularly India, it is not surprising that a discriminatory agreement would lead to significant levels of trade diversion. In the same way the dynamic considerations magnify the benefits of the FTA on its members, they also enlarge the costs for non-participating countries.
Environmental Effects We turn next to environmental effects. Summary measures are supplied in Tables 2.22 and 2.23. Table 2.22 provides estimates of changes in carbon dioxide emissions in thousands of metric tons. Given the relatively small impact on the EU, and the relatively small share of India in global output and emissions, the impact on global CO2 emissions is negligible. Impacts range, between the various scenarios and time frames, from 0.01 to 0.04 percent of of baseline emissions. Table 2.23 reports estimate changes in utilisation of natural resources in fisheries, forestry, and primary agriculture. These effects are also generally quite small. Fisheries stock utilisation remains more or less unchanged across all scenarios. In India, agricultural

institute for international and development economics
IIDE 42
resource utilisation (land, water, etc.) actually drops slightly, while net effects are relatively small in the EU, with slight long-run drops in grain and oilseed production. Table 2.22 Increase in Annual Carbon Emissions 2014, thousands of metric tons
Limited FTA
Ambitious FTA
Ambitious Plus
FTA
short-run India 5,144 10,839 11,793 European Union 442 1,013 1,300 Rest of World -1,086 -1,310 -1,473 WORLD 4,499 10,542 11,621
long-run India 36,329 55,548 60,355 European Union -1,298 -747 -556 Rest of World -19,119 -30,061 -33,197 WORLD 15,912 24,740 26,602 Global increase, % short-run 0.01 0.02 0.02 Long-run 0.02 0.04 0.04
Source: ICE model simulations. Note: All results are reported for a baseline including expected effects of a successful completion of the Doha-Round, and a projection of baseline to 2014.
3. Concluding Comments
This report quantifies the economic impacts of a possible EU-India FTA. This is done with a global CGE model projected through 2014, along with discussion of FDI patterns and restrictions. Overall, there are positive effects for India under all scenarios, and small but positive effects over the long-run for the European Union. However, there are negative effects for third countries. Indeed the net gains for India in the long-run are mirrored by comparable losses in third countries, much of which is carried by other developing countries. These estimates build on a baseline scenario that includes a representative set of Doha- Round tariff reductions. With failure in Geneva, baseline protection in the EU will be larger, and so overall economic gains for India and the EU (and losses for third countries) will also be larger. For India, tariffs, NTBs, and services are of comparable importance in the long-run. For the EU, on the other hand, the dominant issue is services trade and investment liberalisation. Tariffs and NTBs in goods are less important than services, in terms of overall potential gains.
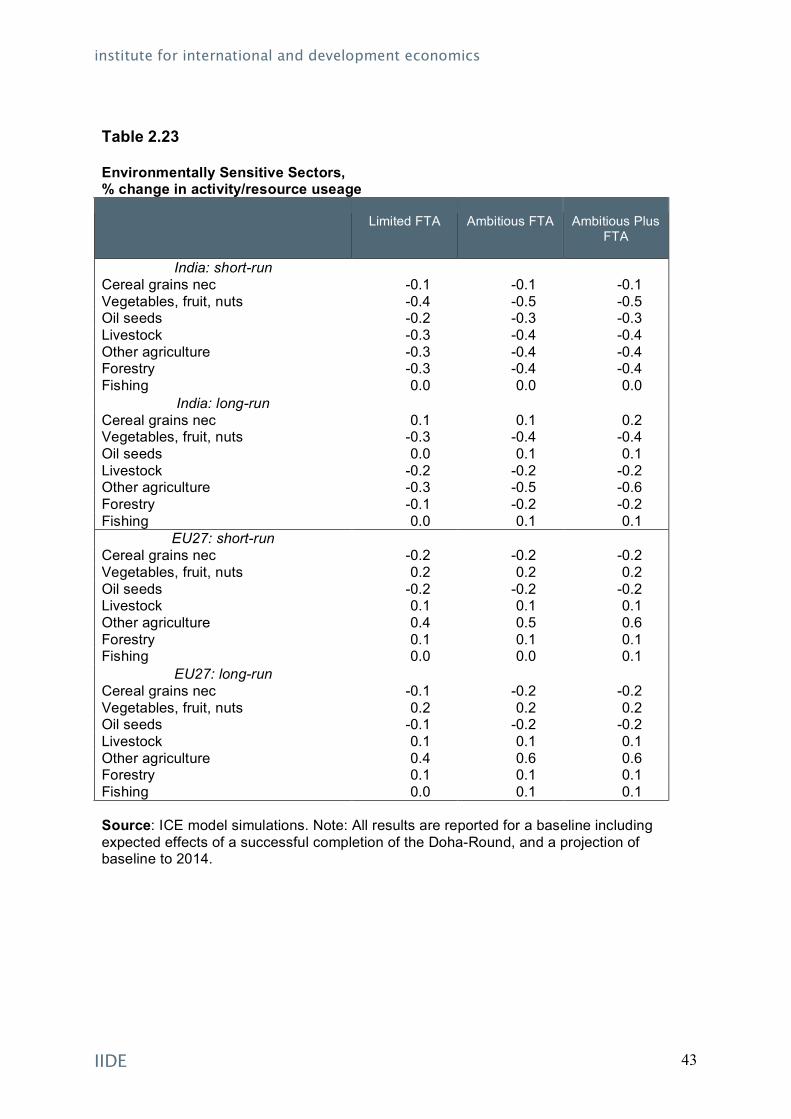
institute for international and development economics
IIDE 43
Table 2.23 Environmentally Sensitive Sectors, % change in activity/resource useage
Limited FTA
Ambitious FTA
Ambitious Plus
FTA
India: short-run Cereal grains nec -0.1 -0.1 -0.1 Vegetables, fruit, nuts -0.4 -0.5 -0.5 Oil seeds -0.2 -0.3 -0.3 Livestock -0.3 -0.4 -0.4 Other agriculture -0.3 -0.4 -0.4 Forestry -0.3 -0.4 -0.4 Fishing 0.0 0.0 0.0
India: long-run Cereal grains nec 0.1 0.1 0.2 Vegetables, fruit, nuts -0.3 -0.4 -0.4 Oil seeds 0.0 0.1 0.1 Livestock -0.2 -0.2 -0.2 Other agriculture -0.3 -0.5 -0.6 Forestry -0.1 -0.2 -0.2 Fishing 0.0 0.1 0.1
EU27: short-run Cereal grains nec -0.2 -0.2 -0.2 Vegetables, fruit, nuts 0.2 0.2 0.2 Oil seeds -0.2 -0.2 -0.2 Livestock 0.1 0.1 0.1 Other agriculture 0.4 0.5 0.6 Forestry 0.1 0.1 0.1 Fishing 0.0 0.0 0.1
EU27: long-run Cereal grains nec -0.1 -0.2 -0.2 Vegetables, fruit, nuts 0.2 0.2 0.2 Oil seeds -0.1 -0.2 -0.2 Livestock 0.1 0.1 0.1 Other agriculture 0.4 0.6 0.6 Forestry 0.1 0.1 0.1 Fishing 0.0 0.1 0.1
Source: ICE model simulations. Note: All results are reported for a baseline including expected effects of a successful completion of the Doha-Round, and a projection of baseline to 2014.

institute for international and development economics
IIDE 44
References
Brockmeier, M. and J. Pekikan (2008), "Agricultural market access: A moving target in the WTO negotiations?" Food Policy 33 250–259.
Chakraborty C. and P Basu (2002) Foreign Direct Investment and Growth in India: a Cointegration Approach”, Applied Economics 34, 1061-1073.
Decreux, Yvan and Cristina Mitaronna (2007), Economic Impact of a Potential Fre Trade Agreement (FTA) between the European Union and India (Study commissioned by the Directorate-General for Trade of the Commission of the European Union).
Dimaran, B. and MacDougall, R. ed (2007) The GTAP database- version 7, Global Trade Analysis Center, Purdue University.
EU Commission (2006), Global Europe: Competing in the World.
Eurostat (2007), EU25 Foreign Direct Investment in Brazil, Russia, India and China. Statistics in Focus, Economy and Finance No. 111/2007.
Francois, J.F. (2008) “Decomposing Trade Patterns in Services”, working paper, Department of University of Linz.
Francois,J., Baughman, L. M. Brockmeier, and R. Klepper (2008), "A Quantification of the Economic Effects of the February 2008 Draft NAMA Text: Summary of Results." report for the German Marshall Fund.
Gasiorek, Michael, Peter Holmes, Sherman Robinson, Jim Rollo and Anirudh Shigal (2007), Qualitative analysis of a Potential Free Trade Agreement Between the European Union and India. Centre for the Analysis of Regional Integration at Sussex (Study commissioned by the Directorate-General for Trade of the Commission of the European Union).
OECD (2006), OECD’s FDI Regulatory Restrictiveness Index: Revision and Extension to More Economies. OECD Working Papers on International Investment No.2006/4.
OECD (2006), Trends and Recent Developments in Foreign Direct Investment. In International Investment Perspectives, 2006 Edition.
OECD (2006), OECD’s FDI Regulatory Restrictiveness Index: Revision and Extension to More Economies and Sectors. International Investment Perspective: Freedom in a Changing World, 2007 Edition.
Rollo, Jim (2007), Spice Route to Europe? Prospects for a India-EU Free Trade Area, Chatham House Briefing Paper 07/02, October 2007.
WTO (2007), Trade Policy Review, India, April 2007.