june 2016 general investor presentation
TRANSCRIPT

Date
1
BGC PARTNERS, INC. NASDAQ: BGCP General Investor Presentation June 2016

Date
2
DISCLAIMER
Discussion of Forward-Looking Statements by BGC Partners and GFI Group
Statements in this document regarding BGC Partners' and GFI Group’s businesses that are not historical facts are "forward-looking statements" that involve risks and uncertainties. Except as
required by law, BGC and GFI undertake no obligation to release any revisions to any forward-looking statements. For a discussion of additional risks and uncertainties, which could cause actual
results to differ from those contained in the forward-looking statements, see BGC's and GFI’s respective Securities and Exchange Commission filings, including, but not limited to, the risk factors set
forth in their respective public filings, including their most recent Forms 10-K and any updates to such risk factors contained in subsequent Form 10-Q or Form 8-K filings.
Note Regarding Financial Tables and Metrics
Excel files with the Company’s quarterly financial results and metrics from the current period dating back to the full year 2008 are accessible in the various financial results press releases at the
“Investor Relations” section of http://www.bgcpartners.com. They are also available directly at ir.bgcpartners.com/news-releases/news-releases.
Distributable Earnings
This presentation should be read in conjunction with BGC’s most recent financial results press release. Unless otherwise stated, throughout this document we refer to our results only on a
distributable earnings basis. For a complete description of this term and how, when and why management uses it, see the final pages of this presentation. For both this description and a
reconciliation to GAAP, see the sections of BGC’s most recent financial results press release entitled “Distributable Earnings Defined”, “Differences Between Consolidated Results for Distributable
Earnings and GAAP”, and “Reconciliation of GAAP Income to Distributable Earnings”, which are incorporated by reference, and available in the “Investor Relations” section of our website at
http://www.bgcpartners.com.
Adjusted EBITDA
See the sections of this document and BGC’s most recent financial results press release titled “Adjusted EBITDA Defined” and “Reconciliation of GAAP Income to Adjusted EBITDA (and
Comparison to Pre-Tax Distributable Earnings)."
Other Items
“Newmark Grubb Knight Frank” is synonymous in this document with “NGKF” or “Real Estate Services.”
Our discussion of financial results for “Newmark Grubb Knight Frank,” “NGKF,” or “Real Estate Services” reflects only those businesses owned by us and does not include the results for Knight
Frank or for the independently-owned offices that use some variation of the NGKF name in their branding or marketing.
For the purposes of this document, all of the Company’s fully electronic businesses are referred to as “FENICS” or “e-businesses.” These offerings include Financial Services segment fully
electronic brokerage products, as well as offerings in market data and software solutions across both BGC and GFI. FENICS results do not include the results of Trayport, which are reported
separately.
On June 28, 2013, BGC sold its fully electronic trading platform for benchmark U.S. Treasury Notes and Bonds to Nasdaq Inc. For the purposes of this document, the assets sold are referred to as
“eSpeed,” and the businesses remaining with BGC that were not part of the eSpeed sale may be referred to as "retained." Approximately 11.9 million of Nasdaq shares are expected to be received
by BGC over the next 12 years in connection with this transaction.
Beginning on March 2, 2015, BGC began consolidating the results of GFI, which continues to operate as a controlled company and as a separately branded division of BGC. BGC owns
approximately 67% of GFI’s outstanding common shares as of October 28, 2015.
"BGC", "BGC Trader", "Newmark", "Grubb & Ellis", and "Grubb" are trademarks and service marks of BGC Partners, Inc. and/or its affiliates. Knight Frank is a service mark of Knight Frank
(Nominees) Limited. Trayport is a trademark or registered trademark of Trayport Limited and/or its affiliates. FENICS and FENICS.COM are trademarks or registered trademarks of Fenics
Software Inc. and/or its affiliates
© 2016 BGC Partners, Inc. All rights reserved.
2

Date
3
GENERAL OVERVIEW
BGC PARTNERS
Date
SOLID BUSINESS WITH SIGNIFICANT OPPORTUNITIES
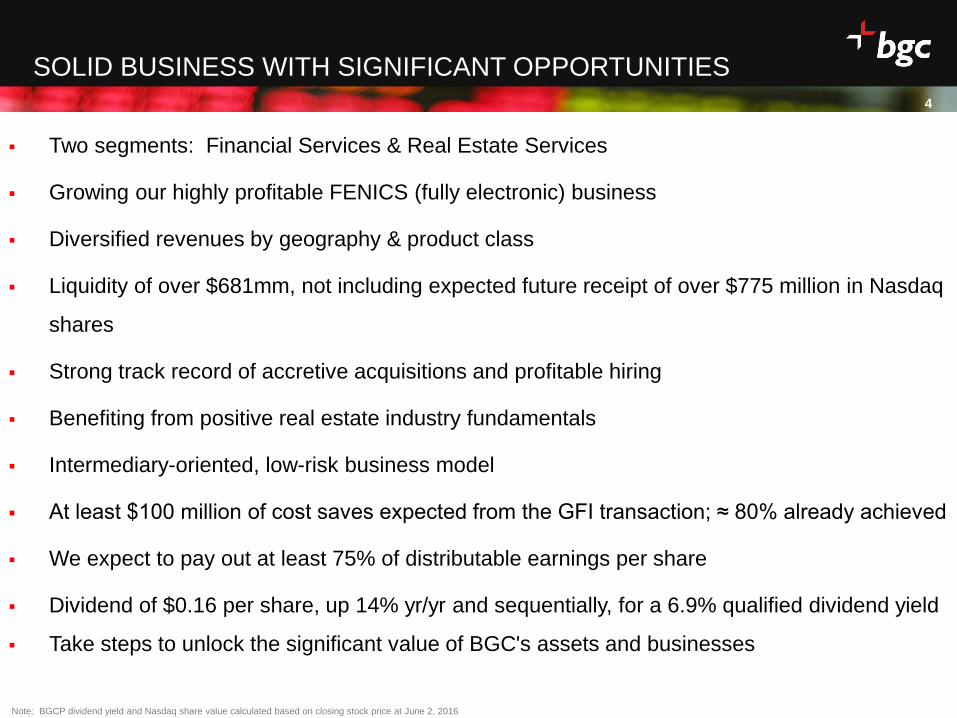
Two segments: Financial Services & Real Estate Services
Growing our highly profitable FENICS (fully electronic) business
Diversified revenues by geography & product class
Liquidity of over $681mm, not including expected future receipt of over $775 million in Nasdaq
shares
Strong track record of accretive acquisitions and profitable hiring
Benefiting from positive real estate industry fundamentals
Intermediary-oriented, low-risk business model
At least $100 million of cost saves expected from the GFI transaction; ≈ 80% already achieved
We expect to pay out at least 75% of distributable earnings per share
Dividend of $0.16 per share, up 14% yr/yr and sequentially, for a 6.9% qualified dividend yield
Take steps to unlock the significant value of BGC's assets and businesses
Note: BGCP dividend yield and Nasdaq share value calculated based on closing stock price at June 2, 2016
4

Date
1 FIRM, 2 SEGMENTS, MANY BUSINESSES
Financial Services
Voice/Hybrid FENICS
(Fully Electronic)
Key products include:
• Rates
• Foreign Exchange (“FX”)
• Credit
• Energy & Commodities
• Equities
2,441 brokers & salespeople 300+ Financial desks In 30+ cities
Key products include:
• Interest Rate Derivatives
• Credit
• FX
• Global Gov’t Bonds
• Market Data
• Software Solutions
• Post-trade Services
Proprietary network connected to the global financial community
TTM 1Q 2016
Rev = $1,432MM
Pre-Tax Margin ≈ 14%
TTM 1Q 2016
Rev = $252 MM
Pre-Tax Margin > 43%
Real Estate Services
Commercial Real Estate
Brokerage Services:
• Leasing
• Investment Sales
• Capital Raising
Other Services:
• Property & Facilities Management
• Global Corporate Services (consulting)
• Valuation
1,417 brokers & salespeople
Over 90 offices
TTM 1Q 2016 Revenue = $1,018 million
TTM 1Q 2016 Pre-Tax Margin ≈ 14%
Note: Segment figures exclude Corporate revenues and pre-tax loss of $35 million and $92 million, respectively. Financial Services revenues & margins exclude Trayport. Voice/Hybrid
includes $68.6 million related to Nasdaq earnout; excluding Nasdaq earnout Voice/Hybrid pre-tax margin would have been approximately 10%
5

Date
BGC'S STRONG YEAR-OVER-YEAR GROWTH IN 1Q16 and FY 2015
Highlights of Consolidated Results (USD millions, except
per share data) 1Q 2016 1Q 2015
Change
(%) FY 2015 FY 2014
Change
(%)
Revenues for distributable earnings $660.1 $563.9 17.1% $2,641.3 $1,841.5 43.4%
Pre-tax distributable earnings before non-controlling
interest in subsidiaries and taxes 90.8 75.2 20.7% 332.5 247.6 34.3%
Pre-tax distributable earnings per share 0.22 0.22 0.0% 0.89 0.74 20.3%
Post-tax distributable earnings 77.0 62.1 24.0% 276.4 207.4 33.3%
Post-tax distributable earnings per share 0.18 0.18 0.0% 0.74 0.62 19.4%
Adjusted EBITDA1 93.5 117.1 (20.1)% 875.5 246.0 255.9%
Effective tax rate 15.0% 15.0% 15.0% 15.0%
Pre-tax distributable earnings margin 13.8% 13.3% 12.6% 13.4%
Post-tax distributable earnings margin 11.7% 11.0% 10.5% 11.3%
6
1. Adjusted EBITDA for Q1 2015 included a $29.0 million unrealized gain related to the 17.1 million shares of GFI common stock owned by BGC prior to the successful completion of the tender
offer for GFI.

Date
7
BGC'S BUSINESS REVENUE DIVERSITY
7 Note: Percentages are approximate for rounding purposes.
1. Includes: data, software, post-trade, interest, and other revenue for distributable earnings (including Nasdaq earn-out)
Wholesale Financial Brokerage revenues and
earnings typically seasonally strongest in 1st
quarter, weakest in 4th quarter
Commercial Real Estate Brokerage
revenues and profitability typically seasonally
strongest in 4th quarter, weakest in 1st
quarter
FY 2015 Revenues by Asset Class
Rates 18%
F/X 12%
Credit 10%
Energy & Commodities
8% Equities and Other
7% Data, Software, Post-trade & Other
6%
Leasing and Other Services
21%
Real Estate Capital Markets
10%
Real Estate Management and
Other 7%
Corporate 1%
Financial
Services
61%
Real Estate
Services
38%
Corporate
1%
EMEA 30%
Americas 61%
APAC 8%
FY 2015 Revenues by Geography
1

Date
8
2,581 2,519 2,498 2,454 2,441
1,293 1,308 1,347 1,401 1,417
1Q 2015 2Q 2015 3Q 2015 4Q 2015 1Q 2016
Financial Brokerage Real Estate
Total Company average revenue per front office employee was $150,000, up 2% from 1Q 2015 driven by higher productivity
in Financial Services
Financial Services average revenue per front office employee was $167,000, up 4%, largely driven by FENICS
Real Estate Services average revenue per front office employee was $120,000, down 5%, largely driven by recent hires;
Historically, BGC’s revenue per front office employee has generally fallen after large acquisitions and significant broker hires.
As the integration of recent acquisitions continues, recently hired brokers ramp up production, and as more voice and hybrid
revenue is converted to more profitable fully electronic trading, the Company expects broker productivity to grow.
STABLE AND CONSISTENT OPERATING PERFORMANCE WITH
ROOM FOR GROWTH – BROKER PRODUCTIVITY
FRONT OFFICE HEADCOUNT
Note: The Real Estate figures are based on brokerage revenues, leasing and capital markets brokers, and exclude staff in management services and “other.” The Financial Services figures in the above table include
segment revenues from “total brokerage revenues” “data, software and post-trade”, and exclude revenues and salespeople related to Trayport. The average revenues for all producers are approximate and based on the
total revenues divided by the weighted-average number of salespeople and brokers for the period.
3,874
FRONT OFFICE PRODUCTIVITY
Yr/Yr change: Flat
147 150
635 615
Q1 2015 Q1 2016 FY 2014 FY 2015
-3%
(USD Thousands)
3,827 3,845 3,855 3,858

Date
STRONG RECORD OF SUCCESSFUL, ACCRETIVE ACQUISITIONS
Across U.S.
Leasing & Capital Markets
Brokerage
Newmark Knight
Frank Across U.S.
Property & Facilities
Management
Leasing & Capital
Markets Brokerage
Grubb & Ellis (a)
Across U.S.
Municipal Bonds
Wolfe & Hurst
Paris
Credit, Swaps
Ginalfi
U.K.
Rates
Sterling
Real Estate
Financial Services
Key
Cornish & Carey
Commercial
Apartment Realty
Advisors (ARA)
2 Real Estate
Acquisitions
Environmental
brokerage
CO2e
Frederick Ross
Smith Mack
2 Real Estate
Acquisitions
Global
Commodities
Rates
FX
Credit
Equities
GFI Group
New York / New
Jersey / Florida
Regional Power
Markets / Nat Gas
Mexico
Rates
Bonds
Remate Lince
London
Rates, FX
R.P. Martin (a)
(a) BGC acquired the rights of these businesses
2013 2010 2011 2012 2014 2015
9
Excess Space
Computerized Facility
Integration
Cincinnati Commercial Real
Estate
Steffner Commercial Real
Estate d/b/a Newmark Grubb
Memphis
4 Real Estate
Acquisitions
HEAT Energy (a)
London
Mainly Equities
Mint Partners/
Mint Equities (a)

Date
GFI ACQUISITION AND TRAYPORT SALE
On December 11, 2015, GFI completed the sale of their Trayport electronic trading
asset to Intercontinental Exchange, Inc. (ICE)
Under the terms of the agreement, BGC received 2,527,658 ICE common shares with
respect to the $650 million purchase price (as adjusted at closing)
Expected net tax rate of 10% or less with respect to the Trayport sales price,
however the gain on sale will be excluded from distributable earnings
On January 12, 2016, BGC and GFI closed on a previously agreed upon merger
The total purchase consideration for all shares of GFI purchased by BGC was
approximately $750 million
With the sale of Trayport, BGC will have paid approximately $100 million for
$610 million of GFI’s revenues, a multiple of about 0.2 times sales(1)
We expect to use these funds to continue investing in both our Real Estate and
Financial Services businesses, including FENICS, and to profitably hire and/or make
accretive acquisitions or repay debt, all while maintaining or improving our investment
grade rating
10
(1) This figure is net of the $250.0 million note previously issued to GFI by BGC, which is eliminated in consolidation. It also excludes the $29.0 million gain recorded in the first quarter of 2015
with respect to the appreciation of the 17.1 million shares of GFI held by BGC prior to the successful completion of the tender offer. Including this gain, the calculation of purchase
consideration and noncontrolling interest totaled $779.5 million. Multiples are based on GFI’s results, excluding Trayport and Kyte Clearing, for the twelve months ended September 30, 2015

Date
11
Overview
FINANCIAL SERVICES

Date
12
1Q 2016 FINANCIAL SERVICES SUMMARY
BGC Financial Services Segment Highlights
Revenues up 23%
Pre-tax profit up over 31%
Pre-tax margins expanded 160 basis points
FENICS1 (fully electronic) revenues and pre-
tax profits up 68% and 55%, respectively
Energy & Commodities revenues up 130%
Equities and other revenues increased over
41%
Credit revenues up 26%; fully electronic
credit revenues up over 70%
FX revenues up 7%
Data, software and post-trade up 126%
Quarterly Drivers
Acquisition and successful integration of GFI
Increased activity across energy and
commodities and equities and other;
decreased activity across most other asset
classes we broker in Financial Services
Distributable earnings and margins have
grown significantly as the integration of GFI
progresses; further improvement expected
in FS as at least $100 million in annualized
cost synergies are realized by end of 2016
FS revenues would have been
approximately $7 million higher, if not for the
strengthening U.S. dollar
1. ”FENICS” includes “total brokerage revenues” related to fully electronic trading and data, software, and post-trade, all of which are reported within the Financial Services segment.
Date
$40.8
$68.6
$116.3
$252.1
Q1 2015 Q1 2016 TTM 1Q15 TTM 1Q16
13
BGC’S FENICS (FULLY ELECTRONIC) GROWTH
13
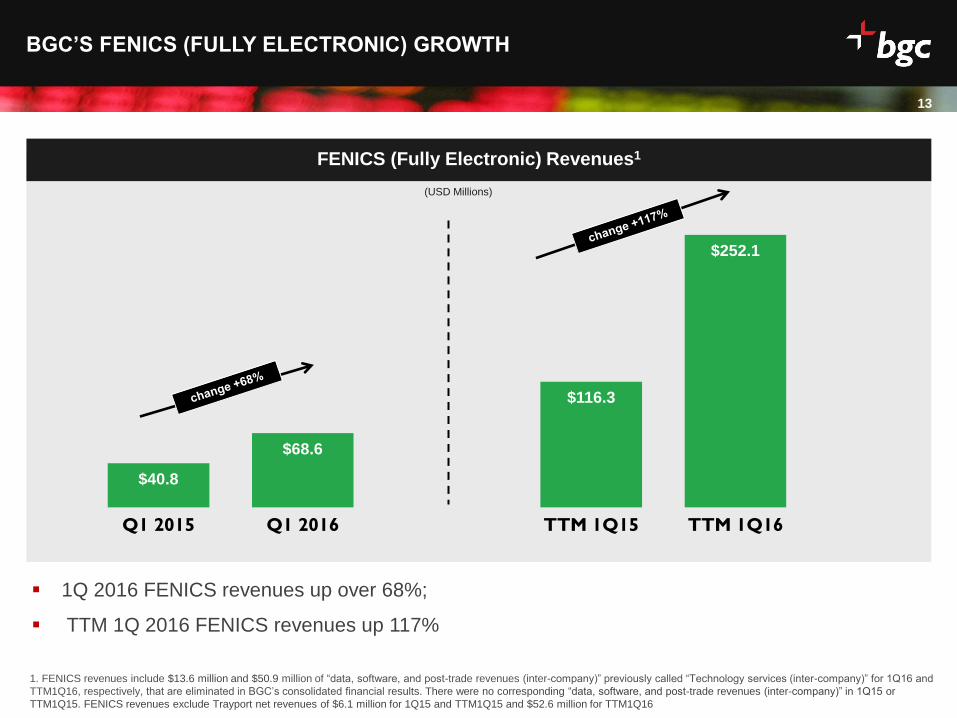
FENICS (Fully Electronic) Revenues1
1Q 2016 FENICS revenues up over 68%;
TTM 1Q 2016 FENICS revenues up 117%
(USD Millions)
1. FENICS revenues include $13.6 million and $50.9 million of “data, software, and post-trade revenues (inter-company)” previously called “Technology services (inter-company)” for 1Q16 and
TTM1Q16, respectively, that are eliminated in BGC’s consolidated financial results. There were no corresponding “data, software, and post-trade revenues (inter-company)” in 1Q15 or
TTM1Q15. FENICS revenues exclude Trayport net revenues of $6.1 million for 1Q15 and TTM1Q15 and $52.6 million for TTM1Q16

Date
14
POTENTIAL UPSIDE FOR FINANCIAL SERVICES BUSINESS
BGC completed the back-end merger of GFI on January 12, 2016; 100% of GFI’s
post-tax distributable earnings are expected to be attributable to BGC’s fully-diluted
shareholders from this date forward.
Achieved over 80% of $100MM target in annualized GFI merger-related cost savings
by thru 1Q 2016
The Street may not appreciate BGC’s over $680 million of total liquidity along with the
over $776 million worth of Nasdaq shares BGC will receive over time 1
Fully electronic trading expanding to more markets and asset classes, aiding BGC’s
profitability
Inter-dealer broker industry consolidation; now only two major players in the space
Expansion of IDB customer base beyond traditional large bank clients
1 Based on the 6/2/2016 closing price of Nasdaq, Inc. (NASDAQ: NDAQ or “Nasdaq”). The Nasdaq amount is calculated by multiplying the 6/2/2016 closing price by
approximately 11.9 million total shares expected to be received by BGC over the next 12 years. These shares relate to BGC’s sale of eSpeed in 2013.

Date
0
50
100
2008 2011 2015 2020
Global AUM $US Trillions
Pro
jecte
d
15
SELL-SIDE BALANCE SHEETS CONTINUE TO SHRINK EVEN AS
ASSETS UNDER MANAGEMENT AT BUY-SIDE SWELL
Buy-side AuM has grown by over 55% since
2008 fueling greater demand for market
liquidity, while large bank Balance Sheets and
RWAs are down ~30% and ~50%, respectively
since 2010, on a Basel 3 like-for-like basis
Expectations are that large banks will continue
to shrink their balance sheets further by up to
an additional 5% to 10%
Source: Morgan Stanley, Oliver Wyman and Boston Consulting Group
-65%
-50%
-35%
-20%
-5%
Changes in Sell-side Balance Sheet By Asset Class, 2010-2015
Further potential reductions

Date
16
Total U.S. Corporate Bonds Outstanding vs. Primary Dealer U.S. Net Corporate Bond Positions
(USD billions)
U.S. CORPORATE BONDS OUTSTANDING HIGHEST EVER; PRIMARY
DEALER BOND POSITIONS DOWN 96% FROM PEAK T
ota
l C
orp
Bo
nd
s O
uts
tan
din
g
Prim
ary
De
ale
r Ne
t Co
rp B
on
d P
ositio
ns
-
50
100
150
200
250
300
-
1,000
2,000
3,000
4,000
5,000
6,000
7,000
8,000
9,000
2005 2006 2007 2008 2009 2010 2011 2012 2013 2014 2015
Total Outstanding ($B) Primary Dealer Net Positions ($B)
Investor demand for U.S. corporate bonds is at all-time highs - notional outstanding is up 77% since
2005
Primary Dealers have reduced net inventories of corporate bonds by 96% from their 2007 peak
Asset managers and other buy-side firms continue to seek liquidity providers in the marketplace
Source: SIFMA, Federal Reserve Bank of New York, Bloomberg

Date
BGC FS + GFI
$1.7
BGC RE $1.0
All Other IDBs $6.5
BGC and other wholesale financial brokerages
currently comprise only a small percentage of the
total global sales & trading market
Reductions in Bank balance sheets may provide
opportunities for BGC’s Financial Services business
IB FICC + Equities:
$164
IDBs: $8
Other: $53
2015 Global Sales & Trading Revenues ≈ $225B (in USD billions)
17
SMALL SLICE OF GLOBAL EXECUTION REVENUES = HUGE
POTENTIAL FOR IDBs
Source: Morgan Stanley and Oliver Wyman, company filings. “Other” = exchanges, CCPs, other execution venues, market data, technology providers, and other 3rd parties. $225B figure does not
include primary issuance, CSDs, or custodians. Major IDBs are BGC, GFI, ICAP (for which 2015 = fiscal year-ended 3/31/2016) Tullett Prebon, Tradition, ICE’s Creditex business, Marex Spectron
and other non-public IDB estimated revenues. Results for BGC include $1B of Real Estate Services revenues, which are excluded from the $8B industry-wide IDB figure
FY 2015 IDB Revenues (in USD billions)

Date
18
Overview
REAL ESTATE

Date
105,428 105,985
53,842 62,133
41,084 46,720
Q1 2015 Q1 2016
19
1Q 2016 Real Estate Segment Breakdown Drivers
NGKF Highlights 1Q 2016 Real Estate Segment Breakdown
BUSINESS OVERVIEW: REAL ESTATE SERVICES
1Q 2016 Real Estate Services revenues increased by over 7% compared to 1Q 2015
Real estate capital markets revenues increased over 15% from the prior year
Management services & other up 14%
Leasing and other revenues up approximately 1% from a year ago
19
Organic growth
Acquisitions of CFI, Excess Space, as well as the completion of our acquisition of ARA
Strengthening U.S. economy and accommodative monetary policy aids the Real Estate recovery
Strong U.S. jobs market
Overall activity industry-wide was generally down for leasing and real estate capital markets in 1Q 2016
Leasing and other
services
49%
Real estate
capital markets
29%
Management
services &
other revenues
22%
Management services
and other revenues
Real estate capital
markets
Leasing and
other services
Note: Percentages may not sum to 100% due to rounding
200,354 214,838
(US
D M
illi
on
s)

Date -
20,000
40,000
60,000
80,000
100,000
120,000
140,000
160,000
-
200,000
400,000
600,000
800,000
1,000,000
FY2013
TTM1Q14
TTM2Q14
TTM3Q14
FY2014
TTM1Q15
TTM2Q15
TTM3Q15
FY2015
TTM1Q16Revenue
Pre-tax Earnings
20
NGKF Revenue & Pre-tax Distributable Earnings
(USD 000’s)
NGKF REVENUE AND EARNINGS CONTINUE STRONG GROWTH
NGKF trailing twelve month (TTM) revenues have grown from $583 million in FY13 to over $1 billion in
1Q 2016, representing a 28% CAGR
Pre-tax distributable earnings have grown from $56 million in FY 2013 to over $137 million for TTM 1Q
2016, representing a CAGR of 49%
Re
ve
nu
es
Pre
-tax D
istrib
uta
ble
Ea
rnin
gs
TTM = trailing twelve months

Date
Leasing
Mgmt Services &
Other
Global Corporate Services
Capital Markets
NGKF REVENUES ARE DIVERSIFIED & A SIGNIFICANT PORTION ARE
RECURRING
Note: Largely contractual and/or recurring revenue includes leasing, global corporate services, property management, and facilities management.
21
Approximately 75% of NGKF’s revenues are from relatively predictable contractual sources (management services, global corporate services) and/or largely recurring sources (leasing)
Contractual management services revenues were up 15% YOY in 2015 & 13% in 1Q2016
Higher margins real estate capital markets brokerage revenues were up 115% YOY in 2015 & 15% in 1Q2016
21

Date
COMMERCIAL REAL ESTATE REMAINS AN ATTRACTIVE INVESTABLE
ASSET CLASS
0.00%
1.00%
2.00%
3.00%
4.00%
5.00%
6.00%
7.00%
8.00%
Spread Cap Rate 10yr UST Avg. Spread
U.S. Commercial RE Cap Rates vs. 10 Year U.S. Treasuries (All Commercial Property Types)
22
Spreads between U.S. commercial cap rates and UST 10yrs ended 1Q 2016 at 433 bps, well above pre-
recession low of 144 bps at 2Q 2007 and above the 10-year average spread of 372 bps
While cap rates have compressed since 2012, U.S. Treasury yields remain near historic lows leaving
spreads relatively high
Source: Moody’s Real Capital Analytics
Date
23
SIGNIFICANT OPPORTUNITIES FOR CONSOLIDATION & GROWTH
IN COMMERCIAL REAL ESTATE SERVICES
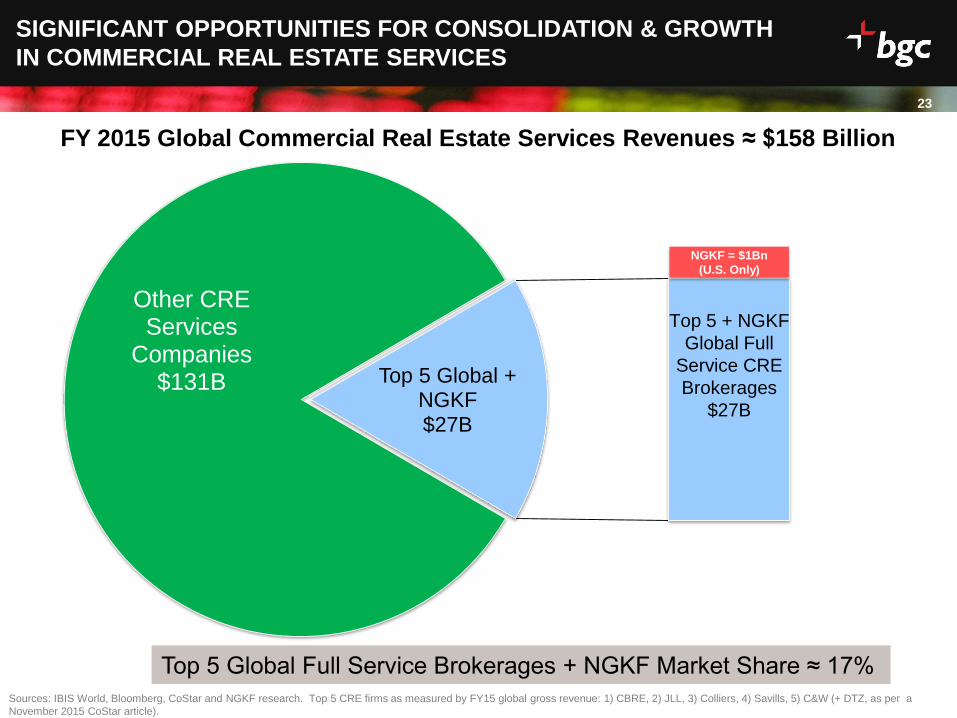
Other CRE Services
Companies $131B Top 5 Global +
NGKF $27B
Top 5 + NGKF
Global Full
Service CRE
Brokerages
$27B
Top 5 Global Full Service Brokerages + NGKF Market Share ≈ 17%
Sources: IBIS World, Bloomberg, CoStar and NGKF research. Top 5 CRE firms as measured by FY15 global gross revenue: 1) CBRE, 2) JLL, 3) Colliers, 4) Savills, 5) C&W (+ DTZ, as per a
November 2015 CoStar article).
FY 2015 Global Commercial Real Estate Services Revenues ≈ $158 Billion
NGKF = $1Bn
(U.S. Only)

Date
24
BGC PARTNERS
Conclusion

Date
CONCLUSION
Two segments: Financial Services & Real Estate Services
Growing our highly profitable FENICS (fully electronic) business
Diversified revenues by geography & product class
Liquidity of over $681mm, not including expected future receipt of over $775 million in Nasdaq
shares
Strong track record of accretive acquisitions and profitable hiring
Benefiting from positive real estate industry fundamentals
Intermediary-oriented, low-risk business model
At least $100 million of cost saves expected from the GFI transaction; ≈ 80% already achieved
We expect to pay out at least 75% of distributable earnings per share
Dividend of $0.16 per share, up 14% yr/yr and sequentially, for a 6.9% qualified dividend yield
Take steps to unlock the significant value of BGC's assets and businesses
Note: BGCP dividend yield and Nasdaq share value calculated based on closing stock price at June 2, 2016
25

Date
Committed to Unlocking Value of BGC’s Businesses
SUM OF THE PARTS
1 NDAQ share price and Peer P/S and P/E multiples as of 6/2/16 closing prices 2 BGC FENICS results exclude Trayport 3 Voice/Hybrid includes $68.6 million related to Nasdaq earnout; excluding Nasdaq earnout Voice/Hybrid pre-tax margin would have been approximately 10%
FENICS peers: BVMF3, CBOE, IAP (NEX), CME, DB1, 388 HK (excluded as P/S outlier), ICE, ITG (excluded as outlier), LSE, NDAQ, MKTX (excluded from P/E as outlier); RE Peers: CBG, JLL,
CIGI, HF, MMI, SVS; IDB Voice/Hybrid Peers: TLPR, KCG, CFT
Liquidity: (as of 3/31/2016)
>$681 million
Nasdaq
Earnout1:
>$775 million
Long-term
Debt: (as of 3/31/2016)
$839 million
Net Long-term
Liquidity:
>$615 million
+
-
=
FENICS (TTM 1Q 2016)
Real Estate (TTM 1Q 2016)
IDB Voice/Hybrid 3
(TTM 1Q 2016)
Revenue:
Pre Tax
Earnings:
Peer (FY15)
P/S Range1:
Peer (FY16)
P/E Range1:
$252 million $1,018 million $1,432 million
$110 million $137 million
11.7x – 16.1x
0.9x – 3.6x
Balance Sheet
+
14.4x – 35.3x
2.2x – 16.5x 0.5x – 1.4x
10.0x – 13.2x
26
$201 million

Q&A

Date
APPENDIX

Date
29
STRONGLY CAPITALIZED; INVESTMENT GRADE CREDIT PROFILE
($ in '000s)
BGC Partners, Inc. 3/31/2016
Cash and Cash Equivalents $456,116
Securities Owned 32,767
Marketable Securities (net) 191,697
Total Liquidity $680,580
BGC Partners, Inc. and Subsidiaries Issuer Maturity 3/31/2016
4.50% Convertible Notes BGC 7/15/2016 $158,557
8.375% Senior Notes GFI 7/19/2018 253,233
Collateralized Borrowings BGC 3/13/2019 21,321
5.375% Senior Notes BGC 12/9/2019 296,346
8.125% Senior Notes BGC 6/15/2042 109,178
Total Debt $838,635
BGC Partners, Inc. (Adj. EBITDA and Ratios are TTM 1Q 2016) 3/31/2016
Adjusted EBITDA $851,951
Leverage Ratio: Total Debt / Adjusted EBITDA 1.0x
Net Leverage Ratio: Net Debt / Adjusted EBITDA 0.2x
Adjusted EBITDA / Interest Expense 12.7x
Total Capital $1,224,916
2
1. Includes the approximately $407 million gain primarily related to the sale of Trayport
2. Does not include the over $765 million in Nasdaq shares expected to be received over time
3. Defined as “redeemable partnership interest,” “noncontrolling interest in subsidiaries,” and “total stockholders’ equity”
3
1

Date
30
FINANCIAL SERVICES REVENUE COMPOSITION
FINANCIAL SERVICES REVENUE BREAKOUT BY ASSET CLASS
122,011 118,517
67,175 84,527
72,941 78,020
29,404
67,497 36,215
51,205
5,451
12,317
22,519
24,619
Q1 2015 Q1 2016
$355,716
$436,702
Data, software, and post-trade
Energy & commodities
Equity & other
Credit
Foreign Exchange
Rates
+41%
+130%
+7%
+26%
-3%
1. Includes $23.3MM and $15.4MM related to the Nasdaq earnout in 1Q16 and 1Q15, respectively and $6.1MM related to Trayport for 1Q15.
+23%
% Change
+126%
+9% Other1
Total Financial
Services

Date
31
Note “FENICS” results include $13.6 million and $50.9 million of data, software, and post-trade (inter-company) revenues for 1Q16 and TTM1Q16, respectively, which are eliminated in BGC’s
consolidated financial results. Data, software, and post-trade revenues, net of inter-company eliminations was $12.3 million and $45.6 million in 1Q16 and TTM 1Q16, respectively. There were no
corresponding technology service (intercompany) revenues in 1Q15 or TTM 1Q15.
FENICS revenues exclude Trayport net revenues of $6.1 million for 1Q15 and TTM1Q15 and $52.6 million for TTM1Q16
“Voice/Hybrid/Other” includes voice/hybrid results from the “Financial Services” segment; $23.3 million, $68.6 million, $15.4 million, and $51.9 million related to the Nasdaq Inc. stock earn-out for
1Q16, TTM1Q16, 1Q15 and TTM1Q15, respectively.
FENICS set new records in terms of revenues and pre-tax distributable earnings
FENICS 1Q16 revenues increased over 68% and pre-tax distributable earnings were up over 55%
FENICS TTM 1Q16 revenues increased by 117% and pre-tax distributable earnings were up 77%
STRONG GROWTH SEEN IN FULLY ELECTRONIC BUSINESS
Note: numbers may not foot and/or crossfoot due to rounding
FENICS
Voice / Hybrid
/ Other Real Estate
Corporate /
Other Total FENICS
Voice / Hybrid
/ Other Real Estate
Corporate /
Other Total
Revenue $68.6 $368.1 $214.8 $8.6 $660.1 $252.1 $1,431.6 $1,018.1 $35.7 $2,737.6
Pre-Tax DE $31.8 $71.1 $17.4 ($29.5) $90.8 $109.5 $200.5 $137.3 ($99.2) $348.1
Pre-tax DE Margin 46.4% 19.3% 8.1% NMF 13.8% 43.4% 14.0% 13.5% NMF 12.7%
FENICS
Voice / Hybrid
/ Other Real Estate
Corporate /
Other Total FENICS
Voice / Hybrid
/ Other Real Estate
Corporate /
Other Total
Revenue $40.8 $314.9 $200.4 $7.8 $563.9 $116.3 $1,033.0 $775.9 $34.2 $1,959.4
Pre-Tax DE $20.5 $57.7 $19.6 ($22.6) $75.2 $61.9 $174.1 $97.2 ($66.7) $266.5
Pre-tax DE Margin 50.2% 18.3% 9.8% NMF 13.3% 53.2% 16.9% 12.5% NMF 13.6%
FENICS
Voice / Hybrid
/ Other Real Estate
Corporate /
Other Total FENICS
Voice / Hybrid
/ Other Real Estate
Corporate /
Other Total
Revenue 68.1% 16.9% 7.2% 9.5% 17.1% 116.8% 38.6% 31.2% 4.4% 39.7%
Pre-Tax DE 55.2% 23.1% -11.0% NMF 20.7% 76.9% 15.1% 41.3% NMF 30.6%
1Q 2016
1Q 2015
Yr/Yr Change
TTM 1Q 2015
Yr/Yr Change
TTM 1Q 2016

Date
A Leading Inter-Dealer Broker (Pre Dodd-Frank/Basel 3/etc.)
32
Banks Trading Firms I-Banks
Corporations Investors Governments
Corporations Investors Governments
Banks Trading Firms I-Banks

Date
BGC May Be Able to Greatly Expand its Customer Base Over Time
(Post Dodd-Frank)
33
Banks Trading Firms I-Banks
Corporations Investors Governments
Corporations Investors Governments
Banks Trading Firms I-Banks

Date
VACANCY RATES CONTINUE TO IMPROVE SIGNALING STRONG
DEMAND FOR COMMERCIAL REAL ESTATE
0.0%
4.0%
8.0%
12.0%
16.0%
20.0%
1Q11 1Q12 1Q13 1Q14 1Q15 1Q16
Office Industrial Retail Unweighted Average
Vacancy rates continue to improve reflecting higher demand and higher rates of
occupancy across major commercial real estate asset classes
Source: CoStar, REIS, and NGKF Research
34
U.S. Vacancy Rates by Asset Class

Date
35
BGC PARTNERS COMPENSATION RATIO
BGC Partners Compensation Ratio was 61.4% in 1Q 2016 vs. 61.7% in 1Q 2015
Commercial Real Estate brokers generally have a higher compensation ratio than IDBs that have
significant electronic trading revenues
$1,036.8
$1,091.2 $1,128.5
$1,638.3
$347.9 $405.5
59.2%
61.7% 61.3% 62.0%
61.7% 61.4%
40%
50%
60%
70%
80%
90%
100%
$0
$200
$400
$600
$800
$1,000
$1,200
$1,400
$1,600
$1,800
2012 2013 2014 2015 Q1 2015 Q1 2016
(US
D m
illio
ns)
Compensation and Employee Benefits Compensation and Employee Benefits as % of Total Revenue

Date
36
NON-COMPENSATION EXPENSES & PRE-TAX MARGIN
16.1%
11.2% 10.3% 13.4% 12.6% 13.8%
30.2%
29.6%
28.0% 25.3%
25.4% 24.8%
0%
10%
20%
30%
40%
50%
FY 2011 FY 2012 FY 2013 FY 2014 FY 2015 Q1 2016
Pre-tax distributable earnings as % of Total Revenue Non-comp Expenses as a % of Total Revenue
1Q 2016 non-comp expenses were 24.8% of distributable earnings revenues – approximately 20 basis
points lower compared with 1Q 2015
Pre-tax distributable earnings margin was 13.8% for 1Q 2016 vs. 13.3% in 1Q 2015
Post-tax distributable earnings margin was 11.7% in 1Q 2016 vs. 11.0% in 1Q 2015

Date
37
BGC’S ECONOMIC OWNERSHIP AS OF March 31, 2016
Public 48%
Cantor 21%
Employees, Executives, &
Directors 31%
Note: Employees, Executives, and Directors ownership figure attributes all units (PSUs, FPUs, RSUs, etc.) and distribution rights to founding partners
& employees and also includes all A shares owned by BGC executives and directors. Cantor ownership includes all A and B shares owned by Cantor
as well as all Cantor exchangeable units and certain distribution rights. Public ownership includes all A shares not owned by executives or directors of
BGC. The above chart excludes shares related to convertible debt. The above chart excludes all formerly contingent shares that had not yet been
issued.

Date
38
DISTRIBUTABLE EARNINGS DEFINED
38
Distributable Earnings Defined
BGC Partners uses non-GAAP financial measures including "revenues for distributable earnings," "pre-tax distributable earnings" and "post-tax distributable earnings," which are
supplemental measures of operating performance that are used by management to evaluate the financial performance of the Company and its consolidated subsidiaries. BGC Partners
believes that distributable earnings best reflect the operating earnings generated by the Company on a consolidated basis and are the earnings which management considers available for
distribution to BGC Partners, Inc. and its common stockholders, as well as to holders of BGC Holdings partnership units during any period.
As compared with "income (loss) from operations before income taxes," "net income (loss) for fully diluted shares," and "fully diluted earnings (loss) per share," all prepared in accordance
with GAAP, distributable earnings calculations primarily exclude certain non-cash compensation and other expenses which generally do not involve the receipt or outlay of cash by the
Company, which do not dilute existing stockholders, and which do not have economic consequences, as described below. In addition, distributable earnings calculations exclude certain
gains and charges that management believes do not best reflect the ordinary operating results of BGC.
Revenues for distributable earnings are defined as GAAP revenues excluding the impact of BGC Partners, Inc.'s non-cash earnings or losses related to its equity investments. Revenues for
distributable earnings include the collection of receivables which would have been recognized for GAAP other than for the effect of acquisition accounting. Revenues for distributable
earnings also exclude certain one-time or unusual gains that are recognized under GAAP, because the Company does not believe such gains are reflective of its ongoing, ordinary
operations.
Pre-tax distributable earnings are defined as GAAP income (loss) from operations before income taxes excluding items that are primarily non-cash, non-dilutive, and non-economic, such as:
Non-cash compensation charges for items granted or issued pre-merger with respect to mergers or acquisitions by BGC Partners, Inc. This includes the merger with and into eSpeed,
Inc. and the back-end merger with GFI Group Inc.
Non-cash, non-dilutive equity-based compensation related to limited partnership unit exchange or conversion.
Allocations of net income to founding/working partner and other limited partnership units.
Non-cash asset impairment charges, if any.
Distributable earnings calculations also exclude charges related to purchases, cancellations or redemptions of partnership interests and certain unusual, one-time or non-recurring items, if
any.
“Compensation and employee benefits” expense for distributable earnings will also include broker commission payouts relating to the aforementioned collection of receivables.
BGC’s definition of distributable earnings also excludes certain gains and charges with respect to acquisitions, dispositions, or resolutions of litigation. This exclusion includes the one-time
gains related to the Nasdaq and Trayport transactions. The calculation of distributable earnings also excludes the non-cash mark-to-market gains or losses related to the shares of
Intercontinental Exchange, Inc. received in connection with the Trayport sale. Management believes that excluding these gains and charges best reflects the ongoing operating performance
of BGC.
However, because Nasdaq is expected to pay BGC in an equal amount of stock on a regular basis for a 15 year period as part of that transaction, the payments associated with BGC’s
receipt of such stock are expected to be included in the Company’s calculation of distributable earnings. To make period-to-period comparisons more meaningful, one-quarter of the annual
contingent earn-out amount, as well as gains or losses with respect to associated mark-to-market movements and/or hedging, will be included in the Company’s calculation of distributable
earnings each quarter as “other revenues.”
Investors and analysts should note that, due to the large gain recorded with respect to the Trayport sale in December, 2015, and the closing of the back-end merger with GFI in January,
2016, non-cash charges related to the amortization of intangibles with respect to acquisitions will be excluded from the calculation of pre-tax distributable earnings for periods beginning with
the first quarter of 2016. These charges were $5.0 million in the first quarter of 2016.
Date
DISTRIBUTABLE EARNINGS DEFINED (CONTINUED)
Investors and analysts should note that, due to the large gain recorded with respect to the Trayport sale in December, 2015, and the closing of the back-end merger with GFI in January, 2016,
non-cash charges related to the amortization of intangibles with respect to acquisitions will be excluded from the calculation of pre-tax distributable earnings for periods beginning with the first
quarter of 2016. These charges were approximately $5 million in the first quarter of 2016. For periods beginning with the first quarter of 2016, non-cash charges related primarily to the
amortization of GFI employee forgivable loans granted prior to the closing of the January 11, 2016 back-end merger with GFI will be excluded from the calculation of pre-tax distributable
earnings. In the first quarter of 2016, these charges were approximately $3.9 million.
Since distributable earnings are calculated on a pre-tax basis, management intends to also report "post-tax distributable earnings" and "post-tax distributable earnings per fully diluted share:"
"Post-tax distributable earnings" are defined as pre-tax distributable earnings adjusted to assume that all pre-tax distributable earnings were taxed at the same effective rate.
"Post-tax distributable earnings per fully diluted share" are defined as post-tax distributable earnings divided by the weighted-average number of fully diluted shares for the period.
BGC’s distributable earnings per share calculations assume either that:
The fully diluted share count includes the shares related to the dilutive instruments, such as the Convertible Senior Notes, but excludes the associated interest expense, net of tax, when
the impact would be dilutive; or
The fully diluted share count excludes the shares related to these instruments, but includes the associated interest expense, net of tax.
The share count for distributable earnings excludes shares expected to be issued in future periods but not yet eligible to receive dividends and/or distributions.
Each quarter, the dividend to BGC’s common stockholders is expected to be determined by the Company’s Board of Directors with reference to post-tax distributable earnings per fully diluted
share. In addition to the Company’s quarterly dividend to common stockholders, BGC Partners expects to pay a pro-rata distribution of net income to BGC Holdings founding/working partner
and other limited partnership units, as well as to Cantor for its non-controlling interest. The amount of all of these payments is expected to be determined using the above definition of pre-tax
distributable earnings per share.
The term “distributable earnings” is not meant to be an exact measure of cash generated by operations and available for distribution, nor should it be considered in isolation or as an alternative
to cash flow from operations or GAAP net income (loss.) The Company views distributable earnings as a metric that is not necessarily indicative of liquidity or the cash available to fund its
operations.
Pre- and post-tax distributable earnings are not intended to replace the Company’s presentation of GAAP financial results. However, management believes that they help provide investors
with a clearer understanding of BGC Partners’ financial performance and offer useful information to both management and investors regarding certain financial and business trends related to
the Company’s financial condition and results of operations. Management believes that distributable earnings and the GAAP measures of financial performance should be considered
together.
Management does not anticipate providing an outlook for GAAP “revenues,” “income (loss) from operations before income taxes,” “net income (loss) for fully diluted shares,” and “fully diluted
earnings (loss) per share,” because the items previously identified as excluded from “pre-tax distributable earnings” and “post-tax distributable earnings” are difficult to forecast. Management
will instead provide its outlook only as it relates to “revenues for distributable earnings,” “pre-tax distributable earnings,” and “post-tax distributable earnings.”
For more information on this topic, please see the tables in the most recent BGC financial results press release entitled “Reconciliation of Revenues Under GAAP and Distributable Earnings,”
and “Reconciliation of GAAP Income (Loss) to Distributable Earnings,” which provide summary reconciliations between distributable earnings and the corresponding GAAP measures for the
Company in the periods discussed in this document. The reconciliations for prior periods do not include the results of GFI.
39

Date
40
ADJUSTED EBITDA DEFINED
Adjusted EBITDA Defined
BGC also provides an additional non-GAAP financial measure, “adjusted EBITDA,” which it defines as GAAP income from operations
before income taxes, adjusted to add back interest expense as well as the following non-cash items:
Employee loan amortization;
Fixed asset depreciation and intangible asset amortization;
Non-cash impairment charges;
Charges relating to grants of exchangeability to limited partnership interests;
Charges related to redemption of units;
Charges related to issuance of restricted shares; and
Non-cash earnings or losses related to BGC’s equity investments.
The Company’s management believes that this measure is useful in evaluating BGC’s operating performance compared to that of its
peers, because the calculation of adjusted EBITDA generally eliminates the effects of financing and income taxes and the accounting
effects of capital spending and acquisitions, which would include impairment charges of goodwill and intangibles created from acquisitions.
Such items may vary for different companies for reasons unrelated to overall operating performance. As a result, the Company’s
management uses these measures to evaluate operating performance and for other discretionary purposes. BGC believes that adjusted
EBITDA is useful to investors to assist them in getting a more complete picture of the Company’s financial results and operations.
Since adjusted EBITDA is not a recognized measurement under GAAP, investors should use adjusted EBITDA in addition to GAAP
measures of net income when analyzing BGC’s operating performance. Because not all companies use identical EBITDA calculations, the
Company’s presentation of adjusted EBITDA may not be comparable to similarly titled measures of other companies. Furthermore,
adjusted EBITDA is not intended to be a measure of free cash flow, because adjusted EBITDA does not consider certain cash
requirements, such as tax and debt service payments.
For a reconciliation of adjusted EBITDA to GAAP income (loss) from operations before income taxes, the most comparable financial
measure calculated and presented in accordance with GAAP, see the section of this document titled "Reconciliation of GAAP Income
(loss) to Adjusted EBITDA (and Comparison to Pre-Tax Distributable Earnings.)”
40

Date
41
RECONCILIATION OF GAAP INCOME TO ADJUSTED EBITDA
BGC PARTNERS, INC.
Reconciliation of GAAP Income (Loss) to Adjusted EBITDA
(and Comparison to Pre-Tax Distributable Earnings)
(in thousands) (unaudited)
Q4 2015 Q4 2014 FY 2015 FY 2014
GAAP Income (loss) from continuing operations before income taxes (1) 251,933$ (59,286)$ 388,814$ (3,188)$
Add back:
Employee loan amortization and reserves on employee loans 55,847 4,291 86,708 25,708
Interest expense 18,074 10,183 69,359 37,945
Fixed asset depreciation and intangible asset amortization 19,568 11,976 81,996 44,747
Impairment of fixed assets 328 94 19,128 5,648
Exchangeability charges (2) 134,812 30,043 231,367 126,514
(Gains) losses on equity investments 815 2,418 (1,863) 8,621
Adjusted EBITDA 481,377$ (281)$ 875,509$ 245,995$
Pre-Tax distributable earnings 91,703$ 72,553$ 332,498$ 247,564$
(1) GAAP Income from continuing operations before taxes for the fourth quarter of 2015 and FY 2015 includes the gain on the sale of Trayport, and the fourth quarter of 2014 and FY 2014 includes
the settlement of all legal claims with Tullett.
(2) Represents non-cash, non-economic, and non-dilutive charges relating to grants of exchangeability to limited partnership units.

Date
42
RECONCILIATION OF INCOME UNDER GAAP TO DISTRIBUTABLE EARNINGS
Q4 2015 Q4 2014 FY 2015 FY 2014
GAAP income (loss) before income taxes 251,933 $ (59,286) $ 388,814 $ (3,188) $
Pre-tax adjustments:
Dividend equivalents to RSUs - - - 3
Non-cash (gains) losses related to equity investments, net 815 2,418 (1,863) 8,621
Real Estate purchased revenue, net of compensation and other expenses (a) 1,705 5,130 9,718 9,616
Allocations of net income and grant of exchangeability to limited partnership units and FPUs 145,718 30,392 259,639 136,633
Nasdaq earn-out revenue (b) 7,787 6,517 (7,336) (6,900)
(Gains) and charges with respect to acquisitions, dispositions and / or resolutions of litigation, charitable
contributions and other non-cash, non-dilutive, non-economic items (316,256) 87,382 (316,474) 102,780
Total pre-tax adjustments (160,231) 131,840 (56,316) 250,752
Pre-tax distributable earnings 91,703 $ 72,553 $ 332,498 $ 247,564 $
GAAP net income (loss) available to common stockholders 65,015 $ (18,685) $ 126,788 $ 4,135 $
Allocation of net income (loss) to noncontrolling interest in subsidiaries 106,265 (19,128) 135,285 (11,030)
Total pre-tax adjustments (from above) (160,231) 131,840 (56,316) 250,752
Income tax adjustment to reflect effective tax rate 65,686 (33,384) 70,621 (36,484)
Post-tax distributable earnings 76,736 $ 60,642 $ 276,378 $ 207,373 $
Pre-tax distributable earnings per share (c) 0.23 $ 0.21 $ 0.89 $ 0.74 $
Post-tax distributable earnings per share (c) 0.20 $ 0.18 $ 0.74 $ 0.62 $
Fully diluted weighted-average shares of common stock outstanding 404,067 374,256 390,836 368,571
Notes and Assumptions
(a) Represents revenues related to the collection of receivables, net of compensation, and non-cash charges on acquired receivables, which would
have been recognized for GAAP other than for the effect of acquisition accounting.
(b) Distributable earnings for Q4 2015 and Q4 2014 includes $7.8 million and $6.5 million, respectively, and FY 2015 and FY 2014 includes $(7.3) million and $(6.9) million,
respectively, of adjustments associated with the Nasdaq transaction. For Q4 2015 and Q4 2014 income/revenues related to the Nasdaq earn-out shares were $9.8 million and $7.4 million
for GAAP and $17.6 million and $14.0 million for distributable earnings, respectively. For FY 2015 and FY 2014, the earn-out revenues were $68.0 million and $52.8 million for GAAP
and $60.7 million and $45.9 million for distributable earnings, respectively.
(c) On April 1, 2010, BGC Partners issued $150 million in 8.75 percent Convertible Senior Notes due 2015, which matured and were converted into 24.0 million Class A common
shares in Q2 2015, and on July 29, 2011, BGC Partners issued $160 million in 4.50 percent Convertible Senior Notes due 2016. The distributable earnings per share calculations
for Q4 2015 and Q4 2014 include 16.3 million and 40.2 million, respectively, and for FY 2015 and FY 2014 include 23.0 million and 40.1 million of additional shares, respectively,
underlying these Notes. The distributable earnings per share calculations exclude the interest expense, net of tax, associated with these Notes.
Note: Certain numbers may not add due to rounding.
BGC PARTNERS, INC.
RECONCILIATION OF GAAP INCOME (LOSS) TO DISTRIBUTABLE EARNINGS (in thousands, except per share data)
(unaudited)

Date
43
43
RECONCILIATION OF REVENUES UNDER GAAP AND DISTRIBUTABLE EARNINGS
BGC PARTNERS, INC.
RECONCILIATION OF REVENUES UNDER GAAP AND DISTRIBUTABLE EARNINGS
(in thousands)
(unaudited)
Q4 2015 Q4 2014 FY 2015 FY 2014
GAAP Revenue 673,444$ 489,283$ 2,575,437$ 1,787,490$
Plus: Other income (losses), net 421,045 1,673 519,378 40,806
Adjusted GAAP 1,094,489 490,956 3,094,815 1,828,296
Adjustments:
Gains related to sale of Trayport (1) (407,201) - (407,201) -
Nasdaq Earn-out Revenue (2) 7,787 6,517 (7,336) (6,900)
Revenue with respect to acquisitions, dispositions, resolutions of litigation, and other (4,828) 4,162 (42,497) (5,192)
Non-cash (gains) losses related to equity investments 815 2,418 (1,863) 8,621
Real Estate purchased revenue 940 11,399 5,425 16,625
Distributable Earnings Revenue 692,003$ 515,452$ 2,641,343$ 1,841,450$
(1) Q4 2015 and FY 2015 include the gain, net of fees, related to the sale of Trayport and the net realized and unrealized gain on the ICE shares received in the Trayport transaction.
(2) Q4 2015 and Q4 2014 income/revenues related to the Nasdaq earn-out shares were $9.8 million and $7.4 million for GAAP and $17.6 million and $14.0 million
for distributable earnings, respectively. For FY 2015 and FY 2014, the earn-out revenues were $68.0 million and $52.8 million for GAAP and $60.7 million
and $45.9 million for distributable earnings, respectively.
Note: Certain numbers may not add due to rounding.

Date
44
RECONCILIATION OF GAAP INCOME TO ADJUSTED EBITDA
BGC PARTNERS, INC.
Reconciliation of GAAP Income (Loss) to Adjusted EBITDA
(and Comparison to Pre-Tax Distributable Earnings)
(in thousands) (unaudited)
Q1 2016 Q1 2015
GAAP Income (loss) from continuing operations before income taxes (1) 21,131 $ 36,270 $
Add back:
Employee loan amortization and reserves on employee loans 10,459 8,066
Interest expense 13,458 15,902
Fixed asset depreciation and intangible asset amortization 19,468 16,599
Impairment of fixed assets 1,792 4,484
Exchangeability charges (2) 27,782 36,572
(Gains) losses on equity investments (558) (803)
Adjusted EBITDA 93,532 $ 117,090 $
Pre-Tax distributable earnings 90,776 $ 75,199 $
(1) GAAP Income from continuing operations before taxes for Q1 2015 includes a $29.0 million gain on the 17.1 million shares of GFI common stock owned
by BGC prior to the tender offer.
(2) Represents non-cash, non-economic, and non-dilutive charges relating to grants of exchangeability to limited partnership units.

Date
45
RECONCILIATION OF INCOME UNDER GAAP TO DISTRIBUTABLE EARNINGS
Q1 2016 Q1 2015
GAAP income (loss) before income taxes 21,131 $ 36,270 $
Pre-tax adjustments:
Non-cash (gains) losses related to equity investments, net (558) (803)
Real Estate purchased revenue, net of compensation and other expenses (a) 579 3,170
Allocations of net income and grant of exchangeability to limited partnership units and FPUs 32,924 37,054
Nasdaq earn-out revenue (b) 12,355 12,484
(Gains) and charges with respect to acquisitions, dispositions and / or resolutions of litigation, and other
non-cash, non-dilutive, non-economic items 24,345 (12,976)
Total pre-tax adjustments 69,645 38,929
Pre-tax distributable earnings 90,776 $ 75,199 $
GAAP net income (loss) available to common stockholders 13,659 $ 14,055 $
Allocation of net income (loss) to noncontrolling interest in subsidiaries 2,516 10,382
Total pre-tax adjustments (from above) 69,645 38,929
Income tax adjustment to reflect effective tax rate (8,776) (1,234)
Post-tax distributable earnings 77,044 $ 62,132 $
Pre-tax distributable earnings per share (c) 0.22 $ 0.22 $
Post-tax distributable earnings per share (c) 0.18 $ 0.18 $
Fully diluted weighted-average shares of common stock outstanding 434,855 378,744
Notes and Assumptions
(a) Represents revenues related to the collection of receivables, net of compensation, and non-cash charges on acquired receivables, which would
have been recognized for GAAP other than for the effect of acquisition accounting.
(b) Distributable earnings for Q1 2016 and Q1 2015 includes $12.4 million and $12.5 million, respectively, of adjustments associated with the Nasdaq
transaction. For Q1 2016 and Q1 2015 income/revenues related to the Nasdaq earn-out shares were $11.0 million and $2.9 million for GAAP
and $23.3 million and $15.4 million for distributable earnings, respectively.
(c) On April 1, 2010, BGC Partners issued $150 million in 8.75 percent Convertible Senior Notes due 2015, which matured and were converted into
24.0 million Class A common shares in Q2 2015, and on July 29, 2011, BGC Partners issued $160 million in 4.50 percent Convertible Senior Notes
due 2016. The distributable earnings per share calculations for Q1 2016 and Q1 2015 include 16.3 million and 40.3 million shares, respectively,
underlying these Notes. The distributable earnings per share calculations exclude the interest expense, net of tax, associated with these Notes.
Note: Certain numbers may not add due to rounding.
BGC PARTNERS, INC.
RECONCILIATION OF GAAP INCOME (LOSS) TO DISTRIBUTABLE EARNINGS (in thousands, except per share data)
(unaudited)

Date
46
46
RECONCILIATION OF REVENUES UNDER GAAP AND DISTRIBUTABLE EARNINGS
BGC PARTNERS, INC.
RECONCILIATION OF REVENUES UNDER GAAP AND DISTRIBUTABLE EARNINGS
(in thousands)
(unaudited)
Q1 2016 Q1 2015
GAAP Revenue 639,036$ 547,567$
Plus: Other income (losses), net (2,359) 31,788
Adjusted GAAP 636,677 579,355
Adjustments:
Nasdaq Earn-out Revenue (1) 12,355 12,484
Revenue with respect to acquisitions, dispositions, resolutions of litigation, and other (2) 11,275 (29,106)
Non-cash (gains) losses related to equity investments (558) (803)
Real Estate purchased revenue 358 1,965
Distributable Earnings Revenue 660,107$ 563,895$
(1) Q1 2016 and Q1 2015 income/revenues related to the Nasdaq earn-out shares were $11.0 million and $2.9 million for GAAP
and $23.3 million and $15.4 million for distributable earnings, respectively.
(2) Q1 2015 GAAP revenues included $29.0 million related to the gain on the 17.1 million shares of GFI that we acquired prior to
the completion of the Tender Offer in February 2015.
Note: Certain numbers may not add due to rounding.

Date
47
47
LIQUIDITY ANALYSIS
March 31, 2016 December 31, 2015
Cash and cash equivalents 456,116$ 461,207$
Securities owned 32,767 32,361
Marketable securities (1) (2) 191,697 532,510
Total 680,580$ 1,026,078$
(1) As of December 31, 2015, $117.9 million of Marketable securities on our balance sheet
had been lent out in a Securities Loaned transaction and therefore are not included in
this Liquidity Analysis.
(2) The significant decrease in Marketable Securities during the quarter ended
March 31, 2016 was primarily due to selling a portion of our positions in both ICE and
Nasdaq.
BGC PARTNERS, INC.
LIQUIDITY ANALYSIS
(in thousands)
(unaudited)

Date
48 48
bgcpartners.com