june 2019 · 2019-07-16 · index content category no. sbi magnum children’s benefit fund...
TRANSCRIPT

June 2019

INDEX
......................................................................................................................................................................
......................................................................................................................................................................
......................................................................................................................................................................
......................................................................................................................................................................
......................................................................................................................................................................
......................................................................................................................................................................
......................................................................................................................................................................
......................................................................................................................................................................
......................................................................................................................................................................
......................................................................................................................................................................
......................................................................................................................................................................
......................................................................................................................................................................
......................................................................................................................................................................
......................................................................................................................................................................
......................................................................................................................................................................
......................................................................................................................................................................
......................................................................................................................................................................
......................................................................................................................................................................
......................................................................................................................................................................
......................................................................................................................................................................
......................................................................................................................................................................
......................................................................................................................................................................
......................................................................................................................................................................
......................................................................................................................................................................
......................................................................................................................................................................
......................................................................................................................................................................
......................................................................................................................................................................
......................................................................................................................................................................
Content Category No.
From the Managing Director’s Desk
Market Overview
From the CMO’s Desk
Snapshot of Equity Funds & Other Categories
Snapshot of Hybrid Funds & Solution Oriented Scheme
04
05
07
08
31
SBI Blue Chip Fund Equity - Large Cap 11
SBI Magnum Equity ESG Fund
(Previously known as SBI Magnum Equity Fund) Equity - Thematic Fund 12
SBI Magnum Multicap Fund Equity - Multi Cap Fund 13
SBI Contra Fund Equity - Contra Fund 14
SBI Large & Midcap Fund
(Previously known as SBI Magnum Multiplier Fund) Equity - Large & Mid Cap Fund 15
SBI Focused Equity Fund
(Previously known as SBI Emerging Businesses Fund) Equity - Focused Fund 16
SBI Magnum MidCap Fund Equity - Mid Cap Fund 17
SBI Magnum Global Fund Equity - Thematic Fund 18
SBI Small Cap Fund
(Previously known as SBI Small & Midcap Fund) Equity - Small Cap Fund 19
SBI Magnum Taxgain Scheme Equity - ELSS 20
SBI Healthcare Opportunities Fund
(Previously known as SBI Pharma Fund) Equity - Sectoral Fund 21
SBI Banking And Financial Services Fund Equity - Sectoral Fund 22
SBI PSU Fund Equity - Sectoral Fund 23
SBI Magnum Comma Fund Equity - Sectoral Fund 24
SBI Infrastructure Fund Equity - Sectoral Fund 25
SBI Consumption Opportunities Fund
(Previously known as SBI FMCG Fund) Equity - Thematic 26
SBI Technology Opportunities Fund
(Previously known as SBI IT Fund) Equity - Sectoral Fund 27
SBI Equity Minimum Variance Fund Equity - Thematic 28
SBI Gold Fund Fund of Fund 29
SBI Nifty Index Fund Index Fund 30
SBI Equity Hybrid Fund
(Previously known as SBI Magnum Balanced Fund) Hybrid - Aggressive Hybrid Fund 32
SBI Dynamic Asset Allocation Fund Hybrid - Dynamic Asset Allocation Fund 33
SBI Debt Hybrid Fund
(Previously known as SBI Magnum Monthly Income Plan) Hybrid - Conservative Hybrid Fund 34
SBI Multi Asset Allocation Fund
(Previously known as SBI Magnum Monthly
Income Plan - Floater) Hybrid - Multi Asset Allocation Fund 35

......................................................................................................................................................................
......................................................................................................................................................................
......................................................................................................................................................................
......................................................................................................................................................................
......................................................................................................................................................................
......................................................................................................................................................................
......................................................................................................................................................................
......................................................................................................................................................................
......................................................................................................................................................................
......................................................................................................................................................................
......................................................................................................................................................................
......................................................................................................................................................................
......................................................................................................................................................................
......................................................................................................................................................................
......................................................................................................................................................................
......................................................................................................................................................................
......................................................................................................................................................................
......................................................................................................................................................................
......................................................................................................................................................................
......................................................................................................................................................................
......................................................................................................................................................................
......................................................................................................................................................................
......................................................................................................................................................................
......................................................................................................................................................................
INDEXContent Category No.
SBI Magnum Children’s Benefit Fund
(Previously known as SBI Magnum Children’s Benefit Plan) Solutions Oriented Scheme - Children’s Fund 36
SBI Equity Savings Fund Hybrid - Equity Savings Fund 37
SBI Arbitrage Opportunities Fund Hybrid - Arbitrage Fund 38
SBI Magnum Gilt Fund
(Previously known as SBI Magnum Gilt Fund -
Long Term Plan) Debt - Gilt Fund 41
SBI Magnum Income Fund Debt - Medium To Long Duration Fund 42
SBI Dynamic Bond Fund Debt - Dynamic Bond Fund 43
SBI Corporate Bond Fund Debt - Corporate Bond Fund 44
SBI Credit Risk Fund
(Previously known as SBI Corporate Bond Fund) Debt - Credit Risk Fund 45
SBI Magnum Medium Duration Fund
(Previously known as SBI Regular Savings Fund) Debt - Medium Duration Fund 46
SBI Short Term Debt Fund Debt - Short Duration Fund 47
SBI Magnum Constant Maturity Fund
(Previously known as SBI Magnum Gilt Fund -
Short Term Plan) Debt - Gilt Fund With 10 Year Constant Duration 48
SBI Magnum Low Duration Fund
(Previously known as SBI Ultra Short Term Debt Fund) Debt - Low Duration Fund 49
SBI Savings Fund Debt - Money Market Fund 50
SBI Banking and PSU Fund
(Previously known as SBI Treasury Advantage Fund) Debt - Banking And PSU Fund 51
SBI Liquid Fund
(Previously known as SBI Premier Liquid Fund) Debt - Liquid Fund 52
SBI Magnum Ultra Short Duration Fund
(Previously known as SBI Magnum InstaCash Fund) Debt - Ultra Short Duration Fund 53
SBI Overnight Fund
(Previously known as SBI Magnum InstaCash Fund -
Liquid Floater) Debt - Overnight Fund 54
Snapshot of Debt Funds & Other Categories 40
Comparative Performance for all Schemes 55
Systematic Investment Plan (SIP) 61
Total Expense Ratios 64
Dividend History Of Debt & Hybrid Funds 65
Disclaimer 68
SBI Funds Management Pvt Ltd Branches 69
How to read the Factsheet 70

From the Managing Director’s Desk
Dear Investors,
Managing Director & CEO
Elections are finally behind us, and we have a new government at the Centre with a clear mandate.
While on the one hand markets welcomed this news, on the other markets were disappointed by
the rather lackluster GDP growth and poor employment numbers.
GDP for FY19 at 6.8% was the lowest seen in five years, bringing up concerns of slowing economic
growth. The RBI played its part in addressing this concern by cutting the repo rate by 25 bps to
5.75, the lowest since July 2010. It also changed its stance to “accommodative” indicating a
willingness to bolster demand and encourage investment activity to boost economic growth.
These events helped improve market sentiments, as did the onset of monsoons in certain pockets
of the country.
This push-and-pull between positive and negative news flows creates volatility in the market and
the best way to deal with such volatility is to sit tight with your equity investments. Market and
economic recovery move in cycles, where highs will be followed by lows. These highs and lows last
for a short period of time, but over the long-term present growth opportunities for investors.
There is no right or wrong time in the equity market, all you need to do is spend time in the market.
The longer you stay invested, the better it is for you. However, when it comes to choosing the right
equity investments, there are a few things you need to evaluate first.
To begin with, identify the goal for which you are investing and what is the time period of that goal.
Then analyse what your risk appetite is, that is your ability to take risks on the investment you
make. And last but not the least, choose the right investment plan that suits your goals and risk
profile.
What follows is that mutual fund investments are not just about being invested but about making
the right investments. Every individual’s investment planning solutions are unique and the first
step towards sound investment planning begins with identifying the right solution.
This is where equity mutual funds come into play. They offer products that suit different investor
risk appetite and needs, and offer benefits of diversification and ease of transaction.
So, ignore the short-term news flows which only serve to distract you from your goals. Stay
focused on the larger picture and choose equity mutual funds for long-term wealth-creation.
As for the elections, results will be out on May 23rd.
Till then, and even after that, keep calm and stay invested.
Happy Investing.
Warm Regards,
Ashwani Bhatia
Ashwani Bhatia
MD & CEO
04
Market Overview
Navneet MunotED & CIO
The full majority gives BJP led NDA government a significant political capital. It also reinforces the belief in
some of the policies undertaken during their last term; particularly the actions to keep the inflation
contained and focus on social security net. The measures to improve rural roads and electrification, build
rural houses, distribute free LPG, free LED, free toilet and expansion of social security net in terms of
pension and medical insurance had earned them a significant political mileage. The prime-minister's
speech has been harping on shift from 'caste' to 'class' politics; the class of "have(s) and have not(s).
Have(s) must support have-not(s). In India, North and South divide is stark. North Indian states,
accounting for nearly two thirds of population earn a per-capita Income which is half of the southern
population. They need to converge in their standard of living. And in our view, the focus on welfare
schemes will continue in the second term of the government. The welfare aspects may expand to other key
aspects of life such as providing 'safe drinking water'. At the same time, the government should focus on
effective implementation of the existing schemes as well and iron out the wrinkles in their execution.
As the government commenced its second term, the Cabinet has approved the plan to extend the PM-
KISAN scheme, including all eligible farmer families irrespective of the size of land holdings with an
estimated central government expenditure of 872 billion for FY20 ( 122 billion higher than FY2020BE). It
also announced a pension scheme for shopkeepers, retail traders and self-employed persons assuring a
minimum monthly pension of 3,000 after 60 years of age. It has also announced a pension scheme for
farmers.
Even as the government undertook social expenditure, it did not fray from the path of fiscal consolidation
at large. We expect the broad fiscal prudence to continue even in the second term. Barring the natural
course of inflation mean reversion, the inflation scenario should broadly remain well behaved.
The government is likely to display continuity on the broader economic reform agenda. During its first
term reforms seen were in the area of FDI liberalization, implementation of GST, Insolvency and
Bankruptcy Code, financial inclusion, regulation in the real estate market, and setting up of monetary
policy committee. The policies were also aimed at spurring infrastructure activities and easing the
conditions for doing business in India.
Yet, challenges in front of the government are bigger as compared to 2014. Growth has been softening.
The latest GDP print of 5.8% for Q4 FY19 is at five year low. A part of it can be due to election related factors
(slowdown in government infrastructure related orders ahead of election, postponement of business
capital spending plans). As the election is over, some of these shelved spending should come back. But
even after accounting for it, analysis of the underlying data point to a severe slowdown in growth
momentum. The issue on unemployment has been officially acknowledged (NSSO estimates put
unemployment rate at 6.1% for 2017-18). Inflation is within their respective target bands and is a non-
issue while the external outlook is mired with uncertainty.
Policy support is needed. The final central budget is to be placed in parliament on 5th of July. As of now,
owing to weak revenue buoyancy, fiscal is relatively hand tied, unless of course the finance ministry is
ready to accommodate some slippage or the Jalan committee comes out with some material bonanza from
RBI in June. Still, favorable election outcomes should help the government to undertake some of the
unfinished tasks such as enforcing the GST compliance and bringing about the tax buoyancy. There have
been serious liquidity issues in the financial sector since the middle of last year. Non-banking financial
entities (NBFEs) will continue to keep markets on the edge as there are huge re-financing risks. Reviving
the real estate sector should also be focused on. With a reform friendly government at helm, confidence
among business community and investors should return.
Some reforms have lent disruption to the economy as reflected in slowing growth momentum.
` `
`
05

Government would have to focus on a host of other reforms that offset disruption, helping the economy
making a smooth transition. For instance, sharp fall in inflation is positive for the economy but lower food
prices have created distress among farmers. Reforms are needed to ensure better income growth for farmers.
Next generation financial sector reforms should also be on the table to attract both foreign and domestic
savings to meet huge investment needs. Legislative reforms and a mind-set change were the major agenda
for the previous term. Execution should be the key now.
In 2014, Modi government launched its flagship campaign, called 'Make in India', targeting domestic
manufacturing. The progress under this initiative has not shown up yet (the manufacturing share has not
improved). The trade tussle between US-China has led to an increased spotlight on the shift of manufacturing
away from China. China's annual manufacturing exports sums to US$2.5 trillion, which is more than India's
total GDP. India can benefit from this evolving global condition. The country has improved over the past three
to four years on many factors such as ease of doing business reforms, financial penetration, and improved
infrastructure. The policy makers should now focus on the sectors on which the US has imposed tariffs on
China, on sectors where China is trying to limit production due to domestic reasons and where India already
has an established manufacturing base. There are a couple of sectors like electrical/electronic products,
clothing, footwear, chemicals and industrials that can show significant positive delta in exports with some
policy nudge. A greater focus on innovation and technology is critical.
While effects of fiscal measures will take time to trickle in, RBI will be expected to take lead in supporting
growth. We expect both rate cut (at least 25bps in June) and liquidity support (liquidity to turn neutral in a
month's time). Ideally, central bank should also change their stance to accommodative and explicitly state to
support liquidity in their forward guidance. Guidance is monetary policy removes uncertainty and is as
important as the actual action.
Indian equity market continued to move up for the third consecutive month in May and has risen 9.8% YTD.
While FIIs have invested US$ 10.6 billion YTD, Domestic institutional investors turned positive on equities in
May (US$ 750 million) after two months of selling. A stable government is positive for the market especially as
it could push through pro-growth policies with greater ease. For the foreign investors, India also provides an
added advantage of being a natural hedge against the adverse growth impact of US- China trade dispute.
Coming to the earnings, last five years saw corporate earnings growing at a sub-optimal rate, given the
backdrop of structural and disruptive macro reforms. India's corporate profit to GDP ratio has moderated
from 5.7% in FY10 to 2.8% in FY19 and likely to be sub 2% in FY18. However, now the corporate earnings cycle
appears to be bottoming out. With a revival in asset quality of corporate banks and likelihood of pro-growth
policies by the government, FY20 is expected to witness earnings growth over 20%. However, there is a
limited room for any re-rating for the markets, given the current valuations (NIFTY 12m fwd PE at 19.5x). As
we look towards easing of interest rate conditions, the interest sensitive sectors should see gains. We are
biased towards domestic cyclicals.
We had turned positive on Indian bond market since March 2019. As fundamentals and valuation looked
positive, we believed it could create new demand (from sources such as FIIs) once the election overhang was
over. This has played out particularly sharply post the 'market favored' outcome in 2019 general election. G-
sec has rallied by 30bps in May, while SDL and Corporate Bonds have rallied by 56 bps and 43bps respectively
since March. The continuity of government has alleviated the concerns of sharp fiscal slippage and hence
higher G-sec supply. That said, fundamentally a weak tax collection for the central government continues to
be a concern and that still keeps the risk of 10-20bps fiscal slippage in FY20 alive. Upcoming budget
announcement will be closely watched. As such we still remain concerned on fiscal and consequently, the
overall sovereign and quasi-sovereign bond supply for FY20. Some risks also remain from the uncertainty
around oil prices.
Despite the fiscal and oil risks, we continue to be positive on fixed income duration. While the valuation
attractiveness has partly materialized, the spreads are still higher than long-term trends and can further
narrow, particularly when we expect easing monetary conditions in India. We expect additional 50bps rate cut
in 2019 and liquidity to turn to neutral/ surplus by June end. Credit spreads have widened significantly and
risk-reward looks favorable in that space.
Navneet Munot, ED & CIO – SBI Funds Management Private Limited
06

Dear Friends,
Executive Director & CMO (Domestic Business)
The markets saw increased action within the election month, with the Sensex touching the 40,000
landmark, and the expectations remain high in the months ahead with a strong mandate for the
elected government. The industry saw increased net equity inflows (including ELSS) of over 5,400
crore with the monthly SIP flows at around 8,183 crore. I feel that investors who were waiting on the
side lines, even though events like elections are blips in the long-term scheme of things, should
invest with strong political stability in place and a promise of further economic reforms and spends
on priority sectors. The India growth story, irrespective of events like elections continues to be very
sound. Factors like favourable demographics, increasing domestic consumption from urban and
rural locations, rising income levels and all-round investment into crucial sectors make the future
look optimistic.
The asset management industry remains as dynamic as ever with regulations and geopolitical events
influencing it. Moreover, with a shift in household savings/investment habits into financial assets the
Indian retail investor continues to drive the momentum for mutual funds. With the new regulations on
TER coming into effect, there is an increasing need for more consistent and relevant engagement
with distribution partners and investors. I have always believed that mutual funds provide the last
mile access to equities for retail investors. Mutual funds remain the most convenient option allowing
the investor access to multiple asset classes at a very low cost.
For us at SBI Mutual Fund, we continue to educate investors on identifying goals and using mutual
fund scheme(s) as solutions towards planning those goals. With scheme standardisation in place,
mutual funds have become simpler in terms of categorising schemes with clear investment
objectives. My advice is to keep your investment portfolio simple, select schemes which can fulfil
your identified financial goals and make use of facilities like SIP and STP while investing to reduce the
volatility.
As always, we value your investments and look forward to your continued patronage.
Warm Regards,
D.P.Singh
`
`
Data Source as on May 31, 2019; Source: AMFI and Internal
D.P. SinghED & CMO (Domestic Business)
07
From the CMO’s Desk

Po
rtfo
lio
Cla
ssif
icati
on
By In
du
str
yA
llo
cati
on
(%
) as o
n 3
1 M
ay 2
019
Port
folio C
lassif
icati
on B
y I
nd
ustr
yA
llocati
on (
%)
(Top
10
)
Oth
er
De
tail
s
Exit
Load
Wit
hin
1 Y
ear
- 1
%W
ithin
1 Y
ear
- 1
%O
n o
r Befo
re 3
0days -
0.1
0%
(w.e
.f 1
5/01/2019)
Wit
hin
1 Y
ear
- 1
%O
n o
r Befo
re 3
0days -
0.1
0%
(w.e
.f 1
5/01/2019)
Wit
hin
1 Y
ear
- 1
%W
ithin
1 Y
ear
- 1
%
Fin
ancia
l Serv
ices
38
.73
Consum
er
Goods
8.7
9
Energ
y8
.05
Cash, C
ash E
quiv
ale
nts
And O
thers
7.3
0
Auto
mobile
6.8
3
Constr
ucti
on
5.8
3
IT5
.37
Fert
ilis
ers
& P
esti
cid
es
4.0
7
Industr
ial
Manufa
ctu
ring
3.9
5
Cem
ent
& C
em
ent
Pro
ducts
3.6
4
Fin
ancia
l Serv
ices
40.7
3
Consum
er
Goods
11.2
5
IT11.1
3
Energ
y10.3
9
Constr
ucti
on
5.2
1
Auto
mobile
4.6
4
Pharm
a3.2
0
Cash, C
ash E
quiv
ale
nts
And O
thers
2.3
7
Tele
com
2.3
4
Cem
ent
& C
em
ent
Pro
ducts
2.3
3
Fin
ancia
l Serv
ices
32.2
0
Consum
er
Goods
11.3
7
Energ
y9.4
8
IT8.7
1
Auto
mobile
6.6
0
Constr
ucti
on
6.0
7
Cem
ent
& C
em
ent
Pro
ducts
4.8
3
Industr
ial
Manufa
ctu
ring
3.7
2
Serv
ices
3.6
1
Cash, C
ash E
quiv
ale
nts
And O
thers
3.4
2
Fin
ancia
l Serv
ices
22.0
3
Industr
ial
Manufa
ctu
ring
13.6
7
Cash, C
ash E
quiv
ale
nts
And O
thers
10.0
7
Pharm
a9.9
9
IT8.3
3
Constr
ucti
on
7.2
6
Tele
com
6.4
2
Consum
er
Goods
5.8
6
Serv
ices
4.7
0
Cem
ent
& C
em
ent
Pro
ducts
4.3
9
Fin
ancia
l Serv
ices
29.8
8
Consum
er
Goods
11.7
8
Cem
ent
& C
em
ent
Pro
ducts
8.3
2
Energ
y8.0
1
Industr
ial
Manufa
ctu
ring
7.6
6
Pharm
a6.2
9
IT5.7
5
Constr
ucti
on
5.4
2
Serv
ices
4.9
3
Tele
com
3.8
6
Fin
ancia
l Serv
ices
24.5
9
Industr
ial
Manufa
ctu
ring
15.5
3
Pharm
a11.5
1
Consum
er
Goods
8.0
7
Constr
ucti
on
7.9
8
Cem
ent
& C
em
ent
Pro
ducts
7.1
2
Fert
ilis
ers
& P
esti
cid
es
6.9
1
Cash, C
ash E
quiv
ale
nts
And O
thers
4.4
5
Energ
y4.2
5
IT3.7
4
Consum
er
Goods
33.9
4
Industr
ial
Manufa
ctu
ring
21.7
7
Pharm
a11.0
6
Auto
mobile
7.5
9
Cem
ent
& C
em
ent
Pro
ducts
6.7
9
Chem
icals
5.2
7
Cash, C
ash E
quiv
ale
nts
And O
thers
4.9
0
Serv
ices
4.1
5
Fert
ilis
ers
& P
esti
cid
es
2.9
5
IT1.4
9
Fu
nd
Deta
ils a
s o
n 3
1 M
ay 2
019
Month
End
AU
M (
in C
rore
s)
``22,7
41.3
7 C
rore
s`2
,38
8.5
3 C
rore
s`7
,58
1.4
0 C
rore
s`1
,54
2.2
4 C
rore
s`2
,61
4.2
9 C
rore
s`3
,66
6.6
8 C
rore
s`3
,58
6.6
9 C
rore
s
Port
folio T
urn
over
0.7
70
.72
0.6
00
.97
0.7
80
.23
0.4
6
Exp
ense R
ati
oRegula
r- 1
.83%
Dir
ect-
1.0
8%
Regula
r- 2
.09
%D
irect-
1.5
0%
Regula
r- 1
.93
%,
Dir
ect-
1.1
3%
Regula
r- 2
.22
%,
Dir
ect-
1.6
7%
Regula
r- 2
.09
%D
irect-
1.6
4%
Regula
r- 1
.98
%,
Dir
ect-
1.2
8%
Regula
r- 1
.99
%,
Dir
ect-
1.3
8%
Sta
nd
ard
Devia
tion
Beta
#
#
#Sharp
e R
ati
o
12.2
2%
0.9
1
0.4
3
12
.17
%
0.8
8
0.5
4
12
.65
%
0.9
1
0.6
2
14
.50
%
0.9
9
0.2
0
12
.92
%
0.8
6
0.5
1
15
.24
%
0.8
3
-0
.00
1
12
.84
%
0.6
4
0.2
0
Schem
e N
am
eSBI
Blu
e C
hip
Fund
SBI
Magnum
Mult
icap
Fund
SBI
Contr
a F
und
SBI
Magnum
Mid
cap
Fund
SBI
Magnum
Glo
bal Fund
Ideal In
vestm
ent
Hori
zon
4years
+3
years
+4
years
+5
years
+4
years
+5
years
+5
years
+
Incep
tion D
ate
14/02/2006
01
/0
1/1
99
12
9/0
9/2
00
50
5/0
7/1
99
92
8/0
2/1
99
32
9/0
3/2
00
53
0/0
9/1
99
4
Fund
Manag
er
Ms.
Sohin
i A
ndani
Mr.
Ruchit
Mehta
(w.e
.f M
ay 5
,20
18
)M
r. A
nup U
padhyay
Mr.
Saura
bh P
ant
Ms. Sohin
i A
ndani
Managin
g S
ince
Sep-2010
May-2
01
8Feb-2
01
7M
ay-2
01
8Sep-2
01
6Ju
ly-2
01
0M
ay-2
01
8
Benchm
ark
S&
P B
SE 1
00 Index
S&
P B
SE 5
00
Index
Po
rtfo
lio
Cla
ssif
icati
on
By
Asset
Allo
cati
on
(%
) as o
n 3
1 M
ay 2
019
Larg
e C
ap
(%
)
Mid
Cap
(%
)
Sm
all C
ap
(%
)
Oth
er
Assets
(%
)
82.1
6
9.8
5
0.6
9
7.3
0
92
.18
5.4
5
-
2.3
7
60
.58
17
.19
18
.81
3.4
2
36
.02
16
.10
37
.81
10
.07
49
.20
35
.88
12
.50
2.4
2
2.0
6
69
.94
23
.55
4.4
5
47
.41
26
.53
21
.15
4.9
0
Snap
shot
of
Eq
uit
y F
und
s &
Oth
er
Cate
gori
es
Ple
ase
consu
lt y
our
financia
l advis
or
befo
re invest
ing.
For
deta
ils,
ple
ase
refe
r to
resp
ecti
ve p
age o
f th
e s
chem
e.
#R
isk F
ree r
ate
: FBIL
Overn
ight
Mib
or
rate
()
Basi
s fo
r R
ati
o C
alc
ula
tion:
3 Y
ears
Month
ly D
ata
Poin
ts.
Expense
rati
o inclu
des
GST,
Base
TER a
nd a
ddit
ional expense
s as
per
regula
tion 5
2(6
A)(
b)
and 5
2(6
A)(
c)
of
SEBI (M
F)
regula
tions
for
both
Dir
ect
and R
egula
r pla
n
6.0
0%
as
on 3
1st
May 2
01
9
SBI
Larg
e &
Mid
cap
Fund
(Pre
vio
usly
know
n a
s S
BI
Magnum
Mult
iplier
Fund)
SBI
Magnum
Eq
uit
yESG
Fund
(Pre
vio
usly
know
n a
s S
BI
Magnum
Equit
y F
und)
Mr.
Din
esh B
ala
chandra
n(w
.e.f
May 5
,20
18
)M
r. A
nup U
padhyay
(w.e
.f M
ay 5
,20
18
)
Nif
ty M
NC
(w.e
.f M
ay 1
6,2
01
8)
Nif
ty L
arg
e M
idC
ap 2
50
(w.e
.f F
ebru
ary
25
,20
19
)S&
P B
SE 5
00
(w.e
.f M
ay 1
6,2
01
8)
Nif
ty M
idcap 1
50
(w.e
.f M
ay 1
6,2
01
8)
Nif
ty 1
00
ESG
Index
(w.e
.f M
ay 1
6,2
01
8)
05
08

Po
rtfo
lio
Cla
ssif
icati
on
By In
du
str
yA
llo
cati
on
(%
) as o
n 3
1 M
ay 2
019
Port
folio C
lassif
icati
on B
y I
nd
ustr
yA
llocati
on (
%)
(Top
10
)
Fin
ancia
l Serv
ices
31
.09
Consum
er
Goods
24
.48
Cash, C
ash E
quiv
ale
nts
And O
thers
11
.50
Industr
ial
Manufa
ctu
ring
6.2
5
Serv
ices
5.4
9
Chem
icals
5.4
6
IT3
.88
Pharm
a3
.83
Tele
com
3.3
8
Constr
ucti
on
2.8
8
Consum
er
Goods
21.4
2
Industr
ial
Manufa
ctu
ring
16.4
6
Fin
ancia
l Serv
ices
12.4
3
Cash, C
ash E
quiv
ale
nts
And O
thers
9.5
0
Cem
ent
& C
em
ent
Pro
ducts
5.1
4
Chem
icals
4.9
1
Texti
les
4.8
9
Serv
ices
4.7
7
Constr
ucti
on
4.6
0
IT4.4
8
Fin
ancia
l Serv
ices
34.2
2
Consum
er
Goods
9.0
3
Industr
ial
Manufa
ctu
ring
8.3
2
Energ
y7.8
1
IT7.2
0
Constr
ucti
on
5.9
9
Cem
ent
& C
em
ent
Pro
ducts
5.2
6
Pharm
a4.7
0
Cash, C
ash E
quiv
ale
nts
And O
thers
3.8
8
Tele
com
3.8
7
Pharm
a9
5.4
7
Healt
hcare
Serv
ices
3.2
3
Cash, C
ash E
quiv
ale
nts
And O
thers
1.3
0
Fin
ancia
l Serv
ices
93.9
0
Cash, C
ash E
quiv
ale
nts
And O
thers
6.1
0
Energ
y40.6
6
Fin
ancia
l Serv
ices
30.3
9
Industr
ial
Manufa
ctu
ring
15.8
1
Cash, C
ash E
quiv
ale
nts
And O
thers
4.8
4
Constr
ucti
on
4.5
9
Meta
ls3.7
2
Energ
y30.2
1
Chem
icals
19.7
2
Meta
ls17.6
7
Cem
ent
& C
em
ent
Pro
ducts
13.8
1
Fert
ilis
ers
& P
esti
cid
es
9.9
9
Cash, C
ash E
quiv
ale
nts
And O
thers
6.6
2
Texti
les
1.9
7
Fu
nd
Deta
ils a
s o
n 3
1 M
ay 2
019
Month
End
AU
M (
Rs. in
Cro
res)
`4,6
42.1
8 C
rore
s`2
,18
6.7
9 C
rore
s`7
,17
0.6
3 C
rore
s`9
34
.56
Cro
res
`8
96
.36
Cro
res
`1
71
.50
Cro
res
`2
69
.85
Cro
res
Port
folio T
urn
over
0.7
60
.61
0.6
20
.61
2.2
50
.34
0.6
2
Exp
ense R
ati
oRegula
r- 2
.03%
Dir
ect-
1.2
3%
Regula
r- 2
.38
%D
irect-
1.2
3%
Regula
r- 1
.94
%,
Dir
ect-
1.4
9%
Regula
r- 2
.35
%,
Dir
ect-
1.3
5%
Regula
r- 2
.45
%D
irect-
1.5
3%
Regula
r- 2
.62
%,
Dir
ect-
2.0
8%
Regula
r- 2
.57
%,
Dir
ect-
2.0
2%
Sta
nd
ard
Devia
tion
Beta
#
#
#Sharp
e R
ati
o
13.6
8%
0.8
7
0.6
7
18
.99
%
0.8
8
0.6
3
12
.88
%
0.9
3
0.3
2
16
.45
%
0.8
6
-0
.66
17
.36
%
0.9
7
0.9
4
17
.83
%
0.8
5
0.2
1
14
.98
%
0.8
1
0.6
1
Schem
e N
am
e
SBI
Focused
Eq
uit
yFund
(Pre
vio
usly
know
n a
sSBI Em
erg
ing B
usin
esses
Fund)
SBI
Sm
all C
ap
Fund
(Pre
vio
usly
know
n a
s S
BI
Sm
all &
Mid
cap F
und)
SBI
Magnum
Taxgain
Schem
e
SBI
Healt
hcare
Op
port
unit
ies F
und
(Pre
vio
usly
know
n a
s S
BI
Pharm
aFund)
SBI
Bankin
g &
Fin
ancia
l Serv
ices
Fund
SBI
PSU
Fund
SBI
Magnum
CO
MM
A F
und
Ideal In
vestm
ent
Hori
zon
5years
+5
years
+3
years
+T
acti
cal
Tacti
cal
Tacti
cal
Tacti
cal
Incep
tion D
ate
17/09/2004
09
/0
9/2
00
93
1/0
3/1
99
30
5/0
7/1
99
92
6/0
2/2
01
50
7/0
7/2
01
00
8/0
8/2
00
5
Fund
Manag
er
Mr.
R.
Sri
niv
asan
Mr.
R.
Sri
niv
asan
Mr.
Din
esh
Bala
chandra
nM
r. T
anm
aya
Desai
Ms. Sohin
i A
ndani
Mr.
Ric
hard
D's
ouza
Mr.
Ric
hard
D's
ouza
Managin
g S
ince
May-2009
Nov
- 2
01
3Sep-2
01
6Ju
n-2
01
1Feb-2
01
5A
ug-2
01
4A
ug-2
01
4
Benchm
ark
S&
P B
SE 5
00 Index
S&
P B
SE S
mall C
ap Index
S&
P B
SE H
EA
LT
H C
AR
EIn
dex
S&
P B
SE P
SU
IN
DEX
Nif
ty C
om
modit
ies
Index
Po
rtfo
lio
Cla
ssif
icati
on
By
Asset
Allo
cati
on
(%
) as o
n 3
1 M
ay 2
019
Larg
e C
ap
(%
)
Mid
Cap
(%
)
Sm
all C
ap
(%
)
Oth
er
Assets
(%
)
51.0
8
15.5
2
21.9
0
11.5
0
6.2
9
14
.61
69
.60
9.5
0
67
.85
16
.86
11
.40
3.8
8
59
.12
18
.11
21
.48
1.3
0
70
.52
17
.37
6.0
1
6.1
0
51
.58
27
.61
15
.96
4.8
4
52
.00
14
.61
26
.77
6.6
2
Oth
er
De
tail
s
Exit
Load
Wit
hin
1 Y
ear
- 1
%W
ithin
1 Y
ear
- 1
%N
ILW
ithin
15
Days -
0.5
0%
Wit
hin
1 Y
ear
- 1
%W
ithin
1 Y
ear
- 1
%W
ithin
1 Y
ear
- 1
%
Snap
shot
of
Eq
uit
y F
und
s &
Oth
er
Cate
gori
es
Ple
ase
consu
lt y
our
financia
l advis
or
befo
re invest
ing.
For
deta
ils,
ple
ase
refe
r to
resp
ecti
ve p
age o
f th
e s
chem
e.
#R
isk F
ree r
ate
: FBIL
Overn
ight
Mib
or
rate
(6
.00
% a
s on 3
1st
May 2
01
9)
Basi
s fo
r R
ati
oC
alc
ula
tion: 3
Years
Month
ly D
ata
Poin
ts.
Expense
rati
o inclu
des
GST,
Base
TER
and a
ddit
ional expense
s as
per
regula
tion 5
2(6
A)(
b)
and 5
2(6
A)(
c)
of
SEBI (M
F)
regula
tions
for
both
Dir
ect
and R
egula
r pla
n
Nif
ty F
inancia
l Serv
ices
(w.e
.f M
ay 1
6,2
01
8)
S&
P B
SE 5
00
(w.e
.f M
ay 1
6,2
01
8)
09

Ple
ase
consu
lt y
our
financia
l advis
or
befo
re invest
ing. For
deta
ils,
ple
ase
refe
r to
resp
ecti
ve p
age o
f th
e s
chem
e.#
Ris
k F
ree r
ate
: FBIL
Overn
ight
Mib
or
rate
(6.0
0%
as
on 3
1st
May 2
019)
Basi
s fo
r
Rati
o C
alc
ula
tion:
3 Y
ears
Month
ly D
ata
Poin
ts. Expense
rati
o inclu
des
GST, Base
TER
and a
ddit
ional expense
s as
per
regula
tion 5
2(6
A)(
b)
and 5
2(6
A)(
c)
of
SEBI (M
F)
regula
tions
for
both
Dir
ect
and R
egula
r pla
n
Po
rtfo
lio
Cla
ssif
icati
on
By In
du
str
yA
llo
cati
on
(%
)a
s o
n 3
1 M
ay
20
19
Port
folio C
lassif
icati
on B
y I
nd
ustr
yA
llocati
on (
%)
(Top
10)
Constr
ucti
on
27.2
5
Industr
ial
Manufa
ctu
ring
22.9
5
Energ
y14.5
1
Tele
com
9.4
3
Serv
ices
8.3
8
Fin
ancia
l Serv
ices
7.9
4
Cem
ent
& C
em
ent
Pro
ducts
6.0
8
Cash, C
ash E
quiv
ale
nts
And O
thers
2.3
5
Auto
mobile
1.1
2
Consum
er
Goods
71.7
6
Serv
ices
10.1
9
Texti
les
9.1
7
Auto
mobile
3.9
8
Constr
ucti
on
3.1
5
Cash, C
ash E
quiv
ale
nts
And O
thers
1.7
5
IT86.0
1
Tele
com
11.5
1
Cash, C
ash E
quiv
ale
nts
And O
thers
1.9
6
Media
And
Ente
rtain
ment
0.5
2
IT30.8
6
Consum
er
Goods
15.3
0
Fin
ancia
l Serv
ices
15.0
3
Pharm
a9.9
3
Energ
y8.2
1
Auto
mobile
5.7
9
Meta
ls4.7
7
Cem
ent
& C
em
ent
Pro
ducts
2.1
9
Cash,
Cash E
quiv
ale
nts
And O
thers
2.1
6
Tele
com
1.8
3
ETF
99.7
6
Cash, C
ash E
quiv
ale
nts
And O
thers
0.2
1
Fin
ancia
l Serv
ices
39.2
9
Energ
y14.5
3
IT13.5
7
Consum
er
Goods
10.5
8
Auto
mobile
5.8
5
Constr
ucti
on
3.9
4
Meta
ls3.3
8
Pharm
a2.1
8
Cem
ent
& C
em
ent
Pro
ducts
1.7
4
Tele
com
1.6
8
Fu
nd
Deta
ils
as
on
31
Ma
y 2
01
9
Schem
e N
am
eSBI
Infr
astr
uctu
reFund
SBI
Gold
Fund
SBI
Nif
ty I
nd
ex F
und
Ideal In
vestm
ent
Hori
zon
Tacti
cal
Tacti
cal
Tacti
cal
5years
+T
acti
cal
3years
+
Incep
tion D
ate
06/0
7/2
00
70
5/0
7/1
99
90
5/0
7/1
99
90
2/0
3/2
01
91
2/0
9/2
01
11
7/0
1/2
00
2
Fund
Manag
er
Mrs
. N
idhi C
haw
laM
r. S
aura
bh P
ant
Mr.
Anup U
padhyay
Mr.
Ravip
rakash S
harm
aM
r. R
avip
rakash S
harm
aM
r. R
avip
rakash S
harm
a
Manag
ing
Sin
ce
Nov-2
01
8Ju
n-2
01
1Ju
n-2
01
1M
ar-
20
19
Sep-2
01
1Feb-2
01
1
Benchm
ark
Nif
ty Infr
astr
uctu
reIn
dex
Pri
ce o
f Physic
al G
old
Nif
ty 5
0 Index
Po
rtfo
lio
Cla
ss
ific
ati
on
By
As
se
tA
llo
ca
tio
n (
%)
as
on
31
Ma
y 2
01
9
Larg
e C
ap
(In
%)
Mid
Cap
(In
%)
Sm
all C
ap
(In
%)
Oth
er
Assets
(In
%)
42
.98
10
.50
44
.18
2.3
5
40
.57
23
.71
33
.98
1.7
5
73
.10
6.2
2
18
.72
1.9
6
- -
0.2
1
ET
F: 9
9.7
6
97
.84
- -
2.1
6
98
.57
- -
1.4
3
Oth
er
De
tail
s
Exit
Load
Wit
hin
1 Y
ear
- 1
%O
n o
r Befo
re 3
0days -
0
.10
%(w
.e.f
15
/0
1/2
01
9)
Wit
hin
15
Days -
0.5
0%
Wit
hin
15
Days -
0.5
0%
Wit
hin
1 Y
ear
- 1
%For
exit
wit
hin
15
days f
rom
the d
ate
of
allotm
ent
- 0
.20
%For
exit
on o
r aft
er
15
days
from
the d
ate
of
allotm
ent
-N
il
Snap
shot
of
Eq
uit
y F
und
s &
Oth
er
Cate
gori
es
SBI
Consum
pti
on
Op
port
unit
ies F
und
(Pre
vio
usly
know
n a
s S
BI
FM
CG
Fund)
SBI
Technolo
gy
Op
port
unit
ies F
und
(Pre
vio
usly
know
n a
s S
BI
IT F
und)
SBI
Eq
uit
y M
inim
um
Vari
ance F
und
Nif
ty India
Consum
pti
on
(w.e
.f.
16
May,2
01
8)
S&
P B
SE T
eck
(w.e
.f M
ay 1
6,2
01
8)
Nif
ty 5
0 Index
Month
End
AU
M (
Rs. in
Cro
res)
`522.4
2 C
rore
s`7
05
.84
Cro
res
`1
50
.40
Cro
res
`4
7.3
5 C
rore
s`3
04
.96
Cro
res
`4
36
.64
Cro
res
Port
folio T
urn
over
0.6
30
.36
0.2
40
.15
-0
.69
Exp
ense R
ati
oRegula
r- 2
.55
%D
irect-
1.9
9%
Regula
r- 2
.51
%D
irect-
1.5
0%
Regula
r- 2
.73
%D
irect-
1.8
3%
Regula
r- 0
.74
%D
irect-
0.3
4%
Regula
r- 0
.52
%,
Dir
ect-
0.1
2%
Regula
r- 0
.66
%,
Dir
ect-
0.2
6%
Sta
nd
ard
Devia
tion
Beta
#
#
#Sharp
e R
ati
o
16
.40
%
0.8
7
0.3
4
15
.19
%
0.8
4
0.5
3
13
.23
%
0.8
0
0.4
6
- - -
- - -
10

11
EQUITY-LARGE CAP
Option NAV ( )`
Reg-Plan-Dividend 23.2073
Reg-Plan-Growth 40.7942
Dir-Plan-Dividend 28.0511
Dir-Plan-Growth 43.2082
NET ASSET VALUE
Record Date Dividend NAV ( )`(in /Unit)`
23-Sep-16 (Reg Plan) 1.00 18.5964
23-Sep-16 (Dir Plan) 1.20 21.8569
17-Jul-15 (Reg Plan) 2.50 17.6880
17-Jul-15 (Dir Plan) 2.90 20.5395
21- Mar-14 (Reg Plan) 1.80 12.7618
LAST DIVIDENDS
Investors understand that their principal
will be at Moderately High risk
�
�
Long term capital appreciation.
Investment in equity and equity-related instruments of large cap companies.
SBI Blue Chip FundThis product is suitable for investors who are seeking^:
Face value: 10`
Investment Objective
Quantitative Data
To provide investors with opportunities
for long-term growth in capital through
an active management of investments in a
diversified basket of large cap equity
stocks (as specified by SEBI/AMFI from
time to time).
Fund Details
Standard Deviation :
Beta :
Sharpe Ratio :
Portfolio Turnover* :
#
#
#
12.22%
0.91
0.43
0.77#S o u r c e : C R I S I L F u n d A n a l y s e r
*Portfolio Turnover = lower of total sale or totalpurchase for the last 12 months upon Avg. AUMof trailing twelve months.
Risk Free rate: FBIL Overnight Mibor rate (6.00%as on 31st May 2019) Basis for Ratio Calculation:3 Years Monthly Data Points
Ratios are computed using Total Return Index(TRI) as per SEBI Circular dated Jan 4, 2018
PORTFOLIO CLASSIFICATION BY
(%)ASSET ALLOCATION
Financial Services 38.73
Consumer Goods 8.79
Energy 8.05
Automobile 6.83
Construction 5.83
IT 5.37
Fertilisers & Pesticides 4.07
Industrial Manufacturing 3.95
Cement & Cement Products 3.64
Pharma 3.46
Services 1.84
Metals 1.77
Chemicals 0.37
Others 7.30
•
•
•
•
•
•
•
•
•
•
•
•
•
•
Type of Scheme
Date of Allotment:
Report As On:
AAUM for the Month of May 2019
AUM as on May 31, 2019
Fund Manager: Ms. Sohini Andani
Managing Since:
Total Experience:
Benchmark:
Exit Load:
Entry Load:
Plans Available:
Options:
SIP
-
Minimum Investment
Additional Investment
An open-ended Equity Scheme
predominantly investing in large cap stocks.
14/02/2006
22,012.47 Crores
22,741.37 Crores
Sep-2010
Over 23 years
S&P BSE 100 Index
For exit within 1 year from the date of
allotment - 1 %; For exit after 1 year from
the date of allotment - Nil
N.A.
Regular, Direct
Growth, Dividend
Any Day SIP’ Facility is available for
Monthly, Quarterly, Semi-Annual and Annual
frequencies through electronic mode like
OTM / Debit Mandate. Default SIP date will
be 10th. In case the SIP due date is a Non
Business Day, then the immediate following
Business Day will be considered for SIP
processing.
Weekly - Minimum 1000 & in multiples of
1 thereafter for a minimum of 6 instalments.
Monthly - Minimum 1000 & in multiples of
1 thereafter for minimum six months (or)
minimum 500 & in multiples of 1
thereafter for minimum one year.
Quarterly - Minimum 1500 & in multiples
of 1 thereafter for minimum one year.
Semi Annual - Minimum 3000 & in
multiples of 1 thereafter for a minimum of
4 installments.
Annual - Minimum 5000 & in multiples of
1 thereafter for a minimum of 4
installments.
5000 & in multiples of 1
1000 & in multiples of 1
31/05/2019
`
`
` `
`
`
` `
`
`
`
`
`
`
` `
` `
PORTFOLIO CLASSIFICATION BY
INDUSTRY ALLOCATION (%)
PORTFOLIO
Equity Shares
HDFC Bank Ltd. 9.66
Larsen & Toubro Ltd. 5.52
ICICI Bank Ltd. 5.13
ITC Ltd. 4.58
HDFC Ltd. 4.55
State Bank Of India 4.33
Nestle India Ltd. 3.21
Infosys Ltd. 3.17
Kotak Mahindra Bank Ltd. 2.95
Axis Bank Ltd. 2.89
UPL Ltd. 2.88
Reliance Industries Ltd. 2.77
ICICI Prudential Life Insurance Company Ltd. 2.48
Shree Cement Ltd. 2.30
Mahindra & Mahindra Ltd. 2.29
HCL Technologies Ltd. 2.20
Divi's Laboratories Ltd. 2.03
Cholamandalam Investment And FinanceCompany Ltd. 2.02
InterGlobe Aviation Ltd. 1.84
Hindustan Petroleum Corporation Ltd. 1.81
HDFC Life Insurance Company Ltd. 1.72
Motherson Sumi Systems Ltd. 1.56
Cummins India Ltd. 1.53
Hero Motocorp Ltd. 1.45
Stock Name (%) Of Total AUM Stock Name (%) Of Total AUM
NTPC Ltd. 1.38
Hindalco Industries Ltd. 1.35
Ultratech Cement Ltd. 1.34
Indian Oil Corporation Ltd. 1.28
Bharat Electronics Ltd. 1.26
PI Industries Ltd. 1.20
Mahindra & Mahindra Financial Services Ltd. 1.09
Bajaj Auto Ltd. 1.08
Aurobindo Pharma Ltd. 1.04
Shriram Transport Finance Company Ltd. 0.90
Bharat Petroleum Corporation Ltd. 0.81
Bajaj Finserv Ltd. 0.72
Britannia Industries Ltd. 0.62
Maruti Suzuki India Ltd. 0.45
Schaeffler India Ltd. 0.45
Thermax Ltd. 0.44
Coal India Ltd. 0.42
Strides Pharma Science Ltd. 0.38
Voltas Ltd. 0.38
Pidilite Industries Ltd. 0.37
Shriram City Union Finance Ltd. 0.32
Sadbhav Engineering Ltd. 0.31
SKF India Ltd. 0.27
Total 92.70
Cash, Cash Equivalents And Others 7.30
Grand Total 100.00
Pursuant to payment of dividend, the NAV of Dividend Option ofscheme/plans would fall to the extent of payout and statutory levy, ifapplicable.
^Investors should consult their financial advisers if in doubt about whether the product is suitablefor them.
Cash, Cash Equivalents and Others
Large Cap Midcap Smallcap
82.16
9.85
0.697.30

12
EQUITY- THEMATICFUND
Option NAV ( )`
Reg-Plan-Dividend 33.9879
Reg-Plan-Growth 108.6796
Dir-Plan-Dividend 40.9579
Dir-Plan-Growth 114.1010
NET ASSET VALUE
Record Date Dividend NAV ( )`(in /Unit)`
16-Mar-18 (Reg Plan) 3.40 29.0857
16-Mar-18 (Dir Plan) 4.00 34.6356
30-May-17 (Reg Plan) 2.00 30.8936
(Dir Plan) 2.50 36.502730-May-17
29-Apr-16 (Reg Plan) 4.50 27.4893
29-Apr-16 (Dir Plan) 5.00 32.3240
24-Apr-15 (Reg Plan) 6.00 31.7479
24-Apr-15 (Dir Plan) 7.00 36.7592
LAST DIVIDENDS
Investors understand that their principal
will be at High risk
�
�
Long term capital appreciation.
Investments in companies following the ESG theme.
SBI Magnum Equity ESG FundThis product is suitable for investors who are seeking^:
Face value: 10`
Investment Objective
Quantitative Data
To provide investors with opportunities
for long-term growth in capital through
an active management of investments in a
diversified basket of companies following
Environmental, Social and Governance
(ESG) criteria.
Fund Details
Standard Deviation :
Beta :
Sharpe Ratio :
Portfolio Turnover* :
#
#
#
12.17%
0.88
0.54
0.72#S o u r c e : C R I S I L F u n d A n a l y s e r
*Portfolio Turnover = lower of total sale or totalpurchase for the last 12 months upon Avg. AUMof trailing twelve months.
Risk Free rate: FBIL Overnight Mibor rate (6.00%as on 31st May 2019) Basis for Ratio Calculation:3 Years Monthly Data Points
Ratios are computed using Total Return Index(TRI) as per SEBI Circular dated Jan 4, 2018
PORTFOLIO CLASSIFICATION BY
(%)ASSET ALLOCATION
Financial Services 40.73
Consumer Goods 11.25
IT 11.13
Energy 10.39
Construction 5.21
Automobile 4.64
Pharma 3.20
Telecom 2.34
Cement & Cement Products 2.33
Industrial Manufacturing 2.31
Metals 2.07
Services 2.03
Others 2.37
Pursuant to payment of dividend, the NAV of Dividend Option ofscheme/plans would fall to the extent of payout and statutory levy, ifapplicable.
•
•
•
•
•
•
•
•
•
•
•
•
•
•
•
Type of Scheme
Date of Allotment:
Report As On:
AAUM for the May 2019
AUM as on May 31, 2019
Fund Manager: Mr. Ruchit Mehta
Managing Since:
Total Experience:
Benchmark:
Exit Load:
Entry Load:
Plans Available:
Options:
SIP
-
Minimum Investment
Additional Investment
An open-ended Equity Scheme investing in
companies following the ESG theme.
01/01/1991
31/05/2019
2,297.84 Crores
2,388.53 Crores
(w.e.f May 2018)
May-2018
Over 14 years
Nifty 100 ESG Index
(w.e.f May 16,2018)
For exit within 1 year from the date of
allotment - 1 %;
For exit after 1 year from the date of
allotment - Nil
N.A.
Regular, Direct
Growth, Dividend
Any Day SIP’ Facility is available for
Monthly, Quarterly, Semi-Annual and Annual
frequencies through electronic mode like
OTM / Debit Mandate. Default SIP date will
be 10th. In case the SIP due date is a Non
Business Day, then the immediate following
Business Day will be considered for SIP
processing.
Weekly - Minimum 1000 & in multiples of
1 thereafter for a minimum of 6 instalments.
Monthly - Minimum 1000 & in multiples of
1 thereafter for minimum six months (or)
minimum 500 & in multiples of 1
thereafter for minimum one year.
Quarterly - Minimum 1500 & in multiples
of 1 thereafter for minimum one year.
Semi Annual - Minimum 3000 & in
multiples of 1 thereafter for a minimum of
4 installments.
Annual - Minimum 5000 & in multiples of
1 thereafter for a minimum of 4
installments.
1000 & in multiples of 1
1000 & in multiples of 1
Month of
`
`
` `
`
`
` `
`
`
`
`
`
`
` `
` `
PORTFOLIO CLASSIFICATION BY
INDUSTRY ALLOCATION (%)
PORTFOLIO
Equity Shares
HDFC Bank Ltd. 9.74
Reliance Industries Ltd. 8.90
Kotak Mahindra Bank Ltd. 5.48
Bajaj Finance Ltd. 5.37
ICICI Bank Ltd. 5.32
Larsen & Toubro Ltd. 5.21
Axis Bank Ltd. 5.07
Tata Consultancy Services Ltd. 5.05
Infosys Ltd. 5.00
State Bank Of India 4.42
HDFC Ltd. 3.10
Asian Paints Ltd. 2.83
Mahindra & Mahindra Ltd. 2.44
Aurobindo Pharma Ltd. 2.39
Bharti Airtel Ltd. 2.34
ACC Ltd. 2.33
Cummins India Ltd. 2.31
Titan Company Ltd. 2.30
Stock Name (%) Of Total AUM Stock Name (%) Of Total AUM
InterGlobe Aviation Ltd. 2.03
Britannia Industries Ltd. 1.96
Colgate Palmolive (India) Ltd. 1.40
Glaxosmithkline Consumer Healthcare Ltd. 1.24
Hindalco Industries Ltd. 1.15
Bajaj Finserv Ltd. 1.13
Hero Motocorp Ltd. 1.12
ICICI Prudential Life Insurance Company Ltd. 1.10
Tata Motors Ltd. 1.08
HCL Technologies Ltd. 1.07
Bharat Petroleum Corporation Ltd. 1.03
Marico Ltd. 0.93
Tata Steel Ltd. 0.92
Alkem Laboratories Ltd. 0.81
Hindustan Unilever Ltd. 0.60
Petronet LNG Ltd. 0.46
Total 97.63
Cash, Cash Equivalents And Others 2.37
Grand Total 100.00
^Investors should consult their financial advisers if in doubt about whether the product is suitablefor them.
(Previously known as SBI Magnum Equity Fund)
MidcapCash, Cash Equivalents and Others Large Cap
92.18
5.45 2.37

13
EQUITY-MULTI CAP FUND
Option NAV ( )`
Reg-Plan-Dividend 22.6680
Reg-Plan-Growth 50.6336
Dir-Plan-Dividend 26.7444
Dir-Plan-Growth 53.5085
NET ASSET VALUE
Record Date Dividend NAV ( )`(in /Unit)`
09-Mar-18 (Reg Plan) 1.90 20.5230
09-Mar-18 (Dir Plan) 2.20 23.9106
29-Dec-17 ( Plan) 2.90 27.6830
29-Dec-17 (Reg Plan) 2.50 23.8257
Dir
30-Dec-16 (Reg Plan) 1.90 19.2173
30-Dec-16 (Dir Plan) 2.20 22.0670
20-Nov-15 (Reg Plan) 2.90 19.2712
20-Nov-15 (Dir Plan) 3.20 21.8941
LAST DIVIDENDS
Investors understand that their principal
will be at Moderately High risk
�
�
Long term capital appreciation.
Investments in a diversified basket of equity stocks spanning the entire market capitalizationspectrum to provide both long-term growth opportunities and liquidity
SBI Magnum Multicap FundThis product is suitable for investors who are seeking^:
Face value: 10`
Investment Objective
Quantitative Data
To provide investors with opportunitiesfor long-term growth in capital alongwith the liquidity of an open-endedscheme through an active managementof investments in a diversified basket ofequity stocks spanning the entire marketcapitalization spectrum and in debt andmoney market instruments.
Fund Details
Standard Deviation :Beta :Sharpe Ratio :Portfolio Turnover* :
#
#
#
12.65%0.910.620.60
#S o u r c e : C R I S I L F u n d A n a l y s e r
*Portfolio Turnover = lower of total sale or total
purchase for the last 12 months upon Avg. AUM
of trailing twelve months.Risk Free rate: FBIL Overnight Mibor rate
Basis for Ratio Calculation:
3 Years Monthly Data PointsRatios are computed using Total Return Index
(TRI) as per SEBI Circular dated Jan 4, 2018
(6.00%
as on 31st May 2019)
PORTFOLIO CLASSIFICATION BY
(%)ASSET ALLOCATION
Financial Services 32.20
Consumer Goods 11.37
Energy 9.48
IT 8.71
Automobile 6.60
Construction 6.07
Cement & Cement Products 4.83
Industrial Manufacturing 3.72
Services 3.61
Chemicals 2.84
Pharma 2.80
Telecom 1.93
Metals 1.00
Fertilisers & Pesticides 0.79
Media And Entertainment 0.62
Others 3.42
Pursuant to payment of dividend, the NAV of Dividend Option ofscheme/plans would fall to the extent of payout and statutory levy, ifapplicable.
•
•
•
•
•
•
•
•
•
•
•
•
•
•
Type of Scheme
Date of Allotment:
Report As On:
AAUM for the May 2019
AUM as on May 31, 2019
Fund Manager: Mr. Anup Upadhyay
Managing Since:
otal Experience:
Benchmark:
Exit Load:
Entry Load:
Plans Available:
Options;
SIP
-
Minimum Investment
Additional Investment
An open-ended Equity Scheme investing
across large cap, mid cap, small cap stocks.
29/09/2005
31/05/2019
7,238.40 Crores
7,581.40 Crores
Feb-2017
T Over 13 years
S&P BSE 500 Index
(w.e.f January 15, 2019)
For exit on or before 30 days from the date
of allotment - 0.10%
For exit after 30 days from the date of
allotment- Nil
N.A.
Regular, Direct
Growth, Dividend
Any Day SIP’ Facility is available for
Monthly, Quarterly, Semi-Annual and Annual
frequencies through electronic mode like
OTM / Debit Mandate. Default SIP date will
be 10th. In case the SIP due date is a Non
Business Day, then the immediate following
Business Day will be considered for SIP
processing.
Weekly - Minimum 1000 & in multiples of
1 thereafter for a minimum of 6 instalments.
Monthly - Minimum 1000 & in multiples of
1 thereafter for minimum six months (or)
minimum 500 & in multiples of 1
thereafter for minimum one year.
Quarterly - Minimum 1500 & in multiples
of 1 thereafter for minimum one year.
Semi Annual - Minimum 3000 & in
multiples of 1 thereafter for a minimum of
4 installments.
Annual - Minimum 5000 & in multiples of
1 thereafter for a minimum of 4
installments.
1000 & in multiples of 1
1000 & in multiples of 1
Month of
`
`
` `
`
`
` `
`
`
`
`
` `
` `
` `
PORTFOLIO CLASSIFICATION BY
INDUSTRY ALLOCATION (%)
PORTFOLIO
Equity Shares
HDFC Bank Ltd. 8.59
Infosys Ltd. 6.51
ICICI Bank Ltd. 4.90
Kotak Mahindra Bank Ltd. 3.84
Larsen & Toubro Ltd. 3.16
Axis Bank Ltd. 2.90
Jk Cement Ltd. 2.82
Gujarat State Petronet Ltd. 2.80
State Bank Of India 2.68
ITC Ltd. 2.39
Bajaj Finance Ltd. 2.25
AU Small Finance Bank Ltd. 2.09
Star Cement Ltd. 2.01
Bharti Airtel Ltd. 1.93
Colgate Palmolive (India) Ltd. 1.89
InterGlobe Aviation Ltd. 1.85
The Indian Hotels Company Ltd. 1.76
Cummins India Ltd. 1.72
Asian Paints Ltd. 1.70
ICICI Prudential Life Insurance Company Ltd. 1.59
Bharat Petroleum Corporation Ltd. 1.57
Exide Industries Ltd. 1.57
Oil & Natural Gas Corporation Ltd. 1.55
Tata Power Company Ltd. 1.54
Maruti Suzuki India Ltd. 1.53
Mahindra & Mahindra Ltd. 1.47
Aavas Financiers Ltd. 1.45
Aurobindo Pharma Ltd. 1.41
Fine Organic Industries Ltd. 1.36
Crompton Greaves Consumer Electricals Ltd. 1.22
Kalpataru Power Transmission Ltd. 1.21
Stock Name (%) Of Total AUM Stock Name (%) Of Total AUM
Marico Ltd. 1.21
ABB India Ltd. 1.16
Sheela Foam Ltd. 1.12
HDFC Asset Management Company Ltd. 1.11
Kajaria Ceramics Ltd. 1.04
HCL Technologies Ltd. 1.03
Sobha Ltd. 1.01
Hindalco Industries Ltd. 1.00
Blue Star Ltd. 0.91
Ashoka Buildcon Ltd. 0.86
Balkrishna Industries Ltd. 0.86
Torrent Pharmaceuticals Ltd. 0.85
Schaeffler India Ltd. 0.84
Deepak Nitrite Ltd. 0.84
Chennai Petroleum Corporation Ltd. 0.80
Indian Energy Exchange Ltd. 0.79
UPL Ltd. 0.79
Emami Ltd. 0.78
Camlin Fine Sciences Ltd. 0.65
UFO Moviez India Ltd. 0.62
Minda Corporation Ltd. 0.62
Eicher Motors Ltd. 0.56
Strides Pharma Science Ltd. 0.47
Prataap Snacks Ltd. 0.15
Solara Active Pharma Sciences Ltd. 0.08
Cognizant Technology Solutions Corporation 1.16
Total 95.42
Foreign Equity
Total 1.16
Cash, Cash Equivalents And Others 3.42
Grand Total 100.00
^Investors should consult their financial advisers if in doubt about whether the product is suitablefor them.
Large Cap Midcap
Cash, Cash Equivalents and Others Smallcap
60.58
17.19
18.81
3.42
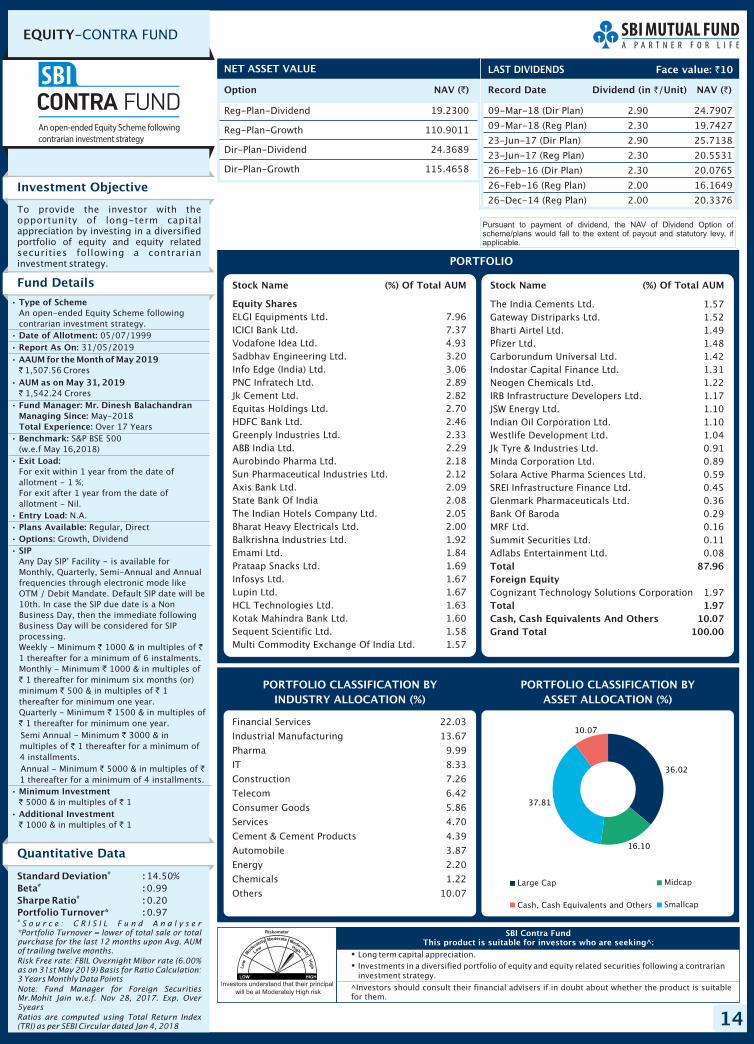
14
EQUITY-CONTRA FUND
Option NAV ( )`
Reg-Plan-Dividend 19.2300
Reg-Plan-Growth 110.9011
Dir-Plan-Dividend 24.3689
Dir-Plan-Growth 115.4658
NET ASSET VALUE
Investors understand that their principal
will be at Moderately High risk
�
�
Long term capital appreciation.
Investments in a diversified portfolio of equity and equity related securities following a contrarianinvestment strategy.
SBI Contra FundThis product is suitable for investors who are seeking^:
Investment Objective
Quantitative Data
To provide the investor with theopportunity of long-term capitalappreciation by investing in a diversifiedportfolio of equity and equity relatedsecurities following a contrarianinvestment strategy.
Standard Deviation :
Beta :
Sharpe Ratio :
Portfolio Turnover* :
#
#
#
14.50%
0.99
0.20
0.97#S o u r c e : C R I S I L F u n d A n a l y s e r
*Portfolio Turnover = lower of total sale or totalpurchase for the last 12 months upon Avg. AUMof trailing twelve months.
Risk Free rate: FBIL Overnight Mibor rate (6.00%as on 31st May 2019) Basis for Ratio Calculation:3 Years Monthly Data Points
Note: Fund Manager for Foreign SecuritiesMr.Mohit Jain w.e.f. Nov 28, 2017. Exp. Over5years
Ratios are computed using Total Return Index(TRI) as per SEBI Circular dated Jan 4, 2018
PORTFOLIO CLASSIFICATION BY
(%)ASSET ALLOCATION
Financial Services 22.03
Industrial Manufacturing 13.67
Pharma 9.99
IT 8.33
Construction 7.26
Telecom 6.42
Consumer Goods 5.86
Services 4.70
Cement & Cement Products 4.39
Automobile 3.87
Energy 2.20
Chemicals 1.22
Others 10.07
Fund Details
•
•
•
•
•
•
•
•
•
•
•
•
•
•
Type of Scheme
Date of Allotment:
Report As On:
AAUM for the
AUM as on
Fund Manager: Mr. Dinesh Balachandran
Managing Since:
Total Experience:
Benchmark:
Exit Load:
Entry Load:
Plans Available:
Options:
SIP
-
Minimum Investment
Additional Investment
An open-ended Equity Scheme following
contrarian investment strategy.
05/07/1999
1,507.56 Crores
1,542.24 Crores
May-2018
Over 17 Years
S&P BSE 500
(w.e.f May 16,2018)
For exit within 1 year from the date of
allotment - 1 %;
For exit after 1 year from the date of
allotment - Nil.
N.A.
Regular, Direct
Growth, Dividend
Any Day SIP’ Facility is available for
Monthly, Quarterly, Semi-Annual and Annual
frequencies through electronic mode like
OTM / Debit Mandate. Default SIP date will be
10th. In case the SIP due date is a Non
Business Day, then the immediate following
Business Day will be considered for SIP
processing.
Weekly - Minimum 1000 & in multiples of
1 thereafter for a minimum of 6 instalments.
Monthly - Minimum 1000 & in multiples of
1 thereafter for minimum six months (or)
minimum 500 & in multiples of 1
thereafter for minimum one year.
Quarterly - Minimum 1500 & in multiples of
1 thereafter for minimum one year.
Semi Annual - Minimum 3000 & in
multiples of 1 thereafter for a minimum of
4 installments.
Annual - Minimum 5000 & in multiples of
1 thereafter for a minimum of 4 installments.
5000 & in multiples of 1
1000 & in multiples of 1
31/05/2019
Month of May 2019
May 31, 2019
`
`
` `
`
`
` `
`
`
`
`
` `
` `
` `
PORTFOLIO CLASSIFICATION BY
INDUSTRY ALLOCATION (%)
PORTFOLIO
Equity Shares
ELGI Equipments Ltd. 7.96
ICICI Bank Ltd. 7.37
Vodafone Idea Ltd. 4.93
Sadbhav Engineering Ltd. 3.20
Info Edge (India) Ltd. 3.06
PNC Infratech Ltd. 2.89
Jk Cement Ltd. 2.82
Equitas Holdings Ltd. 2.70
HDFC Bank Ltd. 2.46
Greenply Industries Ltd. 2.33
ABB India Ltd. 2.29
Aurobindo Pharma Ltd. 2.18
Sun Pharmaceutical Industries Ltd. 2.12
Axis Bank Ltd. 2.09
State Bank Of India 2.08
The Indian Hotels Company Ltd. 2.05
Bharat Heavy Electricals Ltd. 2.00
Balkrishna Industries Ltd. 1.92
Emami Ltd. 1.84
Prataap Snacks Ltd. 1.69
Infosys Ltd. 1.67
Lupin Ltd. 1.67
HCL Technologies Ltd. 1.63
Kotak Mahindra Bank Ltd. 1.60
Sequent Scientific Ltd. 1.58
Multi Commodity Exchange Of India Ltd. 1.57
Stock Name (%) Of Total AUM Stock Name (%) Of Total AUM
The India Cements Ltd. 1.57
Gateway Distriparks Ltd. 1.52
Bharti Airtel Ltd. 1.49
Pfizer Ltd. 1.48
Carborundum Universal Ltd. 1.42
Indostar Capital Finance Ltd. 1.31
Neogen Chemicals Ltd. 1.22
IRB Infrastructure Developers Ltd. 1.17
JSW Energy Ltd. 1.10
Indian Oil Corporation Ltd. 1.10
Westlife Development Ltd. 1.04
Jk Tyre & Industries Ltd. 0.91
Minda Corporation Ltd. 0.89
Solara Active Pharma Sciences Ltd. 0.59
SREI Infrastructure Finance Ltd. 0.45
Glenmark Pharmaceuticals Ltd. 0.36
Bank Of Baroda 0.29
MRF Ltd. 0.16
Summit Securities Ltd. 0.11
Adlabs Entertainment Ltd. 0.08
Cognizant Technology Solutions Corporation 1.97
Total 87.96
Foreign Equity
Total 1.97
Cash, Cash Equivalents And Others 10.07
Grand Total 100.00
^Investors should consult their financial advisers if in doubt about whether the product is suitablefor them.
Record Date Dividend NAV ( )`(in /Unit)`
09-Mar-18 (Dir Plan) 2.90 24.7907
09-Mar-18 (Reg Plan) 2.30 19.7427
26-Feb-16 (Dir Plan) 2.30 20.0765
26-Feb-16 (Reg Plan) 2.00 16.1649
26-Dec-14 (Reg Plan) 2.00 20.3376
23-Jun-17 (Dir Plan) 2.90 25.7138
23-Jun-17 (Reg Plan) 2.30 20.5531
LAST DIVIDENDS Face value: 10`
Pursuant to payment of dividend, the NAV of Dividend Option ofscheme/plans would fall to the extent of payout and statutory levy, ifapplicable.
Large Cap Midcap
Cash, Cash Equivalents and Others Smallcap
36.02
16.10
37.81
10.07

15
EQUITY-LARGE & MID CAPFUND
Option NAV ( )`
Reg-Plan-Dividend 101.8901
Reg-Plan-Growth 225.5519
Dir-Plan-Dividend 121.4684
Dir-Plan-Growth 233.0608
NET ASSET VALUE
Record Date Dividend NAV ( )`(in /Unit)`
09-Mar-18 (Reg-plan) 11.00 94.1106
09-Mar-18 (Dir-plan) 13.00 111.1062
27-Feb-17 (Reg-plan) 7.80 89.6546
27-Feb-17 (Dir-plan) 9.20 105.2064
12-Sep-14 (Reg-plan) 11.50 74.9641
12-Oct-09 (Reg-plan) 7.00 57.91
LAST DIVIDENDS
Investors understand that their principal
will be at Moderately High risk
�
�
Long term capital appreciation.
Investments in a diversified portfolio of large and midcap companies.
SBI Large & Midcap FundThis product is suitable for investors who are seeking^:
Face value: 10`
Investment Objective
Quantitative Data
To provide the investor with theopportunity of long-term capitalappreciation by investing in diversifiedportfolio comprising predominantly largecap and mid cap companies.
Fund Details
Standard Deviation :
Beta :
Sharpe Ratio :
Portfolio Turnover* :
#
#
#
12.92%
0.86
0.51
0.78#S o u r c e : C R I S I L F u n d A n a l y s e r
*Portfolio Turnover = lower of total sale or totalpurchase for the last 12 months upon Avg. AUMof trailing twelve months.
Risk Free rate: FBIL Overnight Mibor rate (6.00%as on 31st May 2019) Basis for Ratio Calculation:3 Years Monthly Data Points
Ratios are computed using Total Return Index(TRI) as per SEBI Circular dated Jan 4, 2018
PORTFOLIO CLASSIFICATION BY
(%)ASSET ALLOCATION
Financial Services 29.88
Consumer Goods 11.78
Cement & Cement Products 8.32
Energy 8.01
Industrial Manufacturing 7.66
Pharma 6.29
IT 5.75
Construction 5.42
Services 4.93
Telecom 3.86
Automobile 3.41
Fertilisers & Pesticides 2.26
Others 2.42
Pursuant to payment of dividend, the NAV of Dividend Option ofscheme/plans would fall to the extent of payout and statutory levy, ifapplicable.
•
•
•
•
•
•
•
•
•
•
•
•
•
•
Type of Scheme
Date of Allotment:
Report As On:
AAUM for the May 2019
AUM as on May 31, 2019
Fund Manager: Mr. Saurabh Pant
Managing Since:
Total Experience
Benchmark:
Exit Load:
Entry Load:
Plans Available:
Options:
SIP
-
Minimum Investment
Additional Investment
An open-ended Equity Scheme investing in
both large cap and mid cap stocks.
28/02/1993
31/05/2019
2,528.61 Crores
2,614.29 Crores
Sep-2016
Over 11 years
For exit on or before 30 days from the date
of allotment - 0.10%
For exit after 30 days from the date of
allotment- Nil
N.A.
Regular, Direct
Growth, Dividend
Any Day SIP’ Facility is available for
Monthly, Quarterly, Semi-Annual and Annual
frequencies through electronic mode like
OTM / Debit Mandate. Default SIP date will
be 10th. In case the SIP due date is a Non
Business Day, then the immediate following
Business Day will be considered for SIP
processing.
Weekly - Minimum 1000 & in multiples of
1 thereafter for a minimum of 6
instalments.
Monthly - Minimum 1000 & in multiples of
1 thereafter for minimum six months (or)
minimum 500 & in multiples of 1
thereafter for minimum one year.
Quarterly - Minimum 1500 & in multiples
of 1 thereafter for minimum one year.
5000 & in multiples of 1
1000 & in multiples of 1
Month of
`
`
`
`
`
`
` `
`
`
Semi Annual - Minimum ` 3000 & in
multiples of ` 1 thereafter for a minimum
of 4 installments.
Annual - Minimum ` 5000 & in multiples of
` 1 thereafter for a minimum of 4
installments.
` `
` `
NIFTY LargeMidCap 250
(w.e.f February 25,2019)
PORTFOLIO CLASSIFICATION BY
INDUSTRY ALLOCATION (%)
PORTFOLIO
Equity Shares
HDFC Bank Ltd. 6.49
ICICI Bank Ltd. 5.67
State Bank Of India 4.72
Axis Bank Ltd. 4.64
The Indian Hotels Company Ltd. 3.91
Larsen & Toubro Ltd. 3.87
Thermax Ltd. 2.93
Infosys Ltd. 2.82
JK Cement Ltd. 2.81
Tata Power Company Ltd. 2.63
Jubilant Foodworks Ltd. 2.46
Exide Industries Ltd. 2.44
Sheela Foam Ltd. 2.39
PI Industries Ltd. 2.26
Muthoot Finance Ltd. 2.24
Relaxo Footwears Ltd. 2.10
AU Small Finance Bank Ltd. 2.08
Vodafone Idea Ltd. 1.96
ACC Ltd. 1.93
Bharti Airtel Ltd. 1.90
Gujarat State Petronet Ltd. 1.85
Divi's Laboratories Ltd. 1.83
Ultratech Cement Ltd. 1.82
ABB India Ltd. 1.80
Tata Consultancy Services Ltd. 1.68
HDFC Ltd. 1.67
Ahluwalia Contracts (India) Ltd. 1.55
Stock Name (%) Of Total AUM Stock Name (%) Of Total AUM
Crompton Greaves Consumer Electricals Ltd. 1.53
Torrent Pharmaceuticals Ltd. 1.50
Prataap Snacks Ltd. 1.38
JSW Energy Ltd. 1.31
Cummins India Ltd. 1.30
ICICI Prudential Life Insurance Company Ltd. 1.29
Reliance Industries Ltd. 1.27
Tech Mahindra Ltd. 1.25
Kirloskar Oil Engines Ltd. 1.17
Cholamandalam Financial Holdings Ltd. 1.07
ITC Ltd. 1.07
Lemon Tree Hotels Ltd. 1.03
Dr. Reddy's Laboratories Ltd. 1.02
Lupin Ltd. 1.00
Tata Motors Ltd. 0.96
Petronet LNG Ltd. 0.94
Prism Johnson Ltd. 0.93
Shree Cement Ltd. 0.83
Sanofi India Ltd. 0.50
Colgate Palmolive (India) Ltd. 0.49
Triveni Turbine Ltd. 0.46
Strides Pharma Science Ltd. 0.45
Manpasand Beverages Ltd. 0.33
Hatsun Agro Product Ltd. 0.05
Total 97.58
Cash, Cash Equivalents And Others 2.42
Grand Total 100.00
(Previously known as SBI Magnum Multiplier Fund)
^Investors should consult their financial advisers if in doubt about whether the product is suitablefor them.
Large Cap Midcap
Cash, Cash Equivalents and Others Smallcap
49.20
35.88
12.502.42

16
EQUITY-FOCUSED FUND
Option NAV ( )`
Reg-Plan-Dividend 26.8224
Reg-Plan-Growth 146.6441
Dir-Plan-Dividend 37.8172
Dir-Plan-Growth 155.2056
NET ASSET VALUE
Record Date Dividend NAV ( )`(in /Unit)`
09-Mar-18 (Reg Plan) 2.70 23.7583
09-Mar-18 (Dir Plan) 3.70 33.0672
28-Apr-17 (Reg Plan) 2.20 22.1892
(Dir Plan) 3.00 30.590528-Apr-17
07-Apr-16 (Reg Plan) 2.00 20.1119
07-Apr-16 (Dir Plan) 2.50 27.4503
28-Nov-14 (Reg Plan) 2.70 21.2616
LAST DIVIDENDS
Investors understand that their principal
will be at Moderately High risk
�
�
Long term capital appreciation.
Investment in equity and equity related instruments with maximum 30 stocks across multicap space
SBI Focused Equity FundThis product is suitable for investors who are seeking^:
Face value: 10`
Investment Objective
Quantitative Data
To provide the investor with the
opportunity of long-term capital
appreciat ion by invest ing in a
concentrated portfolio of equity and
equity related securities.
Fund Details
Standard Deviation :
Beta :
Sharpe Ratio :
Portfolio Turnover* :
#
#
#
13.68%
0.87
0.67
0.76#S o u r c e : C R I S I L F u n d A n a l y s e r
*Portfolio Turnover = lower of total sale or totalpurchase for the last 12 months upon Avg. AUMof trailing twelve months.
Risk Free rate: FBIL Overnight Mibor rate (6.00%as on 31st May 2019) Basis for Ratio Calculation:3 Years Monthly Data Points
Ratios are computed using Total Return Index(TRI) as per SEBI Circular dated Jan 4, 2018
PORTFOLIO CLASSIFICATION BY
(%)ASSET ALLOCATION
Financial Services 31.09
Consumer Goods 24.48
Industrial Manufacturing 6.25
Services 5.49
Chemicals 5.46
IT 3.88
Pharma 3.83
Telecom 3.38
Construction 2.88
Automobile 1.76
Others 11.50
Pursuant to payment of dividend, the NAV of Dividend Option ofscheme/plans would fall to the extent of payout and statutory levy, ifapplicable.
•
•
•
•
•
•
•
•
•
•
•
•
•
•
•
Type of Scheme
Date of Allotment:
Report As On:
AAUM for the May 2019
AUM as on May 31, 2019
Fund Manager: Mr. R. SrinivasanManaging Since:
Total Experience:
Benchmark:
Exit Load:
Entry Load:
Plans Available:
Options:
SIP-
Minimum Investment
Additional Investment
An open-ended Equity Scheme investing inmaximum 30 stocks across multicap space.
17/09/2004
31/05/2019
4,367.46 Crores
4,642.18 Crores
May-2009
Over 26 years
S&P BSE 500 Index
For exit within 1 year from the date ofallotment - 1 %;For exit after 1 year from the date ofallotment - Nil.
N.A.
Regular, Direct
Growth, Dividend
Any Day SIP’ Facility is available forMonthly, Quarterly, Semi-Annual and Annualfrequencies through electronic mode likeOTM / Debit Mandate. Default SIP date willbe 10th. In case the SIP due date is a NonBusiness Day, then the immediate followingBusiness Day will be considered for SIPprocessing.Weekly - Minimum 1000 & in multiples of1 thereafter for a minimum of 6 instalments.Monthly - Minimum 1000 & in multiples of
1 thereafter for minimum six months (or)minimum 500 & in multiples of 1thereafter for minimum one year.Quarterly - Minimum 1500 & in multiplesof 1 thereafter for minimum one year.Semi Annual - Minimum 3000 & inmultiples of 1 thereafter for a minimum of4 installments.Annual - Minimum 5000 & in multiples of
1 thereafter for a minimum of 4installments.
5000 & in multiples of 1
1000 & in multiples of 1
Month of`
`
` `
``
` `
``
``
``
` `
` `
PORTFOLIO CLASSIFICATION BY
INDUSTRY ALLOCATION (%)
PORTFOLIO
Equity Shares
HDFC Bank Ltd. 9.26
State Bank Of India 7.61
Procter & Gamble Hygiene And
Health Care Ltd. 6.90
Kotak Mahindra Bank Ltd. 5.48
Bajaj Finance Ltd. 4.11
Divi's Laboratories Ltd. 3.83
Hatsun Agro Product Ltd. 3.78
Relaxo Footwears Ltd. 3.64
InterGlobe Aviation Ltd. 3.62
Bharti Airtel Ltd. 3.38
Bajaj Finserv Ltd. 3.00
Blue Star Ltd. 2.96
Bharat Heavy Electricals Ltd. 2.95
Solar Industries India Ltd. 2.89
Techno Electric & Engineering Company Ltd. 2.88
Stock Name (%) Of Total AUM Stock Name (%) Of Total AUM
Fine Organic Industries Ltd. 2.57
Emami Ltd. 2.25
ELGI Equipments Ltd. 1.98
Sheela Foam Ltd. 1.89
The Great Eastern Shipping Company Ltd. 1.87
Tube Investments Of India Ltd. 1.76
Hawkins Cookers Ltd. 1.64
Indostar Capital Finance Ltd. 1.61
Dixon Technologies (India) Ltd. 1.42
Kirloskar Oil Engines Ltd. 1.31
Alphabet Inc. 3.88
Total 84.62
Foreign Equity
Total 3.88
Cash, Cash Equivalents And Others 11.50
Grand Total 100.00
(Previously known as SBI Emerging Businesses Fund)
^Investors should consult their financial advisers if in doubt about whether the product is suitablefor them.
Cash, Cash Equivalents and Others
Large Cap Midcap Smallcap
51.08
15.52
21.90
11.50

17
EQUITY-MID CAP FUND
Option NAV ( )`
Reg-Plan-Dividend 30.0409
Reg-Plan-Growth 73.5191
Dir-Plan-Dividend 44.2534
Dir-Plan-Growth 78.0553
NET ASSET VALUE
Record Date Dividend NAV ( )`(in /Unit)`
16-Mar-18 (Reg-Plan) 1.80 32.6595
16-Mar-18 (Dir-Plan) 2.60 47.5513
30-Jun-16 (Reg-Plan) 2.50 28.2445
30-Jun-16 (Dir-Plan) 3.50 40.3050
20-Mar-15 (Reg-Plan) 4.80 26.6619
20-Mar-15 (Dir-Plan) 6.80 37.4040
08-Aug-13 (Reg-Plan) 5.00 18.1066
LAST DIVIDENDS
Investors understand that their principal
will be at Moderately High risk
�
�
Long term capital appreciation.
Investments predominantly in a well diversified equity stocks of midcap companies.
SBI Magnum Midcap FundThis product is suitable for investors who are seeking^:
Face value: 10`
Investment Objective
Quantitative Data
To provide investors with opportunities
for long-term growth in capital along
with the liquidity of an open-ended
scheme by investing predominantly in a
well diversified basket of equity stocks of
Midcap companies.
Fund Details
Standard Deviation :
Beta :
Sharpe Ratio :
Portfolio Turnover* :
#
#
#
15.24%
0.83
-0.001
0.23#S o u r c e : C R I S I L F u n d A n a l y s e r
*Portfolio Turnover = lower of total sale or totalpurchase for the last 12 months upon Avg. AUMof trailing twelve months.Risk Free rate: FBIL Overnight Mibor rate (6.00%as on 31st May 2019) Basis for Ratio Calculation:3 Years Monthly Data PointsRatios are computed using Total Return Index(TRI) as per SEBI Circular dated Jan 4, 2018
PORTFOLIO CLASSIFICATION BY
(%)ASSET ALLOCATION
Financial Services 24.59
Industrial Manufacturing 15.53
Pharma 11.51
Consumer Goods 8.07
Construction 7.98
Cement & Cement Products 7.12
Fertilisers & Pesticides 6.91
Energy 4.25
IT 3.74
Automobile 2.30
Services 2.14
Metals 0.93
Chemicals 0.49
Others 4.45
Pursuant to payment of dividend, the NAV of Dividend Option ofscheme/plans would fall to the extent of payout and statutory levy, ifapplicable.
•
•
•
•
•
•
•
•
•
•
•
•
•
•
Type of Scheme
Date of Allotment:Report As On:AAUM for the May 2019
AUM as on May 31, 2019
Fund Manager: Ms. Sohini Andani
Managing Since:
Total Experience:Benchmark:
Exit Load:
Entry Load:Plans Available:Options:SIP
-
Minimum Investment
Additional Investment
An open-ended Equity Scheme
predominantly investing in mid cap stocks.29/03/2005
31/05/2019
3,564.87 Crores
3,666.68 Crores
July-2010
Over 23 yearsNifty Midcap 150
(w.e.f May 16,2018)For exit within 1 year from the
date of allotment - 1 %;
For exit after 1 year from the date of
allotment - NilN.A.
Regular, DirectGrowth, Dividend
Any Day SIP’ Facility is available for
Monthly, Quarterly, Semi-Annual and Annual
frequencies through electronic mode like
OTM / Debit Mandate. Default SIP date will
be 10th. In case the SIP due date is a Non
Business Day, then the immediate following
Business Day will be considered for SIP
processing.
Weekly - Minimum 1000 & in multiples of
1 thereafter for a minimum of 6
instalments.
Monthly - Minimum 1000 & in multiples of
1 thereafter for minimum six months (or)
minimum 500 & in multiples of 1
thereafter for minimum one year.
Quarterly - Minimum 1500 & in multiples
of 1 thereafter for minimum one year.Semi Annual - Minimum 3000 & in
multiples of 1 thereafter for a minimum of
4 installments.Annual - Minimum 5000 & in multiples of
1 thereafter for a minimum of 4
installments.
5000 & in multiples of 1
1000 & in multiples of 1
Month of
`
`
`
`
`
`
` `
`
``
`
`
`
` `
` `
PORTFOLIO CLASSIFICATION BY
INDUSTRY ALLOCATION (%)
PORTFOLIO
Equity Shares
Cholamandalam Investment AndFinance Company Ltd. 5.57
Sheela Foam Ltd. 5.31
Godrej Properties Ltd. 5.07
The Ramco Cements Ltd. 4.51
Carborundum Universal Ltd. 4.15
PI Industries Ltd. 4.06
PNB Housing Finance Ltd. 3.34
Gujarat State Petronet Ltd. 3.13
RBL Bank Ltd. 2.99
Mahindra & Mahindra Financial Services Ltd. 2.98
Schaeffler India Ltd. 2.85
Coromandel International Ltd. 2.85
Torrent Pharmaceuticals Ltd. 2.72
Thermax Ltd. 2.54
The Federal Bank Ltd. 2.47
Endurance Technologies Ltd. 2.30
Sanofi India Ltd. 2.16
The Indian Hotels Company Ltd. 2.14
Hexaware Technologies Ltd. 2.14
Shriram City Union Finance Ltd. 2.08
Divi's Laboratories Ltd. 2.06
Jk Cement Ltd. 2.05
Cummins India Ltd. 2.05
Dixon Technologies (India) Ltd. 2.00
Stock Name (%) Of Total AUM Stock Name (%) Of Total AUM
Housing And Urban Development Corporation Ltd. 1.88
AU Small Finance Bank Ltd. 1.76
SKF India Ltd. 1.68
Sadbhav Engineering Ltd. 1.61
Mindtree Ltd. 1.60
Strides Pharma Science Ltd. 1.54
Equitas Holdings Ltd. 1.48
NCC Ltd. 1.30
Eris Lifesciences Ltd. 1.29
Tata Power Company Ltd. 1.12
ABB India Ltd. 1.07
National Aluminium Company Ltd. 0.93
Solara Active Pharma Sciences Ltd. 0.91
Swaraj Engines Ltd. 0.60
NRB Bearings Ltd. 0.59
Mangalam Cement Ltd. 0.55
Sequent Scientific Ltd. 0.55
Clariant Chemicals (India) Ltd. 0.49
Voltas Ltd. 0.40
Manpasand Beverages Ltd. 0.36
Natco Pharma Ltd. 0.28
Summit Securities Ltd. 0.05
Total 95.55
Cash, Cash Equivalents And Others 4.45
Grand Total 100.00
^Investors should consult their financial advisers if in doubt about whether the product is suitablefor them.
Large Cap Midcap
Cash, Cash Equivalents and Others Smallcap
2.06
69.94
23.55
4.45

18
EQUITY-THEMATIC FUND
Option NAV ( )`
Reg-Plan-Dividend 51.3635
Reg-Plan-Growth 168.1338
Dir-Plan-Dividend 63.2671
Dir-Plan-Growth 177.2356
NET ASSET VALUE
Investors understand that their principal
will be at High risk
�
�
Long term capital appreciation.
Investments in equity stocks of MNC companies.
SBI Magnum Global FundThis product is suitable for investors who are seeking^:
Investment Objective
Quantitative Data
To provide the investor with the
opportunity of long-term capital
appreciation by investing in diversified
portfolio comprising primarily of MNC
companies.
Fund Details
Standard Deviation :
Beta :
Sharpe Ratio :
Portfolio Turnover* :
#
#
#
12.84%
0.64
0.20
0.46#S o u r c e : C R I S I L F u n d A n a l y s e r
*Portfolio Turnover = lower of total sale or totalpurchase for the last 12 months upon Avg. AUMof trailing twelve months.
Risk Free rate: FBIL Overnight Mibor rate (6.00%as on 31st May 2019) Basis for Ratio Calculation:3 Years Monthly Data Points
Ratios are computed using Total Return Index(TRI) as per SEBI Circular dated Jan 4, 2018
PORTFOLIO CLASSIFICATION BY
(%)ASSET ALLOCATION
Consumer Goods 33.94
Industrial Manufacturing 21.77
Pharma 11.06
Automobile 7.59
Cement & Cement Products 6.79
Chemicals 5.27
Services 4.15
Fertilisers & Pesticides 2.95
IT 1.49
Financial Services 0.09
Cash, Cash Equivalents And Others 4.90
•
•
•
•
•
•
•
•
•
•
•
•
•
•
Type of Scheme
Date of Allotment:
Report As On:
AAUM for the May 2019
AUM as on May 31, 2019
Fund Manager: Mr. Anup Upadhyay
Managing Since:
Total Experience:
Benchmark:
Exit Load:
Entry Load:
Plans Available:
Options:
SIP
Minimum Investment
Additional Investment
An open-ended Equity Scheme investing in
companies following the MNC theme.
30/09/1994
31/05/2019
3,512.44 Crores
3,586.69 Crores
(w.e.f May 5,2018)
May-2018
Over 13 years
Nifty MNC
(w.e.f May 16,2018)
For exit within 12 months from
the date of allotment - 1.00%;
For exit after 12 months from the date of
allotment - Nil
N.A.
Regular, Direct
Growth, Dividend
Any Day SIP’ Facility is available for Monthly,
Quarterly, Semi-Annual and Annual
frequencies through electronic mode like
OTM / Debit Mandate. Default SIP date will
be 10th. In case the SIP due date is a Non
Business Day, then the immediate following
Business Day will be considered for SIP
processing.
Weekly - Minimum 1000 & in multiples of
1 thereafter for a minimum of 6
instalments.
Monthly - Minimum 1000 & in multiples of
1 thereafter for minimum six months (or)
minimum 500 & in multiples of 1
thereafter for minimum one year.
Quarterly - Minimum 1500 & in multiples
of 1 thereafter for minimum one year.
Semi Annual - Minimum 3000 & in
multiples of 1 thereafter for a minimum of
4 installments.
Annual - Minimum 5000 & in multiples of
1 thereafter for a minimum of 4
installments.
5000 & in multiples of 1
1000 & in multiples of 1
Month of
`
`
`
`
`
`
` `
`
`
`
`
`
`
` `
` `
PORTFOLIO CLASSIFICATION BY
INDUSTRY ALLOCATION (%)
PORTFOLIO
Equity Shares
Colgate Palmolive (India) Ltd. 7.04
Divi's Laboratories Ltd. 6.04
Hindustan Unilever Ltd. 4.95
Ambuja Cements Ltd. 4.75
ABB India Ltd. 4.75
Nestle India Ltd. 4.48
Grindwell Norton Ltd. 4.46
Glaxosmithkline Consumer Healthcare Ltd. 4.12
Procter & Gamble Hygiene AndHealth Care Ltd. 4.07
Atul Ltd. 3.72
Maruti Suzuki India Ltd. 3.69
SKF India Ltd. 3.62
Britannia Industries Ltd. 3.57
Schaeffler India Ltd. 3.50
PI Industries Ltd. 2.95
Westlife Development Ltd. 2.76
Goodyear India Ltd. 2.72
ITC Ltd. 2.57
Stock Name (%) Of Total AUM Stock Name (%) Of Total AUM
Sanofi India Ltd. 2.42
ELGI Equipments Ltd. 2.09
GE Power India Ltd. 2.06
ACC Ltd. 2.04
Pfizer Ltd. 1.82
Dr. Reddy's Laboratories Ltd. 1.65
Dixon Technologies (India) Ltd. 1.57
Galaxy Surfactants Ltd. 1.55
Precision Camshafts Ltd. 1.18
United Breweries Ltd. 0.96
Blue Dart Express Ltd. 0.91
Oracle Financial Services Software Ltd. 0.81
Accelya Solutions India Limited 0.68
Greenply Industries Ltd. 0.60
Redington (India) Ltd. 0.48
Abbott India Ltd. 0.43
Sundaram Finance Holdings Ltd. 0.09
Total 95.10
Cash, Cash Equivalents And Others 4.90
Grand Total 100.00
^Investors should consult their financial advisers if in doubt about whether the product is suitablefor them.
Record Date Dividend NAV ( )`(in /Unit)`
29-Nov-17 (Reg Plan) 5.10 54.5060
29-Nov-17 (Dir Plan) 6.20 66.3252
25-Nov-16 (Reg Plan) 5.00 45.0759
25-Nov-16 (Dir Plan) 6.00 54.3465
30-Oct-15 (Reg Plan) 5.10 49.9803
30-Oct-15 (Dir Plan) 5.10 59.5549
LAST DIVIDENDS Face value: 10`
Pursuant to payment of dividend, the NAV of Dividend Option ofscheme/plans would fall to the extent of payout and statutory levy, ifapplicable.
Large Cap Midcap
Cash, Cash Equivalents and Others Smallcap
47.41
26.53
21.15
4.90

19
EQUITY-SMALL CAP FUND
Option NAV ( )`
Reg-Plan-Dividend 31.0918
Reg-Plan-Growth 52.6258
Dir-Plan-Dividend 38.5546
Dir-Plan-Growth 56.4804
NET ASSET VALUE
Record Date Dividend NAV ( )`(in /Unit)`
09-Mar-18 (Reg Plan) 9.10 33.3383
09-Mar-18 (Dir Plan) 11.10 40.7137
28-Aug-15 (Reg Plan) 3.60 23.5236
28-Aug-15 (Dir Plan) 4.30 27.8630
30-Jan-15 (Reg Plan) 4.00 26.0785
LAST DIVIDENDS
Investors understand that their principal
will be at Moderately High risk
�
�
Long term capital appreciation
Investment in equity and equity-related securities predominantly of small cap companies.
SBI Small Cap FundThis product is suitable for investors who are seeking^:
Face value: 10`
Investment Objective
Quantitative Data
To provide investors with opportunitiesfor long-term growth in capital alongwith the liquidity of an open-endedscheme by investing predominantly in awell diversified basket of equity stocks ofsmall cap companies.
Fund Details
Standard Deviation :
Beta :
Sharpe Ratio :
Portfolio Turnover* :
#
#
#
18.99%
0.88
0.63
0.61#S o u r c e : C R I S I L F u n d A n a l y s e r
*Portfolio Turnover = lower of total sale or totalpurchase for the last 12 months upon Avg. AUMof trailing twelve months.
Risk Free rate: FBIL Overnight Mibor rate (6.00%as on 31st May 2019) Basis for Ratio Calculation:3 Years Monthly Data Points
Ratios are computed using Total Return Index(TRI) as per SEBI Circular dated Jan 4, 2018
PORTFOLIO CLASSIFICATION BY
(%)ASSET ALLOCATION
Consumer Goods 21.42
Industrial Manufacturing 16.46
Financial Services 12.43
Cement & Cement Products 5.14
Chemicals 4.91
Textiles 4.89
Services 4.77
Construction 4.60
IT 4.48
Automobile 2.79
Energy 2.29
Pharma 2.27
Paper 2.23
Fertilisers & Pesticides 1.09
Media And Entertainment 0.74
Others 9.50
Pursuant to payment of dividend, the NAV of Dividend Option ofscheme/plans would fall to the extent of payout and statutory levy, ifapplicable.
•
•
•
•
•
•
•
•
•
•
•
•
•
Type of Scheme
Date of Allotment:
Report As On:
AAUM for the May 2019
AUM as on May 31, 2019
Fund Manager: Mr. R. Srinivasan
Managing Since:
Total Experience:
Benchmark:
Exit Load:
Entry Load:
Plans Available:
Options:
SIP
Minimum Investment & Additional
Investment
An open-ended Equity Scheme predominantly
investing in small cap stocks.
09/09/2009
31/05/2019
2,049.21 Crores
2,186.79 Crores
Nov - 2013
Over 26 years
S&P BSE Small Cap Index
For exit within one year from the
date of allotment -1%
For exit after one year from the date of
allotment – Nil
N.A.
Regular, Direct
Growth, Dividend
Fresh Registration through Systematic
Investment Plan (SIP) and Systematic Transfer
Plan (STP), individually or cumulatively, shall
be allowed for a maximum of upto Rs.
25,000/- per PAN for monthly, quarterly,
semi-annual and annual frequency. For
details refer addendum dated May 14, 2018.
Fresh lumpsum subscription / switch-in from
any other scheme to all the Plans & Options
of the Scheme through any mode including
Stock Exchange platform continues to be
suspended in terms of notice-cum-
addendum dated October 28, 2015.
Month of
`
`
PORTFOLIO CLASSIFICATION BY
INDUSTRY ALLOCATION (%)
PORTFOLIO
Equity Shares
Jk Cement Ltd. 5.14
Techno Electric & Engineering Company Ltd. 3.57
Relaxo Footwears Ltd. 3.47
HDFC Bank Ltd. 3.44
Sheela Foam Ltd. 3.42
NIIT Ltd. 3.38
Carborundum Universal Ltd. 3.14
Kewal Kiran Clothing Ltd. 3.09
Indian Energy Exchange Ltd. 3.07
Blue Star Ltd. 2.90
Chalet Hotels Ltd. 2.86
Hatsun Agro Product Ltd. 2.80
Galaxy Surfactants Ltd. 2.71
Bharat Heavy Electricals Ltd. 2.53
ELGI Equipments Ltd. 2.53
Indostar Capital Finance Ltd. 2.52
Aavas Financiers Ltd. 2.37
NHPC Ltd. 2.29
Tamil Nadu Newsprint & Papers Ltd. 2.23
Emami Ltd. 2.07
Triveni Turbine Ltd. 1.94
Timken India Ltd. 1.93
Alembic Ltd. 1.91
Hawkins Cookers Ltd. 1.81
Stock Name (%) Of Total AUM Stock Name (%) Of Total AUM
Agro Tech Foods Ltd. 1.65
Tube Investments Of India Ltd. 1.57
Grindwell Norton Ltd. 1.52
Disa India Ltd. 1.52
The Great Eastern Shipping Company Ltd. 1.41
Kirloskar Oil Engines Ltd. 1.33
V2 Retail Ltd. 1.31
Rajratan Global Wire Ltd. 1.22
Dixon Technologies (India) Ltd. 1.19
Fairchem Speciality Ltd. 1.17
Garware Technical Fibres Ltd. 1.14
Control Print Ltd. 1.10
PI Industries Ltd. 1.09
Pilani Investment & IndustriesCorporation Ltd. 1.03
Fine Organic Industries Ltd. 1.03
Ashiana Housing Ltd. 1.03
Thangamayil Jewellery Ltd. 0.81
UFO Moviez India Ltd. 0.74
Ganesha Ecosphere Ltd. 0.66
Gujarat Pipavav Port Ltd. 0.50
Torrent Pharmaceuticals Ltd. 0.36
Total 90.50
Cash, Cash Equivalents And Others 9.50
Grand Total 100.00
^Investors should consult their financial advisers if in doubt about whether the product is suitablefor them.
(Previously known as SBI Small & Midcap Fund)
Large Cap Midcap
Cash, Cash Equivalents and Others Smallcap
6.29
14.61
69.60
9.50
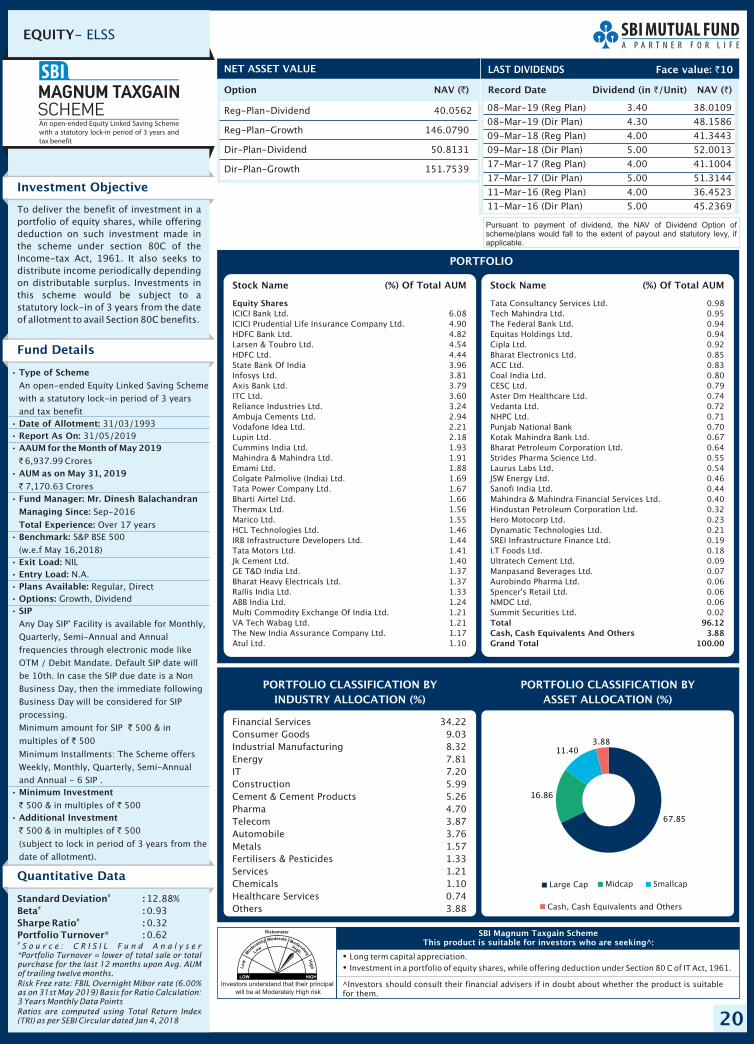
20
EQUITY- ELSS
Option NAV ( )`
Reg-Plan-Dividend 40.0562
Reg-Plan-Growth 146.0790
Dir-Plan-Dividend 50.8131
Dir-Plan-Growth 151.7539
NET ASSET VALUE
Record Date Dividend NAV ( )`(in /Unit)`
LAST DIVIDENDS
Investors understand that their principal
will be at Moderately High risk
�
�
Long term capital appreciation.
Investment in a portfolio of equity shares, while offering deduction under Section 80 C of IT Act, 1961.
SBI Magnum Taxgain SchemeThis product is suitable for investors who are seeking^:
Face value: 10`
Investment Objective
Quantitative Data
To deliver the benefit of investment in a
portfolio of equity shares, while offering
deduction on such investment made in
the scheme under section 80C of the
Income-tax Act, 1961. It also seeks to
distribute income periodically depending
on distributable surplus. Investments in
this scheme would be subject to a
statutory lock-in of 3 years from the date
of allotment to avail Section 80C benefits.
Fund Details
Standard Deviation :
Beta :
Sharpe Ratio :
Portfolio Turnover* :
#
#
#
12.88%
0.93
0.32
0.62#S o u r c e : C R I S I L F u n d A n a l y s e r
*Portfolio Turnover = lower of total sale or totalpurchase for the last 12 months upon Avg. AUMof trailing twelve months.
Risk Free rate: FBIL Overnight Mibor rate (6.00%as on 31st May 2019) Basis for Ratio Calculation:3 Years Monthly Data Points
Ratios are computed using Total Return Index(TRI) as per SEBI Circular dated Jan 4, 2018
PORTFOLIO CLASSIFICATION BY
(%)ASSET ALLOCATION
Financial Services 34.22
Consumer Goods 9.03
Industrial Manufacturing 8.32
Energy 7.81
IT 7.20
Construction 5.99
Cement & Cement Products 5.26
Pharma 4.70
Telecom 3.87
Automobile 3.76
Metals 1.57
Fertilisers & Pesticides 1.33
Services 1.21
Chemicals 1.10
Healthcare Services 0.74
Others 3.88
Pursuant to payment of dividend, the NAV of Dividend Option ofscheme/plans would fall to the extent of payout and statutory levy, ifapplicable.
•
•
•
•
•
•
•
•
•
•
•
•
•
•
Type of Scheme
Date of Allotment:
Report As On:
AAUM for the May 2019
AUM as on May 31, 2019
Fund Manager: Mr. Dinesh Balachandran
Managing Since:
Total Experience:
Benchmark:
Exit Load:
Entry Load:
Plans Available:
Options:
SIP
Minimum Investment
Additional Investment
An open-ended Equity Linked Saving Scheme
with a statutory lock-in period of 3 years
and tax benefit
31/03/1993
31/05/2019
6,937.99 Crores
7,170.63 Crores
Sep-2016
Over 17 years
S&P BSE 500
(w.e.f May 16,2018)
NIL
N.A.
Regular, Direct
Growth, Dividend
Any Day SIP’ Facility is available for Monthly,
Quarterly, Semi-Annual and Annual
frequencies through electronic mode like
OTM / Debit Mandate. Default SIP date will
be 10th. In case the SIP due date is a Non
Business Day, then the immediate following
Business Day will be considered for SIP
processing.
Minimum amount for SIP 500 & in
multiples of 500
Minimum Installments: The Scheme offers
Weekly, Monthly, Quarterly, Semi-Annual
and Annual - 6 SIP .
500 & in multiples of 500
500 & in multiples of 500
(subject to lock in period of 3 years from the
date of allotment).
Month of
`
`
`
`
` `
` `
PORTFOLIO CLASSIFICATION BY
INDUSTRY ALLOCATION (%)
PORTFOLIO
Equity Shares
ICICI Bank Ltd. 6.08
ICICI Prudential Life Insurance Company Ltd. 4.90
HDFC Bank Ltd. 4.82
Larsen & Toubro Ltd. 4.54
HDFC Ltd. 4.44
State Bank Of India 3.96
Infosys Ltd. 3.81
Axis Bank Ltd. 3.79
ITC Ltd. 3.60
Reliance Industries Ltd. 3.24
Ambuja Cements Ltd. 2.94
Vodafone Idea Ltd. 2.21
Lupin Ltd. 2.18
Cummins India Ltd. 1.93
Mahindra & Mahindra Ltd. 1.91
Emami Ltd. 1.88
Colgate Palmolive (India) Ltd. 1.69
Tata Power Company Ltd. 1.67
Bharti Airtel Ltd. 1.66
Thermax Ltd. 1.56
Marico Ltd. 1.55
HCL Technologies Ltd. 1.46
IRB Infrastructure Developers Ltd. 1.44
Tata Motors Ltd. 1.41
Jk Cement Ltd. 1.40
GE T&D India Ltd. 1.37
Bharat Heavy Electricals Ltd. 1.37
Rallis India Ltd. 1.33
ABB India Ltd. 1.24
Multi Commodity Exchange Of India Ltd. 1.21
VA Tech Wabag Ltd. 1.21
The New India Assurance Company Ltd. 1.17
Atul Ltd. 1.10
Stock Name (%) Of Total AUM Stock Name (%) Of Total AUM
Tata Consultancy Services Ltd. 0.98
Tech Mahindra Ltd. 0.95
The Federal Bank Ltd. 0.94
Equitas Holdings Ltd. 0.94
Cipla Ltd. 0.92
Bharat Electronics Ltd. 0.85
ACC Ltd. 0.83
Coal India Ltd. 0.80
CESC Ltd. 0.79
Aster Dm Healthcare Ltd. 0.74
Vedanta Ltd. 0.72
NHPC Ltd. 0.71
Punjab National Bank 0.70
Kotak Mahindra Bank Ltd. 0.67
Bharat Petroleum Corporation Ltd. 0.64
Strides Pharma Science Ltd. 0.55
Laurus Labs Ltd. 0.54
JSW Energy Ltd. 0.46
Sanofi India Ltd. 0.44
Mahindra & Mahindra Financial Services Ltd. 0.40
Hindustan Petroleum Corporation Ltd. 0.32
Hero Motocorp Ltd. 0.23
Dynamatic Technologies Ltd. 0.21
SREI Infrastructure Finance Ltd. 0.19
LT Foods Ltd. 0.18
Ultratech Cement Ltd. 0.09
Manpasand Beverages Ltd. 0.07
Aurobindo Pharma Ltd. 0.06
Spencer's Retail Ltd. 0.06
NMDC Ltd. 0.06
Summit Securities Ltd. 0.02
Total 96.12
Cash, Cash Equivalents And Others 3.88
Grand Total 100.00
^Investors should consult their financial advisers if in doubt about whether the product is suitablefor them.
08-Mar-19 (Reg Plan) 3.40 38.0109
08-Mar-19 (Dir Plan) 4.30 48.1586
09-Mar-18 (Reg Plan) 4.00 41.3443
09-Mar-18 (Dir Plan) 5.00 52.0013
17-Mar-17 (Reg Plan) 4.00 41.1004
17-Mar-17 (Dir Plan) 5.00 51.3144
11-Mar-16 (Reg Plan) 4.00 36.4523
11-Mar-16 (Dir Plan) 5.00 45.2369
Cash, Cash Equivalents and Others
Large Cap Midcap Smallcap
67.85
16.86
11.403.88

21
EQUITY- SECTORAL FUND
Option NAV ( )`
Reg-Plan-Dividend 70.8296
Reg-Plan-Growth 112.4479
Dir-Plan-Dividend 83.7621
Dir-Plan-Growth 120.5589
NET ASSET VALUE
Record Date Dividend NAV ( )`(in /Unit)`
16-Mar-18 (Reg Plan) 14.10 75.9127
16-Mar-18 (Dir Plan) 16.40 88.5986
30-Jan-15 (Reg Plan) 10.00 93.5001
LAST DIVIDENDS
Investors understand that their principal
will be at High risk
�
�
Long term capital appreciation.
Equity investments in stocks of companies in the healthcare sector.
SBI Healthcare Opportunities FundThis product is suitable for investors who are seeking^:
Face value: 10`
Investment Objective
Quantitative Data
To provide the investors with theopportunity of long-term capitalappreciation by investing in a diversifiedportfolio of equity and equity relatedsecurities in Healthcare space.
Fund Details
Standard Deviation :
Beta :
Sharpe Ratio :
Portfolio Turnover* :
#
#
#
16.45%
0.86
-0.66
0.61#S o u r c e : C R I S I L F u n d A n a l y s e r
*Portfolio Turnover = lower of total sale or totalpurchase for the last 12 months upon Avg. AUMof trailing twelve months.
Risk Free rate: FBIL Overnight Mibor rate (6.00%as on 31st May 2019) Basis for Ratio Calculation:3 Years Monthly Data Points
Ratios are computed using Total Return Index(TRI) as per SEBI Circular dated Jan 4, 2018
PORTFOLIO CLASSIFICATION BY
(%)ASSET ALLOCATION
Pharma 95.47
Healthcare Services 3.23
Cash, Cash Equivalents And Others 1.30
Pursuant to payment of dividend, the NAV of Dividend Option ofscheme/plans would fall to the extent of payout and statutory levy, ifapplicable.
•
•
•
•
•
•
•
•
•
•
•
•
•
•
Type of Scheme
Date of Allotment:
Report As On:
AAUM for the May 2019
AUM as on May 31, 2019
Fund Manager: Mr. Tanmaya Desai
Managing Since:
Total Experience:
Benchmark:
Exit Load:
Entry Load:
Plans Available:
Options:
SIP
Minimum Investment
Additional Investment
An open-ended Equity Scheme investing in
healthcare sector.
05/07/1999
31/05/2019
967.70 Crores
934.56 Crores
Jun-2011
Over 12 years
S&P BSE HEALTHCARE Index
For exit within 15 Days from the
date of allotment - 0.50%;
For exit after 15 Days from the date of
allotment - Nil.
N.A.
Regular, Direct
Growth, Dividend
Any Day SIP’ Facility is available for Monthly,
Quarterly, Semi-Annual and Annual
frequencies through electronic mode like
OTM / Debit Mandate. Default SIP date will
be 10th. In case the SIP due date is a Non
Business Day, then the immediate following
Business Day will be considered for SIP
processing.
Weekly - Minimum 1000 & in multiples of
1 thereafter for a minimum of 6
instalments.
Monthly - Minimum 1000 & in multiples
of 1 thereafter for minimum six months
(or) minimum 500 & in multiples of 1
thereafter for minimum one year.
Quarterly - Minimum 1500 & in multiples
of 1 thereafter for minimum one year.
Semi Annual - Minimum 3000 & in
multiples of 1 thereafter for a minimum of
4 installments.
Annual - Minimum 5000 & in multiples of
1 thereafter for a minimum of 4
installments.
5000 & in multiples of 1
1000 & in multiples of
Month of
`
`
`
`
`
`
` `
`
`
`
`
`
`
` `
` ` 1
PORTFOLIO CLASSIFICATION BY
INDUSTRY ALLOCATION (%)
PORTFOLIO
Equity Shares
Divi's Laboratories Ltd. 10.22
Aurobindo Pharma Ltd. 10.07
Dr. Reddy's Laboratories Ltd. 10.02
Lupin Ltd. 9.57
Cipla Ltd. 8.96
Strides Pharma Science Ltd. 7.78
Sun Pharmaceutical Industries Ltd. 6.57
Alkem Laboratories Ltd. 5.18
Torrent Pharmaceuticals Ltd. 4.18
Biocon Ltd. 3.71
Abbott India Ltd. 3.33
Aster Dm Healthcare Ltd. 3.23
Stock Name (%) Of Total AUM Stock Name (%) Of Total AUM
Gufic Biosciences Ltd. 3.20
Sanofi India Ltd. 2.92
Alembic Pharmaceuticals Ltd. 2.49
Sequent Scientific Ltd. 2.23
Alembic Ltd. 1.85
Neuland Laboratories Ltd. 1.66
Solara Active Pharma Sciences Ltd. 1.51
Total 98.70
Cash, Cash Equivalents And Others 1.30
Grand Total 100.00
(Previously known as SBI Pharma Fund)
^Investors should consult their financial advisers if in doubt about whether the product is suitablefor them.
Large Cap Midcap
Cash, Cash Equivalents and Others Smallcap
59.1218.11
21.48
1.30
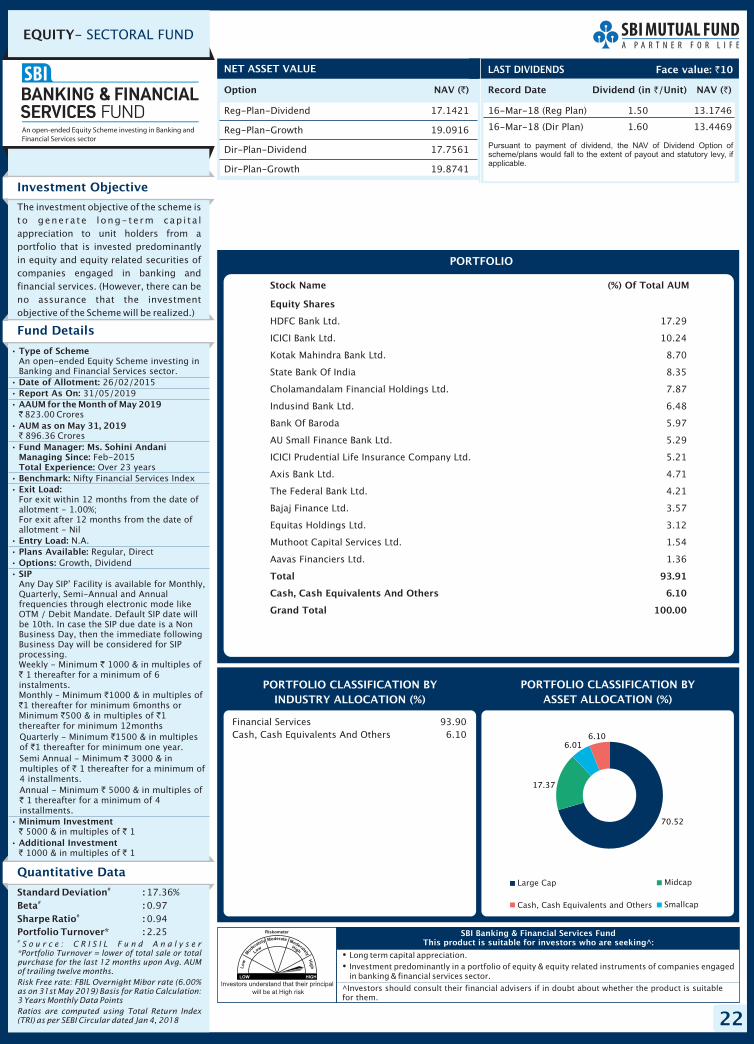
22
EQUITY- SECTORAL FUND
Option NAV ( )`
Reg-Plan-Dividend 17.1421
Reg-Plan-Growth 19.0916
Dir-Plan-Dividend 17.7561
Dir-Plan-Growth 19.8741
NET ASSET VALUE
�
�
Long term capital appreciation.
Investment predominantly in a portfolio of equity & equity related instruments of companies engagedin banking & financial services sector.
SBI Banking & Financial Services FundThis product is suitable for investors who are seeking^:
Investment Objective
The investment objective of the scheme is
to genera te long-term cap i ta l
appreciation to unit holders from a
portfolio that is invested predominantly
in equity and equity related securities of
companies engaged in banking and
financial services. (However, there can be
no assurance that the investment
objective of the Scheme will be realized.)
Fund Details
PORTFOLIO CLASSIFICATION BY
(%)ASSET ALLOCATION
Financial Services 93.90
Cash, Cash Equivalents And Others 6.10
•
•
•
•
•
•
•
•
•
•
•
•
•
•
Type of Scheme
Date of Allotment:
Report As On:
AAUM for the May 2019
AUM as on May 31, 2019
Fund Manager: Ms. Sohini AndaniManaging Since:Total Experience:
Benchmark:
Exit Load:
Entry Load:
Plans Available:
Options:
SIP
Minimum Investment
Additional Investment
An open-ended Equity Scheme investing inBanking and Financial Services sector.
26/02/2015
31/05/2019
823.00 Crores
896.36 Crores
Feb-2015Over 23 years
Nifty Financial Services Index
For exit within 12 months from the date ofallotment - 1.00%;For exit after 12 months from the date ofallotment - Nil
N.A.
Regular, Direct
Growth, Dividend
Any Day SIP’ Facility is available for Monthly,Quarterly, Semi-Annual and Annualfrequencies through electronic mode likeOTM / Debit Mandate. Default SIP date willbe 10th. In case the SIP due date is a NonBusiness Day, then the immediate followingBusiness Day will be considered for SIPprocessing.Weekly - Minimum 1000 & in multiples of
1 thereafter for a minimum of 6instalments.Monthly – Minimum 1000 & in multiples of1 thereafter for minimum 6months or
Minimum 500 & in multiples of 1thereafter for minimum 12months
Quarterly - Minimum 1500 & in multiplesof 1 thereafter for minimum one year.
Semi Annual - Minimum 3000 & inmultiples of 1 thereafter for a minimum of4 installments.
Annual - Minimum 5000 & in multiples of1 thereafter for a minimum of 4
installments.
5000 & in multiples of 1
1000 & in multiples of 1
Month of`
`
``
``
` `
``
``
``
` `
` `
PORTFOLIO CLASSIFICATION BY
INDUSTRY ALLOCATION (%)
^Investors should consult their financial advisers if in doubt about whether the product is suitablefor them.
PORTFOLIO
Equity Shares
Total 93.91
Cash, Cash Equivalents And Others 6.10
Grand Total 100.00
HDFC Bank Ltd. 17.29
ICICI Bank Ltd. 10.24
Kotak Mahindra Bank Ltd. 8.70
State Bank Of India 8.35
Cholamandalam Financial Holdings Ltd. 7.87
Indusind Bank Ltd. 6.48
Bank Of Baroda 5.97
AU Small Finance Bank Ltd. 5.29
ICICI Prudential Life Insurance Company Ltd. 5.21
Axis Bank Ltd. 4.71
The Federal Bank Ltd. 4.21
Bajaj Finance Ltd. 3.57
Equitas Holdings Ltd. 3.12
Muthoot Capital Services Ltd. 1.54
Aavas Financiers Ltd. 1.36
Stock Name (%) Of Total AUM
Investors understand that their principal
will be at High risk
Quantitative Data
Standard Deviation :
Beta :
Sharpe Ratio :
Portfolio Turnover* :
#
#
#
17.36%
0.97
0.94
2.25#S o u r c e : C R I S I L F u n d A n a l y s e r
*Portfolio Turnover = lower of total sale or totalpurchase for the last 12 months upon Avg. AUMof trailing twelve months.
Risk Free rate: FBIL Overnight Mibor rate (6.00%as on 31st May 2019) Basis for Ratio Calculation:3 Years Monthly Data Points
Ratios are computed using Total Return Index(TRI) as per SEBI Circular dated Jan 4, 2018
Record Date Dividend NAV ( )`(in /Unit)`
16-Mar-18 (Reg Plan) 1.50 13.1746
16-Mar-18 (Dir Plan) 1.60 13.4469
LAST DIVIDENDS Face value: 10`
Pursuant to payment of dividend, the NAV of Dividend Option ofscheme/plans would fall to the extent of payout and statutory levy, ifapplicable.
Large Cap Midcap
Cash, Cash Equivalents and Others Smallcap
70.52
17.37
6.016.10

23
EQUITY- SECTORAL FUND
Option NAV ( )`
Reg-Plan-Dividend 10.7399
Reg-Plan-Growth 10.7413
Dir-Plan-Dividend 11.1333
Dir-Plan-Growth 11.1528
NET ASSET VALUE
�
�
Long term capital appreciation.
Investments in diversified basket of equity stocks of domestic Public Sector Undertakings andtheir subsidiaries.
SBI PSU FundThis product is suitable for investors who are seeking^:
Investment Objective
Quantitative Data
To provide investors with opportunitiesfor long-term growth in capital alongwith the liquidity of an open-endedscheme through an active managementof investments in a diversified basket ofequity stocks of domestic Public SectorUndertakings (and their subsidiaries) andin debt and money market instrumentsissued by PSUs and others.
Fund Details
Standard Deviation :
Beta :
Sharpe Ratio :
Portfolio Turnover* :
#
#
#
17.83%
0.85
0.21
0.34#S o u r c e : C R I S I L F u n d A n a l y s e r
*Portfolio Turnover = lower of total sale or totalpurchase for the last 12 months upon Avg. AUMof trailing twelve months.
Risk Free rate: FBIL Overnight Mibor rate (6.00%as on 31st May 2019) Basis for Ratio Calculation:3 Years Monthly Data Points
Ratios are computed using Total Return Index(TRI) as per SEBI Circular dated Jan 4, 2018
PORTFOLIO CLASSIFICATION BY
(%)ASSET ALLOCATION
Energy 40.66
Financial Services 30.39
Industrial Manufacturing 15.81
Construction 4.59
Metals 3.72
Others 4.84
•
•
•
•
•
•
•
•
•
•
•
•
•
•
Type of Scheme
Date of Allotment:
Report As On:
AAUM for the May 2019
AUM as on May 31, 2019
Fund Manager: Mr. Richard D'souza
Managing Since:
Total Experience:
Benchmark:
Exit Load:
Entry Load:
Plans Available:
Options:
SIP
Minimum Investment
Additional Investment
An open-ended Equity Scheme investing in
PSU/PSU subsidiaries sector.
07/07/2010
31/05/2019
164.92 Crores
171.50 Crores
Aug 2014
Over 26 years
S&P BSE PSU INDEX
For exit within 1 year from the date of
allotment - 1%;
For exit after 1 year from the date of
allotment - Nil
N.A.
Regular, Direct
Growth, Dividend
Any Day SIP’ Facility is available for Monthly,
Quarterly, Semi-Annual and Annual
frequencies through electronic mode like
OTM / Debit Mandate. Default SIP date will
be 10th. In case the SIP due date is a Non
Business Day, then the immediate following
Business Day will be considered for SIP
processing.
Weekly - Minimum 1000 & in multiples of
1 thereafter for a minimum of 6
instalments.
Monthly - Minimum 1000 & in multiples of
1 thereafter for minimum six months (or)
minimum 500 & in multiples of 1
thereafter for minimum one year.
Quarterly - Minimum 1500 & in multiples
of 1 thereafter for minimum one year.
Semi Annual - Minimum 3000 & in
multiples of 1 thereafter for a minimum of
4 installments.
Annual - Minimum 5000 & in multiples of
1 thereafter for a minimum of 4
installments.
5000 & in multiples of 1
1000 & in multiples of 1
Month of
`
`
`
`
`
`
` `
`
`
`
`
`
`
` `
` `
PORTFOLIO CLASSIFICATION BY
INDUSTRY ALLOCATION (%)
PORTFOLIO
Equity Shares
State Bank Of India 12.69
Oil & Natural Gas Corporation Ltd. 9.60
NTPC Ltd. 6.71
Power Grid Corporation Of India Ltd. 6.01
Indraprastha Gas Ltd. 5.89
Indian Oil Corporation Ltd. 5.39
Bharat Electronics Ltd. 5.21
Hindustan Petroleum Corporation Ltd. 4.63
Garden Reach Shipbuilders & Engineers Ltd. 4.63
Rites Ltd. 4.59
Bank Of Baroda 4.55
Stock Name (%) Of Total AUM Stock Name (%) Of Total AUM
Can Fin Homes Ltd. 4.31
National Aluminium Company Ltd. 3.72
Punjab National Bank 3.71
Bharat Heavy Electricals Ltd. 3.54
Canara Bank 3.12
Cochin Shipyard Ltd. 2.43
Oil India Ltd. 2.43
The New India Assurance Company Ltd. 2.00
Total 95.16
Cash, Cash Equivalents And Others 4.84
Grand Total 100.00
^Investors should consult their financial advisers if in doubt about whether the product is suitablefor them.
Investors understand that their principal
will be at High risk
Large Cap Midcap
Cash, Cash Equivalents and Others Smallcap
51.58
27.61
15.96
4.84

24
EQUITY- SECTORAL FUND
Option NAV ( )`
Reg-Plan-Dividend 21.3895
Reg-Plan-Growth 37.6884
Dir-Plan-Dividend 22.3950
Dir-Plan-Growth 39.3527
NET ASSET VALUE
Record Date Dividend NAV ( )`(in /Unit)`
16-Mar-18 (Reg Plan) 4.20 22.0929
16-Mar-18 (Dir Plan) 4.30 22.8433
15-Mar-10 3.00 16.01
25-Jul-08 2.00 17.14
27-Nov-06 1.50 16.18
LAST DIVIDENDS
�
�
Long term capital appreciation.
Equity investments in a portfolio of stocks of companies in the commodity and commodity relatedsectors.
SBI Magnum Comma FundThis product is suitable for investors who are seeking^:
Face value: 10`
Investment Objective
Quantitative Data
To generate opportunities for growthalong with possibility of consistentreturns by investing predominantly in aportfolio of stocks of companies engagedin the commodity and commodity relatedbusinesses.
Fund Details
Standard Deviation :
Beta :
Sharpe Ratio :
Portfolio Turnover* :
#
#
#
14.98%
0.81
0.61
0.62#S o u r c e : C R I S I L F u n d A n a l y s e r
*Portfolio Turnover = lower of total sale or totalpurchase for the last 12 months upon Avg. AUMof trailing twelve months.
Risk Free rate: FBIL Overnight Mibor rate (6.00%as on 31st May 2019) Basis for Ratio Calculation:3 Years Monthly Data Points
Ratios are computed using Total Return Index(TRI) as per SEBI Circular dated Jan 4, 2018
PORTFOLIO CLASSIFICATION BY
(%)ASSET ALLOCATION
Energy 30.21
Chemicals 19.72
Metals 17.67
Cement & Cement Products 13.81
Fertilisers & Pesticides 9.99
Textiles 1.97
Others 6.62
Pursuant to payment of dividend, the NAV of Dividend Option ofscheme/plans would fall to the extent of payout and statutory levy, ifapplicable.
•
•
•
•
•
•
•
•
•
•
•
•
•
•
Type of Scheme
Date of Allotment:
Report As On:
AAUM for the May 2019
AUM as on May 31, 2019
Fund Manager: Mr. Richard D'souza
Managing Since:
Total Experience:
Benchmark:
Exit Load:
Entry Load:
Plans Available:
Options:
SIP
Minimum Investment
Additional Investment
An open-ended Equity Scheme investing in
commodity and commodity related sectors.
08/08/2005
31/05/2019
258.86 Crores
269.85 Crores
Aug-2014
Over 26 years
Nifty Commodities Index
For exit within 1 year from the date of
allotment - 1 %;
For exit after 1 year from the date of
allotment - Nil.
N.A.
Regular, Direct
Growth, Dividend
Any Day SIP’ Facility is available for Monthly,
Quarterly, Semi-Annual and Annual
frequencies through electronic mode like
OTM / Debit Mandate. Default SIP date will
be 10th. In case the SIP due date is a Non
Business Day, then the immediate following
Business Day will be considered for SIP
processing.
Weekly - Minimum 1000 & in multiples of
1 thereafter for a minimum of 6 instalments.
Monthly - Minimum 1000 & in multiples of
1 thereafter for minimum six months (or)
minimum 500 & in multiples of 1
thereafter for minimum one year.
Quarterly - Minimum 1500 & in multiples
of 1 thereafter for minimum one year.
Semi Annual - Minimum 3000 & in
multiples of 1 thereafter for a minimum of
4 installments.
Annual - Minimum 5000 & in multiples of
1 thereafter for a minimum of 4
installments.
5000 & in multiples of 1
1000 & in multiples of 1
Month of
`
`
` `
`
`
` `
`
`
`
`
`
`
` `
` `
PORTFOLIO CLASSIFICATION BY
INDUSTRY ALLOCATION (%)
PORTFOLIO
Equity Shares
Fine Organic Industries Ltd. 7.56
Hindustan Petroleum Corporation Ltd. 5.64
Indian Oil Corporation Ltd. 5.38
Ultratech Cement Ltd. 5.29
Indraprastha Gas Ltd. 5.11
Reliance Industries Ltd. 4.93
Shree Cement Ltd. 4.80
Oil & Natural Gas Corporation Ltd. 4.69
UPL Ltd. 4.25
Tata Steel Ltd. 4.21
Deepak Nitrite Ltd. 4.14
Camlin Fine Sciences Ltd. 4.04
Neogen Chemicals Ltd. 3.98
Sagar Cements Ltd. 3.72
NTPC Ltd. 3.70
Stock Name (%) Of Total AUM Stock Name (%) Of Total AUM
PI Industries Ltd. 3.37
Kirloskar Ferrous Industries Ltd. 3.11
National Aluminium Company Ltd. 3.00
Hindustan Zinc Ltd. 2.87
Bayer Cropscience Ltd. 2.37
Hindalco Industries Ltd. 2.26
Tata Metaliks Ltd. 2.23
Mayur Uniquoters Ltd. 1.97
Oil India Ltd. 0.76
Total 93.38
Cash, Cash Equivalents And Others 6.62
Grand Total 100.00
Investors understand that their principal
will be at High risk^Investors should consult their financial advisers if in doubt about whether the product is suitablefor them.
An open-ended Equity Scheme investing in commodity
and commodity related sectors.
Large Cap Midcap
Cash, Cash Equivalents and Others Smallcap
52.00
14.61
26.77
6.62
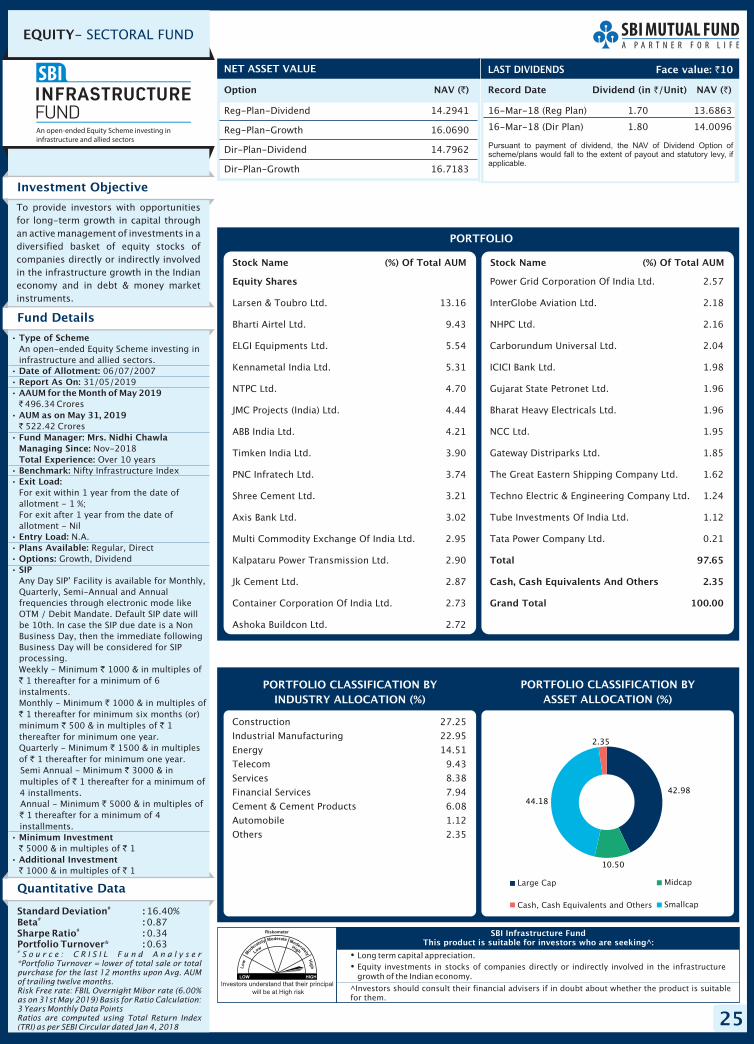
25
EQUITY- SECTORAL FUND
Option NAV ( )`
Reg-Plan-Dividend 14.2941
Reg-Plan-Growth 16.0690
Dir-Plan-Dividend 14.7962
Dir-Plan-Growth 16.7183
NET ASSET VALUE
Investors understand that their principal
will be at High risk
�
�
Long term capital appreciation.
Equity investments in stocks of companies directly or indirectly involved in the infrastructuregrowth of the Indian economy.
SBI Infrastructure FundThis product is suitable for investors who are seeking^:
Investment Objective
Quantitative Data
To provide investors with opportunities
for long-term growth in capital through
an active management of investments in a
diversified basket of equity stocks of
companies directly or indirectly involved
in the infrastructure growth in the Indian
economy and in debt & money market
instruments.
Fund Details
Standard Deviation :Beta :Sharpe Ratio :Portfolio Turnover* :
#
#
#
16.40%0.870.340.63
#S o u r c e : C R I S I L F u n d A n a l y s e r
*Portfolio Turnover = lower of total sale or totalpurchase for the last 12 months upon Avg. AUMof trailing twelve months.Risk Free rate: FBIL Overnight Mibor rate (6.00%as on 31st May 2019) Basis for Ratio Calculation:3 Years Monthly Data PointsRatios are computed using Total Return Index(TRI) as per SEBI Circular dated Jan 4, 2018
PORTFOLIO CLASSIFICATION BY
(%)ASSET ALLOCATION
Construction 27.25
Industrial Manufacturing 22.95
Energy 14.51
Telecom 9.43
Services 8.38
Financial Services 7.94
Cement & Cement Products 6.08
Automobile 1.12
Others 2.35
•
•
•
•
•
•
•
•
•
•
•
•
•
•
Type of Scheme
Date of Allotment:
Report As On:
AAUM for the May 2019
AUM as on May 31, 2019
Fund Manager: Mrs. Nidhi Chawla
Managing Since:
Total Experience:
Benchmark:
Exit Load:
Entry Load:
Plans Available:
Options:
SIP
Minimum Investment
Additional Investment
An open-ended Equity Scheme investing in
infrastructure and allied sectors.
06/07/2007
31/05/2019
496.34 Crores
522.42 Crores
Nov-2018
Over 10 years
Nifty Infrastructure Index
For exit within 1 year from the date of
allotment - 1 %;
For exit after 1 year from the date of
allotment - Nil
N.A.
Regular, Direct
Growth, Dividend
Any Day SIP’ Facility is available for Monthly,
Quarterly, Semi-Annual and Annual
frequencies through electronic mode like
OTM / Debit Mandate. Default SIP date will
be 10th. In case the SIP due date is a Non
Business Day, then the immediate following
Business Day will be considered for SIP
processing.
Weekly - Minimum 1000 & in multiples of
1 thereafter for a minimum of 6
instalments.
Monthly - Minimum 1000 & in multiples of
1 thereafter for minimum six months (or)
minimum 500 & in multiples of 1
thereafter for minimum one year.
Quarterly - Minimum 1500 & in multiples
of 1 thereafter for minimum one year.
Semi Annual - Minimum 3000 & in
multiples of 1 thereafter for a minimum of
4 installments.
Annual - Minimum 5000 & in multiples of
1 thereafter for a minimum of 4
installments.
5000 & in multiples of 1
1000 & in multiples of 1
Month of
`
`
`
`
`
`
` `
`
`
`
`
`
`
` `
` `
PORTFOLIO CLASSIFICATION BY
INDUSTRY ALLOCATION (%)
PORTFOLIO
Equity Shares
Larsen & Toubro Ltd. 13.16
Bharti Airtel Ltd. 9.43
ELGI Equipments Ltd. 5.54
Kennametal India Ltd. 5.31
NTPC Ltd. 4.70
JMC Projects (India) Ltd. 4.44
ABB India Ltd. 4.21
Timken India Ltd. 3.90
PNC Infratech Ltd. 3.74
Shree Cement Ltd. 3.21
Axis Bank Ltd. 3.02
Multi Commodity Exchange Of India Ltd. 2.95
Kalpataru Power Transmission Ltd. 2.90
Jk Cement Ltd. 2.87
Container Corporation Of India Ltd. 2.73
Ashoka Buildcon Ltd. 2.72
Stock Name (%) Of Total AUM Stock Name (%) Of Total AUM
Power Grid Corporation Of India Ltd. 2.57
InterGlobe Aviation Ltd. 2.18
NHPC Ltd. 2.16
Carborundum Universal Ltd. 2.04
ICICI Bank Ltd. 1.98
Gujarat State Petronet Ltd. 1.96
Bharat Heavy Electricals Ltd. 1.96
NCC Ltd. 1.95
Gateway Distriparks Ltd. 1.85
The Great Eastern Shipping Company Ltd. 1.62
Techno Electric & Engineering Company Ltd. 1.24
Tube Investments Of India Ltd. 1.12
Tata Power Company Ltd. 0.21
Total 97.65
Cash, Cash Equivalents And Others 2.35
Grand Total 100.00
^Investors should consult their financial advisers if in doubt about whether the product is suitablefor them.
Record Date Dividend NAV ( )`(in /Unit)`
16-Mar-18 (Reg Plan) 1.70 13.6863
16-Mar-18 (Dir Plan) 1.80 14.0096
LAST DIVIDENDS Face value: 10`
Pursuant to payment of dividend, the NAV of Dividend Option ofscheme/plans would fall to the extent of payout and statutory levy, ifapplicable.
Large Cap Midcap
Cash, Cash Equivalents and Others Smallcap
42.98
10.50
44.18
2.35

26
EQUITY-THEMATIC
Option NAV ( )`
Reg-Plan-Dividend 68.6110
Reg-Plan-Growth 113.9624
Dir-Plan-Dividend 85.7423
Dir-Plan-Growth 121.7895
NET ASSET VALUE
Record Date Dividend NAV ( )`(in /Unit)`
16-Mar-18 (Reg Plan) 12.70 69.8210
16-Mar-18 (Dir Plan) 15.60 85.9324
29-May-15 (Reg Plan) 10.00 51.3257
29-May-15 (Dir Plan) 12.00 61.4862
17-May-13 (Reg Plan) 8.00 46.0416
3-Mar-06 6.00 22.05
LAST DIVIDENDS
�
�
Long term capital appreciation.
Equity investments in stock of companies following consumption theme.
SBI Consumption Opportunities FundThis product is suitable for investors who are seeking^:
Face value: 10`
Investment Objective
Quantitative Data
To provide the investor with theopportunity of long-term capitalappreciation by investing in a diversifiedportfolio of equity and equity relatedsecurities in Consumption space.
Fund Details
Standard Deviation :
Beta :
Sharpe Ratio :
Portfolio Turnover* :
#
#
#
15.19%
0.84
0.53
0.36#S o u r c e : C R I S I L F u n d A n a l y s e r
*Portfolio Turnover = lower of total sale or totalpurchase for the last 12 months upon Avg. AUMof trailing twelve months.
Risk Free rate: FBIL Overnight Mibor rate (6.00%as on 31st May 2019) Basis for Ratio Calculation:3 Years Monthly Data Points
Ratios are computed using Total Return Index(TRI) as per SEBI Circular dated Jan 4, 2018
PORTFOLIO CLASSIFICATION BY
(%)ASSET ALLOCATION
•
•
•
•
•
•
•
•
•
•
•
•
•
•
Type of Scheme
Date of Allotment:
Report As On:
AAUM for the May 2019
AUM as on May 31, 2019
Fund Manager: Mr. Saurabh Pant
Managing Since:
Total Experience:
Benchmark:
Exit Load:
Entry Load:
Plans Available:
Options:
SIP
Minimum Investment
Additional Investment
An open-ended Equity Scheme following
consumption theme.
05/07/1999
31/05/2019
703.70 Crores
705.84 Crores
Jun-2011
Over 11 years
Nifty India Consumption (w.e.f.
16 May, 2018)
(w.e.f. 15 January, 2019)
For exit on or before 30 days from the date
of allotment - 0.10%
For exit after 30 days from the date of
allotment- Nil
Nil
Regular, Direct
Growth, Dividend
Any Day SIP’ Facility is available for
Monthly, Quarterly, Semi-Annual and
Annual frequencies through electronic
mode like OTM / Debit Mandate. Default SIP
date will be 10th. In case the SIP due date is
a Non Business Day, then the immediate
following Business Day will be considered
for SIP processing.
Weekly - Minimum 1000 & in multiples of
1 thereafter for a minimum of 6
instalments.
Monthly - Minimum 1000 & in multiples
of 1 thereafter for minimum six months
(or) minimum 500 & in multiples of 1
thereafter for minimum one year
Quarterly - Minimum 1500 & in multiples
of 1 thereafter for minimum one year.
Semi Annual - Minimum 3000 & in
multiples of 1 thereafter for a minimum of
4 installments.
Annual - Minimum 5000 & in multiples of
1 thereafter for a minimum of 4
installments.
5000 & in multiples of 1
1000 & in multiples of 1
Month of
`
`
`
`
`
`
` `
`
`
`
`
`
`
` `
` `
Consumer Goods 71.76
Services 10.19
Textiles 9.17
Automobile 3.98
Construction 3.15
Others 1.75
PORTFOLIO CLASSIFICATION BY
INDUSTRY ALLOCATION (%)
PORTFOLIO
Equity Shares
Total 98.26
Cash, Cash Equivalents And Others 1.75
Grand Total 100.00
Asian Paints Ltd. 7.56
Nestle India Ltd. 7.07
Sheela Foam Ltd. 6.97
The Indian Hotels Company Ltd. 6.67
Colgate Palmolive (India) Ltd. 6.52
Jubilant Foodworks Ltd. 5.71
Marico Ltd. 5.26
Emami Ltd. 5.24
Hawkins Cookers Ltd. 4.31
Greenply Industries Ltd. 4.02
Hero Motocorp Ltd. 3.98
Ganesha Ecosphere Ltd. 3.84
ITC Ltd. 3.55
Chalet Hotels Ltd. 3.53
Kajaria Ceramics Ltd. 3.15
Procter & Gamble Hygiene And Health Care Ltd. 3.11
Kewal Kiran Clothing Ltd. 2.91
Prataap Snacks Ltd. 2.55
Indian Terrain Fashions Ltd. 2.43
Hatsun Agro Product Ltd. 2.34
Relaxo Footwears Ltd. 2.03
Tata Global Beverages Ltd. 1.73
V2 Retail Ltd. 1.70
Thangamayil Jewellery Ltd. 1.08
Manpasand Beverages Ltd. 0.57
Eveready Industries India Ltd. 0.47
Stock Name (%) Of Total AUM
Investors understand that their principal
will be at High risk
^Investors should consult their financial advisers if in doubt about whether the product is suitablefor them.
Pursuant to payment of dividend, the NAV of Dividend Option ofscheme/plans would fall to the extent of payout and statutory levy, ifapplicable.
(Previously known as SBI FMCG Fund)
Large Cap Midcap
Cash, Cash Equivalents and Others Smallcap
47.57
23.71
33.98
1.75
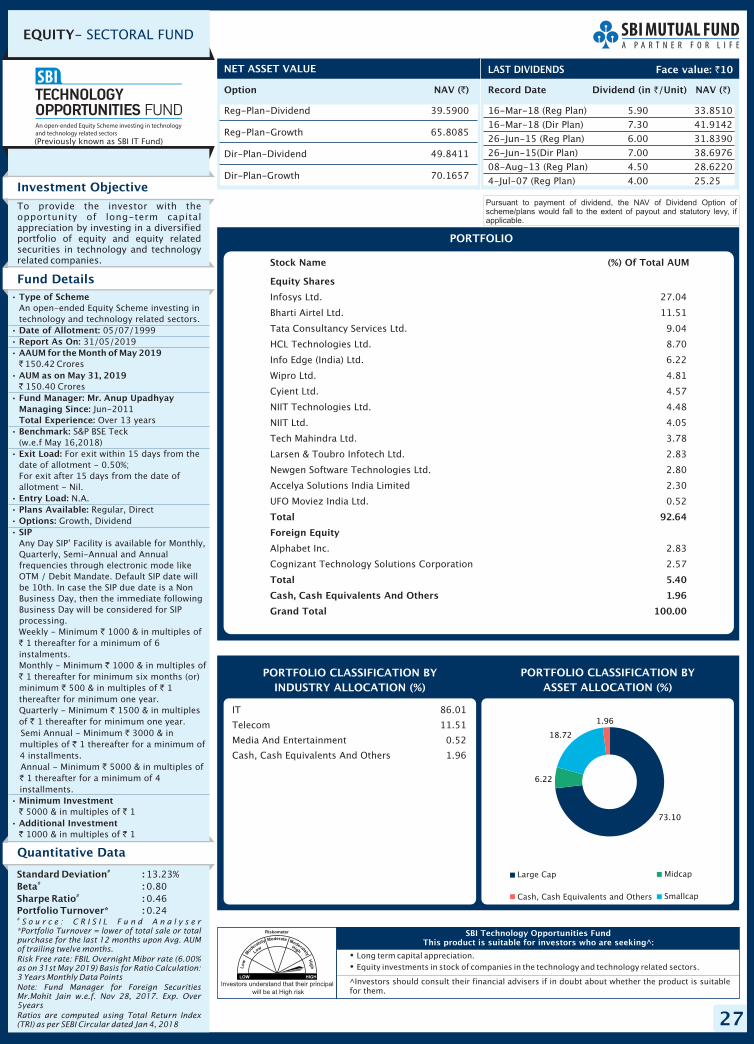
27
EQUITY- SECTORAL FUND
Option NAV ( )`
Reg-Plan-Dividend 39.5900
Reg-Plan-Growth 65.8085
Dir-Plan-Dividend 49.8411
Dir-Plan-Growth 70.1657
NET ASSET VALUE
Record Date Dividend NAV ( )`(in /Unit)`
16-Mar-18 (Reg Plan) 5.90 33.8510
16-Mar-18 (Dir Plan) 7.30 41.9142
26-Jun-15 (Reg Plan) 6.00 31.8390
26-Jun-15(Dir Plan) 7.00 38.6976
08-Aug-13 (Reg Plan) 4.50 28.6220
4-Jul-07 (Reg Plan) 4.00 25.25
LAST DIVIDENDS
�
�
Long term capital appreciation.
Equity investments in stock of companies in the technology and technology related sectors.
SBI Technology Opportunities FundThis product is suitable for investors who are seeking^:
Face value: 10`
Investment Objective
Quantitative Data
To provide the investor with theopportunity of long-term capitalappreciation by investing in a diversifiedportfolio of equity and equity relatedsecurities in technology and technologyrelated companies.
Standard Deviation :
Beta :
Sharpe Ratio :
Portfolio Turnover* :
#
#
#
13.23%
0.80
0.46
0.24#S o u r c e : C R I S I L F u n d A n a l y s e r
*Portfolio Turnover = lower of total sale or totalpurchase for the last 12 months upon Avg. AUMof trailing twelve months.
Risk Free rate: FBIL Overnight Mibor rate (6.00%as on 31st May 2019) Basis for Ratio Calculation:3 Years Monthly Data Points
Note: Fund Manager for Foreign SecuritiesMr.Mohit Jain w.e.f. Nov 28, 2017. Exp. Over5years
Ratios are computed using Total Return Index(TRI) as per SEBI Circular dated Jan 4, 2018
PORTFOLIO CLASSIFICATION BY
(%)ASSET ALLOCATION
IT 86.01
Telecom 11.51
Media And Entertainment 0.52
Cash, Cash Equivalents And Others 1.96
Pursuant to payment of dividend, the NAV of Dividend Option ofscheme/plans would fall to the extent of payout and statutory levy, ifapplicable.
Fund Details
•
•
•
•
•
•
•
•
•
•
•
•
•
•
Type of Scheme
Date of Allotment:
Report As On:
AAUM for the May 2019
AUM as on May 31, 2019
Fund Manager: Mr. Anup Upadhyay
Managing Since:
Total Experience:
Benchmark:
Exit Load:
Entry Load:
Plans Available:
Options:
SIP
Minimum Investment
Additional Investment
An open-ended Equity Scheme investing in
technology and technology related sectors.
05/07/1999
31/05/2019
150.42 Crores
150.40 Crores
Jun-2011
Over 13 years
S&P BSE Teck
(w.e.f May 16,2018)
For exit within 15 days from the
date of allotment - 0.50%;
For exit after 15 days from the date of
allotment - Nil.
N.A.
Regular, Direct
Growth, Dividend
Any Day SIP’ Facility is available for Monthly,
Quarterly, Semi-Annual and Annual
frequencies through electronic mode like
OTM / Debit Mandate. Default SIP date will
be 10th. In case the SIP due date is a Non
Business Day, then the immediate following
Business Day will be considered for SIP
processing.
Weekly - Minimum 1000 & in multiples of
1 thereafter for a minimum of 6
instalments.
Monthly - Minimum 1000 & in multiples of
1 thereafter for minimum six months (or)
minimum 500 & in multiples of 1
thereafter for minimum one year.
Quarterly - Minimum 1500 & in multiples
of 1 thereafter for minimum one year.
Semi Annual - Minimum 3000 & in
multiples of 1 thereafter for a minimum of
4 installments.
Annual - Minimum 5000 & in multiples of
1 thereafter for a minimum of 4
installments.
5000 & in multiples of 1
1000 & in multiples of 1
Month of
`
`
`
`
`
`
` `
`
`
`
`
`
`
` `
` `
PORTFOLIO CLASSIFICATION BY
INDUSTRY ALLOCATION (%)
PORTFOLIO
Equity Shares
Total 92.64
Foreign Equity
Total 5.40
Cash, Cash Equivalents And Others 1.96
Grand Total 100.00
Infosys Ltd. 27.04
Bharti Airtel Ltd. 11.51
Tata Consultancy Services Ltd. 9.04
HCL Technologies Ltd. 8.70
Info Edge (India) Ltd. 6.22
Wipro Ltd. 4.81
Cyient Ltd. 4.57
NIIT Technologies Ltd. 4.48
NIIT Ltd. 4.05
Tech Mahindra Ltd. 3.78
Larsen & Toubro Infotech Ltd. 2.83
Newgen Software Technologies Ltd. 2.80
Accelya Solutions India Limited 2.30
UFO Moviez India Ltd. 0.52
Alphabet Inc. 2.83
Cognizant Technology Solutions Corporation 2.57
Stock Name (%) Of Total AUM
(Previously known as SBI IT Fund)
^Investors should consult their financial advisers if in doubt about whether the product is suitablefor them.
Investors understand that their principal
will be at High risk
Large Cap Midcap
Cash, Cash Equivalents and Others Smallcap
73.10
6.22
18.72
1.96

28
EQUITY-THEMATIC
Option NAV ( )`
Reg-Plan-Dividend 10.2448
Reg-Plan-Growth 10.2447
Dir-Plan-Dividend 10.2530
Dir-Plan-Growth 10.2531
NET ASSET VALUE
�
�
Long term Capital appreciation.
To generate income by investing in a diversified basket of companies in Nifty 50 Index whileaiming for minimizing the portfolio volatility.
SBI Equity Minimum Variance FundThis product is suitable for investors who are seeking^:
Investment Objective
Quantitative Data
The investment objective of the scheme is toprovide long term capital appreciation byinvesting in a diversified basket of companies inNifty 50 Index while aiming for minimizing theportfolio volatility. However, there is noguarantee or assurance that the investmentobjective of the scheme will be achieved.
Portfolio Turnover* : 0.15*Portfolio Turnover = lower of total sale or totalpurchase for the last 12 months upon Avg. AUMof trailing twelve months.
Risk Free rate: FBIL Overnight Mibor rate (6.00%as on 31st May 2019) Basis for Ratio Calculation:3 Years Monthly Data Points
Ratios are computed using Total Return Index(TRI) as per SEBI Circular dated Jan 4, 2018
PORTFOLIO CLASSIFICATION BY
(%)ASSET ALLOCATION
IT 30.86
Consumer Goods 15.30
Financial Services 15.03
Pharma 9.93
Energy 8.21
Automobile 5.79
Metals 4.77
Cement & Cement Products 2.19
Telecom 1.83
Construction 1.08
Services 1.05
Fertilisers & Pesticides 1.03
Media And Entertainment 0.77
Others 2.16
Fund Details
•
•
•
•
•
•
•
•
•
•
•
•
•
•
Type of Scheme
Date of Allotment:
Report As On:
AAUM for the May 2019
AUM as on May 31, 2019
Fund Manager: Mr. Raviprakash Sharma
Managing Since:
Total Experience:
Benchmark:
Exit Load:
Entry Load:
Plans Available:
Options:
SIP
Minimum Investment
Additional Investment
An Open Ended Equity Scheme following
minimum variance theme
02/03/2019
31/05/2019
45.95 Crores
47.35 Crores
March-2019
Over 19 years
Nifty 50 Index
For exit within 1 year from the
date of allotment – 1 %,
For exit after 1 year from the date of
allotment – Nil
N.A.
Regular, Direct
Growth, Dividend
Any Day SIP’ Facility is available for Monthly,
Quarterly, Semi-Annual and Annual
frequencies through electronic mode like
OTM / Debit Mandate. Default SIP date will
be 10th. In case the SIP due date is a Non
Business Day, then the immediate following
Business Day will be considered for SIP
processing.
Weekly - Minimum 1000 & in multiples of
Re. 1 thereafter for minimum of six
installments.
Monthly - Minimum 1000 & in multiples of
Re. 1 thereafter for minimum six months (or)
minimum 500 & in multiples of Re. 1
thereafter for minimum one year
Quarterly - Minimum 1500 & in multiples
of Re. 1 thereafter for minimum one year
Semi-Annual - Minimum amount of
investment will be 3,000 and in multiples
of Re.1 thereafter for minimum 4 number of
installments
Annual - Minimum amount of investment
will be 5,000 and in multiples of Re.1
thereafter for minimum 4 number of
installments
5000 & in multiples of 1
1000 & in multiples of 1
Month of
`
`
`
`
`
`
`
`
` `
` `
PORTFOLIO CLASSIFICATION BY
INDUSTRY ALLOCATION (%)
^Investors should consult their financial advisers if in doubt about whether the product is suitablefor them.
Investors understand that their principal
will be at High risk
Large Cap Cash, Cash Equivalents and Others
PORTFOLIO
Stock Name (%) Of Total AUMStock Name (%) Of Total AUM
Equity Shares
Wipro Ltd. 8.62
HCL Technologies Ltd. 7.74
Infosys Ltd. 7.67
Dr. Reddy's Laboratories Ltd. 7.56
Britannia Industries Ltd. 7.24
Hindustan Unilever Ltd. 5.23
Tata Consultancy Services Ltd. 5.21
Kotak Mahindra Bank Ltd. 3.48
HDFC Bank Ltd. 2.89
Power Grid Corporation Of India Ltd. 2.24
Tech Mahindra Ltd. 1.61
Cipla Ltd. 1.48
Ultratech Cement Ltd. 1.17
Coal India Ltd. 1.14
Bajaj Finserv Ltd. 1.12
Bajaj Finance Ltd. 1.11
Larsen & Toubro Ltd. 1.08
HDFC Ltd. 1.08
State Bank Of India 1.06
Oil & Natural Gas Corporation Ltd. 1.06
Adani Ports And Special Economic Zone Ltd. 1.05
Titan Company Ltd. 1.05
UPL Ltd. 1.03
Grasim Industries Ltd. 1.02
Hero Motocorp Ltd. 1.02
Bharat Petroleum Corporation Ltd. 1.02
Bharti Airtel Ltd. 1.01
ICICI Bank Ltd. 1.01
NTPC Ltd. 1.01
Maruti Suzuki India Ltd. 1.00
Axis Bank Ltd. 0.99
Indian Oil Corporation Ltd. 0.98
Tata Motors Ltd. 0.97
Gail (India) Ltd. 0.97
Bajaj Auto Ltd. 0.95
Mahindra & Mahindra Ltd. 0.95
Reliance Industries Ltd. 0.94
Hindalco Industries Ltd. 0.93
Indiabulls Housing Finance Ltd. 0.93
Tata Steel Ltd. 0.92
Eicher Motors Ltd. 0.91
JSW Steel Ltd. 0.90
Asian Paints Ltd. 0.90
ITC Ltd. 0.89
Sun Pharmaceutical Industries Ltd. 0.89
Vedanta Ltd. 0.86
Indusind Bank Ltd. 0.85
Bharti Infratel Ltd. 0.81
Zee Entertainment Enterprises Ltd. 0.77
Yes Bank Ltd. 0.51
Total 97.84
Cash, Cash Equivalents And Others 2.16
Grand Total 100.00
97.84
2.16

29
Option NAV ( )`
Reg-Plan-Dividend 10.0824
Reg-Plan-Growth 10.0808
Dir-Plan-Dividend 10.3401
Dir-Plan-Growth 10.3498
NET ASSET VALUE
Investors understand that their principal
will be at Moderately High risk
�
�
Long term capital appreciation.
Investment in SBI - ETF Gold.
SBI Gold FundThis product is suitable for investors who are seeking^:
Investment Objective
The scheme seeks to provide returns that
closely correspond to returns provided by
SBI - ETF Gold (erstwhile known as SBI
Gold Exchange Traded Scheme).
Fund Details
PORTFOLIO CLASSIFICATION BY (%)ASSET ALLOCATION
•
•
•
•
•
•
•
•
•
•
•
•
•
•
•
Type of Scheme
Date of Allotment:
Report As On:
AAUM for the May 2019
AUM as on
Fund Manager: Mr. Raviprakash
Sharma
Managing Since:
Total Experience:
Benchmark:
Exit Load:
Entry Load:
Plans Available:
Options:
SIP
Minimum Investment
Additional Investment
An open-ended Fund of Fund Scheme
investing in SBI-ETF Gold
12/09/2011
304.68 Crores
304.96 Crores
Sep-2011
Over 19 years
Price of Physical Gold
Exit within 1 year from the
date of allotment – 1%.
Exit after 1 year from the date of
allotment - Nil
N.A.
Regular, Direct
Growth, Dividend
5000 & in multiples of 1
1000 & in multiples of 1
31/05/2019
Any Day SIP’ Facility is available for Monthly,
Quarterly, Semi-Annual and Annual
frequencies through electronic mode like
OTM / Debit Mandate. Default SIP date will
be 10th. In case the SIP due date is a Non
Business Day, then the immediate following
Business Day will be considered for SIP
processing.
Weekly - Minimum 1000 & in multiples of
1 thereafter for a minimum of 6
instalments.
Monthly - Minimum 1000 & in multiples
of 1 thereafter for minimum six months
(or) minimum 500 & in multiples of 1
thereafter for minimum one year.
Quarterly - Minimum 1500 & in multiples
of 1 thereafter for minimum one year.
Semi Annual - Minimum 3000 & in
multiples of 1 thereafter for a minimum of
4 installments.
Annual - Minimum 5000 & in multiples of
1 thereafter for a minimum of 4
installments.
Month of
`
`
` `
` `
May 31, 2019
`
`
`
`
` `
`
`
`
`
`
`
Mutual Fund Units Cash, Cash Equivalents and Others
PORTFOLIO
Exchange Traded Funds
SBI-ETF Gold 99.79
Total 99.79
Cash, Cash Equivalents And Others 0.21
Grand Total 100.00
Mutual Fund Units (%) Of Total AUM
^Investors should consult their financial advisers if in doubt about whether the product is suitablefor them.
FUND OF FUND
99.79
0.21
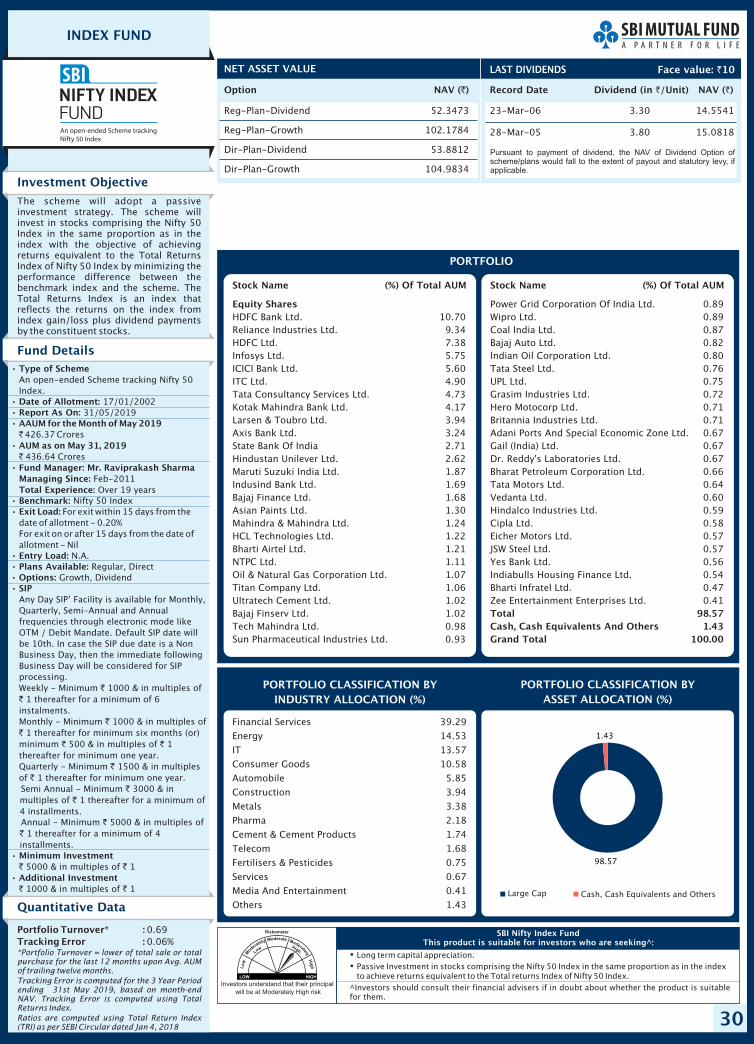
30
INDEX FUND
Option NAV ( )`
Reg-Plan-Dividend 52.3473
Reg-Plan-Growth 102.1784
Dir-Plan-Dividend 53.8812
Dir-Plan-Growth 104.9834
NET ASSET VALUE
Investors understand that their principal
will be at Moderately High risk
�
�
Long term capital appreciation.
Passive Investment in stocks comprising the Nifty 50 Index in the same proportion as in the indexto achieve returns equivalent to the Total returns Index of Nifty 50 Index.
SBI Nifty Index FundThis product is suitable for investors who are seeking^:
Investment Objective
Quantitative Data
The scheme will adopt a passiveinvestment strategy. The scheme willinvest in stocks comprising the Nifty 50Index in the same proportion as in theindex with the objective of achievingreturns equivalent to the Total ReturnsIndex of Nifty 50 Index by minimizing theperformance difference between thebenchmark index and the scheme. TheTotal Returns Index is an index thatreflects the returns on the index fromindex gain/loss plus dividend paymentsby the constituent stocks.
Fund Details
Portfolio Turnover* :
Tracking Error :
0.69
0.06%*Portfolio Turnover = lower of total sale or totalpurchase for the last 12 months upon Avg. AUMof trailing twelve months.
Tracking Error is computed for the 3 Year Periodending , based on month-endNAV. Tracking Error is computed using TotalReturns Index.
Ratios are computed using Total Return Index(TRI) as per SEBI Circular dated Jan 4, 2018
31st May 2019
PORTFOLIO CLASSIFICATION BY
(%)ASSET ALLOCATION
Financial Services 39.29
Energy 14.53
IT 13.57
Consumer Goods 10.58
Automobile 5.85
Construction 3.94
Metals 3.38
Pharma 2.18
Cement & Cement Products 1.74
Telecom 1.68
Fertilisers & Pesticides 0.75
Services 0.67
Media And Entertainment 0.41
Others 1.43
•
•
•
•
•
•
•
•
•
•
•
•
•
•
Type of Scheme
Date of Allotment:
Report As On:
AAUM for the May 2019
AUM as on May 31, 2019
Fund Manager: Mr. Raviprakash Sharma
Managing Since:
Total Experience:
Benchmark:
Exit Load:
Entry Load:
Plans Available:
Options:
SIP
Minimum Investment
Additional Investment
An open-ended Scheme tracking Nifty 50
Index.
17/01/2002
31/05/2019
426.37 Crores
436.64 Crores
Feb-2011
Over 19 years
Nifty 50 Index
For exit within 15 days from the
date of allotment - 0.20%
For exit on or after 15 days from the date of
allotment - Nil
N.A.
Regular, Direct
Growth, Dividend
Any Day SIP’ Facility is available for Monthly,
Quarterly, Semi-Annual and Annual
frequencies through electronic mode like
OTM / Debit Mandate. Default SIP date will
be 10th. In case the SIP due date is a Non
Business Day, then the immediate following
Business Day will be considered for SIP
processing.
Weekly - Minimum 1000 & in multiples of
1 thereafter for a minimum of 6
instalments.
Monthly - Minimum 1000 & in multiples of
1 thereafter for minimum six months (or)
minimum 500 & in multiples of 1
thereafter for minimum one year.
Quarterly - Minimum 1500 & in multiples
of 1 thereafter for minimum one year.
Semi Annual - Minimum 3000 & in
multiples of 1 thereafter for a minimum of
4 installments.
Annual - Minimum 5000 & in multiples of
1 thereafter for a minimum of 4
installments.
5000 & in multiples of 1
1000 & in multiples of 1
Month of
`
`
`
`
`
`
` `
`
`
`
`
`
`
` `
` `
PORTFOLIO CLASSIFICATION BY
INDUSTRY ALLOCATION (%)
PORTFOLIO
Equity Shares
HDFC Bank Ltd. 10.70
Reliance Industries Ltd. 9.34
HDFC Ltd. 7.38
Infosys Ltd. 5.75
ICICI Bank Ltd. 5.60
ITC Ltd. 4.90
Tata Consultancy Services Ltd. 4.73
Kotak Mahindra Bank Ltd. 4.17
Larsen & Toubro Ltd. 3.94
Axis Bank Ltd. 3.24
State Bank Of India 2.71
Hindustan Unilever Ltd. 2.62
Maruti Suzuki India Ltd. 1.87
Indusind Bank Ltd. 1.69
Bajaj Finance Ltd. 1.68
Asian Paints Ltd. 1.30
Mahindra & Mahindra Ltd. 1.24
HCL Technologies Ltd. 1.22
Bharti Airtel Ltd. 1.21
NTPC Ltd. 1.11
Oil & Natural Gas Corporation Ltd. 1.07
Titan Company Ltd. 1.06
Ultratech Cement Ltd. 1.02
Bajaj Finserv Ltd. 1.02
Tech Mahindra Ltd. 0.98
Sun Pharmaceutical Industries Ltd. 0.93
Stock Name (%) Of Total AUMStock Name (%) Of Total AUM
Power Grid Corporation Of India Ltd. 0.89
Wipro Ltd. 0.89
Coal India Ltd. 0.87
Bajaj Auto Ltd. 0.82
Indian Oil Corporation Ltd. 0.80
Tata Steel Ltd. 0.76
UPL Ltd. 0.75
Grasim Industries Ltd. 0.72
Hero Motocorp Ltd. 0.71
Britannia Industries Ltd. 0.71
Adani Ports And Special Economic Zone Ltd. 0.67
Gail (India) Ltd. 0.67
Dr. Reddy's Laboratories Ltd. 0.67
Bharat Petroleum Corporation Ltd. 0.66
Tata Motors Ltd. 0.64
Vedanta Ltd. 0.60
Hindalco Industries Ltd. 0.59
Cipla Ltd. 0.58
Eicher Motors Ltd. 0.57
JSW Steel Ltd. 0.57
Yes Bank Ltd. 0.56
Indiabulls Housing Finance Ltd. 0.54
Bharti Infratel Ltd. 0.47
Zee Entertainment Enterprises Ltd. 0.41
Total 98.57
Cash, Cash Equivalents And Others 1.43
Grand Total 100.00
^Investors should consult their financial advisers if in doubt about whether the product is suitablefor them.
Record Date Dividend NAV ( )`(in /Unit)`
23-Mar-06 3.30 14.5541
28-Mar-05 3.80 15.0818
LAST DIVIDENDS Face value: 10`
Pursuant to payment of dividend, the NAV of Dividend Option ofscheme/plans would fall to the extent of payout and statutory levy, ifapplicable.
Large Cap Cash, Cash Equivalents and Others
98.57
1.43

Fu
nd
Deta
ils a
s o
n M
ay 3
1, 2019
Schem
eSBI
Dynam
ic A
sset
Allocati
on F
und
SBI
Eq
uit
ySavin
gs F
und
SBI
Arb
itra
ge
Op
port
unit
ies
Fund
Ideal In
vestm
ent
Hori
zon
3years
+3
years
+2
years
+2
years
+3
years
+1
year
3m
onth
s
Incep
tion D
ate
09/10/1995
26
/0
3/2
01
50
9/0
4/2
00
12
1/1
2/2
00
52
1/0
2/2
00
22
7/0
5/2
01
50
3/1
1/2
00
6
Fund
Manag
er
Mr.
R.
Sri
niv
asan -
Equit
yM
r. D
inesh A
huja
- D
ebt
Mr.
Din
esh B
ala
chandra
n- E
quit
y&
Equit
y r
ela
ted instr
um
ents
&D
ebt
and M
oney M
ark
et
Instr
um
ents
port
ion- M
r. M
ohit
Jain
- investm
ents
in f
ore
ign
securi
ties o
f th
e S
chem
e.
Mr.
Ruchit
Mehta
-Equit
yM
r. D
inesh A
huja
-D
ebt
Mr.
Gaura
vM
ehta
Mr.
Raje
ev
Radhakri
shnan
Mr.
Neera
j K
um
ar
-A
rbit
rage P
ort
ion
Mr.
Ruchit
Mehta
-Equit
y, D
ebt
Mr.
Neera
j K
um
ar
Manag
ing
Sin
ce
Jan-2012
Mar-
20
15
July
-2
01
1Feb-2
01
9Ju
n-2
00
8M
ay-2
01
5O
ct-
20
12
Benchm
ark
CRIS
IL H
ybri
d 3
5+
65 -
Aggre
ssiv
e Index
50
% C
RIS
IL 1
year
CD
Index +
50
% S
&P B
SE S
ensex
NIF
TY 5
0 H
ybri
dC
om
posit
e D
ebt
15
:85
Index (
w.e
.f June 2
5,2
01
8)
Snap
shot
of
Hyb
rid
Fund
s &
Solu
tion O
riente
d F
und
s
SBI
Eq
uit
y H
yb
rid
Fund
(Pre
vio
usly
know
nas S
BI
Magnum
Bala
nced F
und)
Month
End
AU
M (
Rs. in
Cro
res)
`30,0
08.1
3 C
rore
s`6
69
.52
Cro
res
`1
,20
6.1
2 C
rore
s`2
71
.56 C
rore
s`6
3.4
6 C
rore
s`2
,07
5.2
6 C
rore
s`2
,70
6.1
8 C
rore
s
- - -
Sta
nd
ard
Devia
tion
#0
.50
%
Beta
#0
.37
Sharp
e R
ati
o#
0.0
2
Exp
ense R
ati
oRegula
r- 1
.64%
Dir
ect-
1.0
8%
Regula
r- 2
.24
%D
irect-
0.9
9%
Regula
r- 1
.72
%D
irect-
1.1
2%
Regula
r- 1
.81
%D
irect-
1.2
1%
Regula
r- 2
.24
%D
irect-
1.4
4%
Regula
r- 1
.67
%D
irect-
1.0
0%
Regula
r- 0
.88
%D
irect-
0.4
3%
4.3
1
6.1
6
8.8
3
9.4
3%
1.0
4
0.6
5
7.1
2%
0.8
3
0.3
1
- - -
- - -
- - -
- - -
- - -
3.2
2
4.5
1
8.4
4
- - -
3.5
4
5.0
5
14
.41
- - -
Co
mp
osit
ion
by R
ati
ng
s &
Assets
as o
n M
ay 3
1, 2019
54
.38
10
.74
3.1
1
6.0
0
- -
5.1
4
20
.62
Exit
Load
For
10
% o
f th
ein
vestm
ents
wit
hin
1Year
–N
il;
For
the r
em
ain
ing
For
exit
on o
r befo
re 1
2 m
onth
s f
rom
the d
ate
of
allotm
ent:
- F
or
8%
of
investm
ent-
Nil;
For
rem
ain
ing
investm
ents
: 1
%;
For
exit
aft
er
12
month
s f
rom
the d
ate
of
allotm
ent:
Nil
For
10%
of
the
investm
ents
wit
hin
1Year
–N
il;For
the
rem
ain
ing
investm
ents
-1.0
0%
For10%
ofth
ein
vest
ments
within
1Year–
Nil;Forth
ere
main
ing
invest
ments
-1.0
0%
Wit
hin
1 y
ear
- 3
%;
Wit
hin
2 y
ears
- 2
%;
Wit
hin
3 y
ears
- 1
%
For
exit
on
or
befo
re15
days
from
the
date
of
allotm
ent
–0.1
0%
For
exit
aft
er
15
days
from
the
date
of
allotm
ent
–N
il
Wit
hin
1M
onth
-0.5
0%
Larg
e C
ap
Mid
Cap
Sm
all C
ap
AA
, A
A+
, A
AA
And
EQ
UIV
ALEN
T
Belo
w A
A
Sovere
ign
Belo
w A
1+
, A
1+
Cash, C
ash E
quiv
ale
nts
And
Oth
ers
Oth
er
Deta
ils
Co
mp
osit
ion
by
Assets
as o
n M
ay 3
1, 2019
Eq
uit
y S
hare
s
Corp
ora
te D
eb
t
Gilts
Money M
ark
et
Instr
um
ents
Oth
er
Assets
72.8
2
18.1
3
5.6
9
-
3.3
6
45
.08
- - -
54
.92
24
.96
66
.23
6.3
1
-
2.5
0
40
.65
-
37
.35
-
22
.00
22
.04
59
.07
- -
18
.89
71
.92
15
.42
0.7
2
-
11
.93
68
.23
6.0
0
-
5.1
4
20
.62
56.1
6
9.1
9
7.4
6
16.0
1
2.1
2
6.3
2
-
2.7
2
45
.08
- - - - - -
54
.92
15
.49
1.7
8
7.7
0
51
.90
14
.33
6.3
1
-
2.5
0
37
.50
3.1
5
- - -
37
.35
-
Oth
ers
78
.00 ,
16
.04
Gold
7.5
3
5.1
9
9.3
3
41
.11
17
.96
8.1
1
-
10
.77
62
.17
4.1
9
5.5
7
13
.91
1.5
1
0.7
2
-
11
.93
Ple
ase
consu
lt y
our
financia
l advis
or
befo
re invest
ing.
For
deta
ils,
ple
ase
refe
r to
resp
ecti
ve p
age o
f th
e s
chem
e.
Sourc
e: C
RIS
IL F
und A
naly
ser
Ris
k F
ree r
ate
: FBIL
Overn
ight
Mib
or
rate
()
Basi
s fo
r R
ati
o C
alc
ula
tion:
3 Y
ears
Month
ly D
ata
Poin
ts
Expense
rati
o inclu
des
GST,
Base
TER a
nd a
ddit
ional expense
s as
per
regula
tion 5
2(6
A)(
b)
and 5
2(6
A)(
c)
of
SEBI (M
F)
regula
tions
for
both
Dir
ect
and R
egula
r pla
n
#6.0
0%
as
on 3
1st
May 2
01
9
Mod
ifie
d D
ura
tion
Avera
ge M
atu
rity
Yie
ld t
o M
atu
rity
(%
)(years
)
(years
)
Nifty
Equity
Savi
ngs
I ndex.(w
.e.f
August
10,2
018)
Nif
ty 5
0 A
rbit
rage
Index.
(w.e
.f M
ay 1
6,2
01
8)
SBI
Magnum
Child
ren’s
Benefi
t Fund
(Pre
vio
usly
know
n a
s S
BI M
agnum
Childre
n’s
Benefi
t Pla
n)
SBI
Deb
t H
yb
rid
Fund
(Pre
vio
usly
know
n a
s S
BI
Magnum
Month
ly Incom
ePla
n)
SBI
Mult
i A
sset
Allocati
on
Fund
(Pre
vio
usly
know
n a
sSBI M
agnum
Month
lyIn
com
e P
lan -
Flo
ate
r)
1/3
NIF
TY+
1/3
CR
ISIL
Com
posit
e B
ond F
und
Index+
1/3
Pri
ce o
fG
old
.(w
.e.f
May 1
6,2
01
8)
NIF
TY 5
0 H
ybri
dC
om
posit
e D
ebt
15
:85
Index
(w.e
.f June 2
5,2
01
8)
- -
31
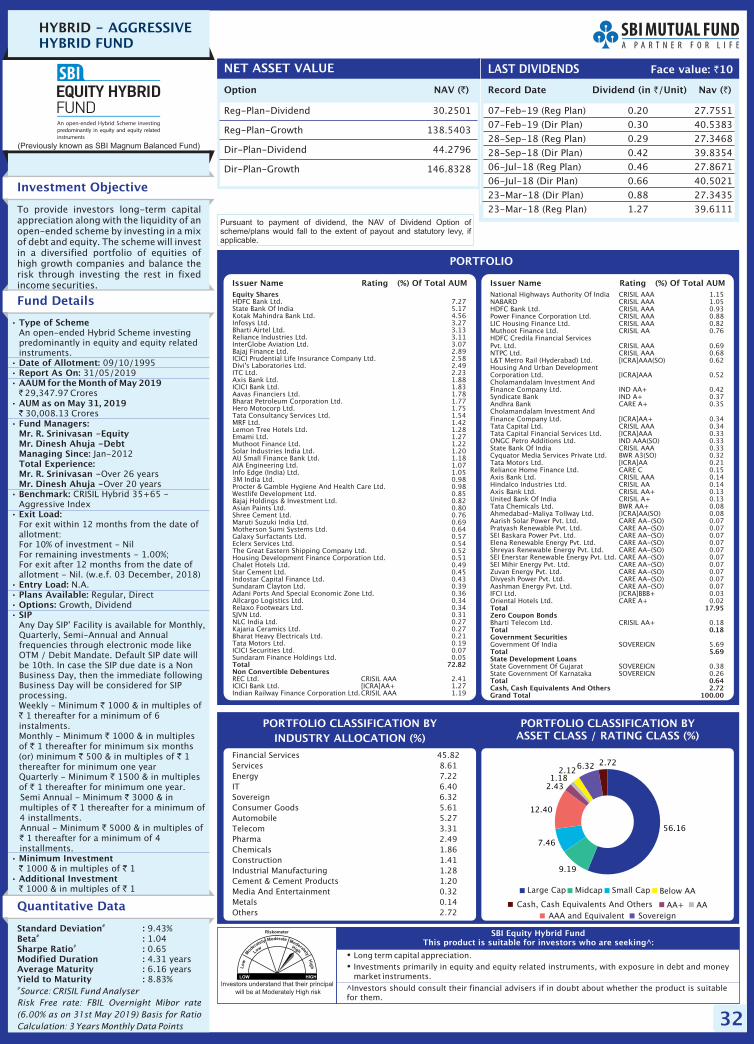
32
HYBRID - AGGRESSIVEHYBRID FUND
Option NAV ( )`
Reg-Plan-Dividend 30.2501
Reg-Plan-Growth 138.5403
Dir-Plan-Dividend 44.2796
Dir-Plan-Growth 146.8328
NET ASSET VALUE
Record Date Dividend Nav ( )`(in /Unit)`
07-Feb-19 (Reg Plan) 0.20 27.7551
07-Feb-19 (Dir Plan) 0.30 40.5383
28-Sep-18 (Reg Plan) 0.29 27.3468
28-Sep-18 (Dir Plan) 0.42 39.8354
06-Jul-18 (Reg Plan) 0.46 27.8671
06-Jul-18 (Dir Plan) 0.66 40.5021
23-Mar-18 (Dir Plan) 0.88 27.3435
23-Mar-18 (Reg Plan) 1.27 39.6111
LAST DIVIDENDS
Investors understand that their principal
will be at Moderately High risk
�
�
Long term capital appreciation.
Investments primarily in equity and equity related instruments, with exposure in debt and moneymarket instruments.
SBI Equity Hybrid FundThis product is suitable for investors who are seeking^:
Face value: 10`
Investment Objective
Quantitative Data
To provide investors long-term capitalappreciation along with the liquidity of anopen-ended scheme by investing in a mixof debt and equity. The scheme will investin a diversified portfolio of equities ofhigh growth companies and balance therisk through investing the rest in fixedincome securities.
Fund Details
Standard Deviation :Beta :Sharpe Ratio :
#
#
#
9.43%1.040.654.31Modified Duration :
Average Maturity :Yield to Maturity :
years6.16 years8.83%
#Source: CRISIL Fund Analyser
Risk Free rate: FBIL Overnight Mibor rate
(6.00% as on 31st May 2019) Basis for Ratio
Calculation: 3 Years Monthly Data Points
PORTFOLIO
Equity Shares
Total 72.82Non Convertible Debentures
HDFC Bank Ltd. 7.27State Bank Of India 5.17Kotak Mahindra Bank Ltd. 4.56Infosys Ltd. 3.27Bharti Airtel Ltd. 3.13Reliance Industries Ltd. 3.11InterGlobe Aviation Ltd. 3.07Bajaj Finance Ltd. 2.89ICICI Prudential Life Insurance Company Ltd. 2.58Divi's Laboratories Ltd. 2.49ITC Ltd. 2.23Axis Bank Ltd. 1.88ICICI Bank Ltd. 1.83Aavas Financiers Ltd. 1.78Bharat Petroleum Corporation Ltd. 1.77Hero Motocorp Ltd. 1.75Tata Consultancy Services Ltd. 1.54MRF Ltd. 1.42Lemon Tree Hotels Ltd. 1.28Emami Ltd. 1.27Muthoot Finance Ltd. 1.22Solar Industries India Ltd. 1.20AU Small Finance Bank Ltd. 1.18AIA Engineering Ltd. 1.07Info Edge (India) Ltd. 1.053M India Ltd. 0.98Procter & Gamble Hygiene And Health Care Ltd. 0.98Westlife Development Ltd. 0.85Bajaj Holdings & Investment Ltd. 0.82Asian Paints Ltd. 0.80Shree Cement Ltd. 0.76Maruti Suzuki India Ltd. 0.69Motherson Sumi Systems Ltd. 0.64Galaxy Surfactants Ltd. 0.57Eclerx Services Ltd. 0.54The Great Eastern Shipping Company Ltd. 0.52Housing Development Finance Corporation Ltd. 0.51Chalet Hotels Ltd. 0.49Star Cement Ltd. 0.45Indostar Capital Finance Ltd. 0.43Sundaram Clayton Ltd. 0.39Adani Ports And Special Economic Zone Ltd. 0.36Allcargo Logistics Ltd. 0.34Relaxo Footwears Ltd. 0.34SJVN Ltd. 0.31NLC India Ltd. 0.27Kajaria Ceramics Ltd. 0.27Bharat Heavy Electricals Ltd. 0.21Tata Motors Ltd. 0.19ICICI Securities Ltd. 0.07Sundaram Finance Holdings Ltd. 0.05
REC Ltd. CRISIL AAA 2.41ICICI Bank Ltd. [ICRA]AA+ 1.27Indian Railway Finance Corporation Ltd.CRISIL AAA 1.19
National Highways Authority Of India CRISIL AAA 1.15NABARD CRISIL AAA 1.05HDFC Bank Ltd. CRISIL AAA 0.93Power Finance Corporation Ltd. CRISIL AAA 0.88LIC Housing Finance Ltd. CRISIL AAA 0.82Muthoot Finance Ltd. CRISIL AA 0.76HDFC Credila Financial ServicesPvt. Ltd. CRISIL AAA 0.69NTPC Ltd. CRISIL AAA 0.68L&T Metro Rail (Hyderabad) Ltd. [ICRA]AAA(SO) 0.62Housing And Urban DevelopmentCorporation Ltd. [ICRA]AAA 0.52Cholamandalam Investment AndFinance Company Ltd. IND AA+ 0.42Syndicate Bank IND A+ 0.37Andhra Bank CARE A+ 0.35Cholamandalam Investment AndFinance Company Ltd. [ICRA]AA+ 0.34Tata Capital Ltd. CRISIL AAA 0.34Tata Capital Financial Services Ltd. [ICRA]AAA 0.33ONGC Petro Additions Ltd. IND AAA(SO) 0.33State Bank Of India CRISIL AAA 0.33Cyquator Media Services Private Ltd. BWR A3(SO) 0.32Tata Motors Ltd. [ICRA]AA 0.21Reliance Home Finance Ltd. CARE C 0.15Axis Bank Ltd. CRISIL AAA 0.14Hindalco Industries Ltd. CRISIL AA 0.14Axis Bank Ltd. CRISIL AA+ 0.13United Bank Of India CRISIL A+ 0.13Tata Chemicals Ltd. BWR AA+ 0.08Ahmedabad-Maliya Tollway Ltd. [ICRA]AA(SO) 0.08Aarish Solar Power Pvt. Ltd. CARE AA-(SO) 0.07Pratyash Renewable Pvt. Ltd. CARE AA-(SO) 0.07SEI Baskara Power Pvt. Ltd. CARE AA-(SO) 0.07Elena Renewable Energy Pvt. Ltd. CARE AA-(SO) 0.07Shreyas Renewable Energy Pvt. Ltd. CARE AA-(SO) 0.07SEI Enerstar Renewable Energy Pvt. Ltd. CARE AA-(SO) 0.07SEI Mihir Energy Pvt. Ltd. CARE AA-(SO) 0.07Zuvan Energy Pvt. Ltd. CARE AA-(SO) 0.07Divyesh Power Pvt. Ltd. CARE AA-(SO) 0.07Aashman Energy Pvt. Ltd. CARE AA-(SO) 0.07IFCI Ltd. [ICRA]BBB+ 0.03Oriental Hotels Ltd. CARE A+ 0.02
Bharti Telecom Ltd. CRISIL AA+ 0.18
Government Of India SOVEREIGN 5.69
State Government Of Gujarat SOVEREIGN 0.38State Government Of Karnataka SOVEREIGN 0.26
Total 17.95Zero Coupon Bonds
Total 0.18Government Securities
Total 5.69State Development Loans
Total 0.64Cash, Cash Equivalents And Others 2.72Grand Total 100.00
PORTFOLIO CLASSIFICATION BYASSET CLASS / RATING CLASS (%)
Financial Services 45.82
Services 8.61
Energy 7.22
IT 6.40
Sovereign 6.32
Consumer Goods 5.61
Automobile 5.27
Telecom 3.31
Pharma 2.49
Chemicals 1.86
Construction 1.41
Industrial Manufacturing 1.28
Cement & Cement Products 1.20
Media And Entertainment 0.32
Metals 0.14
Others 2.72
Pursuant to payment of dividend, the NAV of Dividend Option ofscheme/plans would fall to the extent of payout and statutory levy, ifapplicable.
•
•
•
•
•
•
•
•
•
•
•
•
•
•
Type of Scheme
Date of Allotment:Report As On:AAUM for the May 2019
AUM as on May 31, 2019
Fund Managers:Mr. R. Srinivasan -EquityMr. Dinesh Ahuja -DebtManaging Since:Total Experience:Mr. R. Srinivasan -Mr. Dinesh Ahuja -Benchmark:
Exit Load:
Entry Load:Plans Available:Options:SIP
Minimum Investment
Additional Investment
An open-ended Hybrid Scheme investingpredominantly in equity and equity relatedinstruments.
09/10/199531/05/2019
29,347.97 Crores
30,008.13 Crores
Jan-2012
Over 26 yearsOver 20 years
CRISIL Hybrid 35+65 -Aggressive Index
For exit within 12 months from the date ofallotment:For 10% of investment - NilFor remaining investments - 1.00%;For exit after 12 months from the date ofallotment - Nil. (w.e.f. 03 December, 2018)
N.A.Regular, Direct
Growth, Dividend
Any Day SIP’ Facility is available for Monthly,Quarterly, Semi-Annual and Annualfrequencies through electronic mode likeOTM / Debit Mandate. Default SIP date willbe 10th. In case the SIP due date is a NonBusiness Day, then the immediate followingBusiness Day will be considered for SIPprocessing.Weekly - Minimum 1000 & in multiples of
1 thereafter for a minimum of 6instalments.Monthly - Minimum 1000 & in multiplesof 1 thereafter for minimum six months(or) minimum 500 & in multiples of 1thereafter for minimum one yearQuarterly - Minimum 1500 & in multiplesof 1 thereafter for minimum one year.Semi Annual - Minimum 3000 & inmultiples of 1 thereafter for a minimum of4 installments.Annual - Minimum 5000 & in multiples of
1 thereafter for a minimum of 4installments.
1000 & in multiples of 1
1000 & in multiples of 1
Month of`
`
`
`
`
`
` `
`
`
`
`
`
`
` `
` `
PORTFOLIO CLASSIFICATION BY
INDUSTRY ALLOCATION (%)
Issuer Name Rating (%) Of Total AUM Issuer Name Rating (%) Of Total AUM
^Investors should consult their financial advisers if in doubt about whether the product is suitablefor them.
(Previously known as SBI Magnum Balanced Fund)
Large Cap Midcap Small Cap Below AA
Cash, Cash Equivalents And Others AA+ AA
AAA and Equivalent Sovereign
56.16
9.19
7.46
12.40
2.431.18
2.126.32 2.72
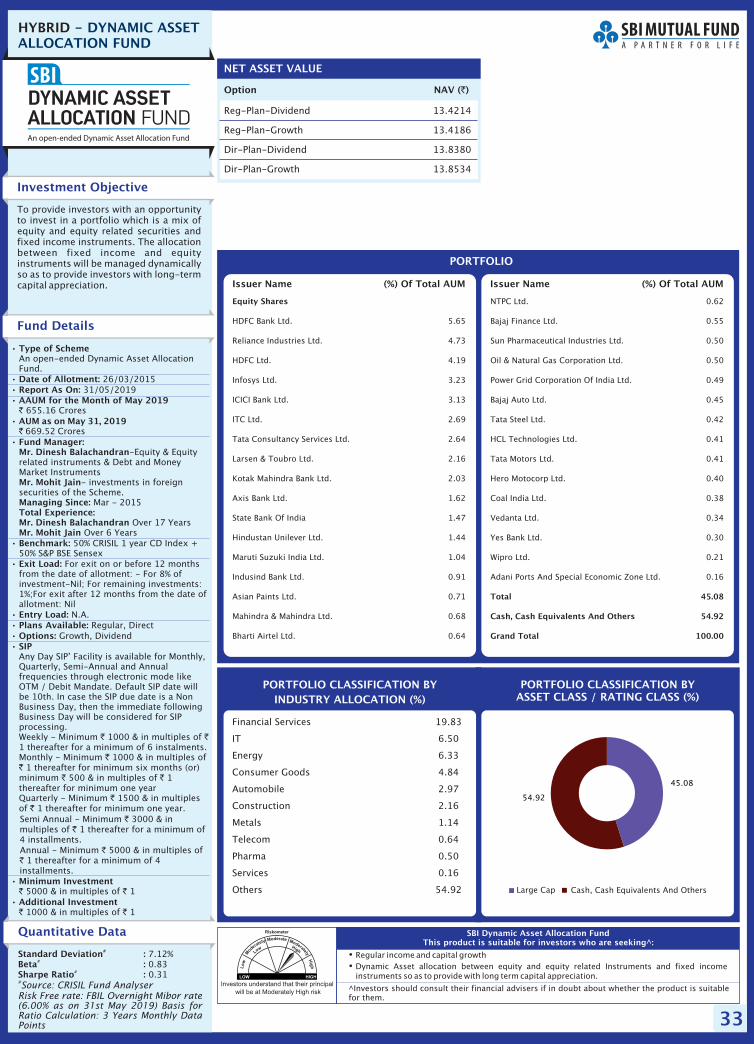
33
HYBRID - DYNAMIC ASSETALLOCATION FUND
Option NAV ( )`
Reg-Plan-Dividend 13.4214
Reg-Plan-Growth 13.4186
Dir-Plan-Dividend 13.8380
Dir-Plan-Growth 13.8534
NET ASSET VALUE
Investors understand that their principal
will be at Moderately High risk
�
�
Regular income and capital growth
Dynamic Asset allocation between equity and equity related Instruments and fixed incomeinstruments so as to provide with long term capital appreciation.
SBI Dynamic Asset Allocation FundThis product is suitable for investors who are seeking^:
Investment Objective
To provide investors with an opportunityto invest in a portfolio which is a mix ofequity and equity related securities andfixed income instruments. The allocationbetween fixed income and equityinstruments will be managed dynamicallyso as to provide investors with long-termcapital appreciation.
Fund Details
PORTFOLIO
Equity Shares
HDFC Bank Ltd. 5.65
Reliance Industries Ltd. 4.73
HDFC Ltd. 4.19
Infosys Ltd. 3.23
ICICI Bank Ltd. 3.13
ITC Ltd. 2.69
Tata Consultancy Services Ltd. 2.64
Larsen & Toubro Ltd. 2.16
Kotak Mahindra Bank Ltd. 2.03
Axis Bank Ltd. 1.62
State Bank Of India 1.47
Hindustan Unilever Ltd. 1.44
Maruti Suzuki India Ltd. 1.04
Indusind Bank Ltd. 0.91
Asian Paints Ltd. 0.71
Mahindra & Mahindra Ltd. 0.68
Bharti Airtel Ltd. 0.64
NTPC Ltd. 0.62
Bajaj Finance Ltd. 0.55
Sun Pharmaceutical Industries Ltd. 0.50
Oil & Natural Gas Corporation Ltd. 0.50
Power Grid Corporation Of India Ltd. 0.49
Bajaj Auto Ltd. 0.45
Tata Steel Ltd. 0.42
HCL Technologies Ltd. 0.41
Tata Motors Ltd. 0.41
Hero Motocorp Ltd. 0.40
Coal India Ltd. 0.38
Vedanta Ltd. 0.34
Yes Bank Ltd. 0.30
Wipro Ltd. 0.21
Adani Ports And Special Economic Zone Ltd. 0.16
Total 45.08
Cash, Cash Equivalents And Others 54.92
Grand Total 100.00
PORTFOLIO CLASSIFICATION BYASSET CLASS / RATING CLASS (%)
•
•
•
•
•
•
•
•
•
•
•
•
•
•
Type of Scheme
Date of Allotment:Report As On:AAUM for the May 2019
AUM as on May 31, 2019
Fund Manager:Mr. Dinesh Balachandran
Mr. Mohit Jain
Managing Since:Total Experience:Mr. Dinesh BalachandranMr. Mohit JainBenchmark:
Exit Load:
Entry Load:Plans Available:Options:SIP
Minimum Investment
Additional Investment
An open-ended Dynamic Asset AllocationFund.
26/03/201531/05/2019
655.16 Crores
669.52 Crores
-Equity & Equityrelated instruments & Debt and MoneyMarket Instruments
- investments in foreignsecurities of the Scheme.
Mar - 2015
Over 17 YearsOver 6 Years
50% CRISIL 1 year CD Index +50% S&P BSE Sensex
For exit on or before 12 monthsfrom the date of allotment: - For 8% ofinvestment-Nil; For remaining investments:1%;For exit after 12 months from the date ofallotment: Nil
N.A.Regular, Direct
Growth, Dividend
Any Day SIP’ Facility is available for Monthly,Quarterly, Semi-Annual and Annualfrequencies through electronic mode likeOTM / Debit Mandate. Default SIP date willbe 10th. In case the SIP due date is a NonBusiness Day, then the immediate followingBusiness Day will be considered for SIPprocessing.Weekly - Minimum 1000 & in multiples of1 thereafter for a minimum of 6 instalments.Monthly - Minimum 1000 & in multiples of
1 thereafter for minimum six months (or)minimum 500 & in multiples of 1thereafter for minimum one yearQuarterly - Minimum 1500 & in multiplesof 1 thereafter for minimum one year.
Semi Annual - Minimum 3000 & inmultiples of 1 thereafter for a minimum of4 installments.Annual - Minimum 5000 & in multiples of
1 thereafter for a minimum of 4installments.
5000 & in multiples of 1
1000 & in multiples of 1
Month of`
`
` `
`
`
` `
`
`
`
`
`
`
` `
` `
Financial Services 19.83
IT 6.50
Energy 6.33
Consumer Goods 4.84
Automobile 2.97
Construction 2.16
Metals 1.14
Telecom 0.64
Pharma 0.50
Services 0.16
Others 54.92
PORTFOLIO CLASSIFICATION BY
INDUSTRY ALLOCATION (%)
Issuer Name (%) Of Total AUMIssuer Name (%) Of Total AUM
^Investors should consult their financial advisers if in doubt about whether the product is suitablefor them.
Cash, Cash Equivalents And OthersLarge Cap
Quantitative Data
Standard Deviation :Beta :Sharpe Ratio :
#
#
#
7.12%0.830.31
#Source: CRISIL Fund Analyser
Risk Free rate: FBIL Overnight Mibor rate(6.00% as on 31st May 2019) Basis forRatio Calculation: 3 Years Monthly DataPoints
45.08
54.92

34
HYBRID - CONSERVATIVEHYBRID FUND
Option NAV ( )` Option NAV ( )`
Reg-Plan-Growth 40.0720
Reg-Plan-Monthly Dividend 12.7515
Reg-Plan-Quarterly Dividend 12.1301
Reg-Plan-Annual Dividend 14.1345
Dir-Plan-Growth 42.3400
Dir-Plan-Monthly Dividend 15.9411
Dir-Plan-Quarterly Dividend 13.5727
Dir-Plan-Annual Dividend 16.8841
NET ASSET VALUE
Investors understand that their principal
will be at Moderate risk
�
�
Regular income and capital growth.
Investment primarily in Debt and Money market instruments and secondarily in equity and equityrelated instruments.
SBI Debt Hybrid FundThis product is suitable for investors who are seeking^:
Investment Objective
Quantitative Data
To provide the investors an opportunityto invest primarily in Debt and Moneymarket instruments and secondarily inequity and equity related instruments.
Fund Details
Modified Duration :
Average Maturity :
Yield to Maturity :
3.22
4.51 years
8.44%
years
PORTFOLIO CLASSIFICATION BYASSET CLASS / RATING CLASS (%)
Financial Services 44.31
Energy 8.27
Services 7.69
Construction 7.64
Metals 6.67
Sovereign 6.31
Consumer Goods 5.74
Telecom 5.49
IT 1.27
Automobile 1.14
Industrial Manufacturing 0.93
Cement & Cement Products 0.85
Textiles 0.84
Fertilisers & Pesticides 0.35
Others 2.50
•
•
•
•
•
•
•
•
•
•
•
•
•
•
•
Type of Scheme
Date of Allotment:
Report As On:
AAUM for the May 2019
AUM as on May 31, 2019
Fund Managers:
Mr. Ruchit Mehta Equity
Mr. Dinesh Ahuja Debt
Managing Since:
Total Experience
Mr. Ruchit Mehta
Mr. Dinesh Ahuja
Benchmark:
Exit Load:
Entry Load:
Plans Available:
Options:
SIP
Minimum Investment
Additional Investment
An open-ended Hybrid Scheme investing
predominantly in debt instruments.
09/04/2001
31/05/2019
1,195.44 Crores
1,206.12 Crores
-
-
July-2011
- Over 14 years
- Over 20 years
NIFTY 50 Hybrid Composite Debt 15:85
Index
For exit within 1 year from the
date of allotment For 10% of investment :
Nil
For remaining investment: 1.00%
For exit after one year from the date of
allotment – Nil
N.A.
Regular, Direct
Growth, Dividend
Any Day SIP’ Facility is available for Monthly,
Quarterly, Semi-Annual and Annual
frequencies through electronic mode like
OTM / Debit Mandate. Default SIP date will
be 10th. In case the SIP due date is a Non
Business Day, then the immediate following
Business Day will be considered for SIP
processing.
Weekly - Minimum 1000 & in multiples of
1 thereafter for a minimum of 6
instalments.
Monthly - Minimum 1000 & in multiples
of 1 thereafter for minimum six months
(or) minimum 500 & in multiples of 1
thereafter for minimum one year
Quarterly - Minimum 1500 & in multiples
of 1 thereafter for minimum one year.
Semi Annual - Minimum 3000 & in
multiples of 1 thereafter for a minimum of
4 installments.
Annual - Minimum 5000 & in multiples of
1 thereafter for a minimum of 4
installments.
5,000 & in multiples of 1
1,000 & in multiples of 1
Month of
`
`
`
`
`
`
` `
`
`
`
`
`
`
` `
` `
(w.e.f June 25,2018)
PORTFOLIO CLASSIFICATION BY
INDUSTRY ALLOCATION (%)
PORTFOLIO
Equity Shares
Total 24.96
Non Convertible Debentures
HDFC Bank Ltd. 1.41
Axis Bank Ltd. 1.34
Lemon Tree Hotels Ltd. 1.33
Bajaj Finance Ltd. 1.29
Larsen & Toubro Ltd. 1.29
Procter & Gamble Hygiene And Health Care Ltd. 1.27
Tata Consultancy Services Ltd. 1.27
Kotak Mahindra Bank Ltd. 1.26
InterGlobe Aviation Ltd. 1.25
ICICI Bank Ltd. 1.23
Titan Company Ltd. 1.23
Maruti Suzuki India Ltd. 1.14
Aavas Financiers Ltd. 1.12
Sheela Foam Ltd. 1.06
Dixon Technologies (India) Ltd. 1.01
Ashoka Buildcon Ltd. 0.92
The Ramco Cements Ltd. 0.85
Indian Terrain Fashions Ltd. 0.84
Bharti Airtel Ltd. 0.71
Prataap Snacks Ltd. 0.68
Bharat Heavy Electricals Ltd. 0.58
Britannia Industries Ltd. 0.48
ITD Cementation India Ltd. 0.38
PI Industries Ltd. 0.35
ELGI Equipments Ltd. 0.35
Chalet Hotels Ltd. 0.30
State Bank Of India CRISIL AAA 8.64
Hindalco Industries Ltd. CRISIL AA 6.67
National Highways AuthorityOf India CRISIL AAA 5.05
ICICI Bank Ltd. [ICRA]AA+ 4.11
HDFC Credila FinancialServices Pvt. Ltd. CRISIL AAA 4.06
Muthoot Finance Ltd. CRISIL AA 3.28
Power Finance Corporation Ltd. CRISIL AAA 2.92
Syndicate Bank IND A+ 2.52
L&T Metro Rail (Hyderabad) Ltd. [ICRA]AAA(SO) 2.18
Housing And Urban DevelopmentCorporation Ltd. [ICRA]AAA 2.14
HDFC Bank Ltd. CRISIL AAA 2.11
REC Ltd. CRISIL AAA 2.10
Reliance Industries Ltd. CRISIL AAA 2.06
Oriental Hotels Ltd. CARE A+ 1.81
AU Small Finance Bank Ltd. IND AA- 1.66
Indiabulls Housing Finance Ltd. BWR AAA 1.38
Reliance Home Finance Ltd. CARE C 1.31
Vadodara Bharuch Tollway Ltd. IND A 0.82
SEI Baskara Power Pvt. Ltd. CARE AA-(SO) 0.62
Divyesh Power Pvt. Ltd. CARE AA-(SO) 0.62
Aashman Energy Pvt. Ltd. CARE AA-(SO) 0.62
Shreyas Renewable Energy Pvt. Ltd. CARE AA-(SO) 0.62
Zuvan Energy Pvt. Ltd. CARE AA-(SO) 0.62
Pratyash Renewable Pvt. Ltd. CARE AA-(SO) 0.62
Elena Renewable Energy Pvt. Ltd. CARE AA-(SO) 0.62
Aarish Solar Power Pvt. Ltd. CARE AA-(SO) 0.62
SEI Mihir Energy Pvt. Ltd. CARE AA-(SO) 0.62
SEI Enerstar RenewableEnergy Pvt. Ltd. CARE AA-(SO) 0.62
Small Industries DevelopmentBank Of India CARE AAA 0.42
Reliance Jio Infocomm Ltd. CRISIL AAA 0.22
Bharti Telecom Ltd. CRISIL AA+ 4.57
Government Of India SOVEREIGN 6.31
Total 61.66
Zero Coupon Bonds
Total 4.57
Government Securities
Total 6.32
Cash, Cash Equivalents And Others 2.50
Grand Total 100.00
Issuer Name Rating (%) Of TotalAUM
Issuer Name Rating (%) Of TotalAUM
^Investors should consult their financial advisers if in doubt about whether the product is suitablefor them.
(Previously known as SBI Magnum MonthlyIncome Plan)
AAA and Equivalent Sovereign
Large Cap Midcap Small Cap Below AA
Cash, Cash Equivalents And Others AA+ AA
15.49
1.78
7.70
33.288.68
9.95
14.33
6.31 2.50

35
HYBRID - MULTI ASSETALLOCATION FUND
Option NAV ( )` Option NAV ( )`
Reg-Plan-Growth 26.9150
Reg-Plan-Monthly Dividend 12.4634
Reg-Plan-Quarterly Dividend 12.5925
Reg-Plan-Annual Dividend 15.2168
Dir-Plan-Growth 28.3870
Dir-Plan-Monthly Dividend 13.1744
Dir-Plan-Quarterly Dividend 14.0697
Dir-Plan-Annual Dividend 16.1737
NET ASSET VALUE
�
�
Regular income and capital growthInvestment in actively managed portfolio of multiple asset classes viz, equity, debt, gold and goldrelated instruments.
SBI Multi Asset Allocation FundThis product is suitable for investors who are seeking^:
Investment Objective
To provide the investors an opportunityto invest in an actively managed portfolioof multiple asset classes.
Fund Details
PORTFOLIO CLASSIFICATION BYASSET CLASS / RATING CLASS (%)
Sovereign 37.35
Precious Metals 16.55
Consumer Goods 9.18
Financial Services 8.52
Pharma 5.57
Cement & Cement Products 3.36
Automobile 3.14
Energy 2.82
Services 1.79
Industrial Manufacturing 1.67
Metals 1.17
Chemicals 1.15
Construction 0.69
Textiles 0.67
Telecom 0.49
It 0.44Others 5.45
•
•
•
•
•
•
•
•
•
•
•
•
•
•
Type of Scheme
Date of Allotment:
Report As On:
AAUM for the May 2019
AUM as on May 31, 2019
Fund Manager: Mr. Gaurav Mehta
Managing Since:
Total Experience:
Benchmark:
Exit Load:
Entry Load:
Plans Available:
Options:
SIP
Minimum Investment
Additional Investment
An open-ended Scheme investing in equity,
debt and gold and gold related instruments.
21/12/2005
31/05/2019
270.47 Crores
271.56 Crores
Feb-2019
Over 12 years
1/3 NIFTY+1/3 CRISIL Composite Bond Fund
Index+1/3 Price of Gold.
(w.e.f May 16,2018)
For exit within 12 months from
the date of allotment
For 10% of investments : Nil
For remaining investment: 1.00%
For exit after 12 months from the date of
allotment – Nil
N.A.
Regular, Direct
Growth, Dividend
Any Day SIP’ Facility is available for Monthly,
Quarterly, Semi-Annual and Annual
frequencies through electronic mode like
OTM / Debit Mandate. Default SIP date will
be 10th. In case the SIP due date is a Non
Business Day, then the immediate following
Business Day will be considered for SIP
processing.
Weekly - Minimum 1000 & in multiples of
1 thereafter for a minimum of 6 instalments.
Monthly - Minimum 1000 & in multiples of
1 thereafter for minimum six months (or)
minimum 500 & in multiples of 1
thereafter for minimum one year.
Quarterly - Minimum 1500 & in multiples
of 1 thereafter for minimum one year.
Semi Annual - Minimum 3000 & in
multiples of 1 thereafter for a minimumof 4
installments.
Annual - Minimum 5000 & in multiples
of 1 thereafter for a minimum of 4
installments.
5,000 & in multiples of 1
1,000 & in multiples of 1
Month of
`
`
` `
`
`
` `
`
`
` `
` `
PORTFOLIO CLASSIFICATION BY
INDUSTRY ALLOCATION (%)
PORTFOLIO
Equity Shares
Shree Cement Ltd. 1.54
Godrej Consumer Products Ltd. 1.52
Hindustan Petroleum Corporation Ltd. 1.41
Dabur India Ltd. 1.31
HDFC Life Insurance Company Ltd. 1.25
Piramal Enterprises Ltd. 1.19
Divi's Laboratories Ltd. 1.18
Pidilite Industries Ltd. 1.15
Marico Ltd. 1.12
Bajaj Holdings & Investment Ltd. 1.11
Aurobindo Pharma Ltd. 1.10
Havells India Ltd. 1.09
ICICI Lombard General Insurance Company Ltd. 1.09
Petronet Lng Ltd. 1.08
Lupin Ltd. 1.04
Ambuja Cements Ltd. 0.99
Shriram Transport Finance Company Ltd. 0.99
United Spirits Ltd. 0.96
InterGlobe Aviation Ltd. 0.94
Bank Of Baroda 0.93
Bosch Ltd. 0.91
Colgate Palmolive (India) Ltd. 0.90
United Breweries Ltd. 0.87
Container Corporation Of India Ltd. 0.85
ACC Ltd. 0.83
Avenue Supermarts Ltd. 0.82
Motherson Sumi Systems Ltd. 0.81
Ashok Leyland Ltd. 0.75
DLF Ltd. 0.69
Biocon Ltd. 0.68
ICICI Prudential Life Insurance Company Ltd. 0.68
MRF Ltd. 0.67
Page Industries Ltd. 0.67
Siemens Ltd. 0.66
SBI Life Insurance Company Ltd. 0.65
Procter & Gamble Hygiene And Health Care Ltd. 0.60
Bharat Heavy Electricals Ltd. 0.53
NMDC Ltd. 0.51
Vodafone Idea Ltd. 0.49
ABB India Ltd. 0.48
L&T Finance Holdings Ltd. 0.48
Oracle Financial Services Software Ltd. 0.44
Bandhan Bank Ltd. 0.41
HDFC Asset Management Company Ltd. 0.37
Cadila Healthcare Ltd. 0.37
Hindustan Zinc Ltd. 0.36
General Insurance Corporation Of India 0.32
NHPC Ltd. 0.32
Steel Authority Of India Ltd. 0.30
The New India Assurance Company Ltd. 0.24
Gold 16.55
Government Of India SOVEREIGN 37.35
Total 40.65
Gold
Total 16.55
Government Securities
Total 37.35
Cash, Cash Equivalents And Others 5.45
Grand Total 100.00
Issuer Name Rating (%) Of TotalAUM
Issuer Name Rating (%) Of TotalAUM
^Investors should consult their financial advisers if in doubt about whether the product is suitablefor them.
Investors understand that their principal
will be at Moderately riskHigh
(Previously known as SBI Magnum MonthlyIncome Plan - Floater)
Cash, Cash Equivalents And Others Sovereign
MidcapLarge Cap Gold
37.50
3.1537.35
5.45
16.55

36
SOLUTIONS ORIENTEDSCHEME-CHILDREN’SFUND
Option NAV ( )`
Reg-Plan-Growth 56.0357
Dir-Plan-Growth 59.2591
NET ASSET VALUE
Investors understand that their principal
will be at Moderately High risk
�
�
Regular income and capital appreciation.
Investment primarily in debt and money market instruments and secondarily in actively managedequity and equity related instruments.
SBI Magnum Children’s Benefit FundThis product is suitable for investors who are seeking^:
Investment Objective
Quantitative Data
To provide the investors an opportunityto earn regular income predominantlythrough investment in debt and moneymarket instruments and capitalappreciation through an activelymanaged equity portfolio.
Fund Details
Modified Duration :
Average Maturity :
Yield to Maturity :
3.54
5.05 years
14.41%
years
PORTFOLIO CLASSIFICATION BYASSET CLASS / RATING CLASS (%)
Financial Services 49.11
Construction 11.11
Sovereign 8.11
Energy 5.15
Consumer Goods 4.36
Metals 4.03
Industrial Manufacturing 3.00
Healthcare Services 1.50
Textiles 1.12
Paper 0.87
Automobile 0.86
Others 10.77
•
•
•
•
•
•
•
•
•
•
•
•
•
•
Type of Scheme
Date of Allotment:
Report As On:
AAUM for the May 2019
AUM as on May 31, 2019
Fund Manager:
Mr. Rajeev Radhakrishnan
Managing Since:
Total Experience:
Benchmark:
Exit Load:
Entry Load:
Plans Available:
Options:
SIP
Minimum Investment
Additional Investment
An open-ended fund for investment for
children having a lock-in for at least 5
years or till the child attains age of
majority (whichever is earlier).
21/02/2002
31/05/2019
62.77 Crores
63.46 Crores
Jun-2008
Over 17 years
NIFTY 50 Hybrid Composite Debt 15:85
Index (w.e.f June 25,2018)
Within 1 year :3%, Within 2 years :2%,
Within 3 years :1%, above 3 years: NIL.
N.A
Regular, Direct
Growth,
Any Day SIP’ Facility is available for
Monthly, Quarterly, Semi-Annual and
Annual frequencies through electronic
mode like OTM / Debit Mandate. Default
SIP date will be 10th. In case the SIP due
date is a Non Business Day, then the
immediate following Business Day will be
considered for SIP processing.
Weekly - Minimum 1000 & in multiples
of 1 thereafter for a minimum of 6
instalments.
Monthly - Minimum 1000 & in multiples
of 1 thereafter for minimum six months
(or) minimum 500 & in multiples of 1
thereafter for minimum one year
Quarterly - Minimum 1500 & in multiples
of 1 thereafter for minimum one year.
Semi Annual - Minimum 3000 & in
multiples of 1 thereafter for a minimum
of 4 installments.
Annual - Minimum 5000 & in multiples
of 1 thereafter for a minimum of 4
installments.
5,000 & in multiples of 1
1,000 & in multiples of 1
Month of
`
`
`
`
`
`
` `
`
`
`
`
`
`
` `
` `
PORTFOLIO CLASSIFICATION BY
INDUSTRY ALLOCATION (%)
PORTFOLIO
Equity Shares
Axis Bank Ltd. 1.59
Narayana Hrudayalaya Ltd. 1.50
ABB India Ltd. 1.41
ICICI Prudential Life Insurance Company Ltd. 1.22
Ahluwalia Contracts (India) Ltd. 1.18
State Bank Of India 1.11
Sadbhav Engineering Ltd. 1.08
Greenply Industries Ltd. 1.05
ICICI Bank Ltd. 1.03
Indian Terrain Fashions Ltd. 0.99
Hawkins Cookers Ltd. 0.96
The New India Assurance Company Ltd. 0.94
Bharat Heavy Electricals Ltd. 0.90
Punjab National Bank 0.89
Tamil Nadu Newsprint & Papers Ltd. 0.87
Tata Global Beverages Ltd. 0.87
Tata Motors Ltd. 0.86
ITD Cementation India Ltd. 0.85
Manpasand Beverages Ltd. 0.83
Schaeffler India Ltd. 0.69
Colgate Palmolive (India) Ltd. 0.64
Issuer Name Rating (%) Of TotalAUM
Issuer Name Rating (%) Of TotalAUM
Gujarat State Petronet Ltd. 0.43
Page Industries Ltd. 0.12
Housing And Urban DevelopmentCorporation Ltd. [ICRA]AAA 8.12
NABARD CRISIL AAA 8.10
National HighwaysAuthority Of India CRISIL AAA 7.99
ICICI Bank Ltd. [ICRA]AA+ 7.81
Syndicate Bank IND A+ 6.37
Muthoot Finance Ltd. CRISIL AA 5.07
Indostar Capital Finance Ltd. CARE AA- 4.73
Greenko Energies Pvt. Ltd. CARE A+ 4.73
Hindalco Industries Ltd. CRISIL AA 4.03
Reliance Home Finance Ltd. CARE C 2.13
State Government Of Gujarat SOVEREIGN 8.11
Total 22.04
Non Convertible Debentures
Total 59.07
State Development Loans
Total 8.12
Cash, Cash Equivalents And Others 10.77
Grand Total 100.00
^Investors should consult their financial advisers if in doubt about whether the product is suitablefor them.
(Previously known as SBI Magnum Children’sBenefit Plan)
Large Cap Midcap Small Cap Below AA
Cash, Cash Equivalents And Others AA+ AA
AAA and Equivalent Sovereign
7.53
5.19
9.33
24.21
7.819.10
17.96
8.11
10.77

37
HYBRID - EQUITY SAVINGSFUND
Investors understand that their principal
will be at Moderately High risk
�
�
Regular income & Capital appreciation.
To generate income by investing in arbitrage opportunities in the cash and derivatives segment ofthe equity market, and capital appreciation through a moderate exposure in equity.
SBI Equity Savings FundThis product is suitable for investors who are seeking^:
Investment Objective
The scheme aims to generate income byinvesting in arbitrage opportunities in thecash and derivatives segment of theequity market, and capital appreciationthrough a moderate exposure in equity.
Fund Details
PORTFOLIO CLASSIFICATION BYASSET CLASS / RATING CLASS (%)
Financial Services 39.14
Consumer Goods 10.01
Energy 8.36
IT 6.15
Services 4.77
Automobile 4.27
Telecom 4.02
Textiles 1.72
Construction 1.70
Cement & Cement Products 1.64
Metals 1.60
Industrial Manufacturing 1.44
Pharma 1.38
Sovereign 0.72
Fertilisers & Pesticides 0.60
Media And Entertainment 0.54
Others 11.93
•
•
•
•
•
•
•
•
•
•
•
•
•
•
Type of Scheme
Date of Allotment:
Report As On:
AAUM for the May 2019
AUM as on May 31, 2019
Fund Manager:
Mr. Neeraj Kumar -
Mr. Ruchit Mehta -
Managing Since:
Total Experience:
Mr. Neeraj Kumar -
Mr. Ruchit Mehta -
Benchmark:
Exit Load:
Entry Load:
Plans Available:
Options:
SIP
Minimum Investment
Additional Investment
An open-ended Scheme investing in equity,
arbitrage and debt.
27/05/2015
31/05/2019
2,076.82 Crores
2,075.26 Crores
Arbitrage portion
Equity, Debt
May-2015
Over 22 years
Over 14 years
Nifty Equity Savings Index
(w.e.f August 10,2018)
(w.e.f. 01 January 2019)
For exit on or before 15 days from the date
of allotment – 0.10% For exit after 15 days
from the date of allotment – Nil
N.A.
Regular, Direct
Growth, Dividend
Any Day SIP’ Facility is available for
Monthly, Quarterly, Semi-Annual and
Annual frequencies through electronic
mode like OTM / Debit Mandate. Default SIP
date will be 10th. In case the SIP due date is
a Non Business Day, then the immediate
following Business Day will be considered
for SIP processing.
Weekly - Minimum 1000 & in multiples of
1 thereafter for a minimum of 6
instalments.
Monthly - Minimum 1000 & in multiples
of 1 thereafter for minimum 6 months (or)
minimum 500 & in multiples of 1
thereafter for minimum one year
Quarterly - Minimum 1500 & in multiples
of 1 thereafter for minimum one year.
Semi Annual - Minimum 3000 & in
multiples of 1 thereafter for a
minimum of 4 installments.
Annual - Minimum 5000 & in multiples
of 1 thereafter for a minimum of 4
installments.
1000 & in multiples of 1
1000 & in multiples of 1
Month of
`
`
`
`
`
`
` `
`
`
`
`
`
`
` `
` `
PORTFOLIO CLASSIFICATION BY
INDUSTRY ALLOCATION (%)
PORTFOLIO
Equity SharesReliance Industries Ltd. 6.83Housing Development Finance Corporation Ltd. 5.78Axis Bank Ltd. 5.65HDFC Bank Ltd. 4.12ICICI Bank Ltd. 2.71Adani Ports And Special Economic Zone Ltd. 2.40Tata Consultancy Services Ltd. 2.39Kotak Mahindra Bank Ltd. 2.21Infosys Ltd. 1.68Bajaj Finance Ltd. 1.53ITC Ltd. 1.43State Bank Of India 1.37Larsen & Toubro Ltd. 1.15Relaxo Footwears Ltd. 1.14Ganesha Ecosphere Ltd. 1.12Tech Mahindra Ltd. 1.11Maruti Suzuki India Ltd. 1.11Asian Paints Ltd. 1.06Dixon Technologies (India) Ltd. 1.04Bharti Airtel Ltd. 1.02Ashok Leyland Ltd. 0.99Yes Bank Ltd. 0.96ICICI Prudential Life Insurance Company Ltd. 0.93Emami Ltd. 0.92Tata Steel Ltd. 0.82InterGlobe Aviation Ltd. 0.81Hindustan Unilever Ltd. 0.77Chalet Hotels Ltd. 0.71Grasim Industries Ltd. 0.68ELGI Equipments Ltd. 0.68Siemens Ltd. 0.64Sun Pharmaceutical Industries Ltd. 0.62UPL Ltd. 0.60Hero Motocorp Ltd. 0.60Indian Terrain Fashions Ltd. 0.54Sheela Foam Ltd. 0.54ACC Ltd. 0.54Bajaj Finserv Ltd. 0.51Colgate Palmolive (India) Ltd. 0.50Indusind Bank Ltd. 0.49Dabur India Ltd. 0.48Britannia Industries Ltd. 0.42The Federal Bank Ltd. 0.37Procter & Gamble Hygiene And Health Care Ltd. 0.37Mahindra & Mahindra Ltd. 0.36HCL Technologies Ltd. 0.35Newgen Software Technologies Ltd. 0.35ITD Cementation India Ltd. 0.35NTPC Ltd. 0.32Tata Global Beverages Ltd. 0.32Oil & Natural Gas Corporation Ltd. 0.31Titan Company Ltd. 0.31Lupin Ltd. 0.31Ultratech Cement Ltd. 0.30Zee Entertainment Enterprises Ltd. 0.30Motherson Sumi Systems Ltd. 0.29United Spirits Ltd. 0.27Power Grid Corporation Of India Ltd. 0.26Wipro Ltd. 0.26Coal India Ltd. 0.25Bajaj Auto Ltd. 0.24Jubilant Foodworks Ltd. 0.24
Stock Name Rating (%) Of Total AUM Stock Name Rating (%) Of Total AUMIndian Oil Corporation Ltd. 0.23Tata Motors Ltd. 0.23Mahindra & Mahindra Financial Services Ltd. 0.23Tata Communications Ltd. 0.21Gabriel India Ltd. 0.20Gail (India) Ltd. 0.20Tv Today Network Ltd. 0.20Dr. Reddy's Laboratories Ltd. 0.19Bharat Petroleum Corporation Ltd. 0.19Indiabulls Housing Finance Ltd. 0.19Vedanta Ltd. 0.17Hindalco Industries Ltd. 0.17Cipla Ltd. 0.17Eicher Motors Ltd. 0.17NCC Ltd. 0.17JSW Steel Ltd. 0.17Bharti Infratel Ltd. 0.14Godrej Consumer Products Ltd. 0.13The India Cements Ltd. 0.12Bharat Heavy Electricals Ltd. 0.11Wockhardt Ltd. 0.09Havells India Ltd. 0.09Bosch Ltd. 0.07Can Fin Homes Ltd. 0.07Sun TV Network Ltd. 0.05Page Industries Ltd. 0.05Canara Bank 0.04IDFC Ltd. 0.03IRB Infrastructure Developers Ltd. 0.03The Karnataka Bank Ltd. 0.02Raymond Ltd. 0.02Steel Authority Of India Ltd. 0.01Petronet LNG Ltd. 0.01Bharat Forge Ltd. 0.01Equitas Holdings Ltd. 0.01Century Textiles & Industries Ltd. 0.01Punjab National Bank 0.01
Muthoot Finance Ltd. CRISIL AA 3.47Housing And Urban DevelopmentCorporation Ltd. [ICRA]AAA 1.74Indian Railway Finance Corporation Ltd.CRISIL AAA 1.24REC Ltd. CRISIL AAA 0.96State Bank Of India CRISIL AA+ 0.73Tata Capital Financial Services Ltd. [ICRA]AAA 0.72Power Finance Corporation Ltd. CRISIL AAA 0.72Indostar Capital Finance Ltd. CARE AA- 0.72Indiabulls Housing Finance Ltd. BWR AAA 0.71Vadodara Bharuch Tollway Ltd. IND A 0.24Blue Dart Express Ltd. [ICRA]AA 0.07
Bharti Telecom Ltd. CRISIL AA+ 2.65KKR India Financial Services Pvt. Ltd. CRISIL AA+ 0.89Essel Corporate Resources Pvt. Ltd. BWR BBB(SO) 0.55
Government Of India SOVEREIGN 0.72
Total 71.92Non Convertible Debentures
Total 11.33Zero Coupon Bonds
Total 4.09Government Securities
Total 0.73Cash, Cash Equivalents And Others 11.93Grand Total 100.00
Option NAV ( )` Option NAV ( )`
Reg-Plan-Growth 13.2160
Reg-Plan-Monthly Dividend 12.2510
Reg-Plan-Quarterly Dividend 12.4967
Dir-Plan-Growth 14.0667
Dir-Plan-Monthly Dividend 12.8713
Dir-Plan-Quarterly Dividend 13.3243
NET ASSET VALUE
^Investors should consult their financial advisers if in doubt about whether the product is suitablefor them.
Large Cap Midcap Small Cap
Cash, Cash Equivalents And Others AA+ AA
AAA and Equivalent Below AA Sovereign
62.17
4.19
5.57
6.10
4.27
3.541.51
0.7211.93

38
HYBRID - ARBITRAGE FUND
Option NAV ( )`
Reg-Plan-Dividend 13.4428
Reg-Plan-Growth 24.3781
Dir-Plan-Dividend 14.2824
Dir-Plan-Growth 25.1726
NET ASSET VALUE
Record Date Dividend NAV ( )`(in /Unit)`
31-May-19 (Reg Plan) 0.06 13.4428
31-May-19 (Dir Plan) 0.07 14.2824
26-Apr-19 (Reg Plan) 0.06 13.3667
26-Apr-19 (Dir Plan) 0.07 14.2016
29-Mar-19 (Reg Plan) 0.06 13.3544
29-Mar-19 (Dir Plan) 0.07 14.1899
LAST DIVIDENDS
Investors understand that their principal
will be at Moderately Low risk
�
�
Short term investment.
Investments to exploit profitable arbitrage opportunities between the spot and derivative marketsegments to provide capital appreciation and regular income.
SBI Arbitrage Opportunities FundThis product is suitable for investors who are seeking^:
Face value: 10`
Investment Objective
Quantitative Data
To provide capital appreciation andregular income for unit holders byident i fy ing prof i table arbi t rageopportunities between the spot andderivative market segments as alsothrough investment of surplus cash indebt and money market instruments.
Fund Details
Standard Deviation :
Beta :
Sharpe Ratio :
Portfolio Turnover* :
#
#
#
0.50%
0.37
0.02
10.39#Source : CR IS IL Fund Ana lyser
*Portfolio Turnover = lower of total sale ortotal purchase for the last 12 monthsupon Avg. AUM of trailing twelve months.
Risk Free rate: FBIL Overnight Mibor rate(6.00% as on 31st May 2019) Basis forRatio Calculation: 3 Years Monthly DataPoints
PORTFOLIO CLASSIFICATION BY
(%)ASSET ALLOCATION
Financial Services 30.23
Energy 9.73
Automobile 6.95
Pharma 6.73
Consumer Goods 6.63
Cement & Cement Products 5.91
Metals 4.66
IT 2.37
Construction 1.26
Industrial Manufacturing 1.20
Services 0.91
Media And Entertainment 0.87
Fertilisers & Pesticides 0.85
Chemicals 0.59
Telecom 0.50
Others 20.62
Pursuant to payment of dividend, the NAV of Dividend Option ofscheme/plans would fall to the extent of payout and statutory levy, ifapplicable.
•
•
•
•
•
•
•
•
•
•
•
•
•
•
Type of Scheme
Date of Allotment:
Report As On:
AAUM for the May 2019
AUM as on May 31, 2019
Fund Manager: Mr. Neeraj Kumar
Managing Since:
Total Experience:
Benchmark:
Exit Load:
Entry Load:
Plans Available:
Option:
SIP
Minimum Investment
Additional Investment
An open-ended Scheme investing in
arbitrage opportunities.
03/11/2006
31/05/2019
2,582.91 Crores
2,706.18 Crores
Oct-2012
Over 22 years
Nifty 50 Arbitrage Index.
(w.e.f May 16,2018)
For exit within 1 month from the
date of allotment - 0.50%;
For exit after 1 month from the date of
allotment - Nil.
N.A.
Regular, Direct
Growth, Dividend
Any Day SIP’ Facility is available for
Monthly, Quarterly, Semi-Annual and
Annual frequencies through electronic
mode like OTM / Debit Mandate. Default SIP
date will be 10th. In case the SIP due date is
a Non Business Day, then the immediate
following Business Day will be considered
for SIP processing.Weekly - Minimum
1000 & in multiples of 1 thereafter for a
minimum of 6 instalments.
Monthly - Minimum 1000 & in multiples
of 1 thereafter for minimum six months
(or) minimum 500 & in multiples of 1
thereafter for minimum one year.
Quarterly - Minimum 1500 & in multiples
of 1 thereafter for minimum one year.
Semi Annual - Minimum 3000 & in
multiples of 1 thereafter for a minimum of
4 installments.
Annual - Minimum 5000 & in multiples of
1thereafter for a minimum of 4
installments.
5000 & in multiples of 1
1000 & in multiples of 1
Month of
`
`
`
`
`
`
` `
`
`
`
`
`
`
` `
` `
PORTFOLIO CLASSIFICATION BY
INDUSTRY ALLOCATION (%)
PORTFOLIO
Equity SharesReliance Industries Ltd. 8.68Axis Bank Ltd. 3.66Housing Development Finance Corporation Ltd. 3.21Maruti Suzuki India Ltd. 2.83Sun Pharmaceutical Industries Ltd. 2.70State Bank Of India 2.62Grasim Industries Ltd. 2.44Yes Bank Ltd. 2.35Ultratech Cement Ltd. 1.68Hindustan Unilever Ltd. 1.67Dr. Reddy's Laboratories Ltd. 1.64Shriram Transport Finance Company Ltd. 1.45Infosys Ltd. 1.37Bharat Financial Inclusion Ltd. 1.25Nestle India Ltd. 1.21Century Textiles & Industries Ltd. 1.21JSW Steel Ltd. 1.20Mahindra & Mahindra Ltd. 1.04Tata Motors Ltd. 1.00The Federal Bank Ltd. 0.93Adani Ports And Special Economic Zone Ltd. 0.91Tata Steel Ltd. 0.91Punjab National Bank 0.88Asian Paints Ltd. 0.87UPL Ltd. 0.80Britannia Industries Ltd. 0.75HCL Technologies Ltd. 0.74Sun TV Network Ltd. 0.73Ashok Leyland Ltd. 0.72Dabur India Ltd. 0.71Petronet LNG Ltd. 0.69Escorts Ltd. 0.68Mahindra & Mahindra Financial Services Ltd. 0.63Pidilite Industries Ltd. 0.59Aurobindo Pharma Ltd. 0.57Equitas Holdings Ltd. 0.52Divi's Laboratories Ltd. 0.52Tata Communications Ltd. 0.50Siemens Ltd. 0.48Bajaj Finance Ltd. 0.45United Breweries Ltd. 0.45Larsen & Toubro Ltd. 0.44Lupin Ltd. 0.43Union Bank Of India 0.42DLF Ltd. 0.42Balkrishna Industries Ltd. 0.39HDFC Bank Ltd. 0.38Hindalco Industries Ltd. 0.37Bharat Forge Ltd. 0.36IDFC Ltd. 0.36Can Fin Homes Ltd. 0.35Cadila Healthcare Ltd. 0.35Godrej Consumer Products Ltd. 0.35
Stock Name Rating (%) Of Total AUM Stock Name Rating (%) Of Total AUM
Multi Commodity Exchange Of India Ltd. 0.34The South Indian Bank Ltd. 0.33IRB Infrastructure Developers Ltd. 0.31Vedanta Ltd. 0.31Jain Irrigation Systems Ltd. 0.31Adani Power Ltd. 0.30Tech Mahindra Ltd. 0.26The India Cements Ltd. 0.23MRF Ltd. 0.22Ambuja Cements Ltd. 0.21Wockhardt Ltd. 0.21Indiabulls Housing Finance Ltd. 0.20United Spirits Ltd. 0.20Biocon Ltd. 0.18Jubilant Foodworks Ltd. 0.17ACC Ltd. 0.14Cipla Ltd. 0.13Indusind Bank Ltd. 0.13REC Ltd. 0.12ITC Ltd. 0.10Godrej Industries Ltd. 0.10NBCC (India) Ltd. 0.09Dish TV India Ltd. 0.09Power Finance Corporation Ltd. 0.08Bosch Ltd. 0.08L&T Finance Holdings Ltd. 0.07Gujarat State Fertilizers & Chemicals Ltd. 0.06Bharat Heavy Electricals Ltd. 0.05Zee Entertainment Enterprises Ltd. 0.05CESC Ltd. 0.05Syndicate Bank 0.05Bank Of India 0.04Muthoot Finance Ltd. 0.04The Karnataka Bank Ltd. 0.04Colgate Palmolive (India) Ltd. 0.02Tata Global Beverages Ltd. 0.02Reliance Power Ltd. 0.01Bajaj Finserv Ltd. 0.01
Vedanta Ltd. CRISIL A1+ 1.86Tata Motor Finance Holdings Ltd. [ICRA]A1+ 0.56JM Financial Capital Ltd. CRISIL A1+ 0.55
Oriental Bank Of Commerce CRISIL A1+ 2.17
Power Finance Corporation Ltd. CRISIL AAA 3.56L&T Infra Debt Fund Ltd. CRISIL AAA 1.31Shriram City Union Finance Ltd. CARE AA+ 1.13
Total 68.24Commercial Papers
Total 2.97Certificate Of Deposits
Total 2.17Non Convertible Debentures
Total 6.00Cash, Cash Equivalents And Others 20.62Grand Total 100.00
^Investors should consult their financial advisers if in doubt about whether the product is suitablefor them.
SmallcapLarge Cap Midcap
Cash, Cash Equivalents And Others A1+ AA+
AAA and Equivalent
54.38
10.74
3.11
4.88
1.13
5.14
20.62

Co
mp
osit
ion
by R
ati
ng
s a
s o
n3
1 M
ay
20
19
AA
,AA
+,A
AA
And
EQ
UIV
ALEN
T
Belo
w A
A
Sovere
ign
Belo
w A
1+
, A
1+
Cash, C
ash E
quiv
ale
nts
And
Oth
ers
Exit
Load
NIL
NIL
Fu
nd
Deta
ils a
s o
n3
1 M
ay
20
19
Month
End
AU
M (
Rs. in
Cro
res)
`1,4
17.8
1 C
rore
s`1,1
99
.79
Cro
res
`9
94
.46
Cro
res
`3
,96
4.1
0 C
rore
s`5
,39
6.4
2 C
rore
s`1
,67
1.7
4 C
rore
s`7
,08
2.6
1 C
rore
s`3
70
.85
Cro
res
Exp
ense R
ati
oRegula
r- 0
.95%
Dir
ect-
0.5
0%
Regula
r- 1
.47
%D
irect-
0.8
7%
Regula
r- 1
.64
%D
irect-
1.0
4%
Regula
r- 0
.84
%D
irect-
0.3
4%
Regula
r- 1
.54
%D
irect-
0.9
4%
Regula
r- 1
.09
%D
irect-
0.7
4%
Regula
r- 0
.84
%D
irect-
0.3
4%
Regula
r- 0
.64
%D
irect-
0.3
4%
Mod
ifie
d D
ura
tion
Avera
ge M
atu
rity
(years
)
(years
)
Yie
ld t
o M
atu
rity
(%)
6.5
7
9.8
3
7.6
8
4.6
7
6.8
8
8.7
6
5.9
6
8.8
1
7.8
1
1.6
4
2.1
1
12
.10
3.3
5
4.6
7
9.0
7
2.1
2
2.6
8
7.7
6
6.4
9
9.6
0
7.3
1
Snap
shot
of
Fund
sD
eb
t
Schem
e N
am
e
SBI
Magnum
Gilt
Fund
(Pre
vio
usly
know
n a
s S
BI
Magnum
Gilt
Fund -
Long
Term
Pla
n)
SBI
Magnum
Incom
e F
und
SBI
Dynam
ic B
ond
Fund
SBI
Corp
ora
te B
ond
Fund
SBI
Cre
dit
Ris
k F
und
(Pre
vio
usly
know
n a
s S
BI
Corp
ora
te B
ond F
und)
SBI
Magnum
Med
ium
Dura
tion F
und
(Pre
vio
usly
know
n a
s S
BI
Regula
r Savin
gs F
und)
SBI
Short
Term
Deb
tFund
Ideal In
vestm
ent
Hori
zon
3years
+3
years
+3
years
+3
years
+2
years
+2
years
+1
year
+1
year
+
Incep
tion D
ate
30/12/2000
25/1
1/1
99
80
9/0
2/2
00
41
6/
01
/2
01
91
7/0
7/2
01
41
2/1
1/2
00
32
7/7
/2
00
73
0/1
2/2
00
0
Fund
Manag
er
Mr.
Din
esh A
huja
Mr.
Din
esh A
huja
Mr.
Din
esh A
huja
Mr.
Raje
ev
Radhakri
shnan
& M
r. M
ohit
Jain
Mr.
Lokesh M
allya
&M
s.
Mansi Saje
jaM
r. D
inesh A
huja
Mr.
Raje
ev
Radhakri
shnan
Mr.
Mahak K
habia
(w.e
.f M
ay 5
,20
18
)
Manag
ing
Sin
ce
Jan-2011
Jan-2
01
1Ja
n-2
01
1Ja
n-2
01
9Feb-20
17
July
-2
01
1Ju
n-2
00
8M
ay-2
01
8
Benchm
ark
NIF
TY C
orp
ora
te B
ond
Index
CR
ISIL
Com
posit
eC
redit
Ris
k Index
(w.e
.f June 2
5,2
01
8)
CR
ISIL
Short
Term
Bond F
und Index
Co
mp
osit
ion
by
Assets
as o
n3
1 M
ay
20
19
Eq
uit
y S
hare
s
Corp
ora
te D
eb
t
Gilts
Money M
ark
et
Instr
um
ents
Oth
er
Assets
- -
22.5
4
-
77.4
6
-
93
.15
- -
6.8
5
-
57
.16
12
.77
-
30
.07
-
92
.66
-
2.6
5
4.6
9
-
81
.11
5.4
3
2.8
4
10
.62
-
85
.31
1.4
1
0.6
8
12
.59
- -
67
.65
-
32
.35
- -
97.5
7
-
2.4
3
83
.00
10
.15
3.0
4
-
3.8
1
57
.16
-
39
.37
-
3.4
7
51
.97
40
.69
-
2.6
5
4.6
9
52
.73
28
.38
13
.11
2.8
4
2.9
4
86
.35
0.0
0
5.8
4
0.6
8
7.1
3
- -
67
.65
-
32
.35
For
10
% o
f th
ein
vestm
ents
wit
hin
1Year
–N
il;
For
the
rem
ain
ing
investm
ents
- 1
.00
%
For
10
% o
f th
ein
vestm
ents
1 m
onth
–N
il;
For
the r
em
ain
ing
investm
ents
- 0
.25
%
wit
hin
For
8%
of
the
investm
ents
wit
hin
12
month
s–
Nil; For
the
rem
ain
ing investm
ents
- 1
.50
% a
fter
12
month
s–
Nil
For
8%
of
the investm
ents
1 Y
ear
–N
il; For
the
rem
ain
ing investm
ents
- 3
.00%
For
8%
of
the investm
ents
aft
er
1 Y
ear
to 2
Years
–N
il; For
the
rem
ain
ing investm
ents
- 1
.50%
For
8%
of
the investm
ents
aft
er
2 Y
ear
to 3
Years
–N
il; For
the
rem
ain
ing investm
ents
- 0
.75%
wit
hin
Ple
ase
consu
lt y
our
financia
l advis
or
befo
re invest
ing.
For
deta
ils,
ple
ase
refe
r to
resp
ecti
ve p
age o
f th
e s
chem
e.
Expense
rati
o inclu
des
GST, Base
TER
and a
ddit
ional expense
s as
per
regula
tion
52(6
A)(
b)
and 5
2(6
A)(
c)
of
SEBI (M
F)
regula
tions
for
both
Dir
ect
and R
egula
r pla
n.
SBI
Magnum
Consta
nt
Matu
rity
Fund
(Pre
vio
usly
know
n a
s S
BI M
agnum
Gilt
Fund -
Short
Term
Pla
n)
CRIS
IL D
ynam
ic G
ilt
Index.
(w.e
.f M
ay 1
6,2
018)
CRIS
IL M
ediu
m t
o
Long T
erm
Debt
Index
(w.e
.f June 2
5,2
01
8)
NIF
TY C
om
posit
e
Debt
Index
(w.e
.f June 2
5,2
01
8)
NIF
TY M
ediu
mD
ura
tion D
ebt
Index
(w.e
.f M
ay 1
6,2
01
8)
Cri
sil 1
0 Y
ear
Gilt
Index
(w.e
.f M
ay 1
6,2
01
8)
Oth
er
Deta
ils
-
91
.66
0.3
9
5.0
6
2.8
9
83
.13
-
8.9
2
5.0
6
2.8
9
For
exit
on o
r befo
re 6
month
s f
rom
the d
ate
of
allotm
ent:
- F
or
4%
of
the
investm
ents
- N
il; - F
or
the
rem
ain
ing investm
ents
-1.0
0%
For
exit
aft
er
6 m
onth
s f
rom
the d
ate
of
allotm
ent
- N
il
2.4
2
2.8
9
7.5
6
39
NIL
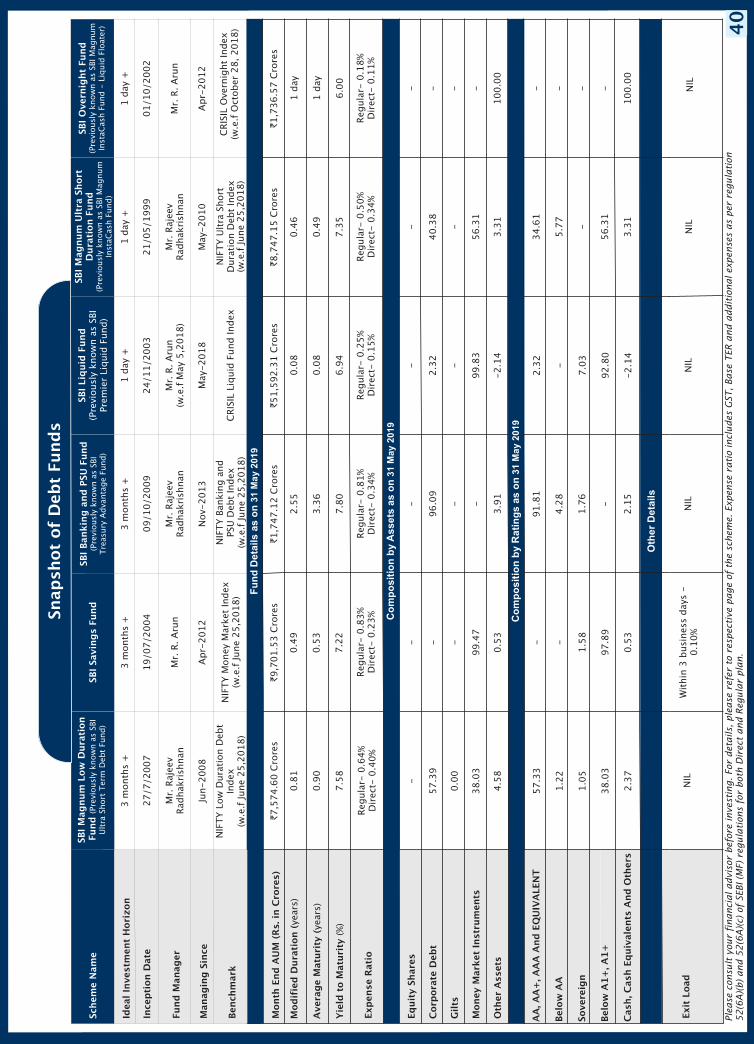
Co
mp
osit
ion
by R
ati
ng
s a
s o
n3
1 M
ay
20
19
Exit
Load
NIL
Wit
hin
3 b
usin
ess d
ays -
0.1
0%
NIL
NIL
NIL
AA
, A
A+
, A
AA
And
EQ
UIV
ALEN
T
Belo
w A
A
Sovere
ign
Belo
w A
1+
, A
1+
Cash, C
ash E
quiv
ale
nts
And
Oth
ers
Oth
er
Deta
ils
Fu
nd
Deta
ils a
s o
n3
1 M
ay
20
19
Month
End
AU
M (
Rs. in
Cro
res)
`7,5
74.6
0 C
rore
s`9
,70
1.5
3 C
rore
s`1
,74
7.1
2 C
rore
s`51
,59
2.3
1 C
rore
s`8
,74
7.1
5 C
rore
s`1
,73
6.5
7 C
rore
s
Exp
ense R
ati
oRegula
r- 0
.64%
Dir
ect-
0.4
0%
Regula
r- 0
.83
%D
irect-
0.2
3%
Regula
r- 0
.81
%D
irect-
0.3
4%
Regula
r0
.25
%D
irect-
0.1
5%
-R
egula
r- 0
.50
%D
irect-
0.3
4%
Regula
r- 0
.18
%D
irect-
0.1
1%
Mod
ifie
d D
ura
tion (
Avera
ge M
atu
rity
Yie
ld t
o M
atu
rity
years
)
years
)
(%)
(
0.8
1
0.9
0
7.5
8
0.4
9
0.5
3
7.2
2
2.5
5
3.3
6
7.8
0
0.0
8
0.0
8
6.9
4
0.4
6
0.4
9
7.3
5
1 d
ay
1 d
ay
6.0
0
Schem
e N
am
eSBI
Savin
gs F
und
SBI
Bankin
g a
nd
PSU
Fund
(Pre
vio
usly
know
n a
s S
BI
Tre
asury
Advanta
ge F
und)
SBI
Liq
uid
Fund
(Pre
vio
usly
know
n a
s S
BI
Pre
mie
r Liq
uid
Fund)
Ideal In
vestm
ent
Hori
zon
3m
onth
s+
3m
onth
s+
3m
onth
s+
1day
+1
day
+1
day
+
Incep
tion D
ate
27/7/2007
19
/0
7/2
00
40
9/1
0/2
00
92
4/1
1/2
00
32
1/0
5/1
99
90
1/1
0/2
00
2
Fund
Manag
er
Mr.
Raje
ev
Radhakri
shnan
Mr.
R.
Aru
nM
r. R
aje
ev
Radhakri
shnan
Mr.
R. A
run
(w.e
.f M
ay 5
,20
18
)M
r. R
aje
ev
Radhakri
shnan
Mr.
R. A
run
Manag
ing
Sin
ce
Jun-2008
Apr-
20
12
Nov-2
01
3M
ay-2
01
8M
ay-2
01
0A
pr-
20
12
Benchm
ark
NIF
TY M
oney M
ark
et
Index
(w.e
.f June 2
5,2
01
8)
CR
ISIL
Liq
uid
Fund Index
Co
mp
osit
ion
by
Assets
as o
n3
1 M
ay
20
19
Eq
uit
y S
hare
s
Corp
ora
te D
eb
t
Gilts
Money M
ark
et
Instr
um
ents
Oth
er
Assets
-
57.3
9
0.0
0
38.0
3
4.5
8
- - -
99
.47
0.5
3
-
96
.09
- -
3.9
1
-
2.3
2
-
99
.83
-2
.14
-
40
.38
-
56
.31
3.3
1
- - - -
10
0.0
0
57.3
3
1.2
2
1.0
5
38.0
3
2.3
7
- -
1.5
8
97
.89
0.5
3
91
.81
4.2
8
1.7
6
-
2.1
5
2.3
2
-
7.0
3
92
.80
-2
.14
34
.61
5.7
7
-
56
.31
3.3
1
- - - -
10
0.0
0
Snap
shot
of
Deb
t Fund
s
Ple
ase
consu
lt y
our
financia
l advis
or
befo
re invest
ing.
For
deta
ils,
ple
ase
refe
r to
resp
ecti
ve p
age o
f th
e s
chem
e.
Expense
rati
o inclu
des
GST, Base
TER
and a
ddit
ional expense
s as
per
regula
tion
52(6
A)(
b)
and 5
2(6
A)(
c)
of
SEBI (M
F)
regula
tions
for
both
Dir
ect
and R
egula
r pla
n.
SBI
Overn
ight
Fund
(Pre
vio
usly
know
n a
s S
BI M
agnum
Insta
Cash F
und -
Liq
uid
Flo
ate
r)
SBI
Magnum
Ult
ra S
hort
Dura
tion F
und
(Pre
vio
usly
know
n a
s S
BI M
agnum
Insta
Cash F
und)
SBI
Magnum
Low
Dura
tion
Fund
(Pre
vio
usly
know
n a
s S
BI
Ult
raShort
Term
Debt
Fund)
CR
ISIL
Overn
ight
Index
(w.e
.f O
cto
ber
28
, 2
01
8)
NIF
TY U
ltra
Short
Dura
tion D
ebt
Index
(w.e
.f June 2
5,2
01
8)
NIF
TY B
ankin
g a
nd
PSU
Debt
Index
(w.e
.f June 2
5,2
01
8)
NIF
TY L
ow
Dura
tion D
ebt
Index
(w.e
.f June 2
5,2
018
)
NIL
40

41
DEBT- GILT FUND
Investment Objective
Quantitative Data
To provide returns to the investorsgenerated through investments inGovernment securities issued by theCentral Government and/or StateGovernment(s).
Fund Details
Modified Duration :
Average Maturity :
Yield to Maturity :
6.57
9.83 years
7.68%
years
•
•
•
•
•
•
•
•
•
•
•
•
•
•
Type of Scheme
Date of Allotment:
Report As On:
AAUM for the May 2019
AUM as on May 31, 2019
Fund Manager: Mr. Dinesh Ahuja
Managing Since:
Total Experience:
Benchmark:
Exit Load:
Entry Load:
Plans Available:
Options:
Minimum Investment
Additional Investment
An open-ended Debt Scheme investing in
government securities across maturity.
30/12/2000
31/05/2019
1,404.69 Crores
1,417.81 Crores
Jan-2011
Over 20 years
CRISIL Dynamic Gilt index
(w.e.f May 16,2018)
NIL
N.A.
Regular, Direct
Growth, Dividend
Any Day SIP’ Facility is available for
Monthly, Quarterly, Semi-Annual and
Annual frequencies through electronic
mode like OTM / Debit Mandate. Default SIP
date will be 10th. In case the SIP due date is
a Non Business Day, then the immediate
following Business Day will be considered
for SIP processing.
Weekly - Minimum 1000 & in multiples of
1 thereafter for a minimum of 6
instalments.
Monthly - Minimum 1000 & in multiples of
1 thereafter for minimum six months (or)
minimum 500 & in multiples of 1
thereafter for minimum one year
Quarterly - Minimum 1500 & in multiples
of 1 thereafter for minimum one year.
Semi Annual - Minimum 3000 & in
multiples of 1 thereafter for a minimum
of 4 installments.
Annual - Minimum 5000 & in multiples of
1 thereafter for a minimum of 4
installments.
5,000 & in multiples of 1
1,000 & in multiples of 1
Month of
`
`
`
`
`
`
` `
`
`
`
`
`
`
` `
` `
SIP
Option NAV ( )`
PF-Fixed Period-1 Year-Dividend 13.5305
PF-Fixed Period-2 Year-Dividend 13.6918
PF-Fixed Period-3 Year-Dividend 13.2837
PF-Regular Dividend 14.1434
PF-Fixed Period-3 Year-Growth 25.1475
NET ASSET VALUE
Option NAV ( )`
PF-Regular Growth 26.9151
Reg-Plan-Dividend 13.9600
Reg-Plan-Growth 41.9286
Dir-Plan-Dividend 14.8780
Dir-Plan-Growth 43.1427
PORTFOLIO CLASSIFICATION BY
RATING CLASS (%)
State Development Loans 75.04
Government Securities 22.54
Cash, Cash Equivalents And Others 2.43
PORTFOLIO CLASSIFICATION BY
ASSET ALLOCATION (%)
Investors understand that their principal
will be at Moderate risk
�
�
Regular income and capital growth for medium to long-term
Investment in government securities.
SBI Magnum Gilt FundThis product is suitable for investors who are seeking^:
^Investors should consult their financial advisers if in doubt about whether the product is suitablefor them.
PORTFOLIO
Government Securities
Total 22.54
State Development Loans
Total 75.04
Cash, Cash Equivalents And Others 2.43
Grand Total 100.00
Government Of India SOVEREIGN 22.54
State Government Of Karnataka SOVEREIGN 32.32
State Government Of Gujarat SOVEREIGN 21.44
State Government Of Maharashtra SOVEREIGN 19.24
State Government Of Tamil Nadu SOVEREIGN 1.87
State Government Of Uttar Pradesh SOVEREIGN 0.17
Issuer Name Rating (%) Of TotalAUM
Sovereign Cash, Cash Equivalents And Others
(Previously known as SBI Magnum Gilt Fund -Long Term Plan)
97.57
2.43

42
DEBT-MEDIUM TO LONGDURATION FUND
Option NAV ( )`
Reg-Plan-Bonus 27.7669
Reg-Plan-Growth 45.8270
Reg-Plan-Half Yearly Dividend 12.3737
Reg-Plan-Quarterly Dividend 13.4948
NET ASSET VALUE
Option NAV ( )`
�
�
Regular income for medium to long-term
Investment in Debt and Money Market Instruments.
SBI Magnum Income FundThis product is suitable for investors who are seeking^:
Investment Objective
Quantitative Data
To provide investors an opportunity togenerate regular income throughinvestments in debt and money marketinstruments such that the Macaulayduration of the portfolio is between 4years and 7 years. However, there is noguarantee or assurance that theinvestment objective of the scheme willbe achieved. The scheme doesn’t assureor guarantee any returns.
Fund Details
Modified Duration :
Average Maturity :
Yield to Maturity :
4.67
6.88 years
8.76%
years
PORTFOLIO CLASSIFICATION BY
RATING CLASS (%)
Non Convertible Debentures 93.15
State Development Loans 3.04
Cash, Cash Equivalents And Others 3.81
•
•
•
•
•
•
•
•
•
•
•
•
•
•
Type of Scheme
Date of Allotment:
Report As On:
AAUM for the May 2019
AUM as on May 31, 2019
Fund Manager: Mr. Dinesh AhujaManaging Since:
Total Experience:
Benchmark:
Exit Load:
Entry Load:
Plans Available:
Options:
SIP
Minimum Investment
Additional Investment
An open-ended medium to long-term Debt
Scheme investing in instruments such that
the Macaulay Duration of the portfolio is
between 4 years to 7 years. (
25/11/1998
31/05/2019
1,200.55 Crores
1,199.79 Crores
Jan-2011
Over 20 years
CRISIL Medium to Long Term
Debt Index
For exit within 1 year from the
date of allotment.
For 10% of investment : Nil
For remaining investment: 1.00%
For exit after one year from the date of
allotment – Nil
N.A.
Regular, Direct
Growth, Dividend
Any Day SIP’ Facility is available for Monthly,
Quarterly, Semi-Annual and Annual
frequencies through electronic mode like
OTM / Debit Mandate. Default SIP date will
be 10th. In case the SIP due date is a Non
Business Day, then the immediate following
Business Day will be considered for SIP
processing.
Weekly - Minimum 1000 & in multiples of
1 thereafter for a minimum of 6 instalments.
Monthly - Minimum 1000 & in multiples of
1 thereafter for minimum six months (or)
minimum 500 & in multiples of 1
thereafter for minimum one year
Quarterly - Minimum 1500 & in multiples
of 1.
Semi Annual - Minimum 3000 & in
multiples of 1 thereafter for a minimum of
4 installments.
Annual - Minimum 5000 & in multiples of
1 thereafter for a minimum of 4
installments.
5,000 & in multiples of 1
1,000 & in multiples of 1
Month of`
`
` `
`
`
` `
`
`
`
`
`
`
` `
` `
Please refer to
the page no. 18 of SID for details on
Macaulay’s Duration.)
(w.e.f June 25,2018)
PORTFOLIO CLASSIFICATION BY
ASSET ALLOCATION (%)
Dir-Plan-Bonus 28.8649
Dir-Plan-Growth 47.5250
Dir-Plan-Half Yearly Dividend 13.9199
Dir-Plan-Quarterly Dividend 14.4166
^Investors should consult their financial advisers if in doubt about whether the product is suitablefor them.
Investors understand that their principal
will be at Moderate risk
PORTFOLIO
Non Convertible Debentures
Total 93.15
State Development Loans
Total 3.04
Cash, Cash Equivalents And Others 3.81
Grand Total 100.00
Housing And Urban Development Corporation Ltd. [ICRA]AAA 8.60
National Highways Authority Of India CRISIL AAA 8.46
L&T Metro Rail (Hyderabad) Ltd. [ICRA]AAA(SO) 8.14
REC Ltd. CRISIL AAA 8.04
ICICI Bank Ltd. [ICRA]AA+ 7.44
NABARD CRISIL AAA 7.34
Shriram Transport Finance Company Ltd. CRISIL AA+ 5.77
Ahmedabad-Maliya Tollway Ltd. [ICRA]AA(SO) 5.26
State Bank Of India CRISIL AA+ 5.08
HDFC Bank Ltd. CRISIL AAA 4.25
Indiabulls Housing Finance Ltd. BWR AAA 4.09
Power Finance Corporation Ltd. CRISIL AAA 3.40
State Bank Of India CRISIL AAA 3.04
Hindalco Industries Ltd. CRISIL AA 2.47
Muthoot Finance Ltd. CRISIL AA 1.65
Divyesh Power Pvt. Ltd. CARE AA-(SO) 1.01
Aashman Energy Pvt. Ltd. CARE AA-(SO) 1.01
Zuvan Energy Pvt. Ltd. CARE AA-(SO) 1.01
Elena Renewable Energy Pvt. Ltd. CARE AA-(SO) 1.01
SEI Baskara Power Pvt. Ltd. CARE AA-(SO) 1.01
SEI Enerstar Renewable Energy Pvt. Ltd. CARE AA-(SO) 1.01
Aarish Solar Power Pvt. Ltd. CARE AA-(SO) 1.01
SEI Mihir Energy Pvt. Ltd. CARE AA-(SO) 1.01
Pratyash Renewable Pvt. Ltd. CARE AA-(SO) 1.01
Shreyas Renewable Energy Pvt. Ltd. CARE AA-(SO) 1.01
State Government Of Gujarat SOVEREIGN 3.04
Issuer Name Rating (%) Of TotalAUM
AASovereignCash, Cash Equivalents And Others
AAA and Equivalent Below AA AA+
55.35
18.28
9.38
10.15
3.04 3.81

43
DEBT- DYNAMIC BOND FUND
Option NAV ( )`
Reg-Plan-Dividend 12.8829
Reg-Plan-Growth 23.4772
Dir-Plan-Dividend 14.3197
Dir-Plan-Growth 24.5332
NET ASSET VALUE
Investors understand that their principal
will be at Moderate risk
�
�
Regular income for medium to long-term
Investment in high quality debt securities of varying maturities.
SBI Dynamic Bond FundThis product is suitable for investors who are seeking^:
Investment Objective
Quantitative Data
To provide investors attractive returnsthrough investment in an activelymanaged portfolio of high quality debtsecurities of varying maturities.
Fund Details
Modified Duration :
Average Maturity :
Yield to Maturity :
5.96 years
8.81 years
7.81%
PORTFOLIO CLASSIFICATION BY
RATING CLASS (%)
Non Convertible Debentures 57.16
State Development Loans 26.60
Government Securities 12.77
Cash, Cash Equivalents And Others 3.47
•
•
•
•
•
•
•
•
•
•
•
•
•
•
Type of Scheme
Date of Allotment:
Report As On:
AAUM for the May 2019
AUM as on May 31, 2019
Fund Manager: Mr. Dinesh Ahuja
Managing Since:
Total Experience:
Benchmark:
Exit Load:
Entry Load:
Plans Available:
Options:
SIP
Minimum Investment
Additional Investment
An open-ended Dynamic Debt Scheme
investing across duration.
09/02/2004
31/05/2019
1,014.74 Crores
994.46 Crores
Jan-2011
Over 20 years
NIFTY Composite Debt Index
For exit within 1 month from the date of
allotment
For 10% of investment : Nil
For remaining investment: 0.25%
For exit after one month from the date of
allotment – Nil
N.A.
Regular, Direct
Growth, Dividend
Any Day SIP’ Facility is available for Monthly,
Quarterly, Semi-Annual and Annual
frequencies through electronic mode like
OTM / Debit Mandate. Default SIP date will
be 10th. In case the SIP due date is a Non
Business Day, then the immediate following
Business Day will be considered for SIP
processing.
Weekly - Minimum 1000 & in multiples of
1 thereafter for a minimum of 6 instalments.
Monthly - Minimum 1000 & in multiples of
1 thereafter for minimum six months (or)
minimum 500 & in multiples of 1
thereafter for minimum one year
Quarterly - Minimum 1500 & in multiples
of 1 thereafter for minimum one year.
Semi Annual - Minimum 3000 & in
multiples of 1 thereafter for a minimum of
4 installments.
Annual - Minimum 5000 & in multiples of
1 thereafter for a minimum of 4
installments.
5,000 & in multiples of 1
1,000 & in multiples of 1
Month of
`
`
` `
`
`
` `
`
`
`
`
`
`
` `
` `
(w.e.f June 25, 2018)
PORTFOLIO CLASSIFICATION BY
ASSET ALLOCATION (%)
^Investors should consult their financial advisers if in doubt about whether the product is suitablefor them.
PORTFOLIO
Non Convertible Debentures
Total 57.16
Government Securities
Total 12.77
State Development Loans
Total 26.60
Cash, Cash Equivalents And Others 3.47
Grand Total 100.00
Housing And Urban Development Corporation Ltd. [ICRA]AAA 9.86
National Highways Authority Of India CRISIL AAA 8.17
REC Ltd. CRISIL AAA 7.72
HDFC Bank Ltd. CRISIL AAA 7.69
Power Finance Corporation Ltd. CRISIL AAA 7.69
NTPC Ltd. CRISIL AAA 7.67
Indian Railway Finance Corporation Ltd. CRISIL AAA 4.63
NABARD CRISIL AAA 2.11
State Bank Of India CRISIL AAA 1.62
Government Of India SOVEREIGN 12.77
State Government Of Gujarat SOVEREIGN 10.60
State Government Of Tamil Nadu SOVEREIGN 9.85
State Government Of Karnataka SOVEREIGN 6.16
Issuer Name Rating (%) Of TotalAUM
Cash, Cash Equivalents And Others
AAA and EquivalentSovereign
57.16
39.37
3.47

44
DEBT- CORPORATE BONDFUND
Option NAV ( )` Option NAV ( )`
Reg-Plan-Monthly Dividend
Reg-Plan-Growth
Reg Quarterly Dividend
10.2354
10.3867
-Plan- 10.3873
Dir-Plan- 10.2537
10.4050
Dir-Plan-Quarterly Dividend 10.4051
Monthly Dividend
Dir-Plan-Growth
NET ASSET VALUE
Investors understand that their principal
will be at Moderate risk
�
�
Regular income for medium term
Investment predominantly in corporate bond securities rated AA+ and above
SBI Corporate Bond FundThis product is suitable for investors who are seeking^:
Investment Objective
Quantitative Data
The investment objective will be to provide the
investors an opportunity to predominantly invest in
corporate bonds rated AA+ and above to generate
additional spread on part of their debt investments
from high quality corporate debt securities while
maintaining moderate liquidity in the portfolio
through investment in money market securities.
Fund Details
Modified Duration :
Average Maturity :
Yield to Maturity :
2.42 years
2.89 years
7.56%
PORTFOLIO CLASSIFICATION BY
RATING CLASS (%)
Non Convertible Debentures 82.34
State Development Loans 8.53
Certificate Of Deposits 5.06
Zero Coupon Bonds 0.79
Government Securities 0.39
Cash, Cash Equivalents And Others 2.89
•
•
•
•
•
•
•
•
•
•
•
•
•
•
•
•
Type of Scheme
Date of Allotment:
Report As On:
AAUM for the May 2019
AUM as on May 31, 2019
Fund Manager: Mr. Rajeev Radhakrishnan
Mr. Mohit Jain
Managing Since:
Total Experience:
Mr. Rajeev Radhakrishnan
Mr. Mohit Jain
Benchmark:
Exit Load:
Entry Load:
Plans Available:
Options:
SIP
Minimum Investment
Additional Investment
An open-ended debt scheme predominantly
investing in AA+ and above rated corporate
bonds
16/01/2019
31/05/2019
3,615.77 Crores
3,964.10 Crores
- investments in foreign
securities of the Scheme.
Jan-2019
Over 17 years
Over 6 Years
NIFTY Corporate Bond Index
For exit on or before 6 months from the
date of allotment: - For 4% of the
investments - Nil; - For the remaining
investments - 1.00%
For exit after 6 months from the date of
allotment - Nil
N.A.
Regular, Direct
Growth, Dividend
Any Day SIP’ Facility is available for Monthly,
Quarterly, Semi-Annual and Annual
frequencies through electronic mode like
OTM / Debit Mandate. Default SIP date will
be 10th. In case the SIP due date is a Non
Business Day, then the immediate following
Business Day will be considered for SIP
processing.
Weekly - Minimum 1000 & in multiples of
1 thereafter for a minimum of 6 instalments.
Monthly - Minimum 1000 & in multiples of
1 thereafter for minimum six months (or)
minimum 500 & in multiples of 1
thereafter for minimum one year
Quarterly - Minimum 1500 & in multiples
of 1 thereafter for minimum one year.
Semi Annual - Minimum 3000 & in
multiples of 1 thereafter for a minimum of
4 installments.
Annual - Minimum 5000 & in multiples of
1 thereafter for a minimum of 4
installments.
5,000 & in multiples of 1
1,000 & in multiples of 1
Month of
`
`
` `
`
`
` `
`
`
`
`
`
`
` `
` `
PORTFOLIO CLASSIFICATION BY
ASSET ALLOCATION (%)
^Investors should consult their financial advisers if in doubt about whether the product is suitablefor them.
PORTFOLIO
Certificate Of Deposits
Total 5.06Non Convertible Debentures
Total 82.34Zero Coupon Bonds
Total 0.79Government Securities
Total 0.39State Development Loans
Total 8.53Cash, Cash Equivalents And Others 2.89Grand Total 100.00
ICICI Bank Ltd. [ICRA]A1+ 2.66HDFC Bank Ltd. IND A1+ 2.40
National Bank For Agriculture And Rural Development CRISIL AAA 9.29NTPC Ltd. CRISIL AAA 8.36Housing Development Finance Corporation Ltd. CRISIL AAA 7.55Power Finance Corporation Ltd. CRISIL AAA 7.15REC Ltd. CRISIL AAA 6.42Larsen & Toubro Ltd. CRISIL AAA 5.87National Highways Authority Of India CRISIL AAA 4.81Reliance Industries Ltd. CRISIL AAA 4.77Small Industries Development Bank Of India [ICRA]AAA 4.61Power Grid Corporation Of India Ltd. CRISIL AAA 4.33Small Industries Development Bank Of India CARE AAA 4.27Indian Railway Finance Corporation Ltd. CRISIL AAA 3.64LIC Housing Finance Ltd. CRISIL AAA 2.58Housing And Urban Development Corporation Ltd. [ICRA]AAA 2.19Tata Sons Ltd. CRISIL AAA 2.13LIC Housing Finance Ltd. CARE AAA 1.67National Housing Bank IND AAA 1.27State Bank Of India CRISIL AAA 0.66Export-Import Bank Of India CRISIL AAA 0.66NHPC Ltd. [ICRA]AAA 0.13
LIC Housing Finance Ltd. CRISIL AAA 0.79
Government Of India SOVEREIGN 0.39
State Government Of Madhya Pradesh SOVEREIGN 2.63State Government Of Karnataka SOVEREIGN 1.31State Government Of Gujarat SOVEREIGN 1.19State Government Of Rajasthan SOVEREIGN 1.07State Government Of Uttar Pradesh SOVEREIGN 0.78State Government SOVEREIGN 0.66State Government Of Maharashtra SOVEREIGN 0.51State Government Of Odisha SOVEREIGN 0.39
Issuer Name Rating (%) Of TotalAUM
Cash, Cash Equivalents And Others A1+
AAA and EquivalentSovereign
An open-ended debt scheme predominantly investing inAA+ and above rated corporate bonds
83.13
8.92
5.06 2.89
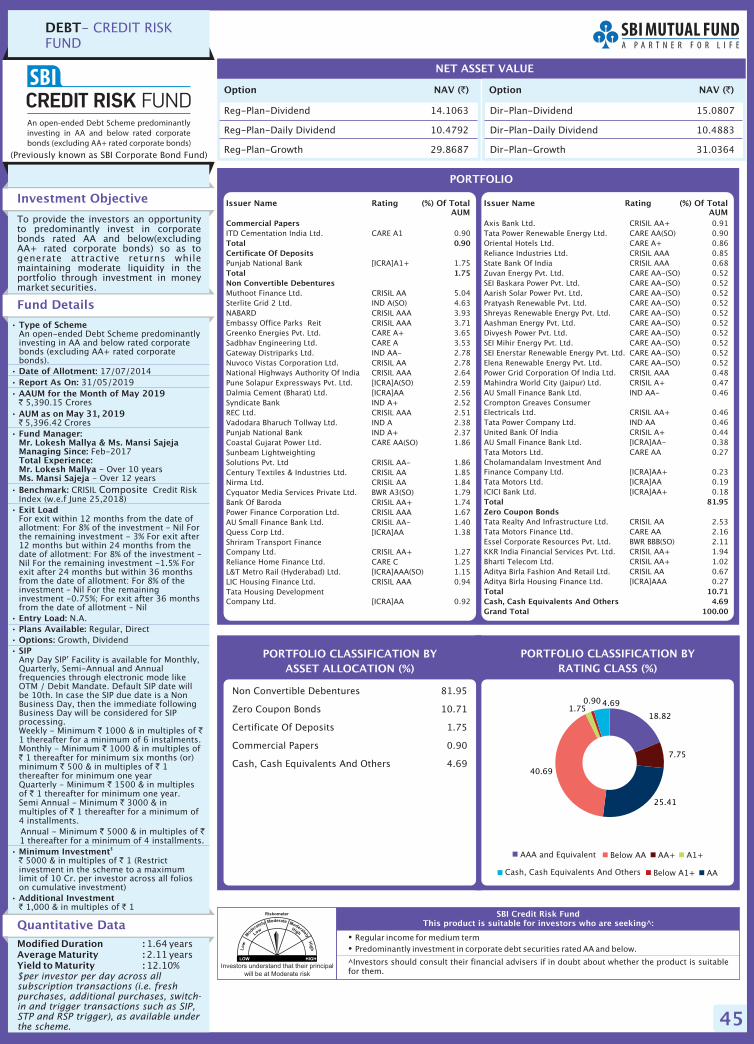
45
DEBT- CREDIT RISKFUND
Option NAV ( )`
Reg-Plan-Dividend 14.1063
Reg-Plan-Daily Dividend 10.4792
Reg-Plan-Growth 29.8687
NET ASSET VALUE
Option NAV ( )`
Investors understand that their principal
will be at Moderate risk
�
�
Regular income for medium term
Predominantly investment in corporate debt securities rated AA and below.
SBI Credit Risk FundThis product is suitable for investors who are seeking^:
Investment Objective
Quantitative Data
To provide the investors an opportunityto predominantly invest in corporatebonds rated AA and below(excludingAA+ rated corporate bonds) so as togenerate attractive returns whilemaintaining moderate liquidity in theportfolio through investment in moneymarket securities.
Fund Details
Modified Duration :Average Maturity :Yield to Maturity :
1.64 years2.11 years12.10%
$per investor per day across allsubscription transactions (i.e. freshpurchases, additional purchases, switch-in and trigger transactions such as SIP,STP and RSP trigger), as available underthe scheme.
PORTFOLIO CLASSIFICATION BY
RATING CLASS (%)
Non Convertible Debentures 81.95
Zero Coupon Bonds 10.71
Certificate Of Deposits 1.75
Commercial Papers 0.90
Cash, Cash Equivalents And Others 4.69
•
•
•
•
•
•
•
•
•
•
•
•
•
•
Type of Scheme
Date of Allotment:
Report As On:
AAUM for the
AUM as on
Fund Manager:Mr. Lokesh Mallya & Ms. Mansi SajejaManaging Since:Total Experience:Mr. Lokesh MallyaMs. Mansi Sajeja
Benchmark:
Exit Load
Entry Load:
Plans Available:
Options:
SIP
Minimum Investment
Additional Investment
An open-ended Debt Scheme predominantlyinvesting in AA and below rated corporatebonds (excluding AA+ rated corporatebonds).
17/07/2014
5,390.15 Crores
5,396.42 Crores
Feb-2017
- Over 10 years- Over 12 years
CRISIL Credit RiskIndex
For exit within 12 months from the date ofallotment: For 8% of the investment – Nil Forthe remaining investment - 3% For exit after12 months but within 24 months from thedate of allotment: For 8% of the investment –Nil For the remaining investment -1.5% Forexit after 24 months but within 36 monthsfrom the date of allotment: For 8% of theinvestment – Nil For the remaininginvestment -0.75%; For exit after 36 monthsfrom the date of allotment – Nil
N.A.
Regular, Direct
Growth, Dividend
Any Day SIP’ Facility is available for Monthly,Quarterly, Semi-Annual and Annualfrequencies through electronic mode likeOTM / Debit Mandate. Default SIP date willbe 10th. In case the SIP due date is a NonBusiness Day, then the immediate followingBusiness Day will be considered for SIPprocessing.Weekly - Minimum 1000 & in multiples of1 thereafter for a minimum of 6 instalments.Monthly - Minimum 1000 & in multiples of
1 thereafter for minimum six months (or)minimum 500 & in multiples of 1thereafter for minimum one yearQuarterly - Minimum 1500 & in multiplesof 1 thereafter for minimum one year.Semi Annual - Minimum 3000 & inmultiples of 1 thereafter for a minimum of4 installments.
Annual - Minimum 5000 & in multiples of1 thereafter for a minimum of 4 installments.
5000 & in multiples of 1 (Restrictinvestment in the scheme to a maximumlimit of 10 Cr. per investor across all folioson cumulative investment)
1,000 & in multiples of 1
31/05/2019
Month of May 2019
May 31, 2019
`
`
` `
`
`
` `
`
`
`
`
` `
` `
` `
$
Composite(w.e.f June 25,2018)
PORTFOLIO CLASSIFICATION BY
ASSET ALLOCATION (%)
Dir-Plan-Dividend 15.0807
Dir-Plan-Daily Dividend 10.4883
Dir-Plan-Growth 31.0364
PORTFOLIO
Issuer Name Rating (%) Of TotalAUM
Issuer Name Rating (%) Of TotalAUM
(Previously known as SBI Corporate Bond Fund)
^Investors should consult their financial advisers if in doubt about whether the product is suitablefor them.
AAA and Equivalent Below AA AA+ A1+
AABelow A1+Cash, Cash Equivalents And Others
Commercial Papers
Total 0.90
Certificate Of Deposits
Total 1.75
Non Convertible Debentures
ITD Cementation India Ltd. CARE A1 0.90
Punjab National Bank [ICRA]A1+ 1.75
Muthoot Finance Ltd. CRISIL AA 5.04
Sterlite Grid 2 Ltd. IND A(SO) 4.63
NABARD CRISIL AAA 3.93
Embassy Office Parks Reit CRISIL AAA 3.71
Greenko Energies Pvt. Ltd. CARE A+ 3.65
Sadbhav Engineering Ltd. CARE A 3.53
Gateway Distriparks Ltd. IND AA- 2.78
Nuvoco Vistas Corporation Ltd. CRISIL AA 2.78
National Highways Authority Of India CRISIL AAA 2.64
Pune Solapur Expressways Pvt. Ltd. [ICRA]A(SO) 2.59
Dalmia Cement (Bharat) Ltd. [ICRA]AA 2.56
Syndicate Bank IND A+ 2.52
REC Ltd. CRISIL AAA 2.51
Vadodara Bharuch Tollway Ltd. IND A 2.38
Punjab National Bank IND A+ 2.37
Coastal Gujarat Power Ltd. CARE AA(SO) 1.86
Sunbeam Lightweighting
Solutions Pvt. Ltd CRISIL AA- 1.86
Century Textiles & Industries Ltd. CRISIL AA 1.85
Nirma Ltd. CRISIL AA 1.84
Cyquator Media Services Private Ltd. BWR A3(SO) 1.79
Bank Of Baroda CRISIL AA+ 1.74
Power Finance Corporation Ltd. CRISIL AAA 1.67
AU Small Finance Bank Ltd. CRISIL AA- 1.40
Quess Corp Ltd. [ICRA]AA 1.38
Shriram Transport Finance
Company Ltd. CRISIL AA+ 1.27
Reliance Home Finance Ltd. CARE C 1.25
L&T Metro Rail (Hyderabad) Ltd. [ICRA]AAA(SO) 1.15
LIC Housing Finance Ltd. CRISIL AAA 0.94
Tata Housing Development
Company Ltd. [ICRA]AA 0.92
Axis Bank Ltd. CRISIL AA+ 0.91
Tata Power Renewable Energy Ltd. CARE AA(SO) 0.90
Oriental Hotels Ltd. CARE A+ 0.86
Reliance Industries Ltd. CRISIL AAA 0.85
State Bank Of India CRISIL AAA 0.68
Zuvan Energy Pvt. Ltd. CARE AA-(SO) 0.52
SEI Baskara Power Pvt. Ltd. CARE AA-(SO) 0.52
Aarish Solar Power Pvt. Ltd. CARE AA-(SO) 0.52
Pratyash Renewable Pvt. Ltd. CARE AA-(SO) 0.52
Shreyas Renewable Energy Pvt. Ltd. CARE AA-(SO) 0.52
Aashman Energy Pvt. Ltd. CARE AA-(SO) 0.52
Divyesh Power Pvt. Ltd. CARE AA-(SO) 0.52
SEI Mihir Energy Pvt. Ltd. CARE AA-(SO) 0.52
SEI Enerstar Renewable Energy Pvt. Ltd. CARE AA-(SO) 0.52
Elena Renewable Energy Pvt. Ltd. CARE AA-(SO) 0.52
Power Grid Corporation Of India Ltd. CRISIL AAA 0.48
Mahindra World City (Jaipur) Ltd. CRISIL A+ 0.47
AU Small Finance Bank Ltd. IND AA- 0.46
Crompton Greaves Consumer
Electricals Ltd. CRISIL AA+ 0.46
Tata Power Company Ltd. IND AA 0.46
United Bank Of India CRISIL A+ 0.44
AU Small Finance Bank Ltd. [ICRA]AA- 0.38
Tata Motors Ltd. CARE AA 0.27
Cholamandalam Investment And
Finance Company Ltd. [ICRA]AA+ 0.23
Tata Motors Ltd. [ICRA]AA 0.19
ICICI Bank Ltd. [ICRA]AA+ 0.18
Tata Realty And Infrastructure Ltd. CRISIL AA 2.53
Tata Motors Finance Ltd. CARE AA 2.16
Essel Corporate Resources Pvt. Ltd. BWR BBB(SO) 2.11
KKR India Financial Services Pvt. Ltd. CRISIL AA+ 1.94
Bharti Telecom Ltd. CRISIL AA+ 1.02
Aditya Birla Fashion And Retail Ltd. CRISIL AA 0.67
Aditya Birla Housing Finance Ltd. [ICRA]AAA 0.27
Total 81.95
Zero Coupon Bonds
Total 10.71
Cash, Cash Equivalents And Others 4.69
Grand Total 100.00
18.82
7.75
25.41
40.69
1.750.90 4.69

46
DEBT- MEDIUM DURATIONFUND
Option NAV ( )`
Reg-Plan-Dividend 13.3480
Reg-Plan-Growth 32.9265
Dir-Plan-Dividend 14.0114
Dir-Plan-Growth 34.5182
NET ASSET VALUE
�
�
Regular income for medium term
Investment in Debt and Money Market securities.
SBI Magnum Medium Duration FundThis product is suitable for investors who are seeking^:
Investment Objective
Quantitative Data
To provide investors an opportunity to
generate attractive returns with moderate
degree of liquidity through investments
in debt and money market instruments
such that the Macaulay duration of the
portfolio is between 3 years – 4 years.
However, there is no guarantee or
assurance that the investment objective
of the scheme will be achieved. The
scheme doesn’t assure or guarantee any
returns.
Fund Details
Modified Duration :
Average Maturity :
Yield to Maturity :
3.35
4.67 years
9.07%
years
PORTFOLIO CLASSIFICATION BY
RATING CLASS (%)
Non Convertible Debentures 78.38
State Development Loans 7.68
Government Securities 5.43
Certificate Of Deposits 2.84
Zero Coupon Bonds 2.73
Cash, Cash Equivalents And Others 2.94
•
•
•
•
•
•
•
•
•
•
•
•
•
•
Type of Scheme
Date of Allotment:
Report As On:
AAUM for the May 2019
AUM as on May 31, 2019
Fund Managers: Mr. Dinesh Ahuja
Managing Since:
Total Experience:
Benchmark:
Exit Load:
Entry Load:
Plans Available:
Options:
SIP
Minimum Investment
Additional Investment
An open-ended medium term Debt Scheme
investing in instruments such that the
Macaulay Duration of the portfolio is between
3 years and 4 years. (
12/11/2003
31/05/2019
1,656.76 Crores
1,671.74 Crores
July-2011
Over 20 years
NIFTY Medium Duration Debt
Index (w.e.f May 16,2018)
For exit within 12 months from the date of
allotment: - For 8% of investment - Nil For
remaining investments - 1.50%;
For exit after 12 months from the date of
allotment: Nil
N.A.
Regular, Direct
Growth, Dividend
Any Day SIP’ Facility is available for Monthly,
Quarterly, Semi-Annual and Annual
frequencies through electronic mode like
OTM / Debit Mandate. Default SIP date will
be 10th. In case the SIP due date is a Non
Business Day, then the immediate following
Business Day will be considered for SIP
processing.
Weekly - Minimum 1000 & in multiples of
1 thereafter for a minimum of 6 instalments.
Monthly - Minimum 1000 & in multiples of
1 thereafter for minimum six months (or)
minimum 500 & in multiples of 1
thereafter for minimum one year
Quarterly - Minimum 1500 & in multiples
of 1 thereafter for minimum one year.
Semi Annual - Minimum 3000 & in
multiples of 1 thereafter for a minimum of
4 installments.
Annual - Minimum 5000 & in multiples of
1 thereafter for a minimum of 4 installments.
5,000 & in multiples of 1
1,000 & in multiples of 1
Month of
`
`
` `
`
`
` `
`
`
`
`
` `
` `
` `
Please refer to the page
no. 18 of SID for details on Macaulay’s
Duration.)
PORTFOLIO CLASSIFICATION BY
ASSET ALLOCATION (%)
PORTFOLIO
Certificate Of Deposits
Total 2.84
Non Convertible Debentures
Bank Of Baroda [ICRA]A1+ 2.84
Power Finance Corporation Ltd. CRISIL AAA 9.84
NABARD CRISIL AAA 8.61
State Bank Of India CRISIL AAA 8.10
Muthoot Finance Ltd. CRISIL AA 6.61
Syndicate Bank IND A+ 4.78
Housing And Urban DevelopmentCorporation Ltd. [ICRA]AAA 4.32
Vadodara Bharuch Tollway Ltd. IND A 3.17
REC Ltd. CRISIL AAA 3.03
Andhra Bank CARE A+ 3.02
Indostar Capital Finance Ltd. CARE AA- 3.00
Pune Solapur Expressways Pvt. Ltd. [ICRA]A(SO) 2.94
Tata Power Renewable Energy Ltd. CARE AA(SO) 2.91
United Bank Of India CRISIL A+ 2.84
NTPC Ltd. CRISIL AAA 2.43
HDFC Credila FinancialServices Pvt. Ltd. CRISIL AAA 2.23
Shriram Transport FinanceCompany Ltd. CRISIL AA+ 1.64
Hindalco Industries Ltd. CRISIL AA 1.47
Indian Railway FinanceCorporation Ltd. CRISIL AAA 0.92
Shreyas Renewable Energy Pvt. Ltd. CARE AA-(SO) 0.56
Divyesh Power Pvt. Ltd. CARE AA-(SO) 0.56
SEI Mihir Energy Pvt. Ltd. CARE AA-(SO) 0.56
Aashman Energy Pvt. Ltd. CARE AA-(SO) 0.56
Elena Renewable Energy Pvt. Ltd. CARE AA-(SO) 0.56
Zuvan Energy Pvt. Ltd. CARE AA-(SO) 0.56
SEI Enerstar RenewableEnergy Pvt. Ltd. CARE AA-(SO) 0.56
SEI Baskara Power Pvt. Ltd. CARE AA-(SO) 0.56
Pratyash Renewable Pvt. Ltd. CARE AA-(SO) 0.56
Aarish Solar Power Pvt. Ltd. CARE AA-(SO) 0.56
L&T Metro Rail (Hyderabad) Ltd. [ICRA]AAA(SO) 0.31
AU Small Finance Bank Ltd. IND AA- 0.30
Nuvoco Vistas Corporation Ltd. CRISIL AA 0.30
Essel Corporate Resources Pvt. Ltd. BWR BBB(SO) 2.73
Government Of India SOVEREIGN 5.43
State Government Of Karnataka SOVEREIGN 6.12
State Government Of Tamil Nadu SOVEREIGN 1.56
Total 78.38
Zero Coupon Bonds
Total 2.73
Government Securities
Total 5.44
State Development Loans
Total 7.68
Cash, Cash Equivalents And Others 2.94
Grand Total 100.00
Issuer Name Rating (%) Of TotalAUM
Issuer Name Rating (%) Of TotalAUM
(Previously known as SBI Regular Savings Fund)
^Investors should consult their financial advisers if in doubt about whether the product is suitablefor them.
Investors understand that their principal
will be at Moderate risk
AAA and Equivalent Below AA AA+ A1+AA
SovereignCash, Cash Equivalents And Others
39.80
1.6411.29
28.38
13.11
2.84 2.94

47
DEBT- SHORT DURATIONFUND
�
�
Regular income for short term
Investment in Debt and Money Market securities.
SBI Short Term Debt FundThis product is suitable for investors who are seeking^:
Investment Objective
Quantitative Data
To provide investors an opportunity togenerate regular income throughinvestments in a portfolio comprisingpredominantly of debt instruments whichare rated not below investment grade andmoney market instruments such that theMacaulay duration of the portfolio isbetween 1 year and 3 years.
Fund Details
Modified Duration :
Average Maturity :
Yield to Maturity :
2.12
2.68 years
7.76%
years
PORTFOLIO CLASSIFICATION BY
RATING CLASS (%)
Non Convertible Debentures 80.80
State Development Loans 4.43
Securitised Debt 2.62
Zero Coupon Bonds 1.89
Government Securities 1.41
Discounted Securitised Debt 1.04
Certificate Of Deposits 0.68
Cash, Cash Equivalents And Others 7.13
•
•
•
•
•
•
•
•
•
•
•
•
•
•
Type of Scheme
Date of Allotment:
Report As On:
AAUM for the May 2019
AUM as on May 31, 2019
Fund Manager:
Mr. Rajeev Radhakrishnan
Managing Since:
Total Experience:
Benchmark:
Exit Load:
Entry Load:
Plans Available:
Options:
SIP
Minimum Investment
Additional Investment
An open-ended short term Debt Scheme
investing in instruments such that the
Macaulay Duration of the portfolio is
between 1 year and 3 years. (
27/7/2007
31/05/2019
6,918.66 Crores
7,082.61 Crores
Jun-2008
Over 17 years
CRISIL Short Term Bond Fund Index
Nil
N.A.
Regular, Direct
Growth, Dividend
Any Day SIP’ Facility is available for
Monthly, Quarterly, Semi-Annual and
Annual frequencies through electronic
mode like OTM / Debit Mandate. Default SIP
date will be 10th. In case the SIP due date is
a Non Business Day, then the immediate
following Business Day will be considered
for SIP processing.
Weekly - Minimum 1000 & in multiples of
1 thereafter for a minimum of 6
instalments.
Monthly - Minimum 1000 & in multiples
of 1 thereafter for minimum six months
(or) minimum 500 & in multiples of 1
thereafter for minimum one year
Quarterly - Minimum 1500 & in multiples
of 1 thereafter for minimum one year.
Semi Annual - Minimum 3000 & in
multiples of 1 thereafter for a minimum of
4 installments.
Annual - Minimum 5000 & in multiples of
1 thereafter for a minimum of 4
installments.
5,000 & in multiples of 1
1,000 & in multiples of 1
Month of
`
`
`
`
`
`
` `
`
`
`
`
`
`
` `
` `
Please refer to
the page no. 16 of SID for details on
Macaulay’s Duration.)
PORTFOLIO CLASSIFICATION BY
ASSET ALLOCATION (%)
Option NAV ( )`
Retail-Plan-Fortnightly Dividend 11.0601
Retail-Plan-Growth 24.5484
Retail-Plan-Monthly Dividend 11.6764
Retail-Plan-Weekly Dividend 10.9775
Reg-Plan-Fortnightly Dividend 10.4628
Reg-Plan-Growth 21.6978
NET ASSET VALUE
Option NAV ( )`
Reg-Plan-Monthly Dividend 12.4284
Reg-Plan-Weekly Dividend 10.5693
Dir-Plan-Fortnightly Dividend 15.0642
Dir-Plan-Growth 22.3643
Dir-Plan-Monthly Dividend 12.9451
Dir-Plan-Weekly Dividend 10.5723
PORTFOLIO
Certificate Of Deposits
Total 0.68
Non Convertible Debentures
ICICI Bank Ltd. [ICRA]A1+ 0.68
Power Finance Corporation Ltd. CRISIL AAA 8.36
REC Ltd. CRISIL AAA 7.58
NABARD CRISIL AAA 6.84
LIC Housing Finance Ltd. CRISIL AAA 5.84
Housing And Urban Development
Corporation Ltd. [ICRA]AAA 4.36
Small Industries Development
Bank Of India CARE AAA 4.32
Indian Railway Finance
Corporation Ltd. CRISIL AAA 3.75
Power Grid Corporation Of India Ltd. CRISIL AAA 3.47
Reliance Industries Ltd. CRISIL AAA 3.46
Larsen & Toubro Ltd. CRISIL AAA 3.46
Shriram Transport Finance
Company Ltd. CRISIL AA+ 3.45
HDFC Ltd. CRISIL AAA 3.11
HDFC Bank Ltd. CRISIL AAA 2.67
Tata Sons Ltd. CRISIL AAA 2.42
NTPC Ltd. CRISIL AAA 2.27
State Bank Of India CRISIL AAA 2.04
National Highways Authority
Of India CRISIL AAA 1.87
Tata Capital Financial Services Ltd. [ICRA]AAA 1.78
L&T Finance Ltd. [ICRA]AAA 1.42
Ultratech Cement Ltd. CRISIL AAA 1.40
Export-Import Bank Of India CRISIL AAA 1.07
Nabha Power Ltd. [ICRA]AAA(SO) 0.71
BMW India Financial Services
Pvt. Ltd. CRISIL AAA 0.71
Nuvoco Vistas Corporation Ltd. CRISIL AA 0.70
LIC Housing Finance Ltd. CARE AAA 0.57
State Bank Of India CRISIL AA+ 0.57
Sp Jammu Udhampur Highway Ltd. [ICRA]AAA(SO) 0.54
Small Industries Development
Bank Of India [ICRA]AAA 0.52
Food Corporation Of India CRISIL AAA(SO) 0.48
L&T Metro Rail (Hyderabad) Ltd. [ICRA]AAA(SO) 0.37
Sundaram Finance Ltd. [ICRA]AAA 0.35
L&T Infra Debt Fund Ltd. CRISIL AAA 0.21
HDFC Bank Ltd. CRISIL AA+ 0.07
IDFC First Bank Ltd. [ICRA]AA 0.05
Reliance Jio Infocomm Ltd. CRISIL AAA 0.01
Bajaj Finance Ltd. CRISIL AAA 0.01
HDB Financial Services Ltd. CRISIL AAA 0.01
Tata Motors Finance Ltd. CARE AA 0.98
LIC Housing Finance Ltd. CRISIL AAA 0.37
HDB Financial Services Ltd. CRISIL AAA 0.21
Sundaram Finance Ltd. [ICRA]AAA 0.21
L&T Interstate Road Corridor Ltd. [ICRA]AAA(SO) 0.11
Reliance Retail Ltd. [ICRA]AAA(SO) 1.04
Reliance Retail Ltd. [ICRA]AAA(SO) 2.62
Government Of India SOVEREIGN 1.41
State Government Of Karnataka SOVEREIGN 2.56
State Government Of Maharashtra SOVEREIGN 1.21
State Government Of Rajasthan SOVEREIGN 0.66
Total 80.80
Zero Coupon Bonds
Total 1.89
Discounted Securitised Debt
Total 1.04
Securitised Debt
Total 2.62
Government Securities
Total 1.41
State Development Loans
Total 4.43
Cash, Cash Equivalents And Others 7.13
Grand Total 100.00
Issuer Name Rating (%) Of TotalAUM
Issuer Name Rating (%) Of TotalAUM
Investors understand that their principal
will be at Moderately Low risk
^Investors should consult their financial advisers if in doubt about whether the product is suitablefor them.
AAA and Equivalent A1+ AA+ AA
SovereignCash, Cash Equivalents And Others
80.51
4.09
1.74
5.840.68 7.13

48
Option NAV ( )`
Reg-Plan-Dividend 14.0331
Reg-Plan-Growth 41.8330
Dir-Plan-Dividend 14.3066
Dir-Plan-Growth 42.6748
NET ASSET VALUE
�
�
Regular income and capital growth for medium to long-term
Investment in government securities having a constant maturity of around 10 years.
SBI Magnum Constant Maturity FundThis product is suitable for investors who are seeking^:
Investment Objective
Quantitative Data
To provide returns to the investorsgenerated through investmentspredominantly in Government securitiesissued by the Central Government and/orState Government such that the AverageMaturity of the portfolio is around 10years.
Fund Details
Modified Duration :
Average Maturity :
Yield to Maturity :
6.49
9.60 years
7.31%
years
PORTFOLIO CLASSIFICATION BY
RATING CLASS (%)
Government Securities 67.65
State Development Loans 26.92
Cash, Cash Equivalents And Others 5.43
•
•
•
•
•
•
•
•
•
•
•
•
•
•
Type of Scheme
Date of Allotment:
Report As On:
AAUM for the May 2019
AUM as on May 31, 2019
Fund Manager: Mr. Mahak Khabia
Managing Since:
Total Experience:
Benchmark:
Exit Load:
Entry Load:
Plans Available:
Options:
SIP
Minimum Investment
Additional Investment
An open-ended Debt Scheme investing in
government securities having a constant
maturity of around 10 years.
30/12/2000
31/05/2019
391.40 Crores
370.85 Crores
(w.e.f May 05, 2018)
May-2018
Over 7 years
Crisil 10 Year Gilt Index
(w.e.f May 16,2018)
NIL
N.A.
Regular, Direct
Growth, Dividend
Any Day SIP’ Facility is available for Monthly,
Quarterly, Semi-Annual and Annual
frequencies through electronic mode like
OTM / Debit Mandate. Default SIP date will
be 10th. In case the SIP due date is a Non
Business Day, then the immediate following
Business Day will be considered for SIP
processing.
Weekly - Minimum 1000 & in multiples of
1 thereafter for a minimum of 6 instalments.
Monthly - Minimum 1000 & in multiples of
1 thereafter for minimum six months (or)
minimum 500 & in multiples of 1
thereafter for minimum one year
Quarterly - Minimum 1500 & in multiples of
1 thereafter for minimum one year.
Semi Annual - Minimum 3000 & in
multiples of 1 thereafter for a minimum of
4 installments.
Annual - Minimum 5000 & in multiples of
1 thereafter for a minimum of 4
installments.
5,000 & in multiples of 1
1,000 & in multiples of 1
Month of
`
`
` `
`
`
` `
`
`
`
`
`
`
` `
` `
PORTFOLIO CLASSIFICATION BY
ASSET ALLOCATION (%)
DEBT-GILT FUND WITH 10YEAR CONSTANT DURATION
PORTFOLIO
Government Securities
Total 67.65
State Development Loans
Total 26.92
Cash, Cash Equivalents And Others 5.43
Grand Total 100.00
Government Of India SOVEREIGN 67.65
State Government Of Gujarat SOVEREIGN 13.91
State Government Of Maharashtra SOVEREIGN 13.01
Issuer Name Rating (%) Of TotalAUM
Investors understand that their principal
will be at Moderate risk^Investors should consult their financial advisers if in doubt about whether the product is suitablefor them.
SovereignCash, Cash Equivalents And Others
(Previously known as SBI Magnum Gilt Fund -Short Term Plan)
94.57
5.43

49
Option NAV ( )`
Institutional-Daily Dividend 1,010.9867
Institutional-Growth 2,493.1429
Institutional-Weekly Dividend 1,009.7219
Reg-Plan-Daily Dividend 1,011.3315
Reg-Plan-Fortnightly Dividend 1,032.4550
Reg-Plan-Growth 2,450.0466
Reg-Plan-Monthly Dividend 1,118.1858
NET ASSET VALUE
Option NAV ( )`
�
�
Regular income for short term
Investment in Money Market instruments.
SBI Magnum Low Duration FundThis product is suitable for investors who are seeking^:
Investment Objective
Quantitative Data
To provide investors an opportunity togenerate regular income with reasonabledegree of liquidity through investmentsin debt and money market instruments insuch a manner that the Macaulay durationof the portfolio is between 6 months and12 months.
Fund Details
Modified Duration :
Average Maturity :
Yield to Maturity :
0.81
0.90 years
7.58%
years
PORTFOLIO CLASSIFICATION BY
RATING CLASS (%)
Non Convertible Debentures 52.39
Certificate Of Deposits 28.89
Commercial Papers 9.13
Zero Coupon Bonds 4.10
Discounted Securitised Debt 1.16
State Development Loans 1.05
Securitised Debt 0.90
Cash, Cash Equivalents And Others 2.37
•
•
•
•
•
•
•
•
•
•
•
•
•
•
Type of Scheme
Date of Allotment:
Report As On:
AAUM for the May 2019
AUM as on May 31, 2019
Fund Manager:
Mr. Rajeev Radhakrishnan
Managing Since:
Total Experience:
Benchmark:
Exit Load:
Entry Load:
Plans Available:
Options:
SIP
Minimum Investment
Additional Investment
An open-ended low duration Debt Scheme
investing in instruments such that the
Macaulay duration of the portfolio is
between 6 months and 12 months. (
27/7/2007
31/05/2019
7,117.87 Crores
7,574.60 Crores
Jun-2008
Over 17 years
NIFTY Low Duration Debt Index
(w.e.f June 25,2018)
Nil
N.A.
Regular, Direct
Growth, Dividend
Any Day SIP’ Facility is available for
Monthly, Quarterly, Semi-Annual and
Annual frequencies through electronic
mode like OTM / Debit Mandate. Default SIP
date will be 10th. In case the SIP due date is
a Non Business Day, then the immediate
following Business Day will be considered
for SIP processing.
Weekly - Minimum 1000 & in multiples of
1 thereafter for a minimum of 6
instalments.
Monthly - Minimum 1000 & in multiples
of 1 thereafter for minimum six months
(or) minimum 500 & in multiples of 1
thereafter for minimum one year
Quarterly - Minimum 1500 & in multiples
of 1 thereafter for minimum one year.
Semi Annual - Minimum 3000 & in
multiples of 1 thereafter for a minimum of
4 installments.
Annual - Minimum 5000 & in multiples of
1 thereafter for a minimum of 4
installments.
5,000 & in multiples of 1
1,000 & in multiples of 1
Month of
`
`
`
`
`
`
` `
`
`
`
`
`
`
` `
` `
Please
refer to the page no. 17 of SID for details
on Macaulay’s Duration.)
PORTFOLIO CLASSIFICATION BY
ASSET ALLOCATION (%)
Reg-Plan-Weekly Dividend 1,012.0562
Dir-Plan-Daily Dividend 1,011.4080
Dir-Plan-Fortnightly Dividend 1,032.5038
Dir-Plan-Growth 2,464.4796
Dir-Plan-Monthly Dividend 1,125.2126
Dir-Plan-Weekly Dividend 1,013.6333
DEBT- LOW DURATION FUND
PORTFOLIO
Commercial Papers
Total 9.13
Certificate Of Deposits
Total 28.89
Non Convertible Debentures
Cholamandalam Investment And
Finance Company Ltd. CRISIL A1+ 2.80
HDFC Ltd. CRISIL A1+ 2.46
LIC Housing Finance Ltd. CRISIL A1+ 1.59
Power Finance Corporation Ltd. CRISIL A1+ 1.25
Nabha Power Ltd. CRISIL A1+ 0.66
Haldia Energy Ltd. [ICRA]A1+ 0.36
Axis Bank Ltd. CRISIL A1+ 7.52
Bank Of Baroda [ICRA]A1+ 5.59
NABARD CRISIL A1+ 5.10
Small Industries Development
Bank Of India CRISIL A1+ 4.40
HDFC Bank Ltd. IND A1+ 2.82
Indian Bank IND A1+ 1.57
Kotak Mahindra Bank Ltd. CRISIL A1+ 1.31
ICICI Bank Ltd. [ICRA]A1+ 0.58
Power Finance Corporation Ltd. CRISIL AAA 6.91
REC Ltd. CRISIL AAA 5.51
Small Industries Development
Bank Of India CARE AAA 4.05
HDFC Ltd. CRISIL AAA 4.05
Shriram City Union Finance Ltd. CARE AA+ 3.97
NABARD CRISIL AAA 2.98
LIC Housing Finance Ltd. CRISIL AAA 2.65
Tata Capital Housing Finance Ltd. [ICRA]AAA 2.65
Tata Sons Ltd. CRISIL AAA 1.91
National Housing Bank IND AAA 1.86
Nabha Power Ltd. [ICRA]AAA(SO) 1.66
Reliance Industries Ltd. CRISIL AAA 1.38
Tata Capital Ltd. CRISIL AAA 1.33
Fullerton India Home Finance
Company Ltd. CARE AA+ 1.33
L&T Infrastructure Finance
Company Ltd. IND AAA 1.32
Shriram Transport Finance
Company Ltd. CRISIL AA+ 1.32
Indostar Capital Finance Ltd. CARE AA- 1.22
Indian Railway Finance
Corporation Ltd. CRISIL AAA 0.93
Larsen & Toubro Ltd. CRISIL AAA 0.87
Export-Import Bank Of India CRISIL AAA 0.86
SP Jammu Udhampur Highway Ltd. [ICRA]AAA(SO) 0.79
Housing And Urban Development
Corporation Ltd. [ICRA]AAA 0.66
IDFC First Bank Ltd. CARE AA+ 0.66
HDB Financial Services Ltd. CRISIL AAA 0.66
Reliance Jio Infocomm Ltd. CRISIL AAA 0.48
BMW India Financial Services Pvt. Ltd. CRISIL AAA 0.33
Kotak Mahindra Prime Ltd. CRISIL AAA 0.07
Bharti Telecom Ltd. CRISIL AA+ 2.19
TMF Holdings Ltd. CRISIL AA 1.62
LIC Housing Finance Ltd. CRISIL AAA 0.30
Reliance Retail Ltd. [ICRA]AAA(SO) 1.16
Reliance Retail Ltd. [ICRA]AAA 0.45
Reliance Retail Ltd. [ICRA]AAA(SO) 0.44
State Government Of Rajasthan SOVEREIGN 0.55
State Government Of Uttar Pradesh SOVEREIGN 0.50
Total 52.39
Zero Coupon Bonds
Total 4.11
Discounted Securitised Debt
Total 1.16
Securitised Debt
Total 0.90
State Development Loans
Total 1.05
Cash, Cash Equivalents And Others 2.37
Grand Total 100.00
Issuer Name Rating (%) Of TotalAUM
Issuer Name Rating (%) Of TotalAUM
Investors understand that their principal
will be at Moderately Low risk
^Investors should consult their financial advisers if in doubt about whether the product is suitablefor them.
(Previously known as SBI Ultra Short Term Debt Fund)
Below AAAA+A1+ AA Sovereign
AAA and EquivalentCash, Cash Equivalents And Others
46.26
9.461.621.221.05
38.03
2.37
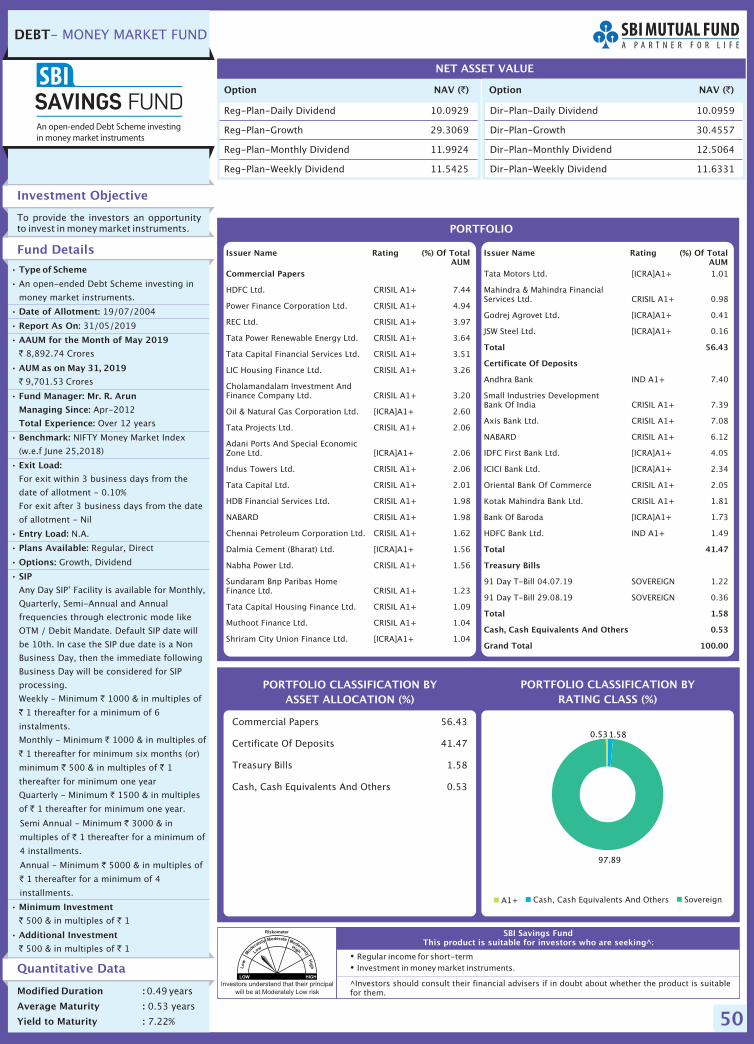
50
Option NAV ( )`
Reg-Plan-Daily Dividend 10.0929
Reg-Plan-Growth 29.3069
Reg-Plan-Monthly Dividend 11.9924
Reg-Plan-Weekly Dividend 11.5425
NET ASSET VALUE
Option NAV ( )`
�
�
Regular income for short-term
Investment in money market instruments.
SBI Savings FundThis product is suitable for investors who are seeking^:
Investment Objective
Quantitative Data
To provide the investors an opportunityto invest in money market instruments.
Fund Details
Modified Duration :
Average Maturity :
Yield to Maturity :
0.49
0.53 years
7.22%
years
PORTFOLIO CLASSIFICATION BY
RATING CLASS (%)
Commercial Papers 56.43
Certificate Of Deposits 41.47
Treasury Bills 1.58
Cash, Cash Equivalents And Others 0.53
•
•
•
•
•
•
•
•
•
•
•
•
•
•
•
Type of Scheme
Date of Allotment:
Report As On:
AAUM for the May 2019
AUM as on May 31, 2019
Fund Manager: Mr. R. Arun
Managing Since:
Total Experience:
Benchmark:
Exit Load:
Entry Load:
Plans Available:
Options:
SIP
Minimum Investment
Additional Investment
An open-ended Debt Scheme investing in
money market instruments.
19/07/2004
31/05/2019
8,892.74 Crores
9,701.53 Crores
Apr-2012
Over 12 years
NIFTY Money Market Index
For exit within 3 business days from the
date of allotment - 0.10%
For exit after 3 business days from the date
of allotment - Nil
N.A.
Regular, Direct
Growth, Dividend
Any Day SIP’ Facility is available for Monthly,
Quarterly, Semi-Annual and Annual
frequencies through electronic mode like
OTM / Debit Mandate. Default SIP date will
be 10th. In case the SIP due date is a Non
Business Day, then the immediate following
Business Day will be considered for SIP
processing.
Weekly - Minimum 1000 & in multiples of
1 thereafter for a minimum of 6
instalments.
Monthly - Minimum 1000 & in multiples of
1 thereafter for minimum six months (or)
minimum 500 & in multiples of 1
thereafter for minimum one year
Quarterly - Minimum 1500 & in multiples
of 1 thereafter for minimum one year.
Semi Annual - Minimum 3000 & in
multiples of 1 thereafter for a minimum of
4 installments.
Annual - Minimum 5000 & in multiples of
1 thereafter for a minimum of 4
installments.
500 & in multiples of 1
500 & in multiples of 1
Month of
`
`
`
`
`
`
` `
`
`
`
`
`
`
` `
` `
(w.e.f June 25,2018)
PORTFOLIO CLASSIFICATION BY
ASSET ALLOCATION (%)
Dir-Plan-Daily Dividend
Dir-Plan-Growth 30.4557
Dir-Plan-Monthly Dividend 12.5064
Dir-Plan-Weekly Dividend 11.6331
10.0959
DEBT- MONEY MARKET FUND
PORTFOLIO
Commercial Papers
HDFC Ltd. CRISIL A1+ 7.44
Power Finance Corporation Ltd. CRISIL A1+ 4.94
REC Ltd. CRISIL A1+ 3.97
Tata Power Renewable Energy Ltd. CRISIL A1+ 3.64
Tata Capital Financial Services Ltd. CRISIL A1+ 3.51
LIC Housing Finance Ltd. CRISIL A1+ 3.26
Cholamandalam Investment AndFinance Company Ltd. CRISIL A1+ 3.20
Oil & Natural Gas Corporation Ltd. [ICRA]A1+ 2.60
Tata Projects Ltd. CRISIL A1+ 2.06
Adani Ports And Special EconomicZone Ltd. [ICRA]A1+ 2.06
Indus Towers Ltd. CRISIL A1+ 2.06
Tata Capital Ltd. CRISIL A1+ 2.01
HDB Financial Services Ltd. CRISIL A1+ 1.98
NABARD CRISIL A1+ 1.98
Chennai Petroleum Corporation Ltd. CRISIL A1+ 1.62
Dalmia Cement (Bharat) Ltd. [ICRA]A1+ 1.56
Nabha Power Ltd. CRISIL A1+ 1.56
Sundaram Bnp Paribas HomeFinance Ltd. CRISIL A1+ 1.23
Tata Capital Housing Finance Ltd. CRISIL A1+ 1.09
Muthoot Finance Ltd. CRISIL A1+ 1.04
Shriram City Union Finance Ltd. [ICRA]A1+ 1.04
Tata Motors Ltd. [ICRA]A1+ 1.01
Mahindra & Mahindra FinancialServices Ltd. CRISIL A1+ 0.98
Godrej Agrovet Ltd. [ICRA]A1+ 0.41
JSW Steel Ltd. [ICRA]A1+ 0.16
Andhra Bank IND A1+ 7.40
Small Industries DevelopmentBank Of India CRISIL A1+ 7.39
Axis Bank Ltd. CRISIL A1+ 7.08
NABARD CRISIL A1+ 6.12
IDFC First Bank Ltd. [ICRA]A1+ 4.05
ICICI Bank Ltd. [ICRA]A1+ 2.34
Oriental Bank Of Commerce CRISIL A1+ 2.05
Kotak Mahindra Bank Ltd. CRISIL A1+ 1.81
Bank Of Baroda [ICRA]A1+ 1.73
HDFC Bank Ltd. IND A1+ 1.49
91 Day T-Bill 04.07.19 SOVEREIGN 1.22
91 Day T-Bill 29.08.19 SOVEREIGN 0.36
Total 56.43
Certificate Of Deposits
Total 41.47
Treasury Bills
Total 1.58
Cash, Cash Equivalents And Others 0.53
Grand Total 100.00
Issuer Name Rating (%) Of TotalAUM
Issuer Name Rating (%) Of TotalAUM
Investors understand that their principal
will be at Moderately Low risk
^Investors should consult their financial advisers if in doubt about whether the product is suitablefor them.
Cash, Cash Equivalents And OthersA1+ Sovereign
1.58
97.89
0.53

51
Option NAV ( )`
Reg-Plan-Daily Dividend 1,027.2292
Reg-Plan-Growth 2,111.0790
Reg-Plan-Monthly Dividend 1,070.5052
Reg-Plan-Weekly Dividend 1,026.6920
NET ASSET VALUE
Option NAV ( )`
�
�
Regular income over medium term
Investment in Debt instruments predominantly issued by Banks PSUs, PFIs and Municipal bodies.
SBI Banking & PSU FundThis product is suitable for investors who are seeking^:
Investment Objective
Quantitative Data
The scheme seeks to generate regularincome through a judicious mix ofportfolio comprising predominantly debtand money market securities of Banks,Public Sector Undertakings, PublicFinancial Institutions and Municipalbodies.
Fund Details
Modified Duration :
Average Maturity :
Yield to Maturity :
2.55
3.36 years
7.80%
years
PORTFOLIO CLASSIFICATION BY
RATING CLASS (%)
Non Convertible Debentures 93.03
Zero Coupon Bonds 3.06
State Development Loans 1.76
Cash, Cash Equivalents And Others 2.15
•
•
•
•
•
•
•
•
•
•
•
•
•
•
Type of Scheme
Date of Allotment:
Report As On:
AAUM for the May 2019
AUM as on May 31, 2019
Fund Manager:
Mr. Rajeev Radhakrishnan
Managing Since:
Total Experience:
Benchmark:
Exit Load:
Entry Load:
Plans Available:
Options:
SIP
Minimum Investment
Additional Investment
An open-ended Debt Scheme predominantly
investing in debt instruments of banks,
Public Sector Undertakings, Public Financial
Institutions and Municipal bodies.
09/10/2009
31/05/2019
1,718.09 Crores
1,747.12 Crores
Nov-2013
Over 17 years
NIFTY Banking and PSU Debt
Index
Nil
N.A.
Regular, Direct
Growth, Dividend
Any Day SIP’ Facility is available for Monthly,
Quarterly, Semi-Annual and Annual
frequencies through electronic mode like
OTM / Debit Mandate. Default SIP date will
be 10th. In case the SIP due date is a Non
Business Day, then the immediate following
Business Day will be considered for SIP
processing.
Weekly - Minimum 1000 & in multiples of
1 thereafter for a minimum of 6
instalments.
Monthly - Minimum 1000 & in multiples of
1 thereafter for minimum six months (or)
minimum 500 & in multiples of 1
thereafter for minimum one year.
Quarterly - Minimum 1500 & in multiples
of 1 thereafter for minimum one year.
Semi Annual - Minimum 3000 & in
multiples of 1 thereafter for a minimum of
4 installments.
Annual - Minimum 5000 & in multiples of
1 thereafter for a minimum of 4
installments.
5,000 & in multiples of 1
1,000 & in multiples of 1
Month of
`
`
`
`
`
`
` `
`
`
`
`
`
`
` `
` `
(w.e.f June 25,2018)
PORTFOLIO CLASSIFICATION BY
ASSET ALLOCATION (%)
Dir-Plan-Daily Dividend 1,028.6265
Dir-Plan-Growth 2,180.9656
Dir-Plan-Monthly Dividend 1,097.6872
Dir-Plan-Weekly Dividend 1,026.7212
DEBT- BANKING AND PSUFUND
PORTFOLIO
Investors understand that their principal
will be at Moderate risk
^Investors should consult their financial advisers if in doubt about whether the product is suitablefor them.
(Previously known as SBI Treasury Advantage Fund)
AAA and Equivalent Below AA A1+ AA+
AA SovereignCash, Cash Equivalents And Others
Non Convertible Debentures
Total 93.03
Zero Coupon Bonds
Total 3.06
State Development Loans
Total 1.76
Cash, Cash Equivalents And Others 2.15
Grand Total 100.00
National Bank For Agriculture And Rural Development CRISIL AAA 9.06
Small Industries Development Bank Of India CARE AAA 8.65
Export-Import Bank Of India CRISIL AAA 8.01
NTPC Ltd. CRISIL AAA 7.89
National Housing Bank IND AAA 7.48
Power Finance Corporation Ltd. CRISIL AAA 7.22
REC Ltd. CRISIL AAA 6.22
HDFC Bank Ltd. CRISIL AAA 5.84
Indian Railway Finance Corporation Ltd. CRISIL AAA 5.73
State Bank Of India CRISIL AAA 4.77
State Bank Of India CRISIL AA+ 4.65
Steel Authority Of India Ltd. IND AA- 4.28
Housing And Urban Development Corporation Ltd. [ICRA]AAA 4.02
Bank Of Baroda CARE AA 2.82
HDFC Bank Ltd. CRISIL AA+ 2.29
LIC Housing Finance Ltd. CARE AAA 1.80
Axis Bank Ltd. CRISIL AA+ 1.40
Union Bank Of India BWR AA 0.90
LIC Housing Finance Ltd. CRISIL AAA 3.06
State Government Of Maharashtra SOVEREIGN 1.76
Issuer Name (%) Of TotalAUM
Rating
79.74
8.34
3.734.28
1.762.15

52
DEBT- LIQUID FUND
�
�
Regular income for short term
Investment in Debt and Money Market securities with residual maturity upto 91 days only.
SBI Liquid FundThis product is suitable for investors who are seeking^:
Investment Objective
Quantitative Data
To provide the investors an opportunity
to invest in the entire range of debt and
money market securities with residual
maturity upto 91 days only.
Fund Details
Modified Duration :
Average Maturity :
Yield to Maturity :
0.08
0.08 years
6.94%
years
PORTFOLIO CLASSIFICATION BY
RATING CLASS (%)
Commercial Papers 73.43
Certificate Of Deposits 19.37
Treasury Bills 7.03
Non Convertible Debentures 2.32
Cash, Cash Equivalents And Others -2.14
• Type of Scheme
Date of Allotment:
Report As On:
AAUM for the
AUM as on
Fund Manager: Mr. R. Arun
Managing Since:
Total Experience:
Benchmark:
Exit Load:
Entry Load:
Plans Available:
Options:
SIP:
Minimum Investment
Additional Investment
An open-ended Liquid Scheme
24/11/2003
54,850.62 Crores
51,592.31 Crores
May-2018
Over 12 years
CRISIL Liquid Fund Index
NIL
N.A.
Regular, Direct
Growth, Dividend
N.A.
5,000 & in multiples of 1
(Growth Plan)
50,000 & multiples of 1
(other than Growth Plan)
5,000 & in multiples of 1
(Growth Plan)
10,000 & in multiples of 1
(other than Growth Plan)
•
•
•
•
•
•
•
•
•
•
•
•
•
31/05/2019
Month of May 2019
May 31, 2019
`
`
` `
` `
` `
` `
PORTFOLIO CLASSIFICATION BY
ASSET ALLOCATION (%)
Option NAV ( )`
Institutional-Daily Dividend 1,003.2500
Institutional-Fortnightly Dividend 1,025.7549
Institutional-Growth 2,978.0417
Institutional-Weekly Dividend 1,061.5929
Reg-Plan-Daily Dividend 1,003.2500
Reg-Plan-Fortnightly Dividend 1,014.4218
NET ASSET VALUE
Option NAV ( )`
Reg-Plan-Growth 2,950.2105
Reg-Plan-Weekly Dividend 1,062.3031
Dir-Plan-Daily Dividend 1,003.2500
Dir-Plan-Fortnightly Dividend 1,014.4571
Dir-Plan-Growth 2,963.1128
Dir-Plan-Weekly Dividend 1,062.3203
PORTFOLIO
Commercial PapersL&T Infrastructure FinanceCompany Ltd. [ICRA]A1+ 4.82Reliance Retail Ltd. CRISIL A1+ 4.14Vedanta Ltd. CRISIL A1+ 4.14Indian Oil Corporation Ltd. CRISIL A1+ 3.95Bajaj Housing Finance Ltd. CRISIL A1+ 2.69Tata Motors Finance Ltd. CRISIL A1+ 2.69HDFC Ltd. CRISIL A1+ 2.40Reliance Jio Infocomm Ltd. CRISIL A1+ 2.32Chennai Petroleum Corporation Ltd. CRISIL A1+ 2.24Tata Motors Finance Solutions Ltd. CRISIL A1+ 2.02Sun Pharma Laboratories Ltd. [ICRA]A1+ 1.93Tata Sponge Iron Ltd. [ICRA]A1+ 1.93JSW Steel Ltd. [ICRA]A1+ 1.79Manappuram Finance Ltd. CRISIL A1+ 1.73Indus Towers Ltd. CRISIL A1+ 1.55Tata Motor Finance Holdings Ltd. [ICRA]A1+ 1.51Azim Premji Trust BWR A1+ 1.48Power Grid Corporation Of India Ltd. CRISIL A1+ 1.34Bharti Airtel Ltd. CRISIL A1+ 1.34Trapti Trading & InvestmentsPrivate Ltd. [ICRA]A1+ 1.21Reliance Industries Ltd. CRISIL A1+ 1.16Muthoot Finance Ltd. CRISIL A1+ 1.02Ultratech Cement Ltd. CRISIL A1+ 0.97Tata Power Company Ltd. CRISIL A1+ 0.97ICICI Securities PrimaryDealership Ltd. CRISIL A1+ 0.97CESC Ltd. [ICRA]A1+ 0.96Shriram Transport FinanceCompany Ltd. CRISIL A1+ 0.96Hasham Investment And TradingCompany Pvt. Ltd. CRISIL A1+ 0.87Tata Capital Housing Finance Ltd. CRISIL A1+ 0.87L&T Finance Holdings Ltd. [ICRA]A1+ 0.77Power Finance Corporation Ltd. CRISIL A1+ 0.77Century Textiles & Industries Ltd. CRISIL A1+ 0.77Tgs Investment & Trade Pvt. Ltd. [ICRA]A1+ 0.72Motilal Oswal Financial Services Ltd. CRISIL A1+ 0.67Turquoise Investments And FinancePrivate Ltd. CRISIL A1+ 0.67Tata Capital Financial Services Ltd. CRISIL A1+ 0.58HPCL-Mittal Energy Ltd. [ICRA]A1+ 0.58Cholamandalam Investment AndFinance Company Ltd. CRISIL A1+ 0.58Tata Cleantech Capital Ltd. CRISIL A1+ 0.58Tata Motor Finance Holdings Ltd. CRISIL A1+ 0.58Ashok Leyland Ltd. [ICRA]A1+ 0.58Talwandi Sabo Power Ltd. CRISIL A1+(SO) 0.55NABARD CRISIL A1+ 0.53HPCL-Mittal Pipelines Ltd. IND A1+ 0.53Sun Pharmaceutical Industries Ltd. CRISIL A1+ 0.48TVS Credit Services Ltd. CRISIL A1+ 0.48Viacom 18 Media Pvt. Ltd. [ICRA]A1+ 0.48Kotak Securities Ltd. CRISIL A1+ 0.39Tata Motors Ltd. CRISIL A1+ 0.39GIC Housing Finance Ltd. CRISIL A1+ 0.39Coromandel International Ltd. CRISIL A1+ 0.39Nirma Ltd. CRISIL A1+ 0.39
BASF India Ltd. CRISIL A1+ 0.39NABHA Power Ltd. CRISIL A1+ 0.39Can Fin Homes Ltd. [ICRA]A1+ 0.39Tata Motors Ltd. [ICRA]A1+ 0.38Bahadur Chand Investments Pvt. Ltd. [ICRA]A1+ 0.37Motilal Oswal Finvest Ltd. CRISIL A1+ 0.29Essel Mining & Industries Ltd. [ICRA]A1+ 0.29Volkswagen Finance Private Ltd. [ICRA]A1+ 0.29ICICI Home Finance Company Ltd. [ICRA]A1+ 0.29Export-Import Bank Of India CRISIL A1+ 0.24TV18 Broadcast Ltd. [ICRA]A1+ 0.24Sundaram Finance Ltd. CRISIL A1+ 0.19Rashtriya Chemicals AndFertilizers Ltd. CRISIL A1+ 0.19ICICI Securities Ltd. CRISIL A1+ 0.19Network18 Media & Investments Ltd. [ICRA]A1+ 0.14Birla Tmt Holdings Pvt. Ltd. CRISIL A1+ 0.10L&T Infra Debt Fund Ltd. CRISIL A1+ 0.10Aarti Industries Ltd. CRISIL A1+ 0.10Godrej Agrovet Ltd. [ICRA]A1+ 0.07
Bank Of Baroda CARE A1+ 3.05Indusind Bank Ltd. CRISIL A1+ 2.64Punjab National Bank [ICRA]A1+ 2.12IDFC First Bank Ltd. [ICRA]A1+ 1.93Bandhan Bank Ltd. [ICRA]A1+ 1.83RBL Bank Ltd. [ICRA]A1+ 1.63Axis Bank Ltd. CRISIL A1+ 1.54Syndicate Bank IND A1+ 1.14ICICI Bank Ltd. [ICRA]A1+ 1.00The Federal Bank Ltd. CRISIL A1+ 0.95Bank Of India CRISIL A1+ 0.47Canara Bank CRISIL A1+ 0.39Small Industries DevelopmentBank Of India CRISIL A1+ 0.35Oriental Bank Of Commerce CRISIL A1+ 0.19Kotak Mahindra Bank Ltd. CRISIL A1+ 0.10NABARD CRISIL A1+ 0.04Andhra Bank IND A1+ 0.01
Power Finance Corporation Ltd. CRISIL AAA 1.02Indian Railway FinanceCorporation Ltd. CRISIL AAA 0.78REC Ltd. CRISIL AAA 0.28Housing And Urban DevelopmentCorporation Ltd. [ICRA]AAA 0.24
91 Day T-Bill 29.08.19 SOVEREIGN 3.2691 Day T-Bill 18.07.19 SOVEREIGN 1.2691 Day T-Bill 04.07.19 SOVEREIGN 1.1691 Day T-Bill 15.08.19 SOVEREIGN 0.8291 Day T-Bill 08.08.19 SOVEREIGN 0.39182 Day T-Bill 27.06.19 SOVEREIGN 0.14
Total 73.43Certificate Of Deposits
Total 19.37Non Convertible Debentures
Total 2.32Treasury Bills
Total 7.03Cash, Cash Equivalents And Others -2.14Grand Total 100.00
Issuer Name Rating (%) Of TotalAUM
Issuer Name Rating (%) Of TotalAUM
Investors understand that their principal
will be at Low risk
^Investors should consult their financial advisers if in doubt about whether the product is suitablefor them.
Sovereign Cash, Cash Equivalents And Others
A1+AAA and Equivalent
(Previously known as SBI Premier Liquid Fund)
2.32 7.03
92.80
-2.14

53
�
�
Regular income for short term
Investment in Debt and Money Market instruments.
SBI Magnum Ultra Short Duration FundThis product is suitable for investors who are seeking^:
PORTFOLIO CLASSIFICATION BY
RATING CLASS (%)
Non Convertible Debentures 38.86
Commercial Papers 30.75
Certificate Of Deposits 25.56
Securitised Debt 0.95
Zero Coupon Bonds 0.56
Cash, Cash Equivalents And Others 3.31
PORTFOLIO CLASSIFICATION BY
ASSET ALLOCATION (%)
DEBT- ULTRA SHORTDURATION FUND
Option NAV ( )`
Reg-Plan-Growth Option 4,199.3911
Reg-Plan-Daily Dividend 1,675.0300
Reg-Plan-Weekly Dividend 1,078.8564
NET ASSET VALUE
Option NAV ( )`
Dir-Plan-Growth 4,223.3021
Dir-Plan-Daily Dividend 1,675.0300
Dir-Plan-Weekly Dividend 1,078.8717
PORTFOLIO
Commercial Papers
Total 30.75
Certificate Of Deposits
Total 25.56
Non Convertible Debentures
Bajaj Finance Ltd. CRISIL A1+ 3.40
Indian Oil Corporation Ltd. CRISIL A1+ 2.87
Tata Realty And Infrastructure Ltd. [ICRA]A1+ 2.83
LIC Housing Finance Ltd. CRISIL A1+ 2.50
Power Finance Corporation Ltd. CRISIL A1+ 2.22
Tata Motors Ltd. [ICRA]A1+ 2.20
Bharat Aluminium Company Ltd. CRISIL A1+ 1.70
Mahindra & Mahindra FinancialServices Ltd. CRISIL A1+ 1.63
Vedanta Ltd. CRISIL A1+ 1.45
Tata Power Renewable Energy Ltd. CRISIL A1+ 1.15
HDB Financial Services Ltd. CRISIL A1+ 1.15
Emami Ltd. CRISIL A1+ 1.11
HDFC Ltd. CRISIL A1+ 1.10
REC Ltd. CRISIL A1+ 1.10
United Spirits Ltd. CRISIL A1+ 0.85
Housing And Urban DevelopmentCorporation Ltd. IND A1+ 0.85
Sundaram BNP Paribas HomeFinance Ltd. CRISIL A1+ 0.83
Sundaram Finance Ltd. CRISIL A1+ 0.83
Dalmia Cement (Bharat) Ltd. [ICRA]A1+ 0.57
Samvardhana MothersonInternational Ltd. CRISIL A1+ 0.32
Shriram City Union Finance Ltd. [ICRA]A1+ 0.11
Axis Bank Ltd. CRISIL A1+ 7.14
NABARD CRISIL A1+ 6.48
Small Industries DevelopmentBank Of India CRISIL A1+ 3.27
Andhra Bank IND A1+ 3.23
Bank Of Baroda [ICRA]A1+ 2.69
ICICI Bank Ltd. [ICRA]A1+ 1.37
AU Small Finance Bank Ltd. CRISIL A1+ 1.08
Equitas Small Finance Bank Ltd. CRISIL A1+ 0.29
Power Finance Corporation Ltd. CRISIL AAA 3.70
Citicorp Finance (India) Ltd. [ICRA]AAA 3.45
Indostar Capital Finance Ltd. CARE AA- 3.34
HDFC Ltd. CRISIL AAA 3.18
LIC Housing Finance Ltd. CRISIL AAA 2.88
Sunbeam LightweightingSolutions Pvt. Ltd CRISIL AA- 2.42
REC Ltd. CRISIL AAA 2.13
Power Grid Corporation OfIndia Ltd. CRISIL AAA 1.92
Gruh Finance Ltd. CRISIL AAA 1.73
Nabha Power Ltd. [ICRA]AAA(SO) 1.58
Orix Leasing & FinancialServices India Ltd. IND AAA 1.38
Reliance Industries Ltd. CRISIL AAA 1.17
L&T Finance Ltd. [ICRA]AAA 1.16
Tata Capital Ltd. CRISIL AAA 1.15
Nuvoco Vistas Corporation Ltd. CRISIL AA 0.86
Cholamandalam Investment AndFinance Company Ltd. IND AA+ 0.86
Tata Sons Ltd. CRISIL AAA 0.86
Shriram City Union Finance Ltd. CARE AA+ 0.81
Tata Realty And Infrastructure Ltd. CRISIL AA 0.77
Sundaram Finance Ltd. [ICRA]AAA 0.58
ONGC MangalorePetrochemicals Ltd. IND AAA 0.58
Cholamandalam Investment AndFinance Company Ltd. [ICRA]AA+ 0.57
HDB Financial Services Ltd. CRISIL AAA 0.57
Housing And Urban DevelopmentCorporation Ltd. [ICRA]AAA 0.52
NABARD CRISIL AAA 0.29
Indian Railway FinanceCorporation Ltd. CRISIL AAA 0.29
Tata Capital Financial Services Ltd. [ICRA]AAA 0.12
Bajaj Finance Ltd. CARE AAA 0.56
Reliance Retail Ltd. [ICRA]AAA(SO) 0.95
Total 38.86
Zero Coupon Bonds
Total 0.56
Securitised Debt
Total 0.95
Cash, Cash Equivalents And Others 3.31
Grand Total 100.00
Issuer Name Rating (%) Of TotalAUM
Issuer Name Rating (%) Of TotalAUM
Investors understand that their principal
will be at Low risk
^Investors should consult their financial advisers if in doubt about whether the product is suitablefor them.
Investment Objective
Quantitative Data
To provide investors with an opportunity
to generate regular income with high
degree of liquidity through investments
in a portfolio comprising predominantly
of debt and money market instruments.
Fund Details
Modified Duration :
Average Maturity :
Yield to Maturity :
0.46
0.49 years
7.35%
years
•
•
•
•
•
•
•
•
•
•
•
•
•
•
Type of Scheme
Date of Allotment:
Report As On:
AAUM for the
AUM as on
Fund Manager:
Mr. Rajeev Radhakrishnan
Managing Since:
Total Experience:
Benchmark:
Exit Load:
Entry Load:
Plans Available:
Options:
SIP:
Minimum Investment
Additional Investment
An open-ended ultra-short-term Debt
Scheme investing in instruments such
that the Macaulay Duration of the
portfolio is between 3 months to 6
months. (
21/05/1999
8,407.71 Crores
8,747.15 Crores
May-2010
Over 17 years
NIFTY Ultra Short Duration
Debt Index (w.e.f June 25,2018)
Nil
N.A.
Regular, Direct
Growth, Dividend
N.A.
5,000 & in multiples of 1
1,000 & in multiples of 1
31/05/2019
Month of May 2019
May 31, 2019
`
`
` `
` `
Please refer to the page no. 15
of SID for details on Macaulay’s
Duration.)
(Previously known as SBI Magnum InstaCash Fund)
AAA and Equivalent Below AAAA+A1+ AA
Cash, Cash Equivalents And Others
30.74
2.241.64
5.77
56.31
3.31
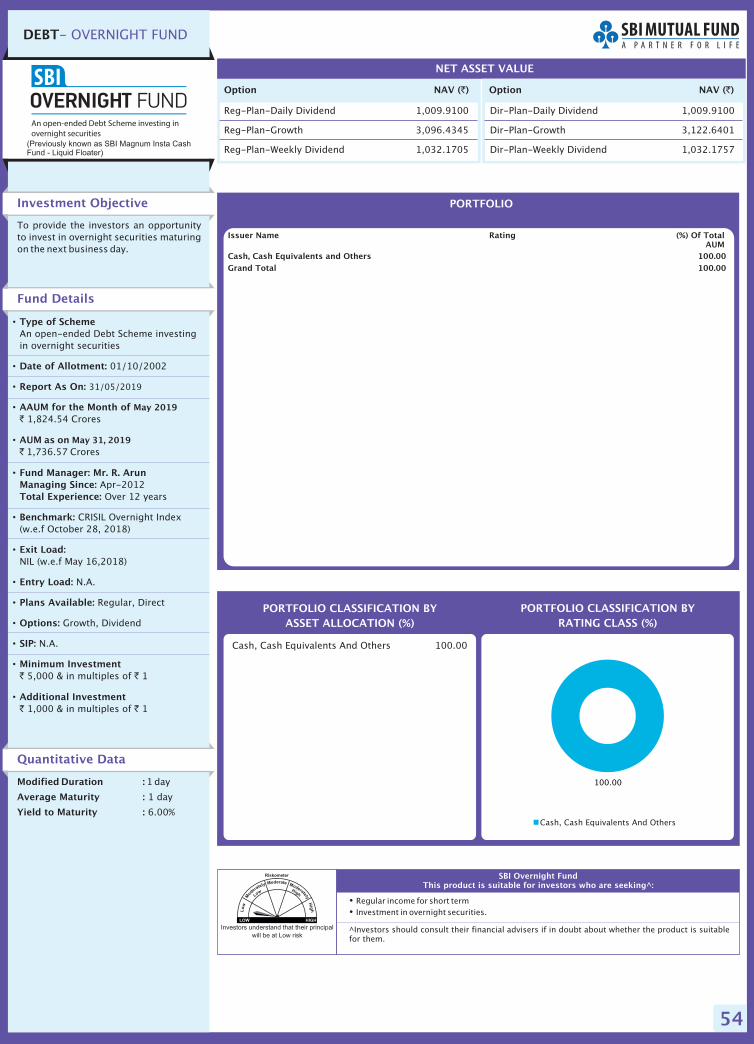
54
�
�
Regular income for short term
Investment in overnight securities.
SBI Overnight FundThis product is suitable for investors who are seeking^:
PORTFOLIO CLASSIFICATION BY
RATING CLASS (%)
Cash, Cash Equivalents And Others 100.00
Investment Objective
Quantitative Data
To provide the investors an opportunity
to invest in overnight securities maturing
on the next business day.
Fund Details
Modified Duration :
Average Maturity :
Yield to Maturity :
1 day
1 day
6.00%
•
•
•
•
•
•
•
•
•
•
•
•
•
•
Type of Scheme
Date of Allotment:
Report As On:
AAUM for the Month of
AUM as on
Fund Manager: Mr. R. Arun
Managing Since:
Total Experience:
Benchmark:
Exit Load:
Entry Load:
Plans Available:
Options:
SIP:
Minimum Investment
Additional Investment
An open-ended Debt Scheme investing
in overnight securities
01/10/2002
1,824.54 Crores
1,736.57 Crores
Apr-2012
Over 12 years
CRISIL Overnight Index
(w.e.f October 28, 2018)
NIL (w.e.f May 16,2018)
N.A.
Regular, Direct
Growth, Dividend
N.A.
5,000 & in multiples of 1
1,000 & in multiples of 1
31/05/2019
May 2019
May 31, 2019
`
`
` `
` `
PORTFOLIO CLASSIFICATION BY
ASSET ALLOCATION (%)
DEBT- OVERNIGHT FUND
Option NAV ( )`
Reg-Plan-Daily Dividend 1,009.9100
Reg-Plan-Growth 3,096.4345
Reg-Plan-Weekly Dividend 1,032.1705
NET ASSET VALUE
Option NAV ( )`
Dir-Plan-Daily Dividend 1,009.9100
Dir-Plan-Growth 3,122.6401
Dir-Plan-Weekly Dividend 1,032.1757
PORTFOLIO
Cash, Cash Equivalents and Others 100.00
Grand Total 100.00
Issuer Name (%) Of TotalAUM
Rating
Investors understand that their principal
will be at Low risk^Investors should consult their financial advisers if in doubt about whether the product is suitablefor them.
Cash, Cash Equivalents And Others
100.00
(Previously known as SBI Magnum Insta CashFund - Liquid Floater)

55
Comparative Performance for all Schemes
Note: Wherever NAV/Benchmark Index value is not available for start/end date for concerned period, the previous business day value of NAV/Benchmark Index is considered for return computation.
CAGR %Point-to-Point
returns on StandardInvestment ofRs. 10,000/-
CAGR %Point-to-Point
returns on StandardInvestment ofRs. 10,000/-
CAGR %Point-to-Point
returns on StandardInvestment ofRs. 10,000/-
3 Years 5 Years
CAGR %Point-to-Point
returns on StandardInvestment ofRs. 10,000/-
Since Inception
Inception Date &Managing Since
Managing Since
May-09
Inception Date
17-09-2004
1 Year
Managing Since
Nov-13
Inception Date
09-09-2009
7.00 10,700 15.28 15,319 16.99 21,932 20.03 1,46,644
6.32 10,632 14.36 14,956 12.44 17,982 15.37 81,943
13.70 11,370 15.65 15,470 11.91 17,566 15.90 87,628
-5.45 9,455 17.37 16,169 24.69 30,178 18.61 52,626
-13.10 8,690 10.89 13,637 11.48 17,229 9.02 23,174
13.70 11,370 15.65 15,470 11.91 17,566 11.22 28,140
SBI Focused Equity Fund
SBI Small Cap Fund
Scheme Benchmark: - S&P BSE 500 (TRI)
Additional Benchmark: - S&P BSE Sensex (TRI)
Scheme Benchmark: - S&P BSE Small Cap (TRI)
Additional Benchmark: - S&P BSE Sensex (TRI)
Funds Managed by R. Srinivasan
Notes:
a.
c. Past performance may or may not be sustained in future and the same may not necessarily provide the basis for comparison with other investment.
d. Load is not considered for computation of returns.
e. Period for which scheme’s performance has been provided is computed basis last day of the month-end preceding the date of advertisement. In case, the start/end date of the concerned period is a non-business day, the NAV of the
previous date is considered for computation of returns.
The details of the period since the Fund Manager is managing the scheme(s) & inception date provided alongside of the table. The total no of schemes managed by Mr. R.Srinivasan is 3 ( 1 scheme is jointly managed by Mr. DineshAhuja). The
total no of schemes managed by Dinesh Ahuja is 6 (1 schemes is jointly managed by Mr. Ruchit Mehta & 1 scheme is jointly managed by Mr. R. Srinivasan). The total no of schemes managed by Mr. Ruchit Mehta is 3 (1 scheme is jointly
managed by Mr. DineshAhuja and 1 scheme is jointly managed with Mr. Neeraj Kumar).
b. Different plans shall have a different expense structure. The performance provided for SBI Magnum Equity ESG Fund and SBI Equity Hybrid Fund are of Regular Plan- Dividend Option and is Net of Dividend distribution tax, if any.
Performance for all other scheme(s) are of Regular- growth option. SBI Magnum Equity ESG Fund Growth option introduced on 27-Nov-06, SBI Equity Hybrid Fund Growth option introduced on 19-Jan-05.
h. SBI Equity Hybrid Fund, SBI Debt Hybrid Fund, SBI Magnum Equity ESG Fund: As the scheme was launched before the launch of the benchmark index, benchmark index figures since inception or the required period are not
available.
i. SBI Equity Hybrid Fund: As scheme additional benchmark TRI data is not available since inception of the scheme, additional benchmark performance is calculated using composite CAGR of S&P BSE Sensex PRI values from 9-Oct-
95 to 18-Aug-96 and TRI values since 19-Aug-96.
j. SBI Magnum Gilt Fund, SBI Magnum Income Fund, SBI Debt Hybrid Fund: As the scheme was launched before the launch of the additional benchmark index, additional benchmark index figures since inception or the required period
are not available.
k. Pursuant to the circular issued by SEBI on Categorization and Rationalization of the Schemes , there has been change in the fundamental attributes (like asset allocation, benchmark and investment objectives) of SBI Multi Asset
Allocation Fund with effect from May 16, 2018, hence the performance of SBI Multi Asset Allocation Fund is not disclosed.
In case of return calculated
the dividend option, it is assumed that dividend declared under the schemes have been reinvested at the prevailing NAV.
f. Scheme count for the total schemes managed by the Fund Managers does not include close ended Scheme.
g. SBI Focused Equity Fund: As scheme benchmark TRI data is not available since inception of the scheme, benchmark performance is calculated using composite CAGR of S&P BSE 500 PRI values from 17-Sep-04 to 31-Jul-06 and
TRI values since 01-Aug-06.
l. The performance of the schemes is benchmarked to the Total Return variant of the Index.
Managing Since
Jan-11
Inception Date
09-02-2004
Managing Since
Jan-11
Inception Date
25-11-1998
Managing Since
Jan-11
Managing Since
Jul-11
Inception Date
30-12-2000
Inception Date
12-11-2003
Inception Date
09-10-1995
Inception Date
09-04-2001
Inception Date
01-01-1991
Managing Since
Jan-12
Managing Since
Jul-11
Managing Since
May-18
Funds Managed by Dinesh Ahuja
Fund Jointly Managed by R. Srinivasan (Equity portion) & Dinesh Ahuja (Debt portion)
Fund Jointly Managed by Dinesh Ahuja (Debt portion) & Ruchit Mehta (Equity portion)
Fund Managed by Ruchit Mehta
10.26 11,026 8.41 12,740 8.83 15,274 5.73 23,480
10.52 11,052 7.58 12,450 8.65 15,146 6.89 27,748
12.20 11,220 6.75 12,165 8.23 14,859 5.62 23,090
8.96 10,896 8.00 12,597 8.49 15,034 7.67 45,559
10.05 11,005 7.84 12,542 9.05 15,426 10.09 71,955
12.20 11,220 6.75 12,165 8.23 14,859 N.A. N.A.
10.54 11,054 8.74 12,858 10.18 16,247 8.09 41,925
11.93 11,193 7.74 12,505 9.02 15,406 8.74 46,795
12.20 11,220 6.75 12,165 8.23 14,859 N.A. N.A.
9.30 10,930 9.04 12,963 9.47 15,725 7.95 32,856
9.48 10,948 7.52 12,431 8.45 15,009 7.36 30,193
12.20 11,220 6.75 12,165 8.23 14,859 5.55 23,177
8.84 10,884 12.31 14,168 14.06 19,321 15.74 3,17,412
9.42 10,942 12.42 14,208 11.52 17,252 N.A. N.A.
13.70 11,370 15.65 15,470 11.91 17,566 12.45 1,60,492
5.75 10,575 7.13 12,294 9.01 15,401 7.93 39,981
10.91 11,091 8.77 12,868 9.25 15,567 N.A. N.A.
12.20 11,220 6.75 12,165 8.23 14,859 N.A. N.A.
10.68 11,068 12.49 14,233 13.19 18,596 14.49 4,68,738
11.22 11,122 15.13 15,260 12.98 18,417 N.A. N.A.
13.70 11,370 15.65 15,470 11.91 17,566 15.32 5,75,452
SBI Dynamic Bond Fund
SBI Magnum Income Fund
SBI Magnum Gilt Fund
SBI Magnum Medium Duration Fund
SBI Equity Hybrid Fund
SBI Debt Hybrid Fund
Scheme Benchmark: - NIFTY Composite Debt Index
Additional Benchmark: - CRISIL 10 Year Gilt Index
Scheme Benchmark: - CRISIL Medium to Long Term Debt Index
Additional Benchmark: - CRISIL 10 Year Gilt Index
Scheme Benchmark: - CRISIL Dynamic Gilt index
Additional Benchmark: - CRISIL 10 Year Gilt Index
Scheme Benchmark: - NIFTY Medium Duration Debt Index
Additional Benchmark: - CRISIL 10 Year Gilt Index
Scheme Benchmark: - CRISIL Hybrid 35+65 - Aggressive Index
Additional Benchmark: - S&P BSE Sensex (TRI)
Scheme Benchmark: - NIFTY 50 Hybrid Composite Debt 15:85Index
Additional Benchmark: - CRISIL 10 Year Gilt Index
SBI Magnum Equity ESG Fund
Scheme Benchmark: - Nifty 100 ESG Index (TRI)
Additional Benchmark: - S&P BSE Sensex (TRI)

56
Comparative Performance for all Schemes
Notes:
a.
b.
c. Past performance may or may not be sustained in future and the same may not necessarily provide the basis for comparison with other investment.
d. Load is not considered for computation of returns.
e. Period for which scheme’s performance has been provided is computed basis last day of the month-end preceding the date of advertisement. In case, the start/end date of the concerned period is a non-business day, the NAV of the
previous date is considered for computation of returns.
f. Scheme count for the total schemes managed by the Fund Managers does not include ended Scheme.
The details of the period since the Fund Manager is managing the scheme(s) & inception date provided alongside of the table. The total no of schemes managed by Mr. Neeraj Kumar is 2 (1 scheme is jointly managed by Mr. Ruchit
Mehta). The total no of schemes managed by Mr. Anup Upadhyay is 3. The total no of of schemes jointly managed by Mr. Lokesh Mallya and Ms. Mansi Sajeja is 1.
Different plans shall have a different expense structure. The performance provided for SBI Technology Opportunities Fund, SBI Magnum Global Fund are of Regular plan - Dividend Option and is Net of Dividend distribution tax, if any.
SBI Technology Opportunities Fund Growth option introduced on 01-Jan-13, SBI Magnum Global Fund Growth option introduced on 27-Jun-05. The performance details provided for SBI Magnum MultiCap Fund, SBI Arbitrage
Opportunities Fund, SBI Equity Savings Fund, SBI Credit Risk Fund are of Growth Option-Regular Plan. In case of return calculated the dividend option, it is assumed that dividend declared under the schemes have been reinvested at
the prevailing NAV.
close
g. The data of the last working day has been considered for the calculation of performance.
h. SBI Equity Savings Fund & SBI Credit Risk Fund have not completed 5 years period, hence the performance of such period are not provided.
i. SBI Magnum Multicap Fund: As scheme benchmark TRI data is not available since inception of the scheme, benchmark performance is calculated using composite CAGR of S&P BSE 500 PRI values from 29-Sep-05 to 31-Jul-06 and
TRI values since 01-Aug-06.
j. SBI Magnum Global Fund: As scheme additional benchmark TRI data is not available since inception of the scheme, additional benchmark performance is calculated using composite CAGR of S&P BSE Sensex PRI values 30-Sep-94
to 18-Aug-96 and TRI values since 19-Aug-96.
k. SBI Arbitrage Opportunities Fund, SBI Technology Opportunities Fund & SBI Magnum Global Fund : As the scheme was launched before the launch of the benchmark index, benchmark index figures since inception or the required
period are not available.
l. The performance of the schemes is benchmarked to the Total Return variant of the Index.
CAGR %Point-to-Point
returns on StandardInvestment ofRs. 10,000/-
CAGR %Point-to-Point
returns on StandardInvestment ofRs. 10,000/-
CAGR %Point-to-Point
returns on StandardInvestment ofRs. 10,000/-
3 Years 5 Years
CAGR %Point-to-Point
returns on StandardInvestment ofRs. 10,000/-
Since Inception
Inception Date &Managing Since
Managing Since
Oct-12
Inception Date
03-11-2006
SBI Arbitrage Opportunities Fund
SBI Equity Savings Fund
Scheme Benchmark: - Nifty 50 Arbitrage Index.
Additional Benchmark: - S&P BSE Sensex (TRI)
Scheme Benchmark: - Nifty Equity Savings Index
Additional Benchmark: - S&P BSE Sensex (TRI)
6.45 10,645 6.18 11,970 6.56 13,747 7.34 24,378
6.03 10,603 5.42 11,715 6.21 13,518 N.A. N.A.
13.70 11,370 15.65 15,470 11.91 17,566 10.70 35,926
5.16 10,516 7.17 12,308 N.A. N.A. 7.19 13,216
9.30 10,930 9.63 13,176 N.A. N.A. 8.33 13,786
13.70 11,370 15.65 15,470 N.A. N.A. 11.03 15,218
1 Year
Managing Since
May-15
Inception Date
27-05-2015
Fund Jointly Managed by Neeraj Kumar (Arbitrage portion) & Ruchit Mehta (Equity & Debt portion)
Funds Managed by Neeraj Kumar
Managing Since
Jun-11
Inception Date
05-07-1999
Managing Since
Feb-17
Inception Date
29-09-2005
Funds Managed by Anup Upadhyay
Managing Since
May-18
Inception Date
30-09-1994
SBI Technology Opportunities Fund
SBI Magnum MultiCap Fund
SBI Magnum Global Fund
Scheme Benchmark: - S&P BSE Teck (TRI)
Additional Benchmark: - S&P BSE Sensex (TRI)
Scheme Benchmark: - S&P BSE 500 (TRI)
Additional Benchmark: - S&P BSE Sensex (TRI)
Scheme Benchmark: - Nifty MNC (TRI)
Additional Benchmark: - S&P BSE Sensex (TRI)
10.07 11,007 11.88 14,003 14.21 19,446 13.50 1,24,650
13.50 11,350 9.66 13,186 11.92 17,574 N.A. N.A.
13.70 11,370 15.65 15,470 11.91 17,566 13.60 1,26,770
6.75 10,675 13.86 14,762 16.75 21,712 12.59 50,634
6.32 10,632 14.36 14,956 12.44 17,982 12.84 52,176
13.70 11,370 15.65 15,470 11.91 17,566 13.33 55,368
-0.57 9,943 7.98 12,592 13.23 18,628 14.16 2,62,751
-7.06 9,294 14.46 14,995 14.35 19,567 N.A. N.A.
13.70 11,370 15.65 15,470 11.91 17,566 11.10 1,34,321
Managing Since
Feb-17
Inception Date
17-07-2014
SBI Credit Risk Fund
Scheme Benchmark: - CRISIL Composite CRISIL Credit RiskIndex
Additional Benchmark: - CRISIL 10 Year Gilt Index
7.12 10,712 7.27 12,343 N.A. N.A. 8.44 14,843
7.03 10,703 8.11 12,636 N.A. N.A. 9.25 15,391
12.20 11,220 6.75 12,165 N.A. N.A. 8.35 14,781
Funds Managed by Lokesh Mallya and Mansi Sajeja
CAGR %Point-to-Point
returns on StandardInvestment ofRs. 10,000/-
CAGR %Point-to-Point
returns on StandardInvestment ofRs. 10,000/-
CAGR %Point-to-Point
returns on StandardInvestment ofRs. 10,000/-
3 Years 5 Years
CAGR %Point-to-Point
returns on StandardInvestment ofRs. 10,000/-
Since Inception
Inception Date &Managing Since
1 Year
2.75 10,275 10.70 13,566 10.82 16,724 4.06 16,069
2.37 10,237 8.45 12,756 2.62 11,384 -0.10 9,883
13.70 11,370 15.65 15,470 11.91 17,566 10.05 31,268
Funds Managed by Nidhi Chawla
SBI Infrastructure Fund
Scheme Benchmark: - Nifty Infrastructure (TRI)
Additional Benchmark: - S&P BSE Sensex (TRI)
Inception Date
06-07-2007
Managing Since
Nov-18
Notes:
a. The details of the period since the Fund Manager is managing the scheme(s) & inception date provided alongside of the table. The total number of schemes managed by Mrs. Nidhi Chawla is 1.
b. Past performance may or may not be sustained in future and the same may not necessarily provide the basis for comparison with other investment.
c. Load is not considered for computation of returns.
d. Period for which scheme's performance has been provided is computed basis last day of the month-end preceding the date of advertisement. In case, the start/end date of the concerned period is a non-business day, the NAV of the previous date
is considered for computation of returns.
e. Different plans shall have a different expense structure. The performance details provided herein are of Growth Option - Regular Plan. Performance for Schemes not having Growth Option has been calculated considering the Dividend Option
and is Net of Dividend distribution tax, if any.
f. Scheme count for the total schemes managed by the Fund Managers does not include close ended Scheme.
g. The data of the last working day has been considered for the calculation of performance.
h.The performance of the schemes is benchmarked to the Total Return variant of the Index.
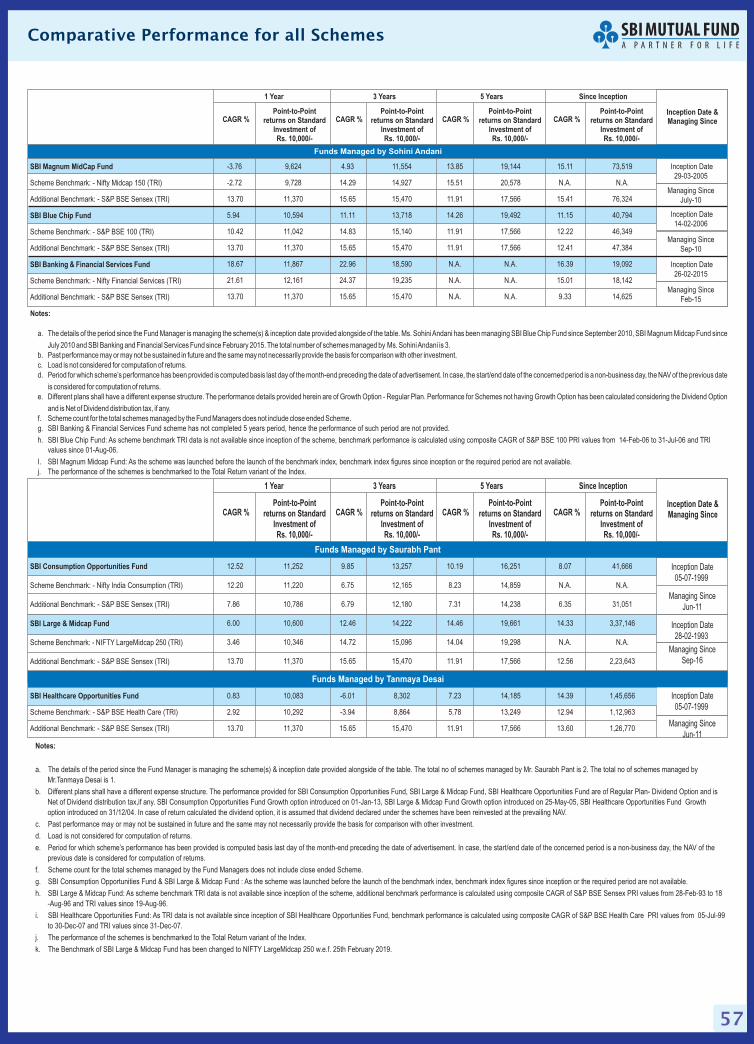
57
Comparative Performance for all Schemes
Notes:
a.
b.
c. Past performance may or may not be sustained in future and the same may not necessarily provide the basis for comparison with other investment.
d. Load is not considered for computation of returns.
e. Period for which scheme’s performance has been provided is computed basis last day of the month-end preceding the date of advertisement. In case, the start/end date of the concerned period is a non-business day, the NAV of the
previous date is considered for computation of returns.
f. Scheme count for the total schemes managed by the Fund Managers does not include ended Scheme.
The details of the period since the Fund Manager is managing the scheme(s) & inception date provided alongside of the table. The total no of schemes managed by Mr. Saurabh Pant is 2. The total no of schemes managed by
Mr.Tanmaya Desai is 1.
Different plans shall have a different expense structure. The performance provided for SBI Consumption Opportunities Fund, SBI Large & Midcap Fund, SBI Healthcare Opportunities Fund are of Regular Plan- Dividend Option and is
Net of Dividend distribution tax,if any. SBI Consumption Opportunities Fund Growth option introduced on 01-Jan-13, SBI Large & Midcap Fund Growth option introduced on 25-May-05, SBI Healthcare Opportunities Fund Growth
option introduced on 31/12/04. In case of return calculated the dividend option, it is assumed that dividend declared under the schemes have been reinvested at the prevailing NAV.
close
g. SBI Consumption Opportunities Fund & SBI Large & Midcap Fund : As the scheme was launched before the launch of the benchmark index, benchmark index figures since inception or the required period are not available.
h. SBI Large & Midcap Fund: As scheme benchmark TRI data is not available since inception of the scheme, additional benchmark performance is calculated using composite CAGR of S&P BSE Sensex PRI values from 28-Feb-93 to 18
-Aug-96 and TRI values since 19-Aug-96.
i. SBI Healthcare Opportunities Fund: As TRI data is not available since inception of SBI Healthcare Opportunities Fund, benchmark performance is calculated using composite CAGR of S&P BSE Health Care PRI values from 05-Jul-99
to 30-Dec-07 and TRI values since 31-Dec-07.
j. The performance of the schemes is benchmarked to the Total Return variant of the Index.
k. The Benchmark of SBI Large & Midcap Fund has been changed to NIFTY LargeMidcap 250 w.e.f. 25th February 2019.
CAGR %Point-to-Point
returns on StandardInvestment ofRs. 10,000/-
CAGR %Point-to-Point
returns on StandardInvestment ofRs. 10,000/-
CAGR %Point-to-Point
returns on StandardInvestment ofRs. 10,000/-
3 Years 5 Years
CAGR %Point-to-Point
returns on StandardInvestment ofRs. 10,000/-
Since Inception
Inception Date &Managing Since
Managing Since
Jun-11
Inception Date
05-07-1999
SBI Consumption Opportunities Fund
SBI Large & Midcap Fund
Scheme Benchmark: - Nifty India Consumption (TRI)
Additional Benchmark: - S&P BSE Sensex (TRI)
Scheme Benchmark: - NIFTY LargeMidcap 250 (TRI)
Additional Benchmark: - S&P BSE Sensex (TRI)
12.52 11,252 9.85 13,257 10.19 16,251 8.07 41,666
12.20 11,220 6.75 12,165 8.23 14,859 N.A. N.A.
7.86 10,786 6.79 12,180 7.31 14,238 6.35 31,051
6.00 10,600 12.46 14,222 14.46 19,661 14.33 3,37,146
3.46 10,346 14.72 15,096 14.04 19,298 N.A. N.A.
13.70 11,370 15.65 15,470 11.91 17,566 12.56 2,23,643
Managing Since
Sep-16
Inception Date
28-02-1993
1 Year
Funds Managed by Saurabh Pant
Managing Since
Jun-11
Inception Date
05-07-1999
SBI Healthcare Opportunities Fund
Scheme Benchmark: - S&P BSE Health Care (TRI)
Additional Benchmark: - S&P BSE Sensex (TRI)
0.83 10,083 -6.01 8,302 7.23 14,185 14.39 1,45,656
2.92 10,292 -3.94 8,864 5.78 13,249 12.94 1,12,963
13.70 11,370 15.65 15,470 11.91 17,566 13.60 1,26,770
Funds Managed by Tanmaya Desai
Notes:
a. Ms. SohiniAndani has been managing SBI Blue Chip Fund since September 2010, SBI Magnum Midcap Fund since
July 2010 and SBI Banking and Financial Services Fund since February 2015. The total number of schemes managed by Ms. SohiniAndani is 3.
b. Past performance may or may not be sustained in future and the same may not necessarily provide the basis for comparison with other investment.
c. Load is not considered for computation of returns.
d. Period for which scheme’s performance has been provided is computed basis last day of the month-end preceding the date of advertisement. In case, the start/end date of the concerned period is a non-business day, the NAV of the previous date
is considered for computation of returns.
e. Different plans shall have a different expense structure. The performance details provided herein are of Growth Option - Regular Plan. Performance for Schemes not having Growth Option has been calculated considering the Dividend Option
and is Net of Dividend distribution tax, if any.
f. Scheme count for the total schemes managed by the Fund Managers does not include Scheme.close ended
g. SBI Banking & Financial Services Fund scheme has not completed 5 years period, hence the performance of such period are not provided.
h. SBI Blue Chip Fund: As scheme benchmark TRI data is not available since inception of the scheme, benchmark performance is calculated using composite CAGR of S&P BSE 100 PRI values from 14-Feb-06 to 31-Jul-06 and TRI
values since 01-Aug-06.
I. SBI Magnum Midcap Fund: As the scheme was launched before the launch of the benchmark index, benchmark index figures since inception or the required period are not available.
j. The performance of the schemes is benchmarked to the Total Return variant of the Index.
The details of the period since the Fund Manager is managing the scheme(s) & inception date provided alongside of the table.
CAGR %Point-to-Point
returns on StandardInvestment ofRs. 10,000/-
CAGR %Point-to-Point
returns on StandardInvestment ofRs. 10,000/-
CAGR %Point-to-Point
returns on StandardInvestment ofRs. 10,000/-
3 Years 5 Years
CAGR %Point-to-Point
returns on StandardInvestment ofRs. 10,000/-
Since Inception
Inception Date &Managing Since
Managing Since
July-10
Inception Date
29-03-2005
SBI Magnum MidCap Fund
SBI Blue Chip Fund
SBI Banking & Financial Services Fund
Scheme Benchmark: - Nifty Midcap 150 (TRI)
Additional Benchmark: - S&P BSE Sensex (TRI)
Scheme Benchmark: - S&P BSE 100 (TRI)
Additional Benchmark: - S&P BSE Sensex (TRI)
Scheme Benchmark: - Nifty Financial Services (TRI)
Additional Benchmark: - S&P BSE Sensex (TRI)
-3.76 9,624 4.93 11,554 13.85 19,144 15.11 73,519
-2.72 9,728 14.29 14,927 15.51 20,578 N.A. N.A.
13.70 11,370 15.65 15,470 11.91 17,566 15.41 76,324
5.94 10,594 11.11 13,718 14.26 19,492 11.15 40,794
10.42 11,042 14.83 15,140 11.91 17,566 12.22 46,349
13.70 11,370 15.65 15,470 11.91 17,566 12.41 47,384
18.67 11,867 22.96 18,590 N.A. N.A. 16.39 19,092
21.61 12,161 24.37 19,235 N.A. N.A. 15.01 18,142
13.70 11,370 15.65 15,470 N.A. N.A. 9.33 14,625
1 Year
Managing Since
Sep-10
Inception Date
14-02-2006
Managing Since
Feb-15
Inception Date
26-02-2015
Funds Managed by Sohini Andani

58
Comparative Performance for all Schemes
Notes:
a. Mr. Dinesh Balachandran has been managing SBI Magnum Taxgain Scheme since September 2016 and co
managing SBI Dynamic Asset Allocation Fund (Equity & Equity related instruments and Debt & Money Market instruments portion) since March 2015 with Mr. Mohit Jain (investments in foreign securities portion). The total number of
schemes managed by Mr. Dinesh Balachandran is 3 (1 scheme is jointly managed by Mr. Mohit Jain).
c. Mr. Mohit Jain is the fund manager for investment in foreign securities in SBI DynamicAssetAllocation fund w.e.f. Nov 28, 2017*.
d. Past performance may or may not be sustained in future and the same may not necessarily provide the basis for comparison with other investment.
e. Load is not considered for computation of returns.
f. Period for which scheme’s performance has been provided is computed basis last day of the month-end preceding the date of advertisement. In case, the start/end date of the concerned period is a non-business day, the NAV of the previous date
is considered for computation of returns.
g. Different plans shall have a different expense structure. The performance provided for SBI Magnum Taxgain Scheme, are of Regular Plan - Dividend Option and is Net of Dividend distribution tax, if any. SBI
Magnum Taxgain Scheme Growth option introduced on 07/05/07. The performance details provided for SBI DynamicAssetAllocation Fund are of Growth Option-Regular Plan.
h. Scheme count for the total schemes managed by the Fund Managers does not include ended Schemes.
SBI Contra Fund was managed by Mr. R. Srinivasan till May 04, 2018.
In case of return calculated the dividend option, it is assumed that dividend declared under the schemes have been reinvested at the prevailing NAV.
l. SBI Contra Fund: As scheme benchmark TRI data is not available since inception of the scheme, benchmark performance is calculated using composite CAGR of S&P BSE 500 PRI values from 05-Jul-99 to 31-Jul-06 and TRI values
since 01-Aug-06.
m. SBI Contra Fund: As TRI data is not available since inception of SBI Contra Fund , benchmark performance is calculated using composite CAGR of S&P BSE 500 PRI values from 05-Jul-99 to 28-Jun-07 and TRI values since 29-Jun-07.
close
i. SBI Dynamic Asset Allocation Fund scheme has not completed 5 years period, hence the performance of such period are not provided.
j. SBI Magnum Taxgain Scheme : As the scheme was launched before the launch of the benchmark index, benchmark index figures since inception or the required period are not available.
k. SBI Magnum Tax Gain Scheme:As scheme benchmark TRI data is not available since inception of the scheme, additional benchmark performance is calculated using composite CAGR of S&P BSE Sensex PRI values 31-Mar-93 to 18-Aug-96 and
TRI values since 19-Aug-96.
The details of the period since the Fund Manager is managing the scheme(s) & inception date provided alongside of the table.
b. Different plans shall have a different expense structure. The performance provided for SBI Contra Fund are of regular plan- Dividend Option and is Net of Dividend distribution tax, if any. Performance for all other scheme(s) are of Regular- growth
option. SBI Contra Fund Growth option introduced on 06/05/05.
CAGR %Point-to-Point
returns on StandardInvestment ofRs. 10,000/-
CAGR %Point-to-Point
returns on StandardInvestment ofRs. 10,000/-
CAGR %Point-to-Point
returns on StandardInvestment ofRs. 10,000/-
3 Years 5 Years
CAGR %Point-to-Point
returns on StandardInvestment ofRs. 10,000/-
Since Inception
Managing Since
Mar-15
Inception Date
26-03-2015
Fund Jointly Managed by Dinesh Balachandran (Equity & Debt portion) and Mohit Jain (investments in foreign securities portion)*
Inception Date &Managing Since
Managing Since
Sep-16
Managing Since
May-18
Inception Date
31-03-1993
Inception Date
05-07-1999
SBI Magnum Taxgain Scheme
SBI Contra Fund
SBI Dynamic Asset Allocation Fund
Scheme Benchmark: - S&P BSE 500 (TRI)
Additional Benchmark: - S&P BSE Sensex (TRI)
Scheme Benchmark: - S&P BSE 500 (TRI)
Additional Benchmark: - S&P BSE Sensex (TRI)
Scheme Benchmark: - 50% CRISIL 1 year CD Index +50% S&P BSE Sensex
Additional Benchmark: - S&P BSE Sensex (TRI)
4.63 10,463 9.72 13,207 10.99 16,854 15.68 4,53,603
6.32 10,632 14.36 14,956 12.44 17,982 N.A. N.A.
13.70 11,370 15.65 15,470 11.91 17,566 13.12 2,52,147
-2.77 9,723 8.22 12,676 10.33 16,357 18.22 2,80,627
6.32 10,632 14.36 14,956 12.44 17,982 15.32 1,71,058
13.70 11,370 15.65 15,470 11.91 17,566 13.60 1,26,770
2.70 10,270 8.23 12,677 N.A. N.A. 7.28 13,419
11.58 11,158 11.62 13,907 N.A. N.A. 9.43 14,577
13.70 11,370 15.65 15,470 N.A. N.A. 10.68 15,288
1 Year
Funds Managed by Dinesh Balachandran
Notes:
a.
The performance of the schemes is benchmarked to the Total Return variant of the Index.
The details of the period since the Fund Manager is managing the scheme(s) & inception date provided alongside of the table. Mr. Raviprakash Sharma has been managing SBI GOLD Fund since September 2011 and SBI Nifty Index Fund since February 2011. The
total number of schemes managed by Mr. Raviprakash Sharma is 2.
b. Past performance may or may not be sustained in future and the same may not necessarily provide the basis for comparison with other investment.
c. Load is not considered for computation of returns.
d. Period for which scheme’s performance has been provided is computed basis last day of the month-end preceding the date of advertisement. In case, the start/end date of the concerned period is a non-business day, the NAV of the previous date is considered for
computation of returns.
e. Different plans shall have a different expense structure. The performance provided for SBI Gold Fund, are of Regular Plan - Dividend Option and is Net of Dividend distribution tax, if any. The performance details provided for SBI Nifty Index Fund are of Growth Option-
Regular Plan.
f. Scheme count for the total schemes managed by the Fund Managers does not include ETF’s managed by Mr. Raviprakash Sharma.
g. The data of the last working day has been considered for the calculation of performance.
h.
CAGR %Point-to-Point
returns on StandardInvestment ofRs. 10,000/-
CAGR %Point-to-Point
returns on StandardInvestment ofRs. 10,000/-
CAGR %Point-to-Point
returns on StandardInvestment ofRs. 10,000/-
3 Years 5 Years
CAGR %Point-to-Point
returns on StandardInvestment ofRs. 10,000/-
Since Inception
Inception Date &Managing Since
Managing Since
Sep-11
Inception Date
12-09-2011
SBI Gold Fund
SBI Nifty Index Fund
Scheme Benchmark: - The Morning Fixing of Gold by LondonBullion Market Association (LBMA)
Additional Benchmark: - S&P BSE Sensex (TRI)
Scheme Benchmark: - Nifty 50 (TRI)
Additional Benchmark: - S&P BSE Sensex (TRI)
1.66 10,166 2.31 10,709 1.93 11,004 0.10 10,081
2.80 10,280 3.13 10,970 3.77 12,032 1.64 11,335
13.70 11,370 15.65 15,470 11.91 17,566 13.62 26,794
11.59 11,159 14.00 14,816 10.78 16,695 14.31 1,02,178
12.43 11,243 14.99 15,203 11.92 17,571 16.29 1,37,643
13.70 11,370 15.65 15,470 11.91 17,566 16.99 1,52,860
1 Year
Managing Since
Feb-11
Inception Date
17-01-2002
Funds Managed by Raviprakash Sharma

59
Comparative Performance for all Schemes
Notes:
a. The total number of schemes managed by Mr. Richard D’souza is 2.b. Past performance may or may not be sustained in future and the same may not necessarily provide the basis for comparison with other investment.c. Load is not considered for computation of returns.d. Period for which scheme’s performance has been provided is computed basis last day of the month-end preceding the date of advertisement. In case, the start/end date of the concerned period is a non-business day, the NAV of the previous date
is considered for computation of returns.e. Different plans shall have a different expense structure. The performance details provided herein are of Growth Option - Regular Plan. Performance for Schemes not having Growth Option has been calculated considering the Dividend Option
and is Net of Dividend distribution tax, if any.f. Scheme count for the total schemes managed by the Fund Managers does not include ended Scheme.closeg. The data of the last working day has been considered for the calculation of performance.h. SBI Magnum Comma Fund: As TRI data is not available since inception of SBI Magnum Comma Fund, benchmark performance is calculated using composite CAGR of Nifty Commodities PRI values from 08-Aug-05 to 13-Feb-12 and TRI
values since 14-Feb-12.. The performance of the schemes is benchmarked to the Total Return variant of the Index.
The details of the period since the Fund Manager is managing the scheme(s) & inception date provided alongside of the table.
Notes:
a. The total number of schemes managed by Mr.Mahak Khabia is 1.b. Past performance may or may not be sustained in future and the same may not necessarily provide the basis for comparison with other investment.c. Load is not considered for computation of returns.d. Period for which scheme’s performance has been provided is computed basis last day of the month-end preceding the date of advertisement. In case, the start/end date of the concerned period is a non-business day, the NAV of the previous date
is considered for computation of returns.e. Different plans shall have a different expense structure. The performance details provided herein are of Growth Option - Regular Plan. Performance for Schemes not having Growth Option has been calculated considering the Dividend Option
and is Net of Dividend distribution tax, if any.f. Scheme count for the total schemes managed by the Fund Managers does not include .
He is also managing SBI ETF 10 Year Gilt Fund.
close ended Scheme
g. The data of the last working day has been considered for the calculation of performance.h. The performance of the schemes is benchmarked to the Total Return variant of the Index.I. As the scheme was launched before the launch of the benchmark index, benchmark index figures since inception or the required period are not available.
The details of the period since the Fund Manager is managing the scheme(s) & inception date provided alongside of the table.
CAGR %Point-to-Point
returns on StandardInvestment ofRs. 10,000/-
CAGR %Point-to-Point
returns on StandardInvestment ofRs. 10,000/-
CAGR %Point-to-Point
returns on StandardInvestment ofRs. 10,000/-
3 Years 5 Years
CAGR %Point-to-Point
returns on StandardInvestment ofRs. 10,000/-
Since Inception
Inception Date &Managing Since
Managing Since
Aug-14
Inception Date
08-08-2005SBI Magnum Comma Fund
SBI PSU Fund
Scheme Benchmark: - Nifty Commodities (TRI)
Additional Benchmark: - S&P BSE Sensex (TRI)
Scheme Benchmark: - S&P BSE PSU (TRI)
Additional Benchmark: - S&P BSE Sensex (TRI)
-0.67 9,933 15.08 15,241 9.78 15,953 10.08 37,688
2.31 10,231 15.63 15,460 7.68 14,481 10.20 38,278
13.70 11,370 15.65 15,470 11.91 17,566 14.26 63,103
-1.69 9,831 8.51 12,776 2.55 11,344 0.81 10,741
2.21 10,221 10.96 13,662 2.43 11,276 0.35 10,317
13.70 11,370 15.65 15,470 11.91 17,566 11.21 25,765
1 Year
Funds Managed by Richard D'souza
Managing Since
Aug-14
Inception Date
07-07-2010
Notes:
a. Mr. R.Arun has been managing SBI Savings Fund and SBI Overnight Fund sinceApril 2012. The total number of schemes managed by Mr.
R.Arun is 3.
b. Past performance may or may not be sustained in future and the same may not necessarily provide the basis for comparison with other investment.
c. Load is not considered for computation of returns.
d. Period for which scheme’s performance has been provided is computed basis last day of the month-end preceding the date of advertisement. In case, the start/end date of the concerned period is a non-business day, the NAV of the previous date
is considered for computation of returns.
e. Different plans shall have a different expense structure. The performance details provided herein are of Growth Option - Regular Plan. Performance for Schemes not having Growth Option has been calculated considering the Dividend Option
and is Net of Dividend distribution tax, if any.
f. Scheme count for the total schemes managed by the Fund Managers does not include ended Scheme.close
g. SBI Overnight Fund : As the scheme was launched before the launch of the benchmark index, benchmark index figures since inception or the required period are not available.
The details of the period since the Fund Manager is managing the scheme(s) & inception date provided alongside of the table.
CAGR %Point-to-Point
returns on StandardInvestment ofRs. 10,000/-
CAGR %Point-to-Point
returns on StandardInvestment ofRs. 10,000/-
CAGR %Point-to-Point
returns on StandardInvestment ofRs. 10,000/-
3 Years 5 Years
CAGR %Point-to-Point
returns on StandardInvestment ofRs. 10,000/-
Since Inception
Inception Date &Managing Since
Managing Since
May-18
Inception Date
30-12-2000
1 Year
12.52 11,252 9.85 13,257 10.19 16,251 8.07 41,666
12.20 11,220 6.75 12,165 8.23 14,859 N.A. N.A.
7.86 10,786 6.79 12,180 7.31 14,238 6.35 31,051
Funds Managed by Mahak Khabia
SBI Magnum Constant Maturity Fund
Scheme Benchmark: -Crisil 10 Year Gilt Index
Additional Benchmark: - CRISIL 1 Year T-Bill Index
Annualized%
Annualized%
Annualized%
CAGR%
CAGR%
CAGR%
CAGR%
Point-to-Pointreturns onStandard
Investmentof Rs. 10,000/-
Point-to-Pointreturns onStandard
Investmentof Rs. 10,000/-
Point-to-Pointreturns onStandard
Investmentof Rs. 10,000/-
Point-to-Pointreturns onStandard
Investmentof Rs. 10,000/-
Point-to-Pointreturns onStandard
Investmentof Rs. 10,000/-
Point-to-Pointreturns onStandard
Investmentof Rs. 10,000/-
Point-to-Pointreturns onStandard
Investmentof Rs. 10,000/-
InceptionDate &
ManagingSince
7 Days 15 Days 1 Month 1 Year 3 Year 5 Year Since Inception
5.76 10,011 5.77 10,024 5.75 10,049 6.26 10,626 6.07 11,935 6.80 13,898 7.01 30,924
5.95 10,011 5.96 10,024 5.93 10,050 6.34 10,634 6.15 11,961 6.73 13,853 N.A. N.A.
14.26 10,027 11.25 10,046 9.02 10,077 7.86 10,786 6.79 12,180 7.31 14,238 6.05 26,649
9.43 10,018 10.59 10,044 9.55 10,081 7.81 10,781 7.14 12,300 7.68 14,483 7.49 29,288
8.30 10,016 9.53 10,039 8.39 10,071 7.89 10,789 7.24 12,333 7.78 14,550 7.84 30,714
14.26 10,027 11.25 10,046 9.02 10,077 7.86 10,786 6.79 12,180 7.31 14,238 6.15 24,310
7.07 10,014 7.08 10,029 7.03 10,060 7.43 10,743 7.01 12,256 7.59 14,419 7.64 24,541
7.60 10,015 7.97 10,033 8.06 10,068 7.73 10,773 7.19 12,316 7.65 14,462 7.57 24,365
14.26 10,027 11.25 10,046 9.02 10,077 7.86 10,786 6.79 12,180 7.31 14,238 6.52 21,617
Inception
Date
01-10-2002
Managing
Since
Apr-12
Inception
Date
19-07-2004
Managing
Since
Apr-12
Inception
Date
24-11-2003
Managing
Since May-18
SBI Overnight Fund
SBI Savings Fund
SBI Liquid Fund
Scheme Benchmark: - CRISILOvernight Index
Additional Benchmark: - CRISIL 1 YearT-Bill Index
Scheme Benchmark: - NIFTY MoneyMarket Index
Additional Benchmark: - CRISIL 1 Year
T-Bill Index
Scheme Benchmark: - CRISIL LiquidFund Index
Additional Benchmark: - CRISIL 1 YearT-Bill Index
Funds Managed by R. Arun

60
Comparative Performance for all Schemes
Notes:
a. Mr. Rajeev Radhakrishnan is also the Fund Manager of other close-ended schemes like SBI Debt Fund Series andmanages the debt portion of the SBI DualAdvantage Fund Series. The total number of open ended schemes managed by Mr. Rajeev Radhakrishnan is 6
b. Past performance may or may not be sustained in future and the same may not necessarily provide the basis for comparison with other investment.c. Load is not considered for computation of returns.d. Period for which scheme’s performance has been provided is computed basis last day of the month-end preceding the date of advertisement. In case, the start/end date of the concerned period is a non-business day, the NAV of the previous date
is considered for computation of returns.e. Different plans shall have a different expense structure. The performance details of all the schemes provided herein are of Growth Option - Regular Plan. Performance for Schemes not having Growth Option has been calculated considering the
Dividend Option and is Net of Dividend distribution tax, if any.f. Scheme count for the total schemes managed by the Fund Managers does not include .close ended Schemeg. SBI Magnum Constant Maturity Fund : As the scheme was launched before the launch of the benchmark index, benchmark index figures since inception or the required period are not available.h. SBI Magnum Ultra Short Duration Fund : As the scheme was launched before the launch of the benchmark index, benchmark index figures since inception or the required period are not available.i. The performance of the schemes is benchmarked to the Total Return variant of the Index.
The details of the period since the Fund Manager is managing the scheme(s) & inception date provided alongside of the table.
CAGR %
CAGR %
Point-to-Pointreturns on Standard
Investment ofRs. 10,000/-
Point-to-Pointreturns on Standard
Investment ofRs. 10,000/-
CAGR %
CAGR %
Point-to-Pointreturns on Standard
Investment ofRs. 10,000/-
Point-to-Pointreturns on Standard
Investment ofRs. 10,000/-
CAGR %
CAGR %
Point-to-Pointreturns on Standard
Investment ofRs. 10,000/-
Point-to-Pointreturns on Standard
Investment ofRs. 10,000/-
3 Years
3 Years
5 Years
5 Years
CAGR %
CAGR %
Point-to-Pointreturns on Standard
Investment ofRs. 10,000/-
Point-to-Pointreturns on Standard
Investment ofRs. 10,000/-
Since Inception
Since Inception
Advising Since
Dec-18
Inception Date
03-12-2018
N.A. N.A. N.A. N.A. N.A. N.A. 9.75 10,975
N.A. N.A. N.A. N.A. N.A. N.A. 7.55 10,755
N.A. N.A. N.A. N.A. N.A. N.A. 9.96 10,996
Inception Date &Managing Since
Inception Date &Advising Since
1 Year
1 Year
Managing Since
Jun-08
Inception Date
27-07-2007
Managing Since
Jun-08
Inception Date
21-02-2002
Inception Date
09-10-2009
Managing Since
Nov-13
8.51 10,851 7.30 12,354 7.93 14,649 6.75 21,698
9.24 10,924 7.64 12,470 8.25 14,870 7.98 24,835
7.86 10,786 6.79 12,180 7.31 14,238 6.42 20,904
2.19 10,219 11.61 13,904 11.99 17,629 10.46 55,812
10.91 11,091 8.77 12,868 9.25 15,567 9.09 45,005
12.20 11,220 6.75 12,165 8.23 14,859 6.55 29,949
8.86 10,886 7.51 12,427 8.13 14,790 8.05 21,111
8.70 10,870 7.09 12,282 8.05 14,727 8.01 21,028
7.86 10,786 6.79 12,180 7.31 14,238 6.62 18,555
Funds Managed by Rajeev Radhakrishnan
SBI Short Term Debt Fund
SBI Magnum Children’s Benefit Fund
SBI Banking and PSU Fund
Scheme Benchmark: - CRISIL Short Term Bond Fund Index
Additional Benchmark: - CRISIL 1 Year T-Bill Index
Scheme Benchmark:- NIFTY 50 Hybrid Composite Debt 15:85Index
Additional Benchmark: - CRISIL 10 Year Gilt Index
Scheme Benchmark: - NIFTY Banking and PSU Debt Index
Additional Benchmark: - CRISIL 1 Year T-Bill Index
Notes:
a.
c. For calculation of scheme performance, NAV is converted into INR using currency conversion rate i.e. USDINR rate. (Source: Bloomberg, closing prices)
d. The performance of the scheme is benchmarked to the Total Return variant of the index.
e. Benchmark return is based on INR value (Source: Bloomberg)
The above Performance returns are calculated and compared from the date of inception of category II- FPI Portfolio i.e. December 03, 2018.
b. Returns less than 1 year period are absolute and returns greater than 1 year period are compounded annualised (CAGR).
Performance of Category II – FPI Portfolio (advised by Mr. R. Srinivasan)
Past performance may or may not be sustained in the future. Inception date is December 3, 2018. The performance is not comparable with the performance of the scheme(s) of SBI Mutual Fund due todiffering investment objective/s and fundamental differences in asset allocation, investment strategy and the regulatory environment. The said disclosure is pursuant to SEBI Circular No. Cir/IMD/DF/F/2012dated February, 2012 pertaining to Regulation 24(b) of SEBI (Mutual Funds) Regulations, 1996. FPI – Foreign Portfolio Investor.
Category II - FPI Portfolio (managed under a bilateral agreementunder Regulation 24(b) and subject to applicable laws)
Scheme Benchmark: - MSCI India (TRI)
Additional Benchmark: - S&P BSE Sensex (TRI)
SBI Magnum Low Duration Fund
Scheme Benchmark: - NIFTY LowDuration Debt Index
Additional Benchmark: - CRISIL 1 YearT-Bill Index
12.45 10,024 13.57 10,056 11.00 10,093 8.42 10,842 7.49 12,419 7.98 14,684 7.85 24,500
11.31 10,022 13.20 10,054 10.21 10,087 8.40 10,840 7.48 12,417 8.00 14,695 8.45 26,166
14.26 10,027 11.25 10,046 9.02 10,077 7.86 10,786 6.79 12,180 7.31 14,238 6.42 20,904Managing
Since May-10
Inception
Date
21-05-1999
Managing
Since Jun-08
Inception
Date
27-07-2007
Annualized%
Annualized%
Annualized%
CAGR%
CAGR%
CAGR%
CAGR%
Point-to-Pointreturns onStandard
Investmentof Rs. 10,000/-
Point-to-Pointreturns onStandard
Investmentof Rs. 10,000/-
Point-to-Pointreturns onStandard
Investmentof Rs. 10,000/-
Point-to-Pointreturns onStandard
Investmentof Rs. 10,000/-
Point-to-Pointreturns onStandard
Investmentof Rs. 10,000/-
Point-to-Pointreturns onStandard
Investmentof Rs. 10,000/-
Point-to-Pointreturns onStandard
Investmentof Rs. 10,000/-
InceptionDate &
ManagingSince
7 Days 15 Days 1 Month 1 Year 3 Year 5 Year Since Inception
SBI Magnum Ultra Short Duration Fund
Scheme Benchmark: - NIFTY UltraShort Duration Debt Index
Additional Benchmark: - CRISIL1 Year T-Bill Index
9.87 10,019 10.75 10,044 9.32 10,079 8.48 10,848 7.41 12,393 7.83 14,583 7.41 41,898
8.64 10,017 10.27 10,042 9.10 10,077 8.53 10,853 7.65 12,474 8.06 14,740 N.A. N.A.
14.26 10,027 11.25 10,046 9.02 10,077 7.86 10,786 6.79 12,180 7.31 14,238 6.60 35,979

61
The Fund offers flexible and convenient Systematic Investment Plan (SIP) facility. To illustrate the advantages of SIP investments, this is how your investments wouldhave grown if you had invested say 10,000 systematically on the first Business Day of every month over a period of time in the Respective Scheme by using XIRRapproach. XIRR helps in calculating return on investments given an initial and final value and a series of cash inflows and outflows with the correct allowance for thetime impact of the transactions. Data as on May 31, 2019.
`
Investors are advised to refer to the performance summary table on page 55 -60. Returns are calculated for the Regular plan.Disclaimer: The above investment simulation is for illustrative purposes only and should not be construed as a promise on minimum returns and safeguard ofcapital. The AMC / Mutual Fund is not guaranteeing or promising or forecasting any returns. Investors are advised to consult their financial advisor/consultantbefore taking any investment decision. SIP does not assure a profit or guarantee protection against a loss in a declining market. Please refer SID of the respectiveSchemes before investing.The performance of the schemes is benchmarked to the Total Return variant of the Index.
Source: ICRA Online
Benefits of Systematic Investment Plan (SIP)SIP Performance of Select Schemes - Fund Manager-wise
34,10,000 18,00,000 12,00,000 6,00,000 3,60,000 1,20,0004,06,63,058 57,02,143 23,26,787 7,96,533 4,30,014 1,30,941
14.48 14.10 12.71 11.29 11.91 17.42N.A. N.A. N.A. 12.97 14.42 14.23N.A. 13.13 12.43 12.93 15.53 17.11
Total Amount Invested ( )
Mkt Value as on May 31, 2019 ( )
Benchmark Returns (Annualised) (%) (TRI) #
AdditionalBenchmarkReturns(Annualised)(TRI)(%)##
`
`
Returns (Annualised) (%)
SIP Investments
Past performance may or may not be sustained in the future. # Nifty 100 ESG Index, ## S&P BSE SENSEX, Inception Date: January 01, 1991
Returns are calculated for Regular Plan Dividend Option. It is assumed that dividends declared under the scheme have been reinvested at the prevailing NAV.
SBI Magnum Equity ESG Fund FUND MANAGER -RUCHIT MEHTA
23,90,000 18,00,000 12,00,000 6,00,000 3,60,000 1,20,0002,07,04,790 46,71,454 19,38,147 7,03,821 3,82,610 1,23,991
18.69 11.78 9.27 6.33 4.00 6.2615.17 12.87 12.31 11.29 10.92 11.1415.04 13.13 12.43 12.93 15.53 17.11
Total Amount Invested ( )
Mkt Value as on May 31, 2019 ( )
Benchmark Returns (Annualised) (TRI) (%) #
Additional Benchmark Returns (Annualised) (TRI) (%) ##
`
`
Returns (Annualised) (%)
SIP Investments
Past performance may or may not be sustained in the future. # S&P BSE 500, ## S&P BSE SENSEX, Inception Date: July 05, 1999
Returns are calculated for Regular Plan Dividend Option. It is assumed that dividends declared under the scheme have been reinvested at the prevailing NAV.
SBI Contra Fund FUND MANAGER -DINESH BALACHANDRAN
16,00,000 N.A. 12,00,000 6,00,000 3,60,000 1,20,00039,91,677 N.A. 24,54,272 7,82,709 4,15,139 1,29,744
12.81 N.A. 13.71 10.58 9.50 15.4711.95 N.A. 12.25 11.92 12.82 13.9111.98 N.A. 12.43 12.93 15.53 17.11
Total Amount Invested ( )Mkt Value as on May 31, 2019 ( )
Benchmark Returns (Annualised) ( (%) #AdditionalBenchmarkReturns(Annualised)(TRI)(%)##
`
`
Returns (Annualised) (%)TRI)
SIP Investments
Past performance may or may not be sustained in the future. # S&P BSE 100, ## S&P BSE SENSEX, Inception Date: February 14, 2006
Returns are calculated for Regular Plan Growth Option
SBI Blue Chip Fund FUND MANAGER -SOHINI ANDANI
31,60,000 18,00,000 12,00,000 6,00,000 3,60,000 1,20,0003,89,03,737 64,23,211 24,94,968 7,84,408 4,14,000 1,27,280
15.90 15.47 14.02 10.67 9.31 11.50N.A. N.A. 13.66 11.50 9.64 8.34
13.56 13.13 12.43 12.93 15.53 17.11
Total Amount Invested ( )
Mkt Value as on May 31, 2019 ( )
Benchmark Returns (Annualised) (TRI) (%) #
Additional Benchmark Returns (Annualised) (TRI) (%)##
`
`
Returns (Annualised) (%)
SIP Investments
Past performance may or may not be sustained in the future. # NIFTY Large Midcap 250, ## S&P BSE SENSEX, Inception Date: February 28, 1993
Returns are calculated for Regular Plan Dividend Option. It is assumed that dividends declared under the scheme have been reinvested at the prevailing NAV.
SBI Large & Midcap Fund FUND MANAGER -SAURABH PANT
17,00,000 N.A. 12,00,000 6,00,000 3,60,000 1,20,00048,20,200 N.A. 25,97,203 6,88,246 3,59,683 1,22,487
13.62 N.A. 14.77 5.43 -0.06 3.8814.33 N.A. 14.79 10.78 6.32 3.1212.45 N.A. 12.43 12.93 15.53 17.11
Total Amount Invested ( )
Mkt Value as on May 31, 2019 ( )
Benchmark Returns (Annualised) (TRI) (%) #
Additional Benchmark Returns (Annualised) (TRI) (%) ##
`
`
Returns (Annualised) (%)
SIP Investments
Past performance may or may not be sustained in the future. # Nifty Midcap 150, ## S&P BSE SENSEX, Inception Date: March 29, 2005
Returns are calculated for Regular Plan Growth Option
SBI Magnum MidCap Fund FUND MANAGER -SOHINI ANDANI
Since InceptionSIP
15 YearsSIP
10 YearsSIP
5 YearsSIP
3 YearsSIP
1 YearSIP
Since InceptionSIP
15 YearsSIP
10 YearsSIP
5 YearsSIP
3 YearsSIP
1 YearSIP
Since InceptionSIP
15 YearsSIP
10 YearsSIP
5 YearsSIP
3 YearsSIP
1 YearSIP
Since InceptionSIP
15 YearsSIP
10 YearsSIP
5 YearsSIP
3 YearsSIP
1 YearSIP
Since InceptionSIP
15 YearsSIP
10 YearsSIP
5 YearsSIP
3 YearsSIP
1 YearSIP

62
The Fund offers flexible and convenient Systematic Investment Plan (SIP) facility. To illustrate the advantages of SIP investments, this is how your investments wouldhave grown if you had invested say 10,000 systematically on the first Business Day of every month over a period of time in the Respective Scheme by using XIRRapproach. XIRR helps in calculating return on investments given an initial and final value and a series of cash inflows and outflows with the correct allowance for thetime impact of the transactions. Data as on May 31, 2019.
`
Investors are advised to refer to the performance summary table on page 55 -60. Returns are calculated for the Regular plan.Disclaimer: The above investment simulation is for illustrative purposes only and should not be construed as a promise on minimum returns and safeguard ofcapital. The AMC / Mutual Fund is not guaranteeing or promising or forecasting any returns. Investors are advised to consult their financial advisor/consultantbefore taking any investment decision. SIP does not assure a profit or guarantee protection against a loss in a declining market. Please refer SID of the respectiveSchemes before investing.The performance of the schemes is benchmarked to the Total Return variant of the Index.
Benefits of Systematic Investment Plan (SIP)SIP Performance of Select Schemes - Fund Manager-wise
28,10,000 18,00,000 12,00,000 6,00,000 3,60,000 1,20,0002,64,80,577 55,89,972 24,41,271 7,93,668 4,25,249 1,30,079
16.25 13.87 13.61 11.14 11.15 16.02N.A. 11.53 11.24 10.65 10.49 12.65
14.40 13.13 12.43 12.93 15.53 17.11
Total Amount Invested ( )
Mkt Value as on May 31, 2019 ( )
Benchmark Returns (Annualised) (%) #
Additional Benchmark Returns (Annualised) (TRI) (%) ##
`
`
Returns (Annualised) (%)
SIP Investments
Past performance may or may not be sustained in the future. # Scheme Benchmark: - CRISIL Hybrid 35+65 - Aggressive Index, ## S&P BSE SENSEX,Inception Date: October 09, 1995
Returns are calculated for Regular Plan Dividend Option. It is assumed that dividends declared under the scheme have been reinvested at the prevailing NAV.
SBI Equity Hybrid Fund FUND MANAGER -R. SRINIVASAN (Equity) & DINESH AHUJA (Debt)
31,50,000 18,00,000 12,00,000 6,00,000 3,60,000 1,20,0005,11,16,283 54,58,481 21,92,867 7,26,481 3,97,738 1,26,483
17.54 13.60 11.60 7.59 6.60 10.22N.A. 12.87 12.31 11.29 10.92 11.14
13.62 13.13 12.43 12.93 15.53 17.11
Total Amount Invested ( )
Mkt Value as on May 31, 2019 ( )
Benchmark Returns (Annualised) (TRI) (%) #
Additional Benchmark Returns (Annualised) (TRI) (%) ##
`
`
Returns (Annualised) (%)
SIP Investments
Past performance may or may not be sustained in the future. # S&P BSE 500, ## S&P BSE SENSEX, Inception Date: March 31, 1993
Returns are calculated for Regular Plan Dividend Option. It is assumed that dividends declared under the scheme have been reinvested at the prevailing NAV.
SBI Magnum Taxgain Scheme FUND MANAGER -DINESH BALACHANDRAN
29,70,000 18,00,000 12,00,000 6,00,000 3,60,000 1,20,0004,34,62,288 65,45,391 25,13,066 7,14,074 3,85,011 1,20,719
18.07 15.69 14.16 6.90 4.42 1.12N.A. 15.19 14.13 9.64 6.12 -6.86
14.06 13.13 12.43 12.93 15.53 17.11
Total Amount Invested ( )
Mkt Value as on May 31, 2019 ( )
Benchmark Returns (Annualised) (TRI) (%) #
Additional Benchmark Returns (Annualised) (TRI) (%) ##
`
`
Returns (Annualised) (%)
Since InceptionSIP
15 YearsSIP
10 YearsSIP
5 YearsSIP
3 YearsSIP
1 YearSIP
SIP Investments
Past performance may or may not be sustained in the future. # Nifty MNC, ## S&P BSE SENSEX, Inception Date: September 30, 1994
Returns are calculated for Regular Plan Dividend Option. It is assumed that dividends declared under the scheme have been reinvested at the prevailing NAV.
SBI Magnum Global Fund FUND MANAGER -ANUP UPADHYAY
17,60,000 N.A. 12,00,000 6,00,000 3,60,000 1,20,00067,78,484 N.A. 29,42,863 8,51,378 4,44,947 1,32,394
16.75 N.A. 17.10 13.98 14.28 19.8012.57 N.A. 12.31 11.29 10.92 11.1412.79 N.A. 12.43 12.93 15.53 17.11
Total Amount Invested ( )
Mkt Value as on May 31, 2019 ( )
Benchmark Returns (Annualised) (TRI) (%) #
Additional Benchmark Returns (Annualised) (TRI) (%) ##
`
`
Returns (Annualised) (%)
Since InceptionSIP
15 YearsSIP
10 YearsSIP
5 YearsSIP
3 YearsSIP
1 YearSIP
SIP Investments
Past performance may or may not be sustained in the future. # S&P BSE 500, ## S&P BSE SENSEX, Inception Date: September 17, 2004
Returns are calculated for Regular Growth
SBI Focused Equity Fund FUND MANAGER -R. SRINIVASAN
11,70,000 N.A. N.A. 6,00,000 3,60,000 1,20,00034,78,143 N.A. N.A. 8,71,990 4,13,922 1,23,817
21.24 N.A. N.A. 14.95 9.30 5.9810.43 N.A. N.A. 6.24 0.79 -2.5412.47 N.A. N.A. 12.93 15.53 17.11
Total Amount Invested ( )
Mkt Value as on May 31, 2019 ( )
Benchmark Returns (Annualised) (TRI) (%) #
Additional Benchmark Returns (Annualised) (TRI) (%) ##
`
`
Returns (Annualised) (%)
SIP Investments
Past performance may or may not be sustained in the future. # S&P BSE SMALL CAP, ## S&P BSE SENSEX, Inception Date: September 09, 2009
Returns are calculated for Regular Plan Growth Option
SBI Small Cap Fund FUND MANAGER -R. SRINIVASAN
Since InceptionSIP
15 YearsSIP
10 YearsSIP
5 YearsSIP
3 YearsSIP
1 YearSIP
Since InceptionSIP
15 YearsSIP
10 YearsSIP
5 YearsSIP
3 YearsSIP
1 YearSIP
Since InceptionSIP
15 YearsSIP
10 YearsSIP
5 YearsSIP
3 YearsSIP
1 YearSIP
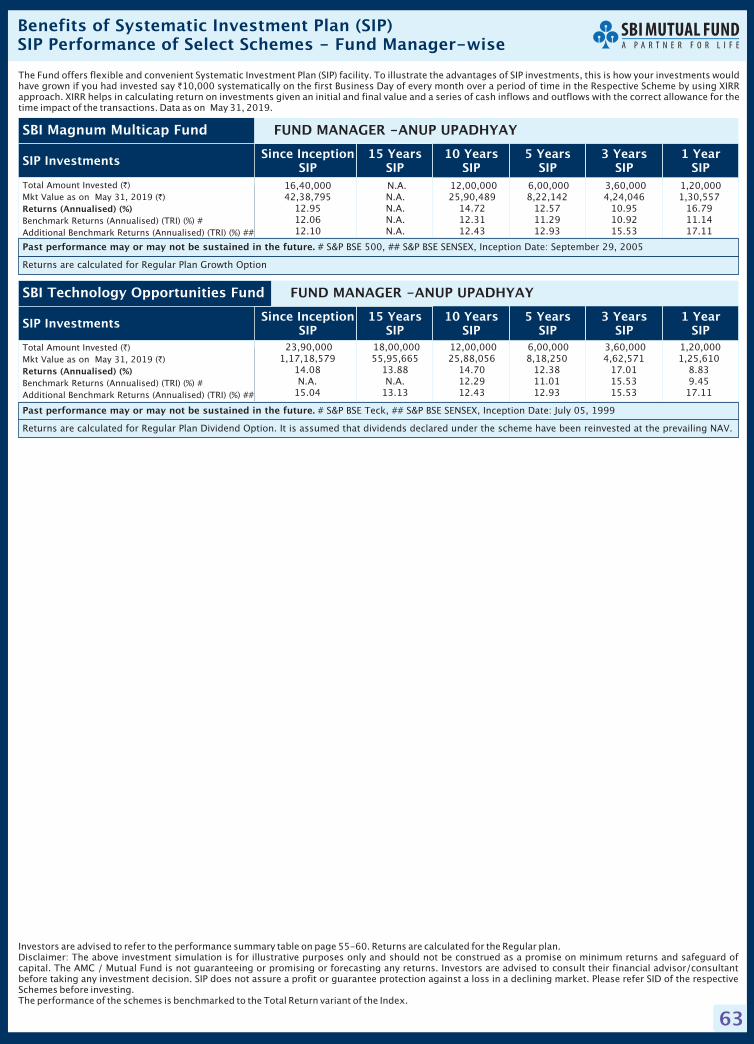
63
The Fund offers flexible and convenient Systematic Investment Plan (SIP) facility. To illustrate the advantages of SIP investments, this is how your investments wouldhave grown if you had invested say 10,000 systematically on the first Business Day of every month over a period of time in the Respective Scheme by using XIRRapproach. XIRR helps in calculating return on investments given an initial and final value and a series of cash inflows and outflows with the correct allowance for thetime impact of the transactions. Data as on May 31, 2019.
`
Investors are advised to refer to the performance summary table on page 55-60. Returns are calculated for the Regular plan.Disclaimer: The above investment simulation is for illustrative purposes only and should not be construed as a promise on minimum returns and safeguard ofcapital. The AMC / Mutual Fund is not guaranteeing or promising or forecasting any returns. Investors are advised to consult their financial advisor/consultantbefore taking any investment decision. SIP does not assure a profit or guarantee protection against a loss in a declining market. Please refer SID of the respectiveSchemes before investing.The performance of the schemes is benchmarked to the Total Return variant of the Index.
Benefits of Systematic Investment Plan (SIP)SIP Performance of Select Schemes - Fund Manager-wise
16,40,000 N.A. 12,00,000 6,00,000 3,60,000 1,20,00042,38,795 N.A. 25,90,489 8,22,142 4,24,046 1,30,557
12.95 N.A. 14.72 12.57 10.95 16.7912.06 N.A. 12.31 11.29 10.92 11.1412.10 N.A. 12.43 12.93 15.53 17.11
Total Amount Invested ( )
Mkt Value as on May 31, 2019 ( )
Benchmark Returns (Annualised) (TRI) (%) #
Additional Benchmark Returns (Annualised) (TRI) (%) ##
`
`
Returns (Annualised) (%)
Since InceptionSIP
15 YearsSIP
10 YearsSIP
5 YearsSIP
3 YearsSIP
1 YearSIP
SIP Investments
Past performance may or may not be sustained in the future. # S&P BSE 500, ## S&P BSE SENSEX, Inception Date: September 29, 2005
Returns are calculated for Regular Plan Growth Option
SBI Magnum Multicap Fund FUND MANAGER -ANUP UPADHYAY
Total Amount Invested ( )
Mkt Value as on May 31, 2019 ( )
Benchmark Returns (Annualised) (TRI) (%) #
Additional Benchmark Returns (Annualised) (TRI) (%) ##
`
`
Returns (Annualised) (%)
Since InceptionSIP
15 YearsSIP
10 YearsSIP
5 YearsSIP
3 YearsSIP
1 YearSIP
SIP Investments
Past performance may or may not be sustained in the future. # S&P BSE Teck, ## S&P BSE SENSEX, Inception Date: July 05, 1999
Returns are calculated for Regular Plan Dividend Option. It is assumed that dividends declared under the scheme have been reinvested at the prevailing NAV.
SBI Technology Opportunities Fund FUND MANAGER -ANUP UPADHYAY
23,90,000 18,00,000 12,00,000 6,00,000 3,60,000 1,20,0001,17,18,579 55,95,665 25,88,056 8,18,250 4,62,571 1,25,610
14.08 13.88 14.70 12.38 17.01 8.83N.A. N.A. 12.29 11.01 15.53 9.45
15.04 13.13 12.43 12.93 15.53 17.11

64
Statutory Details & Risk Factors
Mutual Fund investments are subject to market risks, read all scheme related documents carefully.
Disclaimer: In the preparation of the material contained in this document, the Asset Management Company (AMC) has used information that
is publicly available, including information developed in-house. Some of the material used in the document may have been obtained from
members/persons other than the AMC and/or its affiliates and which may have been made available to the AMC and/or to its affiliates.
Information gathered and material used in this document is believed to be from reliable sources. The AMC however does not warrant the
accuracy, reasonableness and / or completeness of any information. We have included statements / opinions / recommendations in this
document, which contain words, or phrases such as “will”, “expect”, “should”, “believe” and similar expressions or variations of such
expressions that are “forward looking statements”. Actual results may differ materially from those suggested by the forward looking
statements due to risk or uncertainties associated with our expectations with respect to, but not limited to, exposure to market risks, general
economic and political conditions in India and other countries globally, which have an impact on our services and / or investments, the
monetary and interest policies of India, inflation, deflation, unanticipated turbulence in interest rates, foreign exchange rates, equity prices
or other rates or prices etc.
The AMC (including its affiliates), the Mutual Fund, the trust and any of its officers, directors, personnel and employees, shall not be liable for
any loss, damage of any nature, including but not limited to direct, indirect, punitive, special, exemplary, consequential, as also any loss of
profit in any way arising from the use of this material in any manner. The recipient alone shall be fully responsible/are liable for any decision
taken on this material.
SBI Blue Chip Fund 1.83 1.08
SBI Equity Hybrid Fund 1.64 1.08(Previously known as SBI Magnum Balanced Fund)
SBI Magnum Global Fund 1.99 1.38
SBI Magnum Mid Cap Fund 1.98 1.28
SBI Magnum Equity ESG Fund 2.09 1.50(Previously known as SBI Magnum Equity Fund)
SBI Focused Equity Fund 2.03 1.23(Previously known as SBI Emerging Businesses Fund)
SBI Consumption Opportunities Fund 2.51 1.50(Previously known as SBI FMCG Fund)
SBI Healthcare Opportunities Fund 2.35 1.35(Previously known as SBI Pharma Fund)
SBI Technology Opportunities Fund 2.73 1.83(Previously known as SBI IT Fund)
SBI Contra Fund 2.22 1.67
SBI Magnum Multi Cap Fund 1.93 1.13
SBI Large & Midcap Fund 2.09 1.64(Previously known as SBI Magnum Multiplier Fund)
SBI Nifty Index Fund 0.66 0.26
SBI Magnum Comma Fund 2.57 2.02
SBI PSU Fund 2.62 2.08
SBI Infrastructure Fund 2.55 1.99
SBI Arbitrage Opportunities Fund 0.88 0.43
SBI Small Cap Fund 2.38 1.23(Previously known as SBI Small & Midcap Fund)
SBI Dynamic Asset Allocation Fund 2.24 0.99
SBI Equity Savings Fund 1.67 1.00
SBI Banking And Financial Services Fund 2.45 1.53
SBI Gold Fund 0.52 0.12
SBI Magnum Tax Gain Scheme 1.94 1.49
SBI Equity Minimum Variance Fund 0.74 0.34
SBI Magnum Low Duration Fund 0.64 0.40(Previously known as SBI Ultra Short Term Debt Fund)
SBI Short Term Debt Fund 0.84 0.34
SBI Debt Hybrid Fund 1.72 1.12(Previously known as SBI Magnum Monthly Income Plan)
SBI Liquid Fund 0.25 0.15(Previously known as SBI Premier Liquid Fund)
SBI Magnum Children’s Benefit Fund 2.24 1.44(Previously known as SBI Magnum Children’s Benefit Plan)
SBI Magnum Income Fund 1.47 0.87
SBI Magnum Constant Maturity Fund 0.64 0.34(Previously known as SBI Magnum Gilt Fund - Short Term Plan)
SBI Magnum Gilt Fund 0.95 0.50(Previously known as SBI Magnum Gilt Fund - Long Term Plan)
SBI Multi Asset Allocation Fund 1.81 1.21(Previously known as SBI Magnum Monthly Income Plan - Floater)
SBI Savings Fund 0.83 0.23
SBI Dynamic Bond Fund 1.64 1.04
SBI Corporate Bond Fund 0.84 0.34
SBI Credit Risk Fund 1.54 0.94(Previously known as SBI Corporate Bond Fund)
SBI Magnum Medium Duration Fund 1.09 0.74(Previously known as SBI Regular Savings Fund)
SBI Magnum Ultra Short Duration Fund 0.50 0.34(Previously known as SBI Magnum InstaCash Fund)
SBI Overnight Fund 0.18 0.11(Previously known as SBI Magnum InstaCash Fund - Liquid Floater)
SBI Banking and PSU Fund 0.81 0.34(Previously known as SBI Treasury Advantage Fund)
Equity Schemes Reg -Plan Dir-Plan Debt Schemes Reg -Plan Dir-Plan
Note: Expense ratio includes GST, Base TER and additional expenses as per regulation 52(6A)(b) and 52(6A)(c) of SEBI (MF) Regulations, 1996 for
both Direct and Regular plan
Total Expense Ratios (as on month end)

65
SBI Debt Hybrid Fund - Monthly Dividend(Previously known as SBI Magnum Monthly Income Plan)
29-Mar-19 0.0500 0.0500 12.7107
29-Mar-19 0.0500 0.0500 15.8512
30-Apr-19 0.5000 0.0500 12.4926
30-Apr-19 0.5000 0.0500 15.5997
31-May-19 0.5000 0.0500 15.9411
31-May-19 0.5000 0.0500 12.7515
Scheme Name Record Date Individual Corporate NAV(in Rs./Unit) (in Rs./Unit) ( )`
Direct Plan - Mthly Div
Regular Plan - Mthly Div
Direct Plan - Mthly Div
Regular Plan - Mthly Div
Regular Plan - Mthly Div
Direct Plan - Mthly Div
Face value: 10`
SBI Debt Hybrid Fund - Quarterly Dividend(Previously known as SBI Magnum Monthly Income Plan)
Scheme Name Record Date Individual Corporate NAV(in Rs./Unit) (in Rs./Unit) ( )`
Regular Plan - Qtr Div
Direct Plan - Qtr Div
Regular Plan - Qtr Div
Direct Plan - Qtr Div
Regular Plan - Qtr Div
Direct Plan - Qtr Div
Face value: 10`
23-Mar-18 0.2000 0.2000 12.0122
23-Mar-18 0.2000 0.2000 13.2567
28-Dec-18 0.2000 0.2000 11.7508
28-Dec-18 0.2000 0.2000 13.1211
29-Mar-19 0.2000 0.2000 11.9960
29-Mar-19 0.2200 0.2200 13.4110
SBI Debt Hybrid Fund - Annual Dividend(Previously known as SBI Magnum Monthly Income Plan)
24-Mar-17 0.8000 0.8000 14.2182
24-Mar-17 0.8000 0.8000 16.3740
23-Mar-18 0.8000 0.8000 14.0798
23-Mar-18 0.8000 0.8000 16.4921
29-Mar-19 0.8000 0.8000 13.9783
29-Mar-19 0.8000 0.8000 16.6829
Scheme Name Record Date Individual Corporate NAV(in Rs./Unit) (in Rs./Unit) ( )`
Regular Plan - Annual Div
Direct Plan - Annual Div
Regular Plan - Annual Div
Direct Plan - Annual Div
Regular Plan - Annual Div
Direct Plan - Annual Div
Face value: 10`
SBI Multi Asset Allocation Fund Monthly Dividend(Previously known as SBI Magnum Monthly Income Plan - Floater)
29-Mar-19 0.0500 0.0500 12.4491
29-Mar-19 0.0500 0.0500 13.1468
30-Apr-19 0.5000 0.0500 12.3358
30-Apr-19 0.5000 0.0500 13.0357
31-May-19 0.5000 0.0500 12.4634
31-May-19 0.5000 0.0500 13.1744
Scheme Name Record Date Individual Corporate NAV(in Rs./Unit) (in Rs./Unit) ( )`
Reg. Plan - Monthly Div
Direct Plan - Monthly Div
Reg. Plan - Monthly Div
Direct Plan - Monthly Div
Reg. Plan - Monthly Div
Direct Plan - Monthly Div
Face value: 10`
SBI Multi Asset Allocation Fund - Quarterly Dividend(Previously known as SBI Magnum Monthly Income Plan - Floater)
28-Dec-18 0.2000 0.2000 12.3469
28-Dec-18 0.2000 0.2000 13.7503
28-Dec-18 0.2000 0.2000 12.3469
28-Dec-18 0.2000 0.2000 13.7503
29-Mar-19 0.2000 0.2000 12.4772
29-Mar-19 0.2000 0.2000 13.9338
Scheme Name Record Date Individual Corporate NAV(in Rs./Unit) (in Rs./Unit) ( )`
Regular Plan - Qtr Div
Direct Plan - Qtr Div
Regular Plan - Qtr Div
Direct Plan - Qtr Div
Regular Plan - Qtr Div
Direct Plan - Qtr Div
Face value: 10`
Pursuant to payment of dividend, the NAV of Dividend Option of schemes/plans would fall to the extent of payout and statutory levy, if applicable.Existing plans under the scheme are named Regular w.e.f. 01/01/2013
SBI Multi Asset Allocation Fund - Annual Dividend(Previously known as SBI Magnum Monthly Income Plan - Floater)
24-Mar-17 0.8000 0.8000 15.0660
24-Mar-17 0.8000 0.8000 15.5711
23-Mar-18 0.8000 0.8000 15.2971
23-Mar-18 0.8000 0.8000 15.9910
29-Mar-19 0.8000 0.8000 15.0775
29-Mar-19 0.8000 0.8000 16.0175
Scheme Name Record Date Individual Corporate NAV(in Rs./Unit) (in Rs./Unit) ( )`
Regular Plan - Annual Div
Direct Plan - Annual Div
Regular Plan - Annual Div
Direct Plan - Annual Div
Regular Plan - Annual Div
Direct Plan - Annual Div
Face value: 10`
SBI Magnum Gilt Fund PF Fixed 1 Years - Quarterly Dividend(Previously known as SBI Magnum Gilt Fund - Long Term Plan)
29-Dec-17 0.2000 0.2000 13.0372
23-Mar-18 0.2000 0.2000 12.7675
07-Sep-18 0.2000 0.2000 12.7135
28-Dec-18 0.2000 0.2000 13.0774
29-Mar-19 0.2000 0.2000 13.1224
Scheme Name Record Date Individual Corporate NAV(in Rs./Unit) (in Rs./Unit) ( )`
Dividend - PF Fixed 1 Year
Dividend - PF Fixed 1 Year
Dividend - PF Fixed 1 Year
Dividend - PF Fixed 1 Year
Dividend - PF Fixed 1 Year
Face value: 10`
SBI Magnum Gilt Fund PF Regular - Dividend(Previously known as SBI Magnum Gilt Fund - Long Term Plan)
29-Mar-19 0.2000 0.2000 13.7166
Scheme Name Record Date Individual Corporate NAV(in Rs./Unit) (in Rs./Unit) ( )`
Dividend - PF Regular
Face value: 10`
29-Dec-17 0.2000 0.2000 13.1830
23-Mar-18 0.2000 0.2000 12.9126
07-Sep-18 0.2000 0.2000 12.8604
28-Dec-18 0.2000 0.2000 13.2308
29-Mar-19 0.2000 0.2000 13.2787
Scheme Name Record Date Individual Corporate NAV(in Rs./Unit) (in Rs./Unit) ( )`
Div-PF Fixed 2 Years
Div-PF Fixed 2 Years
Div-PF Fixed 2 Years
Div-PF Fixed 2 Years
Div-PF Fixed 2 Years
SBI Magnum Gilt Fund PF Fixed 2 Years - Quarterly Dividend(Previously known as SBI Magnum Gilt Fund - Long Term Plan)
Face value: 10`
SBI Magnum Gilt Fund Quarterly DividendPF Fixed 3 Years -(Previously known as SBI Magnum Gilt Fund - Long Term Plan)
29-Dec-17 0.2000 0.2000 12.8133
23-Mar-18 0.2000 0.2000 12.5448
07-Sep-18 0.2000 0.2000 12.4885
28-Dec-18 0.2000 0.2000 12.8423
29-Mar-19 0.2000 0.2000 12.8829
Scheme Name Record Date Individual Corporate NAV(in Rs./Unit) (in Rs./Unit) ( )`
Div-PF Fixed 3 Years
Div-PF Fixed 3 Years
Div-PF Fixed 3 Years
Div-PF Fixed 3 Years
Div-PF Fixed 3 Years
Face value: 10`
30-Jun-17 0.2500 0.2500 14.1250
29-Sep-17 0.2000 0.2000 13.9865
29-Dec-17 0.2000 0.2000 13.5916
23-Mar-18 0.2000 0.2000 13.3190
07-Sep-18 0.2000 0.2000 13.2715
Scheme Name Record Date Individual Corporate NAV(in Rs./Unit) (in Rs./Unit) ( )`
Dividend - PF Regular
Dividend - PF Regular
Dividend - PF Regular
Dividend - PF Regular
Dividend - PF Regular
SBI Magnum Gilt Fund - Quarterly Dividend(Previously known as SBI Magnum Gilt Fund - Long Term Plan)
Face value: 10`
Dividend History Of Debt & Hybrid Funds

66Pursuant to payment of dividend, the NAV of Dividend Option of schemes/plans would fall to the extent of payout and statutory levy, if applicable.Existing plans under the scheme are named Regular w.e.f. 01/01/2013
SBI Magnum Income Fund - Quarterly Dividend
07-Sep-18 0.2000 0.2000 12.9325
07-Sep-18 0.2000 0.2000 13.7192
28-Dec-18 0.2000 0.2000 13.1160
28-Dec-18 0.2000 0.2000 13.9638
29-Mar-19 0.2000 0.2000 13.2366
29-Mar-19 0.2000 0.2000 14.1266
Scheme Name Record Date Individual Corporate NAV(in Rs./Unit) (in Rs./Unit) ( )`
Regular Plan - Dividend
Direct Plan - Dividend
Regular Plan - Dividend
Direct Plan - Dividend
Regular Plan - Dividend
Direct Plan - Dividend
Face value: 10`
SBI Magnum Income Fund - Half Yearly Dividend
23-Mar-18 0.4000 0.4000 12.1623
23-Mar-18 0.4000 0.4000 13.5101
12-Oct-18 0.4000 0.4000 11.9114
12-Oct-18 0.4500 0.4500 13.2953
12-Oct-18 0.4000 0.4000 12.2598
12-Oct-18 0.4500 0.4500 13.6850
29-Mar-19 0.4000 0.4000 12.1369
29-Mar-19 0.4000 0.4000 13.6399
Scheme Name Record Date Individual Corporate NAV(in Rs./Unit) (in Rs./Unit) ( )`
Regular Plan - Dividend
Direct Plan - Dividend
Regular Plan - Dividend
Direct Plan - Dividend
Regular Plan - Dividend
Direct Plan - Dividend
Regular Plan - Dividend
Direct Plan - Dividend
Face value: 10`
23-Mar-18 0.2000 0.2000 12.1783
23-Mar-18 0.2000 0.2000 13.3449
07-Sep-18 0.2000 0.2000 12.1722
07-Sep-18 0.2000 0.2000 13.4207
28-Dec-18 0.2000 0.2000 12.4192
28-Dec-18 0.2000 0.2000 13.7513
Scheme Name Record Date Individual Corporate NAV(in Rs./Unit) (in Rs./Unit) ( )`
Regular Plan - Dividend
Direct Plan - Dividend
Regular Plan - Dividend
Direct Plan - Dividend
Regular Plan - Dividend
Direct Plan - Dividend
SBI Dynamic Bond Fund - Quarterly Dividend
Face value: 10`
SBI Magnum Medium Duration Fund - Quarterly Dividend(Previously known as SBI Regular Savings Fund)
29-Sep-17 0.2500 0.2500 12.9872
29-Sep-17 0.2500 0.2500 13.4154
29-Dec-17 0.2500 0.2500 12.8096
29-Dec-17 0.2500 0.2500 13.2745
23-Mar-18 0.2000 0.2000 12.7657
23-Mar-18 0.2000 0.2000 13.2672
07-Sep-18 0.2000 0.2000 12.8078
07-Sep-18 0.2000 0.2000 13.3802
Scheme Name Record Date Individual Corporate NAV(in Rs./Unit) (in Rs./Unit) ( )`
Regular Plan - Dividend
Direct Plan - Dividend
Regular Plan - Dividend
Direct Plan - Dividend
Regular Plan - Dividend
Direct Plan - Dividend
Regular Plan - Dividend
Direct Plan - Dividend
Face value: 10`
SBI Short Term Debt Fund
29-Mar-19 0.0500 0.0500 12.8538
29-Mar-19 0.0500 0.0500 12.3538
30-Apr-19 0.5000 0.0500 12.3007
30-Apr-19 0.5000 0.0500 12.8046
31-May-19 0.5000 0.0500 12.9451
31-May-19 0.5000 0.0500 12.4284
Scheme Name Record Date Individual Corporate NAV(in Rs./Unit) (in Rs./Unit) ( )`
Direct Plan - Monthly Div
Regular Plan - Monthly Div
Direct Plan - Monthly Div
Regular Plan - Monthly Div
Direct Plan - Monthly Div
Regular Plan - Monthly Div
Face value: 10`
SBI Short Term Debt Fund - Retail Plan
30-Nov-18 0.0500 0.0500 11.4344
28-Dec-18 0.0500 0.0500 11.4660
31-Jan-19 0.0500 0.0500 11.4954
28-Feb-19 0.0500 0.0500 11.5083
29-Mar-19 0.0500 0.0500 11.6123
30-Apr-19 0.5000 0.0500 11.5594
31-May-19 0.5000 0.0500 11.6764
Scheme Name Record Date Individual Corporate NAV(in Rs./Unit) (in Rs./Unit) ( )`
Monthly Dividend
Monthly Dividend
Monthly Dividend
Monthly Dividend
Monthly Dividend
Monthly Dividend
Monthly Dividend
Face value: 10`
SBI Magnum Gilt Fund - Quarterly Dividend(Previously known as SBI Magnum Gilt Fund - Long Term Plan)
SBI Magnum Gilt Fund - Monthly Dividend(Previously known as SBI Magnum Gilt Fund - Long Term Plan)
Scheme Name Record Date Individual Corporate NAV(in Rs./Unit) (in Rs./Unit) ( )`
Scheme Name Record Date Individual Corporate NAV(in Rs./Unit) (in Rs./Unit) ( )`
29-Dec-17 0.2000 0.2000 13.4258
29-Dec-17 0.2000 0.2000 14.1448
23-Mar-18 0.2000 0.2000 13.1542
23-Mar-18 0.2000 0.2000 13.8883
07-Sep-18 0.2000 0.2000 13.1049
07-Sep-18 0.2000 0.2000 13.8919
28-Dec-18 0.2000 0.2000 13.4861
28-Dec-18 0.2000 0.2000 14.3374
29-Mar-19 0.2000 0.2000 13.5389
29-Mar-19 0.2000 0.2000 14.4180
Face value: 10`
Face value: 10`
Regular Plan - Dividend
Direct Plan - Dividend
Regular Plan - Dividend
Direct Plan - Dividend
Regular Plan - Dividend
Direct Plan - Dividend
Regular Plan - Dividend
Direct Plan - Dividend
Regular Plan - Dividend
Direct Plan - Dividend
23-Mar-18 0.2000 0.2000 13.7163
23-Mar-18 0.2000 0.2000 14.5017
07-Sep-18 0.2000 0.2000 13.8151
07-Sep-18 0.2000 0.2000 14.6808
28-Dec-18 0.2000 0.2000 13.9521
28-Dec-18 0.2000 0.2000 14.8782
29-Mar-19 0.2000 0.2000 14.0990
29-Mar-19 0.2100 0.2100 15.0590
Scheme Name Record Date Individual Corporate NAV(in Rs./Unit) (in Rs./Unit) ( )`
Regular Plan - Dividend
Direct Plan - Dividend
Regular Plan - Dividend
Direct Plan - Dividend
Regular Plan - Dividend
Direct Plan - Dividend
Regular Plan - Dividend
Direct Plan - Dividend
SBI Credit Risk Fund - Quarterly Dividend#
(#Previously known as SBI Corporate Bond Fund)
Face value: 10`
Dividend History Of Debt & Hybrid Funds
Face value: 10`
SBI Corporate Bond Fund - Monthly Dividend
30-Apr-19 0.5000 0.0500 10.1179
30-Apr-19 0.5000 0.0500 10.1316
31-May-19 0.5000 0.0500 10.2354
31-May-19 0.5000 0.0500 10.2537
Scheme Name Record Date Individual Corporate NAV(in Rs./Unit) (in Rs./Unit) ( )`
Regular Plan - Dividend
Direct Plan - Dividend
Regular Plan - Dividend
Direct Plan - Dividend

67Pursuant to payment of dividend, the NAV of Dividend Option of schemes/plans would fall to the extent of payout and statutory levy, if applicable.Existing plans under the scheme are named Regular w.e.f. 01/01/2013
28-Feb-19 5.0000 5.0000 1114.8689
29-Mar-19 5.0000 5.0000 1113.3409
29-Mar-19 5.0000 5.0000 1119.9999
30-Apr-19 0.5000 5.0000 1112.7887
30-Apr-19 0.5000 5.0000 1119.6116
31-May-19 0.5000 5.0000 1118.1858
31-May-19 0.5000 5.0000 1125.2126
Scheme Name Record Date Individual Corporate NAV(in Rs./Unit) (in Rs./Unit) ( )`
Direct Plan - Mthly Div
Regular Plan - Mthly Div
Direct Plan - Mthly Div
Regular Plan - Mthly Div
Direct Plan - Mthly Div
Mthly Div
Mthly Div
Regular Plan -
Direct Plan -
SBI Magnum Low Duration Fund(Previously known as SBI Ultra Short Term Debt Fund)
Face value: 1000`
SBI Magnum Low Duration Fund - Retail Plan(Previously known as SBI Ultra Short Term Debt Fund)
31-Jul-14 6.5000 6.5000 1047.1081
31-Jul-14 6.5000 6.5000 1047.4407
30-May-14 6.0000 6.0000 1045.1610
30-May-14 6.0000 6.0000 1045.3861
30-Jun-14 6.3000 6.3000 1046.5158
30-Jun-14 6.3000 6.3000 1046.7751
Scheme Name Record Date Individual Corporate NAV(in Rs./Unit) (in Rs./Unit) ( )`
Retail Plan
Retail Plan - Dir - Mthly Div
Retail Plan
Retail Plan - Dir - Mthly Div
Retail Plan
Retail Plan - Dir - Mthly Div
Face value: 1000`
SBI Magnum Low Duration Fund - Institutional Plan(Previously known as SBI Ultra Short Term Debt Fund)
31-Oct-12 8.0486 8.0486 1065.0685
30-Nov-12 7.1638 7.1638 1065.0685
31-Dec-12 7.5144 7.5144 1065.0685
31-Jan-13 7.5715 7.5715 1065.0685
28-Feb-13 6.1130 6.1130 1065.0685
26-Mar-13 7.5986 7.5986 1065.0685
30-Apr-13 9.7772 9.7772 1065.0685
31-May-13 7.2888 7.2888 1065.0685
Scheme Name Record Date Individual Corporate NAV(in Rs./Unit) (in Rs./Unit) ( )`
Institutional Plan - Mthly Div
Institutional Plan - Mthly Div
Institutional Plan - Mthly Div
Institutional Plan - Mthly Div
Institutional Plan - Mthly Div
Institutional Plan - Mthly Div
Institutional Plan - Mthly Div
Institutional Plan - Mthly Div
Face value: 1000`
SBI Banking and PSU Fund - Monthly Dividend(Previously known as SBI Treasury Advantage Fund)
SBI Equity Savings Fund - Monthly Dividend
28-Feb-19 5.0000 5.0000 1052.9761
28-Feb-19 5.0000 5.0000 1078.0969
29-Mar-19 5.0000 5.0000 1064.1433
29-Mar-19 5.0000 5.0000 1090.0657
30-Apr-19 0.5000 5.0000 1058.8792
30-Apr-19 0.5000 5.0000 1085.2238
31-May-19 0.5000 5.0000 1070.5052
31-May-19 0.5000 5.0000 1097.6872
23-Mar-18 0.0650 0.0650 11.5787
26-Feb-18 0.09 0.09 12.2667
26-Feb-18 0.09 0.09 11.8522
29-Dec-17 0.07 0.07 12.3179
29-Dec-17 0.07 0.07 11.9379
10-Jul-18 0.0650 0.0650 12.1689
10-Jul-18 0.0650 0.0650 11.6685
31-Aug-18 0.0500 0.0500 12.4388
Scheme Name Record Date Individual Corporate NAV(in Rs./Unit) (in Rs./Unit) ( )`
Scheme Name Record Date Individual Corporate NAV(in Rs./Unit) (in Rs./Unit) ( )`
Regular Plan - Mthly Div
Direct Plan - Mthly Div
Regular Plan - Mthly Div
Direct Plan - Mthly Div
Regular Plan - Mthly Div
Direct Plan - Mthly Div
Regular Plan - Mthly Div
Direct Plan - Mthly Div
Regular Plan - Mthly Div
Direct Plan - Mthly Div
Regular Plan - Mthly Div
Direct Plan - Mthly Div
Regular Plan - Mthly Div
Direct Plan - Mthly Div
Regular Plan - Mthly Div
Direct Plan - Mthly Div
Face value: 1000`
Face value: 10`
Face value: 10`
SBI Equity Savings Fund - Quarterly Dividend
07-Sep-18 0.2000 0.2000 12.8166
07-Sep-18 0.2000 0.2000 12.1196
Scheme Name Record Date Individual Corporate NAV(in Rs./Unit) (in Rs./Unit) ( )`
Direct Plan - Dividend
DividendRegular Plan -
SBI Magnum Constant Maturity Fund(Previously known as SBI Magnum Gilt Fund - Short Term Plan)
28-Feb-19 0.0500 0.0500 13.5104
29-Mar-19 0.0500 0.0500 13.6690
29-Mar-19 0.0500 0.0500 13.9265
30-Apr-19 0.5000 0.0500 13.8986
30-Apr-19 0.5000 0.0500 13.6372
31-May-19 0.5000 0.0500 14.0331
31-May-19 0.5000 0.0500 14.3066
Scheme Name Record Date Individual Corporate NAV(in Rs./Unit) (in Rs./Unit) ( )`
Direct Plan - Dividend
Regular Plan - Dividend
Direct Plan - Dividend
Regular Plan - Dividend
Direct Plan - Dividend
Regular Plan - Dividend
Direct Plan - Dividend
Face value: 10`
SBI Savings Fund (Previously known as SBI Magnum Income Fund –Floating Rate Plan – Savings Plus Bond Plan)
28-Feb-19 0.0500 0.0500 12.3880
29-Mar-19 0.0500 0.0500 11.9396
29-Mar-19 0.0500 0.0500 12.4343
30-Apr-19 0.5000 0.0500 11.9455
30-Apr-19 0.5000 0.0500 12.4490
31-May-19 0.5000 0.0500 11.9924
31-May-19 0.5000 0.0500 12.5064
Scheme Name Record Date Individual Corporate NAV(in Rs./Unit) (in Rs./Unit) ( )`
Direct Plan - Dividend
Regular Plan - Dividend
Direct Plan - Dividend
Regular Plan - Dividend
Direct Plan - Dividend
Regular Plan - Dividend
Direct Plan - Dividend
Face value: 10`
Dividend History Of Debt & Hybrid Funds
SBI Magnum Medium Duration Fund - Monthly Dividend(Previously known as SBI Magnum Gilt Fund - Long Term Plan)
Scheme Name Record Date Individual Corporate NAV(in Rs./Unit) (in Rs./Unit) ( )`
28-Dec-18 0.2000 0.2000 12.9748
28-Dec-18 0.2000 0.2000 13.5960
28-Dec-18 0.2000 0.2000 12.9748
28-Dec-18 0.2000 0.2000 13.5960
Face value: 10`
Regular Plan - Dividend
Direct Plan - Dividend
Regular Plan - Dividend
Direct Plan - Dividend
68
Disclaimer for data from CRISIL'S FUND ANALYSER:
Disclaimer:
Disclaimer of SBI Nifty Index Fund:
Mutual Fund Investments are subject to market risks, read all scheme related documents carefully.
Asset Management Company:
Trustee Company:
Registered Office:
CRISIL has taken due care and caution in compilation of the
Data contained in the CRISIL'S FUNDANALYSER. The Data in the CRISIL'S FUNDANALYSER has been obtained by
CRISIL from sources, which it considers reliable. However, CRISIL does not guarantee the accuracy, adequacy or
completeness of any Data in the CRISIL'S FUND ANALYSER and is not responsible for any errors or omissions or for
the results obtained from the use of such Data. CRISIL especially states that it has no financial liability whatsoever to
the users of CRISIL'S FUND ANALYSER. CRISIL or any of its directors/ employees/ representatives does not accept
any liability for any direct or consequential loss arising from the use of the Data contained in the CRISIL'S FUND
ANALYSER or any data generated from the CRISIL'S FUNDANALYSER.
This investment update is for information purpose only and is not an offer to sell or a solicitation to buy any
mutual fund units/securities. These views alone are not sufficient and should not be used for the development or
implementation of an investment strategy. It should not be construed as investment advice to any party.All opinions and
estimates included in this schemes guide constitute our view as of this date and are subject to change without notice.
Neither SBI Funds Management Private Limited, nor any person connected with it, accepts any liability arising from the
use of this information. The recipient of this material should rely on their own investigations and take professional
advice on their own.
In the preparation of the material contained in this document, the AMC has used information that is publicly available,
including information developed in-house. Information gathered and material used in this document is believed to be
from reliable sources published by third parties. While such publications are believed to be reliable, however, neither
theAMC, its officers, the trustees, the Fund nor any of their affiliates or representatives assume any responsibility of the
accuracy, reasonableness and/or completeness of any information. For data referred to of any third party in this
material no such party will assume any liability for the same. Further, all opinion included in this newsletter are as of date
and are subject to change without any notice.All recipients of this material should seek appropriate professional advice
and carefully read the scheme information document/ statement of additional information and before dealing and or
transacting in any of the products referred to in this material make their own investigation.The Fund, the AMC and
Trustees and any of its directors, officers, employees and other personnel shall not liable for any loss, damage of any
nature, including but not limited to direct, indirect, punitive, special, exemplary, consequential, as also any loss of profit
in any way arising from the use of this material in any manner whatsoever. The recipient alone shall be fully
responsible/are liable for any decision taken on the basis of this material.
“The “SBI Nifty Index Fund” offered by “SBI Funds Management Private Limited”
is not sponsored, endorsed, sold or promoted by India Index Services & Products Limited (IISL) and its affiliates. IISLdo
not make any representation or warranty, express or implied (including warranties of merchantability or fitness for
particular purpose or use) and disclaims all liability to the owners of “SBI Nifty Index Fund” or any member of the public
regarding the advisability of investing in securities generally or in the “SBI Nifty Index Fund” linked to Nifty 50 Index or
particularly in the ability of the Nifty 50 Index to track general stock market performance in India. Please read the full
Disclaimers in relation to the Nifty 50 Index in the Scheme Information Document.”
SBI Funds Management Private Limited (A joint venture between SBI & AMUNDI)
CIN: U65990MH1992PTC065289. SBI Mutual Fund Trustee Company Private Limited
9th Floor, Crescenzo, C-38 & 39, G Block, Bandra-Kurla Complex,
Bandra (East), Mumbai 400 051. Tel.: 022-61793000 E-mail : [email protected] • www. sbimf.com
CIN:
U65991MH2003PTC138496.
Disclaimer
69
NORTH
SOUTH
EAST
WEST
Chandigarh: 0172-2703380 • Gurgaon: 0124-4200828/ 0124-4083769 • Jaipur: 0141-2740061/2740023• Kanpur: 0512-6900314/15 • Lucknow: 0522-2286742 • Ludhiana: 0161-2449849 • New Delhi: (011) 23466666Aligarh: 0571-2402017 • Ambala: (0171) 2653400 • Bathinda: (0164) 2218415 • Dehradun: 0135-2651719• Dhanbad: 0326-2301545 • Dharamshala: 01892-225814 • Faizabad: 919999029351/ 919811607620• Faridabad: 0129 - 4030661 • Ferozepur: 01632-236167 • Ghaziabad: 0120-2797582 Gorakhpur:0551-2203378 • Haldwani: 0594-6220526 • Hissar: 01662 238415 Hosiharpur: 0188-2228415 • Jabalpur:0761-2410042 • Jalandhar: 0181-2238415 • Jammu: 0191-2474975 • Jhansi: 0510-2330298 • Jodhpur:0291-2611929/ 28 • Meerut: 0121-2667877 • Moradabad: 0591-2411411 • Panchakula: 0172-2580136 • Panipat:0180-2648415 • Pathankot: 8872008415 • Patiala: 0175-2300058 • Rohtak: (0126) 2258415 • Saharanpur: 0132-2720789 • Shimla: 0177-2807608 • Sonepat: 011- 23466666 • Udaipur: - • Varanasi: 0542-2222492 • Nehru Place(Delhi): (011) 26224606 • Noida: 0120-4232214 • Pitam Pura (Delhi): (011) 23751974
Bangalore: 080-25580014/51 • Chennai : 044 2854 3382/83 • Coimbatore: 0422 - 2541666 • Ernakulam:0484-2323489 2318886 • Hyderabad: 040-69000541/42 • Thrivanthapuram: 0471-4011590 / 4011591 / 4011592• Vijayawada: 0866-2436113/2438217 Bareilly: 7830111140 • Belgaum: 0831-2422463 • Bellary: 0839-2271775• Calicut: 0495-2768270/4020079 • Cuttack: 0671-2422792 • Davangere: 08192-231463
• Guntur: 0863-2211022 • Hubli: 0836-2368477 • Kannur: 0497-2708180 • Kollam: 0474-2752760• Kottayam: 0481-2570816 • Kurnool: 08518-227776 • Madurai: 0452 4374242 • Mangalore: 0824-2222463• Mysore: 0821-2424919 • Nellore: 0861-2338688 • Pondichery: 9445196934 • Rajahmundry:0883-2434002/2432306 • Salem: 0427 - 4552289 • Shimoga: 08182-222463 • Thiruchirapalli: 0431-4000667• Thrissur: 8129354324 • Thrissur: 0487-2445700 • Tinsukia: - • Tirunelveli: 0462 4220023 • Tirupati(0877)6450828 • Vellore: 0416- 2225005 • Vishakapatnam: 0891-3293018/2511853 • Warangal: 0870-2430307
Bhubaneshwar: (0674) 2392401/501 • Guwahati: 0361-2463747/2130366 • Kolkata: 22882342 / 22883767 /22883768 • Patna: 0612-3242047 • Raipur: (0771) 2543355 / 4263256 • Ranchi:0651-2213212/3205026 Agartala: 0381-2384107 • Asansol: 8170037270 • Balasore: 0678-2262646• Bhagalpur: 0641-2420661 • Bhilai: 0788-6940012/6940011-6940010/6940014/6940013 • Bokaro: 9304823011• Bokaro: 06542-232561 • Burdwan: 8335844461 • Darbhanga: 06272-245004 • Dimapur: 0386-2224267• Durgapur: 2544191 / 192 • Gaya: 0631-2222405 • Hazaribagh: 06546-270415 • Imphal: 0386-2224267• Itanagar: 0360-2292416 • Jamshedpur: 0657-2440446 • Jorhat: 0367-2304396 • Kalyani: 033-25827700• Kharagpur: (03222) 225592 • Malda: (03512)266128 • Port Blair: (03192)235552 • Rourkela: 0661-2400299• Sambalpur: 0663-2410001 • Shillong: 9436704232 • Silchar: 0384-2221109 • Siliguri: (0353) 2537065• Sriganganagar: 9829067384
Ahmedabad: 079-26423060/70; 26463090 • Bhopal: 0755-2557341 • Goa: (0832) 2235283 / 6642475 • Indore:0731-2541141/6900080/85 • Mumbai: (022) 66532800 • Nagpur: 0712 - 6458368 • Pune: 020 25670961/25671524/ 25653398 / 99 • Surat: 0261-3994800/6646555/2462764 • Vadodara: 0265-2323010 Agra: 0562-2850239 • Ajmer: 0145-2426284 • Allahabad: 0532-2261028 • Alwar: (0144) 2332035 • Amravati: - • Amritsar:0183-2221755 • Anand: 02692-246210 • Aurangabad: 0240 3244781 • Bavnagar: (0278) 2523788 • Bharuch:02642-247550 • Bhilwara: 01482-240144 • Bhuj: (02832) 250900 • Bilaspur: 07752-415300 • Gandhidham:02836-233615 • Gwalior: 0751-2447272 • Jalgaon: 9545025850 • Jamnagar: (0288) 2660104 • Junagadh: 0285-2670350 • Kolhapur: 0231 2680880 • Korba: 07759-230082 • Kota: 0744 – 2390631 • Margao: (0832) 2725233-2725234 • Mehsana: 02762-233872 • Nadiad: 0268-2560110 • Nashik: 0253 - 6575888, 2232553 • Navsari:02637-242266 • Raipur: (0771) 2543355 / 4263256 • Rajkot: 0281-2466740/41 • Ratlam: 07412-409492 • Sagar:07582-241367 • Solapur: 09226389292 • Srinagar: 0194-2474864 • Valsad: 02632-245440 • Vapi: 0260-2400480• Borivali (Mumbai): 022-28927551 • Chinchwad: 020 27355721 • Kalyan: (0251) 2311850 / 2311980 • Thane022-25414594 • Vashi: 022-27810368
•
• Amritsar (Punjab): (0183)2221755 • Mandi: (01905) 223833 • Srinagar: (0194) 2474864 • Baddi: (01795) 244415 • Hamirpur: 9855008415 •
Sangrur: (0167) 2500020
• Gulbarga:9980872463
• Muzzaffarpur: 9473199059
•
SBI Funds Management Pvt Ltd Branches

70
Fund Manager :
Application Amount for Fresh Subscription :
Minimum Additional Amount :
Yield to Maturity :
SIP :
NAV :
Benchmark :
Entry Load :
Note:
Exit Load :
Modified Duration :
Standard Deviation :
Sharpe Ratio :
Beta :
AUM :
Holdings :
Nature of Scheme :
Rating Profile :
Tracking Error :
An employee of the asset management company such as a mutual fund or life insurer, who manages
investments of the scheme. He is usually part of a larger team of fund managers and research analysts.
This is the minimum investment amount for a new investor in a mutual fund
scheme.
This is the minimum investment amount for an existing investor in a mutual fund scheme.
The Yield to Maturity or the YTM is the rate of return anticipated on a bond if held until maturity. YTM is
expressed as an annual rate. The YTM factors in the bond's current market price, par value, coupon interest rate and time to
maturity.
SIP or systematic investment plan works on the principle of making periodic investments of a fixed sum. It works similar
to a recurring bank deposit. For instance, an investor may opt for an SIP that invests Rs 500 every 15th of the month in an
equity fund for a period of three years.
The NAV or the net asset value is the total asset value per unit of the mutual fund after deducting all related and
permissible expenses. The NAV is calculated at the end of every business day. It is the value at which the investor enters or
exits the mutual fund.
A group of securities, usually a market index, whose performance is used as a standard or benchmark to
measure investment performance of mutual funds, among other investments. Some typical benchmarks include the Nifty 50,
S&P BSE Sensex, BSE 200, BSE 500, 10-Year Gsec.
A mutual fund may have a sales charge or load at the time of entry and/or exit to compensate the
distributor/agent. Entry load is charged at the time an investor purchases the units of a mutual fund. The entry load is added to
the prevailing NAV at the time of investment. For instance, if the NAV is Rs. 100 and the entry load is 1%, the investor will enter
the fund at Rs 101.
SEBI, vide circular dated June 30, 2009 has abolished entry load and mandated that the upfront commission to
distributors will be paid by the investor directly to the distributor, based on his assessment of various factors including the
service rendered by the distributor
Exit load is charged at the time an investor redeems the units of a mutual fund. The exit load is deducted from the
prevailing NAV at the time of redemption. For instance, if the NAV is Rs 100 and the exit load is 1%, the redemption price would
be Rs 99 Per Unit.
Modified duration is the price sensitivity and the percentage change in price for a unit change in yield
Standard deviation is a statistical measure of the range of an investment's performance. When a mutual
fund has a high standard deviation, its means its range of performance is wide, implying greater volatility.
The Sharpe Ratio, named after its founder, the Nobel Laureate William Sharpe, is a measure of risk-adjusted
returns. It is calculated using standard deviation and excess return to determine reward per unit of risk.
Beta is a measure of an investment's volatility vis-à-vis the market. Beta of less than 1 means that the security will be
less volatile than the market. A beta of greater than 1 implies that the security's price will be more volatile than the market.
AUM or assets under management refers to the recent / updated cumulative market value of investments managed by a
mutual fund or any investment firm.
The holdings or the portfolio is a mutual fund's latest or updated reported statement of investments/securities.
These are usually displayed in terms of percentage to net assets or the rupee value or both. The objective is to give investors an
idea of where their money is being invested by the fund manager.
The investment objective and underlying investments determine the nature of the mutual fund scheme.
For instance, a mutual fund that aims at generating capital appreciation by investing in stock markets is an equity fund or
growth fund. Likewise, a mutual fund that aims at capital preservation by investing in debt markets is a debt fund or income
fund. Each of these categories may have sub-categories.
Mutual funds invest in securities after evaluating their creditworthiness as disclosed by the ratings. A
depiction of the mutual fund in various investments based on their ratings becomes the rating profile of the fund. Typically,
this is a feature of debt funds.
Measure that indicates how closely the portfolio return tracks the benchmark return. Tracking error is the
standard deviation of the difference of returns between a portfolio and the benchmark over a specified holding period.
S&P S&P
How to read the Factsheet?
