june 3, 2020. title: mcnp 6 simulations of short-lived
TRANSCRIPT

AN ABSTRACT FOR THE THESIS OF
Tanner D. Jeffries for the degree of Master of Science in Radiation Health Physics presented on
June 3, 2020.
Title: MCNP 6 Simulations of Short-Lived, Low-Yield Fission Byproducts, Gamma-Ray
Spectrometry, and their Comparison to Natural Uranium Measurements for the Evaluation of
Available Evaluated Nuclear Data Files.
Abstract approved:
______________________________________________________________________________
Steven R. Reese
Natural uranium samples were irradiated in-core for 7 seconds using the pneumatic rabbit system
within the TRIGA Mark II Reactor at Oregon State University, and then used to generate a
gamma-ray spectrum with a high purity germanium (HPGe) detector. The irradiated sample was
simulated in Monte Carlo N-Particle (MCNP), a radiation transport code developed to simulate
fission, or burnup, of special nuclear material for application in the field of nuclear forensics, to
replicate the experiment, and a simulated gamma ray spectrum was generated within MCNP for
this sample. The results of these experiments were compared to each other in order to highlight
inconsistencies between available evaluated nuclear data and expected physical data. There were
limitations discovered within MCNP that restrict the viability of using MCNP for replicating
gamma ray spectra produced by fission byproducts, due to lack of available data for short-lived,
low-yield fission byproducts. Further work may be performed to experimentally verify and/or
correct the current available data to reflect actual fission yields, in order to improve the reliability
of MCNP for use in repeating characteristic analysis of special nuclear material.

© Copyright by Tanner D. Jeffries
June 3, 2020
All Rights Reserved

MCNP 6 Simulations of Short-Lived, Low-Yield Fission Byproducts, Gamma-Ray
Spectrometry, and their Comparison to Natural Uranium Measurements for the Evaluation of
Available Evaluated Nuclear Data Files
by
Tanner D. Jeffries
A THESIS
submitted to
Oregon State University
in partial fulfillment of
the requirements for the
degree of
Master of Science
Presented June 3, 2020
Commencement June 2021

Master of Science thesis of Tanner D. Jeffries presented on June 3, 2020.
APPROVED:
Major Professor, representing Radiation Health Physics
Head of the School of Nuclear Science and Engineering
Dean of the Graduate School
I understand that my thesis will become part of the permanent collection of Oregon State
University libraries. My signature below authorizes release of my thesis to any reader upon
request.
Tanner D. Jeffries, Author

ACKNOWLEDGEMENTS
I would like to thank Dr. Steven Reese, my advisor, for consistently encouraging me
throughout the research process, and providing the extra push I needed to complete my research
whenever I became discouraged or frustrated. I am incredibly grateful for your patience,
wisdom, and understanding.
I would also like to thank my parents and the rest of my family, for supporting me
throughout the years as I moved from one side of the country to another in pursuit of personal
growth and education. I was and am grateful for your love and encouragement, even if I did not
always make that apparent.
Thank you to Robert Schickler, for teaching me that I could do more than I ever
thought was possible with a computer program over twice my age, and to Mitch Mannino for
patiently helping me learn how to use Python.
Special thanks to the friends I made at Oregon State University, for helping me feel
like I was in the right place and for believing in me even when I did not believe in myself.
Finally, I would like to thank Lynn Oster, for teaching me how to take pride in my
work, and for pushing me to work to the best of my abilities. I hope to one day inspire others the
way you have inspired me.

TABLE OF CONTENTS
Page
1 Introduction……………………………………………………………………………………...1
1.1 Motivation…………………………………………………………………………..2
1.2 Objectives…………………………………………………………………………...3
1.3 Document Overview………………………………………………………………...4
2 Background Theory and Literature Review…………………………………………….……….5
2.1 Nuclear Fission……………………………………………………………….……..5
2.2 Beta and Gamma Decay in Fission Products……………………………………….6
2.3 Interactions of Photons with Matter………………………………………………...8
2.3.1 The Photoelectric Effect…………………………………………………….8
2.3.2 The Compton Effect…………………………………………………………8
2.3.3 Pair Production……………………………………………………………..10
2.4 Semiconductor detectors………………………………………………………......11
2.5 Energy Deposition…………………………………………………………………13
2.6 Gamma Spectroscopy……………………………………………………………...15
2.6.1 Nuclear Instrumentation Modules and Pulse Processing…………………..18
2.6.2 Listmode Collection and Data Parsing…………………………………….18
2.7 Nuclear Forensics, Safeguards, and Non-Proliferation……………………………19
2.7.1 Assay and Interrogation……………………………………………………20
2.7.2 Simulation in the Realm of Nuclear Forensics…………………………….21
2.8 Monte Carlo N-Particle (MCNP)………………………………………………….22
2.8.1 Burnup……………………………………………………………………..22
2.8.2 Evaluated Nuclear Data Files………………………………………………23
2.8.3 Point Detection in MCNP………………………………………………….24
3 Methods and Materials…………………………………………………………………………25
3.1 Target Description…………………………………………………………………25
3.2 TRIGA Reactor……………………………………………………………………26
3.2.1 The Specimen Capsule (Rabbit) System…………………………………..26

TABLE OF CONTENTS (Continued)
Page
3.3 Experiment Setup………………………………………………………………….27
3.4 ORTEC GEM P-Type HPGe Detector……………………………………………28
3.5 List-Mode Data Collection………………………………………………………..29
4 Results and Analysis…………………………………………………………………………..30
4.1 MCNP Isotope Catalogs…………………………………………………………..30
4.2 Gamma Ray Spectra………………………………………………………………33
4.3 Discussion…………………………………………………………………………37
4.4 MCNP Libraries…………………………………………………………………..39
4.5 Accuracy to Calculated Values……………………………………………………40
5 Conclusion……………………………………………………………………………………..41
6 Future Work……………………………………………………………………………………41
Bibliography……………………………………………………………………………………..43
Appendices………………………………………………………………………………………48

LIST OF FIGURES
Page
1. Observed fission product yield of thermal fission of U-235 as a function of atomic mass ……6
2. Diagram representing deformations of liquid drop model of atomic nucleus………………….7
3. Visualization of the Compton effect……………………………………………………………9
4. Photon interaction mechanisms as a function of energy and material atomic number………..10
5. Discrete atomic energy levels compared to energy bands within solid state materials……….11
6. Unbiased and biased p-n junctions within a semiconductor…………………………………..12
7. The Compton Continuum and Compton Edge………………………………………………..14
8. Sample monoenergetic pulse height distribution……………………………………………...17
9. Measured pulse height spectrum with imperfect energy resolution…………………………..17
10. Sample multi-energetic spectrum recorded with a Ge detector……………………………...17
11. Sample output spectrum from a multichannel analyzer……………………………………...18
12. Overhead view of TRIGA Mk II. Reactor visualized using MCNP interactive plotter……..23
13. Rabbit specimen capsule……………………………………………………………………..27
14. Pulse processing chain block diagram for HPGe detector setup…………………………….28
15. Coaxial detector example geometries and electrode configurations…………………………29
16. Combined MCNP and experimental List mode spectra……………………………………..34
17. Semilog plot, combined spectra……………………………………………………………...35
18. Combined Spectra, U-239 peak removed……………………………………………………36
19. Combined Spectra, U-239 peak removed, semilog plot……………………………………..37

LIST OF EQUATIONS
Page
1. Production rate of a fission byproduct………………………………………………………….7
2. General form of beta decay …………………………………………………………………….8

LIST OF TABLES
Page
1. Post burnup non-actinide inventory…………………………………………………………..31
2. Post burnup actinide inventory……………………………………………………………….31
3. Calculation of expected Mo-99 mass…………………………………………………………32
4. Expected mass of relatively high-yield fission products……………………………………...32

1
1 Introduction
In the modern world of nuclear science, fission remains to be a major focus of research
and attention in part due to its prominence in the areas of nuclear forensics and nonproliferation.
While fission can be used to produce useful isotopes for commercial applications such as
radiopharmaceuticals, medical equipment, or radiotracers for industrial use, other, less useful
fission byproducts can be of great concern due to the difficulties in reprocessing or handling as
waste. Such sources of these fission byproducts can vary from spent fuel from a commercial
reactor application, byproducts of manufacturing the fuel, or sources such as those used in
nuclear weapons. While these material characteristics and conditions are not ideally replicated
for research purposes, simulation programs exist that can assist in the modeling and
characterization of material that would otherwise be difficult or impossible to possess while
complying with domestic and international regulations.
For certain research applications, it is often beneficial to utilize simulation programs such
as MCNP due to the large libraries of experimental data available for fission yields and nuclear
interactions. However, the most prominent data sets used in modern calculations and modeling
programs focus largely on radioisotopes that remain for long periods of time post-fission event,
due to their prominence in application, be it commercial, military, or otherwise. This, however,
has led to incomplete data for fission products of both shorter lifetimes and lower fission yield.
Fission does occur naturally in nuclides with a high atomic mass and it can be artificially
induced in various ways; one commonly used method is a reactor which utilizes neutron-induced
fission. Neutron irradiation of materials is commonly performed using either a fast neutron
generator, such as a deuterium-tritium generator for inducing fissions from higher energy

2
neutrons, or a research reactor such as a TRIGA (Training, Research, Isotopes, General Atomics)
reactor, for lower neutron energy induced fissions.
Nuclides that undergo fission, as well as their byproducts, release characterizable
emissions directly from radioactive decay, for example prompt and delayed neutrons and
gamma-rays. For material identification and analysis, it is useful to utilize the characteristic
gamma-rays produced by the fission byproducts using gamma-ray spectroscopy. Using the
produced spectrum can aid in identifying the source of the fission products by comparing to
known fission yield distributions. This work aims to measure the short-lived fission products
created by thermal neutron induced fission of natural uranium, which consists primarily of
fissionable 238U and fissile 235U using a TRIGA class research reactor.
1.1 Motivation
The motivation of this work is drawn from the lack of available evaluated nuclear data
files for short lived, low yield fission products within the National Nuclear Data Center’s
evaluated nuclear data files used by Monte Carlo simulations. Ratios of isotopes produced can
often indicate the initial material composition prior to undergoing irradiation, and this
information can be used to trace the material back to a source, either a location or a device. The
yield distribution depends on both the energy of the inciting particle as well as the target, but
generally follows a pattern of two peaks within the distribution spectrum, one of higher mass
than the other, with a “valley” centered between them. Knowing this distribution for specific
targets and incident particles, and being able to accurately reproduce them, would be beneficial
for simulating various nuclear forensics experimentations without needing to address material
acquisition or handling. Previous work performed at Oregon State University utilizes various

3
simulation and analytical methods for investigating short-lived fission yields for forensic
application [7, 29, 33].
1.2 Objectives:
The goal of this work is to provide a clear example of the discrepancies between
experimental and simulated fission yields for natural uranium. Improvements to the evaluated
nuclear data files used for simulation will be suggested, concerning fission yields as well as any
other observed inconsistencies or issues caused by the program itself. The objectives listed below
highlight the plan for achieving this goal.
• Measure thermal neutron induced fission product yields of natural uranium and create a
Monte Carlo simulation replicating the experiment
• Create a gamma-ray spectrum of the samples and compare isotope composition to the
simulated experiment.
• Target the discrepancies, suggest the possible sources of error, and propose solutions to
eliminate the discrepancies.

4
1.3 Document Overview
Chapter 2 – Theory and Literature Review
The mechanics of fission, analysis of fission products using gamma ray spectroscopy, and
its application in modern nuclear forensics and nonproliferation are described.
Chapter 3 – Methods and Materials
The experimental setup is outlined, along with the methodology. A description of the
reactor and γ-ray spectrometry instrumentation and how it is used to determine the fission
yields is provided.
Chapter 4 – Simulation and In-Universe Experiment
The simulation process that replicates the experimental setup is described. This includes
the reactor itself and the detector setup
Chapter 5 – Results
The fission product yield for the natural uranium is reported. The result is compared to
the simulated spectrum
Chapter 6 – Conclusions
Conclusions on the compared fission yields are discussed, and discrepancies are pointed
out. Future work is proposed.

5
2. Theory and Literature Review
2.1 Nuclear Fission
In atomic nuclei, the binding energy due to the strong force increases in a manner that is
roughly proportional to A, or the number of total nucleons contained within, while the Coulomb
forces increase proportional to the square of Z, the number of protons. In certain heavier nuclei,
these opposing forces cause the nucleus to occupy an excited energy state, making them unstable
and more susceptible to undergo spontaneous fission, however any nucleus is capable of fission
if a sufficient excitation energy is provided as the result of an incident particle (i.e. proton,
neutron, deuteron, triton) interacting with the nucleus [4, 15].

6
Low-energy (thermal) neutrons, with energies around 0.025 eV are capable of inducing
fission in certain heavy nuclei, often classified as “fissile” nuclei, which all contain an unpaired
neutron within the nucleus. After
capturing the thermal neutron,
sufficient energy is provided in
order for the nucleus to become
unstable and induce fission, which
then subsequently occurs in a time
frame of ~10-12 seconds. This
process causes the nucleus to split
into two smaller nuclei, which
follow the yield probability curve
shown in Figure 1, accompanied by
a varying number of neutrons that
are either prompt (released within
~10-14 seconds), or delayed
(released upwards of tens of minutes after fission event), as well as neutrinos, β-particles, and γ-
rays. The largest portion (~80%) of the approximately 200 MeV released by this fission event is
imparted on the fission product as kinetic energy [4]. The resultant neutrons are capable of
inducing fission in other nearby fissionable or fissile materials, which can create a self-sustaining
chain reaction. Equation 1 shows the calculation method to determine the amount of a desired
nuclide that is produced during a sustained fission chain reaction, where N0 is the initial number
of fissile target atoms, Φ is the neutron flux incident on the target, given in units of neutrons per
Figure 1. Observed fission product yield of thermal
fission of U-235 by atomic mass number [4]

7
area per unit time, σ is the thermal fission cross section in units of area, which represents the
probability of a thermal neutron inducing being absorbed by the nucleus of the target atom and
inducing a fission event, and Y% is the fission yield percent of the desired byproduct.
𝑅 = 𝑁0 ∗ 𝛷 ∗ 𝜎𝑛,𝑓 ∗ 𝑌%
Equation 1. The production rate (R) of a given fission byproduct.
Bohr and Wheeler approximate the atomic nucleus as a liquid drop, with the excited
states of nuclei giving rise to oscillations that are counteracted by the strong force, which acts in
a similar manner to surface tension that keeps the nucleus intact. However, provided the nuclear
charge reaches a critical value, the spherical
form can become unstable and begin to
deform following the pattern c → b → a,
shown in Figure 2 [3]. The two smaller
nuclei are then repelled by the Coulomb force
and move away from each other. The mass of these fission products varies, but follows an
asymmetrical distribution, typically releasing two smaller nuclei of differing masses which have
an average atomic mass of 118 [19, 23]. These nuclei are emitted in an excited energy state and
go through de-excitation processes of their own by emitting radiation of their own, in the form of
betas, gammas, and neutrons [32].
2.2 Beta and Gamma Decay in Fission Products
Shown in Equation 2, Beta decay occurs within the nucleus of an atom and is the process
by which a neutron is
Figure 2. Diagram representing deformations
of liquid drop model of atomic nucleus [3]

8
converted to a proton, or vice versa, preserving the atomic mass of the nucleus while changing
the charge of the nucleus; the emitted
particle is referred to as a beta particle and
can either be positively or negatively
charged [15]. This resulting nucleus is
often left in an excited energy state and will release that energy in the form of a photon via
isometric transition [13]. These photons will have discrete energy depending on their source
isotope, and can be measured based on the interactions undergone by the photon within a
detecting medium.
2.3 Interactions of Photons with Matter
Photons that are released by radioactive nuclei can interact with matter in largely three
distinct ways, which can all be used and measured within a detecting medium. How the photon
interacts with the medium is largely dependent on the energy of the photon as well as the atomic
number of the target material, which corresponds to the number of electrons within the material.
These three interactions are the photoelectric effect, Compton scattering, and pair production.
2.3.1 The Photoelectric Effect
The photoelectric effect is the process by which a photon interacts with an atom as a
whole, transferring its energy into an orbital electron, causing it to be ejected as a free electron
with an energy equal to that of the incoming photon minus the binding energy of the electron.
This electron, once ejected can recombine with the detecting material, releasing another photon
in turn, which can then interact again with the medium [32].
𝑋𝑍𝐴
𝑦𝑖𝑒𝑙𝑑𝑠→ 𝑌𝑍±1
𝐴 + 𝛽∓
Equation 2. The general form of the equation for
beta decay [32]

9
2.3.2 The Compton Effect
The Compton effect, also referred to as Compton scattering, occurs when a photon
collides with a free electron. While electrons within a medium are bound, if the energy of the
photon is sufficiently high, on the order of keV, compared to the binding energy of the electrons
within the medium, on the order of eV,
the electron is considered to be free for
the sake of this interaction. The
difference between the Compton effect
and the photoelectric effect is that the
interacting photon does not disappear
as a result of the Compton effect; its energy is reduced and its direction of motion changes, with
the energy lost by the photon being given to the electron [32]. A visualization of this
phenomenon can be seen in Figure 3.
Figure 3. A visualization of the Compton effect [32]

10
2.3.3 Pair Production
For photons of sufficiently high energy, greater than double the energy of the rest mass of
an electron (511 keV), an interaction known as pair production may occur only in the presence of
a nucleus. The nucleus in question does not undergo any change of its own, however it does
interact with the photon, which disappears and is replaced by two particles of equal mass, an
electron and an anti-electron, or positron. These particles will appear and begin to move within
the medium. The positron will eventually interact with another electron, annihilating with each
other at the end of its path of travel and producing two photons of equal energy [32]. It is
important to note that while the
threshold for this interaction is
1.022 MeV, this interaction will
often not be observed for photons
with energy equal to this value,
due to the produced pair needing
additional energy in order to have
the kinetic energy required for the
particles to overcome the
electromagnetic force between
themselves and begin travelling through the medium. A graphical representation of photon
interaction mechanism as a function of photon energy and target atomic number can be seen in
Figure 4.
Each of these unique interactions can be seen using a detecting medium, which is
comprised of a material that readily interacts with incident radiation events. For gamma rays,
Figure 4. The dominant photon interaction mechanism within a
material, as a function of photon energy and material Z number
11
these detecting mediums can take several distinct forms: gas-filled ionization chambers such as
a Geiger-Mueller tube, scintillation detectors, and solid-state detectors, which include
semiconductor detectors.
2.4 Semiconductor Detectors
One method of detecting photon interactions with matter is using semiconductor
detectors. Within the crystal structure of the solid-state material, as opposed to the discrete
energy states in which electrons are allowed to exist around a free atom, energy bands exist
within the material that the electrons instead occupy, with certain gaps between bands referred to
as forbidden gaps.
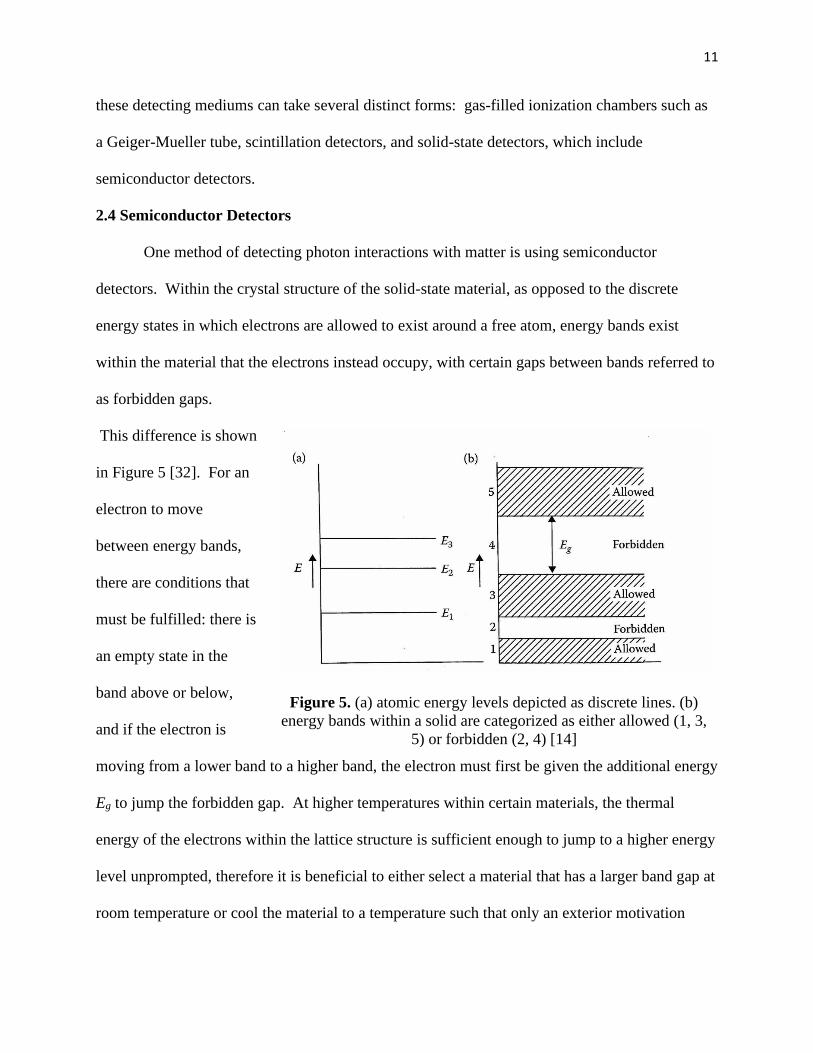
This difference is shown
in Figure 5 [32]. For an
electron to move
between energy bands,
there are conditions that
must be fulfilled: there is
an empty state in the
band above or below,
and if the electron is
moving from a lower band to a higher band, the electron must first be given the additional energy
Eg to jump the forbidden gap. At higher temperatures within certain materials, the thermal
energy of the electrons within the lattice structure is sufficient enough to jump to a higher energy
level unprompted, therefore it is beneficial to either select a material that has a larger band gap at
room temperature or cool the material to a temperature such that only an exterior motivation
Figure 5. (a) atomic energy levels depicted as discrete lines. (b)
energy bands within a solid are categorized as either allowed (1, 3,
5) or forbidden (2, 4) [14]

12
causes the electron to move to a higher energy level [14,32]. Materials that possess these desired
characteristics are referred to as semiconductors, due to their ability to conduct electrical charge
based on the environment the material itself is placed in.
The material properties of a semiconductor detector also contribute to the establishment
of the electric field within the material and therefore the charge formation and collection that
creates the pulses within the detector. For pure germanium detectors, the semiconductor crystal
is connected to a voltage source, and the electron-hole pairs drift apart, creating a concentration
of electrons at one end and a concentration of holes at the other. This forms a p-n semiconductor
junction within the material. Applying a reverse bias to this junction causes the potential across it
to increase, which is beneficial for charge collection when using the semiconductor as a radiation
detector. This process can be seen in Figure 6 below.
Figure 6. (a) an unbiased p-n junction. (b) a p-n junction with a reverse
voltage applied, which causes the potential depth x0 to increase [32]
When a charged particle or other ionizing radiation event passes through the detector
material, electron-hole pairs are created as the electrons become excited and move to higher
energy levels. In germanium, the energy required to create these pairs, also known as the

13
ionization energy, is on the order of ~3 eV, which is around 10 times lower than that of gas-filled
detectors, meaning that the number of charge carriers produced per radiation event is around 10
times greater within semiconductors. As these charge carriers are produced, the detector is
configured in such a way that the applied voltage bias across the material causes them to move in
opposite directions, creating a current throughout the material. The current is collected at the
electrodes and output as a measurable pulse that is proportional to the total energy deposited
within the detector [32].
2.5 Energy Deposition
Below the energy threshold for pair production, photons within the detector can only
interact via the photoelectric effect or via coherent or incoherent scattering, which includes
Compton scattering as well as Rayleigh and Thompson Scattering. For photoelectric
interactions, the resultant ejected electron will have energy equal to the incident photon minus
the binding energy of the electron. The energy spent on freeing the electron as well as the energy
released by the resultant electrons dropping down into the lower energy levels freed up by the
incident particle energy deposition will be read by the detector almost simultaneously (within
about 10-8 seconds of the radiation event interaction).
For Compton scattered photons, only a fraction of their initial energy will be given to an
electron within the detector medium. For detectors of a finite size, there will always be a chance
that the resulting scattered photon will not interact again within the detector medium, which can
change based off the location of the initial reaction within the detector as well as the material
with which the detector is made. Due to this interaction, pulse height within the created
spectrum for Compton events will be proportional to an energy less than that of the incident
photon energy.

14
Electrons that interact via Compton scattering with the incident photons will have
energies within a range dependent upon the initial photon energy. This range goes from zero to
𝑇𝑚𝑎𝑥 = 𝐸 −𝐸
1+2𝐸/𝑚0𝑐2, where m0c
2 is the rest mass energy of an electron, or 511 kV. Due to this
relationship, pulses created within the detector by Compton interaction will have heights
between V=0 volts, corresponding to a T of zero, up to the voltage corresponding to the
maximum electron energy Tmax. For a detector system with perfect energy resolution, the
spectrum formed by the interaction of an incident radiation particle with energy E0 will appear
similar to that shown in Figure 7 on
the right, where some radiation
events will result in full energy
deposition at the channel
corresponding to the energy E0 of the
incident particle, while others will
only deposit some of their energy,
creating a continuous range known
as the Compton Continuum, which
ends abruptly at an energy equal to Tmax, also known as the Compton edge. This phenomenon
becomes less prominent for detectors of larger size, and would disappear entirely for a detector
of infinite size.
For photons with energy greater than 1.022 MeV, or double the rest mass energy of a free
electron, pair production within the detector is possible. When this interaction occurs, the
incident photon disappears simultaneously with the formation of an electron-positron pair, which
consumes 1.022 MeV of energy with the remainder being split between the two resultant
Figure 7. an example pulse height spectrum from a
monoenergetic photon source, with perfect energy
resolution (i.e. no statistical detector effects); C0 is the
photon energy, CC is the Compton edge [32]

15
particles as kinetic energy. Both of these particles will deposit their kinetic energy within the
detector medium, which produces pulses with height equal to T=E0 – 1.022 MeV. The produced
positron will slow down in a time frame less than that required for pulse formation within the
detector, and then will combine with an atomic electron
and annihilate, emitting two gammas
with energies equal to 511 keV. After this happens, either the resultant annihilation photon
energies will deposit within the detector, creating a pulse with height proportional to that of the
incident photon, the annihilation photons will escape, creating a pulse with height proportional to
that of the incident photon less 1.022 MeV, or one photon will escape, creating a pulse with
height proportional to that of the incident photon less 511 keV. The final case with pair
production occurs when the interaction takes place on or near the surface of the detector, and
only one annihilation photon penetrates into the detector, which causes a peak to form
proportional to the incident 511 keV photon. This peak will also be present if the radioactive
source is a positron emitter. Therefore, for a monoenergetic source with energy greater than
1.022 MeV, there will be visible peaks in the spectrum at: The full energy peak, E, the Compton
edge, E-E/(1+2E/mc2), the backscatter peak E/(1+2E/mc2), the single escape energy E-0.511
MeV, and the double escape energy E-1.022 MeV [32].
The events measured by a detecting medium can be compiled into a single resource that
can provide information related to the characteristic of the radioisotopes contained within a
material. The study of the energy distribution of the energy events occurring in a detector is
known as gamma ray spectroscopy.

16
2.6 Gamma Spectroscopy
One of the key pieces of equipment for gamma spectroscopy is a multichannel analyzer,
which stores multiple pulses from the detector and displays them as a function of channel
number, which is generally proportional to the energy of the particle that enters the detector. Part
of the multichannel analyzer is the analog-to-digital converter (ADC), which assesses the pulse
height, and provides a binary output proportional to the input amplitude. The ADC sorts the
pulses according to voltage, which is proportional to the energy deposited within the detector.
These pulses are then compiled into an energy spectrum at the end of the counting period and
displayed. Due to the ADC processing one pulse at a time, all other pulses that may occur
simultaneously or a short time after are ignored, creating a dead time, which can increase
uncertainty within the final spectrum. To limit this, discrimination levels are set to ignore pulses
of energies either higher or lower than the range desired for the spectrum. An important
characteristic of the detector in question is the energy resolution, which is characterized by the
pulse-height distribution width for multiple radiation events of the same energy. These pulses
have a finite width and can vary based off of statistical fluctuations within the detector,
electronic noise from the detector or pulse processing circuitry, or incomplete charge collection
[14, 32]. Having good energy resolution within a detector system is paramount for spectra that
contain sources of multiple energies such that a finer resolution will allow for discretization
between radiation events of similar energies. See Figure 8 for a sample pulse height distribution
for a monoenergetic source, Figure 9 for a measured pulse height spectrum including detector
effects, and Figure 10 for a multi-energetic source created by irradiation of a material of
unknown composition.

17
Figure 8. A sample pulse height distribution for a monoenergetic radiation source [14]
Figure 9. Measured pulse height spectrum with statistical detector effects (imperfect energy
resolution). The dashed line represents the theoretical spectrum recorded in the absence of a
Compton continuum [14].
Figure 10. An example spectrum of a coal sample irradiated within a reactor, recorded with a
Ge detector [14].

18
2.6.1 Nuclear Instrumentation Modules and Pulse Processing
The pulse created by a single event within the semiconductor detector is very weak, on
the order of millivolts, and therefore must be processed into a more measurable event in order to
be utilized for the creation of a spectrum. This is accomplished through shaping and
amplification. Pulse shaping occurs within a preamplifier, while an amplifier takes this shaped
pulse and amplifies the voltage to a measurable level, on the order of volts. Increasing the
resolution and voltage of the measured output allows for the pulse to be used by a multichannel
analyzer for gamma spectroscopy. See Figure 11 for an example spectrum output from a
multichannel analyzer.
Figure 11. Sample spectrum output for a multichannel analyzer [32]
2.6.2 Listmode Collection and Data Parsing
For the research conducted within, the high purity germanium detector setup was
connected to a DSPEC Pro digital spectrometer, which is capable of operating in List Mode,
which collects time-dependent count data, including energy channel and detection time, and
streaming this information to a machine language file. ListPRO, a program developed by
ORTEC for use with digital spectrometers, works in conjunction with the Listmode data

19
collection to store the incoming data and compiling it into a large data file which will contain
each detected count, its corresponding channel within the spectrometer, the running time at
which the event occurred, both real and live time, which is time the detector is collecting, i.e. real
time minus dead time.
After the listmode collection is complete, the output data file can be processed with the
ListDump program, which converts the file into a text file showing a list of sequential pulse
events measured during collection. At the beginning of each line, the file specifies the type of
event, with ADC indicating that line contains information about a detector pulse event. The line
will contain the channel number at which the event occurred.
Due to the significant size of the data files, compiling all measured events into one
readable spectrum is most efficiently done by parsing the processed text file to remove unwanted
information. A parsing module, created using Python3, was developed for this experiment, which
reads each line of the listmode text file, searching for ADC events, and recording the channel
number at which the event occurred. The module creates a histogram with dimensions equal to
the number of channels within the spectrometer, and increments each element of the histogram
up in accordance to the number of ADC events recorded at the given channel. This histogram
can then be used accordingly, to create the spectrum recorded by the Listmode collection. The
module script can be found in Appendix A. The usage of this program allows for more
information to be collected and analyzed than is possible with an integrated counting approach.
2.7 Nuclear Forensics, Safeguards, and Non-Proliferation
One particularly useful application of gamma spectroscopy is in the area of nuclear
forensics, which is the process of intercepting material, characterizing the material, and
interpreting the characterization to suggest possible origin of nuclear materials. With current

20
data, and knowledge that specific radioisotopes can only be generated through fission of heavier
nuclei, by capturing a gamma-ray spectrum of an unknown material, the ratio of peaks within the
spectrum can be measured, and compared to known fission yield ratios for the radioisotopes
which are emitting those gamma rays in order to determine which fissile material likely produced
the radioisotopes. Since the implementation of the Nuclear Nonproliferation Treaty in 1968, the
United Nations and the International Atomic Energy Agency (IAEA) have worked towards
creating and encouraging an environment in which a controlling voice regarding the application
of nuclear technology remains regulated in a manner such that illicit nuclear programs are
discouraged and penalized accordingly. In 1994, the United Nations began work at the
Conference of Disarmament, which aimed to create a comprehensive nuclear-test-ban treaty.
The goal of this treaty was to discourage the proliferation of nuclear weapons and special nuclear
material on a global scale by outlawing the production and testing of nuclear weapons around the
world. Currently, 168 states have ratified the treaty, with 17 more signing but not ratifying [5,
11]. The method by which materials are characterized is referred to as assay, which itself can be
categorized as destructive or non-destructive [24].
2.7.1 Assay and Interrogation
Gamma rays from fission products can vary depending on the composition of the original
material. When gamma ray spectroscopy is performed on a fission product, or some other
unknown nuclear material, the characteristics of the spectrum can be used to determine the
original composition of the material based off the abundance of the various fission products,
using known fission yields for all fissile materials. Using the ratios of the various gamma ray line
intensities, which isotope that underwent fission can be determined [2, 8, 16]. This process can
be performed either via destructive assay or non-destructive assay, which does not involve

21
chemically or physically altering the source material. Non-destructive assay techniques include
the use of passive and active interrogation, which utilize the naturally emitted gamma rays or
externally induced gamma rays to achieve the necessary conditions for collection of a gamma ray
spectrum. Previous studies show that active interrogation, focusing on the utilization of delayed
gamma rays, allows for the measuring and characterization of fissionable isotopes from a source
material. This process is useful in the application of investigating seized material of unknown
composition, from unknown sources, or verification of specified compositions of materials [17,
18, 22]. High energy gamma rays emitted by short lived fission products are more beneficial for
use in special nuclear material applications due to their high production, also known as
cumulative fission yield, from the decaying byproducts and the ability to use these signature
characteristics to determine the initial fissionable isotope. [8]
2.7.2 Simulation in the Realm of Nuclear Forensics.
Simulation programs such as MCNP and SCALE/ORIGEN present a method for
performing complimentary analyses to performing physical interrogation and characterization of
special nuclear material, such that using these programs can, once the source material is initially
characterized, provide repeatable results ideally consistent with measurement. However, these
simulation programs use libraries of evaluated nuclear data that do not contain all pertinent
information regarding the interactions and characteristic decay which occurs within the physical
material. As an example, previous work performed by Sanchez et. al. utilized SCALE 6
(TRITON) simulations to compare fission product line emissions to measurements of various
special nuclear materials which have been irradiated for a short time to highlight inconsistencies
between the simulated results and experimental results [29]. In order to assist in encouraging
more comprehensive data libraries being created for this purpose, a set of experiments and
22
measurements were performed at Oregon State University utilizing a TRIGA Mk. II reactor and
Monte Carlo-based codes to highlight discrepancies between published data and measured data.
2.8 MCNP
Monte Carlo N-Particle Transport (MCNP), developed by Los Alamos National
Laboratory, is a general purpose, time-dependent, continuous-energy, generalized-geometry
Monte Carlo radiation transport code. This code has many applications, and is used around the
world for aiding reactor design, nuclear criticality safety, transmutation and burnup, and material
detection. The code features methods for creating general sources, criticality sources, and
surface sources, as well as an extensive collection of cross-section data. This cross-section data,
when combined with a working input deck that features criticality code and burnup information,
can be used to simulate burnup experiments for scenarios where access to a research reactor is
limited. Typically, point-wise cross section data are used; for neutrons, all reactions are
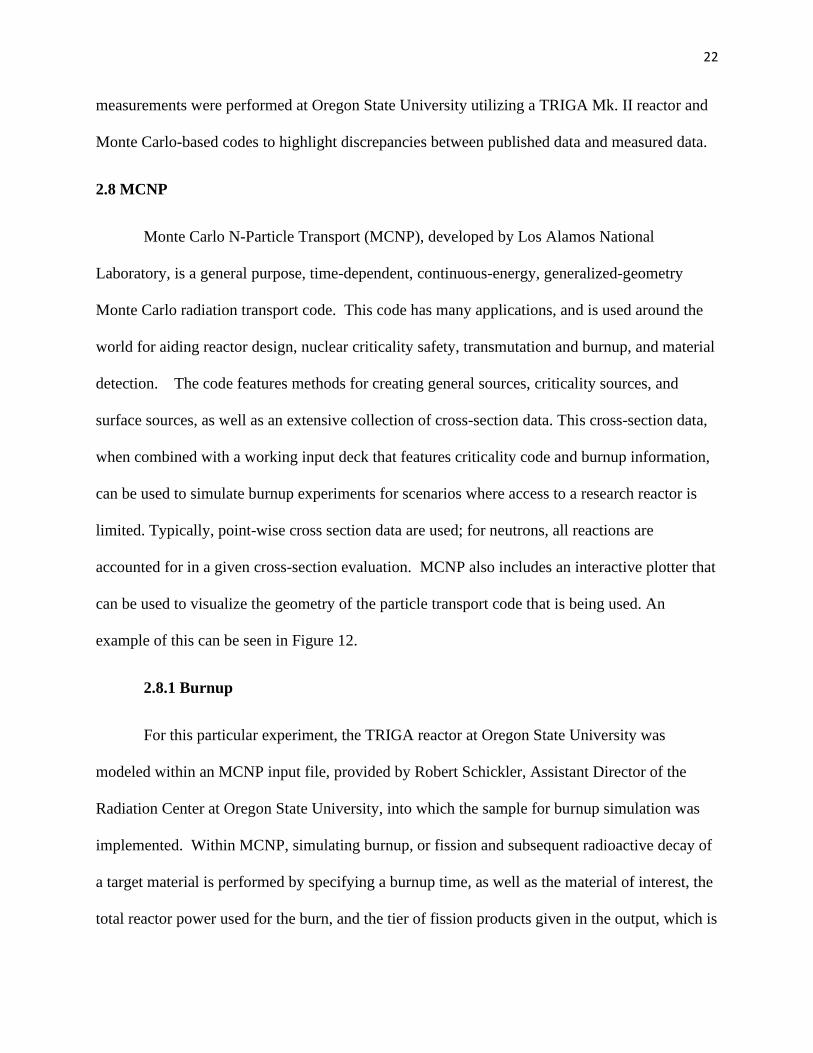
accounted for in a given cross-section evaluation. MCNP also includes an interactive plotter that
can be used to visualize the geometry of the particle transport code that is being used. An
example of this can be seen in Figure 12.
2.8.1 Burnup
For this particular experiment, the TRIGA reactor at Oregon State University was
modeled within an MCNP input file, provided by Robert Schickler, Assistant Director of the
Radiation Center at Oregon State University, into which the sample for burnup simulation was
implemented. Within MCNP, simulating burnup, or fission and subsequent radioactive decay of
a target material is performed by specifying a burnup time, as well as the material of interest, the
total reactor power used for the burn, and the tier of fission products given in the output, which is

23
simply the list of possible fission products and associated neutron cross section data available
within the MCNP data libraries. The specific burnup simulation was specified to use the cross-
section data comprising fission products in the ENDF/B-VII.0 data libraries that have
CINDER90 yield information, which contains decay, fission yield, and 63-group cross-section
data not calculated by MCNP6 [18].
Figure 12: an overhead view of the MCNP geometry of the TRIGA reactor at Oregon State
University. The cell highlighted in grey indicates the location of the sample within the
pneumatic rabbit system.
2.8.2 Evaluated Nuclear Data Files

24
Evaluated Nuclear Data Files (ENDF) is a library that groups relevant experimental data
for nuclear physics and nuclear applications. It is released by the Cross Section Evaluation
Working Group of the United States, and includes physical quantities such as scattering and
reaction cross sections, and decay parameters, and can involve neutrons, protons, and virtually
all other nuclear isotopes that could be handled in a laboratory. This system relies on the process
of analyzing experimentally measured physical parameters (such as cross sections) and
combining them with predictions derived from nuclear model calculations in order to attempt to
extract the true values of such parameters. The ENDF/B libraries are maintained at the National
Nuclear Data Center (NNDC) and are revised or replaced only after extensive review and testing,
permitting them to be used as standard reference data [10, 18].
2.8.3 Point Detection in MCNP
Within MCNP, pulse-height tally capabilities are included such that a point detector
geometry can be recreated without the need of any specialized equipment in a laboratory setting;
allowing the creation of a source and target geometry, and specification of a source’s
composition, characteristic decay energy, and gamma probabilities. MCNP also includes the
necessary physical data to cause specified materials to behave as a point detector, replicating the
behavior of a semiconductor detector within the program itself. By specifying the source
characteristics and recreating the real-world geometry, a comparable gamma ray spectrum can be
created using only the pulse-height tally function of MCNP. In order to reflect the real-world
resolution of an HPGe detector, the input deck is given capability to discretize the energy bins
similar to how a multichannel analyzer and analog-to-digital converter would behave, as well as
gaussian energy broadening cards through with the statistical uncertainty of a physical detector is
introduced into the simulation. By combining the output of the Monte Carlo simulation with the

25
output of the Listmode data collection, a comparison spectrum can be created, which will
highlight the similarities and differences in the post-irradiation materials created by the measured
and modeled results.
Utilizing the capability of MCNP to replicate sample irradiation and gamma-ray
detection, an experiment can be recreated entirely within the environment of MCNP such that the
results of each can be directly compared. Examples of portions of the input code for each of the
two MCNP decks are shown in Appendix B.
3 Materials and Methods
In December 2019, experiments were performed using the TRIGA reactor at Oregon
State University, utilizing the pneumatic rabbit system to irradiate samples of natural uranium.
The irradiated samples were then analyzed using an ORTEC HPGe detector, Model GEM
25185-P (Serial No. 31-TP10710A), and a Digital Spectrometer, Model DSPEC Pro (Serial No.
199) to create a gamma-ray spectrum in order to distinguish the fission products present. These
fission products were compared to simulated samples created in MCNP6.2.
This section details the materials used for the experiments, including the target samples,
the TRIGA reactor, the rabbit system, the HPGe detector system, the list-mode data collector,
and the radiation transport code used for simulations.
3.1 Target Description
The target material for this experiment consisted of natural uranium, containing fissile
uranium-235 and fissionable uranium-238 at their natural abundances of ~0.711% and 99.284%,
respectively (the remaining 0.005% is accounted for by uranium-234, which has a relatively low
probability of fission for capture of thermal neutrons). These two isotopes were chosen due to

26
the abundance of data available for nuclear reactions involving them, specifically their fission-
product distributions, as well as their significance as a concern for proliferation. These samples
consist of the natural uranium in a powder form, weighing 5mg each, contained within a small
plastic sealable container for transport using the rabbit system. These samples were irradiated for
7 seconds within the TRIGA Mk. II reactor and then immediately transferred to the HPGe
detector setup for spectral analysis. This amount and irradiation time were chosen due to the
resultant gamma activity after irradiation needing to be sufficient enough to be measured by the
detector, but not active enough to flood the detector with activity, which would increase the dead
time of the detector and result in a less accurate reflection of the material characteristics.
3.2 TRIGA Reactor
A TRIGA reactor is a class of research reactor that is designed for research and testing in
both an educational as well as commercial application, as well as non-destructive testing and
isotope production. This reactor type is a popular choice for research reactors at universities due
to its inherent, passive safety features, including its metallic uranium zirconium hydride fuel,
which decreases in reactivity as reactor temperature increases, and therefore is limited in its
power output. These reactors use low-enriched uranium fuel (>20% U-235) and generally
operate in the range of 0.1 to 16 megawatts. The reactor at Oregon State University is a TRIGA
Mark II reactor, rated at 1.1 MWth, with an average in-core neutron flux of 1013 n/cm2-s [1, 12,
31]. One crucial component of the reactor for this project is the pneumatic rabbit system, used
for transferring samples directly into the reactor core for thermal neutron irradiation [1, 31].
3.2.1 The Specimen Capsule (Rabbit) System

27
The natural uranium samples are contained within small polyethylene capsules, designed
to be small enough to travel through a pneumatic tube system and into the irradiation channel
within the TRIGA reactor core. Figure 13 shows an example of the specimen capsule used. The
flux within the Rabbit column inside the reactor core is predominantly thermal, approximately
1 𝑥 1012𝑛 − 𝑐𝑚−2𝑠−1 at 5 𝑥 10−7 eV, dropping to 1 𝑥 1011𝑛 − 𝑐𝑚−2𝑠−1up through the thermal
and epithermal range, and significantly dropping off at fast neutron energies (>1 MeV) [30].
Figure 13. Rabbit specimen capsule [1]
3.3 Experiment Setup
The uranium samples were transported into the reactor core for irradiation via the
pneumatic rabbit system. The measurement system was contained in the same room in which the
rabbit system was accessed, in order to ensure minimal decay between removal of the samples
from the reactor and the beginning of the data collection with the detector. The detector
assembly itself was shielded using lead bricks in order to minimize background radiation
interfering with the collection of sample data. Connected to the detector assembly is the gamma-
ray spectrometer.

28
The rabbit access port was used to send the samples into the reactor core, where they
remained for 7 seconds, and then were removed from the rabbit system and placed on the face of
the detector. The list-mode collector was run for the duration of the irradiation, and then
continued collecting data from the sample for 10 minutes post-irradiation.
3.4 ORTEC GEM P-Type HPGe Detector
A cryogenically cooled ORTEC GEM Series Coaxial HPGe Detector was placed within
the lead brick assembly for the collection of the delayed gamma rays from the fission products
contained within the samples. This detector featured a relative efficiency of 28% and a FWHM
of 1.79 keV. The detector was kept cool via a cryostat containing liquid nitrogen. A diagram of
the detector setup is shown in Figure 14, with a typical coaxial detector diagram and electrode
configurations for coaxial detectors shown in Figure 15.
Figure 14. Block diagram of the detector and pulse-processing chain.
High-purity
germanium
detector
Pre-amplifier
Amplifier Multi-channel analyzer
Ortec DSPEC
gamma
spectrometer ListPro/Listdump High voltage
power source

29
Figure 15. a) three common geometries of coaxial detectors and b) electrode configurations of
p- and n-type detectors [14].
3.5 List-Mode data collection
The detector data was collected and recorded using an ORTEC DSPEC Pro Digital
Gamma-Ray Spectrometer in list mode. For this configuration, the detectable events are sent to
the computer as a pulse-height value along with a time stamp and collected in a text output file,
as opposed to being compiled directly using a Multichannel Analyzer. Using this collection
mode, along with specifically designed parsing software, the data collected can be compiled into
a spectrum based off a specific time window. For this experiment, the entire counting duration
was considered for analysis due to the desire to compare isotopics to currently available nuclear
data, as well as hand calculations using currently available nuclear data.

30

31
4 Results and Analysis
Two natural uranium samples were irradiated and compared to MCNP simulations in
order to identify the differences between expected fission yields for fission products given by
ENDF/B-VIII.0 libraries in order to determine the viability of MCNP burnup calculations for
generating accurate gamma ray spectra for short-lived fission products.
4.1 MCNP Isotope Catalogs
The first component of the outcome of this work was the results of a simulated short
burnup of naturally enriched uranium using MCNP. The MCNP simulation output gives an
isotope inventory of all component isotopes, divided into actinides and non-actinides. The non-
actinide and actinide isotope inventories are shown in Tables 1 and 2, respectively. The given
MCNP-generated masses of the resultant non-actinides were compared to calculated values using
fission yields taken from the ENDF/B-VII.0 library. A detailed calculation can be seen in Table
3 using Equation 1 as described in Chapter 2. A comprehensive comparison of the MCNP-
produced fission product masses compared to the expected mass based on available fission yield
data is shown in Table 4.
These isotope catalogs were then used to create the source data that was used as the input
for the MCNP-generated γ-ray spectrum. Decay schemes taken from the National Nuclear Data
Center (NNDC) provided the decay energy and branching ratios for each produced isotope. Non-
radioactive isotopes that were generated were ignored from the source composition in order to
eliminate unnecessary processing by MCNP. The spectra were simulated for 1010 particle
histories, and gave an output of relative counts at a given energy bin. The energy calibration and
conversion for the ORTEC DSPEC Pro Digital Gamma-Ray Spectrometer were used to

32
determine the maximum energy value within the spectrum, as well as the number of energy bins
that the spectrum was subdivided into. This energy calibration is shown in Appendix C.
Table 1: Post burnup non-actinide inventory
zaid isotope mass activity sp. act. atom den. atom fr. mass fr.
(gm) (Ci) (Ci/gm) (a/b-cm)
36086 Kr-86 2.49E-11 0.00E+00 0.00E+00 8.88E-12 1.84E-10 6.63E-11
38090 Sr-90 4.75E-11 6.71E-09 1.41E+02 1.62E-11 3.35E-10 1.27E-10
40095 Zr-95 2.61E-11 5.62E-07 2.15E+04 8.45E-12 1.75E-10 6.97E-11
40096 Zr-96 9.87E-11 0.00E+00 0.00E+00 3.16E-11 6.53E-10 2.63E-10
42098 Mo-98 8.54E-11 0.00E+00 0.00E+00 2.68E-11 5.54E-10 2.28E-10
42099 Mo-99 8.36E-11 4.02E-05 4.81E+05 2.59E-11 5.37E-10 2.23E-10
42100 Mo-100 1.03E-10 0.00E+00 0.00E+00 3.16E-11 6.53E-10 2.74E-10
44102 Ru-102 1.83E-11 0.00E+00 0.00E+00 5.52E-12 1.14E-10 4.89E-11
44103 Ru-103 3.92E-11 1.27E-06 3.23E+04 1.17E-11 2.42E-10 1.05E-10
52132 Te-132 6.70E-11 2.04E-05 3.04E+05 1.56E-11 3.23E-10 1.79E-10
53135 I-135 1.37E-10 4.83E-04 3.54E+06 3.11E-11 6.43E-10 3.65E-10
54136 Xe-136 1.26E-10 0.00E+00 0.00E+00 2.84E-11 5.87E-10 3.35E-10
55137 Cs-137 7.28E-11 6.34E-09 8.70E+01 1.63E-11 3.38E-10 1.94E-10
56140 Ba-140 1.20E-10 8.81E-06 7.32E+04 2.64E-11 5.46E-10 3.21E-10
58143 Ce-143 2.79E-11 1.85E-05 6.65E+05 5.99E-12 1.24E-10 7.44E-11
58144 Ce-144 1.14E-10 3.64E-07 3.19E+03 2.43E-11 5.04E-10 3.05E-10
60148 Nd-148 2.38E-11 0.00E+00 0.00E+00 4.93E-12 1.02E-10 6.34E-11
totals
1.22E-09 5.74E-04 4.72E+05 3.20E-10 6.61E-09 3.24E-09
Table 2: Post burnup actinide inventory
zaid isotope mass activity spec.act. atom den atom fr. mass fr.
(gm) (Ci) (Ci/gm) (a/b-cm)
92234 U-234 1.84E-05 1.15E-07 6.22E-03 2.42E-06 5.00E-05 4.92E-05
92235 U-235 2.63E-03 5.69E-09 2.16E-06 3.44E-04 7.11E-03 7.02E-03
92236 U-236 6.78E-10 4.38E-14 6.47E-05 8.81E-11 1.82E-09 1.81E-09
92238 U-238 3.72E-01 1.25E-07 3.36E-07 4.80E-02 9.93E-01 9.93E-01
92239 U-239 4.89E-09 1.64E-01 3.35E+07 6.28E-10 1.30E-08 1.31E-08
93239 Np-239 7.58E-10 1.76E-04 2.32E+05 9.72E-11 2.01E-09 2.02E-09
totals
3.75E-01 1.64E-01 4.38E-01 4.83E-02 1.00E+00 1.00E+00

33
Table 3: Calculation of expected molybdenum-99 mass
# U-235 flux cross section (barns)
Reaction rate
fission yield of Mo-99
production rate
Expected Number
mass (g)
6.91942E+18 1.57E+13 585.1 6.35E+10 6.13% 3.90E+09 2.34E+12 3.84E-10
Table 4: Expected mass of relatively high-yield fission products
Isotope Yield % Expected number produced
(#)
expected mass (g)
MCNP result (g)
Difference
Sr-90 5.73% 2.18527E+12 3.59877E-10 4.747E-11 87% Zr-95 6.50% 2.47893E+12 4.30917E-10 2.614E-11 94%
Mo-99 6.13% 2.33858E+12 4.23637E-10 8.362E-11 80% Ru-103 3.10% 1.1834E+12 2.23036E-10 3.919E-11 82% Te-132 4.28% 1.63075E+12 3.93884E-10 6.702E-11 83% I-135 6.39% 2.43698E+12 6.01992E-10 1.367E-10 77%
Cs-137 6.22% 2.37253E+12 5.94754E-10 7.284E-11 88% Ba-140 6.31% 2.40799E+12 6.16863E-10 1.204E-10 80% Ce-144 5.47% 2.08764E+12 5.50077E-10 1.142E-10 79%

34
4.2 Gamma Ray Spectra
The second component of the outcome of this work is gamma ray spectra collected by the
high purity germanium detector and the ORTED DSPEC Pro Digital Gamma-Ray Spectrometer.
These collected spectra were used to i) provide a visual representation of the discrepancies
between MCNP generated spectra and list-mode generated spectra and ii) provide an example of
the limitations of using MCNP to generate spectra for short burnup times in small sample sizes.
The output of an MCNP generated spectra gives peak heights in units of relative counts, which is
a measure of the fraction of the total number of particle histories simulated that resulted in the
measurement of a peak at a specified energy bin. In order to compare the Listmode output, which
gives total counts at a given energy bin, to the MCNP output, the total number of detected events
in each bin was divided by the total number of counts recorded in the complete spectrum, giving
a fractional relative count value. The two collected spectra can be seen in Figure 16 below, both
compared to the MCNP generated spectrum. The y-axis of these spectra gives the relative counts
at the given energy.

35
Figure 16: MCNP-generated gamma-ray spectrum compared to experimental gamma-ray
spectra.
The largest peak observed on both spectra occurs at 74.6 keV, which corresponds to the
gamma decay of U-239. Due to the relatively high cross section of 2.683 barns for thermal
neutron absorption within U-238, and the short half-life of the byproduct U-239 of 23 minutes,
and a branching ratio of 53.2%, this isotope’s abundance can easily be seen within the graphs
themselves. This high abundance, however prevents other gamma peaks from being visible on

36
the same order of magnitude, therefore in order to observe the other peaks within the spectra,
Figure 17 plots the relative counts on a semi-log plot.
Figure 17: MCNP and listmode spectra, semilog plot

37
Figures 18 and 19 show the comparison spectra on a linear and semi-log plot,
respectively, for each of the list-mode collections, with the prominent U-239 peak removed from
the MCNP input, in order to see the relative height of other significant peaks.
Figure 18: Comparison spectra, no U-239 peak

38
Figure 19: Comparison spectra, no U-239 peak, semilog plot
The most prominent peak in the MCNP graph after removing the dominant U-239 peak
corresponds to the 49.6 keV gamma-decay of U-238, which is not as prominent within the
listmode spectrum.
4.3 Discussion

39
A significant issue encountered during the MCNP calculations, first visible in the isotope
inventories, is the omission of isotopes post-burnup with atom fractions less than 1.0x10⁻¹⁰
within a given material, which is the limit found in the burnup function of MCNP itself. In order
to ensure that any isotopes generated by the thermal fission of uranium-235 were listed in the
burnup output, the burnup time, as well as the initial mass of natural uranium, had to be
increased compared to the experimental irradiation time and mass. The initial conditions for
which the sample was specified within MCNP were not of sufficient mass or burnup time to
generate atom fractions higher than this threshold for any single non-actinide. In order to
compensate for this, the burnup time within MCNP was increased to 10 minutes, compared to
the 7 seconds of irradiation time within the TRIGA reactor, and the simulated mass was
increased from 5 milligrams to 375 milligrams. As can be seen in Figures 17 and 18, even with
modification to the burnup mass and duration in order to generate a list of isotopes with atom
fractions greater than 10-10, the amount of U-239 generated within this spectrum, along with its
relatively high gamma branching ratio, is large enough to dominate the spectrum such that other
characteristic gamma energies attributable to the fission products generated by the burnup
calculation are less likely to appear within the final spectrum. Even after removing the U-239
peak from the spectrum, the number of relative counts at higher energies in the spectrum are on
the order of one count out of every billion decay events, compared to the Listmode spectrum
relative counts at the same energies being three to four orders of magnitude greater. Therefore,
adjusting the burnup function to result in higher relative fractions of fission products would also
require a significant number of particle histories simulated for the gamma-ray spectrum, which
increases total computation time for the spectrum to be produced. Since the computing time is
several times larger than the real-world time needed to produce a gamma spectrum with better

40
resolution and higher confidence in the number of counts recorded for a given energy bin, this
manipulation of MCNP only serves to limit the confidence in the accuracy of the simulated
spectrum.
It is hypothesized that the reasoning behind this behavior within MCNP is the result of
the more customary application of the burnup function within MCNP itself, where the mass of
uranium burned is on the order of metric tons as opposed to milligrams, and a burnup time of
days or years is used as opposed to seconds or minutes. Within these applications, the larger
concern for fission byproducts lies with the longer lived, high-yield isotopes that are the most
difficult to deal with from a long-term disposal or nonproliferation perspective.
Along with this issue, the MCNP-generated spectra are also seen to have a cut-off at 10-10
relative counts, although this is more likely due to the total number of particle histories used for
each MCNP calculation. Additionally, it can be seen that with the Listmode spectrum, there is a
prominent peak at an energy of 1427 keV which is correspondent to the gamma emitted by I-
135m as it transitions to the ground state after Te-135 undergoes beta decay with a half-life of 25
minutes. However, within the decay schemes for the isotopes generated by MCNP, no such
decay energy was characteristic of any of the produced isotopes. In addition to this, within the
NNDC database for U-235 thermal fission yields, the yield value for I-135 is 6.39%, but no yield
value for Te-135 is published [23]. However, due to the calibration process for the detector,
energies above the calibration range contain uncertainty that might account for peak energies
appearing at inaccurate locations within the spectrum.
Several short-lived fission products (half-lives on the order of seconds or less) exist that
contain complex decay schemes that have yet to be studied in-depth in such a manner that can
generate comprehensive transition energies and gamma emission probabilities. Since these

41
products have little practical application in a laboratory setting, and are not able to be repurposed
in a significantly meaningful manner, there is not a high demand for these decay schemes to be
studied and understood in-depth. An estimation for the proportion of undetected gamma
emissions within background measurements was approximately 20% according to Hardy et. al.
Therefore, in order to provide mean beta and gamma energies for these short-lived fission
products with incomplete or undetermined gamma-ray spectra, theoretical models of the mean
beta and gamma energies, as well as half-lives for the isotopes in question are produced to fill the
gap in current knowledge [9, 20].
4.4 MCNP Libraries
For these measurements, MCNP libraries compiled from ENDF/B-VII and decay
schemes taken from NuDat 2.8 were used to generate the spectra. The discrepancies seen within
the spectra themselves are likely caused due to the unknown yields of shorter-lived fission
products, due to a lack of available data, as well as the cutoff threshold within MCNP burnup
functionalities. A function within MCNP to provide more in-depth decay data for burnup-
generated isotope data, or an ability to force MCNP to display all isotopes regardless of
abundance within a specific material that was burned would allow for a more accurate
representation of the post-irradiation material.
4.5 Accuracy to Calculated Values
While certain high-yield fission products were present in the post-burnup MCNP isotope
inventory, such as Sr-90, Cs-137, and I-135, their calculated yields did not match within
reasonable error the expected values given by ENDF fission yield data. Additionally, the
presence of isotopes with either very low fission yield, or no known yield value compared to

42
other more prominent fission products is worth noting. The presence of Kr-86 in the output
library, despite it having no published fission yield value [13], indicates that either Kr-85 was
significantly generated by the burnup calculations, and then underwent neutron capture to
convert to Kr-86, or there is a calculated fission yield used within the library itself. The first case
seems unlikely, due to the fission yield for Kr-85 being less than 1%, and other isotopes with
higher fission yields not being present in the inventory.

43
5 Conclusion
Experimental fission byproducts of two natural uranium samples were compared to
MCNP generated isotope inventories and gamma ray spectra in order to: i) observe how MCNP
burnup calculations handle short-lived, low-yield fission byproducts, ii) highlight discrepancies
between available evaluated nuclear data files and observed experimental measurements and
suggest possible sources for these discrepancies, and iii) suggest methods by which MCNP could
become a more viable option for replication characterization of material for nuclear forensic
applications.
The MCNP simulation was manipulated in order to generate an observable fission
byproduct inventory; limitations exist within MCNP which limit given outputs for burnup
calculations based on the measured atomic fractions of the isotopes. These manipulations
allowed a small inventory to be produced, however the expected amounts of isotopes produced
did not reflect published yield values for the shorter-lived isotopes. Once the isotope inventory
was simulated again to produce a gamma spectrum, the generated spectrum did not match up
with the prominent peaks within the listmode generated spectra, with the exception of a peak
characteristic of U-239. It was hypothesized that the extended simulation time in order to
generate a sufficient isotope inventory also caused the specific activity of U-239 within the
byproducts to significantly overwhelm the rest of the resulting inventory.
6 Future Work
While initial results show large discrepancies between experimental results and simulated
data, further research in to the fission yield of short-lived, lower yield isotopes would provide
valuable data that can be used not only for simulated characterization of special nuclear material,

44
but to limit the access to the material itself, allowing for an extra safety measure to secure
material after seizure from an unlicensed source. Other application of this new data would
include the verification of existing data for more thoroughly studied fission byproducts, and
clarification and resolution of current gaps in data for which error within simulation can be
attributed to. Within MCNP specifically, a secondary mode or program in which discrimination
levels for compositional output can be set by the user would provide especially useful for the
study of samples and materials of relatively low mass and radioactivity without needing to
acquire the material in the physical world. As it stands currently, for large samples, utilizing
burnup code within MCNP for recreation of physical experiments can be accepted as potential
results, but must be considered to not contain the full set of relevant data related to the material
itself. It is also possible that changing the geometry of the sample in order to avoid self-shielding
might result in a more accurate recreation of the sample burnup within MCNP.
Williford et. al. discuss utilizing Listmode collection’s function of timestamping each
counted event and developed a parsing method to investigate the changes in the spectrum as the
samples decay post-irradiation [33]. Using this method to analyze the changes in the spectrum
would allow for a better picture of the shorter-lived fission products, and how the sample
behaves post irradiation.

45
Bibliography
1. Anderson, T., Dodd, B., Ringe, J., & Menn, S. (n.d.). Oregon State TRIGA Reactor
Training Manual.
2. Beddingfield, D.H, and F.E Cecil. “Identification of Fissile Materials from Fission
Product Gamma-Ray Spectra.” Nuclear Instruments and Methods in Physics Research
Section A: Accelerators, Spectrometers, Detectors and Associated Equipment, North-
Holland, 25 Nov. 1998, www.sciencedirect.com/science/article/pii/S0168900298007815
3. Bohr, Niels, and John Archibald Wheeler. “The Mechanism of Nuclear Fission.” Physical
Review, vol. 56, no. 5, 1 Sept. 1939, pp. 426–450., doi:10.1103/physrev.56.426.
4. Byrne, J. Neutrons, Nuclei, and Matter: an Exploration of the Physics of Slow Neutrons.
Dover Publications, 2011.
5. “Comprehensive Nuclear-Test-Ban Treaty (CTBT) – UNODA.” United Nations, United
Nations, www.un.org/disarmament/wmd/nuclear/ctbt/.
6. ENDF: Evaluated Nuclear Data File, Nuclear Data Services - International Atomic
Energy Agency, 3 Mar. 2020, www-nds.iaea.org/exfor/endf.htm.
7. Foley, Ari A.R. 2019. Short-Lived Photofission Product Yields and Analytical Methods
for Nuclear Forensic Application. Oregon State University
8. Gozani, Tsahi. Active Nondestructive Assay of Nuclear Materials: Principles and
Applications. U.S. Nuclear Regulatory Comission, 1981.
9. Hardy, J. C., Carraz, L. C., Jonson, B. and Hansen, P. G. (1977) The essential decay of
pandemonium: a demonstration of errors in complex beta-decay schemes, Phys. Letts.,
71B(2), 307-310.

46
10. Herman, M., and A. Trkov, editors. ENDF-6 Formats Manual, National Nuclear Data
Center.
11. IAEA (1972). INFCIRC/153 (Corrected), The Structure and Content of Agreements
Between the Agency and States Required in Connection with the Treaty on the Non-
Proliferation of Nuclear Weapons, International Atomic Energy Agency
12. IAEA. “Technical Data - RRDB.” Research Reactor Database, International Atomic
Energy Agency, nucleus.iaea.org/RRDB/RR/TechnicalData.aspx?RId=484.
13. Jonsson, T. “Isotopic Composition of Fission Gases in LWR Fuel.” U.S. Office of
Scientific and Technical Information, Hot Cell Laboratory, Nykoping, Sweden,
www.osti.gov/etdeweb/servlets/purl/20116609.
14. Knoll, Glenn Frederick. Radiation Detection and Measurement. 3rd ed., John Wiley &
Sons, 2012.
15. Krane, Kenneth S. Introductory Nuclear Physics. John Wiley and Sons, 1988.
16. Ludewigt, et al. “Delayed Gamma-Ray Spectroscopy for Non-Destructive Assay of
Nuclear Materials.” Delayed Gamma-Ray Spectroscopy for Non-Destructive Assay of
Nuclear Materials (Technical Report) | OSTI.GOV, 1 June 2015,
www.osti.gov/biblio/1236076.
17. Miller, T. M., B. W. Patton, B. R. Grogan, J. J. Henkel, B. D. Murphy, J. O. Johnson, and
J. T. Mihalczo (2013). Investigations of active interrogation techniques to detect special
nuclear material in maritime environments: Stando↵ interrogation of small- and medium-
sized cargo ships. Nuclear Instruments and Methods in Physics Research, Section B:
Beam Interactions with Materials and Atoms 316, 94–104.

47
18. Mozin, V. (2011). Delayed Gamma-Ray Assay for Nuclear Safeguards (Unpublished
doctoral dissertation). University of California Berkeley.
19. Nave, R. Nuclear Fission Fragments, Hyperphysics, hyperphysics.phy-
astr.gsu.edu/hbase/NucEne/fisfrag.html.
20. Nichols, A. (2000, August). Nuclear Data Requirements for Decay Heat Calculations.
21. Nichols, A. L., et al. Aug. 2008. Handbook of Nuclear Data for Safeguards, International
Nuclear Data Committee.
22. Norman, E. B., S. G. Prussin, R.-m. Larimer, H. Shugart, E. Browne, A. R. Smith, R. J.
Mcdonald, H. Nitsche, P. Gupta, M. I. Frank, and T. B. Gosnell (2004). Signa- tures of
fissile materials: high-energy g rays following fission. Nuclear Instruments and Methods
in Physics Research A 521, 608–610.
23. Nuclear Data for Safeguards, International Atomic Energy Agency, Oct. 2006, www-
nds.iaea.org/sgnucdat/c3.htm.
24. Nuclear Forensics: Role, State of the Art, Program Needs. Joint Working Group of the
American Physical Society and the American Association for the Advancement of
Science, 2007, https://www.aps.org/policy/reports/popa-reports/upload/nuclear-
forensics.pdf.
25. Nudat 2.8, National Nuclear Data Center, www.nndc.bnl.gov/nudat2/chartNuc.jsp.
26. ORTEC. “GEM Series Coaxial HPGe Detector Product Configuration Guide.” ORTEC
Online, ORTEC, www.ortec-online.com/-/media/ametekortec/brochures/gem.pdf.
27. Pelowitz, Denise B., editor. MCNP6 User’s Manual, May 2013.

48
28. Physics of Uranium and Nuclear Energy - World Nuclear Association, World Nuclear
Association, Feb. 2018, www.world-nuclear.org/information-library/nuclear-fuel-
cycle/introduction/physics-of-nuclear-energy.aspx.
29. Sanchez, Timothy J. 2017. SCALE 6 (TRITON) Simulations of Fission Product Gamma
Line Emissions and their Comparison to Plutonium and Uranium Measurements. Oregon
State University.
30. Schickler, Robert. Comparison of HEU and LEU neutron spectra in irradiation facilities
at the Oregon State TRIGA® reactor 2012
31. “TRIGA Nuclear Reactors.” General Atomics, www.ga.com/triga.
32. Tsoulfanidis, Nicholas, and Sheldon Landsberger. Measurement and Detection of
Radiation. 4th ed., CRC Press, 2015.
33. Williford, Russell S. 2013. Temporal gamma-ray spectrometry to quantify relative fissile
material content. Oregon State University

49
APPENDIX A – Python Parsing Code
This script takes each ADC event, which signifies an analog-to-digital conversion event
recorded by the spectrometer, and separates each piece of information contained within the line.
A histogram of length equal to the total number of channels is created, and each element within
that histogram is incremented up by one for each ADC event that specifies a measurement at that
given channel number.

50
APPENDIX B – MCNP Input Decks
Shown here is the burnup card and material specification of the MCNP burnup deck
Burnup time is given in units of days, power is in units of Megawatts
Isotopes are specified by their data libraries and atomic fraction within the material
Shown below is the geometry specification cards of the MCNP detector input deck, as well as
the number of particle histories, energy bins, and gaussian energy broadening modifier.
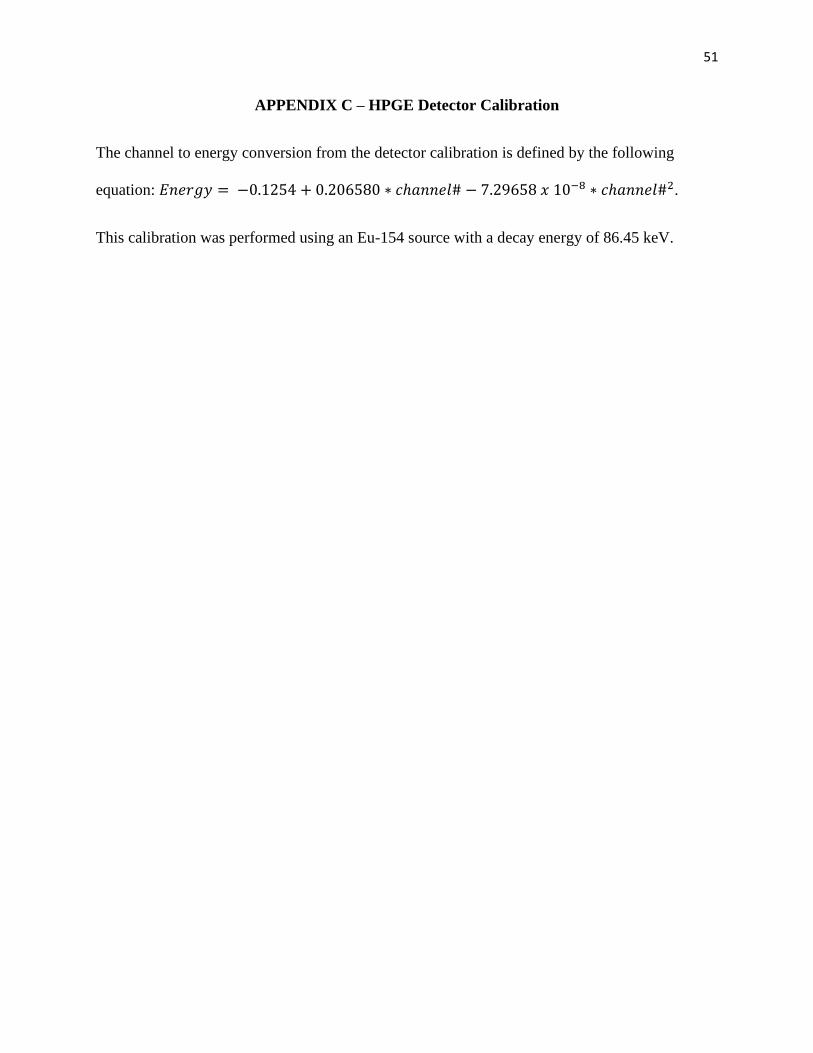
51
APPENDIX C – HPGE Detector Calibration
The channel to energy conversion from the detector calibration is defined by the following
equation: 𝐸𝑛𝑒𝑟𝑔𝑦 = −0.1254 + 0.206580 ∗ 𝑐ℎ𝑎𝑛𝑛𝑒𝑙# − 7.29658 𝑥 10−8 ∗ 𝑐ℎ𝑎𝑛𝑛𝑒𝑙#2.
This calibration was performed using an Eu-154 source with a decay energy of 86.45 keV.