juniper qfx10002: performance and scalability for …networktest.com/jnprqfx10k/jnprqfx10k.pdf ·...
TRANSCRIPT
Juniper QFX10002:Performance and Scalability
for the Data Center
December 2015
Page 2
Juniper QFX10002-72Q Scalability and Performance Benchmarks
Executive SummaryThe requirements list for data center switches is long, and getting longer. They must help cloud and data center operators scale up using technologies such as EVPN, VXLAN, VRF Lite, and Layer-3 VPNs. They must deliver high-capacity routing performance, both over IPv4 and IPv6. They must offer high-density options for 40G Ethernet and 100G Ethernet. And on the data plane, they must forward heavy traffic with zero frame loss.
To validate the ability to meet all these requirements, Juniper Networks commissioned Network Test, an inde-pendent third-party test lab, to assess its QFX10002-72Q data center switch. Tests involved two interface con-figurations: One with 24 100G Ethernet interfaces, and another with 72 40G Ethernet interfaces.
In an extensive battery of stress tests – including a first-ever demonstration of EVPN and VXLAN control- and data-plane performance – Network Test pounded the QFX10002-72Q with unicast, multicast, IPv4, IPv6, and switched and routed traffic in a variety of configurations and test bed topologies.
The Juniper QFX10002-72Q didn’t just pass every milestone – it smashed right through them, with impressive results in control- and data-plane performance and scalability.
Among the test highlights:
• First-ever demonstration of hardware-based Layer-3 EVPN/VXLAN gateway (VXLAN routing), with ground-breaking performance on 72 x 40G Ethernet interfaces
• Line-rate IMIX throughput for IPv4 and IPv6 unicast and multicast traffic
• 60,000 firewall filters with no reduction in throughput
• Loss-free performance when forwarding to 4,000 Layer-3 VPN instances
• Loss-free performance when forwarding to 4,000 VRF Lite instances, using both OSPF and BGP, and running BFD on all instances for fault detection
• Highly scalable Layer-2 and Layer-3 control-plane capacity
This report is organized as follows. This section provides an overview of the test results. The “About This Test” section explains the importance of each metric used and briefly describes issues common to all test cases. The “Performance Test Results” section provides full results from individual test cases. Appendix A provides software versions used in testing.
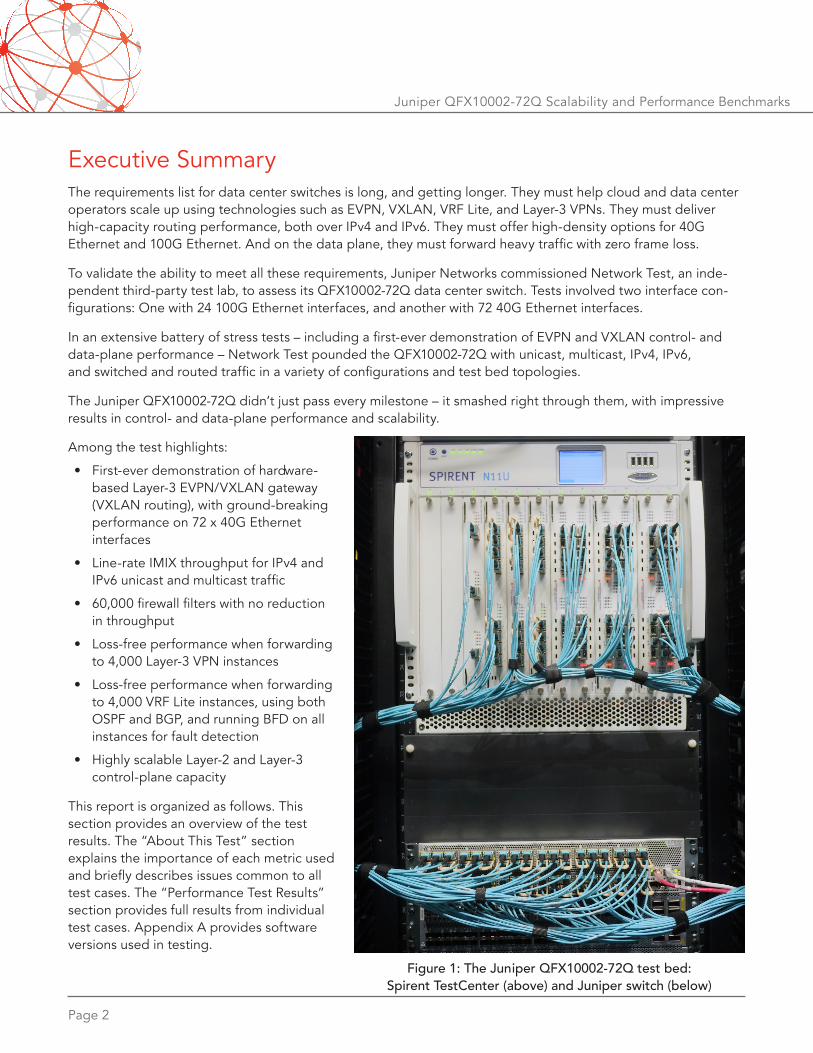
Figure 1: The Juniper QFX10002-72Q test bed: Spirent TestCenter (above) and Juniper switch (below)
Page 3
Juniper QFX10002-72Q Scalability and Performance Benchmarks
About This Test This project characterized Juniper QFX10002-72Q performance and scalability with the switch in 14 configuration modes. Most 40G Ethernet tests involved 72 interfaces, while most 100G Ethernet tests involved 24 interfaces. Table 1 summarizes test cases and results. Network Test and Juniper jointly developed pass criteria to mean every test outcome met or exceeded the expected results.
Test case Pass Fail
40G EVPNs with VXLAN tunneling 40G and 100G RFC 2544 unicast throughput and latency 40G and 100G RFC 3918 multicast throughput and latency RFC 3918 multicast group capacity Unicast and multicast power consumption 40G and 100G buffering capacity ARP scalability RFC 2889 MAC address capacity IPv4 and IPv6 route scalability IPv4 and IPv6 host route scalability Firewall filter (ACL) scalability Layer-3 VPNs VRF Lite with OSPF and BFD VRF Lite with BGP and BFD
Table 1: Juniper QFX10002-72Q test results
Figure 1 shows the Juniper QFX10002-72Q on the test bed, along with the Spirent TestCenter traffic generator/analyzer. Spirent TestCenter is capable of offering traffic at wire speed on all 40G or 100G Ethernet ports.
For all tests, the primary metrics were throughput and latency. RFC 2544, the industry-standard methodology for network device testing (and its companion, RFC 3918, for multicast traffic), determines throughput as the limit of system performance. In the context of lab benchmarking, throughput describes the maximum rate at which a device forwards all traffic with zero frame loss. Describing “real-world” performance is explicitly a non-goal of RFC 2544 throughput testing. Indeed, production networks load are typically far lower than the throughput rate.
Latency describes the delay introduced by a switch. It is a vital metric, and arguably even more important than throughput, especially for delay-sensitive applications such as video, voice, and some financial trading applications.
RFC 2544 requires latency be measured at, and only at, the throughput rate. Average utilization in production networks is typically far lower than line rate, so latency may be lower.
Page 4
Juniper QFX10002-72Q Scalability and Performance Benchmarks
Performance and Scalability Test ResultsEVPN with VXLAN Tunneling
Why it matters: VXLAN is the encapsulation of choice for data center overlay networking. While several solu-tions exist to interconnect conventional VLANs using Layer-2 VXLAN gateways, very few exist to provide both Layer-2 and Layer-3 gateways for VXLAN traffic – and even fewer solutions exist with high density at 40G and 100G Ethernet rates. On the control plane, Ethernet VPNs (EVPNs) are becoming the industry standard to build highly scalable Layer-2 data centers with overlays. VXLAN and EVPNs offer the advantages of operating without a controller; using open standards; and interoperating with multiple implementations.
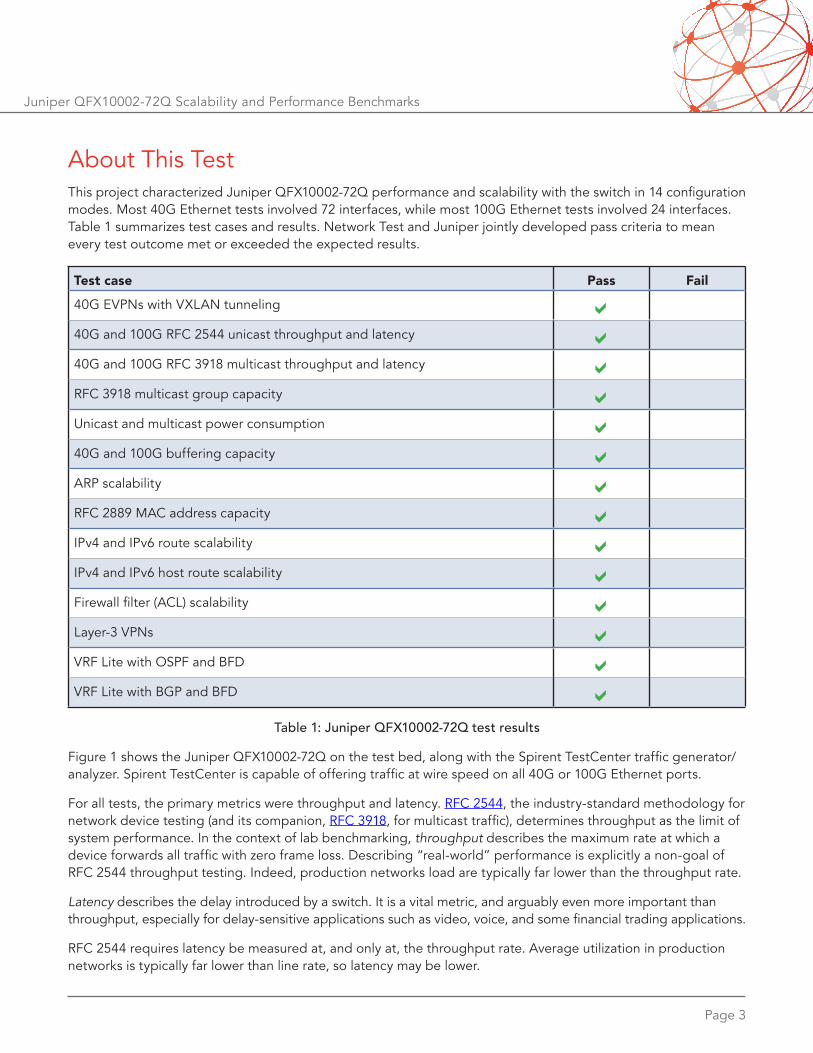
How we tested: The test bed modeled a scenario in which the Juniper QFX10002-72Q provided Layer-2 con-nectivity for 72 different sites, each using different EVPN instances and VXLAN tunnels.
Figure 2 shows the EVPN/VXLAN test bed topology. Doug Hanks, Juniper’s director of architecture, developed the topology for this test case.
Figure 2: EVPN / VXLAN test bed
Page 5
Juniper QFX10002-72Q Scalability and Performance Benchmarks
Throughput Latency @ throughput rate
Frame size (bytes)
Frames/s
Tbit/s
% line rate
Minimum (usec)
Average (usec)
Maximum (usec)
128 972,973,064 1.00 40% 2.89 3.09 3.65
256 991,304,356 2.03 76% 2.98 3.20 3.80
512 676,691,728 2.77 100% 3.13 3.67 3.93
1,024 344,827,586 2.82 100% 3.19 3.83 4.06
1,280 276,923,077 2.84 100% 3.29 3.79 3.98
1,518 234,070,222 2.84 100% 3.33 3.95 4.18
9,216 38,977,913 2.87 100% 5.01 5.54 6.08
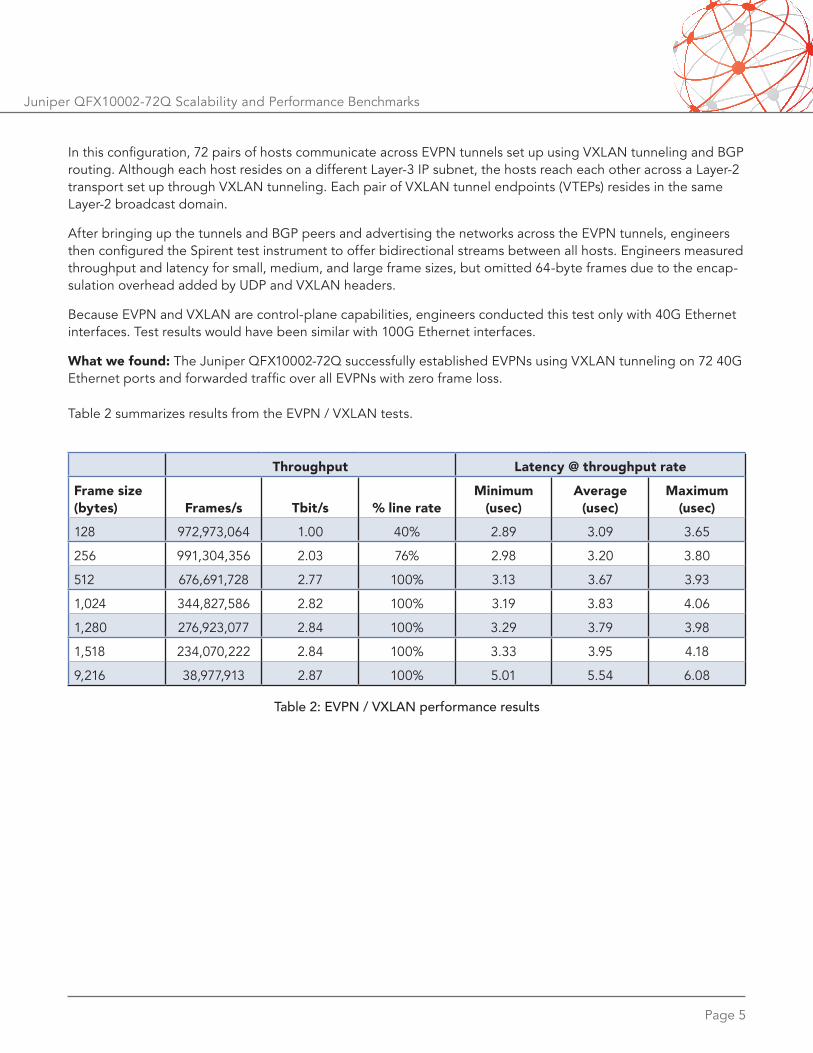
Table 2: EVPN / VXLAN performance results
In this configuration, 72 pairs of hosts communicate across EVPN tunnels set up using VXLAN tunneling and BGP routing. Although each host resides on a different Layer-3 IP subnet, the hosts reach each other across a Layer-2 transport set up through VXLAN tunneling. Each pair of VXLAN tunnel endpoints (VTEPs) resides in the same Layer-2 broadcast domain.
After bringing up the tunnels and BGP peers and advertising the networks across the EVPN tunnels, engineers then configured the Spirent test instrument to offer bidirectional streams between all hosts. Engineers measured throughput and latency for small, medium, and large frame sizes, but omitted 64-byte frames due to the encap-sulation overhead added by UDP and VXLAN headers.
Because EVPN and VXLAN are control-plane capabilities, engineers conducted this test only with 40G Ethernet interfaces. Test results would have been similar with 100G Ethernet interfaces.
What we found: The Juniper QFX10002-72Q successfully established EVPNs using VXLAN tunneling on 72 40G Ethernet ports and forwarded traffic over all EVPNs with zero frame loss.
Table 2 summarizes results from the EVPN / VXLAN tests.
Page 6
Juniper QFX10002-72Q Scalability and Performance Benchmarks
40G and 100G RFC 2544 IPv4 Unicast Throughput and Latency
Why it matters: The most basic task of any Ethernet switch is to move traffic as fast as possible with zero frame loss. The two industry-standard metrics for data-plane performance are throughput and latency. As described in RFCs 1242 and 2544, throughput is the highest rate at which a switch forwards all offered traffic with zero frame loss. Latency is the delay introduced by the switch, in this case measured on a last-bit-in, first-bit-out basis because the QFX10002-72Q is a store-and-forward device.
How we tested: Engineers repeated this test twice, using 40G and 100G Ethernet interfaces. In the 40G tests, engineers configured the Spirent TestCenter traffic generator/analyzer to offer IPv4 traffic to all 72 40G Ethernet interfaces in a “fully meshed” pattern, meaning all flows were destined for all other ports. This is generally considered the most stressful possible test case. The 100G Ethernet tests also used fully meshed traffic, this time across all 24 ports.
Because throughput and latency vary by frame size, engineers took measurements using the seven standard frame lengths specified in RFC 2544, ranging from the Ethernet minimum to the maximum lengths of 64 and 1,518 bytes respectively. Engineers also tested with 9,216-byte jumbo frames, as commonly found in data centers.
Engineers also tested with a combination of small, medium, and large frames known as “IMIX.” The standard IMIX blend involves 64-, 594-, and 1,518-byte Ethernet frames offered in a 7:4:1 ratio. These sizes and this ratio are based on studies of frame size distribution in Internet backbone traffic.
For all tests, engineers used a binary search algorithm to determine the throughput rate, and measured mini-mum, average, and maximum latency at that rate, as required by RFC 2544. The duration for all tests was 60 seconds.
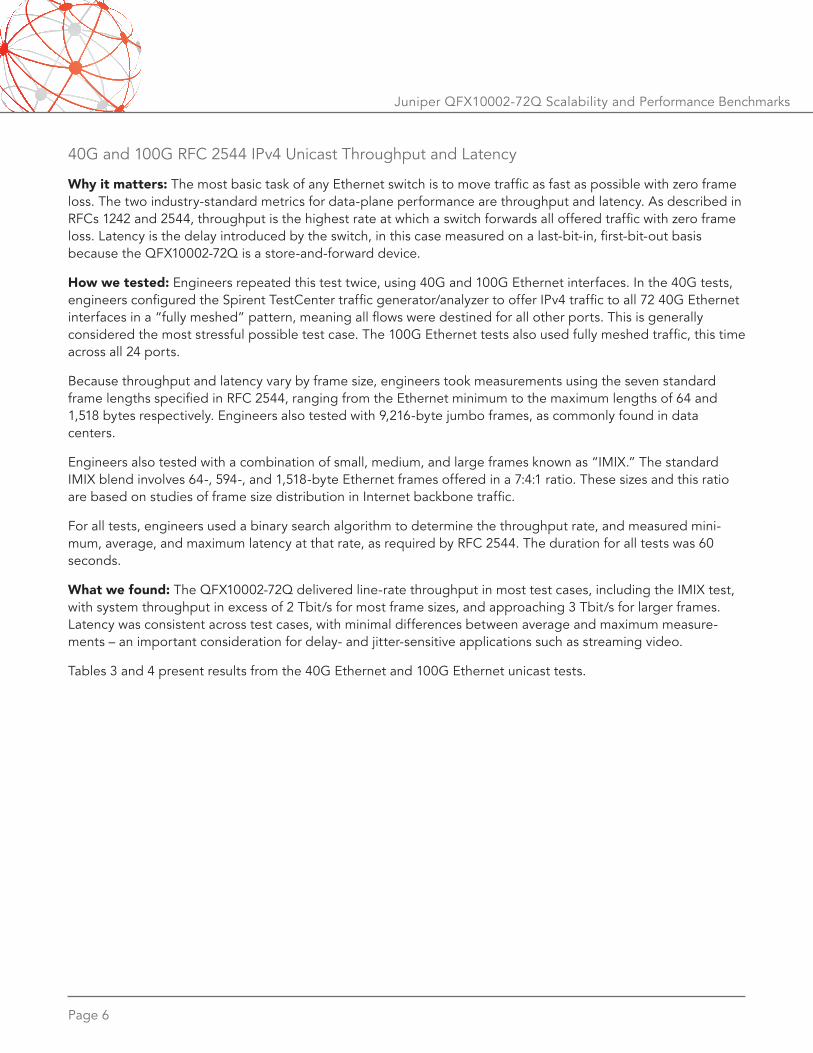
What we found: The QFX10002-72Q delivered line-rate throughput in most test cases, including the IMIX test, with system throughput in excess of 2 Tbit/s for most frame sizes, and approaching 3 Tbit/s for larger frames. Latency was consistent across test cases, with minimal differences between average and maximum measure-ments – an important consideration for delay- and jitter-sensitive applications such as streaming video.
Tables 3 and 4 present results from the 40G Ethernet and 100G Ethernet unicast tests.
Page 7
Juniper QFX10002-72Q Scalability and Performance Benchmarks
Throughput Latency @ throughput rate
Frame size (bytes)
Frames/s
Tbit/s
% line rate
Minimum (usec)
Average (usec)
Maximum (usec)
IMIX 942,286,609 2.73 100.00% 2.22 6.53 9.97
64 1,971,428,524 1.01 46.00% 2.15 4.62 6.47
128 1,994,594,640 2.04 82.00% 2.22 5.05 8.21
256 1,304,347,743 2.67 100.00% 2.31 5.79 7.96
512 676,691,687 2.77 100.00% 2.34 6.07 9.67
1,024 344,827,566 2.82 100.00% 2.34 5.99 8.53
1,280 276,923,060 2.84 100.00% 2.35 6.05 9.17
1,518 234,070,207 2.84 100.00% 2.37 6.07 9.48
9,216 38,977,910 2.87 100.00% 2.56 8.18 12.22
Table 3: 40G Ethernet / IPv4 unicast performance results
Throughput Latency @ throughput rate
Frame size (bytes)
Frames/s
Tbit/s
% line rate
Minimum (usec)
Average (usec)
Maximum (usec)
IMIX 786,414,856 2.28 100.00% 2.10 5.46 7.08
64 1,981,035,641 1.01 55.47% 2.06 4.52 5.74
128 1,995,364,820 2.04 98.44% 2.10 4.80 6.68
256 1,086,956,468 2.23 100.00% 2.17 5.06 6.41
512 563,909,746 2.31 100.00% 2.20 5.11 6.43
1,024 287,356,307 2.35 100.00% 2.24 5.24 6.69
1,280 230,769,219 2.36 100.00% 2.27 5.23 6.52
1,518 195,058,508 2.37 100.00% 2.24 5.24 6.70
9,216 32,481,592 2.39 100.00% 2.48 6.33 8.97
Table 4: 100G Ethernet / IPv4 unicast performance results
Page 8
Juniper QFX10002-72Q Scalability and Performance Benchmarks
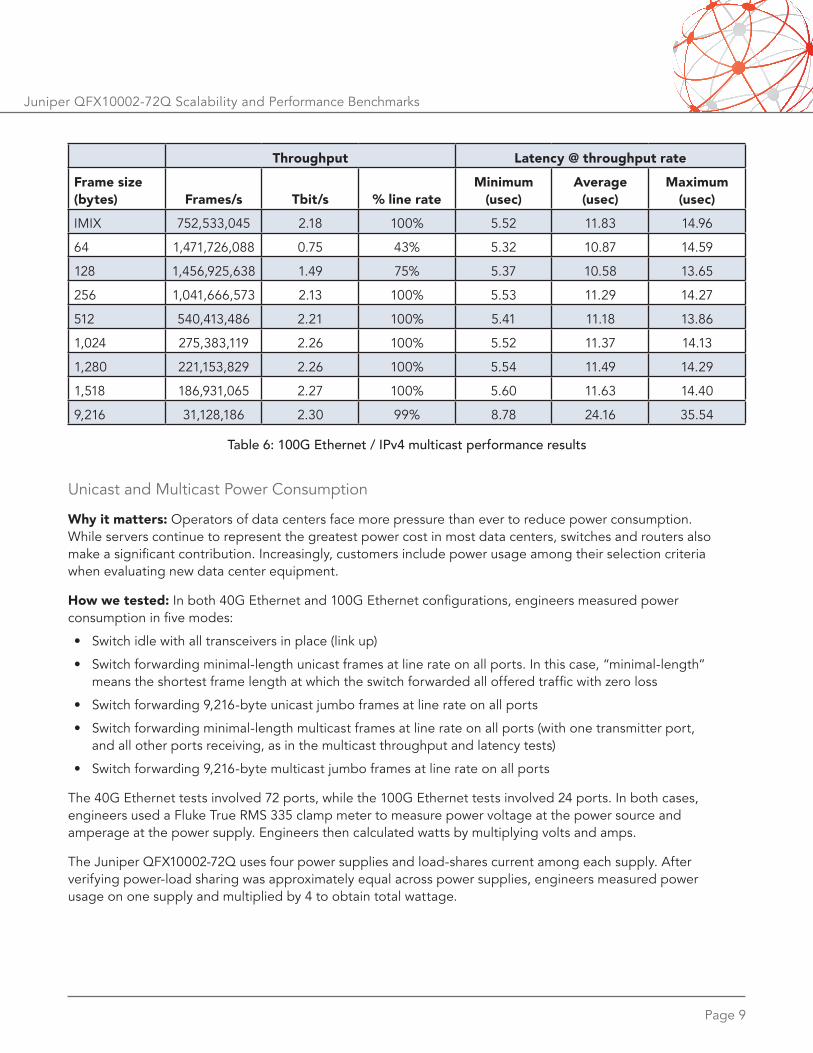
40G and 100G RFC 3918 Multicast Throughput and Latency
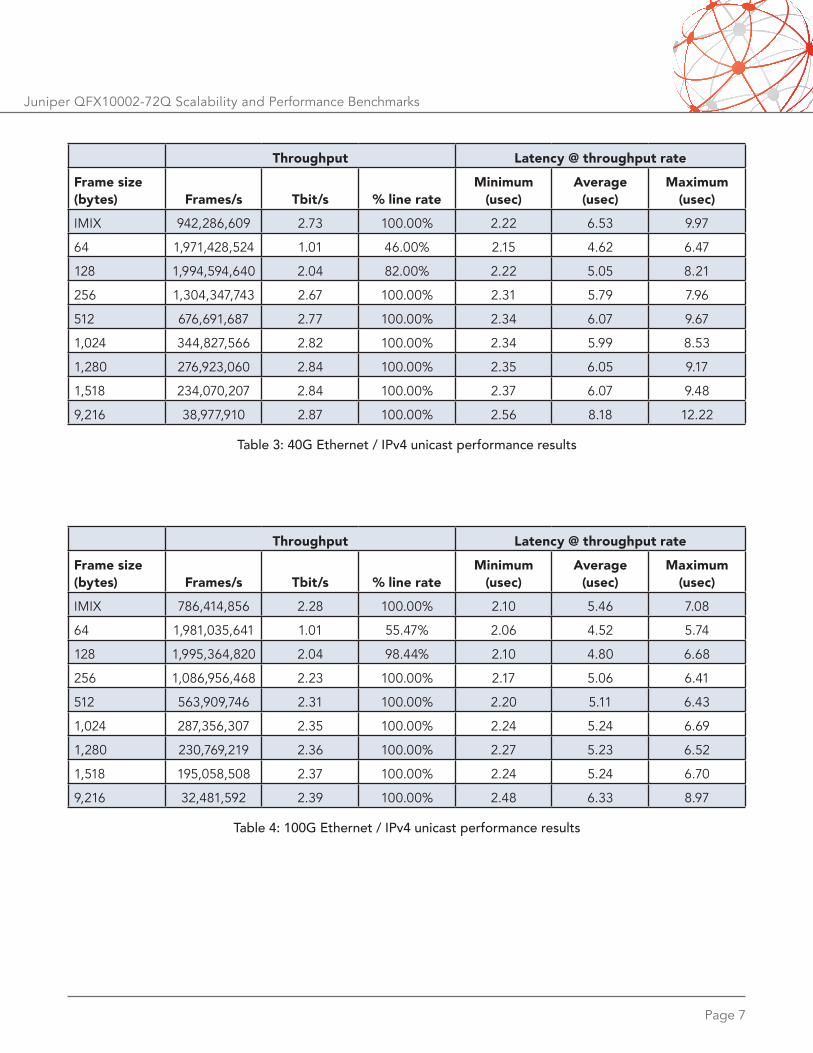
Why it matters: With the rapid growth of multicast-enabled applications in data centers and beyond, a switch’s ability to replicate multicast traffic at high rates, and with minimal delay, becomes critically important.
How we tested: In this scenario, the Spirent TestCenter instrument offered IPv4 multicast traffic to one port, and the switch replicated the traffic to all other “subscriber” ports. As with the unicast tests, engineers measured throughput and latency both with 40G Ethernet and 100G Ethernet interfaces, using 72 and 24 interfaces respectively.
The Juniper QFX10002-72Q ran the Protocol Independent Multicast (PIM) routing protocol to build a multicast distribution tree. All subscriber ports joined the same 1,000 multicast groups using Internet Group Membership Protocol version 3 (IGMPv3) reports. Thus, the multicast routing table held 1,000 entries in all tests.
What we found: The Juniper switch correctly joined 1,000 multicast groups and forwarded all traffic to all groups on all ports with zero loss in both 40G Ethernet and 100G Ethernet test cases.
Tables 5 and 6 present results for 40G Ethernet and 100G Ethernet multicast tests.
Throughput Latency @ throughput rate
Frame size (bytes)
Frames/s
Tbit/s
% line rate
Minimum (usec)
Average (usec)
Maximum (usec)
IMIX 929,214,811 2.69 100% 5.62 13.67 18.02
64 1,775,000,018 0.91 42% 5.38 10.26 13.30
128 1,775,000,120 1.82 74% 5.50 10.52 13.15
256 1,286,231,884 2.63 100% 5.61 11.22 14.29
512 667,293,234 2.73 100% 5.51 11.31 14.02
1,024 340,038,314 2.79 100% 5.58 11.90 15.44
1,280 273,076,923 2.80 100% 5.62 12.35 16.07
1,518 230,819,246 2.80 100% 5.72 13.12 17.40
9,216 38,052,190 2.81 99% 7.83 24.68 45.76
Table 5: 40G Ethernet / IPv4 multicast performance results
Page 9
Juniper QFX10002-72Q Scalability and Performance Benchmarks
Throughput Latency @ throughput rate
Frame size (bytes)
Frames/s
Tbit/s
% line rate
Minimum (usec)
Average (usec)
Maximum (usec)
IMIX 752,533,045 2.18 100% 5.52 11.83 14.96
64 1,471,726,088 0.75 43% 5.32 10.87 14.59
128 1,456,925,638 1.49 75% 5.37 10.58 13.65
256 1,041,666,573 2.13 100% 5.53 11.29 14.27
512 540,413,486 2.21 100% 5.41 11.18 13.86
1,024 275,383,119 2.26 100% 5.52 11.37 14.13
1,280 221,153,829 2.26 100% 5.54 11.49 14.29
1,518 186,931,065 2.27 100% 5.60 11.63 14.40
9,216 31,128,186 2.30 99% 8.78 24.16 35.54
Table 6: 100G Ethernet / IPv4 multicast performance results
Unicast and Multicast Power Consumption
Why it matters: Operators of data centers face more pressure than ever to reduce power consumption. While servers continue to represent the greatest power cost in most data centers, switches and routers also make a significant contribution. Increasingly, customers include power usage among their selection criteria when evaluating new data center equipment.
How we tested: In both 40G Ethernet and 100G Ethernet configurations, engineers measured power consumption in five modes:
• Switch idle with all transceivers in place (link up)
• Switch forwarding minimal-length unicast frames at line rate on all ports. In this case, “minimal-length” means the shortest frame length at which the switch forwarded all offered traffic with zero loss
• Switch forwarding 9,216-byte unicast jumbo frames at line rate on all ports
• Switch forwarding minimal-length multicast frames at line rate on all ports (with one transmitter port, and all other ports receiving, as in the multicast throughput and latency tests)
• Switch forwarding 9,216-byte multicast jumbo frames at line rate on all ports
The 40G Ethernet tests involved 72 ports, while the 100G Ethernet tests involved 24 ports. In both cases, engineers used a Fluke True RMS 335 clamp meter to measure power voltage at the power source and amperage at the power supply. Engineers then calculated watts by multiplying volts and amps.
The Juniper QFX10002-72Q uses four power supplies and load-shares current among each supply. After verifying power-load sharing was approximately equal across power supplies, engineers measured power usage on one supply and multiplied by 4 to obtain total wattage.
Page 10
Juniper QFX10002-72Q Scalability and Performance Benchmarks
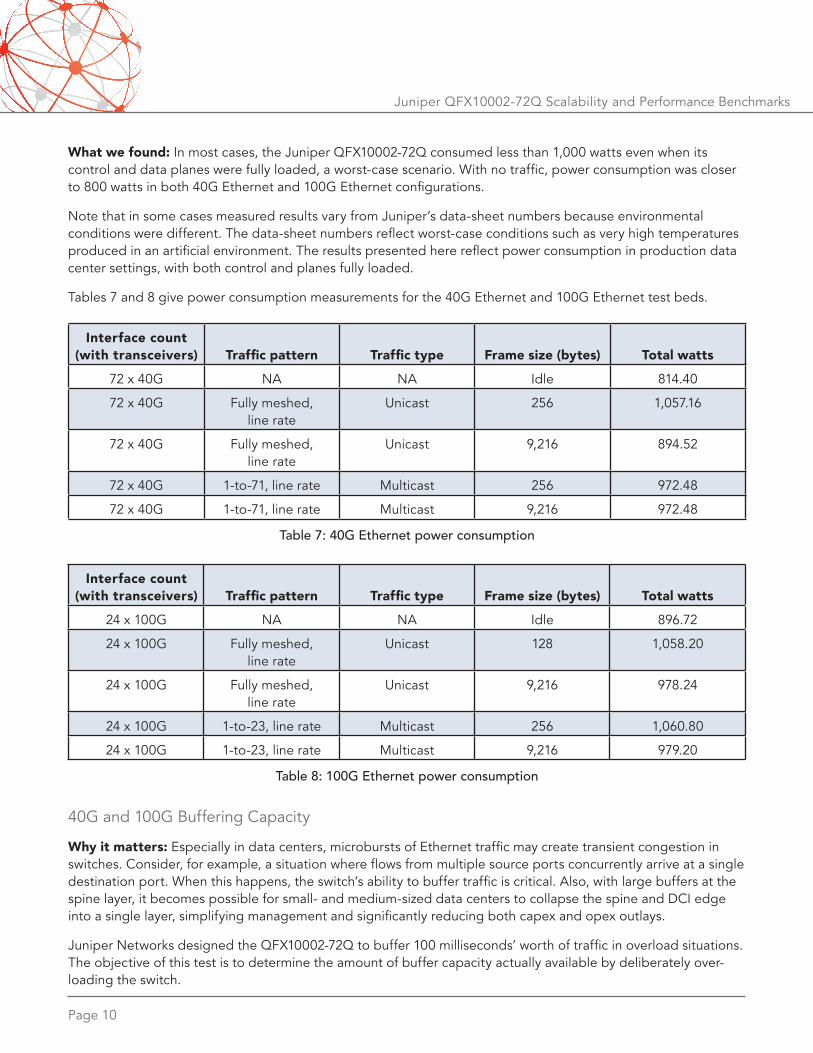
What we found: In most cases, the Juniper QFX10002-72Q consumed less than 1,000 watts even when its control and data planes were fully loaded, a worst-case scenario. With no traffic, power consumption was closer to 800 watts in both 40G Ethernet and 100G Ethernet configurations.
Note that in some cases measured results vary from Juniper’s data-sheet numbers because environmental conditions were different. The data-sheet numbers reflect worst-case conditions such as very high temperatures produced in an artificial environment. The results presented here reflect power consumption in production data center settings, with both control and planes fully loaded.
Tables 7 and 8 give power consumption measurements for the 40G Ethernet and 100G Ethernet test beds.
Interface count (with transceivers)
Traffic pattern
Traffic type
Frame size (bytes)
Total watts
72 x 40G NA NA Idle 814.40
72 x 40G Fully meshed, line rate
Unicast 256 1,057.16
72 x 40G Fully meshed, line rate
Unicast 9,216 894.52
72 x 40G 1-to-71, line rate Multicast 256 972.48
72 x 40G 1-to-71, line rate Multicast 9,216 972.48
Table 7: 40G Ethernet power consumption
Interface count (with transceivers)
Traffic pattern
Traffic type
Frame size (bytes)
Total watts
24 x 100G NA NA Idle 896.72
24 x 100G Fully meshed, line rate
Unicast 128 1,058.20
24 x 100G Fully meshed, line rate
Unicast 9,216 978.24
24 x 100G 1-to-23, line rate Multicast 256 1,060.80
24 x 100G 1-to-23, line rate Multicast 9,216 979.20
Table 8: 100G Ethernet power consumption
40G and 100G Buffering Capacity
Why it matters: Especially in data centers, microbursts of Ethernet traffic may create transient congestion in switches. Consider, for example, a situation where flows from multiple source ports concurrently arrive at a single destination port. When this happens, the switch’s ability to buffer traffic is critical. Also, with large buffers at the spine layer, it becomes possible for small- and medium-sized data centers to collapse the spine and DCI edge into a single layer, simplifying management and significantly reducing both capex and opex outlays.
Juniper Networks designed the QFX10002-72Q to buffer 100 milliseconds’ worth of traffic in overload situations. The objective of this test is to determine the amount of buffer capacity actually available by deliberately over-loading the switch.
Page 11
Juniper QFX10002-72Q Scalability and Performance Benchmarks
How we tested: As with throughput and latency tests, engineers repeated the buffering test using 40G Ether-net and 100G Ethernet interfaces. In both cases, engineers configured the Spirent TestCenter test instrument with two flows, each offered to different source interfaces but both targeted at the same destination interface.
The first flow involved a continuous stream of 512-byte frames at line rate, fully loading the destination port. The second flow involved a burst of 512-byte frames lasting exactly 100 milliseconds, forcing the switch to buffer traffic at the destination port.
Using detailed stream statistics from Spirent TestCenter, engineers verified that zero frame loss occurred and then observed the maximum latency for each flow. Maximum latency represents the amount of delay introduced by the switch during congestion.
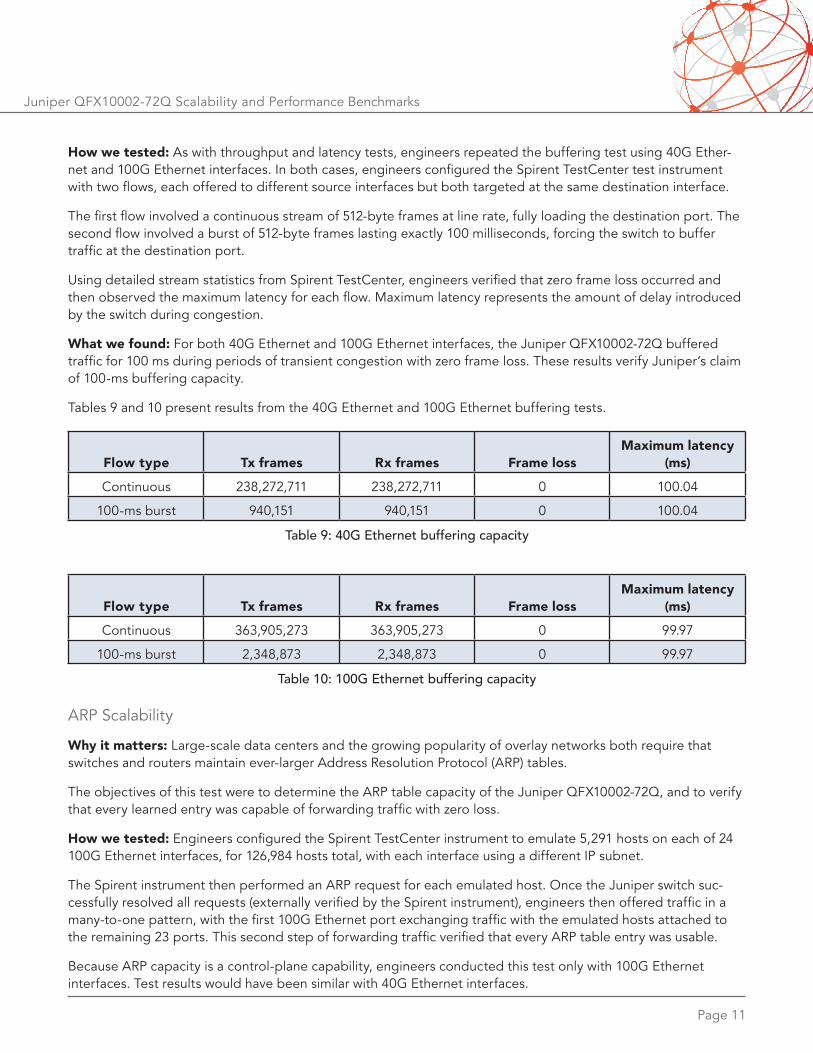
What we found: For both 40G Ethernet and 100G Ethernet interfaces, the Juniper QFX10002-72Q buffered traffic for 100 ms during periods of transient congestion with zero frame loss. These results verify Juniper’s claim of 100-ms buffering capacity.
Tables 9 and 10 present results from the 40G Ethernet and 100G Ethernet buffering tests.
Flow type
Tx frames
Rx frames
Frame loss
Maximum latency (ms)
Continuous 238,272,711 238,272,711 0 100.04
100-ms burst 940,151 940,151 0 100.04
Table 9: 40G Ethernet buffering capacity
Flow type
Tx frames
Rx frames
Frame loss
Maximum latency (ms)
Continuous 363,905,273 363,905,273 0 99.97
100-ms burst 2,348,873 2,348,873 0 99.97
Table 10: 100G Ethernet buffering capacity
ARP Scalability
Why it matters: Large-scale data centers and the growing popularity of overlay networks both require that switches and routers maintain ever-larger Address Resolution Protocol (ARP) tables.
The objectives of this test were to determine the ARP table capacity of the Juniper QFX10002-72Q, and to verify that every learned entry was capable of forwarding traffic with zero loss.
How we tested: Engineers configured the Spirent TestCenter instrument to emulate 5,291 hosts on each of 24 100G Ethernet interfaces, for 126,984 hosts total, with each interface using a different IP subnet.
The Spirent instrument then performed an ARP request for each emulated host. Once the Juniper switch suc-cessfully resolved all requests (externally verified by the Spirent instrument), engineers then offered traffic in a many-to-one pattern, with the first 100G Ethernet port exchanging traffic with the emulated hosts attached to the remaining 23 ports. This second step of forwarding traffic verified that every ARP table entry was usable.
Because ARP capacity is a control-plane capability, engineers conducted this test only with 100G Ethernet interfaces. Test results would have been similar with 40G Ethernet interfaces.
Page 12
Juniper QFX10002-72Q Scalability and Performance Benchmarks
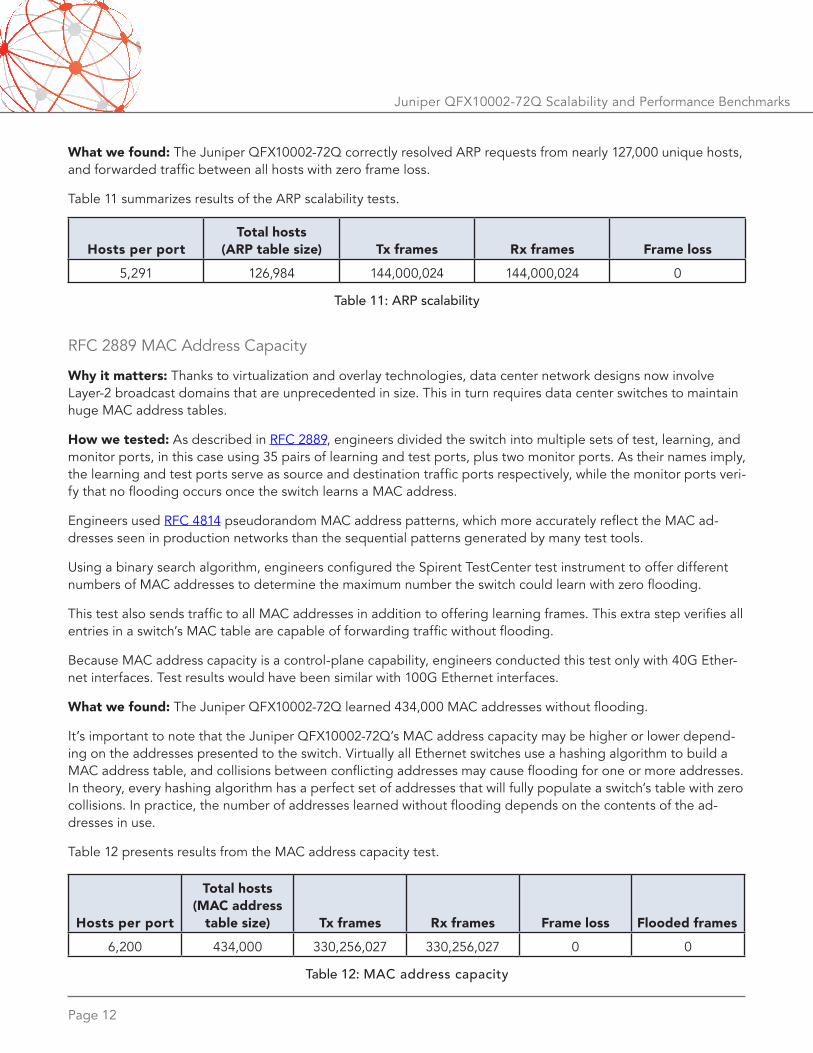
What we found: The Juniper QFX10002-72Q correctly resolved ARP requests from nearly 127,000 unique hosts, and forwarded traffic between all hosts with zero frame loss.
Table 11 summarizes results of the ARP scalability tests.
Hosts per port
Total hosts (ARP table size)
Tx frames
Rx frames
Frame loss
5,291 126,984 144,000,024 144,000,024 0
Table 11: ARP scalability
RFC 2889 MAC Address Capacity
Why it matters: Thanks to virtualization and overlay technologies, data center network designs now involve Layer-2 broadcast domains that are unprecedented in size. This in turn requires data center switches to maintain huge MAC address tables.
How we tested: As described in RFC 2889, engineers divided the switch into multiple sets of test, learning, and monitor ports, in this case using 35 pairs of learning and test ports, plus two monitor ports. As their names imply, the learning and test ports serve as source and destination traffic ports respectively, while the monitor ports veri-fy that no flooding occurs once the switch learns a MAC address.
Engineers used RFC 4814 pseudorandom MAC address patterns, which more accurately reflect the MAC ad-dresses seen in production networks than the sequential patterns generated by many test tools.
Using a binary search algorithm, engineers configured the Spirent TestCenter test instrument to offer different numbers of MAC addresses to determine the maximum number the switch could learn with zero flooding.
This test also sends traffic to all MAC addresses in addition to offering learning frames. This extra step verifies all entries in a switch’s MAC table are capable of forwarding traffic without flooding.
Because MAC address capacity is a control-plane capability, engineers conducted this test only with 40G Ether-net interfaces. Test results would have been similar with 100G Ethernet interfaces.
What we found: The Juniper QFX10002-72Q learned 434,000 MAC addresses without flooding.
It’s important to note that the Juniper QFX10002-72Q’s MAC address capacity may be higher or lower depend-ing on the addresses presented to the switch. Virtually all Ethernet switches use a hashing algorithm to build a MAC address table, and collisions between conflicting addresses may cause flooding for one or more addresses. In theory, every hashing algorithm has a perfect set of addresses that will fully populate a switch’s table with zero collisions. In practice, the number of addresses learned without flooding depends on the contents of the ad-dresses in use.
Table 12 presents results from the MAC address capacity test.
Hosts per port
Total hosts (MAC address
table size)
Tx frames
Rx frames
Frame loss
Flooded frames
6,200 434,000 330,256,027 330,256,027 0 0
Table 12: MAC address capacity
Page 13
Juniper QFX10002-72Q Scalability and Performance Benchmarks
IPv4 and IPv6 Route Scalability
Why it matters: The number of networks attached to the global Internet continues to expand at an explosive pace, and technologies such as IPv6 and the Internet of Things continue to drive rapid Internet growth. Within and across data centers, some network designs also involve huge numbers of routed networks. Both developments require data center devices to build large routing tables and to forward traffic to all networks in those tables.
How we tested: The objective of this test was to determine the size not only of the QFX10002-72Q’s routing information base (RIB) but also its forwarding information base (FIB). Because a RIB describes network topologies and routing tables, it can reside in software and may contain multiple routes to the same network. A FIB contains only the best route to each network, and is installed into hardware for the fastest forwarding performance.
FIB capacity testing is a more stressful measure of route scalability because it measures the number of unique routes a device can actually forward traffic to.
Significantly, this test involved concurrent IPv4 and IPv6 routing on a large scale. Engineers configured the Spirent TestCenter instrument to bring up a BGP peering session with one QFX10002-72Q interface. The test instrument then advertised nearly 500,000 unique IPv4 and IPv6 routes (nearly 256,000 unique routes apiece). After advertising the routes, the Spirent instrument then offered 512-byte frames to every route at line rate from an emulated host attached to a second interface of the QFX10002-72Q. As noted, the QFX10002-72Q simultane-ously forwarded both IPv4 and IPv6 traffic to all advertised networks.
The pass criterion for this test was for the device to forward all traffic to all IPv4 and IPv6 routes at line rate with zero loss.
Because route scalability is a control-plane capability, engineers conducted this test only with 40G Ethernet interfaces. Test results would have been identical with 100G Ethernet interfaces.
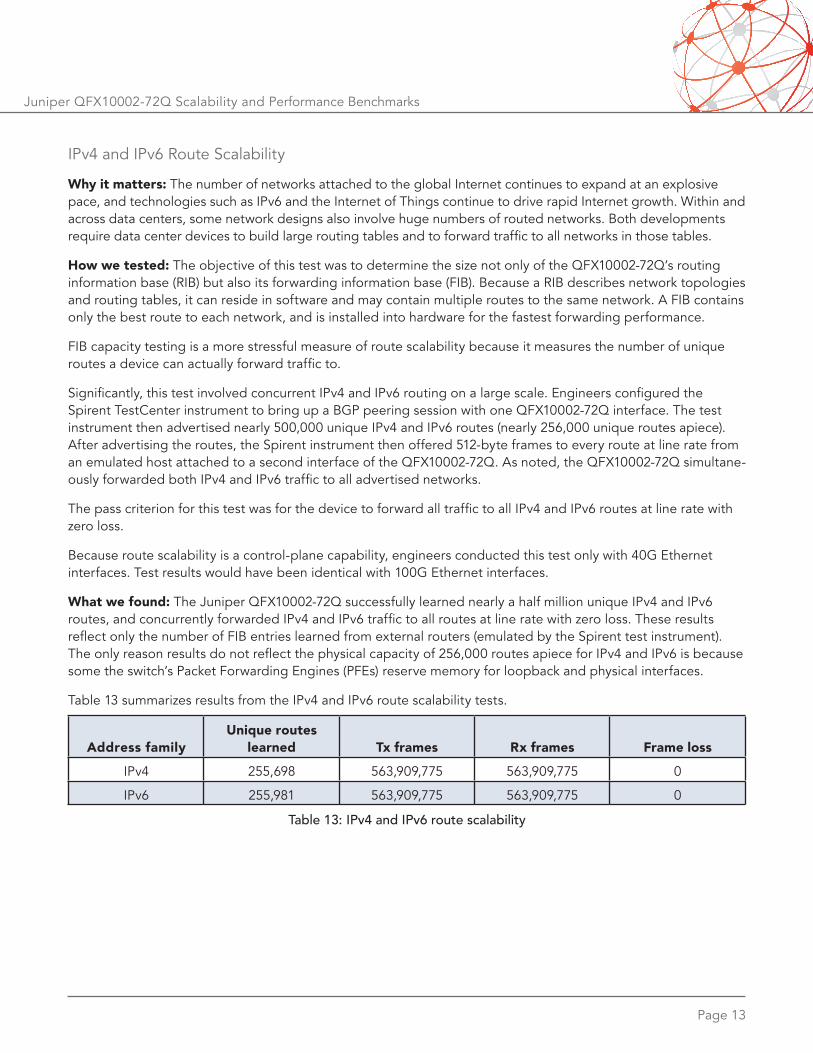
What we found: The Juniper QFX10002-72Q successfully learned nearly a half million unique IPv4 and IPv6 routes, and concurrently forwarded IPv4 and IPv6 traffic to all routes at line rate with zero loss. These results reflect only the number of FIB entries learned from external routers (emulated by the Spirent test instrument). The only reason results do not reflect the physical capacity of 256,000 routes apiece for IPv4 and IPv6 is because some the switch’s Packet Forwarding Engines (PFEs) reserve memory for loopback and physical interfaces.
Table 13 summarizes results from the IPv4 and IPv6 route scalability tests.
Address family
Unique routes learned
Tx frames
Rx frames
Frame loss
IPv4 255,698 563,909,775 563,909,775 0
IPv6 255,981 563,909,775 563,909,775 0
Table 13: IPv4 and IPv6 route scalability

Page 14
Juniper QFX10002-72Q Scalability and Performance Benchmarks
IPv4 and IPv6 Host Route Scalability
Why it matters: Driven by virtualization and cloud computing, data center switches must connect a rapidly rising number of servers and other network-attached devices. Accordingly, a key measure of scalability is the number of direct routes a data center device can handle.
How we tested: This test was conceptually similar to the previous route scalability tests, in that one test instru-ment interface brought up a BGP peering instance and advertised routes, and then a second interface offered test traffic to those routes. In this case, however, all advertised routes used host prefix lengths of /32 for IPv4 and /128 for IPv6.
Engineers tested host route scalability twice, once apiece with IPv4 and IPv6 hosts, each time advertising nearly 2 million host routes. To verify reachability, engineers configured the test instrument to offer test traffic to all hosts at line rate.
Because host route scalability is a control-plane capability, engineers conducted this test only with 40G Ethernet interfaces. Test results would have been identical with 100G Ethernet interfaces.
What we found: In separate tests with IPv4 and IPv6 traffic, the Juniper QFX10002-72Q learned nearly 2 million host routes for both address families, and successfully forwarded all traffic to all host routes with zero loss. These results reflect only the number of host entries learned from external devices (emulated by the Spirent test instrument). The only reason results do not reflect the physical capacity of 2 million host routes apiece for IPv4 and IPv6 is because some the switch’s Packet Forwarding Engines (PFEs) reserve memory for loopback and physical interfaces.
Table 14 summarizes results from the IPv4 and IPv6 host route scalability tests.
Address family
Unique host routes learned
Tx frames
Rx frames
Frame loss
IPv4 1,999,698 563,909,775 563,909,775 0
IPv6 1,999,981 563,909,775 563,909,775 0
Table 14: IPv4 and IPv6 host route scalability
Firewall Filter (ACL) Scalability
Why it matters: When it comes to securing the data center, controlling access to network devices and end-sta-tions is a critical capability. Given the high device counts in modern data centers, the ability to support large numbers of firewall filters (also known as access control lists [ACLs]), and to do so without significantly affecting throughput and latency, are key measures of device scalability and performance.
How we tested: As in the IPv4 throughput and latency tests, engineers constructed a fully meshed traffic pattern in which all ports exchanged traffic with all other ports. This time, the Spirent TestCenter test instrument emulated 50 hosts attached to each switch port.
The firewall filters covered all 50 hosts on each port. With 24 100G Ethernet ports, the total number of firewall filters was 60,001 (24 ports, each with 50 sources and 50 destinations, plus one final filter to cover any other traffic). The resulting configuration file was nearly 781,000 lines long.
Engineers ran two sets of test cases to verify the firewall filters, covering “accept” and “discard” conditions. Both test cases began with a baseline test with no firewall filters applied to validate that the Juniper QFX10002-72Q
Page 15
Juniper QFX10002-72Q Scalability and Performance Benchmarks
would forward 512-byte frames at line rate with zero loss. Then engineers applied the firewall filter and repeated the test to determine if the switch accepted or discarded traffic.
Because firewall filter scalability is a control-plane capability, engineers conducted this test only with 100G Ethernet interfaces. Test results would have been identical with 40G Ethernet interfaces.
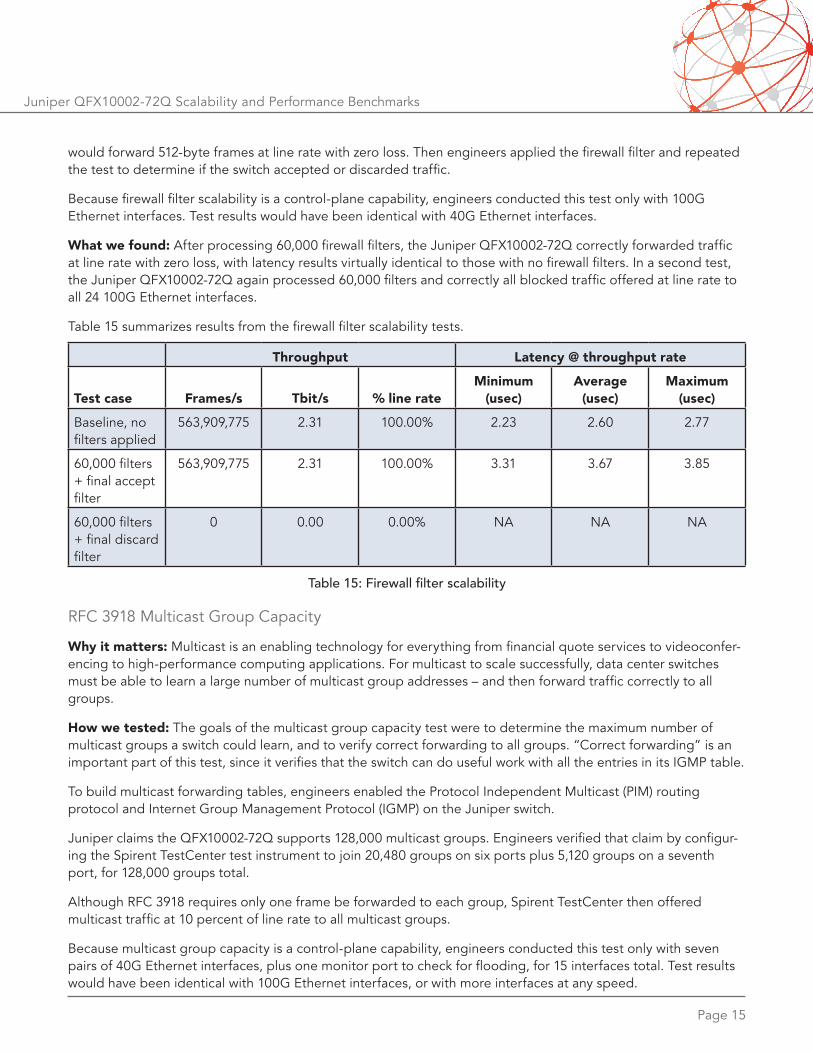
What we found: After processing 60,000 firewall filters, the Juniper QFX10002-72Q correctly forwarded traffic at line rate with zero loss, with latency results virtually identical to those with no firewall filters. In a second test, the Juniper QFX10002-72Q again processed 60,000 filters and correctly all blocked traffic offered at line rate to all 24 100G Ethernet interfaces.
Table 15 summarizes results from the firewall filter scalability tests.
Throughput Latency @ throughput rate
Test case
Frames/s
Tbit/s
% line rate
Minimum (usec)
Average (usec)
Maximum (usec)
Baseline, no filters applied
563,909,775 2.31 100.00% 2.23 2.60 2.77
60,000 filters + final accept filter
563,909,775 2.31 100.00% 3.31 3.67 3.85
60,000 filters + final discard filter
0 0.00 0.00% NA NA NA
Table 15: Firewall filter scalability
RFC 3918 Multicast Group Capacity
Why it matters: Multicast is an enabling technology for everything from financial quote services to videoconfer-encing to high-performance computing applications. For multicast to scale successfully, data center switches must be able to learn a large number of multicast group addresses – and then forward traffic correctly to all groups.
How we tested: The goals of the multicast group capacity test were to determine the maximum number of multicast groups a switch could learn, and to verify correct forwarding to all groups. “Correct forwarding” is an important part of this test, since it verifies that the switch can do useful work with all the entries in its IGMP table.
To build multicast forwarding tables, engineers enabled the Protocol Independent Multicast (PIM) routing protocol and Internet Group Management Protocol (IGMP) on the Juniper switch.
Juniper claims the QFX10002-72Q supports 128,000 multicast groups. Engineers verified that claim by configur-ing the Spirent TestCenter test instrument to join 20,480 groups on six ports plus 5,120 groups on a seventh port, for 128,000 groups total.
Although RFC 3918 requires only one frame be forwarded to each group, Spirent TestCenter then offered multicast traffic at 10 percent of line rate to all multicast groups.
Because multicast group capacity is a control-plane capability, engineers conducted this test only with seven pairs of 40G Ethernet interfaces, plus one monitor port to check for flooding, for 15 interfaces total. Test results would have been identical with 100G Ethernet interfaces, or with more interfaces at any speed.
Page 16
Juniper QFX10002-72Q Scalability and Performance Benchmarks
Layer-3 Virtual Private Networks (Layer-3 VPNs)
Why it matters: By providing virtual, routed IP tunnels across a service provider’s backbone network (typically MPLS), Layer-3 VPNs offer scalability and manageability advantages over conventional IP-based VPNs for enter-prises and service providers.
Conventional VPNs typically require fully meshed networking among all sites requiring VPN connectivity. More-over, each router must be reconfigured each time a site is added or deleted. In contrast, a change in one site in an MPLS-based VPN requires reconfiguration only of the service provider’s edge router at that site.
How we tested: This test involved VPN traffic from 4,000 customers, all using overlapping IP addresses, and all tunneled across an MPLS backbone.
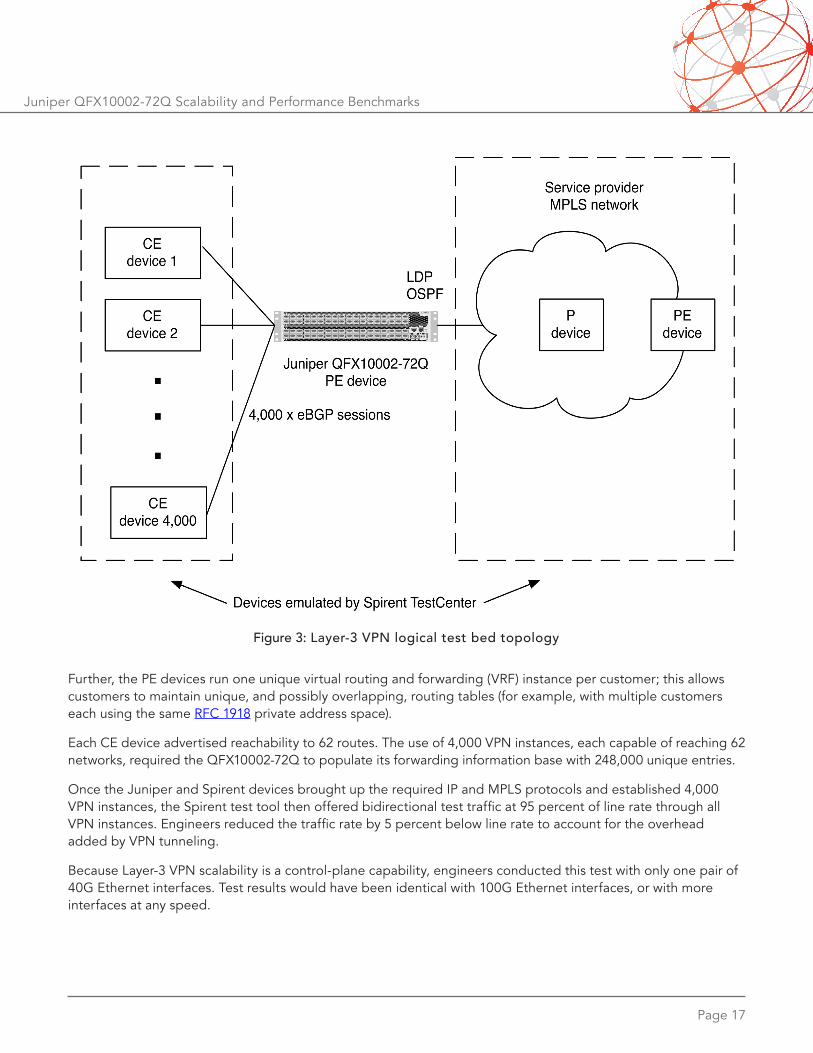
In this scenario, the Juniper QFX10002-72Q acted as a provider edge (PE) device, and the Spirent TestCenter test instrument emulated all other network elements, including customer edge (CE), provider (P), and other PE devices. Figure 3 illustrates the logical test bed topology.
The PE devices ran MP-BGP (multiprotocol BGP), redistributing routes learned from the Layer-3 VPN into the routing tables of the CE devices, which ran BGP. The PE devices also ran the Open Shortest Path First (OSPF) routing protocol and the MPLS Label Distribution Protocol (LDP).
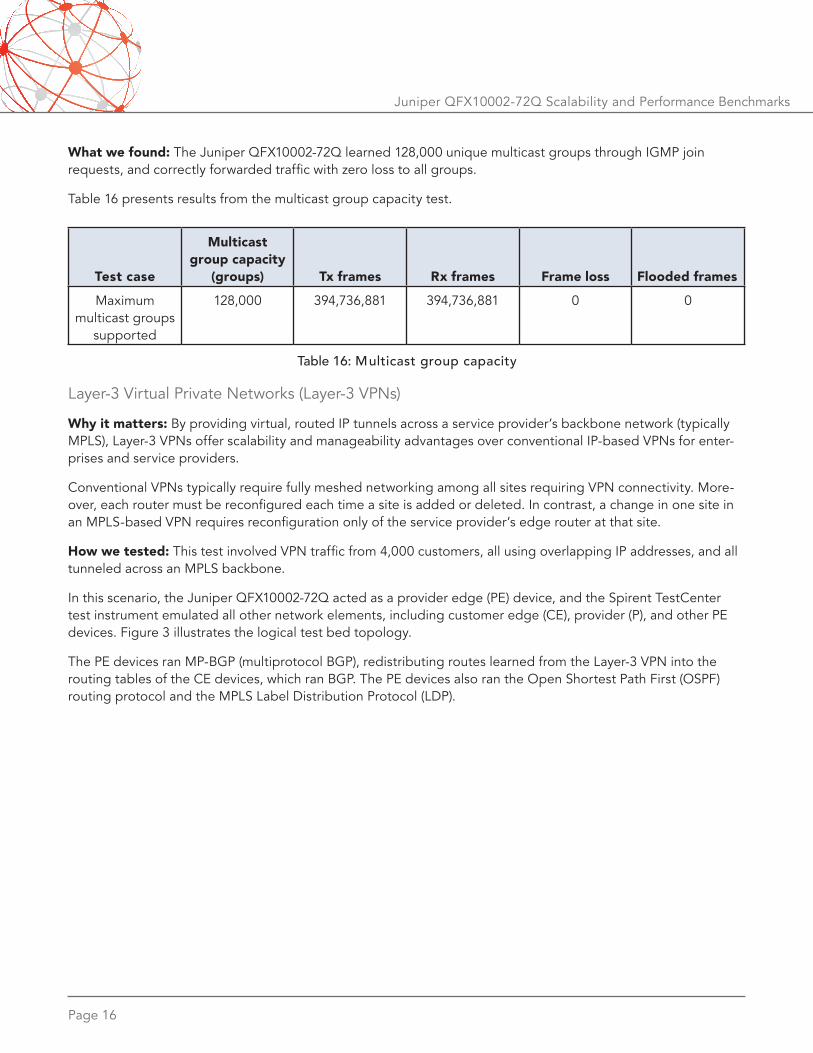
What we found: The Juniper QFX10002-72Q learned 128,000 unique multicast groups through IGMP join requests, and correctly forwarded traffic with zero loss to all groups.
Table 16 presents results from the multicast group capacity test.
Test case
Multicast group capacity
(groups)
Tx frames
Rx frames
Frame loss
Flooded frames
Maximum multicast groups
supported
128,000 394,736,881 394,736,881 0 0
Table 16: Multicast group capacity
Page 17
Juniper QFX10002-72Q Scalability and Performance Benchmarks
Figure 3: Layer-3 VPN logical test bed topology
Further, the PE devices run one unique virtual routing and forwarding (VRF) instance per customer; this allows customers to maintain unique, and possibly overlapping, routing tables (for example, with multiple customers each using the same RFC 1918 private address space).
Each CE device advertised reachability to 62 routes. The use of 4,000 VPN instances, each capable of reaching 62 networks, required the QFX10002-72Q to populate its forwarding information base with 248,000 unique entries.
Once the Juniper and Spirent devices brought up the required IP and MPLS protocols and established 4,000 VPN instances, the Spirent test tool then offered bidirectional test traffic at 95 percent of line rate through all VPN instances. Engineers reduced the traffic rate by 5 percent below line rate to account for the overhead added by VPN tunneling.
Because Layer-3 VPN scalability is a control-plane capability, engineers conducted this test with only one pair of 40G Ethernet interfaces. Test results would have been identical with 100G Ethernet interfaces, or with more interfaces at any speed.
Page 18
Juniper QFX10002-72Q Scalability and Performance Benchmarks
VRF Lite with OSPF and BFD
Why it matters: Virtual routing and forwarding (VRF) allows service providers to maintain multiple routing tables on the same device. Because each routing table is independent, routing entries can overlap, allowing different customers to use the same network space (for example, the same net-10 addresses in IPv4).
Bidirectional forwarding detection (BFD) can detect link faults much faster than many routing protocols, includ-ing Open Shortest Path First (OSPF). For example, by default most OSPF implementations wait 40 seconds (waiting for 3 Hello intervals spaced 10 seconds apart, plus 10 seconds to ensure a Hello interval has actually passed) before detecting a problem with routing state. In contrast, BFD can be configured to send messages every 1 second, or even faster.
How we tested: The objectives of this test were fourfold:
• To verify the Juniper QFX10002-72Q can maintain 4,000 concurrent VRF Lite instances, each bringing up an OSPF adjacency
• To verify the Juniper QFX10002-72Q can forward traffic to 62 networks learned from each OSPF neighbor, for 248,000 routes total
• To verify the Juniper QFX10002-72Q can use BFD in conjunction with VRF Lite
• To determine fault detection time using BFD with 1-second timers
The Spirent TestCenter test instrument emulated 4,000 OSPF neighbors, each advertising 62 routes.
The use of 4,000 VRF Lite instances, each advertising reachability to 62 networks, required the QFX10002-72Q to populate its forwarding information base with 248,000 unique entries.
Once the Juniper and Spirent devices brought up the OSPF adjacencies and established 4,000 VRF Lite and BFD instances, the Spirent test tool then offered bidirectional test traffic at 99 percent of line rate to all networks. Engineers reduced the traffic rate by 1 percent below line rate to account for the overhead added by OSPF and BFD control messages.
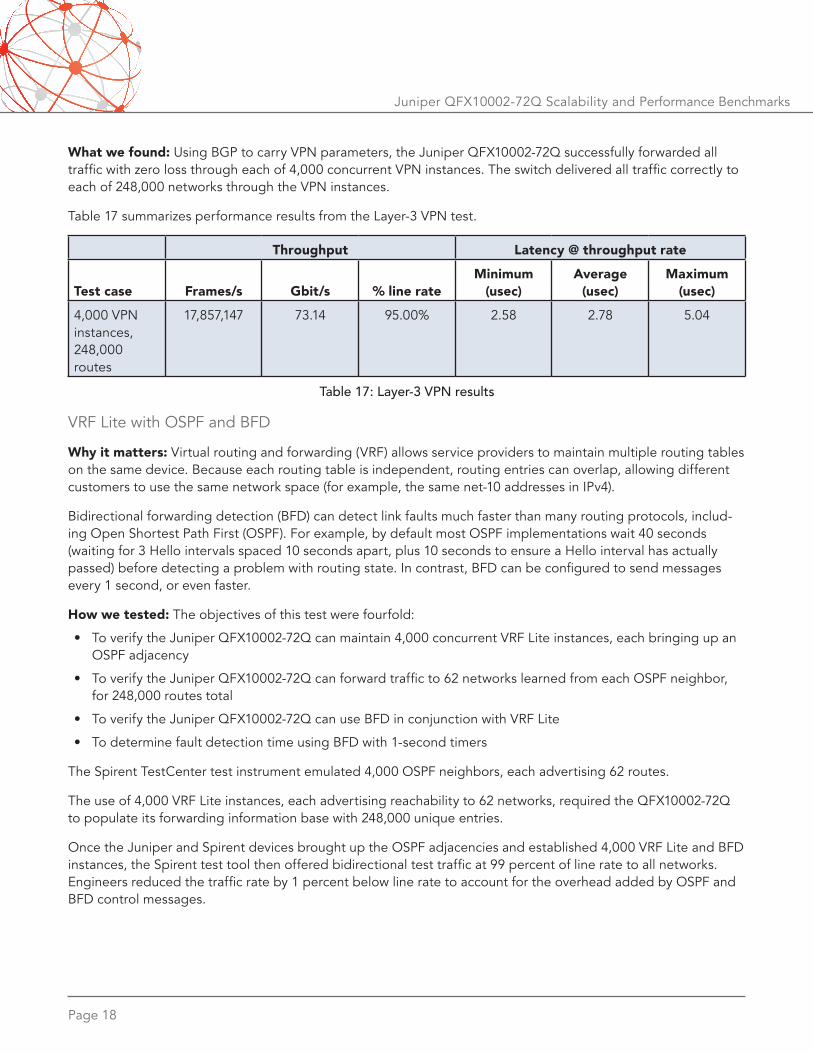
What we found: Using BGP to carry VPN parameters, the Juniper QFX10002-72Q successfully forwarded all traffic with zero loss through each of 4,000 concurrent VPN instances. The switch delivered all traffic correctly to each of 248,000 networks through the VPN instances.
Table 17 summarizes performance results from the Layer-3 VPN test.
Throughput Latency @ throughput rate
Test case
Frames/s
Gbit/s
% line rate
Minimum (usec)
Average (usec)
Maximum (usec)
4,000 VPN instances, 248,000 routes
17,857,147 73.14 95.00% 2.58 2.78 5.04
Table 17: Layer-3 VPN results
Page 19
Juniper QFX10002-72Q Scalability and Performance Benchmarks
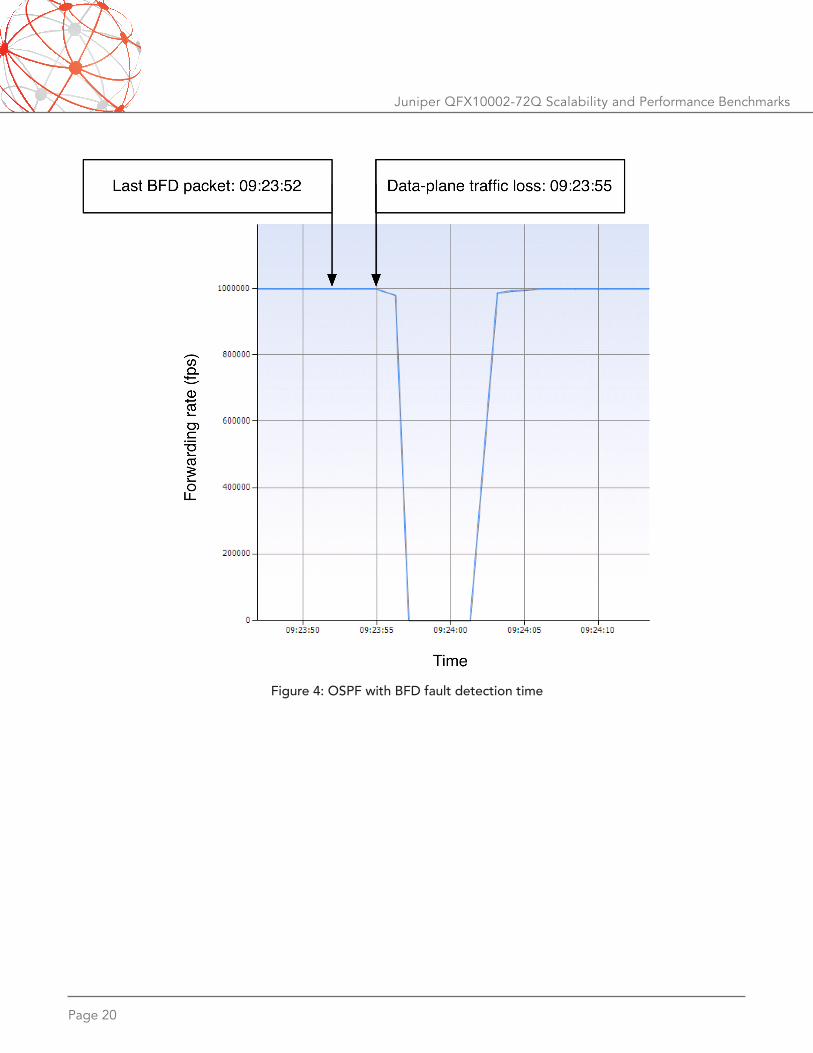
Engineers also measured BFD fault detection time. To do so, engineers configured Spirent TestCenter to offer traffic continuously to one VRF lite instance at a rate of 1 million frames/second while simultaneously capturing control-plane traffic and plotting forwarding rate vs. time. For this test, engineers configured BFD transmit and receive intervals of 1 second. Although this isolated one VRF Lite instance, there were 4,000 concurrent BFD sessions active during the test.
Engineers then disabled the VRF Lite instance’s emulated router on the test instrument, forcing BFD to detect a fault. By correlating the absolute timestamp of the last BFD packet with the time seen in the chart where for-warding rates begin to fall, it is possible to derive fault detection time.
Because VRF Lite and BFD are control-plane capabilities, engineers conducted this test with only one pair of 40G Ethernet interfaces. Test results would have been similar with 100G Ethernet interfaces, or with more interfaces at any speed.
What we found: The Juniper QFX10002-72Q met all four goals of the VRF Lite/BFD link detection test with OSPF:
• It successfully established 4,000 concurrent VRF Lite instances
• It forwarded all traffic without loss to 248,000 unique networks learned through the VRF Lite instances
• It successfully established BFD fault detection sessions on all 4,000 VRF Lite instances
• It successfully detected a link fault within 3 seconds of a router failure using BFD with timers set to 1 second, far faster than the 40 seconds required by OSPF
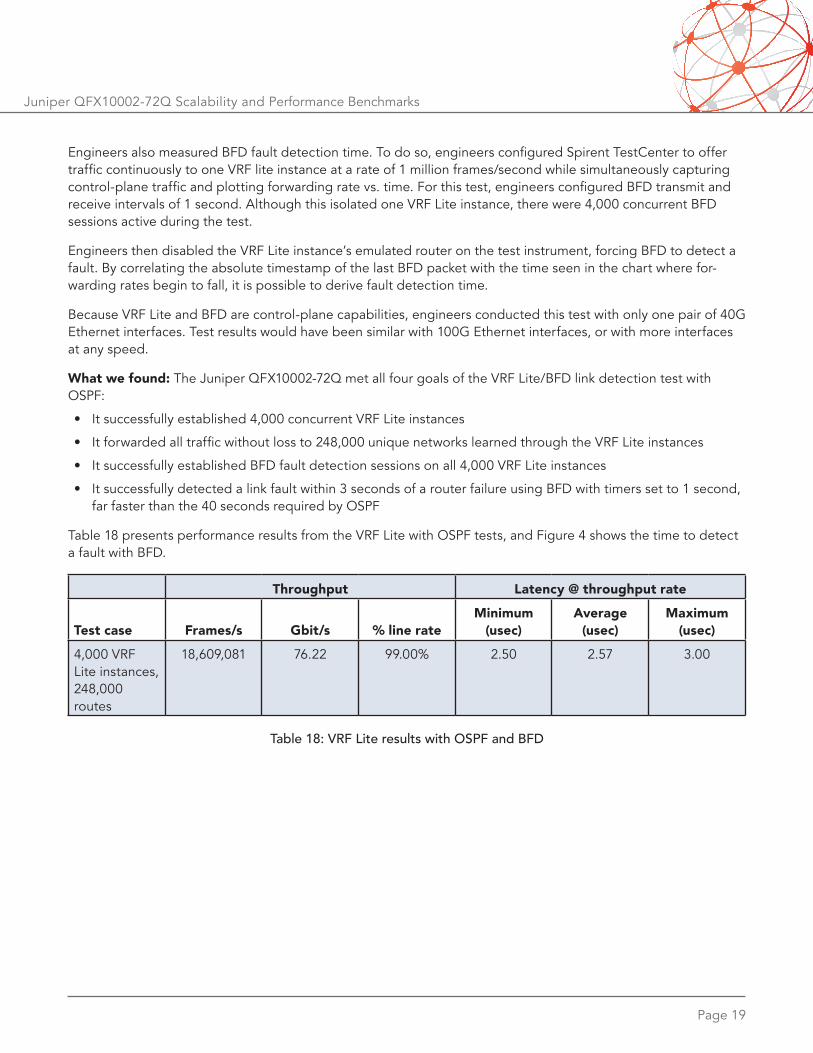
Table 18 presents performance results from the VRF Lite with OSPF tests, and Figure 4 shows the time to detect a fault with BFD.
Throughput Latency @ throughput rate
Test case
Frames/s
Gbit/s
% line rate
Minimum (usec)
Average (usec)
Maximum (usec)
4,000 VRF Lite instances, 248,000 routes
18,609,081 76.22 99.00% 2.50 2.57 3.00
Table 18: VRF Lite results with OSPF and BFD
Page 20
Juniper QFX10002-72Q Scalability and Performance Benchmarks
Figure 4: OSPF with BFD fault detection time
Page 21
Juniper QFX10002-72Q Scalability and Performance Benchmarks
VRF Lite with BGP and BFD
Why it matters: Virtual routing and forwarding (VRF) allows service providers to maintain multiple routing tables on the same device. Because each routing table is independent, routing entries can overlap, allowing different customers to use the same network space (for example, the same net-10 addresses in IPv4).
Bidirectional forwarding detection (BFD) can detect link faults much faster than many routing protocols, includ-ing the Border Gateway Protocol (BGP), which uses a default keepalive timer value of 60 seconds.
How we tested: The objectives of this test were fourfold:
• To verify the Juniper QFX10002-72Q can maintain 4,000 concurrent VRF Lite instances, each bringing up a BGP peering session
• To verify the Juniper QFX10002-72Q can forward traffic to 62 networks learned from each BGP neighbor, for 248,000 routes total
• To verify the Juniper QFX10002-72Q can use BFD in conjunction with VRF Lite
• To determine fault detection time using BFD with 1-second timers
The Spirent TestCenter test instrument emulated 4,000 BGP peers, each advertising 62 routes. The use of 4,000 VRF Lite instances, each advertising reachability to 62 networks, required the QFX10002-72Q to populate its forwarding information base with 248,000 unique entries.
Once the Juniper and Spirent devices brought up the BGP routing sessions and established 4,000 VRF Lite and BFD instances, the Spirent test tool then offered bidirectional test traffic at 99 percent of line rate to all net-works. Engineers reduced the traffic rate by 1 percent below line rate to account for the overhead added by BGP and BFD control messages.
Engineers also measured BFD fault detection time. To do so, engineers configured Spirent TestCenter to offer traffic continuously to one VRF lite instance at a rate of 1 million frames/second while simultaneously capturing control-plane traffic and plotting forwarding rate vs. time. For this test, engineers configured BFD transmit and receive intervals of 1 second. Although this isolated one VRF Lite instance, there were 4,000 concurrent BFD sessions during the test.
Engineers then disabled the VRF Lite instance’s emulated router on the test instrument, forcing BFD to detect a fault. By correlating the absolute timestamp of the last BFD packet with the time seen in the chart where for-warding rates begin to fall, it is possible to derive fault detection time.
Because VRF Lite and BFD are control-plane capabilities, engineers conducted this test with only one pair of 40G Ethernet interfaces. Test results would have been identical with 100G Ethernet interfaces, or with more interfaces at any speed.
What we found: The Juniper QFX10002-72Q met all four goals of the VRF Lite/BFD link detection test with BGP:
• It successfully established 4,000 concurrent VRF Lite instances using BGP
• It forwarded all traffic without loss to 248,000 unique networks learned through the VRF Lite instances
• It successfully established BFD fault detection sessions on all 4,000 VRF Lite instances
• It successfully detected a link fault within 3 seconds of a router failure using BFD with timers set to 1 second, far faster than the minimum of 60 seconds required by BGP
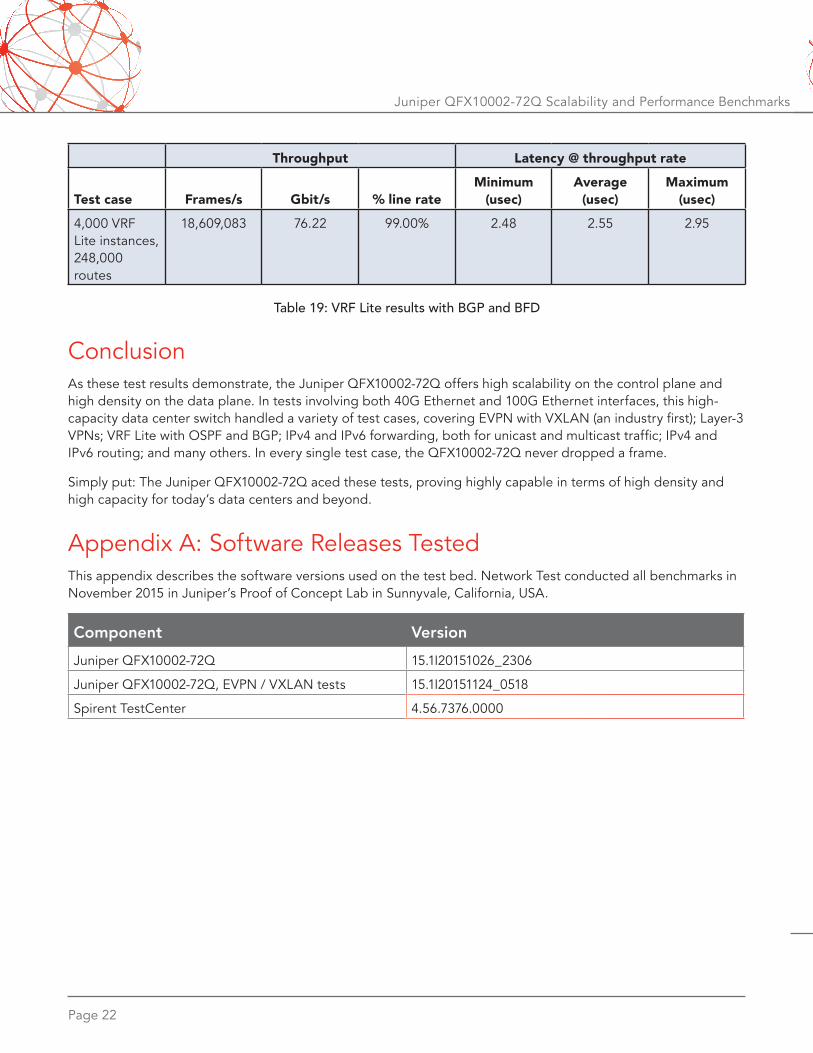
Table 19 presents performance results from the VRF Lite with BGP tests.
Page 22
Juniper QFX10002-72Q Scalability and Performance Benchmarks
ConclusionAs these test results demonstrate, the Juniper QFX10002-72Q offers high scalability on the control plane and high density on the data plane. In tests involving both 40G Ethernet and 100G Ethernet interfaces, this high-capacity data center switch handled a variety of test cases, covering EVPN with VXLAN (an industry first); Layer-3 VPNs; VRF Lite with OSPF and BGP; IPv4 and IPv6 forwarding, both for unicast and multicast traffic; IPv4 and IPv6 routing; and many others. In every single test case, the QFX10002-72Q never dropped a frame.
Simply put: The Juniper QFX10002-72Q aced these tests, proving highly capable in terms of high density and high capacity for today’s data centers and beyond.
Appendix A: Software Releases TestedThis appendix describes the software versions used on the test bed. Network Test conducted all benchmarks in November 2015 in Juniper’s Proof of Concept Lab in Sunnyvale, California, USA.
Throughput Latency @ throughput rate
Test case
Frames/s
Gbit/s
% line rate
Minimum (usec)
Average (usec)
Maximum (usec)
4,000 VRF Lite instances, 248,000 routes
18,609,083 76.22 99.00% 2.48 2.55 2.95
Table 19: VRF Lite results with BGP and BFD
Component VersionJuniper QFX10002-72Q 15.1I20151026_2306
Juniper QFX10002-72Q, EVPN / VXLAN tests 15.1I20151124_0518
Spirent TestCenter 4.56.7376.0000
Network Test Inc.31324 Via Colinas, Suite 113 • Westlake Village, CA 91362-6761 • USA+1-818-889-0011 • http://networktest.com • [email protected]
Version 2015121403. Copyright © 2015 Network Test Inc. All rights reserved.
Juniper QFX10002-72Q Scalability and Performance Benchmarks
About Network TestNetwork Test is an independent third-party test lab and engineering services consultancy. Our core competencies are performance, security, and conformance assessment of networking equipment and live networks. Our clients include equipment manufacturers, large enterprises, service providers, industry consortia, and trade publications.
DisclaimerNetwork Test Inc. has made every attempt to ensure that all test procedures were conducted with the utmost precision and accuracy, but acknowledges that errors do occur. Network Test Inc. shall not be held liable for damages which may result for the use of information contained in this document. All trademarks mentioned in this document are property of their respective owners.