jupai holdings ltd nyse:...
TRANSCRIPT

Jupai Holdings Ltd(NYSE: JP)
Q4 2018

Disclaimer
The information in this presentation is provided to you by Jupai Holdings Limited (the “Company”) pursuant to Section 5(d) of the U.S. Securities Act of 1933, as amended (the “Securities Act”), solely forinformational purposes and is not an offer to buy or sell, or a solicitation of an offer to buy or sell, any security or instrument of the Company, or to participate in any investment activity or trading strategy, nor may itor any part of it form the basis of or be relied on in connection with any contract or commitment whatsoever, in the United States or anywhere else. The information included herein was obtained from varioussources, including certain third parties, and has not been independently verified.
By viewing or participating in this presentation, you acknowledge and agree that (i) the information contained in this presentation, the Company’s contemplated initial public offering and any related discussionbetween you and the Company are each strictly confidential, (ii) the information contained in this presentation is intended for the recipient of this information only and shall not be disclosed, reproduced or distributedin any way to anyone else, (iii) no part of this presentation or any other materials provided in connection herewith may be copied, retained, taken away, reproduced or redistributed following this presentation, and (iv)all participants must return all materials provided in connection herewith to the Company at the completion of the presentation. By viewing, accessing or participating in this presentation, you agree to be bound bythe foregoing limitations.
You further represent to us that you are a “qualified institutional buyer” as such term is defined under Rule 144A under the Securities Act, whether you are in the United States or outside of the United States.
No securities of the Company may be sold in the United States without registration with the United States Securities and Exchange Commission (“SEC”) or an exemption from such registration. Any decision topurchase securities in the proposed offering should be made solely on the basis of the information contained in the registration statement on Form F-1 filed by the Company on [July 6, 2015], including withoutlimitation the prospectus contained therein. Such prospectus contains all material information in respect of any securities offered thereby and any decision to invest in such securities should be made solely inreliance on such prospectus. The prospectus is available at the website of the SEC and may be obtained from the potential underwriters participating in such offer or the Company upon such publication. Thispresentation does not contain all relevant information relating to the Company or its securities, particularly with respect to the risks and special considerations involved with an investment in the securities of theCompany, and these materials are qualified in their entirety by reference to the detailed information appearing in the statutory prospectus. This presentation does not constitute a “prospectus” within the meaning ofthe Securities Act. The Company is not making any offer of its securities at this time, and cannot accept orders for any securities at this time.
This presentation does not constitute legal, regulatory, accounting or tax advice to you. We recommend that you seek independent third party legal, regulatory, accounting and tax advice regarding the contents ofthis document. This presentation does not constitute and should not be considered as any form of financial opinion or recommendation by the Company or any other party.
No representations, warranties or undertakings, express or implied, are made and no reliance should be placed on the accuracy, fairness or completeness of the information, sources or opinions presented orcontained in this presentation. By viewing or accessing the information contained in this presentation, the recipient hereby acknowledges and agrees that neither the Company nor any of the underwriters orrepresentatives of the Company accepts any responsibility for or makes any representation or warranty, express or implied, with respect to the truth, accuracy, fairness, completeness or reasonableness of theinformation contained in, and omissions from, these materials and that neither the Company nor any of its affiliates, advisers, underwriters or representatives accepts any liability whatsoever for any loss howsoeverarising from any information presented or contained in these materials. The information presented or contained in this presentation is subject to change without notice and its accuracy is not guaranteed.
This presentation contains statements that constitute forward-looking statements. These statements include descriptions regarding the intent, belief or current expectations of the Company or its officers about thefuture. Such forward-looking statements are not guarantees of future performance and involve risks and uncertainties, and actual results may differ materially from those in the forward-looking statements as a resultof various factors and assumptions, many of which are beyond the Company’s control. Neither the Company nor any of its affiliates, advisors, representatives or underwriters has any obligation to, nor do any ofthem undertake to, revise or update the forward-looking statements contained in this presentation to reflect future events or circumstances. Any failure to comply with these limitations may constitute a violation ofapplicable securities laws.
This presentation speaks as of April 23, 2019. Neither the delivery of this presentation nor any further discussion of the Company or any of its affiliates, shareholders, directors, employees, agents or advisors withany of the recipients shall, under any circumstances, create any implication that there has been no change in the affairs of the Company since that date.

2.07
3.88
2015 2020
50
102
2015 2020
The Number of HNW Households Will Reach 3.88 mn by 2020
The Investable Assets of HNW Households Grow Rapidly
Source: CIB, BCG Global Wealth Database
Definition of HNW Households: with more than RMB 6mil of investable assets. 1
The Potential of Wealth Management Market in ChinaSteady Growth Rates in the Number of HNW Households & Their Investable Assets
RMB Trillion
Million Households
It is estimated that Chinese HNW households will grow rapidly during 2015-2020 and will reach 3.88 million by 2020
2
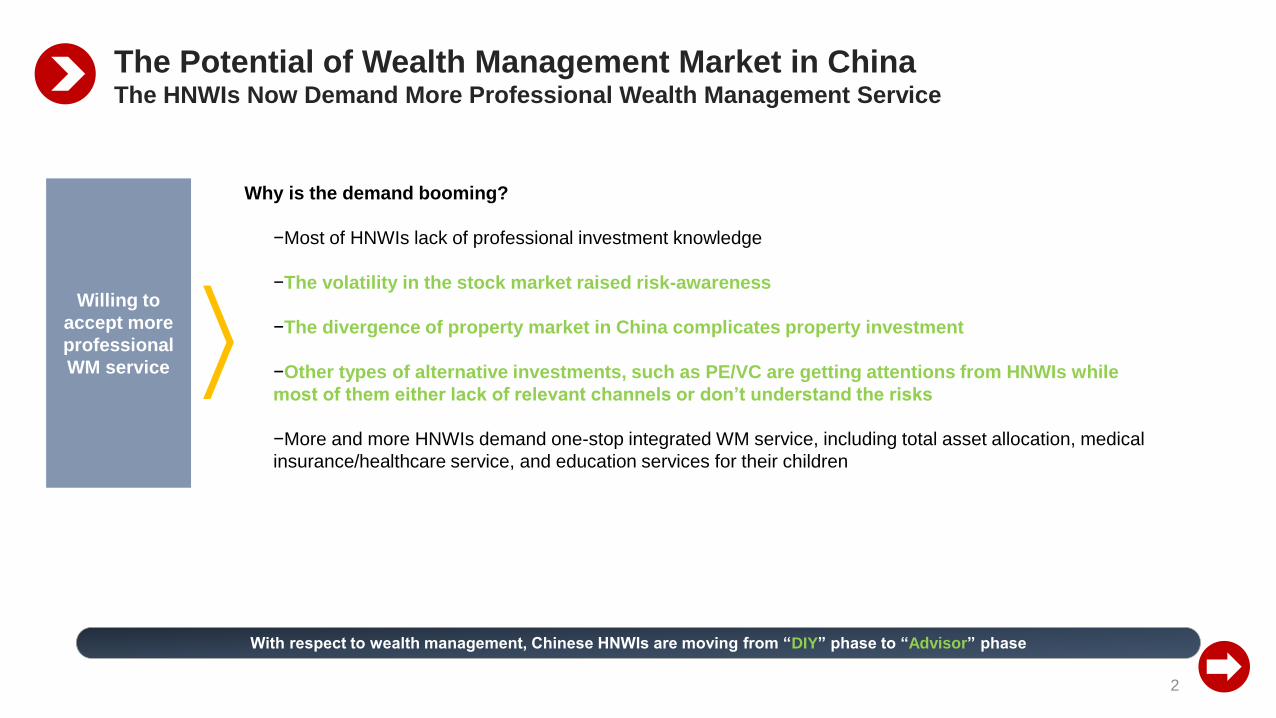
With respect to wealth management, Chinese HNWIs are moving from “DIY” phase to “Advisor” phase
Why is the demand booming?
−Most of HNWIs lack of professional investment knowledge
−The volatility in the stock market raised risk-awareness
−The divergence of property market in China complicates property investment
−Other types of alternative investments, such as PE/VC are getting attentions from HNWIs while
most of them either lack of relevant channels or don’t understand the risks
−More and more HNWIs demand one-stop integrated WM service, including total asset allocation, medical
insurance/healthcare service, and education services for their children
The Potential of Wealth Management Market in ChinaThe HNWIs Now Demand More Professional Wealth Management Service
Willing to
accept more
professional
WM service

Source: “2017 China Private Wealth Report” by China Merchants Bank and Bain & Company
Heading-Century Report, Financial Planning Standards Board(China) website
More Market
Share
Features of third party wealth management firms
−Provide clients with customized wealth management solutions
The market share of third party wealth management firms
in China
−The market share of 3rd Party WM firms in the US: ~60%
−The market share of 3rd Party WM firms in UK: ~55%
−The China market of third party wealth management showing high growth potential
3
The wealth management market in China is characterized as fragmented, and high growth potential
The Potential of Wealth Management Market in ChinaGaining More Market Share
0%
20%
40%
60%
80%
100%
2009 2011 2013 2015 2017
Joint-stock commercial banks Four state-owned banks
Foreign private banks Independent wealth managers

4
Jupai – Leveraging China's Booming WM MarketEvents and Vision

5
Jupai – Leveraging China's Booming WM Market
Source: Company information.
(1) Calculation method for the client repeat purchase rate: number of active clients that repeatedly purchase the Company’s products divided by the number of active clients in the relevant period. For example, the repeat purchase rate of 52.1% in
2015 reflects not only the active clients who purchased the products more than once in 2015, but also the active clients who purchased the products prior to 2015 and purchased the products once in 2015.
Wealth Management Product Transaction Value (RMB¥mn) Number of Active Clients
Average transaction value per client (RMB¥’000) Repeat purchase rate(1)
1,0902,122
4,678
8,572
10,218
12,825
8,638
2012 2013 2014 2015 2016 2017 2018
2,784
7,590
13,292
28,418
45,299
54,316
30,273
2012 2013 2014 2015 2016 2017 2018
2,554 3,577 2,841 4,2353,315 4,433 3,505 21.4% 34.4% 41.8% 52.1% 55.6% 60.9% 73.5%

3.8 13.6 142.4
260.6 363.7
435.5
2013 2014 2015 2016 2017 2018
6
Recurring income (including management fees & service fees) outgrew one-time commissions and will still be the trend
Source: Company information.
(1) Jupai's non-GAAP financial measures are derived from adjusting the corresponding GAAP financial measures by excluding the effects of share-based compensation, amortization of intangible assets resulted from business acquisitions,
impairment loss of investment in affiliates and impairment loss of goodwill.
Net Revenue(RMB¥)
Net Income Attributable to Ordinary Shareholders(RMB¥mn)
The Breakdown of Net Revenue(RMB¥mn)
As of December 31, 2018 AUM: ~RMB56.8billion
One-time commissions
The Main Components of Net Revenue(RMB¥mn)Net Revenue(RMB¥mn)
Non-Gaap (1) Net Income Attributable to Ordinary Shareholders(RMB¥mn)
Recurring management fees have been growing rapidly
Jupai – Leveraging China's Booming WM Market
Recurring management fees
134.6 212.3336.5
633.2
1,038.7
737.5
2013 2014 2015 2016 2017 2018
52.1 138.9 237.7
595.0
1,127.7
1,706.2
1,321.7
2012 2013 2014 2015 2016 2017 2018
25.156.7 44.6
175.5
243.0
454.0
13.0
2012 2013 2014 2015 2016 2017 2018
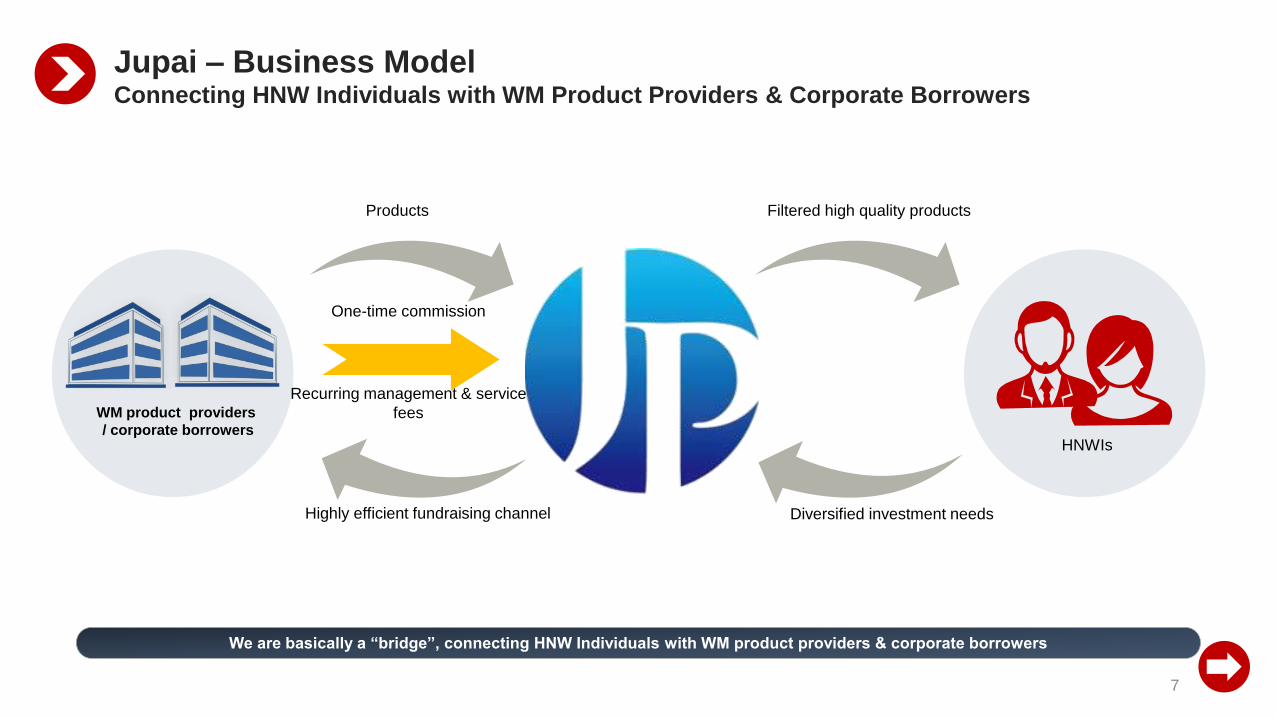
WM product providers
/ corporate borrowersHNWIs
Filtered high quality productsProducts
Diversified investment needsHighly efficient fundraising channel
Recurring management & service
fees
One-time commission
7
We are basically a “bridge”, connecting HNW Individuals with WM product providers & corporate borrowers
Jupai – Business ModelConnecting HNW Individuals with WM Product Providers & Corporate Borrowers

Source: Company information.
(1) Data as of Dec.31, 2018.
Client service team (1) :
Relationship Managers:384; Business Development Advisors: 798
Industry recognized qualifications and 8 years of industry experience on average
Product development team(1):
264 persons with experience in fund development/management and real estate industry
After merging with E-House Capital, we gain talents with expertise in PE funds
Employee training:
Efficient job training: Relationship Managers serve as “mentors” to Business Development Advisors
Organize various staff training projects
Client care unit (Gardener)
Business Development Advisors (Hunter) Relationship Managers (Farmer)
Perform ongoing client relationship management
Conduct regular client satisfaction surveys
Develop further business opportunities based on client needs
Arrange one-on-one client meetings
Analyze clients’ risk preference
Provide customized wealth management product advisory service
Recommend suitable products
Serve as initial point of contact with potential clients
Introduce Jupai’s wealth management products and related services
Obtain a preliminary understanding of clients’ wealth management needsand targets
Arrange advisory appointments
HNWIs
Dedicated and professional team A “one-stop” wealth management product platform for clients
8
Our customized client services are provided by a dedicated client relationship team with rich industry knowledge and experience
Jupai – Business ModelService Model : Hunter – Farmer – Gardener
Source: Company information and Heading-Century report. “2017 China Private Wealth Report” by China Merchants Bank and Bain & Company
Extensive network strategically targeting HNWIs:
(As of Dec.31,2018)
76 wealth management centers in 50 cities in China and overseas
Covers Bohai Rim, Yangtze River Delta and Pearl River Delta region
Over 80% of China’s HNWIs live in these three regions
384 relationship managers and 798 business development advisors
Prudent market expansion strategies:
Carefully choose new markets: focus on areas concentrated with HNWIs, with strong growth potential and a sufficient supply of talents in related industries
Conduct in-depth due diligence and market research before entering a specific market
Comprehensive preparations enable us to build and start operating a new wealth management center within 4 months
The number of investable assets of more than RMB10 million in 2016 >100,000
The number of investable assets of more than RMB10 million in 2016 >50,000, ≤100,000
The number of investable assets of more than RMB10 million in 2016 >30,000, ≤50,000
Pearl River Delta
Shenzhen(2)
Xiamen(3)
Ningbo(2)
Hangzhou(3)
Shanghai(5)
Suzhou(2)
Nanjing(1)
Wuhan(1)
Chongqing(2)
Chengdu(3)
Tianjin(3)
Beijing(3)
Shenyang(1)
Yangtze River Delta
Bohai Rim
Guangzhou(3)
Qingdao(2)
Nantong (1)
Changzhou(1)
9
Our extensive network coverage focuses on increasing direct exposure to HNWIs in China
Qidong(1)
Jupai – Business ModelExtensive Network
Hongkong(2)

10
Classified
Financial
Institution
Systematic
Risk
Issuer
Credit
Risk
Issuer Self-
Management
Capability
Project
Systematic
RiskProject
Collateral
Project
Default
Risk in
Extremity
Jupai – Risk Management System
Evaluation
Client Overall Asset Management
Client risk tolerance; Whether client’s risk preference is acceptable?
Does client’s risk exposure matches his/her investment target/profile?
Overall Asset Allocation
Is it within client’s risk response acceptable range?
Does it match with client’s short-, medium-, and long-term financial targets?
Is it within client’s risk tolerance?
Is it within Jupai’s overall risk tolerance?
Investor Risk Assessment (C1-C5)
Line of credit control for single counterpart entity
Differentiated management of transaction
counterparts
Equity products can only be categorized into R4/R5
Investors are only allowed to purchase products
with risk level at par or below his/her risk
tolerance level
When purchasing high-risk products, investor’s
investment capability needs to be qualified
Whitelist Partner System
PE funds, secondary markets, external products introduction, service institutions whitelist system
Jupai Overall Asset Management
Whether the risk structure of Jupai’s overall asset management is appropriate.
Source: Company information.
Comprehensive Risk Management System
Product Risk Assessment (R1-R5) Investor Risk Assessment (C1-C5)
Whitelist Partner System

Rigorous Product Screening
11
New products need to go through three committees. In 2015, over 2,000 products were analyzed and only 145 products were launched
Jupai – Risk Management SystemRigorous Product Screening from Three Committees
Source: Company information.
Product ManagerRisk Management Committee
of Asset Management
Risk Management Committee
of Jupai Holdings
Product Initiation
Review
Initiation
Final Review at Group
Level
Review at Asset
Management Level
Abort Product
Revise/Submit
More Data
Review
Revise/Submit
More Data
Review
Revise/Submit
More Data
Information Gathering
Research
Product Solutions
Product
Release
Initiation
Application
Abort Product Abort Product
Internal Product
Committee of Subsidiaries
Post Investment Management
12
We continue to monitor closely the products after release and reserve the right to abort the project
Jupai – Risk ManagementPost Investment Management
Source: Company information.

13
What’s Driving Our Growth – Experienced Management TeamOverview of Management Team
Source: Company information.
Our management team members have over 15 years of industry experience on average, most of whom previously worked at private banking divisions of international banks
Mr. Jianda NI
Chairman and CEO
Mr. Xin ZHOU
Director
Ms. Min LIU
CFOMs. Linda Wong
COO
As of Dec.31, 2018.
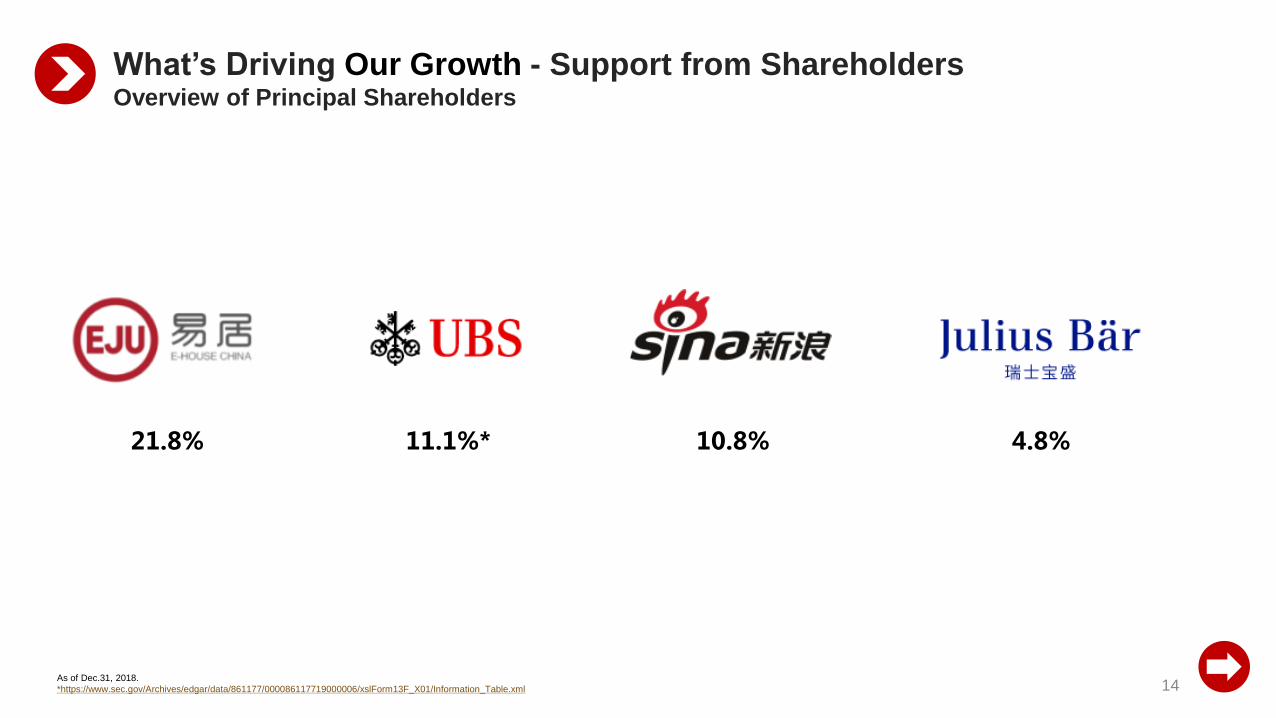
*https://www.sec.gov/Archives/edgar/data/861177/000086117719000006/xslForm13F_X01/Information_Table.xml 14
10.8% 4.8%21.8%
What’s Driving Our Growth - Support from ShareholdersOverview of Principal Shareholders
11.1%*

Fixed Income
Products , 28%
Other PE/VC
Funds , 5%Real Estate
PE/VC Funds ,
58%
Public Market
Funds , 4%
Others , 5%
Real Estate
Fixed Income
Products , 29%
Other Fixed
Income
Products , 6%
PE/VC Funds ,
60%
Public Market
Funds , 3%
Others , 2%
2014年
15
Jupai offers product that better satisfies clients’ asset allocation needs, including self-developed products
What’s Driving Our Growth – Diversified Product CategoriesWide Range of Product Offering with Leading Industry Partners
Source: Company information.
2018 – WM: RMB30.3billion
PE/VC Funds: 63%
2018.12.31 – AUM: RMB56.8billion
PE/VC Funds: 60%
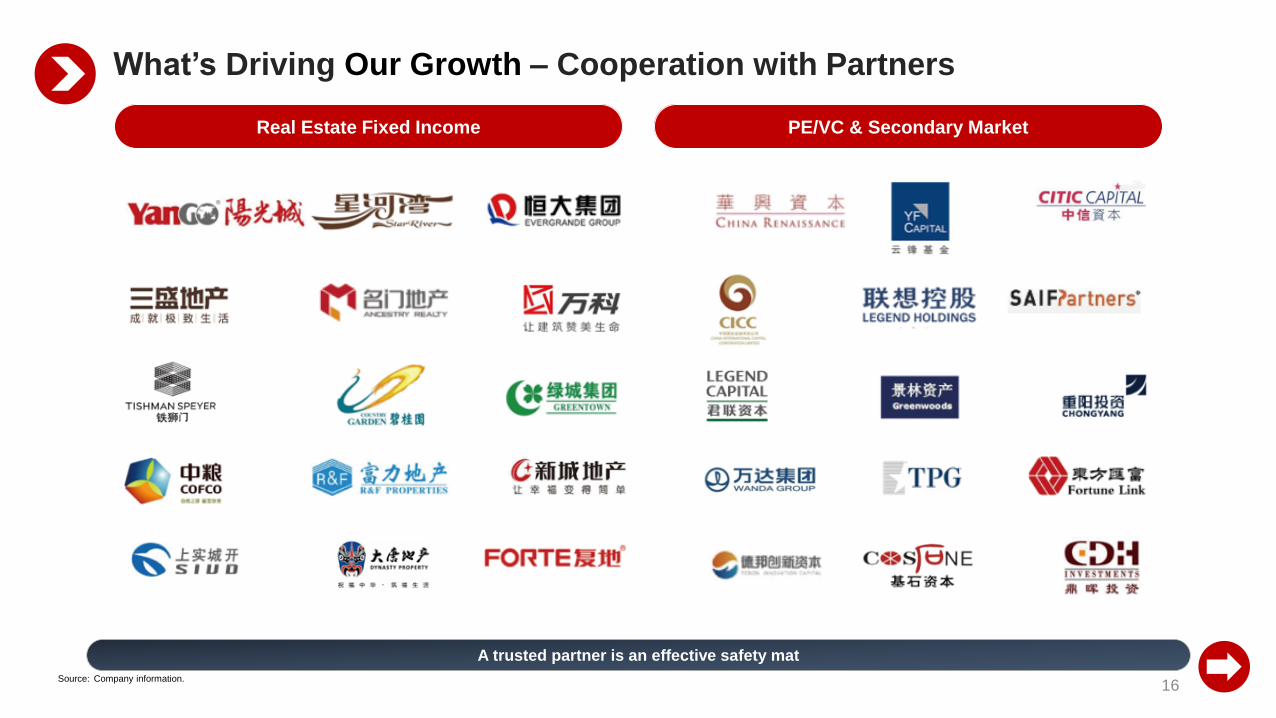
A trusted partner is an effective safety mat
16
Real Estate Fixed Income PE/VC & Secondary Market
2013年2014
What’s Driving Our Growth – Cooperation with Partners
Source: Company information.
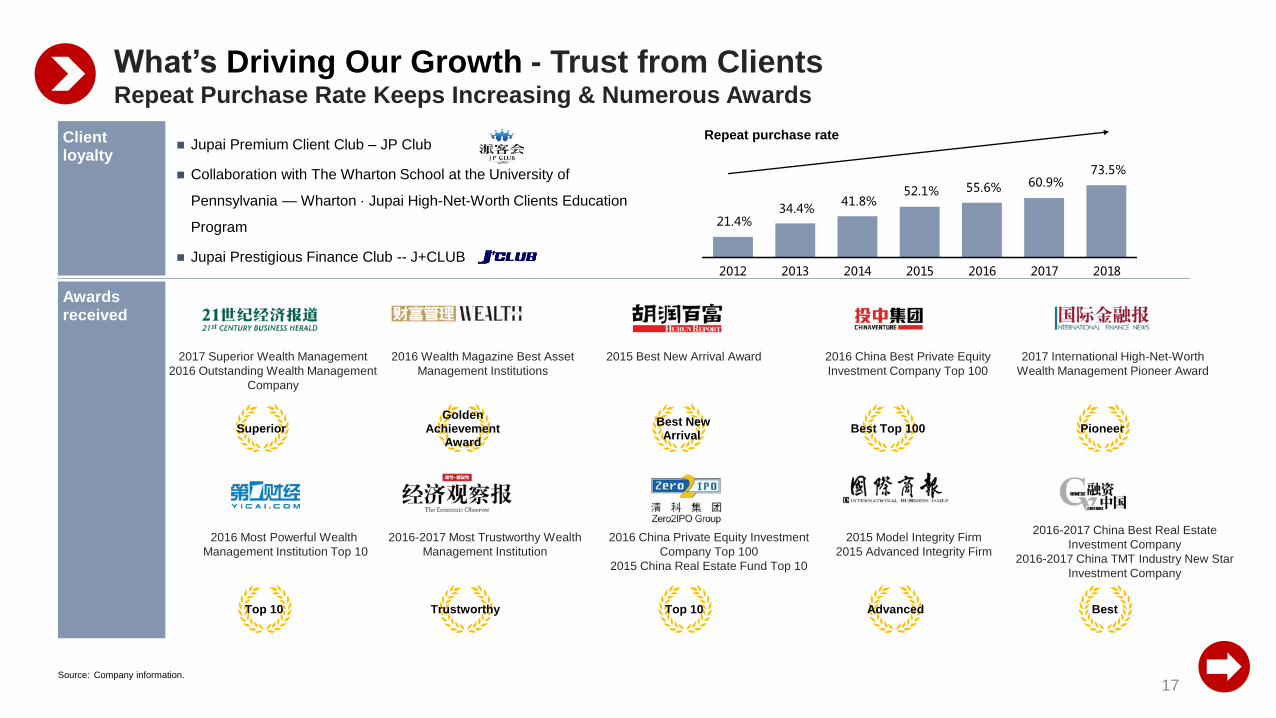
Client loyalty
Jupai Premium Client Club – JP Club
Collaboration with The Wharton School at the University of
Pennsylvania — Wharton · Jupai High-Net-Worth Clients Education
Program
Jupai Prestigious Finance Club -- J+CLUB
Awards received
17
Repeat purchase rate
What’s Driving Our Growth - Trust from ClientsRepeat Purchase Rate Keeps Increasing & Numerous Awards
2017 Superior Wealth Management
2016 Outstanding Wealth Management
Company
Superior
2016 Most Powerful Wealth
Management Institution Top 10
Top 10
2016 Wealth Magazine Best Asset
Management Institutions
Golden Achievement
Award
2016-2017 Most Trustworthy Wealth
Management Institution
Trustworthy
2015 Best New Arrival Award
Best New Arrival
2016 China Private Equity Investment
Company Top 100
2015 China Real Estate Fund Top 10
Top 10
2016 China Best Private Equity
Investment Company Top 100
Best Top 100
2015 Model Integrity Firm
2015 Advanced Integrity Firm
Advanced
2017 International High-Net-Worth
Wealth Management Pioneer Award
Pioneer
2016-2017 China Best Real Estate
Investment Company
2016-2017 China TMT Industry New Star
Investment Company
Best
Source: Company information.
21.4% 34.4%
41.8% 52.1% 55.6% 60.9%
73.5%
2012 2013 2014 2015 2016 2017 2018
Thank you!

18
Layout inside and outside
of China
Get through the financial
value chain
Mainland China
· Qualified Private Fund Manager
· Fund Distribution
·Insurance Brokerage
·Financial Leasing
Hong Kong
·Dealing in Securities (#1)
·Advising in Securities (#4)
·Asset Management (#9)
·Insurance Brokerage
Appendix 1 – Licenses and Certifications

19
Maximized benefit through synergy
Significant growth in business scale: Further boosts the capability of Jupai’s asset management business
Greater access to market information:
Direct contact with real estate developers enables us to:
Regular cooperation with E-House’s real estate sales agency business
Full access to CRIC – wholly-owned subsidiary of E-House and the largest real estate data-center in China
Distribute more attractive and differentiated self-developed wealth management products
Minimize intermediate layers and associated expenses to maximize benefits for clients
Appendix 2 – The Synergy Brought by E-House
20
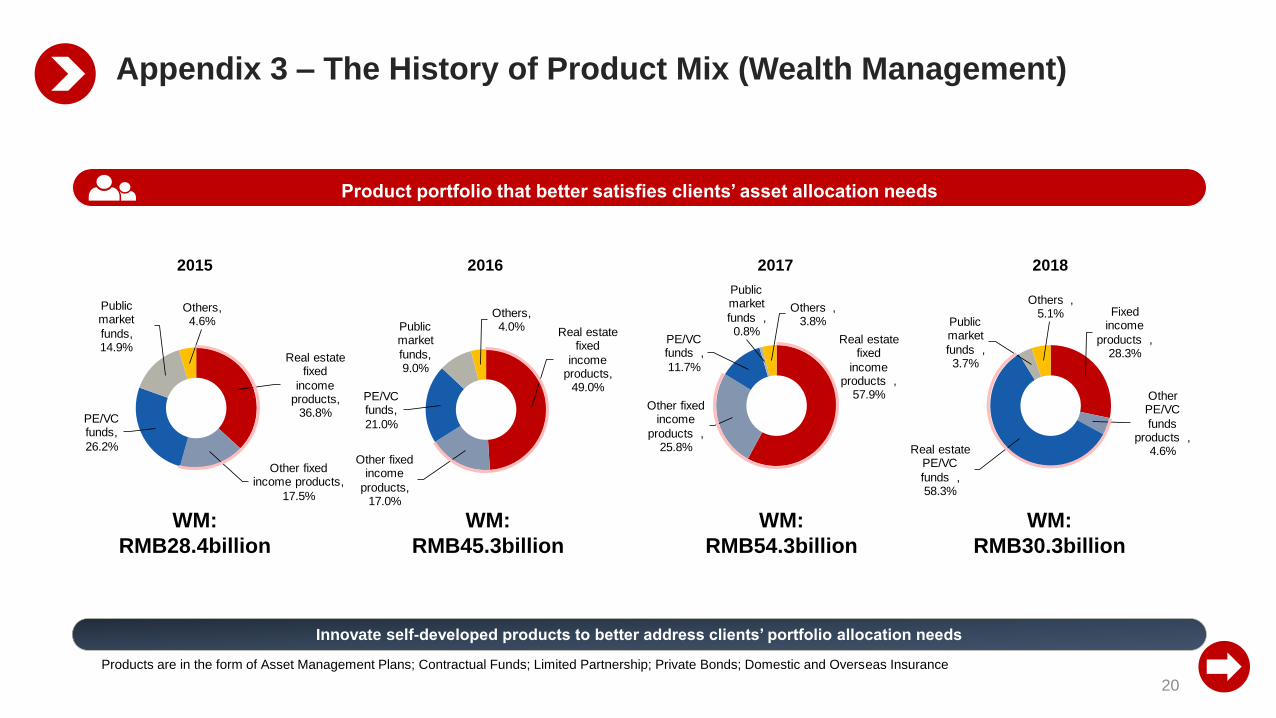
Innovate self-developed products to better address clients’ portfolio allocation needs
Product portfolio that better satisfies clients’ asset allocation needs
Products are in the form of Asset Management Plans; Contractual Funds; Limited Partnership; Private Bonds; Domestic and Overseas Insurance
Appendix 3 – The History of Product Mix (Wealth Management)
Fixed income
products , 28.3%
Other PE/VC
funds products ,
4.6% Real estate PE/VC
funds , 58.3%
Public market
funds , 3.7%
Others , 5.1%
2018
WM:
RMB30.3billion
Real estate fixed
income products,
36.8%
Other fixed income products,
17.5%
PE/VC funds,
26.2%
Public market
funds, 14.9%
Others, 4.6%
Real estate fixed
income products,
49.0%
Other fixed income
products, 17.0%
PE/VC funds,
21.0%
Public market
funds, 9.0%
Others, 4.0%
Real estate fixed
income products ,
57.9% Other fixed
income
products , 25.8%
PE/VC funds ,
11.7%
Public market
funds , 0.8%
Others , 3.8%
2017
WM:
RMB54.3billion
2015
WM:
RMB28.4billion
2016
WM:
RMB45.3billion