jupiter, florida 33458, usa...1 supplementary information for quantitative structural assessment of...
TRANSCRIPT

1
Supplementary Information for Quantitative Structural Assessment of Graded Receptor Agonism Jinsai Shanga, Richard Brusta, Patrick R. Griffina,b, Theodore M. Kameneckab, and Douglas J. Kojetina,b,1
a Department of Integrative Structural and Computational Biology, The Scripps Research Institute, Jupiter, Florida 33458, USA b Department of Molecular Medicine, The Scripps Research Institute, Jupiter, Florida 33458, USA 1 Correspondence should be addressed to D.J.K. ( e-mail: [email protected] ) This PDF file includes:
Supplementary text (SI Materials and Methods) Figures S1 to S10 Table S1 Legend for Dataset S1 SI References
Other supplementary materials for this manuscript include the following:
Dataset S1
www.pnas.org/cgi/doi/10.1073/pnas.1909016116

2
Supplementary Information Text
SI Methods Materials and reagents. The TZD ligand series includes Ciglitazone, Darglitazone, Edaglitazone, Pioglitazone, Rosiglitazone, Troglitazone, Netoglitazone (MCC-555), Mitoglitazone (CAY10415, MSDC-0160), CAY10506, and CAY10638. The structurally diverse ligand set includes natural/endogenous PPARγ ligands (arachidonic acid, decanoic acid, docosahexaenoic acid, dodecanoic acid, linoleic acid, nonanoic acid, oleic acid, palmitoleic acid) and synthetic ligands (BVT.13, GQ-16, GW1929, MRL20, MRL24, nTZDpa, SR1663). All ligands except MRL20 and SR1663 were obtained from commercial sources, including BioVision (MRL24), Cayman Chemical, Sigma-Aldrich, and Tocris Bioscience; MRL20 (1-4) and SR1663 (5) were synthesized and characterized previously. A peptide containing an LXXLL nuclear receptor interaction motif from TRAP220/MED1/DRIP205 (residues 638–656; NTKNHPMLMNLLKDNPAQD) was synthesized with an N-terminal FITC label with a six-carbon linker (Ahx) and an amidated C-terminus for stability by LifeTein, or with an N-terminal biotin label by Anaspec. TR-FRET coregulator recruitment and ligand displacement assays. Time-resolved fluorescence resonance energy transfer (TR-FRET) assays were performed in black 384-well plates (Greiner) with 23 μL final well volume. For the coregulator recruitment assay, each well containing 4 nM 6xHis-PPARγ LBD, 1 nM LanthaScreen Elite Tb-anti-His Antibody (ThermoFisher), and 400 nM FITC-labeled TRAP220 peptide (or as noted in SI Appendix, Fig. S1) in a buffer containing 20 mM potassium phosphate (pH 7.4), 50 mM potassium chloride, 5 mM TCEP, 0.005% Tween 20. TZDs were assessed in dose response format and the last (20 μM) data point for Netoglitazone and CAY10638 was removed from data fitting due to compound precipitation; other ligands were assessed as a single concentration (5 μM). For the ligand displacement assay, each well contained 1 nM 6xHis-PPARγ LBD protein, 1 nM LanthaScreen Elite Tb-anti-HIS Antibody (Thermo Fisher Scientific), and 5 nM Fluormone Pan-PPAR Green (Invitrogen) in a buffer containing 20 mM potassium phosphate (pH 8), 50 mM potassium chloride, 5 mM TCEP, and 0.005% Tween-20. Compounds stocks were prepared in DMSO via serial dilution (when applicable), added to wells in triplicate, and plates were read using BioTek Synergy Neo multimode plate reader after incubation at 25 °C for 1 h. The Tb donor was excited at 340 nm; the Tb donor emission was measured at 495 nm, and the acceptor FITC emission was measured at 520 nm. Data were plotted using GraphPad Prism as TR-FRET ratio 520 nm/495 nm vs. ligand concentration (TZD series) or at a single ligand concentration (5 μM; other ligands). Coregulator recruitment data were fit to a three-parameter sigmoidal dose response curve equation, which assumes a slope = 1 and allows a reasonable fitting of non-saturating dose response data, to obtain EC50/potency and TR-FRET window/efficacy (i.e., “span” reported from the fit) values. Ligand displacement data were fit to the one site - Fit Ki binding equation to obtain Ki values using the known binding affinity of Fluormone Pan-PPAR Green (2.8 nM; Invitrogen PV4894 product insert). Fluorescence polarization coregulator interaction assay. 6xHis-PPARγ LBD was diluted by serial dilution into a buffer containing 20 mM potassium phosphate (pH 8), 50 mM potassium chloride, 5 mM TCEP, 0.5 mM EDTA, and 0.01% Tween-20 and plated with 180 nM FITC-labeled TRAP220 peptide in black 384-well plates (Greiner) in the presence of DMSO (ligand vehicle) or ligand at a concentration equal to 10 μM over the highest protein concentration to ensure complete formation of ligand-bound protein in triplicate. The plate was incubated at 25°C for 1 hr, and fluorescence polarization was measured on a BioTek Synergy Neo multimode plate reader at 485 nm emission and 528 nm excitation wavelengths. Data were plotted using GraphPad Prism as fluorescence polarization signal in millipolarization units vs. protein concentration and fit to a one site — total binding equation. Bio-layer interferometry coregulator interaction assay. The binding of TRAP220 peptide and TZDs-bound PPARγ-LBD was characterized by using a ForteBio Octet RED96 system. Biotin-labeled TRAP220 peptide (100 nM) was prepared in 1X Kinetics Buffer (Pall Life Sciences; item 18-1092). Purified PPARγ LBD protein was incubated with two molar equivalents of each TZD

3
ligand at room temperature for 1 hr in PBS buffer and serial diluted with PBS buffer containing 10 μM excess TZD ligand reach near saturation of ligand-bound form. BLI binding curves were measured using Super Streptavidin SSA biosensors (Pall Life Sciences). Data at two concentrations of TZD-bound PPARγ LBD (Edaglitazone, 1 and 4 μM; Rosiglitazone, 2 and 10 μM; other TZDs, 4 and 8 μM) were fit in GraphPad Prism using a two-phase association exponential equation that reports a fast rate (binding) and a slow rate (non-specific interaction of the protein with the biosensor) to obtain Kobs and Koff rate constants; Kon was calculated using the following equation: (Kobs - Koff)/[analyte]. Differential scanning calorimetry. Samples containing PPARγ LBD (30 μM) incubated with 30 μM ligand or 0.15% DMSO (vehicle control) were degassed for 10 minutes in a buffer containing 20 mM potassium phosphate (pH 7.4), 50 mM potassium chloride, 5 mM TCEP, and 0.5 mM EDTA; 1 mL sample aliquots were transferred to duplicate wells of a 96-well deep-well plate and loaded to the autosampler module of Nano DSC (TA Instruments). Differential scanning calorimetry (DSC) data were obtained by increasing the temperature from 25–95 °C at a rate of 1 °C min-1 while monitoring the heat change of buffer, ligand-free protein in the presence of DMSO, and ligand-bound protein samples. Buffer scans were performed in triplicate before each protein denaturation experiment to condition the reference and sample cells. Baseline-corrected data were converted to molar heat capacity before defining a two-state sigmoidal integration baseline. The DSC peak was fitted with a two-state scaled model to determine the thermal transition midpoint (TS). Data were analyzed using TA Instruments DSC Analysis software and TS values plotted in GraphPad Prism. Cellular transactivation. HEK293T cells (ATCC CRL03216) as detailed in SI Appendix. were cultured in Dulbecco’s Minimal Essential Medium (DMEM, Gibco) supplemented with 10% fetal bovine serum (FBS) and 50 units ml-1 of penicillin, streptomycin, and glutamine. Cells were grown to 90% confluency in T-75 flasks; from this, 4 million cells were seeded in a 10 cm cell culture dish for transfection using X-tremegene 9 (Roche) and Opti-MEM (Gibco) with Gal4-PPARγ LBD expression plasmid (4.5 μg) and a luciferase reporter plasmid containing the fix copies of the Gal4 Upstream Activation Sequence (5xUAS-luciferase) (4.5 μg). After an 18 hr incubation, cells were transferred to white 384-well cell culture plates (Thermo Fisher Scientific) at 10,000 cells/well in 20 μL total volume/well. After a 4 hr incubation, cells were treated in quadruplicate with 20 μL of either vehicle control (1.5% DMSO in DMEM media) or 2-fold serial dilution of TZDs. After a final 18 hr incubation, cells were harvested with 20 μL Britelite Plus (Perkin Elmer), and luminescence was measured on a BioTek Synergy Neo multimode plate reader. Data were plotted in GraphPad Prism as luminescence vs. ligand concentration and fit to a sigmoidal dose response curve. Crystallization and structure determination. For PPARγ LBD complexes with Ciglitazone, Troglitazone, Mitoglitazone, CAY10506, and CAY10638, the ligands were incubated at a 1:3 protein/ligand molar ratio in PBS overnight before being concentrated to 10 mg/ml and buffer exchange into phosphate buffer to remove DMSO. The PPARγ LBD complex with Darglitazone was obtained by soaking the ligand (1 mM in reservoir solution containing 5% DMSO) into preformed apo-PPARγ LBD crystals. Apo or protein/ligand complex crystals were obtained after 3–5 days at 22 °C by sitting-drop vapor diffusion against 50 μL of well solution using 96-well format crystallization plates. The crystallization drops contained 1 μL of protein (with or without ligand) mixed with 1 μL of reservoir solution containing 0.1 M MOPS (pH 7.6) or Tris (pH 7.6) and 0.8 M sodium citrate. All crystals were flash-frozen in liquid nitrogen before data collection. Data collection for PPARγ LBD bound to Ciglitazone, Mitoglitazone, CAY10506, and CAY10638 was carried out at ALS Beamline 5.0.2 at Berkeley Center for Structural Biology (Lawrence Berkeley National Laboratory). Data collection for the PPARγ LBD bound to Troglitazone and Darglitazone was carried out using our home source MicroMax007 HF x-ray generator equipped with the mar345 detector. Data were processed, integrated, and scaled with the programs Mosflm (6) and Scala in CCP4 (7). The structures were solved by molecular replacement using the program Phaser (8) implemented in the PHENIX package (9) and using a previously published PPARγ LBD structure (PDB code: 1PRG) (10) as the search model. The structure was refined using

4
PHENIX with several cycles of interactive model rebuilding in COOT (11). Final structure figures were prepared using PyMOL (Schrödinger). NMR spectroscopy. Two-dimensional [1H,15N]-TROSY HSQC NMR data of 15N-labeled PPARγ LBD (200 μM; unless otherwise noted) were acquired at 298K on a Bruker 700 MHz NMR instrument equipped with a QCI cryoprobe in NMR buffer (50 mM potassium phosphate, 20 mM potassium chloride, 1 mM TCEP, pH 7.4, 10% D2O) with ligands added at 2 molar equivalents (TZD series), 1 molar equivalent (structurally diverse ligands), or at the indicated equivalents in SI Appendix, Fig. S8. Data were processed using Topspin 3.0 (Bruker Biospin) and analyzed using NMRViewJ (OneMoon Scientific, Inc.) (12), respectively. NMR chemical shift assignments previously reported for ligand-bound PPARγ (2) were transferred to the spectra obtained in this study for well-resolved residues with conversed NMR peak positions to the previous ligand-bound forms using the minimum chemical shift perturbation procedure (13).

5
Fig. S1. TR-FRET coactivator recruitment assay performed using TRAP220 coactivator peptide concentrations of (a) 100 μM, (b) 200 μM, and (c) 400 μM.

6
Fig. S2. Correlation of TR-FRET assay parameters with kinetic rate constants for binding TRAP220 coactivator peptide. Correlation plots of TRAP220 peptide (a) Kon and (b) Koff values determined in the presence of the TZD ligand series using bio-layer interferometry (BLI) with TR-FRET window values and calculated occupancy from Fig. 2. BLI data represent the mean ± s.d. of experimental replicates (n=2); TR-FRET mean and errors are as stated in the legend of Figure 2.

7
Fig. S3. TZD ligand density in the crystal structures. Omit maps (2FO–FC, contoured at 1σ) for PPARγ LBD bound to (a) Darglitazone (PDB 6DGL), (b) Edaglitazone (PDB 5UGM), (c) CAY10506 (PDB 6DGQ), (d) Rosiglitazone (PDB 4EMA), (e) Pioglitazone (PDB 5Y2O), (f) Troglitazone (PDB 6DGO), (g) Netoglitazone (PDB 3B0Q), (h) Cioglitazone (PDB 6O68), (i) Mitoglitazone (PDB 6O67), and (j) CAY10638 (PDB 6DGR).

8
Fig. S4. Ligand hydrogen bond and electrostatic contacts in the crystal structures. Distances are represented by dotted lines colored colored by interaction strength: strong, <3.5Å (red); moderate, 3.5–4.5Å (yellow); weak, >4.5Å (gray) for PPARγ LBD bound to (a) Darglitazone (PDB 6DGL), (b) Edaglitazone (PDB 5UGM), (c) CAY10506 (PDB 6DGQ), (d) Rosiglitazone (PDB 4EMA), (e) Pioglitazone (PDB 5Y2O), (f) Troglitazone (PDB 6DGO), (g) Netoglitazone (PDB 3B0Q), (h) Cioglitazone (PDB 6O68), (i) Mitoglitazone (PDB 6O67), and (j) CAY10638 (PDB 6DGR).

9
Fig. S5. Other residues that show NMR peak line broadening for less potent ligands in the TZD series.

10
Fig. S6. Other residues that show colinear NMR peak shifting in the TZD series.

11
Fig. S7. 2D [1H,15N]-TROSY HSQC NMR data show two receptor populations for some intermediate potency ligands within the TZD series.

12
Fig. S8. Control NMR titrations. (a) 100 μM 15N-PPARγ LBD titrated with CAY10638 at the indicated concentrations. (b) 200 μM 15N-PPARγ LBD titrated with DMSO at the indicated concentrations.

13
Fig. S9. Chemical structures of the diverse ligand set.
14
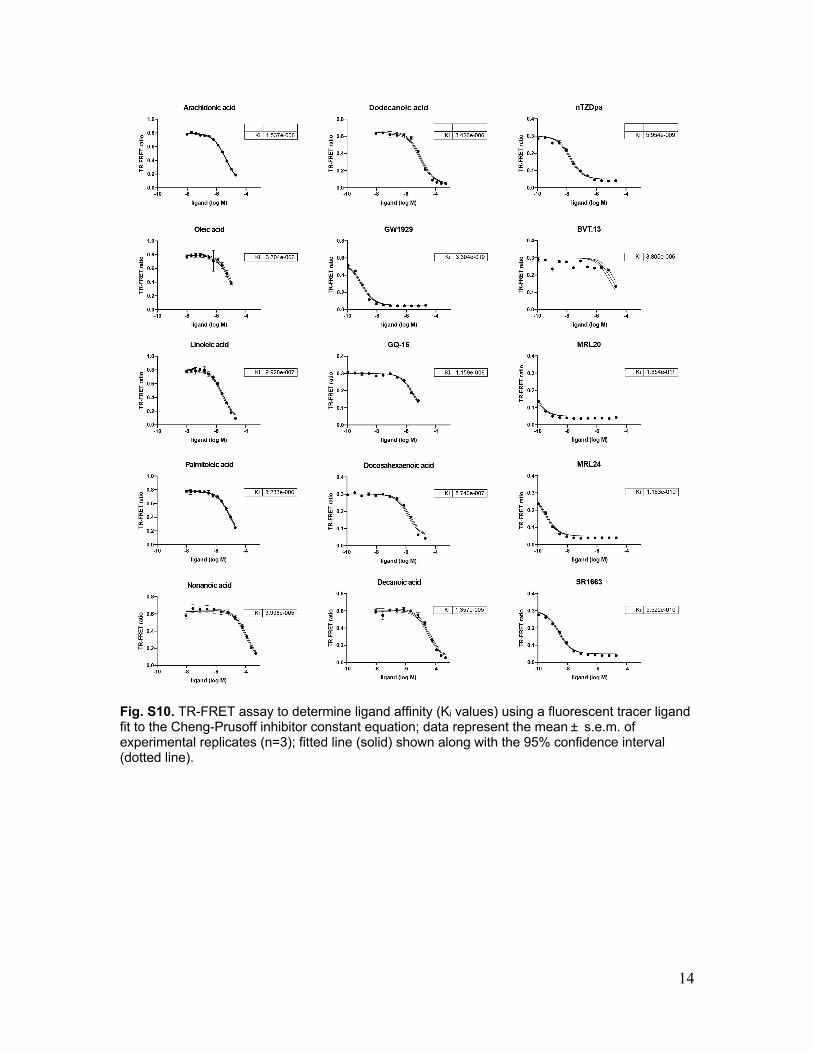
Fig. S10. TR-FRET assay to determine ligand affinity (Ki values) using a fluorescent tracer ligand fit to the Cheng-Prusoff inhibitor constant equation; data represent the mean ± s.e.m. of experimental replicates (n=3); fitted line (solid) shown along with the 95% confidence interval (dotted line).

15
Table S1. X-ray crystallography data collection and refinement statistics.
PPARγ LBD +
Darglitazone PPARγ LBD + CAY10506 PPARγ LBD +
Troglitazone PPARγ LBD + Ciglitazone PPARγ LBD +
Mitoglitazone PPARγ LBD + CAY10638
Data collection Space group C 1 2 1 C 1 2 1 C 1 2 1 C 1 2 1 C 1 2 1 C 1 2 1 Cell dimensions a, b, c (Å) 93.36, 61.74,
119.47 92.20, 59.49, 116.73 92.81, 62.07,
118.76 92.39, 59.96, 117.61 92.93, 60.35,
118.11 92.86, 60.60, 117.66
α, β, γ (°) 90.00, 102.72, 90.00 90.00, 103.55,
90.00 90.00 102.10 90.00 90.00, 103.02,
90.00 90.00, 103.14, 90.00 90.00, 103.14,
90.00 Resolution 41.01-1.95 (2.02-
1.95) 45.48-2.45 (2.54-2.45) 44.95-3.10 (3.21-
3.10) 49.90-2.78 (2.88-2.78) 48.30-2.52 (2.61-
2.52) 50.34-2.15 (2.23-2.15)
Rpim 0.037 (0.525) 0.040 (0.280) 0.0726 (0.378) 0.059 (0.457) 0.036 (0.303 0.055 (0.409) I / σ(I) 8.62 (1.26) 12.38 (2.89) 8.48 (2.20) 8.13 (1.71) 11.79 (2.54) 5.84 (1.34) CC1/2 in highest shell 0.611 0.811 0.717 0.642 0.814 0.805 Completeness (%) 96.06 (94.82) 97.30 (96.95) 98.55 (97.71) 99.77 (99.94) 99.92 (99.77) 96.42 (92.89) Redundancy 1.7 (1.6) 2.0 (2.0) 1.8 (1.8) 1.9 (1.9) 2.0 (2.0) 1.7 (1.7) Refinement Resolution (Å) 1.95 2.45 3.10 2.78 2.52 2.15 No. of unique reflections 46650 22240 12003 15994 21743 33678 Rwork/Rfree (%) 22.6/27.0 19.6/24.7 19.4/27.7 24.0/30.1 19.2/24.5 21.9/26.2 No. of atoms Protein 4147 4080 4141 4169 4098 4132 Water 423 185 0 15 158 226 B-factors Protein 27.90 31.05 25.38 65.65 31.90 30.45 Ligand 30.67 39.11 30.00 87.49 41.61 39.01 Water 32.29 30.12 n/a 56.79 30.57 31.88 Root mean square deviations Bond lengths (Å) 0.008 0.009 0.011 0.010 0.008 0.009 Bond angles (°) 0.92 1.03 1.16 1.27 1.02 1.09 Ramachandran favored (%) 95.66 95.98 89.80 92.16 97.39 95.41 Ramachandran outliers (%) 1.18 0.80 1.93 0.93 0.40 1.30 PDB accession code 6DGL 6DGQ 6DGO 6O68 6O67 6DGR *Values in parentheses indicate highest resolution shell.

16
Dataset S1 (separate file). Data values used to make the plots

17
SI References
1. J. B. Bruning et al., Partial agonists activate PPARgamma using a helix 12 independent mechanism. Structure 15, 1258-1271 (2007). 2. T. S. Hughes et al., Ligand and receptor dynamics contribute to the mechanism of graded PPARgamma agonism. Structure 20, 139-150 (2012). 3. T. S. Hughes et al., An alternate binding site for PPARgamma ligands. Nat Commun 5, 3571 (2014). 4. R. Brust et al., Modification of the Orthosteric PPARgamma Covalent Antagonist Scaffold Yields an Improved Dual-Site Allosteric Inhibitor. ACS Chem Biol 12, 969-978 (2017). 5. D. P. Marciano et al., Pharmacological repression of PPARgamma promotes osteogenesis. Nat Commun 6, 7443 (2015). 6. T. G. Battye, L. Kontogiannis, O. Johnson, H. R. Powell, A. G. Leslie, iMOSFLM: a new graphical interface for diffraction-image processing with MOSFLM. Acta Crystallogr D Biol Crystallogr 67, 271-281 (2011). 7. M. D. Winn et al., Overview of the CCP4 suite and current developments. Acta Crystallogr D Biol Crystallogr 67, 235-242 (2011). 8. A. J. McCoy et al., Phaser crystallographic software. J Appl Crystallogr 40, 658-674 (2007). 9. P. D. Adams et al., The Phenix software for automated determination of macromolecular structures. Methods 55, 94-106 (2011). 10. R. T. Nolte et al., Ligand binding and co-activator assembly of the peroxisome proliferator-activated receptor-gamma. Nature 395, 137-143 (1998). 11. P. Emsley, K. Cowtan, Coot: model-building tools for molecular graphics. Acta Crystallogr D Biol Crystallogr 60, 2126-2132 (2004). 12. B. A. Johnson, Using NMRView to visualize and analyze the NMR spectra of macromolecules. Methods Mol Biol 278, 313-352 (2004). 13. M. P. Williamson, Using chemical shift perturbation to characterise ligand binding. Prog Nucl Magn Reson Spectrosc 73, 1-16 (2013).