jurnal teknologi full paper - eprints.utm.myeprints.utm.my/id/eprint/53291/1/md.habiburrahman... ·...
TRANSCRIPT
69:8 (2014) 85–93 | www.jurnalteknologi.utm.my | eISSN 2180–3722 |
Full paper Jurnal
Teknologi
Lab-on-Chip Microfluidics System for Single Cell Mass Measurement: A Comprehensive Review Md. Habibur Rahman, Mohd Ridzuan Ahmad*
Micro-Nano System Engineering Research Group, Nanotechnology Research Alliance, Control and Mechatronic Engineering Department, Universiti Teknologi Malaysia, 81310 UTM Johor Bahru, Johor, Malaysia
*Corresponding author: [email protected]
Article history
Received :7 March 2014
Received in revised form:
8 April 2014 Accepted :5 May 2014
Graphical abstract
Abstract Single cell mass (SCM) is one of the intrinsic properties of cell and is a vital part of single cell analysis
(SCA). To date, a myriad numbers of works has been successfully reported for single cell mass measurement
but the reported information are scattered, consequently a comprehensive review becomes mandatory to bring them together. Lab-on-chip microfluidics system integrated with micro-resonator provided an
excellent platform to measure single cell mass directly (in presence of cells). On-chip microfluidics system
like suspended micro channel resonator (SMR) was reported for non-adherent single yeast cell mass while ‘living cantilever arrays’ (LCA) was proposed to measure adherent HeLa cell mass. On the other hand,
cantilever based resonant mass measurement system has non-uniform mass sensitivity; this issue has been
overcome by pedestal mass measurement system (PMMS). PMMS has a unique geometrical structure that provided uniform mass sensitivity to the sensing surface. Moreover, we presented a comprehensive
discussion of each of the available methods of SCM elaborating the sensing mechanism, geometry of the sensor and governing equations. It is hoped that, information presented in this comprehensive review paper
will be a valuable source for the single cell mass analysers and biological researchers.
Keywords: Single cell mass; suspended micro channel resonator; living cantilever arrays; pedestal mass
measurement sensor
© 2014 Penerbit UTM Press. All rights reserved.
1.0 INTRODUCTION
With the revolution of micro-bio and nano-bio technology,
physiology of single cell is being discovered day by day. Great
strides have been taken to develop the technology to investigate
the intracellular and extracellular properties of single cell. For
example analysis of single cell inside environmental scanning
electron microscope (ESEM) [1]–[4], AFM cantilever for single
cell strength analysis [5], Nano scale electrochemical probe for
single cell analysis (SCA) [6], SCA through electrochemical
detection [2], [6]–[11] and microfluidics disk for single cell
viability detection [12]. SCA elucidates complex cellular
functions such as cell’s mechanical, electrical and chemical
properties. Single cell mechanics is one of the vital part of the
single cell analysis. Recent development of micro electro
mechanical systems (MEMS) provide an excellent platform to
analyse single cell mechanics often known as lab-on-chip (LOC)
microfluidics device [7], [10], [12]–[16]. Studies on cell
mechanics acquired a great interest of scientist as cell mechanics
can be related to the early diagnosis of disease through single cell
surgery and cell wall stiffness [17]–[20]. Cell mechanics consist
of (but not limited to) cell wall strength, cell mass, density and
volume at different phases of cell growth cycle. However, in this
comprehensive review article we limit our scope to single cell
mass and its measurement techniques. Previously, a few
illuminating review papers were presented reflecting chemical
and biological analysis of single cell [21], single cell analysis for
quantitative biology [22], single cell trapping mechanisms [23],
single cell in biotechnological applications [14] and single cell
culturing methods. Nevertheless the review on single cell mass
(SCM) measurement is yet to be done and technological
advancements of SCM remains scattered. In order to bring this
scattered information in a single platform we have presented in
this review article.
Lab-on-chip integrated with microfluidics system enabled
scientist to measure the mass of individual cells directly (in
presence of alive cells). Micro-nano mechanical resonators have
opened the doors for single cell mass measuring with high
accuracy. Frequency of the resonator is inversely proportional to
the acquainted mass of resonator [5], [24]–[28]. Using this
principle Burg et al. proposed suspended micro channel resonator
(SMR) for single cell mass measurement [7], [29]. But this work
was limited to dry cell only i.e. non adherent yeast cell [13], infect
micro beads was used to characterize the sensor [30]. This issue
has been overcome by ‘living cantilever arrays’ for measuring
adherent HeLa cell [10]. However, resonating cantilever has non-

86 Md. Habibur Rahman & Mohd Ridzuan Ahmad / Jurnal Teknologi (Sciences & Engineering) 69:8 (2014) 85–93
uniform mass sensing ability [31] as a result accuracy depends on
the cell position merely [10]. On the other hand, cantilever based
mass measurement techniques were not able to relate the cell
mass with cell growth through cell cycle. These issues have been
addressed by object position independent pedestal mass
measurement [16]. Results showed that, cell mass increases
exponentially with cell growth which is in agreement with the
previous arguments [16], [32].
Figure 1 (A) A large population of cells. (B) Properties of particular
healthy and unhealthy cell
1.1 Significance of Measuring Single Cell Mass
Cell mass depends on the synthesis of proteins, DNA replication,
cell wall stiffness, cell cytoplasm density, cell growth, ribosome
and other analogous of organisms [10]. Chronic diseases like
cancer and tumour affect intracellular physiological properties of
cells [33], subsequently cell mass and density will be changed as
well [32], [34]. Single cell mass can be measured either from an
absolute single cell or from a large population of cells. But from
the average data of single cell mass, it is not possible to identify
the mass of a particular single cell. Hence, ambiguities arise in
identification of cell’s physical data. On the other hand, an
absolute single cell mass data is able to explain the physical
conditions of a particular cell. This leads to differentiate an
unhealthy cell from a bunch of healthy cells and vice-versa for
the healthy cell. Figure 1 shows a concept, how single cell mass
contributes in terms of identifying infected cell. Figure 1A
describes a schematic diagram of a population cell. From the
estimated data of population cell mass, it is not possible to
differentiate the healthy and infected cell. On the other hand,
Figure 1B shows the single cell property for a particular cell only.
For an infected cell, all these internal particles are being affected
by the foreign agents or materials. These physiological changes
also affect the mass of single cell. For example, in a tumour
infected cell, integrity of DNA faces continuous challenges and
genomic instability occurs to the chromosome's structure [35].
Inevitably, this will cause severe change to DNA replication,
cytoplasm density and cell volume which ultimately leads to the
changes in single cell mass. In this condition, if we could
determine the mass of a single cell, we will be able to differentiate
the unhealthy cell from healthy cells by investigating single cell
mass property. Single whole cell mass has also a great
contribution in terms by generating biomarkers for rapid
identification of intact microorganisms like virus and bacteria
[36]. As a result, we strongly believe that studying single cell
mass and its measurement techniques will enhance our
understanding of physiological properties of cell and perhaps it
may provide new tools for disease diagnosis through the variation
of single cell mass property of identical cells at different health
conditions.
Figure 2 (A) A typical SMR, where cantilever is hanging. (B) Frequency shifting in presence of cell. (C) Frequency shifting of the cantilever at
different position of the cell [7]
2.0 LAB-ON-CHIP SUSPENDED MICROCHANNEL
RESONATOR (SMR) FOR SINGLE CELL MASS
MEASUREMENT
Suspended micro channel resonator (SMR) was proposed by
Burg et al. for bio molecular detection from the frequency
shifting of cantilever in 2003 [29]. Although this technology was
initially proposed for bio molecular detection, its area of
application has subsequently expanded into single cell mass and
density measurements [7], [9], [13]. Frequency of the resonator
is inversely proportional to the square root of its mass [7], [9],
[10], [29]. This principle enables frequency shifting cantilever to
measure the single particle mass in 100 mg level with high quality
factor i.e. adequate sensitivity to detect each and every particle.
Figure 2A shows a schematic of typical SMR, where the
cantilever is at the hanging position and to be resonated. An
electrostatic actuator is placed at the bottom of the cantilever to
generate sufficient actuation (‘DC’ voltage ~60). This actuation
generates micro-newton centrifugal force, which provides
excellent mass sensing capability to the cantilever. At the
presence of any particle, the frequency generates pick value and
each of the pick is inversely proportional to the square root of
current mass of the cantilever [7]. Relationship between mass and
frequency is illustrated in Equation 1 proposed by Sarid [37].
Relation between the particle mass and frequency depends on the
position of the particle on the cantilever. The maximum
experienced mass by the cantilever is when the particle at its apex.
Schematic at Figure 2B illustrates this phenomenon of mass
sensing by the resonating cantilever. Figure 2C illustrates a more
specific relation between mass and frequency of the cantilever.
Frequency of the cantilever was measured by a position sensitive
photo detector (PSD).
87 Md. Habibur Rahman & Mohd Ridzuan Ahmad / Jurnal Teknologi (Sciences & Engineering) 69:8 (2014) 85–93
1
2
kf
m m
(1)
Where, f is the resonating frequency, m* is the effective
mass, k is the spring constant, α is the numerical constant that
depends on the added mass to the resonator ∆m. When
measureable particle is at the apex numerical constant α=1.
Cantilever is coated with 100 nm Aluminium thin film to obtain
a good electrical conductivity and a high optical reflectivity [29].
Smallest change of the frequency can be determined from the
ratio between the surface areas to the total mass as shown in
Equation 2. Optimizing this ratio is known as surface absorption
[7], [9].
1
2
f A
f m
(2)
Where, ∆f/f is the related frequency shift, A is the area of the
cantilever, m is the loaded mass and ∆σ = A/∆m is the surface
mass loading. By increasing surface area to mass ratio, the mass
sensing resolution of the cantilever can be enhanced.
2.1 Optimization of the SMR Design for Single Cell Mass
Measurement
SMR was fabricated by etching microfluidic channel on a
standard silicon wafer using photolithography and reactive ion
etching (RIE). For a fine detection of biomolecules, suspended
micro channel must be thin and the channel should have the
capability to flow the liquids continuously. Keeping these
purpose ahead, SMR was fabricated with channel wall thickness
of 800 nm and a fluid layer of 1.2 µm thick. Combination of
polysilicon Damascene and sacrificial layer [38] etching in bulk
micromachining of hot potassium hydroxide [39] was used to
fabricate the suspended micro channel resonator. Actuation was
generated through electrostatic force and optical lever used to
detect the resonance frequency. Recently, SMR was modified
with piezoresistive actuator by Lee et al. [15] and the frequency
detection mechanism has changed to electrically instead of
optically. Optical detection of frequency has two major
limitations; external laser source required to generate the optical
beam and a photodiode detector to detect the frequency shift.
Multiplexed measurement was not possible with the SMR that
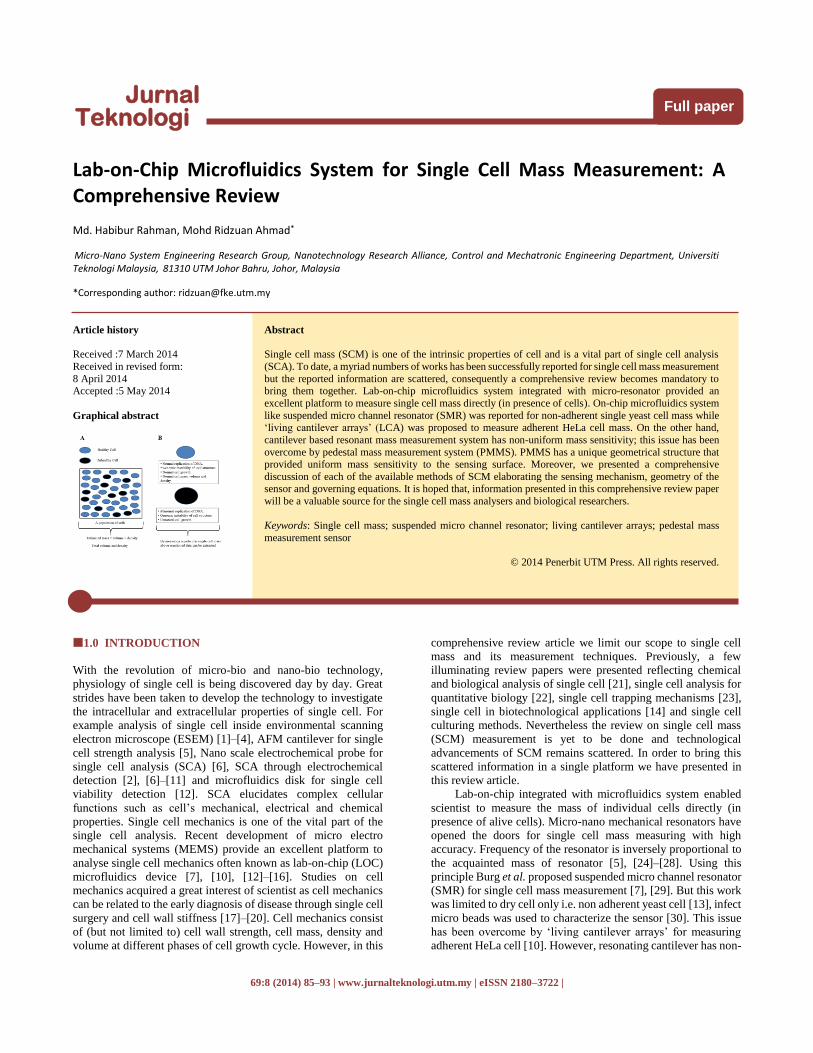
proposed by Burg et al. Figure 3 shows SMR's frequency
detection mechanism with both optical lever detector and
electronic detector modified by Lee et al. Three external resistors
were combined with on-chip piezoresistor to build a Wheatstone
bridge. The output signal passes to the amplifier either through
the Wheatstone bridge or photodiode. Phase shifter determines
the frequency shift and feedback the signal to the actuator. This
configuration of SMR, allowed it to be a feedback suited actuator
and able to detect the dynamic displacement of the SMR [15].
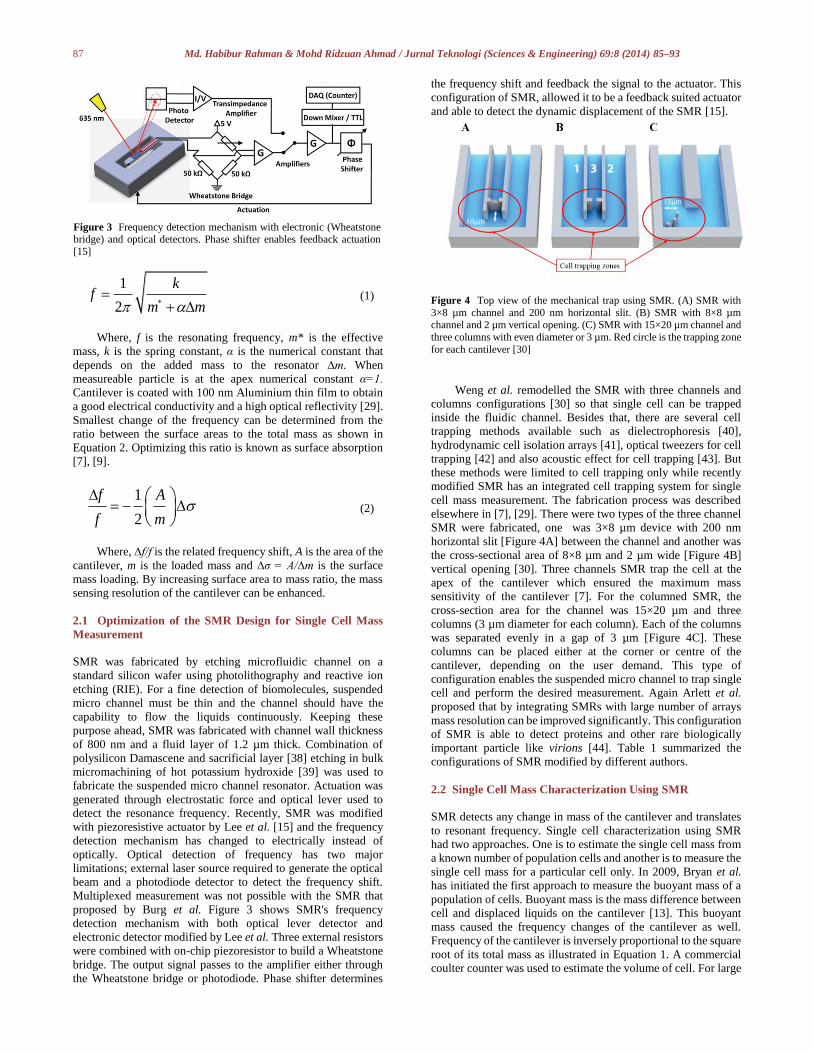
Figure 4 Top view of the mechanical trap using SMR. (A) SMR with
3×8 µm channel and 200 nm horizontal slit. (B) SMR with 8×8 µm channel and 2 µm vertical opening. (C) SMR with 15×20 µm channel and
three columns with even diameter or 3 µm. Red circle is the trapping zone
for each cantilever [30]
Weng et al. remodelled the SMR with three channels and
columns configurations [30] so that single cell can be trapped
inside the fluidic channel. Besides that, there are several cell
trapping methods available such as dielectrophoresis [40],
hydrodynamic cell isolation arrays [41], optical tweezers for cell
trapping [42] and also acoustic effect for cell trapping [43]. But
these methods were limited to cell trapping only while recently
modified SMR has an integrated cell trapping system for single
cell mass measurement. The fabrication process was described
elsewhere in [7], [29]. There were two types of the three channel
SMR were fabricated, one was 3×8 µm device with 200 nm
horizontal slit [Figure 4A] between the channel and another was
the cross-sectional area of 8×8 µm and 2 µm wide [Figure 4B]
vertical opening [30]. Three channels SMR trap the cell at the
apex of the cantilever which ensured the maximum mass
sensitivity of the cantilever [7]. For the columned SMR, the
cross-section area for the channel was 15×20 µm and three
columns (3 µm diameter for each column). Each of the columns
was separated evenly in a gap of 3 µm [Figure 4C]. These
columns can be placed either at the corner or centre of the
cantilever, depending on the user demand. This type of
configuration enables the suspended micro channel to trap single
cell and perform the desired measurement. Again Arlett et al.
proposed that by integrating SMRs with large number of arrays
mass resolution can be improved significantly. This configuration
of SMR is able to detect proteins and other rare biologically
important particle like virions [44]. Table 1 summarized the
configurations of SMR modified by different authors.
2.2 Single Cell Mass Characterization Using SMR
SMR detects any change in mass of the cantilever and translates
to resonant frequency. Single cell characterization using SMR
had two approaches. One is to estimate the single cell mass from
a known number of population cells and another is to measure the
single cell mass for a particular cell only. In 2009, Bryan et al.
has initiated the first approach to measure the buoyant mass of a
population of cells. Buoyant mass is the mass difference between
cell and displaced liquids on the cantilever [13]. This buoyant
mass caused the frequency changes of the cantilever as well.
Frequency of the cantilever is inversely proportional to the square
root of its total mass as illustrated in Equation 1. A commercial
coulter counter was used to estimate the volume of cell. For large
Figure 3 Frequency detection mechanism with electronic (Wheatstone bridge) and optical detectors. Phase shifter enables feedback actuation
[15]
88 Md. Habibur Rahman & Mohd Ridzuan Ahmad / Jurnal Teknologi (Sciences & Engineering) 69:8 (2014) 85–93
number of sample (n > 20,000), volume of single cell was
estimated as 27.0 ± 0.1 µm3. Relation between buoyant mass and
volume were illustrated in Equation 3.
b fm V (3)
Where mb is buoyant mass of cell, V is volume, ρf and ρ are the
density of fluid and cell respectively. From Equation 3 average
single yeast cell mass was calculated as 1.38 ± 0.010 pg [13]. As
single cell volume was estimated from the total size of the
population and so for the density. This average estimated data
was unable to illustrate the mass of a particular single cell,
subsequently real time mass data of each cell remains elusive.
Table 1 SMR with different configurations
Authors References & Year Configuration Frequency detection
methods
Remarks
Burg et al. 2003,2007 [7], [29] U-Shaped Optical lever SMR was used to detect
biomolecules and estimate single
cell mass from average data
Lee et al. 2010 [15] U-Shaped Optical lever and
piezoresistive
Feedback suited actuator
Weng et al. 2011 [30] Three channel and columned Piezoelectric and optical Cell trapping mechanism has been
added
Arlett et al. 2010 [44] Double clamped beams Thermoelectric actuation and
piezoresistive detection
Flow through detection methods
introduced
Lee et al. 2011 [45] U-Shaped Photo detector Second flexural bending mode to
lower the minimum detectable particle size
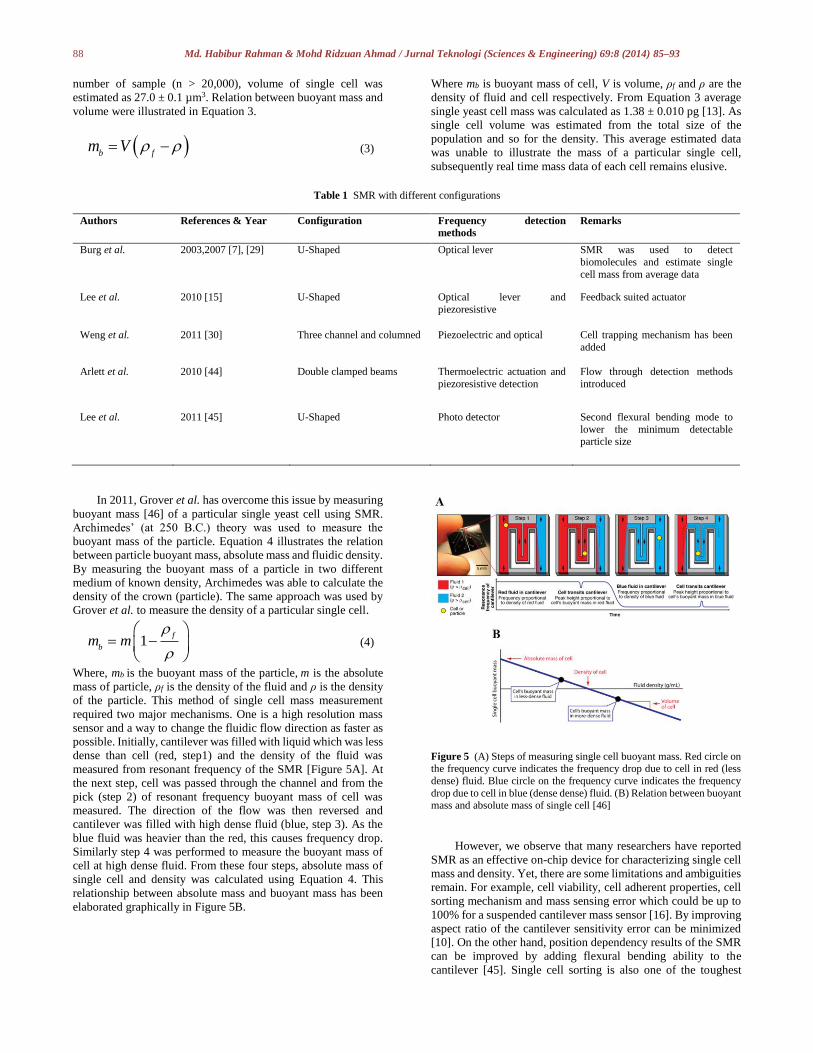
In 2011, Grover et al. has overcome this issue by measuring
buoyant mass [46] of a particular single yeast cell using SMR.
Archimedes’ (at 250 B.C.) theory was used to measure the
buoyant mass of the particle. Equation 4 illustrates the relation
between particle buoyant mass, absolute mass and fluidic density.
By measuring the buoyant mass of a particle in two different
medium of known density, Archimedes was able to calculate the
density of the crown (particle). The same approach was used by
Grover et al. to measure the density of a particular single cell.
1f
bm m
(4)
Where, mb is the buoyant mass of the particle, m is the absolute
mass of particle, ρf is the density of the fluid and ρ is the density
of the particle. This method of single cell mass measurement
required two major mechanisms. One is a high resolution mass
sensor and a way to change the fluidic flow direction as faster as
possible. Initially, cantilever was filled with liquid which was less
dense than cell (red, step1) and the density of the fluid was
measured from resonant frequency of the SMR [Figure 5A]. At
the next step, cell was passed through the channel and from the
pick (step 2) of resonant frequency buoyant mass of cell was
measured. The direction of the flow was then reversed and
cantilever was filled with high dense fluid (blue, step 3). As the
blue fluid was heavier than the red, this causes frequency drop.
Similarly step 4 was performed to measure the buoyant mass of
cell at high dense fluid. From these four steps, absolute mass of
single cell and density was calculated using Equation 4. This
relationship between absolute mass and buoyant mass has been
elaborated graphically in Figure 5B.
Figure 5 (A) Steps of measuring single cell buoyant mass. Red circle on the frequency curve indicates the frequency drop due to cell in red (less
dense) fluid. Blue circle on the frequency curve indicates the frequency
drop due to cell in blue (dense dense) fluid. (B) Relation between buoyant mass and absolute mass of single cell [46]
However, we observe that many researchers have reported
SMR as an effective on-chip device for characterizing single cell
mass and density. Yet, there are some limitations and ambiguities
remain. For example, cell viability, cell adherent properties, cell
sorting mechanism and mass sensing error which could be up to
100% for a suspended cantilever mass sensor [16]. By improving
aspect ratio of the cantilever sensitivity error can be minimized
[10]. On the other hand, position dependency results of the SMR
can be improved by adding flexural bending ability to the
cantilever [45]. Single cell sorting is also one of the toughest
89 Md. Habibur Rahman & Mohd Ridzuan Ahmad / Jurnal Teknologi (Sciences & Engineering) 69:8 (2014) 85–93
challenge in SMR mass measurement sensor. In the structure of
a SMR, micro channel is hanging with an opening inlet and outlet.
In order to pass a cell through the suspended micro channel, cell
must be injected through the gate of the inlet [23]. There might
be two possible way to manage the single cell to pass through the
channel [14]. One is to sort the cell in another lab-on-chip and
then inject to the suspended cantilever beam. Another approach
might be, to use a valve analogous gate at the inlet of the channel
which will allow only a single cell at one time to pass through the
channel. After all, a micro-nano manipulator can be used for
positioning the single cell in the inlet of the channel [21]. As a
consequence we may conclude that, SMR can be modified with
additional feature to obtain an optimised sensor for measuring
single cell mass. For instance, introducing of dynamic ‘mass-
spring-damper’ model to extract the spring constant of the
cantilever and minimize the object position dependency [16].
3.0 ‘LIVING CANTILEVER ARRAYS’ (LCA) FOR
MEASURING SINGLE CELL MASS
Even though suspended micro channel resonator has a great
contribution to the advancements of single cell mass
measurement techniques, yet this method is limited to non-
adherent cell only [16] and cell stiffness data remained elusive.
But it has been believed that, cell stiffness is a significant
parameter that impact on stress-induced cell spreading [47], cell
differentiation [48] and cancer metastasis [8]. As a consequence,
Park et al. has proposed ‘living cantilever arrays’ to measure
adherent cell mass [10]. In this method, cantilevers were
submerged into the L-15 growth medium and cells were cultured.
Hence, cells remain alive and adherent cell mass was measured
using cantilever arrays mass measurement sensor. Figure 6A
shows the schematic diagram of the cantilever arrays. Laser
doppler vibrometer (LDV) was connected with the cantilever to
measure the vibration frequency precisely. Positive
dielectrophoresis was used to attach the cells on the cantilever.
Frequency shifting phenomenon was used by Park et al. to relate
frequency with cell mass. Similarly like SMR, the cantilever
array used the frequency shifting phenomenon at the cantilever
beam. Mass changed ∆m was measured from the frequency
shifting [49] as illustrated in Equation 5.
2 2 2
1 0
1 1
4
km
f f
(5)
Where, f1, f0 is the resonant frequency with and without cell
respectively, k is the spring constant of the cantilever. For a
cantilever, typical equation for spring constant is denoted by
Equation 6.
3
33
t bk E
L (6)
Where, E is the elastic modulus, L is the length, b and t is the
width and thickness of the cantilever. The cantilever arrays were
named as “living cantilever arrays” as cells were captured and
cultivated on the surface of the cantilever, which kept the cell
alive and adherent properties unchanged.
Figure 6 (A) Living cantilever arrays for single cell mass (SCM)
measurement. (B) Cell capturing using dielectrophoresis (DEP). DEP
input signal was 6 Vpp at 1 MHz [10]
3.1 Fabrication and Characterization of LCA
‘Living cantilever arrays’ were fabricated from a silicon wafer.
Length of the cantilever was varied from 25-40 µm long, 10 µm
wide and 240 nm thick. Shortest cantilever was 25 µm long and
longest was 40 µm. Initially, silicon wafer was a 500 µm substrate
with 240 nm thick device layer (Figure 6A). Desired dimensions
of the cantilever were obtained by reactive ion etching (RIE).
Cantilever’s electric conductivity was enhanced by implantation
of boron at 10 KeV, it was then further tempered at 900°C for 30
min. A PDMS slab with a 2.5 mm wide and 250 µm high
microfluidic channel was fabricated to cover the silicone
cantilever. Thermal noise was the excitation source and an
advanced Fourier transform was performed to produce sufficient
vibration. Frequency of the cantilever was detected with a LDV
(Laser Doppler Vibrometer, MSV-300, Polytech PI).
3.2 Cell Capturing and Culturing on LCA
The aim of this work was to measure the single cell mass without
distorting the adherent properties of cell. Positive
dielectrophoresis (DEP, 6 Vpp,1 MHz) was used to capture the
cell from liquid medium. Biomolecules have dielectric property,
which allows DEP in many medical applications like bio
molecular separation, isolation etc. [50]. Silicon cantilevers were
coated with poly-L-lysine and poly-L-lysine become highly
positive at the physiological conditions. Cells were captured by
the cantilevers due to the electrostatic interaction.
Figure 6B confirmed cell capturing using DEP. With increasing
of time, number of attached ells also increased. Once cells were
captured, DEP signal was turned off. Cell growth media was
inserted immediately to keep cells alive. As there is no DEP at
this stage, cells were attached to the cantilever due to the adhesion
property of cells only. Immortal human cervical cells, HeLa were
used as a sample cell. HeLa cells culturing required 3-7 days to
observe the cell growth properly.
3.3 Single Cell Mass Characterization Using LCA
After capturing the cells, cells were cultured inside incubator at
37°C and 5% CO2 and cells growth was observed for several
days. After several days (up to 7 days) of cell culturing, frequency
of the cantilever was measured with LDV. Later cells were
detached from the cantilever by trypsin and cleaned with an
enzymatic cleaner (Tergazyme, Alconox, Inc., NY, USA).
Frequency was measured again to get resonant frequency without
cells only at the growth medium. Frequency drop was 2.92 KHz
in the presence of cell. From these two frequencies (with and
90 Md. Habibur Rahman & Mohd Ridzuan Ahmad / Jurnal Teknologi (Sciences & Engineering) 69:8 (2014) 85–93
without cells) single cell mass was calculated using Equation 5.
Single HeLa cell mass was calculated as 1.01 ng, which is
approximately half of the theoretical measurement of single HeLa
cell mass i.e. 2.48 ng [10]. The experimented result was only 40%
close to theoretical result and single cell mass result is to be
fluctuated, depending on the numbers of cells attached on the
cantilever. On the other hand the cell growth at the artificial cell
cultivation media was not as normal as expected. LCA was to
culture a single cell and measure the single cell mass only. But in
dielectrophoresis, many cells were attached and frequency was
measured with many cells acquainted in the cantilever [50]. In
addition, the spring constant and the quality factor of the
resonating cantilever is affected due to the small aspect ratio of
the cantilever [51]. This may cause error to the calculating of
spring constant of the cantilever. As a result, we could conclude
that, LCA may require improvement in terms of cells capturing
and spring constant calculation.
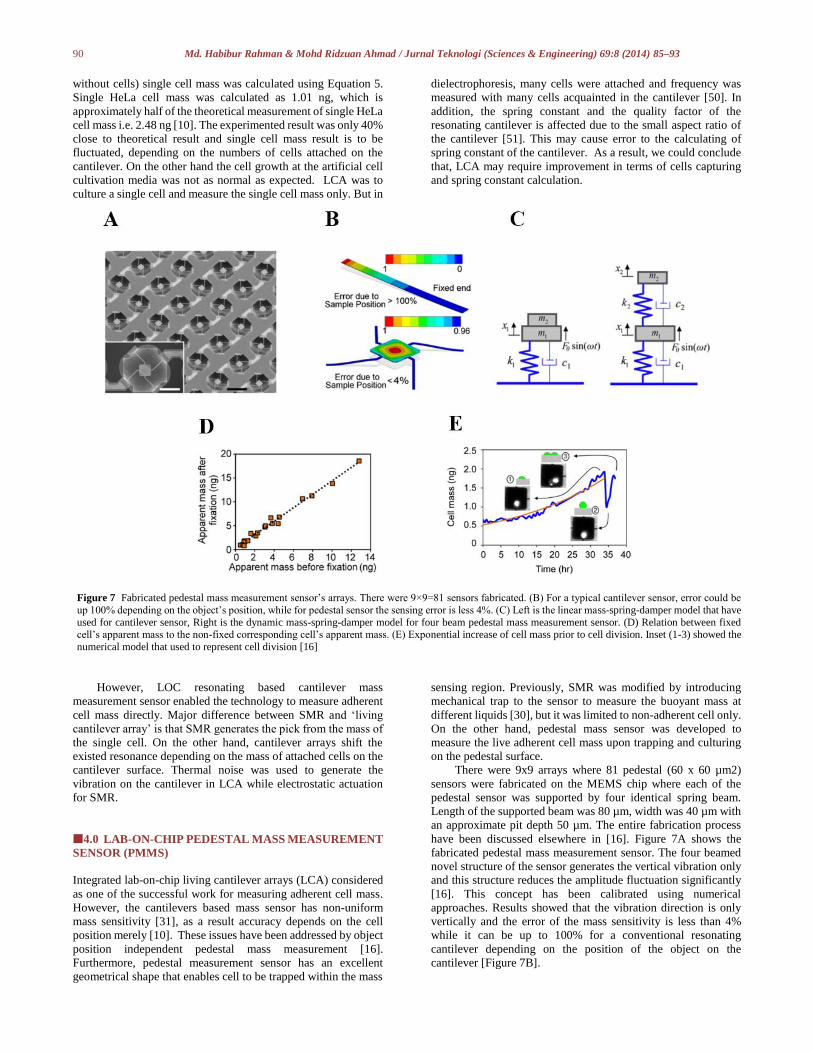
Figure 7 Fabricated pedestal mass measurement sensor’s arrays. There were 9×9=81 sensors fabricated. (B) For a typical cantilever sensor, error could be
up 100% depending on the object’s position, while for pedestal sensor the sensing error is less 4%. (C) Left is the linear mass-spring-damper model that have
used for cantilever sensor, Right is the dynamic mass-spring-damper model for four beam pedestal mass measurement sensor. (D) Relation between fixed cell’s apparent mass to the non-fixed corresponding cell’s apparent mass. (E) Exponential increase of cell mass prior to cell division. Inset (1-3) showed the
numerical model that used to represent cell division [16]
However, LOC resonating based cantilever mass
measurement sensor enabled the technology to measure adherent
cell mass directly. Major difference between SMR and ‘living
cantilever array’ is that SMR generates the pick from the mass of
the single cell. On the other hand, cantilever arrays shift the
existed resonance depending on the mass of attached cells on the
cantilever surface. Thermal noise was used to generate the
vibration on the cantilever in LCA while electrostatic actuation
for SMR.
4.0 LAB-ON-CHIP PEDESTAL MASS MEASUREMENT
SENSOR (PMMS)
Integrated lab-on-chip living cantilever arrays (LCA) considered
as one of the successful work for measuring adherent cell mass.
However, the cantilevers based mass sensor has non-uniform
mass sensitivity [31], as a result accuracy depends on the cell
position merely [10]. These issues have been addressed by object
position independent pedestal mass measurement [16].
Furthermore, pedestal measurement sensor has an excellent
geometrical shape that enables cell to be trapped within the mass
sensing region. Previously, SMR was modified by introducing
mechanical trap to the sensor to measure the buoyant mass at
different liquids [30], but it was limited to non-adherent cell only.
On the other hand, pedestal mass sensor was developed to
measure the live adherent cell mass upon trapping and culturing
on the pedestal surface.
There were 9x9 arrays where 81 pedestal (60 x 60 µm2)
sensors were fabricated on the MEMS chip where each of the
pedestal sensor was supported by four identical spring beam.
Length of the supported beam was 80 µm, width was 40 µm with
an approximate pit depth 50 µm. The entire fabrication process
have been discussed elsewhere in [16]. Figure 7A shows the
fabricated pedestal mass measurement sensor. The four beamed
novel structure of the sensor generates the vertical vibration only
and this structure reduces the amplitude fluctuation significantly
[16]. This concept has been calibrated using numerical
approaches. Results showed that the vibration direction is only
vertically and the error of the mass sensitivity is less than 4%
while it can be up to 100% for a conventional resonating
cantilever depending on the position of the object on the
cantilever [Figure 7B].
91 Md. Habibur Rahman & Mohd Ridzuan Ahmad / Jurnal Teknologi (Sciences & Engineering) 69:8 (2014) 85–93
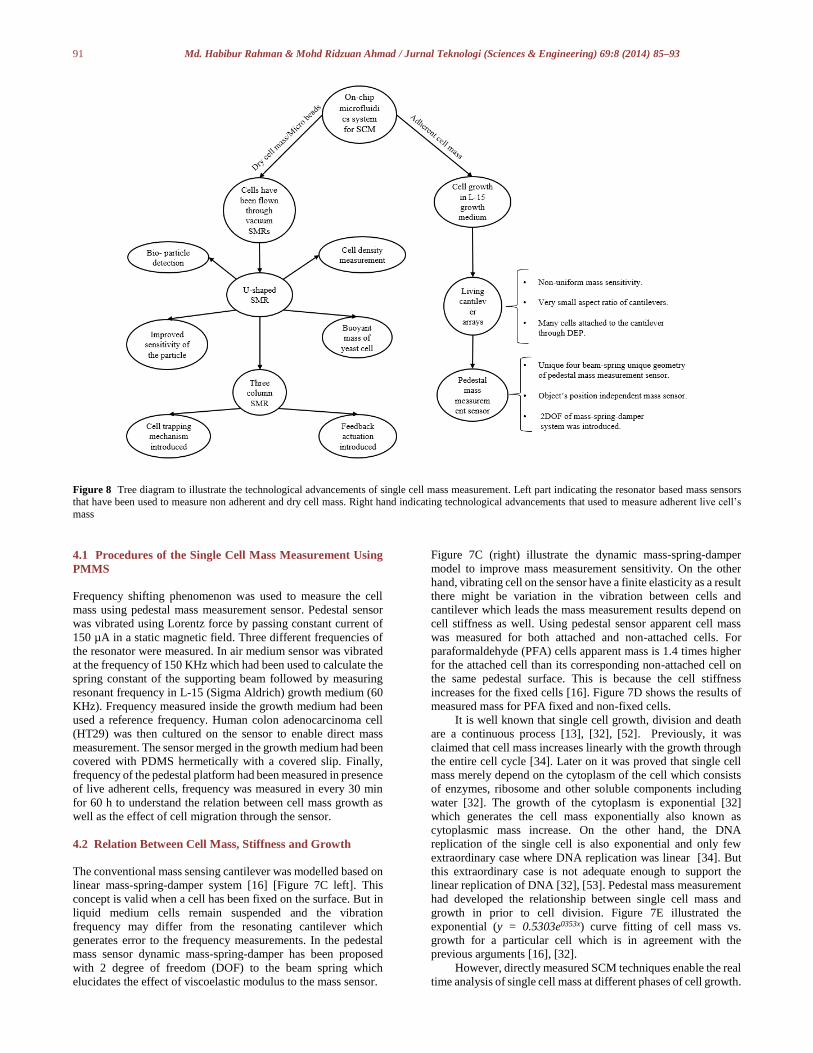
Figure 8 Tree diagram to illustrate the technological advancements of single cell mass measurement. Left part indicating the resonator based mass sensors
that have been used to measure non adherent and dry cell mass. Right hand indicating technological advancements that used to measure adherent live cell’s
mass
4.1 Procedures of the Single Cell Mass Measurement Using
PMMS
Frequency shifting phenomenon was used to measure the cell
mass using pedestal mass measurement sensor. Pedestal sensor
was vibrated using Lorentz force by passing constant current of
150 µA in a static magnetic field. Three different frequencies of
the resonator were measured. In air medium sensor was vibrated
at the frequency of 150 KHz which had been used to calculate the
spring constant of the supporting beam followed by measuring
resonant frequency in L-15 (Sigma Aldrich) growth medium (60
KHz). Frequency measured inside the growth medium had been
used a reference frequency. Human colon adenocarcinoma cell
(HT29) was then cultured on the sensor to enable direct mass
measurement. The sensor merged in the growth medium had been
covered with PDMS hermetically with a covered slip. Finally,
frequency of the pedestal platform had been measured in presence
of live adherent cells, frequency was measured in every 30 min
for 60 h to understand the relation between cell mass growth as
well as the effect of cell migration through the sensor.
4.2 Relation Between Cell Mass, Stiffness and Growth
The conventional mass sensing cantilever was modelled based on
linear mass-spring-damper system [16] [Figure 7C left]. This
concept is valid when a cell has been fixed on the surface. But in
liquid medium cells remain suspended and the vibration
frequency may differ from the resonating cantilever which
generates error to the frequency measurements. In the pedestal
mass sensor dynamic mass-spring-damper has been proposed
with 2 degree of freedom (DOF) to the beam spring which
elucidates the effect of viscoelastic modulus to the mass sensor.
Figure 7C (right) illustrate the dynamic mass-spring-damper
model to improve mass measurement sensitivity. On the other
hand, vibrating cell on the sensor have a finite elasticity as a result
there might be variation in the vibration between cells and
cantilever which leads the mass measurement results depend on
cell stiffness as well. Using pedestal sensor apparent cell mass
was measured for both attached and non-attached cells. For
paraformaldehyde (PFA) cells apparent mass is 1.4 times higher
for the attached cell than its corresponding non-attached cell on
the same pedestal surface. This is because the cell stiffness
increases for the fixed cells [16]. Figure 7D shows the results of
measured mass for PFA fixed and non-fixed cells.
It is well known that single cell growth, division and death
are a continuous process [13], [32], [52]. Previously, it was
claimed that cell mass increases linearly with the growth through
the entire cell cycle [34]. Later on it was proved that single cell
mass merely depend on the cytoplasm of the cell which consists
of enzymes, ribosome and other soluble components including
water [32]. The growth of the cytoplasm is exponential [32]
which generates the cell mass exponentially also known as
cytoplasmic mass increase. On the other hand, the DNA
replication of the single cell is also exponential and only few
extraordinary case where DNA replication was linear [34]. But
this extraordinary case is not adequate enough to support the
linear replication of DNA [32], [53]. Pedestal mass measurement
had developed the relationship between single cell mass and
growth in prior to cell division. Figure 7E illustrated the
exponential (y = 0.5303e0353x) curve fitting of cell mass vs.
growth for a particular cell which is in agreement with the
previous arguments [16], [32].
However, directly measured SCM techniques enable the real
time analysis of single cell mass at different phases of cell growth.
92 Md. Habibur Rahman & Mohd Ridzuan Ahmad / Jurnal Teknologi (Sciences & Engineering) 69:8 (2014) 85–93
Micromechanical resonator integrated with microfluidic chip
provides an excellent opportunity to extract a particular cell mass.
Figure 8 describes the entire technological advancements of cell
mass measurement techniques. We could say, this technological
developments are continuously improved by the researcher. For
example SMR was proposed to detect bio particles, optimized
and applied to single cell mass measurement techniques. On the
other hand, living cantilever arrays was proposed to measure
mass of HeLa cells at fixed and non-fixed conditions. But the
major drawback of the cantilever mass measurement sensor is the
non-uniform mass sensitivity through the cantilever surface. This
issue have been overcome by proposing four spring beam
pedestal mass measurement system. Mass sensitivity of the
pedestal mass measurement system is very promising and allow
the sensor to measure mass for both adherent and non-adherent
cells [16].
5.0 CONCLUSION
In this work, we analysed and summarized the available methods
of single cell mass measurement (SCM) from various published
works. Although it is very challenging to develop a benchmark
for SCM techniques, a detailed discussion of up-to-date
microfluidics based lab-on-chip and mass spectrometry for SCM
measurements techniques are presented throughout the entire
review. For example lab-on-chip microfluidics system integrated
with suspended micro channel resonator (SMR) for non-adherent
cell mass measurement, ‘living cantilever arrays’ (LCA) for
adherent cell measurement and also the position independent
pedestal mass measurement sensor (PMMS) for measuring single
cell mass directly. Comprehensive discussions of the relevant
works including the pros and cons, mechanism, sensor geometry,
fabrication procedures and the governing equations have been
presented. Moreover, we tried to extract the key features from the
relevant published works and reflect the accumulated information
in this work. It is envisaged that, this article could be a one stop
source for single cell mass analysers and could be a valuable
direction for the future works in this area.
Acknowledgement
We would like to express our appreciation towards Ministry of
Higher Education Malaysia (MOHE) grant no. 4L038 (ERGS)
and Universiti Teknologi Malaysia grant nos. 02H34 and 03H80
(GUP) for funding this project and for their endless support.
References
[1] M. R. Ahmad, M. Nakajima, S. Kojima, M. Homma, and T. Fukuda.
2010. Nanoindentation Methods to Measure Viscoelastic Properties of
Single Cells Using Sharp, Flat, and Buckling Tips Inside ESEM. IEEE Trans. Nanobioscience. 9(1): 12–23.
[2] M. R. Ahmad, M. Nakajima, S. Kojima, M. Homma, and T. Fukuda.
2008. The effects of Cell Sizes, Environmental Conditions, and Growth
Phases on the Strength of Individual W303 Yeast Cells Inside ESEM.
IEEE Trans. Nanobioscience. 7(3): 185–93.
[3] M. R. Ahmad, M. Nakajima, S. Kojima, M. Homma, and T. Fukuda.
2011. Buckling Nanoneedle for Characterizing Single Cells Mechanics
Inside Environmental SEM. IEEE Trans. Nanotechnol. 10(2): 226–236. [4] M. R. Ahmad, M. Nakajima, S. Kojima, M. Homma, and T. Fukuda.
2008. In Situ Single Cell Mechanics Characterization of Yeast Cells
Using Nanoneedles Inside Environmental SEM. IEEE Trans.
Nanotechnol. 7(5): 607–616.
[5] I. Obataya, C. Nakamura, S. Han, N. Nakamura, and J. Miyake. 2005.
Nanoscale Operation of a Living Cell Using An Atomic Force
Microscope with a Nanoneedle. Nano Lett. 5(1): 27–30.
[6] R. J. Fasching, S. J. Bai, T. Fabian, and F. B. Prinz. 2006. Nanoscale
Electrochemical Probes for Single Cell Analysis. Microelectron. Eng.
83, 4–9, 1638–1641.
[7] T. P. Burg, M. Godin, S. M. Knudsen, W. Shen, G. Carlson, J. S. Foster,
K. Babcock, and S. R. Manalis. 2007. Weighing of Biomolecules, Single Cells and Single Nanoparticles in Fluid. Nature. 446(7139): 1066–1069.
[8] S. E. Cross, Y.-S. Jin, J. Rao, and J. K. Gimzewski. 2007.
Nanomechanical Analysis of Cells from Cancer Patients. Nat.
Nanotechnol. 2(12): 780–783.
[9] M. Godin, A. K. Bryan, T. P. Burg, K. Babcock, and S. R. Manalis. 2007.
Measuring the Mass, Density, and Size of Particles and Cells Using a
Suspended Microchannel Resonator. Appl. Phys. Lett. 91(12): 123121–1231212.
[10] K. Park, J. Jang, D. Irimia, J. Sturgis, and J. Lee. 2008. Living Cantilever
Arrays’ for Characterization of Mass of Single Live Cells In Fluids. Lab
Chip. 8: 1034–1041.
[11] F. Xia, W. Jin, X. Yin, and Z. Fang. 2005. Single-cell Analysis by
Electrochemical Detection with a Microfluidic Device. J. Chromatogr.
A. 1063(1–2): 227–233.
[12] I. Kubo, S. Furutani, and K. Matoba. 2011. Use of a Novel Microfluidic Disk in the Analysis of Single-cell Viability and the Application to
Jurkat Cells. J. Biosci. Bioeng. 112(1): 98–101.
[13] A. K. Bryan, A. Goranov, A. Amon, and S. R. Manalis. 2010.
Measurement of Mass, Density, and Volume During the Cell Cycle of
Yeast. Proc. Natl. Acad. Sci. 107(3): 999–1004.
[14] F. S. O. Fritzsch, C. Dusny, O. Frick, and A. Schmid. 2012. Single-cell
Analysis in Biotechnology, Systems Biology, and Biocatalysis. Annu.
Rev. Chem. Biomol. Eng. 3: 129–55. [15] J. Lee, R. Chunara, W. Shen, K. Payer, K. Babcock, T. P. Burg, and S.
R. Manalis. 2011. Suspended Microchannel Resonators with
Piezoresistive Sensors. Lab Chip. 11(4): 645–51.
[16] K. Park, L. J. Millet, N. Kim, H. Li, X. Jin, G. Popescu, N. R. Aluru, K.
J. Hsia, and R. Bashir. 2010. Measurement of Adherent Cell Mass and
Growth. Proc. Natl. Acad. Sci. 107(48): 20691–96.
[17] M. Y. M. Chiang, Y. Yangben, N. J. Lin, J. L. Zhong, and L. Yang . 2013. Relationships among cell morphology, intrinsic cell stiffness and
cell-substrate interactions. Biomaterials. 34(38): 9754–62.
[18] G. Weder, M. C. Hendriks-Balk, R. Smajda, D. Rimoldi, M. Liley, H.
Heinzelmann, A. Meister, and A. Mariotti. 2014. Increased Plasticity of
the Stiffness of Melanoma Cells Correlates with Their Acquisition of
Metastatic Properties. Nanomedicine. 10(1): 141–8.
[19] M. H. Rahman, A. H. Sulaiman, M. R. Ahmad, and T. Fukuda. 2013.
Finite Element Analysis of Single Cell Wall Cutting by Piezoelectric-Actuated Vibrating Rigid Nanoneedle. IEEE Trans. Nanotechnol. 12(6):
1158–1168.
[20] S. Suresh. 2007. Biomechanics and Biophysics of Cancer Cells. Acta
Biomater. 3(4): 413–38.
[21] A. Schmid, H. Kortmann, P. S. Dittrich, and L. M. Blank. 2010.
Chemical and Biological Single Cell Analysis. Curr. Opin. Biotechnol.
21(1): 12–20.
[22] D. Di Carlo and L. P. Lee. 2006. Dynamic Single-cell Analysis for Quantitative Biology. Anal. Chem. 78(23): 7918–7925.
[23] J. Nilsson, M. Evander, B. Hammarström, and T. Laurell. 2009. Review
of Cell and Particle Trapping in Microfluidic Systems. Anal. Chim. Acta.
649(2): 141–57.
[24] B. Ilic, H. G. Graighead, S. Krylov, W. Senaratne, and P. Neuzil. 2004.
Attogram Detection Using Nanoelectromechanical Oscillators. J. Appl.
Phys. 95(7): 3694–3703. [25] Y. T. Yang, C. Callegari, X. L. Feng, K. L. Ekinci, and M. L. Roukes.
2006. Zeptogram-scale Nanomechanical Mass Sensing. Nano Lett. 6(4):
583–86.
[26] A. Gupta, D. Akin, and R. Bashir. 2004. Single Virus Particle Mass
Detection Using Microresonators with Nanoscale Thickness. Appl.
Phys. Lett. 84(11): 1976–1978.
[27] D. Lange, C. Hagleitner, A. Hierlemann, O. Brand, and H. Baltes. 2002.
Cantilever Arrays on a Single Chip: Mass-sensitive Detection of Volatile Organic Compounds. Anal. Chem. 74(13): 3084–3095.
[28] B. Ilic, Y. Yang, and H. G. Craighead. 2004. Virus detection using
nanoelectromechanical devices. Appl. Phys. Lett. 85(13): 2604–06.
[29] T. P. Burg and S. R. Manalis. 2003. Suspended Microchannel
Resonators for Biomolecular Detection. Appl. Phys. Lett. 83(13): 2698–
2700.
[30] Y. Weng, F. F. Delgado, S. Son, T. P. Burg, S. C. Wasserman, and S. R. Manalis. 2011. Mass Sensors with Mechanical Traps for Weighing
Single Cells in Different Fluids. Lab Chip. 11(24): 4174–80.
[31] S. Dohn, R. Sandberg, W. Svendsen, and A. Boisen. 2005. Enhanced
Functionality of Cantilever Based Mass Sensors Using Higher Modes.
Appl. Phys. Lett. 86(23): 233501–03.
93 Md. Habibur Rahman & Mohd Ridzuan Ahmad / Jurnal Teknologi (Sciences & Engineering) 69:8 (2014) 85–93
[32] S. Cooper. 2006. Distinguishing between Linear and Exponential Cell
Growth During the Division Cycle: Single-Cell Studies, Cell-Culture
Studies, and the Object of Cell-Cycle Research. Theor. Biol. Med.
Model. 3: 10–25.
[33] S. De Flora, A. Izzotti, K. Randerath, E. Randerath, H. Bartsch, J. Nair, R. Balansky, F. Schooten, P. Degan, G. Fronza, D. Walsh, and J. Lewtas.
1996. DNA Adducts and Chronic Degenerative Diseases. Pathogenetic
Relevance and Implications in Preventive Medicine. Mutat. Res. Genet.
Toxicol. 366(3): 197–238.
[34] J. M. Mitchison. 2005. Single Cell Studies of the Cell Cycle and Some
Models. Theor. Biol. Med. Model. 2: 4–9.
[35] C. J. Lord and A. Ashworth. 2012. The DNA Damage Response and Cancer Therapy. Nature. 481(7381): 287–94.
[36] C. Fenselau and P. A. Demirev. 2002. Characterization of Intact
Microorganisms by MALDI Mass Spectrometry. Mass Spectrom. Rev.
20(4): 157–71.
[37] D. Sarid. 1994. Scanning Force Microscopy : with Applications to
Electric, Magnetic, and Atomic Forces. Oxford University Press, USA.
[38] W. H. Grover, A. K. Bryan, M. Diez-Silva, S. Suresh, J. M. Higgins, and
S. R. Manalis. 2011. Measuring Single-cell Density. Proc. Natl. Acad. Sci. 108(27): 10992–6.
[39] J. L. Arlett and M. L. Roukes. 2010. Ultimate and Practical Limits of
Fluid-based Mass Detection with Suspended Microchannel Resonators.
J. Appl. Phys. 108(8): 084701–11.
[40] J. Lee, A. K. Bryan, and S. R. Manalis. 2011. High Precision Particle
Mass Sensing Using Microchannel Resonators In The Second Vibration
Mode. Rev. Sci. Instrum. 82(2): 02370401–04.
[41] J. Bühler, F. P. Steiner, and H. Baltes. 1997. Silicon Dioxide Sacrificial Layer Etching in Surface Micromachining. J. Micromechanics
Microengineering. 7(1): 1–13.
[42] J. W. Berenschot, N. R. Tas, T. S. J. Lammerink, M. Elwenspoek, and
A. Berg. 2002. Advanced Sacrificial Poly-Si Technology for Fluidic
Systems. J. Micromechanics Microengineering. 12(5): 621–624.
[43] E. B. Cummings and A. K. Singh. 2003. Dielectrophoresis in Microchips
Containing Arrays of Insulating Posts: Theoretical and Experimental
Results. Anal. Chem. 75(18): 4724–31.
[44] D. Di Carlo, N. Aghdam, and L. P. Lee. 2006. Single-cell Enzyme
Concentrations, Kinetics, and Inhibition Analysis Using High-density Hydrodynamic Cell Isolation Arrays. Anal. Chem. 78(14): 4925–30.
[45] J. E. Molloy and M. J. Padgett. 2002. Lights, Action: Optical Tweezers.
Contemp. Phys. 43(4): 241–258.
[46] M. Evander, L. Johansson, T. Lilliehorn, J. Piskur, M. Lindvall, S.
Johansson, M. Almqvist, T. Laurell, and J. Nilsson. 2007. Noninvasive
Acoustic Cell Trapping in a Microfluidic Perfusion System for Online
Bioassays. Anal. Chem. 79(7): 2984–91. [47] F. Chowdhury, S. Na, D. Li, Y. C. Poh, T. S. Tanaka, F. Wang, and N.
Wang. 2010. Material Properties of the Cell Dictate Stress-induced
Spreading and Differentiation in Embryonic Stem Cells. Nat. Mater.
9(1): 82–88.
[48] A. J. Engler, S. Sen, H. L. Sweeney, and D. E. Discher. 2006. Matrix
Elasticity Directs Stem Cell Lineage Specification. Cell. 126(4): 677–
89.
[49] A. Gupta, D. Akin, and R. Bashir. 2004. Single Virus Particle Mass Detection Using Microresonators with Nanoscale Thickness. Appl.
Phys. Lett. 84(11): 1976–1978.
[50] M. S. Pommer, Y. Zhang, N. Keerthi, D. Chen, J. a Thomson, C. D.
Meinhart, and H. T. Soh. 2008. Dielectrophoretic Separation of Platelets
from Diluted Whole Blood in Microfluidic Channels. Electrophoresis.
29(6): 1213–8.
[51] J. E. Sader, J. W. M. Chon, and P. Mulvaney. 1999. Calibration of
Rectangular Atomic Force Microscope Cantilevers. Rev. Sci. Instrum. 70(10): 3967–3969.
[52] D. Di Carlo, L. Y. Wu, and L. P. Lee. 2006. Dynamic Single Cell Culture
Array. Lab Chip. 6(11): 1445–9.
[53] J. M. Mitchison. 2003. Growth During the Cell Cycle. Int. Rev. Cytol.
226: 165–258.