just how low are china’s labor costs? - swarthmore … how low are china’s labor costs? * janet...
TRANSCRIPT

Just How Low are China’s Labor Costs? *
Janet Ceglowski Bryn Mawr College
Stephen Golub
Swarthmore College
November 4, 2005
Abstract
This paper provides a new perspective on Chinese international competitiveness in manufacturing using relative unit labor costs. We find that Chinese unit labor costs are about 25-40 percent of US labor costs. They are also low relative to costs in the EU, Japan, Mexico, Korea and most other newly industrializing countries. China’s cost advantage derives from large currency devaluations that preceded the establishment of a de facto peg around 1995, and rapid productivity growth in the period since 1995. The recent 2.1 percent revaluation of the yuan is much too small to have a significant effect on China’s relative unit labor costs.
JEL classification: F02, F14, F16, F31, J30
Keywords: China, labor costs, productivity, international competitiveness, real exchange rate
Ceglowski: Economics Department, Bryn Mawr College, Bryn Mawr PA 19010,
Voice: 610-526-5182, Fax: 610-526-7475, Email: [email protected] Golub: Economics Department, Swarthmore College, Swarthmore PA 19081,
Voice: 610-328-8103, Fax: 610-328-7352, Email: [email protected]
* We would like to thank Qing Ling for very helpful research assistance.

1
I. Introduction
“China’s emergence as one of the world’s leading export nations is driven by a huge disparity in the cost of producing goods, caused primarily by hourly wages that are a fraction of those in the United States and Western Europe… Typically, a U.S. or Western European factory worker costs an employer $15 to $30 per hour. A Chinese factory worker earns the equivalent of less than $1 per hour.” -- George Stalk and Dave Young, “How China Gets Our Business” The Washington Post, 3/7/04
China’s spectacular growth in manufactured exports (Figure 1) has elicited
widespread concerns in the United States and other developed countries about
deindustrialization and the loss of manufacturing jobs. China’s export success is often
attributed to unfairly low wages and an undervalued currency. The concerns about low
wages and an undervalued currency are closely related: both result in low Chinese labor
costs when expressed in competitors’ currencies. Political pressures for increasing trade
barriers on Chinese exports and for a revaluation of China’s currency, the yuan, have
intensified in Europe and the United States. In an attempt to defuse these pressures,
China revalued its currency by 2.1 percent in July 2005, and altered its exchange-rate-
setting policy from pegging to the US dollar to a basket peg. The yuan had been
effectively fixed at 8.3 to the dollar since the mid-1990s, following sustained and steep
devaluations in the 1980-1994 period (Figure 2). The extent of the undervaluation of the
Chinese currency remains highly controversial, however.1
Much attention is paid to China’s very low wages and pegged exchange rate, but
low wages by themselves do not guarantee that a country’s workers are competitive in the
1 For some recent discussions of China’s exchange rate and international competitiveness, see Funke and Rahn (2005), Adams et al (2004), Bosworth (2004), and Goldstein (2004).

2
world market for manufactured goods. Labor productivity also matters. This paper
attempts to shed some light on these issues through an analysis of China’s relative unit
labor costs (RULC) in manufacturing. As explained more fully below, unit labor costs
are the ratio of wages to labor productivity, and relative unit labor costs reflect currency
fluctuations as well as international differences in wages and labor productivity. Relative
unit labor costs therefore provide a compact measure of international competitiveness
that encapsulates the key sources of the controversy surrounding China’s phenomenal
export growth. Our objective is to calculate and analyze China’s manufacturing wages,
productivity and unit labor costs relative to those in the United States, the European
Union, Japan, Mexico, and other East Asian developing countries. We provide both a
snapshot of China’s bilateral RULC vis-à-vis these countries and an historical perspective
that traces the evolution of China’s RULC since 1980.
Turner and Van’t Dack (1993) and Turner and Golub’s (1997) surveys of the
literature conclude that relative unit labor costs in manufacturing are the best single
indicator of competitiveness. Where data are available, Hinkle and Nsengiyumba (1999)
also endorse the use of unit labor costs, for analysis of both levels and rates of change of
competitiveness. In addition to its clear intuitive appeal, relative unit labor cost is the key
relative price in a Ricardian model of trade (Golub and Hsieh 2000). Furthermore, in a
world where capital is mobile and production is footloose between countries, it is the
relative price of non-tradable inputs, notably labor, rather than outputs that matters.2 As
noted above, given the attention focused on Chinese wages, RULC are a very prominent
2 See Jones (1980, 2000) for theoretical analyses of globalization and the fragmentation of production pointing to the importance of the distinction between tradable and non-tradable inputs.

3
candidate for explaining China’s booming exports of manufactures. The concept and
methodology of this paper are based on previous studies of RULC in various countries by
one of the authors (Golub 1999, Mbaye and Golub 2003, Edwards and Golub 2004).
To our knowledge, there have been no previous systematic analyses of Chinese
RULC over time. UNCTAD (2002) computes bilateral Chinese RULC vis-à-vis a range
of developed and developing countries but the calculations are for a single year, 1998.
Cox and Koo (2003) report comparative wage and productivity data for China vis-à-vis
the United States and Mexico for 2001 but stop short of unit labor cost comparisons.
Szirmai, Ren, and Bai (2005) provide a careful analysis of relative Chinese labor
productivity over time, but do not cover relative wages and unit labor costs. Banister
(2004) is a detailed study of labor costs in Chinese manufacturing that includes a
meticulously-constructed estimate for 2002 but does not contain productivity or unit
labor cost estimates.
This paper provides more comprehensive measures of Chinese RULC than in the
prior literature. It pays careful attention to data and measurement issues in order to arrive
at unit labor cost measures for manufacturing that are comparable across countries. It
also provides time series estimates for Chinese RULC over a 23-year period. This time-
series perspective is used to trace the evolution of China’s competitive position in
manufacturing and to analyze the specific developments that have contributed to it. As
such, it can provide valuable insights into China’s emergence as a manufacturing
powerhouse.

4
II. Methodology
Let ai represent the unit labor requirement (the inverse of productivity) for home
country i:
(1) ai = i
i
VAL
where VA is value-added and L is labor employment. Marginal productivity and hence
ai are assumed to be constant with respect to variations in Li. If labor is the only factor of
production (or other factor costs do not differ across countries), average costs of
production are equal to unit labor costs, ULCi
(2) ULCi = wiLi
VAi
= wi ai
where w is the wage. Expressed in domestic currency, foreign (country j) unit labor costs
are e.wj.aj where e is the exchange rate between the home and foreign currencies.
Country i’s competitive position vis-à-vis country j depends on its bilateral relative unit
labor costs
(3) RULCij = aiwi
ajwjeij
RULCij can be decomposed as follows
(4) RULCij = aiwi
ajwjeij
= ai
aj
. wi
wjeij
= ai
aj
. wi
wjPPPij
. PPPij
eij
China’s competitiveness vis-à-vis other countries depends on the three terms in (4): 1)
labor productivity in China relative to other countries, 2) China’s wages relative to those

5
of other countries at an equilibrium or PPP exchange rate, and 3) the level of the yuan
exchange rate relative to its equilibrium level. Gains or losses in China’s competitive
position over time can originate with changes in any of these ratios.
III. Data
III.1. General considerations
We construct annual series for unit labor costs and relative unit labor costs in
Chinese manufacturing for 1980-2002. The sample period begins near the start of
China’s shift towards a market economy and ends in the year for which the latest data are
available.
To compare levels of real output and labor compensation across economies, they
must be converted to a common currency. Productivity is calculated as nominal
manufacturing value added per employee, deflated by the manufacturing value-added
deflator and converted to US dollars at an equilibrium or purchasing power parity (PPP)
exchange rate. Wages are defined as total labor compensation per employee, converted
to dollars at the market exchange rate. As is accepted in the literature on international
labor productivity and unit labor cost comparisons, PPP exchange rates are used for
international productivity comparisons to eliminate the effects of exchange-rate volatility
on measures of real output, which should be invariant to such exchange-rate fluctuations.
But deviations of exchange rates from PPP do affect relative labor costs, so it is
appropriate to use the market exchange rate in converting wages.3 Currency depreciation
3 See Hooper and Larin (1989) for further justification of the use of PPP exchange rates for productivity comparisons but market exchange rates for labor-cost comparisons.

6
consequently tends to improve international competitiveness by reducing labor costs
relative to labor productivity.
Two alternative measures of PPP exchange rates were used: the average real
exchange rate over 1980-2002 based on manufacturing value added deflators, and the
PPP derived from manufacturing unit values in Szirmai (2005).4 As these two methods
yielded very similar results, only the RULC based on average real exchange rates are
reported in the text.
III.2. Constructing Chinese unit labor costs
Chinese unit labor costs in manufacturing are calculated using data from the United
Nations Industrial Development Organization (UNIDO), the World Bank, and published
Chinese government documents. The available time-series data on Chinese labor
compensation, employment, and value added have some limitations.5 Given these
limitations, two alternative ULC series are constructed and the results are reported as a
range. The first series uses a narrow concept of the manufacturing sector that largely
excludes rural and small businesses, is based on census of manufacturing data, and omits
employer contributions to social insurance funds from labor compensation. The second
uses a more inclusive measure of manufacturing activity that covers rural and smaller
enterprises, is based on national accounts data, and includes employer contributions to
fringe benefits in labor compensation. Each of these two series, in turn, is then compared
4 See the appendix for further details on the computation of the PPP exchange rate. 5 As explained below, the coverage of some manufacturing measures is incomplete and changes over the sample period. Other measures, particularly those compiled by the Chinese government, are viewed as unreliable by some China scholars; see, for instance, Rawski and Xiao (2001).
7
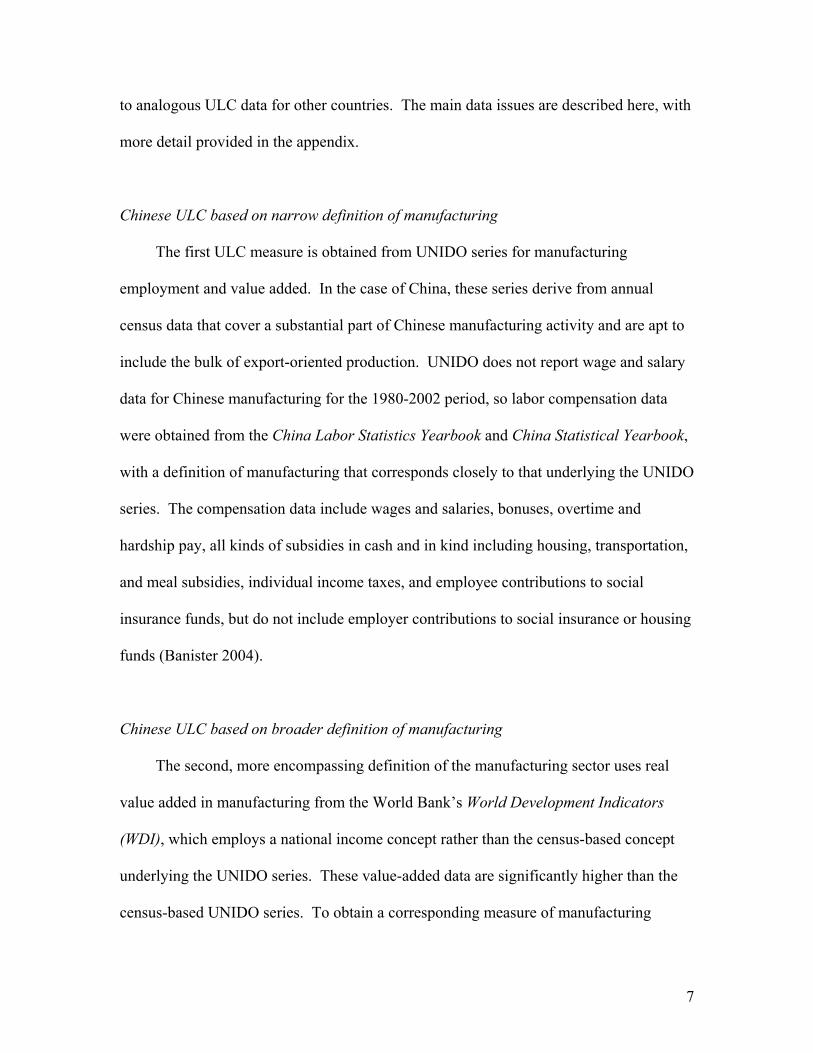
to analogous ULC data for other countries. The main data issues are described here, with
more detail provided in the appendix.
Chinese ULC based on narrow definition of manufacturing
The first ULC measure is obtained from UNIDO series for manufacturing
employment and value added. In the case of China, these series derive from annual
census data that cover a substantial part of Chinese manufacturing activity and are apt to
include the bulk of export-oriented production. UNIDO does not report wage and salary
data for Chinese manufacturing for the 1980-2002 period, so labor compensation data
were obtained from the China Labor Statistics Yearbook and China Statistical Yearbook,
with a definition of manufacturing that corresponds closely to that underlying the UNIDO
series. The compensation data include wages and salaries, bonuses, overtime and
hardship pay, all kinds of subsidies in cash and in kind including housing, transportation,
and meal subsidies, individual income taxes, and employee contributions to social
insurance funds, but do not include employer contributions to social insurance or housing
funds (Banister 2004).
Chinese ULC based on broader definition of manufacturing
The second, more encompassing definition of the manufacturing sector uses real
value added in manufacturing from the World Bank’s World Development Indicators
(WDI), which employs a national income concept rather than the census-based concept
underlying the UNIDO series. These value-added data are significantly higher than the
census-based UNIDO series. To obtain a corresponding measure of manufacturing

8
employment, we aggregated Chinese data on urban manufacturing employment and a
measure of manufacturing employment in township and village enterprises (TVEs), as in
Banister (2004). Though the China Labor Statistics Yearbook reports total
manufacturing employment, Banister suggests this total may undercount non-urban
employment by an increasing amount over time. Employment in rural manufacturing is
collected and reported by a different Chinese government agency than TVE employment,
and the data reveal a growing gap between the two measures with reported TVE
employment increasingly higher than reported rural employment.6 Adding the series for
urban and TVE employment yields total employment figures that are considerably larger
than the UNIDO data.
Rural workers, including most TVE employees, earn significantly less than urban
workers in Chinese manufacturing (Rawski 1999, 2003). For this reason, separate labor
compensation series were constructed for urban and TVE manufacturing. As noted
above, the wage data reported by the Chinese government exclude employer
contributions to social insurance funds and housing funds.7 These funds and their
contribution rates vary by municipality and the ownership of the enterprise. For instance,
the Social Security Administration (SSA) (2005) reports that social insurance plans apply
to urban enterprises and all state-owned enterprises but, for the most part, do not extend
to rural enterprises. A time series of employer contribution rates to social insurance
programs was constructed from information reported in SSA’s Social Security Programs
6 This possible undercounting is noted also by Szirmai et al (2005), who take a different approach to dealing with it. However Rawski (2003) reports massive, chronic exaggeration of TVE statistics, including employment data, in the late 1990s. 7 Li and Zax (2002) also indicate they exclude implicit housing subsidies due to the difficulty in assigning an explicit monetary value.

9
Throughout the World. For China, the contribution rates range from 3 percent of wages
in the early part of the sample period to as high as 35 percent more recently.8 Since these
rates apply primarily to urban enterprises, they were used to adjust the urban
compensation series, but not the TVE compensation series.
III.3. Constructing Chinese relative unit labor costs
Bilateral measures of Chinese RULC were constructed by pairing each series for
Chinese manufacturing ULC with ULC series for other countries that were constructed
from comparable data, ensuring that roughly similar concepts are used across countries in
making comparisons. That is, the UNIDO-based Chinese unit labor cost series was
compared with unit labor costs in other countries that were derived from the same
UNIDO database.9 In a similar way, the second, broader series for Chinese ULC was
paired with ULC for the United States and other countries based on Bureau of Labor
Statistics (BLS) data. The BLS data employ a national accounts-based concept of value
8 These contribution rates exclude contributions to housing funds. The housing funds are a relatively new development, limited in scope, for which scant data are available. The figure used to adjust the compensation data for 2002 is similar to the “lower-end” adjustment factors used by Banister. She reports the results of a 2004 survey of urban manufacturing enterprises which found that employer contributions to social insurance and housing funds averaged 32 percent of wages in 2002, a figure she uses as a lower-end bound for urban labor costs in 2002. But the same survey reports that total average labor costs were 1.58 times the average wage, Banister’s upper bound for urban wages. The latter is consistent with the 2001 data for labor costs in manufacturing reported in ILO (2003), which works out to 1.5 of the average urban wage. As time series for these labor compensation ratios are not available, we rely on the social insurance contribution rates reported in the various issues of Social Security Programs Throughout the World. 9 For all countries, the UNIDO-based ULC series employ a census concept of value added and exclude employer contributions to social insurance funds from reported labor compensation.

10
added and employment, as well as a measure of labor compensation that includes
employer-paid fringe benefits.
Each of these RULC measures has distinct strengths and shortcomings. The
Chinese RULC series based on the UNIDO data are apt to include the bulk of China’s
export-oriented manufacturing. They are also amenable to comparisons with a wide
range of countries due to the large number of countries that are included in the UNIDO
database. Another advantage is that the Chinese and partner country data are both
reported by UNIDO, providing at least some indication of international consistency in the
definitions of manufacturing value added, employment and labor compensation. A
downside of the UNIDO data for China is that they contain several changes in their
coverage of manufacturing firms. Comparative unit labor costs for the second, broader
measure are available for fewer, primarily industrial countries from the BLS. Because
the BLS does not report data for Chinese value added, World Bank data were used
instead, with uncertain comparability with the BLS definition of value added. However,
the broader coverage of the second RULC series provides a more comprehensive measure
of relative manufacturing competitiveness. It is also apt to better account for China’s
non-urban manufacturing activity and costs, whose importance has increased in recent
years due to the considerable growth in Chinese manufacturing employment outside of
urban areas.

11
IV. Results
IV.1. Chinese RULC vis-à-vis the United States
Figure 3 shows two RULC series for China, both relative to the United States. The
first pairs the UNIDO-based Chinese unit labor cost series with unit labor costs in the
United States that are derived from the same UNIDO database. The second series
compares the broader measure of Chinese unit labor costs to US costs derived from BLS
data on manufacturing value added, labor compensation, and employment. The two
series tell a similar story. Both indicate that China’s relative unit labor costs fell in the
first part of the sample period; the UNIDO-based series shows a drop in China’s costs
from 74 percent to about 40 percent of US unit labor costs while the second series falls
from 38 percent of US costs in 1980 to 27 percent in 2002. In both series these gains in
China’s competitive position are sustained through the end of the sample period, but they
have not widened to any significant degree since the mid-1990s. Still, Chinese labor
costs were very low in 2002 even after accounting for productivity differences.
Table 1 breaks down the observed changes in China’s unit labor costs into their
constituent components for both measures of ULC. The sample period is split at 1995,
when the de facto dollar peg appears in the exchange rate series. According to both
measures, Chinese labor compensation per worker grew rapidly in local currency terms
throughout the 1980-2002 period, at more than 10 percent annually. It substantially
outpaced productivity growth prior to 1995. But Chinese productivity growth accelerated
in the most recent period, with the average annual growth rate of output per person
roughly doubling to 11-12 percent annually, depending on the measure of productivity

12
used. As a result, China’s ULC in yuan terms rose at an annual rate of 5-7.6 percent until
1995 but fell between 1995 and 2002.
Unit labor costs in dollar terms exhibit a similar pattern over 1995-2002, but they
display a very different trend than ULC in local currency terms before then. The yuan
depreciated by an average of 8 percent a year between 1980 and 1995, leading to an
overall fall in unit labor costs, measured in dollar terms, of 1-3 percent a year despite the
5-7 percent annual increase in local-currency unit labor costs. Since 1995 the changes in
Chinese unit labor costs measured in dollars have been nearly identical to the changes
measured in yuan, reflecting the exchange rate peg.
Table 2 presents a breakdown of changes over time of China’s relative unit labor
costs measured against the United States in dollar terms. This measure of China’s RULC
exhibits the same pattern over time as China’s dollar-based unit labor cost series. The
China/United States RULC declined by 2-4 percent annually between 1980 and 1995.
That trend did not continue apace after 1995, despite a substantial rise in the growth rate
of China’s value added per person relative to that of the United States, reflecting the
continued high growth in Chinese labor compensation and the absence of further yuan
depreciation.
Table 3 compares the levels of China’s manufacturing productivity, labor
compensation, and unit labor costs with their US counterparts for the two measures
described above for selected years.10 Both measures show that China’s labor
compensation and productivity levels have grown but remain small fractions of their US
10 As is apparent in the table, the principal difference in the two sets of estimates is in the relative wage costs, which are consistently lower in the second series based on the World Bank and BLS data.
13
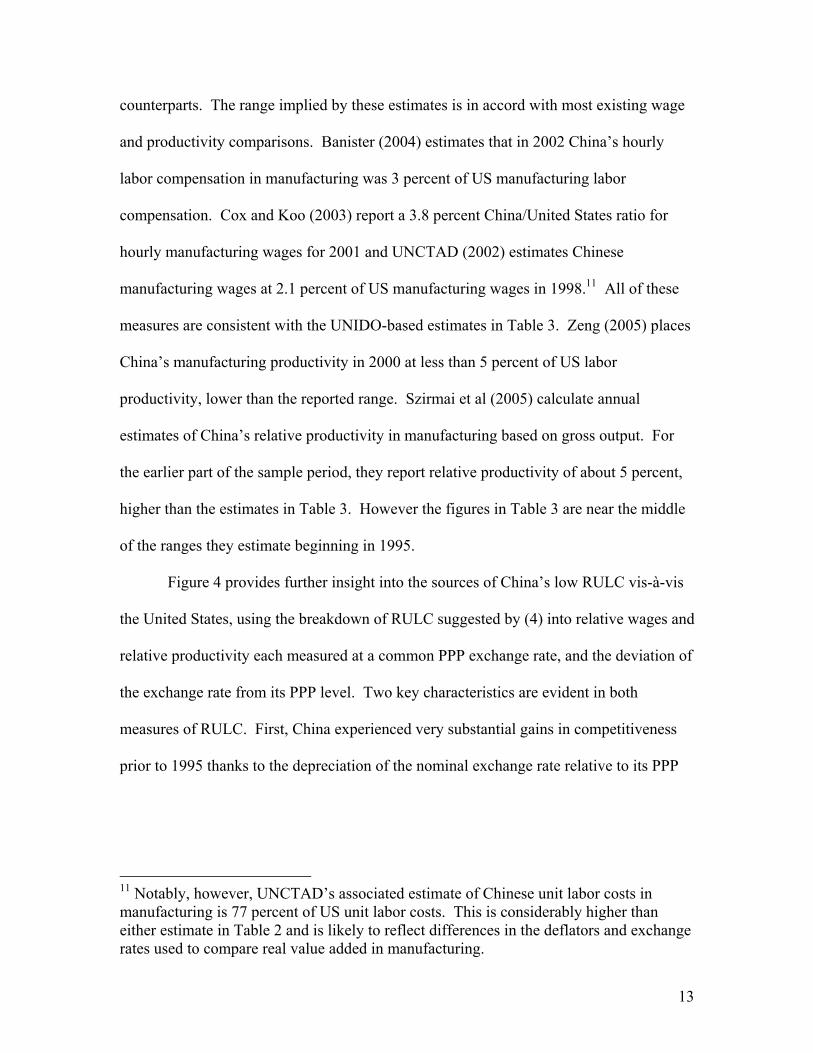
counterparts. The range implied by these estimates is in accord with most existing wage
and productivity comparisons. Banister (2004) estimates that in 2002 China’s hourly
labor compensation in manufacturing was 3 percent of US manufacturing labor
compensation. Cox and Koo (2003) report a 3.8 percent China/United States ratio for
hourly manufacturing wages for 2001 and UNCTAD (2002) estimates Chinese
manufacturing wages at 2.1 percent of US manufacturing wages in 1998.11 All of these
measures are consistent with the UNIDO-based estimates in Table 3. Zeng (2005) places
China’s manufacturing productivity in 2000 at less than 5 percent of US labor
productivity, lower than the reported range. Szirmai et al (2005) calculate annual
estimates of China’s relative productivity in manufacturing based on gross output. For
the earlier part of the sample period, they report relative productivity of about 5 percent,
higher than the estimates in Table 3. However the figures in Table 3 are near the middle
of the ranges they estimate beginning in 1995.
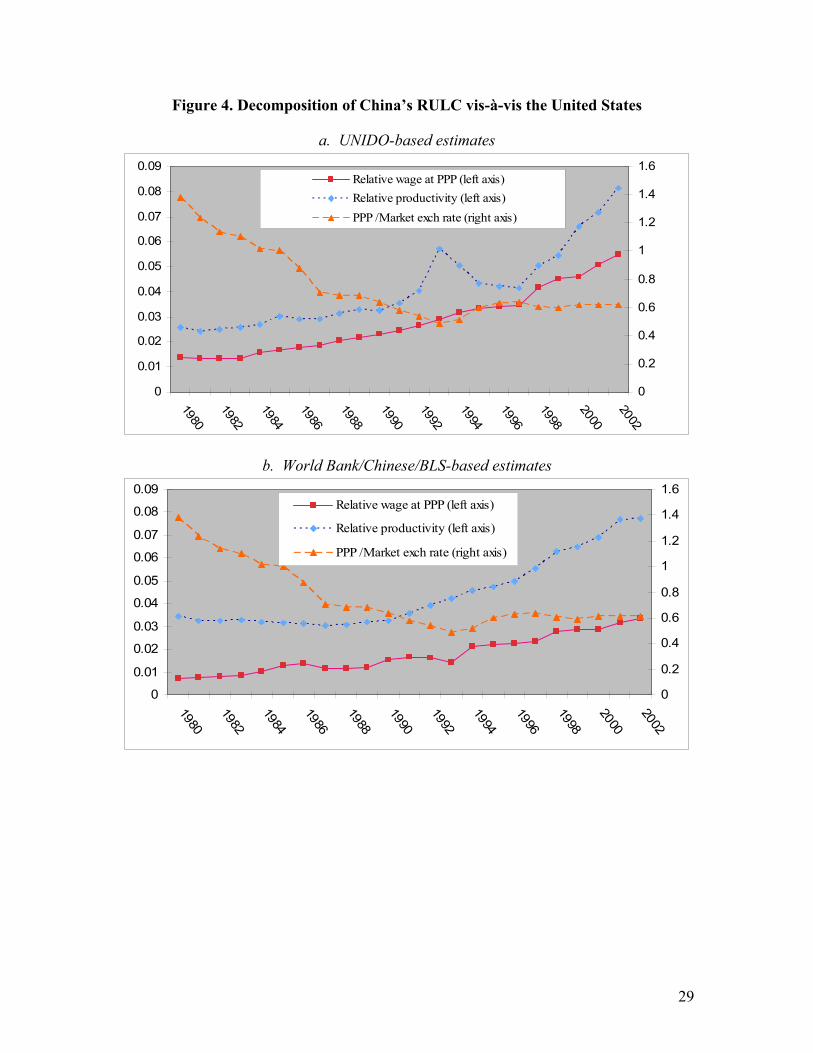
Figure 4 provides further insight into the sources of China’s low RULC vis-à-vis
the United States, using the breakdown of RULC suggested by (4) into relative wages and
relative productivity each measured at a common PPP exchange rate, and the deviation of
the exchange rate from its PPP level. Two key characteristics are evident in both
measures of RULC. First, China experienced very substantial gains in competitiveness
prior to 1995 thanks to the depreciation of the nominal exchange rate relative to its PPP
11 Notably, however, UNCTAD’s associated estimate of Chinese unit labor costs in manufacturing is 77 percent of US unit labor costs. This is considerably higher than either estimate in Table 2 and is likely to reflect differences in the deflators and exchange rates used to compare real value added in manufacturing.

14
level.12 That is, the yuan experienced a real depreciation relative to its equilibrium level
of more than 50 percent between 1980 and 1995. Second, when both wages and
productivity are measured with the PPP exchange rate in order to control for exchange
rate movements, China’s relative productivity consistently exceeds China’s relative wage.
In short, China’s low RULC reflect both the sustained depreciation of the yuan prior to
1995 and low wages relative to productivity measured at a constant exchange rate, with
this wage-productivity gap widening moderately since 1995.
IV.2. Chinese RULC vis-a-vis other countries
Table 4 presents two sets of estimates of Chinese relative wages, productivity and
unit labor costs against selected developed and developing countries for 2002. The first
set compares wages, productivity, and unit labor costs based on the UNIDO data for
China and each comparator country. The second set pairs the broader measures of the
same Chinese series calculated from World Bank and Chinese sources with comparable
BLS measures for the United States, Japan, and the EU. For other countries for which no
BLS data are available, the second RULC measure is imputed using the UNIDO-based
RULC between the United States and each specific comparator country and the broader
China/United States RULC.13
12 This shows up in Figure 4 as a fall in the ratio of the PPP exchange rate to the market exchange rate. The two measures of PPP exchange rates yield very similar results in this regard. 13 For both sets of RULC estimates, the calculations start by computing the bilateral RULC between each comparator country and the US. For example, the bilateral RULC for Mexico vis-à-vis the United States (RULCM-US
UNIDO) is calculated from UNIDO data. Bilateral China-Mexico RULC (RULCC-M
UNIDO) for the narrow definition is then obtained by taking the ratio
15
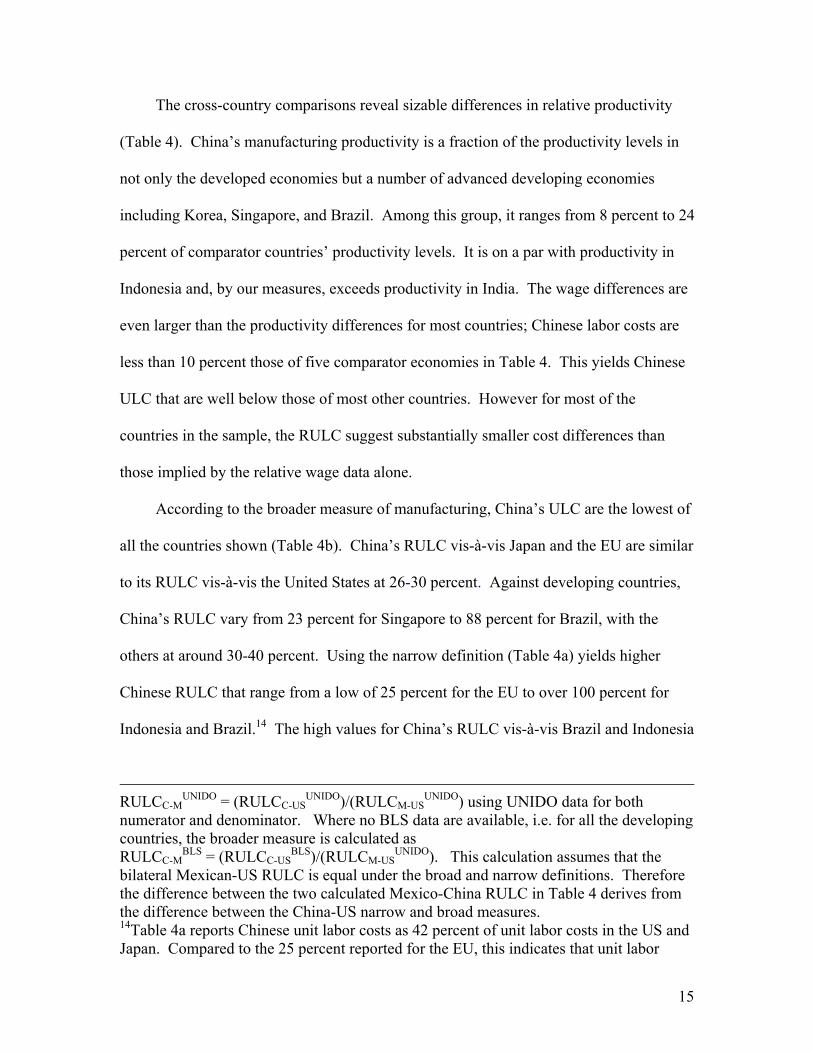
The cross-country comparisons reveal sizable differences in relative productivity
(Table 4). China’s manufacturing productivity is a fraction of the productivity levels in
not only the developed economies but a number of advanced developing economies
including Korea, Singapore, and Brazil. Among this group, it ranges from 8 percent to 24
percent of comparator countries’ productivity levels. It is on a par with productivity in
Indonesia and, by our measures, exceeds productivity in India. The wage differences are
even larger than the productivity differences for most countries; Chinese labor costs are
less than 10 percent those of five comparator economies in Table 4. This yields Chinese
ULC that are well below those of most other countries. However for most of the
countries in the sample, the RULC suggest substantially smaller cost differences than
those implied by the relative wage data alone.
According to the broader measure of manufacturing, China’s ULC are the lowest of
all the countries shown (Table 4b). China’s RULC vis-à-vis Japan and the EU are similar
to its RULC vis-à-vis the United States at 26-30 percent. Against developing countries,
China’s RULC vary from 23 percent for Singapore to 88 percent for Brazil, with the
others at around 30-40 percent. Using the narrow definition (Table 4a) yields higher
Chinese RULC that range from a low of 25 percent for the EU to over 100 percent for
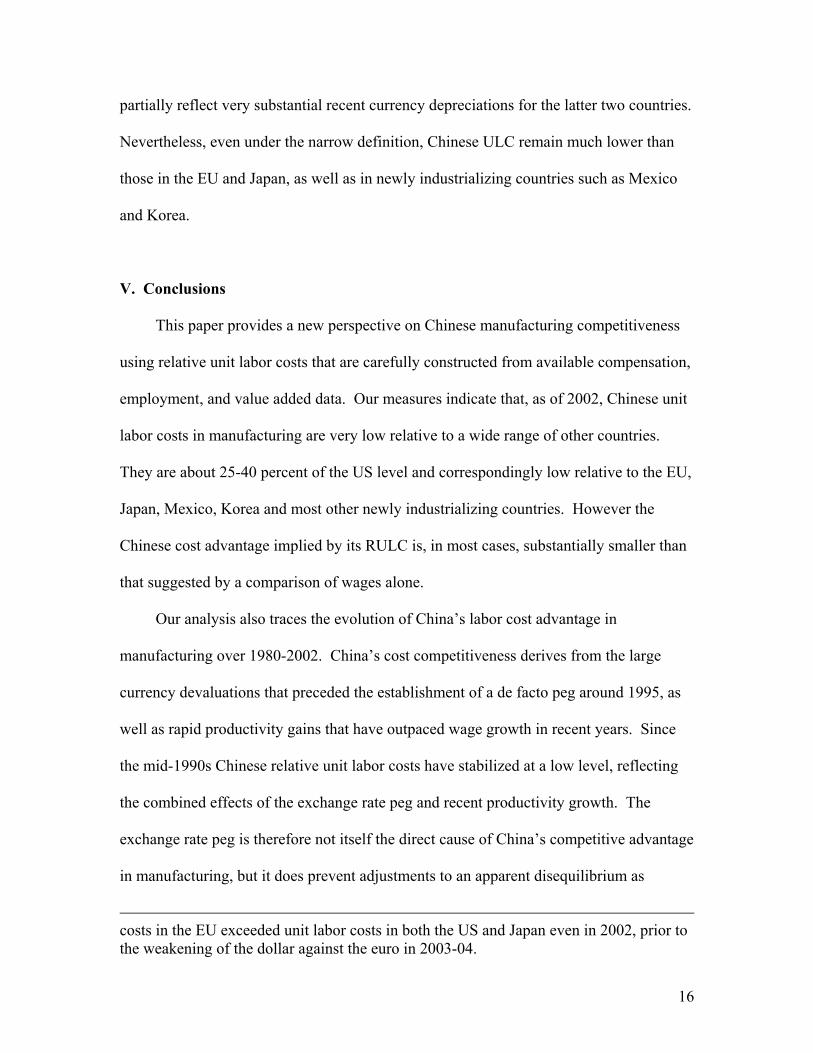
Indonesia and Brazil.14 The high values for China’s RULC vis-à-vis Brazil and Indonesia
RULCC-M
UNIDO = (RULCC-USUNIDO)/(RULCM-US
UNIDO) using UNIDO data for both numerator and denominator. Where no BLS data are available, i.e. for all the developing countries, the broader measure is calculated as RULCC-M
BLS = (RULCC-USBLS)/(RULCM-US
UNIDO). This calculation assumes that the bilateral Mexican-US RULC is equal under the broad and narrow definitions. Therefore the difference between the two calculated Mexico-China RULC in Table 4 derives from the difference between the China-US narrow and broad measures. 14Table 4a reports Chinese unit labor costs as 42 percent of unit labor costs in the US and Japan. Compared to the 25 percent reported for the EU, this indicates that unit labor
16
partially reflect very substantial recent currency depreciations for the latter two countries.
Nevertheless, even under the narrow definition, Chinese ULC remain much lower than
those in the EU and Japan, as well as in newly industrializing countries such as Mexico
and Korea.
V. Conclusions
This paper provides a new perspective on Chinese manufacturing competitiveness
using relative unit labor costs that are carefully constructed from available compensation,
employment, and value added data. Our measures indicate that, as of 2002, Chinese unit
labor costs in manufacturing are very low relative to a wide range of other countries.
They are about 25-40 percent of the US level and correspondingly low relative to the EU,
Japan, Mexico, Korea and most other newly industrializing countries. However the
Chinese cost advantage implied by its RULC is, in most cases, substantially smaller than
that suggested by a comparison of wages alone.
Our analysis also traces the evolution of China’s labor cost advantage in
manufacturing over 1980-2002. China’s cost competitiveness derives from the large
currency devaluations that preceded the establishment of a de facto peg around 1995, as
well as rapid productivity gains that have outpaced wage growth in recent years. Since
the mid-1990s Chinese relative unit labor costs have stabilized at a low level, reflecting
the combined effects of the exchange rate peg and recent productivity growth. The
exchange rate peg is therefore not itself the direct cause of China’s competitive advantage
in manufacturing, but it does prevent adjustments to an apparent disequilibrium as
costs in the EU exceeded unit labor costs in both the US and Japan even in 2002, prior to the weakening of the dollar against the euro in 2003-04.

17
measured by relative unit labor costs. The recent 2 percent revaluation of the yuan is
much too small to have a significant effect on China’s relative unit labor costs.

18
Appendix
This appendix details the sources and construction of the manufacturing value
added, employment, compensation, and exchange rate series that form the basis of the
Chinese unit labor cost and relative unit labor cost series for manufacturing. The first
ULC series employs a narrow, census-based measure of manufacturing production and
employment, using UNIDO data. It focuses on urban, large-scale manufacturing. The
second ULC series uses a broader concept of manufacturing, based on a national accounts
measure of value added and total manufacturing employment. Its inclusion of small and
rural manufacturing activities and costs provides a more comprehensive measure of unit
labor costs. Comparable ULC series are calculated for other countries and combined
with the Chinese ULC series to yield relative unit labor cost measures.
Chinese unit labor costs based on narrow definition of manufacturing
This ULC series is calculated from data for manufacturing value added and
employment from the UNIDO INSTAT database, and Chinese data for labor
compensation. The UNIDO employment and value-added series for Chinese
manufacturing are census data reported by the Chinese authorities. Their coverage varies
over the sample period of 1980-2002. The value-added data pertain to enterprises with
independent accounting systems for the period 1980-1997 and to industrial enterprises
that are state-owned or independent with annual sales of at least 5 million yuan for the
period 1998-2002.15 The UNIDO employment data are consistent with these two
15 Szirmai et al (2005) report that in 1978 enterprises with independent accounting systems accounted for most industrial output and employment but that this coverage has steadily fallen since then due to changes in ownership structure and the limited coverage

19
reporting bases for the period 1990-2002 but not for the period 1980-1989.16 Therefore
manufacturing staff and workers from the China Labor Statistics Yearbook have been
used instead of the reported UNIDO employment data for 1980-1989.17
As noted above, the reporting base for the employment and value-added series
changes in 1998. The new base excludes small enterprises and is thus less
comprehensive than the old base.18 Holz and Lin (2001) indicate that this change
introduces a discontinuity in the series but that the new reporting base may provide more
accurate data, citing concerns about the reliability of statistics collected on small
township enterprises that are excluded under the new system. Another break, reported by
UNIDO, occurs in 1993 due to the introduction of a new statistical system. These
changes have the potential to affect the consistency of the unit labor cost series over time.
UNIDO reports manufacturing value added in nominal terms. This series is
converted to real terms by applying the World Bank’s implicit value-added deflator for
manufacturing from WDI. There are large increases in the deflator in the mid-1990s.
When it is applied to UNIDO’s value-added data, the resulting real value-added series
exhibits substantial volatility. This volatility is not apparent in the real value-added series
reported by the World Bank. For this reason, the UNIDO value-added data were
of the reported statistics. The change in the reporting base in 1998 excludes small manufacturing enterprises. 16 For 1980-1989 UNIDO reports formal employment in state-owned enterprises. 17 Staff and workers refer to formal employees on the payroll of state, collective, and other ownership units for 1980-1997 and formal, on-post employees on the payroll of the same ownership units beginning in 1998. The employment data reported in the China Labor Statistics Yearbook are end-year figures. Therefore, the year-end data were averaged to yield an average annual employment series. 18 Another potential source of discontinuity in the employment series occurs in 1998, when furloughed workers were no longer counted among the employed. This change, along with the narrowing of the reporting base, could account for the substantial drop in the number of manufacturing employees reported by UNIDO in 1998.

20
smoothed to accord with the World Bank data by applying the growth rate in the real
World Bank series to the real value-added series derived from the UNIDO data beginning
in 1993.
Compensation data reported in the China Labor Statistics Yearbook and China
Statistical Yearbook were used to construct a series that corresponds to average annual
labor compensation in China’s urban manufacturing sector. Starting in 1994 the
yearbooks report average compensation per worker for urban units, a concept that
includes staff and workers, urban reemployed retirees and foreign, Hong Kong, Macao,
and Taiwan employees in urban manufacturing (Banister 2004) but excludes self-
employed urban workers, urban workers in relatively small privately-owned and –
operated enterprises, and rural workers in manufacturing. This series is used as a proxy
for average compensation in urban manufacturing. No such series is available prior to
1994 so average compensation for manufacturing staff and workers is used instead.19
Chinese ULC based on broader definition of manufacturing
This alternative employs a broader measure of the manufacturing sector that
includes small and rural enterprises. It combines the World Bank’s national accounts-
based measure of real manufacturing value added from WDI with series for
manufacturing employment and labor compensation that were constructed from data
published by the Chinese government.
19 This is probably a reasonable substitution as employment data reported in the China Labor Statistics Yearbook indicate little difference between staff and workers and urban employment in manufacturing in the early years of the sample period during China’s transition to a more market-oriented production system.
21
Total employment in manufacturing is calculated as the sum of urban
manufacturing employment (reported in the China Labor Statistics Yearbook) and an
estimate of TVE employment in manufacturing, based on the methodology employed by
Banister (2004). TVE employment in manufacturing is reported only for 2002; in all
other years, only TVE employment in industry (which includes mining, utilities, and
manufacturing) is reported. In 2002 TVE employment in manufacturing was 92.4
percent of total TVE industry employment. Applying this ratio to the series for TVE
employment in industry yields an estimated time series for TVE employment in
manufacturing. The results were added to the reported total for urban manufacturing
employment to derive a series for total manufacturing employment for the entire 1980-
2002 period.20
Total labor compensation is constructed as the sum of total urban manufacturing
compensation and total compensation in manufacturing TVEs. Total urban
manufacturing compensation is the product of urban manufacturing employment and
average urban labor compensation. The latter is based on the average urban
compensation series detailed above.21 It is adjusted to account for employers’
20 One shortcoming of this series is the possible undercounting of rural migrants working in urban manufacturing plants but registered in rural locales. Banister (2004) reports that these workers are supposed to be included as on-post staff and workers but their numbers may be underreported by employers. 21 The urban compensation series applies to urban units so it excludes labor costs for self-employed urban manufacturing workers and urban workers in small privately-owned and –operated manufacturing enterprises. By applying it to total urban employment, we are implicitly assuming that it is a reasonable estimate of average compensation for those urban workers operating outside of urban units. In the relative unit labor cost estimates, these data are paired with comparable US data from the BLS. The BLS handles similar data gaps as follows: it does not include compensation data for very small enterprises and assumes that self-employed workers earn the same hourly compensation as the average for wage and salary employees (Banister 2004).

22
contributions to social insurance funds, as described in the text.22 Total compensation in
TVE manufacturing is calculated as the product of our estimate of TVE employment and
an imputed series for average labor compensation in manufacturing TVEs. There is no
published series of average compensation for TVE manufacturing workers. However
Banister (2004) reports total compensation in TVE manufacturing enterprises for 2002,
dividing that figure by total year-end TVE manufacturing employment to derive an
average compensation figure of 6927 yuan for TVE manufacturing workers in that year.
This is 62.11 (62.97) percent of the average compensation reported for manufacturing
workers in urban units (staff and workers) for the same year. We applied these two ratios
to the series for average urban compensation to infer average TVE manufacturing
compensation for the earlier years. This average is multiplied by TVE manufacturing
employment and the result is added to total urban manufacturing compensation to arrive
at total labor compensation in manufacturing. This total is divided by the sum of urban
employment and TVE employment to calculate average compensation per worker.
Unit labor costs for other countries
Two main sources of information were used to calculate productivity, wages, and
ULC for the other countries in the sample: the UNIDO INSTAT database and the US
BLS. The UNIDO value-added series is in nominal terms and was deflated by the
WDI’s implicit manufacturing value-added deflator to yield a measure of real value
added. For each partner country, this real value-added measure was combined with
22 The adjustment factors are based on contribution rates reported in the SSA’s Social Security Programs Throughout the World, which is published biennially. In the interim years, the last reported contribution rates were used. In instances where contribution ranges were reported, simple averages were used.

23
UNIDO data for employment and wages to yield a census-based measure of ULC that
excludes employer contributions to fringe benefits. The UNIDO data were used for all
countries shown in Table 4a of the text.
A second ULC measure was calculated for those countries for which the BLS
collects and reports compensation and productivity data, consisting almost entirely of
developed countries. We used the BLS series to construct RULC for the European
Union, Japan, and the United States as shown in Table 4b. The BLS value-added data are
based on a national-accounts concept and its compensation series include employer-paid
fringe benefits. There are no BLS data for developing countries.
Nominal and PPP exchange rates
The average annual exchange rate series that were used to convert labor
compensation to US dollars are from WDI. Notably, China had multiple exchange rates
in the early part of the sample period. The World Bank’s exchange rate series for China
consists of a weighted average of multiple exchange rates for 1980-1993 and the official
exchange rate beginning in 1994 (World Bank 1995).
Two alternative methods of computing equilibrium exchange rates for use in
productivity comparisons between countries were tried: 1) the average bilateral real
exchange rate over the sample period and 2) the manufacturing PPP based on relative unit
value ratios from Smirzai et al (2005). The first method of calculating a benchmark PPP
exchange rate can be used for all countries in the sample as it is based on the average
value of the real exchange rate vis-à-vis the United States over 1980-2002, using value
added deflators in manufacturing as the price index. However it implicitly assumes that

24
the average value of the real exchange rate over the sample period is a good proxy for its
long-run value. This may be questionable, particularly in the case of China because of
the government’s extensive control over the foreign exchange market and goods market
prices, thereby limiting the role of market forces in inducing mean reversion of real
exchange rates towards equilibrium. An alternative PPP exchange rate can be derived
from ICOP’s 1995 unit value ratio benchmark for China and the United States (Szirmai et
al, 2005). This is an estimate of the value of the yuan/dollar exchange rate that would
equate the prices of comparable baskets of manufactured goods in the two countries. The
price comparisons are derived from detailed, comparable data on output volumes and
values for specific manufacturing products in China and the United States in 1995. This
benchmark PPP exchange rate for 1995 was combined with the US and Chinese value-
added deflators for manufacturing to interpolate a series for the PPP exchange rate over
1980-2002. However, because ICOP’s 1995 benchmark value (4.6 yuan/dollar) is not
substantially different from the value of our PPP exchange rate series in 1995 (5.0
yuan/dollar) the effect on China’s relative productivity is minor and it yields marginally
lower relative unit labor costs.

25
References
Adams, F. Gerard, Byron Gangnes, and Yochanana Schachmurove (2004) “Why is China so
Competitive?” Singapore Management University Economics and Statistics Working Paper 07-2004, March.
Banister, Judith (2004) “Manufacturing Employment and Compensation in China,” unpublished paper prepared for United States Bureau of Labor Statistics, December (Washington).
Bosworth, Barry (2004) “Valuing the Renminbi” paper presented at the Tokyo Club Research Meeting, February.
Cox, W. Michael and Jahyeong Koo (2003) “China: Awakening Giant” Southwest Economy, 5, September/October, Federal Reserve Bank of Dallas.
Edwards, Lawrence and Stephen Golub (2004) “South Africa’s International Cost Competitiveness and Exports in Manufacturing,” World Development, August.
Funke, Michael and George Rahn (2005) “Just How Undervalued in the Chinese Renminbi?” World Economy, 465-489.
Goldstein, Morris (2004) “Adjusting China’s Exchange Rate Policies,” (Washington: Institute for International Economics).
Golub, Stephen (1999) Labor Costs and International Trade (Washington: American Enterprise Institute).
Golub, Stephen and Chang-Tai Hsieh (2000) “The Classical Theory of Comparative Advantage Revisited,” Review of International Economics, 8 (2) May: 221-234.
Hinkle Larry E. and Fabien Nsengiyumba (1999) “External real exchange rates: Purchasing power parity, the Mundell Fleming model, and competitiveness in traded goods” in L. E. Hinkle and P. J. Montiel (eds.), Exchange Rate Misalignment: Concepts and Measurement (Washington DC:Oxford University Press).
Holz, Carsten and Yi-min Lin (2001) “The 1997-1998 Break in Industrial Statistics Facts and Appraisal” China Economic Review, 12, 303-316.
Hooper, Peter and K. Larin (1989) “International comparisons of labor costs in manufacturing” Review of Income and Wealth, 35, 4, 335-355.
International Labor Office (2003) Yearbook of Labor Statistics (Geneva). Jones, Ronald W. (1980) "Comparative and Absolute Advantage," Swiss Journal of
Economics and Statistics 3: 235-260. Jones, R. W. (2000). Globalization and the Theory of Input Trade (Cambridge: MIT
Press). Li, Haizheng and Jeffrey Zax (2002) “Economic Transition and the Labor Market in
China” unpublished manuscript, http://www.prism.gatech.edu/~hl45/research/lbmkt.pdf.
Mbaye, Aly and Stephen Golub (2003) “Unit Labor Costs, International Competitiveness, and Exports: the Case of Senegal” Journal of African Economies, 2, 219-248.
National Bureau of Statistics, China Labor Statistics Yearbook (China). National Bureau of Statistics, China Statistical Yearbook (China). Rawski, Thomas (1999) “China: Prospects for Full Employment” Employment and
Training Paper 47 (International Labor Office, Geneva).

26
Rawski, Thomas (2003) “Recent Developments in China’s Labor Economy” International Policy Group Working Paper 11 (International Labor Office, Geneva).
Rawski, Thomas and Wei Xiao (2001) “Roundtable on Chinese Economic Statistics: Introduction” China Economic Review, 12, 298-302.
Social Security Administration Social Security Programs Throughout the World Asia and the Pacific, 2002, 2005.
Social Security Administration Social Security Programs Throughout the World, 1981, 1983, 1985, 1987, 1989, 1991, 1993, 1995, 1997, 1999.
Szirmai, Adam, Ruoen Ren, and Manyin Bai (2005) “Chinese Manufacturing Performance in Comparative Perspective, 1980-2002” Economic Growth Center Discussion Paper 920 (Yale University).
Turner, Anthony G. and Stephen S. Golub (1997) “Towards a system of unit labor cost-based competitiveness indicators for advanced, developing and transition countries” Staff Studies for the World Economic Outlook (Washington: IMF).
Turner, Philip and J. Van't Dack (1993) “Measuring international price and cost competitiveness” Bank for International Settlements Economic Paper No. 39, November.
UNCTAD (2002) “China’s Accession to WTO: Managing Integration and Industrialization” Trade and Development Report 2002, 141-174 (Geneva).
UNIDO (2005) INSTAT database (Vienna). UNIDO, International Yearbook of Industrial Statistics (Vienna). United States Bureau of Labor Statistics (BLS) (2005), “Underlying Data for Indexes of Output
per Hour, Hourly Compensation, and Unit Labor Costs in Manufacturing,” unpublished data provided upon request (Washington).
World Bank (1995) World Tables (Washington). World Bank, World Development Indicators online (Washington). Zeng, Douglas (2005) “China’s Employment Challenges and Strategies after the WTO
Accession” World Bank Policy Research Working Paper 3522, February (Washington).

27
Figure 1. China’s share of world manufactured exports
0.0%
1.0%
2.0%
3.0%
4.0%
5.0%
6.0%
7.0%
8.0%
1980
1981
1982
1983
1984
1985
1986
1987
1988
1989
1990
1991
1992
1993
1994
1995
1996
1997
1998
1999
2000
2001
2002
2003
Source: authors calculations, based on World Trade Organization, http://stat.wto.org/StatisticalProgram/WSDBStatProgramHome.aspx?Language=E
Figure 2. China’s exchange rate (yuan per dollar)
0
1
2
3
4
5
6
7
8
9
10
1980
1981
1982
1983
1984
1985
1986
1987
1988
1989
1990
1991
1992
1993
1994
1995
1996
1997
1998
1999
2000
2001
2002
2003
2004
2005
Source: World Bank, World Development Indicators

28
Figure 3. China/United States relative unit labor costs in manufacturing
(United States= 1)
0
0.1
0.2
0.3
0.4
0.5
0.6
0.7
0.8
1980 1981 1982 1983 1984 1985 1986 1987 1988 1989 1990 1991 1992 1993 1994 1995 1996 1997 1998 1999 2000 2001 2002
UNIDO-based series World Bank/Chinese/BLS-based series
29
Figure 4. Decomposition of China’s RULC vis-à-vis the United States
a. UNIDO-based estimates
0
0.01
0.02
0.03
0.04
0.05
0.06
0.07
0.08
0.09
1980
1982
1984
1986
1988
1990
1992
1994
1996
1998
2000
2002
0
0.2
0.4
0.6
0.8
1
1.2
1.4
1.6Relative wage at PPP (left axis)Relative productivity (left axis)PPP /Market exch rate (right axis)
b. World Bank/Chinese/BLS-based estimates
0
0.01
0.02
0.03
0.04
0.05
0.06
0.07
0.08
0.09
1980
1982
1984
1986
1988
1990
1992
1994
1996
1998
2000
2002
0
0.2
0.4
0.6
0.8
1
1.2
1.4
1.6Relative wage at PPP (left axis)
Relative productivity (left axis)
PPP /Market exch rate (right axis)

30
Table 1. China’s unit labor costs, 1980-2002 (average annual growth rates in percent)
1980-2002
1980-1995
1995-2002
ULC, UNIDO-based series
Real value added per person 9.3 7.8 12.3Labor compensation per person in yuan 12.3 12.9 10.9 in dollars 6.6 4.6 11.0Unit labor costs in yuan 3 5.0 -1.4 in dollars -2.6 -3.3 -1.3
ULC, World Bank/Chinese-based series Real value added per person 7.2 5.4 11.1Labor compensation per person in yuan 12.1 13.1 9.9 in dollars 6.4 4.8 10.0Unit labor costs in yuan 4.8 7.6 -1.2 in dollars -0.8 -0.7 -1.0 Yuan/dollar exchange rate 5.6 8.3 -0.1

31
Table 2. China/United States relative unit labor costs in dollars, 1980-2002
(average annual growth rates in percent)
1980-2002
1980- 1995
1995-2002
China/US RULC, UNIDO-based series Relative real value added per person 5.1 4.4 6.6Relative labor compensation per person 2.6 0.3 7.6Relative unit labor costs -2.5 -4.1 1.0
China/US RULC, World Bank/Chinese/BLS-based series
Relative real value added per person 3.6 2.1 6.9Relative labor compensation per person 2.1 0 6.6Relative unit labor costs -1.6 -2.1 -0.3
Table 3. China’s competitive position
(as a percent of United States levels)
1980 1985 1990 1995 2000 2002
UNIDO-based estimates
Relative labor compensation per person 1.9 1.7 1.5 2.0 2.8 3.4
Relative value added per person 2.6 3.0 3.2 5.0 7.2 7.9
Relative unit labor costs 73.7 55.4 45.5 39.9 39.0 42.8
World Bank/Chinese/BLS-based estimates
Relative labor compensation per person 1.3 1.1 1.1 1.3 1.8 2.1
Relative value added per person 3.5 3.2 3.3 4.8 6.9 7.7
Relative unit labor costs 38.1 34.2 32.8 27.6 25.9 27.0

32
Table 4.
Chinese productivity, wages, and RULC vis-à-vis selected countries, 2002 (as a percent of comparator country levels)
a. UNIDO-based estimates (narrow definition of manufacturing)
UNIDO Relative
productivityRelative
wage RULC United States 8.1 3.4 41.6 Japan** 10.3 4.3 41.6 EU average# 14.6 3.7 25.0 India 160.3 100.3 62.6 Indonesia 107.9 118.0 109.3 Malaysia** 43.6 27.5 62.9 Korea** 12.2 8.6 70.2 Singapore** 17.5 6.3 35.9 Mexico* 29.6 15.9 53.7 Brazil 23.9 32.4 135.4
b. World Bank/Chinese/BLS-based estimates (broad definition)
Relative
productivityRelative
wage RULC United States 7.7 2.1 27.0 Japan 8.7 2.6 30.3 EU average# 10.7 2.8 25.8 India 152.1 61.8 40.6 Indonesia 102.4 72.6 70.9 Malaysia** 41.4 16.9 40.8 Korea** 11.6 5.3 45.5 Singapore** 16.6 3.9 23.3 Mexico* 28.1 9.8 34.9 Brazil 22.7 19.9 87.8
# France, Italy, UK, Sweden, Netherlands, Belgium *2000 **2001.