justice reinvestment: increasing public safety and ... · justice reinvestment: increasing public...
TRANSCRIPT

1
Justice Reinvestment: Increasing Public Safety and
Managing the Growth of Pennsylvania Prison Population
Dr. Tony Fabelo
Fred C. Osher, MD
Michael ThompsonJune 4, 2007
Harrisburg, PA

2
Overview
Challenge
Drivers
Options
2

3
The PDOC Population Has Grown Significantly Since 1999 and the Growth Has Accelerated in 2007
45,201
42,44644,365 44,625
42,544
36,384 36,81037,995
40,09040,817 40,965
30,000
34,000
38,000
42,000
46,000
Dec.99
Dec.00
Dec.01
Dec.02
Dec.03
Dec.04
Dec.05
Jan.06
Dec.06
Jan.07
Apr07
Percentage Change
Dec 99 to Jan. 07+ 24%
Monthly average increase
Dec. 1999 to Dec. 2005
92 inmates per month
Jan. 2006 to April 2007
177 inmates per month
3DOC Spreadsheet, September 15, 2006, Worksheet 1, Admissions by Year/ Updated, May 2007; includes CCC in count
4
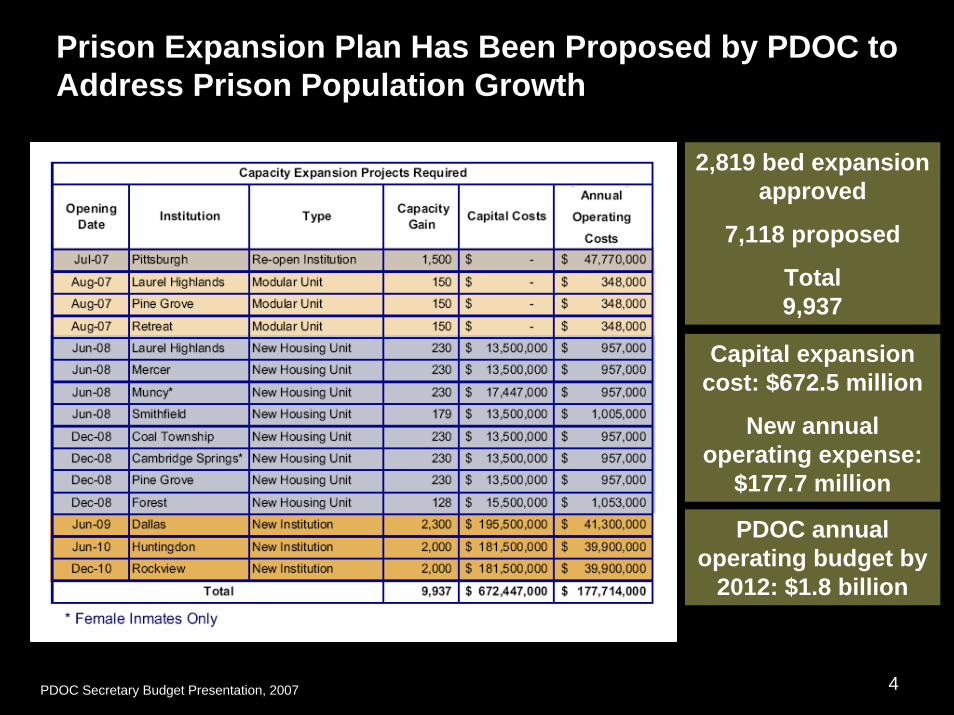
Prison Expansion Plan Has Been Proposed by PDOC to Address Prison Population Growth
2,819 bed expansion approved
7,118 proposed
Total9,937
Capital expansion cost: $672.5 million
New annual operating expense:
$177.7 million
PDOC annual operating budget by
2012: $1.8 billion
PDOC Secretary Budget Presentation, 2007
5
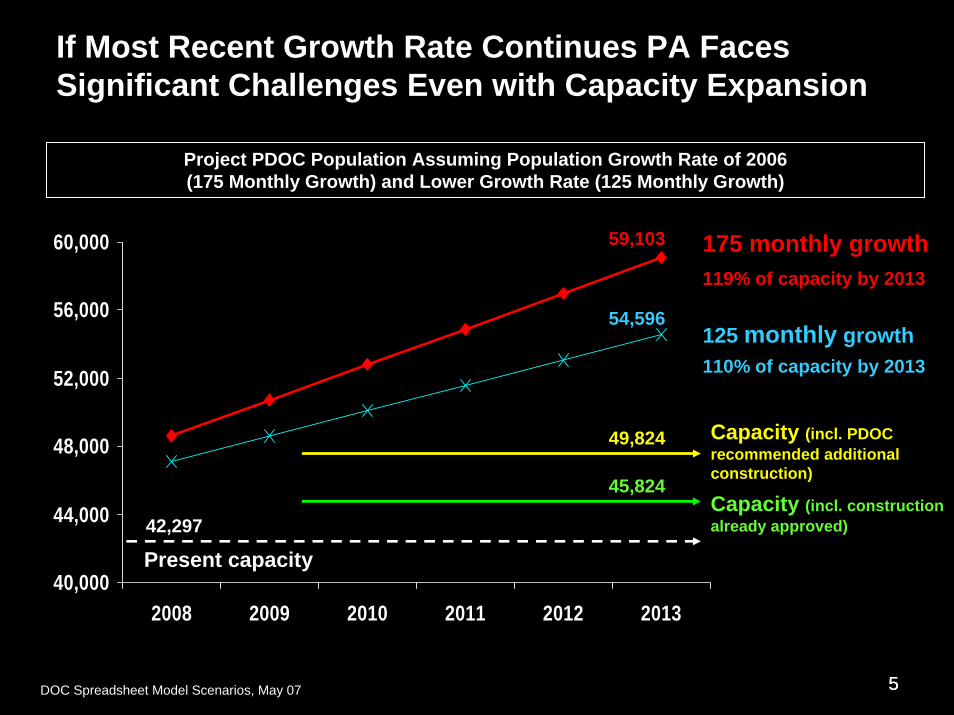
If Most Recent Growth Rate Continues PA Faces Significant Challenges Even with Capacity Expansion
Project PDOC Population Assuming Population Growth Rate of 2006(175 Monthly Growth) and Lower Growth Rate (125 Monthly Growth)
40,000
44,000
48,000
52,000
56,000
60,000
2008 2009 2010 2011 2012 2013
175 monthly growth
42,297
49,824
45,824
54,596
59,103
125 monthly growth110% of capacity by 2013
119% of capacity by 2013
Present capacity
Capacity (incl. construction already approved)
Capacity (incl. PDOC recommended additional construction)
5DOC Spreadsheet Model Scenarios, May 07

6
PDOC Population Growth is Driven by Practices and Policies Not by State Population Growth or Crime
Pennsylvania Population
200012,281,054
200512,429,616 + 1.2%
2000367,858
2005353,205
- 3.9%Reported Index Crimes
20002,995
20052,841
Crime Rate - 5.1%
200181,173
200691,804
+ 13%Sentences
200012,545
200618,141
+ 45%Prison Admissions
200036,810
200644,365Prison Population + 21%
DOC Spreadsheet, Admissions by Year/ Updated, Feb. 2007; PA Population, US Census; PA Crime, FBI Crime in US; Sentencing Commission spreadsheet, May 07 6
7
Overview
Challenge
Drivers
Options
7

8
Main Drivers of Growth
Pressure of jail overcrowdingMore offenders admitted to prison for less severe
offenses
Higher percentage of offenders being sentenced to prison than jail, particularly those with short
sentences
Low utilization of some prison diversion programsLow utilization of State Intermediate Punishment
(SIP) and intermediate sanctions for parole
Recycling of offenders back to prisonIncrease in parole violators admitted to prison
Shortage of prison programs and intermediate sanction capacity to reduce recidivism
8
9
Overview
Challenge
Drivers
Options
9

10
Policy Elements of Any Short Term Reform
TargetNon-violent offenders
Rehabilitation Programs
“Risk reduction time credit” as incentive
Prison
GoalDecrease recidivism while reducing costs
SIP
Parole at Minimum “unless”
Intermediate Sanctions Facilities
Supervision
Release
Technical violations
Court
MH Caseloads
2,0005,000
5,700
10
11
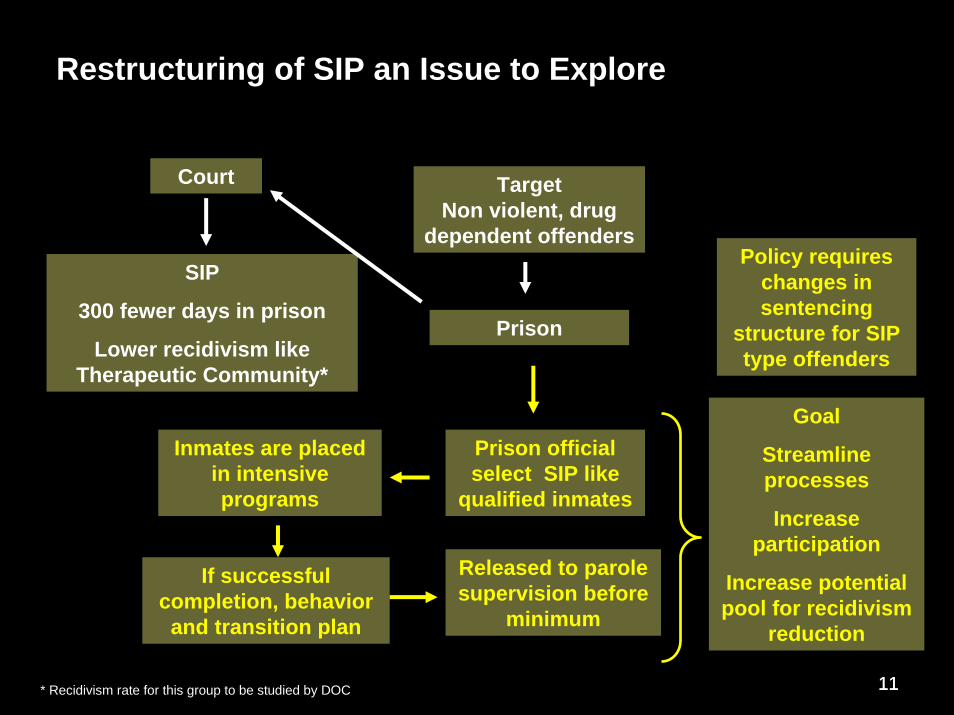
Restructuring of SIP an Issue to Explore
TargetNon violent, drug
dependent offenders
Prison
SIP
300 fewer days in prison
Lower recidivism like Therapeutic Community*
Court
Prison official select SIP like
qualified inmates
Inmates are placed in intensive programs
If successful completion, behavior and transition plan
Released to parole supervision before
minimum
Policy requires changes in sentencing
structure for SIP type offenders
Goal
Streamline processes
Increase participation
Increase potential pool for recidivism
reduction
11* Recidivism rate for this group to be studied by DOC
12
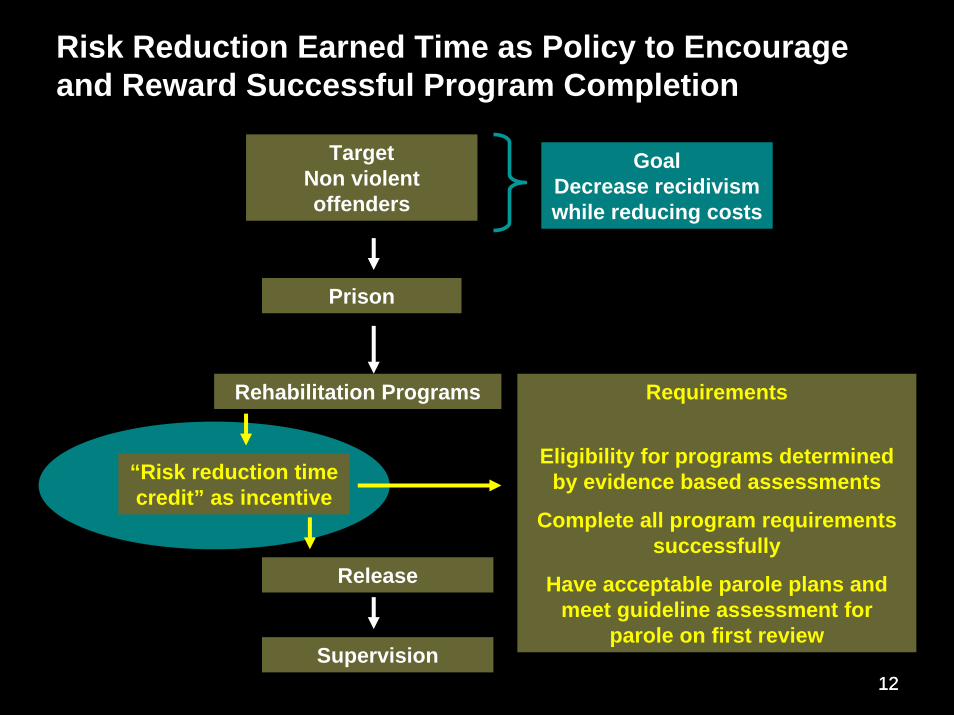
Risk Reduction Earned Time as Policy to Encourage and Reward Successful Program Completion
TargetNon violent offenders
GoalDecrease recidivism while reducing costs
Prison
Rehabilitation Programs Requirements
Eligibility for programs determined by evidence based assessments
Complete all program requirements successfully
Have acceptable parole plans and meet guideline assessment for
parole on first review
“Risk reduction time credit” as incentive
Release
Supervision 12

13
Parole Intermediate Sanction Capacity a Key Policy to Sanction Violators Short of Prison Revocation
TargetNon violent, drug
dependent offenders
Prison
Parole Violator Center
Sanction for up to six months
Supervision
Release
Technical violations
Technical violators revoked to prison or “held and
released” after hearing in 2006
4,767
Would have reduced prison population by approximate
1,046 inmates
Prison Operational Cost Avoidance
$23.7 millionCost of Policy$19.3 million
13
14
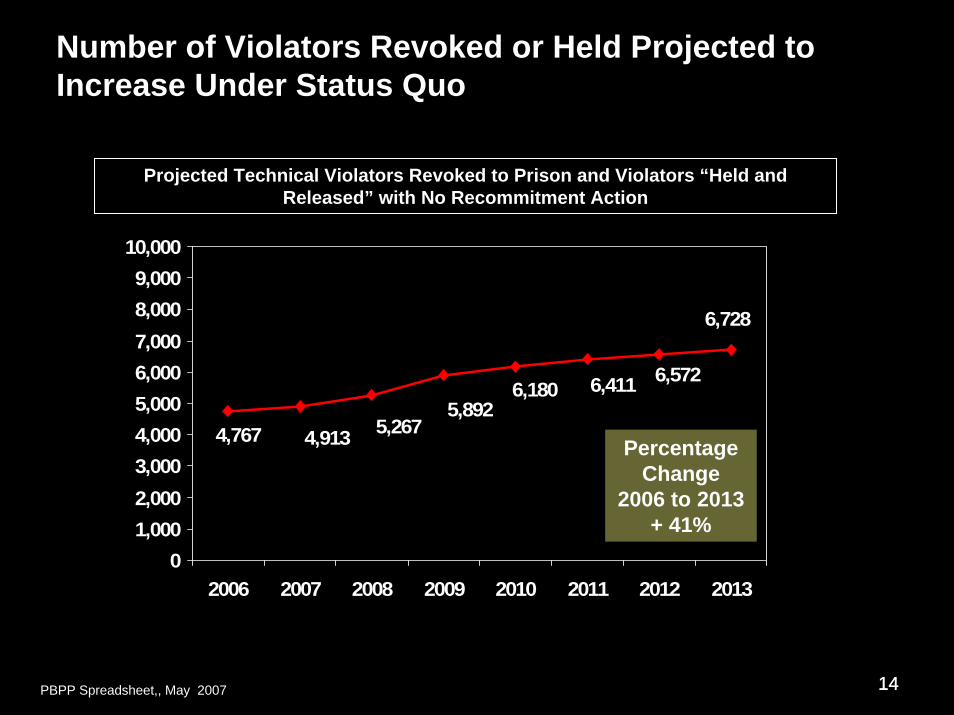
Number of Violators Revoked or Held Projected to Increase Under Status Quo
6,4116,1805,892
5,2674,9134,767
6,728
6,572
01,0002,0003,0004,0005,0006,0007,0008,0009,000
10,000
2006 2007 2008 2009 2010 2011 2012 2013
Percentage Change
2006 to 2013+ 41%
Projected Technical Violators Revoked to Prison and Violators “Held and Released” with No Recommitment Action
14PBPP Spreadsheet,, May 2007
15
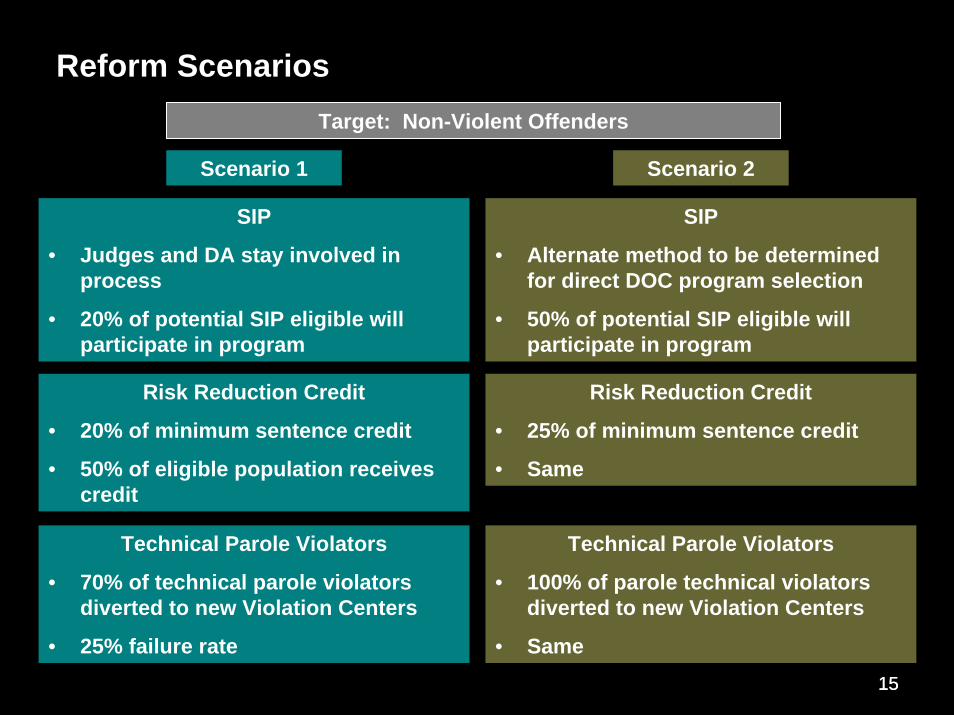
Reform ScenariosTarget: Non-Violent Offenders
Scenario 1 Scenario 2
SIP
• Judges and DA stay involved in process
• 20% of potential SIP eligible will participate in program
SIP
• Alternate method to be determined for direct DOC program selection
• 50% of potential SIP eligible will participate in program
Risk Reduction Credit
• 20% of minimum sentence credit
• 50% of eligible population receives credit
Risk Reduction Credit
• 25% of minimum sentence credit
• Same
Technical Parole Violators
• 70% of technical parole violators diverted to new Violation Centers
• 25% failure rate
Technical Parole Violators
• 100% of parole technical violators diverted to new Violation Centers
• Same15
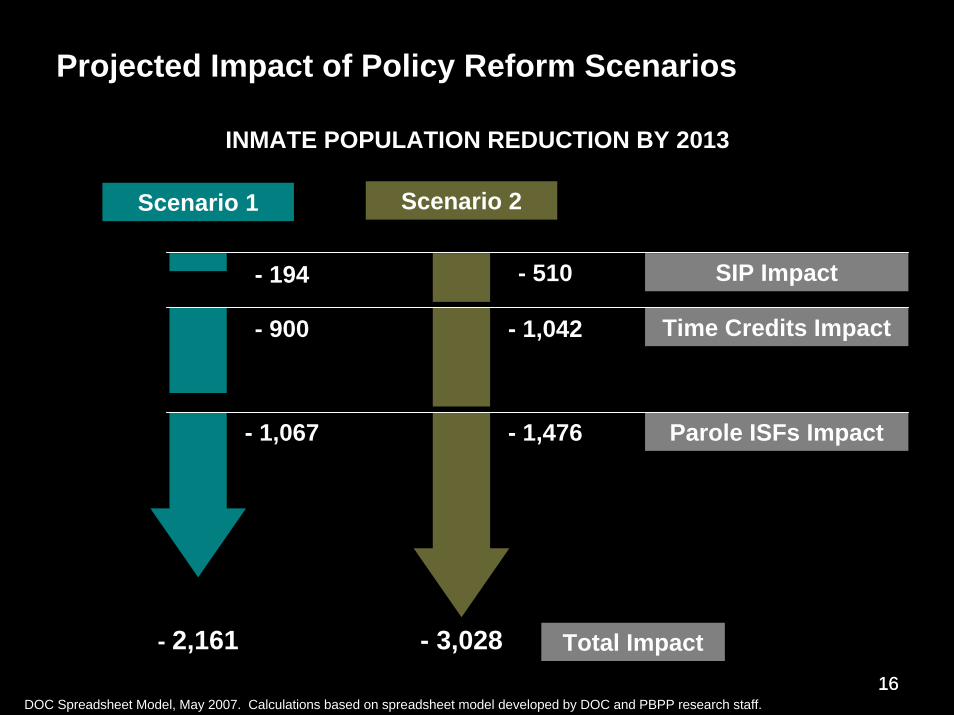
16
Projected Impact of Policy Reform Scenarios
INMATE POPULATION REDUCTION BY 2013
Scenario 2Scenario 1
SIP Impact
Time Credits Impact
Parole ISFs Impact
- 510- 194
- 1,042- 900
- 1,476- 1,067
- 2,161 - 3,028 Total Impact16
DOC Spreadsheet Model, May 2007. Calculations based on spreadsheet model developed by DOC and PBPP research staff.

17
Projected Impact on Population and Operating Percentage of Capacity – High Growth
Projected DOC Population at 175 Monthly Growth Rate
20132008
59,103
119%56,942
114% 56,075
113%
48,603
115% 47,057
111% 46,391
110%
Status Quo175 Pop. Growth Per Month
Scenario 1 Scenario 2
Operating prison capacity percentage based on assumption that all prison capacity authorized and proposed will be added
17DOC Spreadsheet Model, May 2007. Calculations based on spreadsheet model developed by DOC and PBPP research staff.

18
Projected Impact on Population and Operating Percentage of Capacity – Low Growth
Projected DOC Population at 125 Monthly Growth Rate
20132008
54,596
110% 52,435
105%51,568
104%
47,096
111% 45,550
108% 44,884
106%
Status Quo175 Pop. Growth Per Month
Scenario 1 Scenario 2
Operating prison capacity percentage based on assumption that all prison capacity authorized and proposed will be added
18DOC Spreadsheet Model, May 2007. Calculations based on spreadsheet model developed by DOC and PBPP research staff.

19
Projected Cost Avoidance Due to Reduction in Prison Population
Projected Cost Avoidance
2009 2013
ReformScenario 2
$95 million
ReformScenario 1
$69.4 million
ReformScenario 2
$67.8 million
ReformScenario 1
$48.5 million
Based on an average prison operational cost of $86 per day
19DOC Spreadsheet Model, May 2007

20
Policy Elements to Explore for Long Term Reforms
GoalReduce jail overcrowding to reduce local pressure to
use prisons as a relief valve
Jails
Probation Violators
20
RIP
Reduce probation “failures”to prison and jail
Prison
Court Sentencing
Options
Community Supervision
2 to less 5 yrs option
Pre-trial release policies
Progressive sanctionsStreamlined processes
Mental health diversions
Sentencing policies/practices study
Jail population planning and standards

21
Projected Impact of Policy Options onPrison Population
40,000
44,000
48,000
52,000
56,000
60,000
2008 2009 2010 2011 2012 2013
175 monthlygrowth
125 monthly growth
Present capacity
Capacity (incl. construction already approved)
Capacity (incl. PDOC recommended additional construction)
Scenario 1
Scenario 2
Discrepancy of9,279 beds
21DOC Spreadsheet Model Scenarios, May 07
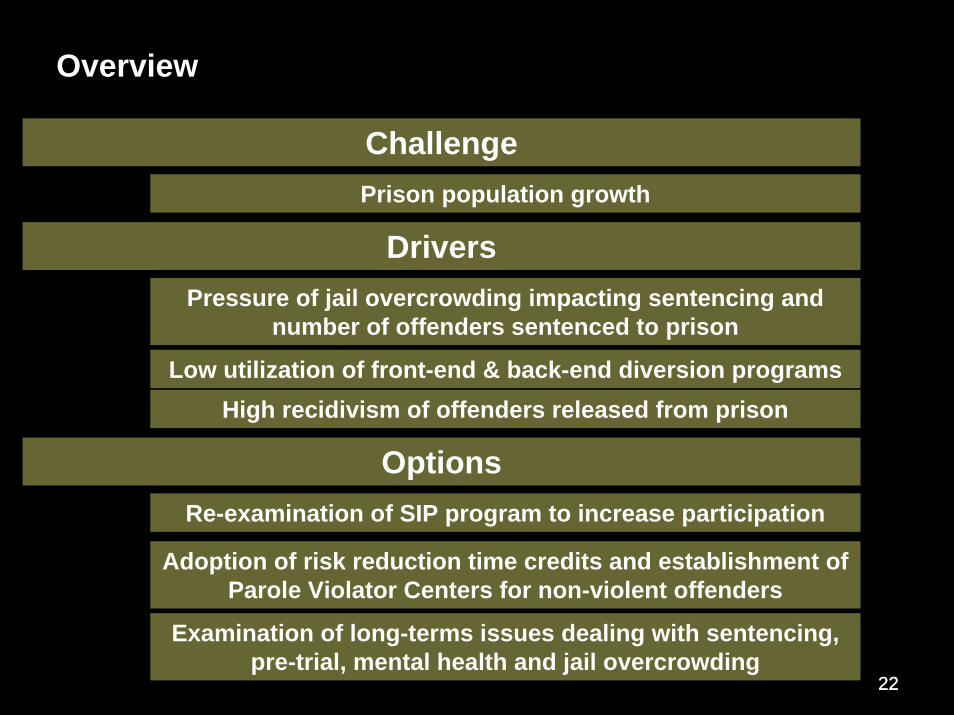
22
Overview
ChallengePrison population growth
DriversPressure of jail overcrowding impacting sentencing and
number of offenders sentenced to prison
Low utilization of front-end & back-end diversion programsHigh recidivism of offenders released from prison
OptionsRe-examination of SIP program to increase participation
Adoption of risk reduction time credits and establishment of Parole Violator Centers for non-violent offenders
Examination of long-terms issues dealing with sentencing, pre-trial, mental health and jail overcrowding
22

23
Pennsylvania’s Opportunity to Improve Public Safety Through
Effective Treatment
Fred C. Osher, MDDirector of Health Systems and Services Policy
June 4, 2007
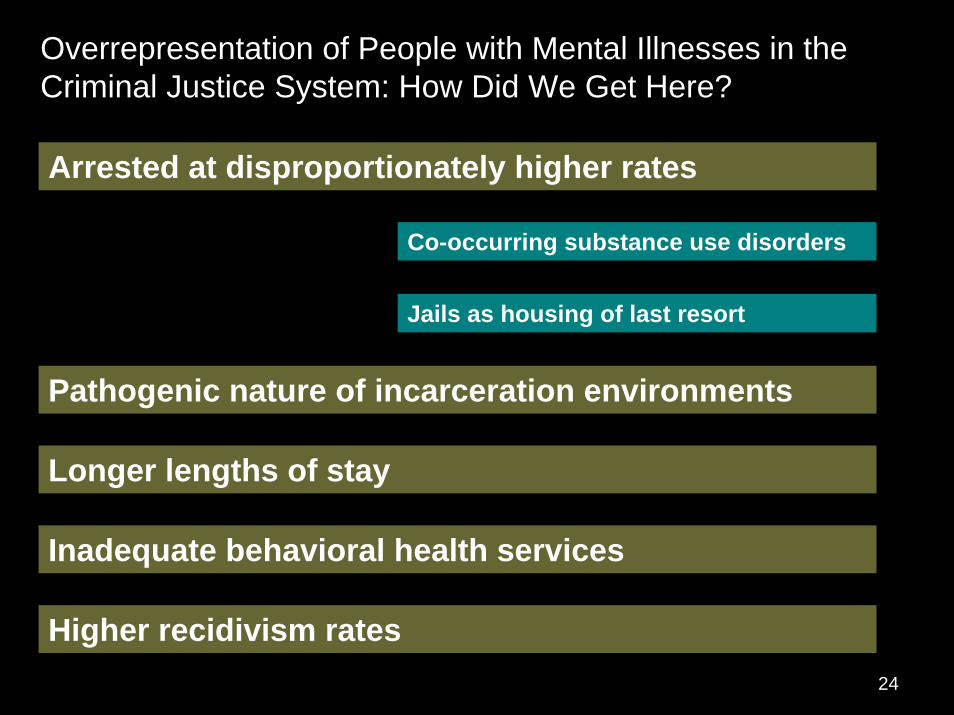
24
Overrepresentation of People with Mental Illnesses in the Criminal Justice System: How Did We Get Here?
Arrested at disproportionately higher rates
Co-occurring substance use disorders
Jails as housing of last resort
Pathogenic nature of incarceration environments
Longer lengths of stay
Inadequate behavioral health services
Higher recidivism rates24
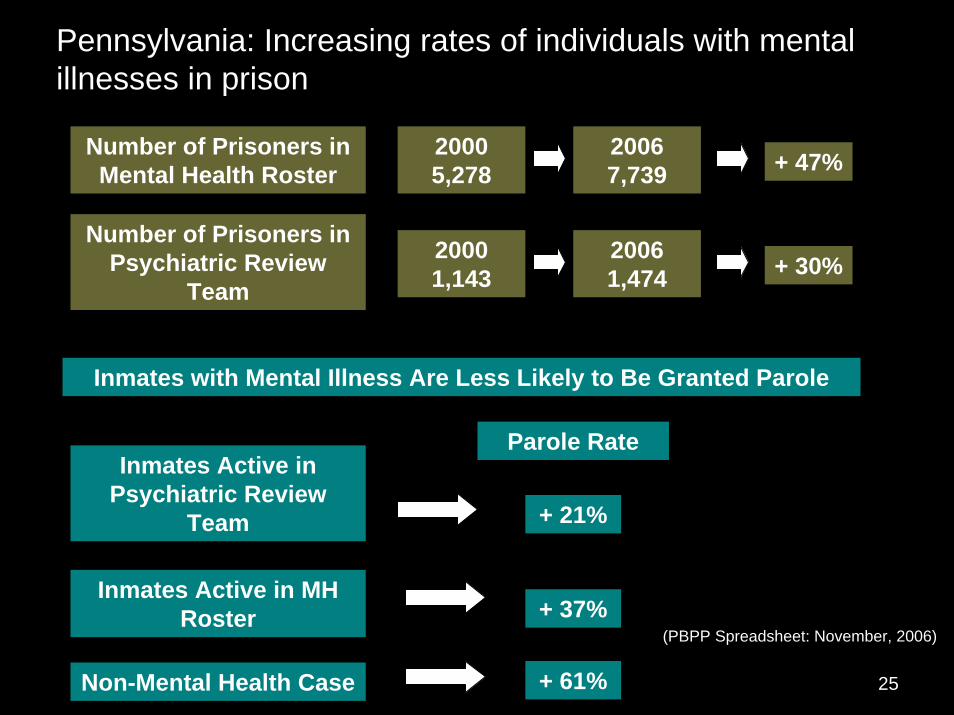
25
Pennsylvania: Increasing rates of individuals with mental illnesses in prison
Number of Prisoners in Mental Health Roster
20005,278
20067,739 + 47%
Number of Prisoners in Psychiatric Review
Team
20001,143
20061,474 + 30%
Inmates with Mental Illness Are Less Likely to Be Granted Parole
Parole RateInmates Active in
Psychiatric Review Team + 21%
Inmates Active in MH Roster + 37%
(PBPP Spreadsheet: November, 2006)
+ 61%Non-Mental Health Case 25

26
Senate Resolution 125
Evaluate fiscal impact of three collaborative programs
Jail diversion program in Chester County
Mental health court in Allegheny County
Re-entry program in Philadelphia
26
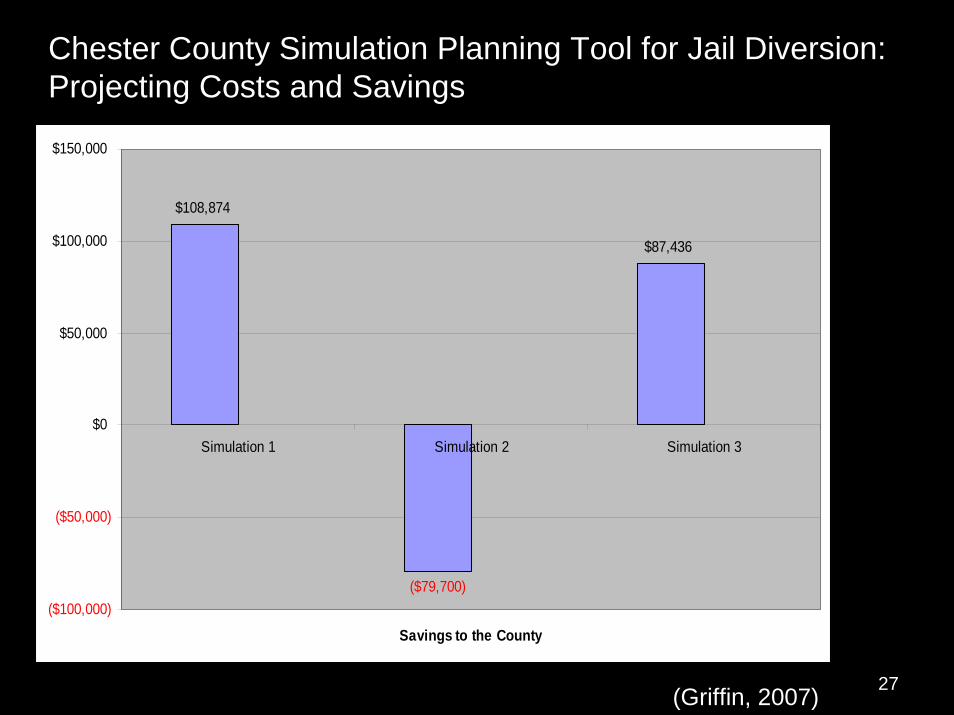
27
Chester County Simulation Planning Tool for Jail Diversion: Projecting Costs and Savings
$108,874
($79,700)
$87,436
($100,000)
($50,000)
$0
$50,000
$100,000
$150,000
Simulation 1 Simulation 2 Simulation 3
Savings to the County
27(Griffin, 2007)

28
Justice, Treatment, and Cost: An Evaluation of the Fiscal Impact of Allegheny County Mental Health Court
(Ridgely et al., 2007)
28

29
Justice, Treatment, and Cost: An Evaluation of the Fiscal Impact of Allegheny County Mental Health Court
$0
$5,000
$10,000
$15,000
$20,000
$25,000
$30,000
$35,000
Total Costs Mental Health Costs Jail Costs
Actual Hypothetical
Difference: – $5,532
Difference: $6,844
Difference: $2,656
$0
$5,000
$10,000
$15,000
$20,000
$25,000
$30,000
$35,000
Total Costs Mental Health Costs Jail Costs
Actual Hypothetical
Difference: – $5,532
Difference: $6,844
Difference: $2,656
(Ridgely et al., 2007)

30
Mental Illness and Reincarceration among Persons Released from Pennsylvania State Prisons to Philadelphia Locations in 2001
Significantly more likely to be reincarcerated (jail or prison) two years post release period, even after adjusting for differences in population characteristics
Gaudenzia FIR-St. sample size too small to determine effects of specialized residential programming
30

31
Well-managed Prison Programs Can Reduce Recidivism
Change in Recidivism Rates for Adult Offenders
0%
-10%
-20%
-30%
-8.2
General cognitive-behavioral programs
No intervention
0%
Vocational education in
prison
-12.6
Steve Aos, Marna Miller, and Eilzabeth Drake. (2006). Evidence-Based Adult Corrections Programs: What Works and What Does Not. Olympia: Washington State Institute for Public Policy.
In-prison therapeutic
communities
-5.3
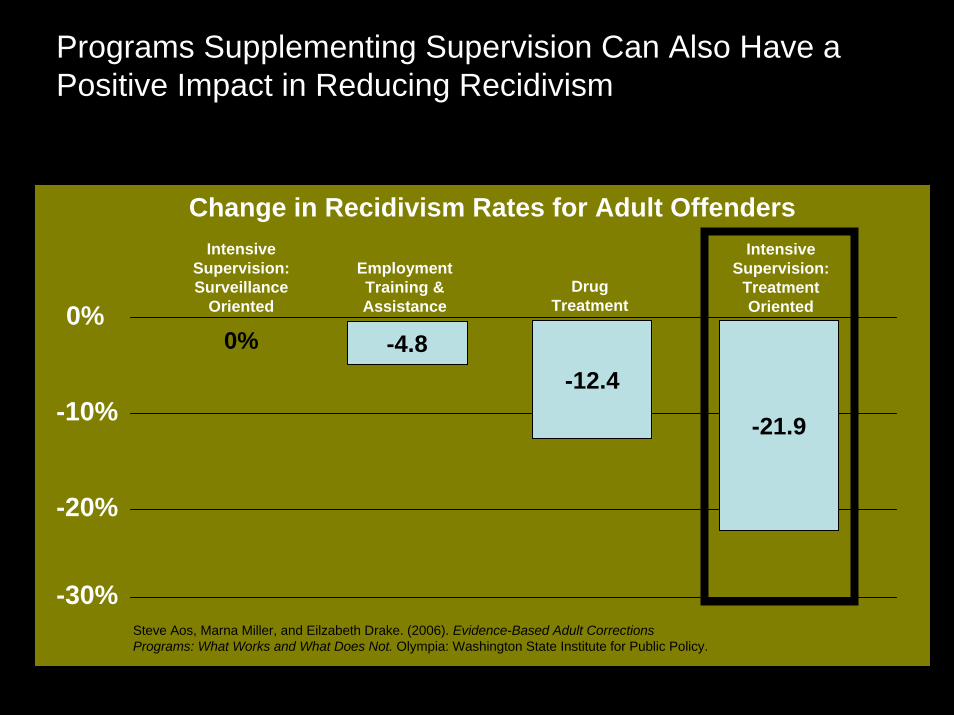
32
Programs Supplementing Supervision Can Also Have a Positive Impact in Reducing Recidivism
Change in Recidivism Rates for Adult Offenders
0%
-10%
-20%
-30%
-12.4
Drug Treatment
Intensive Supervision: Surveillance
Oriented
0%
Intensive Supervision:
Treatment Oriented
-21.9
Steve Aos, Marna Miller, and Eilzabeth Drake. (2006). Evidence-Based Adult Corrections Programs: What Works and What Does Not. Olympia: Washington State Institute for Public Policy.
Employment Training & Assistance
-4.8

33
Recommendations
Front end:
A statewide grant program to improve response to people with mental illness in contact with police, courts, and jails.
Back end:
Making the transition from prison to community more successful.
33
