justice reinvestment working group
TRANSCRIPT

1
Justice Reinvestment Working GroupFirst Meeting
July 7, 2015
Council of State Governments Justice Center
Ellen Whelan‐Wuest, Project ManagerChenise Bonilla, Policy Analyst Ed Weckerly, Data Analyst Becky Cohen, Senior Research AssociateMichelle Rodriguez, Program Associate
State leaders and stakeholders have indicated strong interest and commitment to justice reinvestment
Council of State Governments Justice Center 2
Executive OrderThere is hereby established The Justice Reinvestment Working Group that shall exist for the purpose of advising the Governor on ways to improve our criminal justice system with the overarching goals of protecting public safety, reducing recidivism, analyzing racial disparities, promoting stronger, healthier communities, and reducing costs.
April meetings to discuss the potential for justice reinvestment in Rhode Island:
• Governor Raimondo• House and Senate
leaders• Corrections• Supreme Court• Superior Court
• District Court• Attorney General• Public Defender• Defense Bar• Victim advocates• Parole Board

2
Working Group Composition
Council of State Governments Justice Center 3
Hon. Alice Gibney,
Superior Court Presiding Justice
Hon. Alice Gibney,
Superior Court Presiding Justice
Hon. Jeanne LaFazia,
District Court Chief Judge
Hon. Jeanne LaFazia,
District Court Chief Judge
Chief JusticePaul A. Suttell,Supreme Court
Chief JusticePaul A. Suttell,Supreme Court
Hon.John Flynn,
Superior Court Magistrate
Judge
Hon.John Flynn,
Superior Court Magistrate
Judge
Hon.Judith Savage,
Associate Justice, RI
Superior Court (ret.)
Hon.Judith Savage,
Associate Justice, RI
Superior Court (ret.)
Rep. Marvin Abney
Rep. Marvin Abney
Rep. Robert Craven
Rep. Robert Craven
U.S. Attorney Peter NeronhaU.S. Attorney Peter Neronha
Olin Thompson,President, RI
Assoc. Criminal Defense Lawyers
Olin Thompson,President, RI
Assoc. Criminal Defense Lawyers
Hon. John J. McConnell, Jr.,U.S. District Court Judge
Hon. John J. McConnell, Jr.,U.S. District Court Judge
Sen. Chris OttianoSen. Chris Ottiano
Colonel Steven O’Donnell,
Superintendent, RI State Police
Colonel Steven O’Donnell,
Superintendent, RI State Police
Sen. Paul JabourSen. Paul Jabour
A. T. Wall,Director,
RI Department of Corrections
A. T. Wall,Director,
RI Department of Corrections
Sen. Cynthia Coyne
Sen. Cynthia Coyne
Maria Montanaro,Director, RI
Department of BHDDH
Maria Montanaro,Director, RI
Department of BHDDH
Megan Clingham,
Mental Health Advocate
Megan Clingham,
Mental Health Advocate
Chief Brian Sullivan,
RI Police Chiefs Association
Chief Brian Sullivan,
RI Police Chiefs Association
James Vincent,President, NAACP ‐
Providence Branch
James Vincent,President, NAACP ‐
Providence Branch
Attorney General Peter Kilmartin
Attorney General Peter Kilmartin
Anna Cano‐Morales,
Director, Latino Policy Institute
Anna Cano‐Morales,
Director, Latino Policy Institute
Laura Pisaturo,Chairperson,
RI Parole Board
Laura Pisaturo,Chairperson,
RI Parole Board
Colonel Hugh T. Clements, Jr.,
Chief, Providence Police Dept.
Colonel Hugh T. Clements, Jr.,
Chief, Providence Police Dept.
Michael Évora,Executive Director,
Commission for Human Rights
Michael Évora,Executive Director,
Commission for Human Rights
Mary McElroy,State Public Defender
Mary McElroy,State Public Defender
Rep.To Be
Determined
Rep.To Be
Determined
Presentation Overview
Next Steps
Rhode Island Criminal Justice Challenges
Justice Reinvestment Overview
4Council of State Governments Justice Center

3
Council of State Governments Justice Center
Council of State Governments Justice Center 5
• National non‐profit, non‐partisan membership association of state government officials
• Engages members of all three branches of state government
• Justice Center provides practical, nonpartisan advice informed by the best available evidence
Justice reinvestment is based in data and engagement
Council of State Governments Justice Center 6
Supported by:
Justice Reinvestmenta data‐driven approach to reduce corrections spending and reinvest savings in strategies that can decrease recidivism and increase public safety.

4
Justice reinvestment offers states a comprehensivestep‐by‐step process
Council of State Governments Justice Center 7
Data AnalysisData sources should come from across the criminaljustice system for comprehensive analysis
Stakeholder EngagementComplement data analysis with input fromstakeholder groups and interested parties
Develop Policy Options & Estimate Impacts
Implement New Policies
Target Reinvestments &Monitor Key Measures
Bipartisan, Inter‐branchWorking Group
Present a policy framework to reduce correctionscosts, increase public safety, and project the impacts
Identify assistance needed for implementation anddeliver technical assistance for reinvestment strategies
Assemble practitioners and leaders; receive andconsider information, reports and policies
Track and monitor the impact of enacted policies and programs, and adjust implementation plan as needed
1
2
3
4
5
6
States have reinvested into different public safety strategies
Reinvest $2.5 million in substance use treatment focused on higher‐risk probationers and parolees
with higher needs
Substance use needs contributing to probation and parole violations
Despite substantial community correction program investment,
probation failures account for close to one third of prison admissions
Reinvest $10 million in funding for improving probation, including performance‐incentive grants
STATE FINDING REINVESTMENT
Victims lack confidence that restitution orders will be managed effectively
Increase, by statute, prison‐based restitution collections, reinvest in 15 victim service positions, and track collections using a database
Council of State Governments Justice Center 8

5
Rhode Island was early among 21 states to work with the CSG Justice Center using a justice reinvestment approach
Council of State Governments Justice Center 9
NVNV
AZAZ
TXTX
KSKS
OKOK
WIWI
NCNC
ININ
HIHI
VTVTNHNH
OHOH
RIRI
CTCT
WVWV
MIMI
IDID
WAWA
NENE
ALAL
PAPA
Rhode Island’s first justice reinvestment initiative focused on sentenced populations
Council of State Governments Justice Center 10
• 2007‐2008: Rhode Island faces 22% increase in the ACI population by 2017, at a projected cost of $300 million; begins a justice reinvestment project
• CSG Justice Center analyzes data and works with RI stakeholders to identify drivers in growing ACI population, policy changes to avoid growth in system
• 2008: Rhode Island passes justice reinvestment legislative package focusing on earned time credits, risk reduction programs, and the use of risk assessments in parole release decisions

6
3,4833,818
3,888
3,146
4,6244,880
0
1,000
2,000
3,000
4,000
5,000
6,000
2004 2005 2006 2007 2008 2009 2010 2011 2012 2013 2014 2015 2016 2017
Rhode Island’s ACI population trend projections before justice reinvestment, and outcomes after bill passage
Council of State Governments Justice Center 11
Justice reinvestmentpolicies enacted, 2008
Rhode Island ACI Population, FY‐end 2004‐2014, and 2008 ACI Population Projection
ACI population had grown 15% from
1997‐2007
Projections at the time showed the population would grow another 22% by
2017, at a cost of $300 million
Actual ACI population down 19% from 2008‐2014 and over 1,400 people below
the projection
Source: JFA 2014 Report Draft: Rhode Island Department of Corrections Ten‐Year Prison Population Projections Brief FY2015‐2025, RIDOC FY2007 Population Report.
32,551
28,250
0
5,000
10,000
15,000
20,000
25,000
30,000
35,000
2008 2009 2010 2011 2012 2013
3,888
3,146
0
500
1,000
1,500
2,000
2,500
3,000
3,500
4,000
4,500
2008 2009 2010 2011 2012 2013 2014
Since 2008, the ACI population has decreased while crime continued to fall
Council of State Governments Justice Center 12
Source: JFA 2014 Report Draft: Rhode Island Department of Corrections Ten‐Year Prison Population Projections Brief FY2015‐2025, FBI UCR Online Data Tool.
ACI PopulationDown 19%
TotalIndex CrimeDown 13%
Rhode Island has shown that it is possible to drop both the ACI population and the total index crime simultaneously
Rhode Island ACI Population, FY‐end 2008‐2014 Rhode Island Reported Index Crimes, 2008‐2013
7
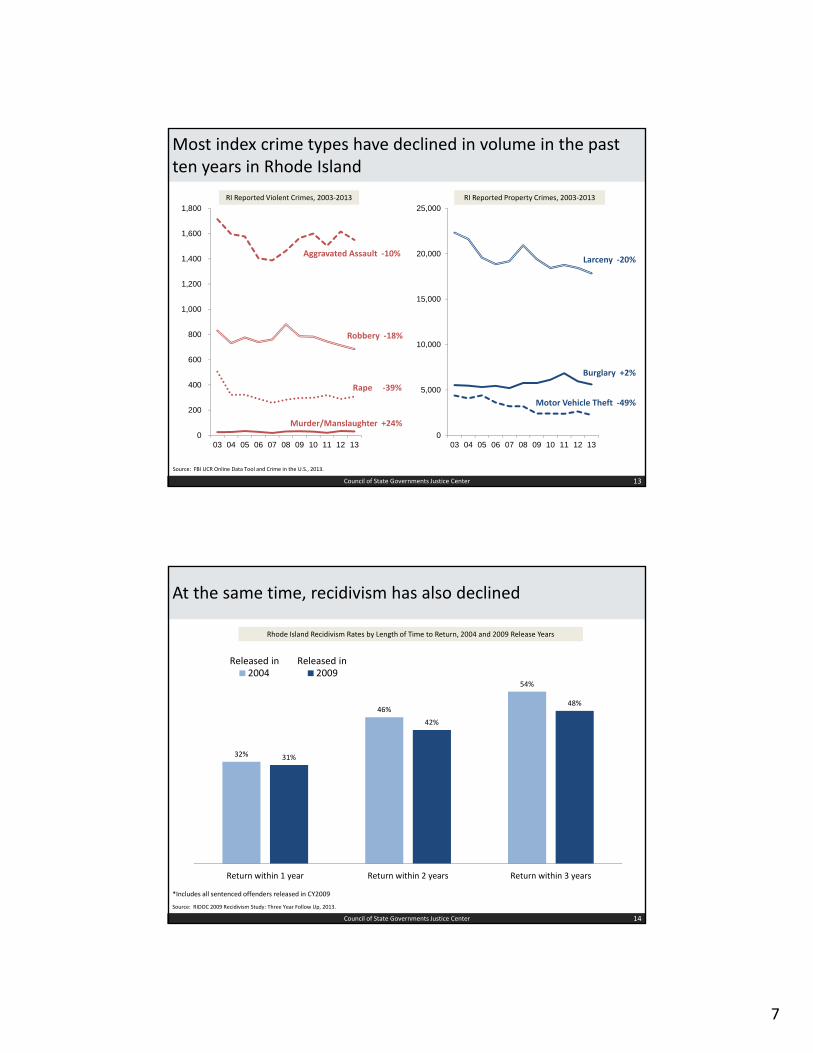
Most index crime types have declined in volume in the past ten years in Rhode Island
0
200
400
600
800
1,000
1,200
1,400
1,600
1,800
03 04 05 06 07 08 09 10 11 12 13
Murder/Manslaughter +24%
Robbery ‐18%
Rape ‐39%
Aggravated Assault ‐10%
Burglary +2%
Larceny ‐20%
Motor Vehicle Theft ‐49%
0
5,000
10,000
15,000
20,000
25,000
03 04 05 06 07 08 09 10 11 12 13
Council of State Governments Justice Center 13
Source: FBI UCR Online Data Tool and Crime in the U.S., 2013.
RI Reported Violent Crimes, 2003‐2013 RI Reported Property Crimes, 2003‐2013
At the same time, recidivism has also declined
Council of State Governments Justice Center 14
32%
46%
54%
31%
42%
48%
Return within 1 year Return within 2 years Return within 3 years
2004 2009Released in Released in
Rhode Island Recidivism Rates by Length of Time to Return, 2004 and 2009 Release Years
*Includes all sentenced offenders released in CY2009
Source: RIDOC 2009 Recidivism Study: Three Year Follow Up, 2013.

8
Corrections funding has also remained relativelyflat in recent years
Source: State of Rhode Island Budget Office, Budget as Enacted Reports FY04‐14, Inflation adjustment uses CPI inflation calculator: http://data.bls.gov/cgi‐bin/cpicalc.pl
$176 $179$172
$185
$207$197 $193 $188 $188 $186 $185
$140 $147 $147$162
$188 $179 $177 $178 $182 $183 $185
0
50
100
150
200
250
2004 2005 2006 2007 2008 2009 2010 2011 2012 2013 2014
General Fund Corrections Expenditures (in millions)and Inflation Adjusted Expenditures, FY2004‐FY2014
Council of State Governments Justice Center 15
Inflation adjusted general fund corrections expenditures
(in 2014 dollars)
Actual general fund corrections expenditures
What challenges continue to face Rhode Island’s criminal justice system, and how can the state apply a justice reinvestment
approach to analyzing and addressing these issues?
Rhode Island can build on its success to address other challenges
16Council of State Governments Justice Center
Recent Achievements
Reduced ACI Population Decreasing Crime Rate Flat Corrections Budget

9
Presentation Overview
17Council of State Governments Justice Center
Next Steps
Rhode Island Criminal Justice Challenges
Justice Reinvestment Overview
Despite a recent decline, current projections indicate future ACI population growth
Council of State Governments Justice Center 18
Source: JFA 2014 Report Draft: Rhode Island Department of Corrections Ten‐Year Prison Population Projections Brief FY2015‐2025 .
Rhode Island Historical and Projected ACI Populations, FY‐end 2004‐2025
3,4833,146
3,477
0
1,000
2,000
3,000
4,000
5,000
Projected ACIPopulation 2014‐2025
+11%
Actual ACIPopulation 2004‐2014
‐10%
How can Rhode Island avoid future growth or even decrease the ACI
population while further increasing public safety?

10
Presentation Overview
19Council of State Governments Justice Center
Rhode Island Criminal Justice Challenges
• Pretrial• Sentenced Admissions• Probation
2,467
679
0
500
1,000
1,500
2,000
2,500
3,000
3,500
2014
One quarter of people in the ACI are awaiting trial, and pretrial admissions have greatly increased in recent years
ACI Population by Type, FY‐end 2014
Council of State Governments Justice Center 20
Sentenced Population
78%
Awaiting Trial22%
3,146
11,361
12,506
3,886 3,746
0
2,000
4,000
6,000
8,000
10,000
12,000
14,000
2010 2011 2012 2013 2014
Awaiting Trial Admissions
+10%
Sentenced Admissions
‐4%
ACI Admissions by Type, FY2010‐2014
Source: JFA 2014 Report Draft: Rhode Island Department of Corrections Ten‐Year Prison Population Projections Brief FY2015‐2025 .

11
With Rhode Island’s pretrial population growing, an increase in the length of stay can have wider impacts on bed space
Council of State Governments Justice Center 21
Managing the pretrial population efficiently and effectively is critical to both cost and public safety
Average length of stay among pretrial
releases:22.4 days
PretrialAdmissionsin FY2013:11,139
Pretrial Beds Occupied for a
Full Year:684 beds
X =
Imagine if the average lengthof stay also
increased 30% to:30 days
PretrialAdmissionsin FY2014:12,506
Potential Pretrial Beds Occupied for a
Full Year:1,028 beds
X =
Example:
Source: JFA 2014 Report Draft: Rhode Island Department of Corrections Ten‐Year Prison Population Projections Brief FY2015‐2025 .
Most unified corrections states statutorily require pretrial risk assessment
Council of State Governments Justice Center 22
Delaware: As of 2011, courts are instructed to use a risk assessment to determine release of all defendants based on risk of flight and re‐arrest.
Vermont: As of 2012, risk assessments are used to determine release conditions and services or treatment.
Hawaii: As of 2012, pretrial risk assessments are conducted within three days of admission.
Connecticut: As of 2011, risk assessments are conducted on defendants not released on personal recognizance.
Alaska & Rhode Island:No statutes or requirement for use of risk assessments of pretrial detainees.
RI bail guidelines require that judges receive information and reports about defendants’ background and risk.

12
Presentation Overview
23Council of State Governments Justice Center
Rhode Island Criminal Justice Challenges
• Pretrial
• Sentenced Admissions• Probation
Misdemeanor Property/Drug/Other
74%
Misdemeanor Violent/Sex 26%
Felony Property/Drug/Other
59%
Felony Violent/Sex
41%Felony50%
Misdemeanor50%
Two thirds of admissions are for lower severity crimes
Council of State Governments Justice Center 24
Sentenced Admissions to ACI,
FY2014
FY2014SentencedAdmissions
3,746Total
Property/Drug/Other
66%
Total Violent/Sex
33%
Source: RIDOC Sentenced Admissions data..

13
Almost half of sentenced admissions are younger adults
Council of State Governments Justice Center 25
What is the criminal history of this population of younger adult offenders? What is their risk of
reoffending?
What sanctions and services are most effective at improving the
long term recidivism and employment outcomes for this younger adult population?
Sentenced Admissions to ACI,
FY2014
Source: RIDOC Sentenced Admissions data..
FY2014SentencedAdmissions
3,746
29 or Younger42%
30 to 3929%
40 or Older29%
Nearly half of those sentenced to the ACI are probation and parole violators
Council of State Governments Justice Center 26
What type of violations or new crimes are driving these violator admissions? What types of probationers are most likely to violate and
why?
Are there further opportunities to reduce recidivism and find more cost‐effective responses to
violation behavior?
Sentenced Admissions to ACI,
FY2014
FY2014SentencedAdmissions
3,746Newly
Sentenced52%
Probation Violator43%
Parole Violator 5%
Source: RIDOC Sentenced Admissions data..

14
How many people sentenced for low severity crimes have mental health and substance abuse needs?
Council of State Governments Justice Center 27
What data and information can be analyzed to answer these and other questions?
Sentenced Admissions to ACI,
FY2014
FY2014SentencedAdmissions
3,746
How many offenders have MH/SA issues?
How/when are they assessed for risk and needs?
What is the availability and quality of programming inside and outside of ACI?
What is the role of supervision in their
treatment?
The parole grant rate is down in recent years, which may relate to recent policy changes
Council of State Governments Justice Center 28
39%
34%35%
30%29%
24%22%
0
500
1,000
1,500
2,000
2,500
0%
10%
20%
30%
40%
2008 2009 2010 2011 2012 2013 2014
RI Parole Grant Rate and Volume ofParole Hearing Applications, FY2008‐FY2014
Parole Grant Rate Total Applications
To what extent is the drop in the grant rate related to changes in earned‐time policies enacted in 2008?

15
Presentation Overview
29Council of State Governments Justice Center
Rhode Island Criminal Justice Challenges
• Pretrial• Sentenced Admissions• Probation
Rhode Island has a relatively low incarceration rate
2013 Incarceration Rate(Sentenced prisoners per 100,000 population)
U.S. Total Incarceration Rate
478
Source: Bureau of Justice Statistics, Prisoners in 2013.
Council of State Governments Justice Center 30

16
Rhode Island has the third highest rate of people on probation in the US, and is first among New England states
Council of State Governments Justice Center 31
0 500 1,000 1,500 2,000 2,500 3,000
New Hampshire
UtahNevada
West VirginiaMaine
New YorkKansas
VirginiaNorth Dakota
MarylandNebraska
South CarolinaCalifornia
WisconsinNew Mexico
MontanaSouth Dakota
MissouriVermont
WyomingLouisiana
OregonIowa
North Carolina
IllinoisMassachusetts
TennesseeArkansas
AlaskaMississippi
ArizonaFlorida
KentuckyConnecticut
US TotalNew Jersey
AlabamaPennsylvania
WashingtonColorado
HawaiiTexas
DelawareMichigan
MinnesotaIndiana
IdahoRhode Island
OhioGeorgia
Rhode Island
Probationers per 100,000 Adult Residents, 2013
Ranked 3rd 2,737 people on probation per 100,000 residents
~20,000 Probationers at FY‐end 2014
1 in 44Rhode Island residents
on probation
1 in 21Providence residents
on probation
Source: BJS, Probation and Parole in the United States, 2013.
Rhode Island felony probation terms are long and often include incarceration
Council of State Governments Justice Center 32
In addition, anecdotes from Rhode Island suggest that a large portion of felonies
receive split sentences which include both an ACI stay and
probation supervision, whereas the figure from the national survey only includes
straight probation
Source: BJS, Felony Sentences in State Courts, 2006 –Statistical Tables, RIDOC Probation Stock data.
3.2
4.9
US (2006)
RI
Average Felony Probation Term in Years
Rhode Island(FY2012 Placements)
US(2006 Sentences)
32 States with Maximum ProbationTerms of Five Years or Less*
* Many states exempt somecrimes from the cap
14 States with No Probation Term Cap*
* Max probation term oftentied to max prison sentence
CACA IAIA
LALAMDMD
MIMI MOMO
NENE
NVNV NHNH
NJNJ
NCNC
NDND
OHOH
OROR
SCSC
WVWV
WYWY
GAGA
CTCT
WAWA
WIWIMNMN
MSMSKYKY
DEDE FLFL
KSKS
MEME
ILIL ALAL
NMNM NYNY
RIRI
ARAR
COCO MTMT PAPA IDIDUTUT
OKOKSDSD VAVA
MAMA TNTN
VTVT
ININ
53%Longer

17
Nearly half of sentenced admissions are probation violators, and over one third of those violations are technical
33Council of State Governments Justice Center
Sentenced Commitments by Type, FY2010‐2014
FY2014 Probation Violation Types
New Charge 64%
Technical 35%
2010 2011 2012 2013 2014
Other
Parole Violator
Probation Violator
Newly Sentenced
20%
43%
73%
52%
3,922 3,8483,626
3,7463,563
Source: RIDOC Sentenced Admissions data.
RI
Relative to other states, Rhode Island makes low investments in supervision, and has high active caseloads for probation
Council of State Governments Justice Center 34
RI average active caseload per probation officer:
116 cases
Average Supervision Cost Per Person
CT
$19/day per person oncommunity supervision
$11/day per probationer
$5/day per probationer & parolee*
WA $$$$$$$$$$$$$$$$$$$
$$$$$$$$$$$
$$$$$
Active34%
Low5%
Banked61%
Stock Probation Population by Supervision Type, FY‐end 2014
* Approximately 20% of the RI active supervision population is comprised of misdemeanants which may lower the average cost per day per person compared to CT and WA if misdemeanants consume less resources and officer time.
Source: RIDOC Probation Stock data, Framework for Connecticut’s Fiscal Future, 2006. WA : DOC Budget Office data.

18
Corrections spending accounts for nearly half of all public safety expenditures
Council of State Governments Justice Center 35
Source: Rhode Island Budget Office, FY2004 and FY2014 Budget as Enacted Reports.
Rhode Island General RevenueCriminal Justice Spending, FY2014
Dept. of Corrections$185.4M45%
Dept. of Public Safety$96.4M24%
Judiciary & Courts$91.7M22%
FY2014 DOC Detail
Custody and Security $115.4M
Healthcare Services $19.6M
Institutional Support $15.7M
Community Corrections $15.0M
Institutional Based Rehab $9.1M
Central Management $9.1M
Parole Board $1.4M
Office of the Public Defender
Attorney General’s Office
$24M6%
$11M3%
With corrections funding so dominant among public safety dollars, and only 8%of those funds devoted to supervision,
are there ways for RI to target resources to increase public safety?
Washington state offers a comparison for how policy changes can transform supervision to achieve better outcomes
In 2003, Washington state policies changed to focus supervision resources on
higher severity offenders with a higher risk of recommitting
crime
Source: Communications with Washington Department of Corrections staff.Washington State Legislature. 56th Legislative Session. [SB 5421] Enhancing supervision of offenders.Washington State Legislature. 58th Legislative Session. [SB 5990] Changing times and supervision standards for release of offenders.Washington State Legislature. 61st Legislative Session. [SB 6162] Providing for the supervision of offenders sentenced to community.
42,293
65,549
15,395
0
10,000
20,000
30,000
40,000
50,000
60,000
70,000
93 94 95 96 97 98 99 00 01 02 03 04 05 06 07 08 09 10 11 12 13
As a result, the supervision population decreased by 77%
between 2003 and 2013
Council of State Governments Justice Center 36
Washington Community Supervision Population, 1993‐2013

19
By reducing the supervision population, WA was able to increase spending per offender, even as funding stayed flat
Council of State Governments Justice Center 37
…daily supervision spending increasedfrom $8 to $19 per offender…
$7.88
$19.06
$0.00
$5.00
$10.00
$15.00
$20.00
$25.00
2004 2005 2006 2007 2008 2009 2010 2011 2012 2013
Community Corrections Average Daily Expenditures per Supervised Offender, FY2004–2013
…and investments in community supervision programming more than quadrupled
FY2004$4.1M
Funded Programsand Treatment:
• Chemical dependency• Offender change• Job training• Sex offender treatment
Between 2004‐2013, community corrections funding remained flat, while…
Source: WA DOC Budget Office dataData received from the WA Department of Corrections Budget Office
FY2013 $18.7M
2011 2012 2013 2014
Before 2012, technical
violators couldbe held in jailup to 60 days
Changes to violation sanctions policies dramatically reduced the average daily population of violators in Washington
Council of State Governments Justice Center 38
Source: Washington Department of Corrections.
Average Daily Community Supervision Population in Prison, FY2011‐2014
The average number of days per violation
decreased 65% from 23 in 2010 to 8 in 2013
After policy changes, technical violators can be held for2‐3 days for low level violations and up to 30 days for
high level violations0
200
400
600
800
1,000
1,200
1,400
1,600

20
Summary of three initial focus areas
Council of State Governments Justice Center 39
How does Rhode Island’s growing pretrial population move through the system to achieve efficiency and effectiveness for the system and public safety?
Early analysis indicates a high volume of offenders who are convicted of lower severity crimes ‐‐ how can and does Rhode Island respond to these individuals?
Are there ways to strengthen Rhode Island’s uniquely large probation system to achieve better outcomes?
1
2
3
Additional questions and areas for further analysis
Council of State Governments Justice Center 40
Can people move through the system efficiently and effectively, from arraignment to sentencing, probation, incarceration, and parole?
How do individuals on supervision access behavioral health treatment programs, and how effective are they at reducing recidivism?
Do programs aimed at reducing recidivism effectively achieve this goal, and how do they target populations for supervision or treatment?
What are the demographic profiles of the criminal justice‐involved population at different points in the system?
How will greater integration of validated risk assessments into the parole process impact the parole grant rate, as well as public safety?

21
After justice reinvestment, some states have seendisparities decline
Council of State Governments Justice Center 41
“Examining the Changing Racial Composition of Three States’ Prison Populations”
This brief focuses on three states (CT, NC and GA) where bipartisan groups of state leaders enacted major criminal justice reforms and subsequently saw the number of people
incarcerated markedly decline in their states. In each of these cases, closer inspection of the data shows that these states experienced considerable reductions in the overall number of people being admitted to prison, and that the decline in admissions has been steepest for blacks and Hispanics.
In all three states, the justice reinvestment effort was not focused specifically on addressing racial disparities in the prison population‐ rather, the projects were all aimed
at reducing recidivism and system costs to achieve better outcomes.
http://csgjusticecenter.org/jr/publications/examining‐the‐changing‐racial‐composition‐of‐three‐states‐prison‐populations/
Presentation Overview
Next Steps
Rhode Island Criminal Justice Challenges
Justice Reinvestment Overview
42Council of State Governments Justice Center
22
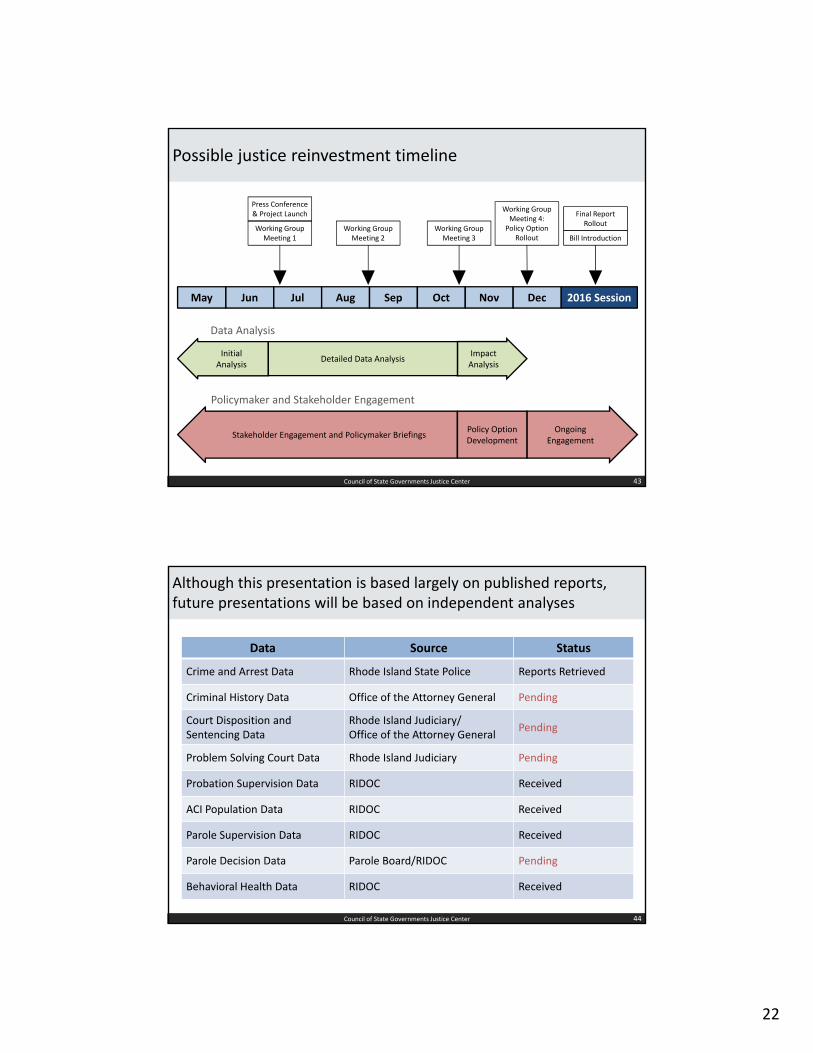
2016 Session
Possible justice reinvestment timeline
May Jun Jul Aug Sep Oct Nov Dec
Working Group Meeting 1
Press Conference & Project Launch
Impact Analysis
Data Analysis
InitialAnalysis
Detailed Data Analysis
Working Group Meeting 3
Working Group Meeting 2
Working Group Meeting 4: Policy Option
Rollout Bill Introduction
Final Report Rollout
Policymaker and Stakeholder Engagement
Stakeholder Engagement and Policymaker BriefingsPolicy Option Development
OngoingEngagement
Council of State Governments Justice Center 43
Although this presentation is based largely on published reports, future presentations will be based on independent analyses
Council of State Governments Justice Center 44
Data Source Status
Crime and Arrest Data Rhode Island State Police Reports Retrieved
Criminal History Data Office of the Attorney General Pending
Court Disposition and Sentencing Data
Rhode Island Judiciary/Office of the Attorney General
Pending
Problem Solving Court Data Rhode Island Judiciary Pending
Probation Supervision Data RIDOC Received
ACI Population Data RIDOC Received
Parole Supervision Data RIDOC Received
Parole Decision Data Parole Board/RIDOC Pending
Behavioral Health Data RIDOC Received

23
Judges
Office of the Attorney General
Office of the Public
Defender & Defense Bar
Parole Board
Corrections Administrators
Behavioral Health
Providers
Victim Advocates
Formerly Incarcerated Individuals
Probation and Parole Officers
Law Enforcement
Reform Advocates
Business Leaders
Stakeholder engagement will raise additional issues
RI JR
Council of State Governments Justice Center 45
• How do mental health and substance abuse needs contribute to recidivism in Rhode Island?
• What are the unique treatment needs of criminal justice‐involved populations? Where and how are these needs unmet by current resources?
• Focus presentation on “what works” to improve public health and public safety through tailored and coordinated multi‐system approaches to supporting justice involved people with behavioral health needs.
• Provide recommendations on how Rhode Island can improve the quality of and access to behavioral health care for justice involved populations.
Justice reinvestment offers RI the opportunity to analyze and address challenges related to behavioral health
Council of State Governments Justice Center 46
ANALYSIS
PRESENTATION
RECOMMENDATIONS

24
Council of State Governments Justice Center 47
Thank You
Chenise Bonilla, Policy [email protected]
This material was prepared for the State of Rhode Island. The presentation was developed by members of the Council of State Governments Justice Center staff. Because presentations are not subject to the same rigorous review process as other printed materials, the statements made reflect the views of the authors, and should not be considered the official position of the Justice Center, the members of the Council of State Governments, or the funding agency supporting the work.
C SG J U S T I C E C EN T E R .ORG / SUB S C R I B E

This project was supported by Grant No. 2013-ZB-BX-K002 awarded by the Bureau of Justice Assistance. The Bureau of Justice Assistance is a component of the Department of Justice’s Office of Justice Programs, which also includes the Bureau of Justice Statistics, the National Institute of Justice, the Office of Juvenile Justice and Delinquency Prevention, the Office for Victims of Crime, and the SMART Office. Points of view or opinions in this document are those of the author and do not necessarily represent the official position or policies of the U.S. Department of Justice.