juutmu :::>ctences l
TRANSCRIPT

... I '
l
.Juutmu ot Applted :::>ctences l<.esearch Paoe 1 of2
'1
Ho.nc
J~urnal Rank1n<:s
Count ry Ranking,.
Country Searc h
CompM<'
1-f"lp
Ahout U•.
C: fl o w th sor.. · n fo t m;, t·· ~P ir'l "·our owu wcO •~:,
Tc•t.•li q t:~~
• 241
../ I(
I .. C\•j•'' \hf'\ Mo;", lJt t;t I l'N dl'd
~-:.J,tP \..;·ttrr , ,,, tn· l·i· ·} •·
<a href="http //www sc1mago)r
:~ r! i ;:~ t e I p r ,1 r. u c t
' "'
,p ' I ' '
m Journal T1t1e v Search
Exac t phrase
Jr :"1 : I ( I ,'._ !) l' ' ~ ( ,.,. ) R f''•
Country: k "~., ,
Subject Area: />. • 1 v •' . "'
Subject Category:
Quartile (Q1 means h1ghest values and Q4 lowest values) Category
1999 2000 2001 2002 2003 2004 2005 2006 2007 2008 2009 2010 201 1 2012 2013
1\ I ttl 1 ll ~~
Publisher. • • ,, " 111 ., . Publication type: Journals. ISSN: 1819544X, 1816157X
Coverage: 2009·2012
H Index: 9
Scope:
: : Agricultural Sciences
: : ReligiOUS Studies
: : Applied Biology
: : Civil Engineering
: : Applied Physics
::!Ill[ ... ) )h<"w lull ·.u>pr·
(ll~ft~
SJR indicator vs. Cites per Doc O y )
.... : !\
.•.?J I \ \
I \ 1.~- : I \ 1. ~ ,·
)_ l:
)•
.1.'.:
' \ '..
---- ~---- ---- ---- ,---- .---- ~---- ----~---- ---- ----~----~--~----~
.• 2(
~, ' [l
01(
•11.!
vI·
;o l t,
\. ·~
1 .. •:-~ ... :.•, ... t•11 .. ... J.. ...v.. , ).! ... •v: 2 .. ••;. ..0(•, 2(.,,.;,o __ 1(19 21.' ·:• .. . 1 · .. t~~~ .. . ·1~
(')(, ! ' •' ,I ( ,, P.· I I I'
(I \ I 1/ ( tlV! II
,our . ,. lUI
'""If,
1 'JIll! •1n1. 1
t :1··,_: ~\ ,· h. l , ... 1t 1 l1,r !' ()il 1r lV' ~ ;' lfi v' I~· J ,r,, l
1r I (• ,1 ~·n: 11 r; l,t c' .1 11 ~Vf' >'lf/' Hi,. ( [•JtJt: /1•.·1 .11 rt·1,
111 , h• s , •o• f"t'l~ ll 11 o ;r,\(1( • ••1 t t1< tf')l ,- nrp
bttp://www.scimagoj r.com/journalsearch.php?q= 17600155 1 05&tip=sid&clean=O 2015-05-25

Journal 01 Applied i::iciences Kesearch Paae 1 of2
Ho•nc
.J::>urna l Rankm~s
•:01 n try Se-arch
Compare
Ma p Ge nerate••
H<'IP
Ahout U•.
<;tlnw th1 •, pfflT m:~ tr ul' If'
VOl or ·.\.-..: \•:cb . d
SJ~
C1 t~~ pe-t• d(oc • ~ • +
To:•t~"tol
r.l ~ t~ \). 4 -So
• 1• .13
• V .1~
• 241
../ I • ' ~ I
<a href="http //www sctmagoJr'
p r ,, tJ u c t
.lo • ,,,; :;E, r( h
in Journal Tttle v Sea rch
Exact phrase
J< ' ., l
Country: t•
Subject Area: N • "' npt:nar
Subject Category:
Quartile (Q1 means highest values and Q4 lowest values) Category
1999 2000 2001 2002 2003 2004 2005 2006 2007 2008 2009 2010 2011 2012 201)
.,1
Publisher: •l'olm·t "• I'll'·"", . Publication type: Journals. ISSN: 1819544X, 1816157X
Coverage: 2009·2012
H lndex:9
Scope:
: : Agncultural Sciences
: : Religious Studies
: : Applied Biology
: : Civil Engineering
: : Applied Physics
::All[ ... )
S ll0\'J I d '(')P(!
•: ...
11_; :
··- ~·.
,.
SJR indicator vs. Cites per Ooc (2v)
Chart ...
1\ I \
! \ / \
'
----,---- ---- ----,---- ----,----,----,---- ---- ----~---------------
~. 10
'' I~
l I
\. ·~
1\t~~ :_.-. (1~ _, {'1 .'1 : .'ll., .. LL.-~ 2.~1 .! :.J(\: 2~.:ij =~(17 2(<18: :J(IJ 2f•l(l .. 11 ._'(l l~ 1:
hP ).,t( I t. l t 1 I li tr\ rf I ,• \1 IPil'ltlr 1,'(\ ~1 1 ·'"~ '"'II thr• J'-'f"r~lf!0 'I • k• I n ]'ll !n,1i .
t.~x.~·r '.· f'C.: lt(\W ( l 1 ''i' fr1 thP (!lriJ, ' ·,,·,~ ,, a; d1Vd'• 1011 --.. 1vt r,r!J=~ '' 1.~ 0f 1.~-1
,r l-l :..
lt P\ )( r i)(1( :2yln I I ,Jit;o<..lhr> ( pqt fir I TlP•l• t 01 'lf' tlVPrfl~W ~11~ 1 (,,(• l iilh& •.1 (.~·1 lll rl--·
.,uur·l 1• ;· ' 1 nutP< ' "Ill·, th I SC'fl"lc 'o• ffilhf'l tt-~t jo ~flldl'il ,.._.,i ~ ~( tnr (,.,,cHn~·~n
R· {PT'\i
http://www.sci magojr .com/journalsearch.php?q= 176001551 05&tip=sid&clean=O 2015-05-25
\ I~-

• c{ I
Journal of Applied Sciences Research
Scopus Ci1.ation v~ •. Self-Citation
L" "'" I I lOll J\ h' : .. ,: I I ournb 1 ·r ~f ( lLJitOn\ .:nd ]Ollrfl,)(" 1JPlf ( 'l )l_tCf\) rr v-•]V~·'il }\ il J')lll (l,\l
[)i..it·:t~<:.h•d dO( Jr1C·r·t~ !U:HH~ ~it.' three' prt?VIOIJ~ ',;•."'(lrS.
Cites per Document vs. External Cites per Document ,...Vl: t-1 orr r:·-f t!w· 'lumber o+ tnt..ll r-q~~. pt'r :locllrnc·nt Jncl ext~?rn,ll cit ('I\ per c!ocumert li,,_-::~_
J( •l' · ~ ··rti ·( 1t ;.:·r(H!" r'''TlOVt~{! 1 r t'l r·:v(_·rJ by "r JOlll rr;j\.•) puhtr~lw<l dot-, rncntli durJfl:! thf' thrt•t
PH'\1<)1_;-:., VCiH' •.
Cites per Document in 2, 3 and 4 years windows Evolution of Crtations Pf'1 Document to a journnl's publ1shed docurn,.nb dtr•·ing the two. three
and four prPvious yp;uo;;. ThP two year5 linP is equivalenlto iorJrn,llrmoc:~ct far tor.,.~ !Thomson
RntJlPrs) metric
inter-national Collaboration 1·1~"' rt(Jlt()l1-11 ( )[L-il}fit."'!tH)I d<:rDunt~ f01 thP ·11 tid<•'" 1h(lt hrtV~"- hr:f'll pr(ll 1 tl~'"t•d 'l)' ''''\(•,H• h'-'t'
iJ!".'''Il \f'Vf I 1~' )tJI"liiH'(. .,.lf' r h;HI ·,h{)Wt, th('• r:)llO 0 1 rl JOIIfllfll·, dt11 tll"lt"'l''( .)lf~tH•d 1··\
.r~· .. •··'l~ ·,:. · t·~ i r'lll note tll-lt1 r)nr; '.ountry.
Journal's Citable vs. Non Citable Documents f·l11t ('VC!V -"'\1':1 1.1" in.") )filii '':1' i~ ·r~n<.,;clr•lf'd pri!Tl(lry tf'\Ci"HCh ;~n\.1 thr·v·foH· "lt'1bi' , thi\
Ch;l1 1 $11()W'.: t''r' 1.1tin 01 ,1 l(ll !I n~ll'<l r11 ir~[ ('\:, \ndtt(!lilg '-'ilh'-'1 ;"J!lttt=ll I p..;.(•."'!rt'h ( I ('<:.f··11Th •1rt\l_·ipt;,
fOilff'rPtll.(' IMPCI \ ,:1( I<'Vii'W">ltn ti1 f P(' V('.lr Window•;.
Journal's Cited vs. Uncited Documents f'<; 10 iJf 1 j,)l lrf•;t[\ ~t1 '1', ~~~ rt:tJr~r! If' thrc~p -.•r: ,"'JI"5 ll.Jij1di""JW'J '.h-?lt i1,1Vf.' ~1• ~f"l ·it.Pii at [rc:tr,J (}11( fl
\~. '·'"t)'.:P not c. it~""'d r IJr il':; t h·· fotlovn11~ w~·~~~ .
http ://www.scimagojr.com/journalsearch.php?q==17600 1551 05&tip=sid&clean==O
Page 2 of 2
2015-05-25

I, I•
I
Journal of Appli ed Sciences Research, 6( 12): 2042 -~050, 20 I 0 © 2010, lNS incl Publication
Hydrogeochemical Study, Health Implications and Interpretation of Surface Water· Analysis Around Rural Settlements of Itasin and Oki-gbode, Southwestern, Nigeria
11khane Phillips R., 2 f-(>lorunso Adetayo F., 2Shoni bare Olufcmi L., 10dukoya Abiodun M. and 1Shomoyc Comfort 0.
I
10 epartment of Earth Sciences, Olabisi Onabanjo University, Ago-lwoye, Ogun Stnte, Nigerin 2 Department of Geosciences, Uni versity of Lngos, Lagos, Nigeria
3Department of Petroleum nne! Chemical Sciences, Tai Solarin University of Education, Jjebu-Ocle, Ogun State, Nigeri a
Ahslrncl: A total of twelve water samples were collected fro m two rivers in ltasin and Oki-Gbode nreas of lmobi, southwestern Nigeria, six (6) from each river and analyzed for chemical and physical quality parameters. The two water bodies serve the inhabilcHltS of these communities as source of drinking water, agricultural and domestic uses. The hydrochemical parameters deterlllinecl include major cntions and ani0ns using Inductively Coupled Plnsrna Optical Emission Spectroscopy (ICI'-OES) and the ion Chromnlogrnphy methods to evaluate the water type, qunlity and usnge. The physicnl analysis of the water samples were determined and the resu lts indicate that the pl-1 and Total Dissolved Solids (TDS) values nmge from 4.4-5 .5 and 2 1.00- 75.00 mg/L respectively, Electrica l Conductance (EC) ranges from 32.3 1- 1 15.39 mS/cm and Sodium Adsorption Ratio (SAR) from 1.62-3.39. Results of the chemical and physical analysis obtained for the ri ve r water samples were assessed and compared with World Health Organizntion (W II O) and Standard Organization of Nigeria (SON) standards in order to deduce if the water satisfies all the· conditions for potability, irrigation and industrial use in low pressure boilers. 'Results obtained show that the Weller samples do not fit for drinking from the two standards c.mployed, but C<l l l fi nd uses in irrigation and for industri<~ l purposes in low pressure boilers. The health implications deriving from drinking of these water bodies could be very devastnting. For example, eonsu mption of water having low pH over a long period of time may lead to metabolic acidosis, respiration may become deep and rapid in severe cases. Using Piper Trilinear diagram, the water samples were cla~;sified as Alkal i/Earth Alkaline fCa - Na- Cl - S04 - I IC04] water type.
Key word: Wnter Quality, Piper/Trilinear Diagrr1111, Sodium Absorption Ratio (SAR); llydrochemiefl l.
INTRODUCTION
Water is the most essential const ituents of the human environment, Tehhutt!IMJ_ The wnter resources generate development in socio-environmental issue crucinl to the society in general and more specificnlly for industries, agricu ltural activities and for pu bl ic usc. Surface water classifications arc designations applied to surface water bodies, such as streams, rivers, nnd lakes, which define the best uses to be protected within these water (for ex<~mple sw imming, fi shing, drinking w<~ter supply) nnd cnrry with them an associated set of water quality stclllclards to protect those u~es. There is no substitute for water in any of its uses. However, as much <IS water is important in life, where and when it is nvnilnble, it must he kept safe and free of eontumination and pollution tbr the survival o f immkind : Until recen tly, surface water was the obvious
source of water but the advent of hand-dug wells and boreholes which arc relatively recent development have <1 lmosl shifted the supply of' fresh water from surface wnter bod ies to underground water supply. The chemica l composition of water is important criterion that determines the qunlily of water. Wnler quality is very imp01tant and often easi ly degrnded. While naluml environmenln l processes provide a means f~r removing poll utants from water, there are definite limits. ll is up to society to provide safeguards lo protect and maintain water quali ty. Pollution of water comes from many sources . Municipalities and industries sometimes cpscharge waite disposa ls into water bodies that nrc used as public sources of supply. Surface run-off also brings mud, leaves, qnd de<.~ay vcgel!llion logetl)cr wi th human and animal \vnste~ into stre~ms <Hi d li1kes. lq turn , these orgnnic wastes C!liiSC ' ~ Igae nnd b11ttcria tr nourish. j'ollutan1s deriv ing ft'om these and 111ai1y other
' , ' ' I •
Corrcsnon cting Autlwr: Folqnmso i\dctnyo F., Dcparllllcnt or Geosciences, ~piyprsity (Jf J-ng(lS, Lngns, Nigeria E-mHII: [email protected] '; ' ' · . . ,
2042
• ' t ,, 1,''

.. " -.1. Appl. Sci. !?e.~ .. 6(12)' 2042-2050, 20/IJ
processes may enter surface or groundwater directly, may now slowly within the groundwater to emerge eventually in surface water, or m<1y ru n off the land. Hydrochemical assessment on the water samples shows how the dissolved substances (which could be heavy metals (trace clements), compounds etc) occur in Willer.
·The proportions of these chemical parameters constitute indices of its proper use and quality. The improper d isposil l of refuse dumps and other pollutants, weathering and subsequent release of weathered materials also contribute to the chemistry of water. The Worl d Heal th Organization (W IIO) therefore established certain limits as minimum and maximum allowances for certain substance in water that is intended for dr ink ing purposes.
In Nigeria , the National Council on Water Resources (NCWR), in 2005, recogn ized the need to urgently establish acceptable Nigerian Standard for Drinking Water Quality because it was observed· that the "Nigeria n Industrial Standard for Potable Water" developed by Sta ndards Organisation of Nigeria (SON) (the on ly body responsible for developing National Stand<1rds in Nigeria) and the "National Guidelines and Standards for Water Quality in Nigeria" developed by Federal Ministry of Environment did not receive a wide acceptance by all stakeholders in the country, SONl17l . Also, owing to the importance of water and the fact that water quality issues arc health related, the Federal Mini stry of Health, collaborating wi th the SON and working through a technical committee of key stakeholders d~vcl~ped a Standard, SON117l, which was also used for this work.
2. Th e Study Area: The study area is around rural settlements where people depend on su rf'ace water both for consumption, domest ic and irrigation purposes. It lies on lat itudes 4° G' to 4° 91 N and longitudes 6° 351 to 6° 371 E within Eastern Dahomey Basin, Fig I . The stratig raphy of eastern Dahomey basin has been studied by various researchers such as Russ1161 , Omatsola and Adckogc113l and Agagulll, EnulSl and Nton191 Fig 2. The lithostratigraphic units described arc Abeokuta group. T.his is the o ldest stratigraphic un it overlying the basement consisted of three formations namely; lse, Afowo and Araromi formations. f
The group is made up of sequence of continental sands, grits and coarse grained to medium grained sandstones and nlso with variab le but thick interbedded shales, siltstones and clays tones. The rock is son and fragi le but it is in some places cemented by ferruginous and siliceous material. The sandy facies arc tar bearing and the shales are organic rich. Enul5l. The grains arc well sorted, line to medium grained si ltstone at base overl<1in by shale. The bitumen . is found seeping in most areas including the study· area.
Overlying the Abcokuta group is the lmo group wh ich consists of Ewekoro and Akinbo forn1<1lions. The Ewekoro formation is essentially a fossiliferous limestone, shale, marls with a sandy base as it grades into Abeokula formation whi le Akinbo consists of grey fossil iferous shale and claystone unitsl"l.
The claystones arc concretionary and are predom inantly Knolin ite, while the base of the formation is defined by the presence of glnuconi tic bands with lenses of I imestnne. Oshoshu n forn1<1tion is the next stratigraphic unit. This formntion composes of massive phosphate bearing shale with interbedded sandy unit overlying Akin bo formationll 5l. It is characterized by a dull brown and brick red sandy mudstone and claystone. Underlying this is the sa ndstone unit of ll <J ro FormatiorPl, while the younges t sedimentary formati on in the Basin is Ben in Fom;ntion or coaslnl plain sand consisting of series of so ft poorly sorted, clayey sands, and sandy clay sandstones showing cross bedding.
However, the geology of the study area is mainly sa ndstone of the A fowo formation. The grnins are wel,l sorted, which is of medium sizes and small component increases progressively from bottom to lop. Natural seepage of hydrocarbon - bitumen IS common especially along river courses .
Methodology: Twelve ( 12) water samples were collected from the two rivers, six (6) from each river for laboratory analysis following <1 sys tematic procedure. A three-in-one pH meter was used to determine the pH and TDS of the water samples while conductivity meter WilS employed for the determination of electrical conductivity (EC). These parameter were determined in situ. Determination of hydro-chemical parameters such as concentrations of nnions (Ct·, SO/ , IIC03' and N03') and cations (Na•, K\ Ca2
', MgH· CuH and Fe) was done using Inductively Coupled Plasma Optic<1l Emis~ion Spectroscopy (ICP - OES) at the Activation Laboratory, Canada. ICP-OES techn ique is a rapidly developing rmrlti -elemcnls method and is replacing even Atomic Absorption Spectrometry, AAS. Inherent advantages of the methods includes ti me saving, multi -element determination of a wide range of 40 - 70 clements, detection limit of 0.0 I%, better precision and accuracy.
Samples for cntions determination were acidified immediately to avoid contamination and acidi lied samples were stored into 60m l bottles and unacidificd samples into 120m! bottle. Total or four-acid digestion, comprising hydrochloric (I ICI), nitri c acid (HNOJ)• perchloric acid (1-ICIO~> and hydroOuoric acid (HF), was used to decompose metal salts, carbonates, su lphides, sillc~f~s and some sulphates and sulfide.
I ,,,1 : •
2043
117
.!. Appl. Sci. Res .. 6(12): 2042-2050, 2010
~
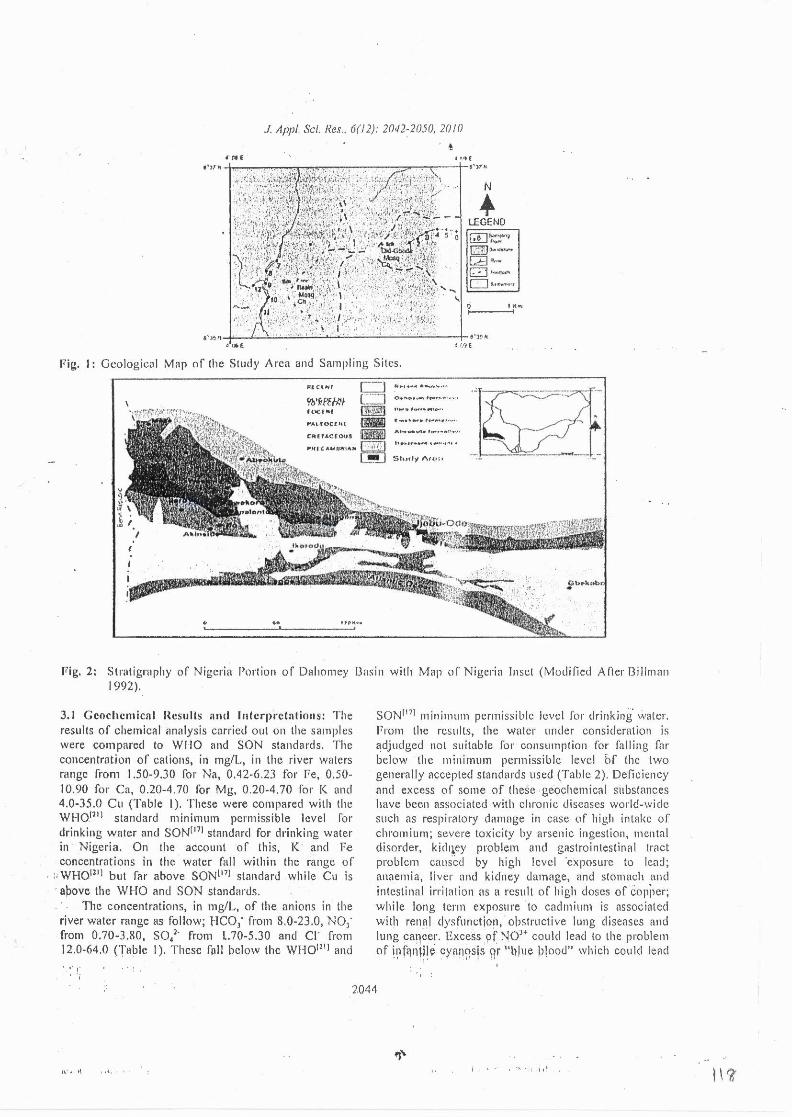
Fig. I: Geological Map of the Study Area and Sampling Sites.
" -l C\Nf c-J , .. , ....... ~~ ............ 9b'flf'E:HII L= l O•"'to•~-~,..,,,.,.,,,, •
f(.)C(Nf lm21 ,,_.., ,_, .._..,,_. fi'Ar.l(OCfiH 1&1 .. _ ... _.,, ... ............ CA(f.&.C:( t)U.S ~
.... , ... _ ....... , _~ ..... , .~··
PI( I ( AU,f"'I~,Jt ~ '•l,-t\1'} l ., ............ .- ....... , ...... "r-=~zt ~,·
[_Iii!] S tudy A,,, , , - ---·---~--- -·- ·-
Fig. 2: Stratigraphy of Nigeria Portion of Dahomey Bnsin wi th Map of Nigeria Inset (Modified After Billman 1992).
3. I Geochemical ncsults and lnlcq)l'ctnlions: The results of chemical ilnalysis carried out on the samples were compared to WHO and SON standards. The concentration of cations, in mg/L, in the river waters range from 1.50-9.30 for Na, 0.42-6.23 fo r Fe, 0.50-10.90 for Ca, 0.20-4 .70 for Mg, 0.20-4.70 for K nnd 4.0-35.0 Cu (Table I). These were compared with the WHO.fl iJ standard minimum permissible level for drinking wnter and SONfi?J stAndnrd for drinking water in Nigeria. On the account of this , K and Fe concentrations in the water fall within the range of
.. WHOfli J but far above SONll71 standard while Cu is · apove the WHO And SON stnndards.
The concentrations, in mg/L, of the anions in the river water range as follow; HC01- from 8.0-23.0, N01·
from 0.70-3.RO, SO/ from l.70-5.30 and c1· from 12.0-64 .0 (T11ble I) . These fnll below the WHOfliJ and
. :!
SONI 171 mini mum permissible level for drinking. water. From the resul ts, the water under considemtion is adjudged not sui table for consumption fo r falling fnr below th e minimum perm issible level bf the two generally nccepted standnrds used (Table 2). Deficiency and excess of some of these geochemical substances have been associated with chronic disenses world-wide such as respiratory damage in case of high intake of chromium; severe toxicity by arsenic ingestion, mental disorder, kid1ley problem and gastrointestinal tmct problem caused by hi gh level 'exposure to lead; anaemia, liver nnd kidney damage, and stomach ancl intestinal irri tation as a result o f high doses of copjler; while long term exposure to cadm ium is associated with renlll · dysfunctio!l , ·obstructive lung diseases and lung cancer. Excess of NOJ+ cou ld lead to th e problem of !pf<lll\ile cyan?sjs qr 1'h!ue l.>!ood" which could lead
I' .
2044
II ' • 11 , , i, ' .. , . l \ <6

.. i' -
.J. Appl. Sci. Res., 6(12): 2042-2050, 2()/()
TRblr I : Results of Chemicul Annlysis for I he Two R1vers SamplcLocnlmn Nn' K' Cn'' Mg'' Fe Cu JICO,· NO, SO,' Cl"
(mg/L) (mg/L) (mg/L) (mg/L) (mg/L) (pg/L) (mp,/L) (mg/L) (mg/L) (mg/L)
lA 93 4.7 10.9 4 5 0 .45 6 13 OR IR 22
2A I .R 0.4 06 0.2 0.54 24 21 07 J I 28
3A . 2 0.2 0.5 02 0.42 6 8 08 3 60
4A 1.6 0.4 0.7 OJ 0.73 12 16 0.9 2.9
SA 04 I I 04 I 83 8 17 52
6A 15 09 1.2 04 2 83 16 13 OR 2 27
78 1.2 6 2 442 4 22 I 8 12
8D 4 2 0.9 5.9 2 4.67 31 19 09 36 60
9U 46 1.1 6. 1 19 5.64 8 21 1.1 17 64 .
100 3 4 1.1 6.4 2 6 23 6 19 1.6 2.6 42
IIU 1.3 6.5 2.1 6.06 35 23 3.8 53 26
f21l 4 2 1.2 6.5 2.2 432 6J 21 2.5 3 58
Tnhlc 2: Slut1stical results of summary of chemical nncJ physical analyses wtth WHO nncJ SON StancJarcJs Measured l'aramelers l'resenl Study WIIO (2006)Siandard SON (2007)Sinnd:lrd
f rom the Present Sludy Rnnge Menn Min Perm. Level Max. l'crm. Level . Max Perm Level l'h 4.4-5.5 4.9X 6.5(mg!L) 9.5(mg/l) 6.5-8 5
TDS (mg/1} 21-75 51.2 500(mg/L) 1500(mg!1) SOO(mg/1)
EC (pS/cm) 32.3 1-115.39 7.72 400 1500 10000
Ca (mg/1) 0.50-10.9 4.37 75(mg/1.) 200(mg/L) NA
Mg (mg/1) 0.20-4.50 1.52 40(mg/L) 150(mg/L) 0 2(mgfl)
Nn (mg/1) 1.5-9.30 3.57 I O(mg/L) <20(rn!VL} 200(mg/L}
K(mg/1 ) 0.2-4.70 1.14 IOppm 15ppm NA
Fe (mgll) 0.42-6 23 3.18 S(mg/L} IO(mg/L) OJ(mgll)
Cu (mgll) 4.0-35.0 13.53 O.l(mg!L) 2(mgll J I.O(mg/1)
Hardness(mg/1) 2.0-30.0 I 3.3 150(mg/l.}
8.0-23.0 17.75 200(mg!L) 600(mgll .) NA - ·- ~--~·-- --------------------------------------------------------------·-·----------------·---------- -------------------------------------·--·------------- ------------------------
0.70-3 80 1.33 20(mg!L) 45(mg/L)
Cl' (mg/1) 12.0-64.0 42.58 200(mg!L) 400(mg/L) 250(mg/L) Min. - Minimum, Max. - Maximum, NA - Not Availnble ·
to infantry death. High contents of re 2' in water can
also cause stain ing of laundry; metal pipes for reticulation, scaling in pipes, nnd it may give undes irabl e tastcll 2
'6
'101.
High concentmtions of some clements in water from. the two rivers may not be unconnected with natural and anthropogenic nctivities in the nrca. ltasin
and Oki-Gbodc and their environs nre well known with naturnl secpnge of bitumen also referred to as tnr sand. The bitumen seeps nnd nows into the nenrby streams nnd rivers while !]t some locations it seeps along river cou rses. It -.ya~ ~lso noticed that the resource is mined by the lpcnl dwel lers for various purposes but commer~i a l ini1ilp~ ' js' pot with in the area. These
201\5

~ -
-, .
J. IIppi. Sci. Res., 6(/2): 2042-2050, 21110
activities arc expected to have signilicnnt effects on geochemical processes within the environs by way of increasing and/or decreasing the quantity of geochemicnl elements present, while the qunlity of water is ndverscly altered. Thus, the environment cannot be regarded ns a nntural one owing to the aforementioned nctivities and other anthropogenic in t1 ucnces.
3.2 Hesults and Interpretations of Physicochemicnl Tests on the Water: The physicochemicnl onnlyses carried out on the snmples include pi I, TDS, Electrical Conductivity, EC, Hardness and SAR. The last three parameters i.e. Electrical Conductivity, EC, Hardness and SA R, are carried out for consistency of result cllld to ascertain the true charnctcristics of the water from different points. The results show tlwt the pH of the water samples rnnged from acidic va lues of 4.40 to slightly acidic value of 5.50. The lower values recorded might be due to decomposition of some organic matters or seepage of bitumen into the water from run-off.
The partial decomposition of these organic matters by bacterial and fungi has been recognised to produce va rious organic acids that are capable of lowering the pH of aqueous solution1l· 101. Also, one of the associated impurities with hydrocnrhon is hydrogen sulphide, hence its likely int roduction to the two water bodies. The total hardness of water which ranged from 2.00 -30.00 mg/L, falls within soft water classification of Toddl 20 1, Table 3. Genera ll y, low Electric!ll Conductivity, EC, (32.3 1- 115.39 11S/cm) and TDS (27.00-75.00 mg/L) vnlues were measured showing that the surface waters are fresh waters. While the abnormal value obtnined for the pl-l confirms the interaction of seeping bitumen with the surface water.
Physical parameters also determine the suitability of water for ce11ain uses (for example domestic use). Notable damage could occur both to humnn being and utility from !lbnormal high or low values of th ese parameters. For example,fl21 noted that water with low pH ('acidic' water) may cause severe corrosion of metal casing used for reticulntion. In like manner, long exposure to such water has been associated with metabolic ncidosis whereby respiration hecomes deep and rapid in severe cascs,fl01.
The Sodium Adsorption Ratio (S1\ R) ranged f'rom - 1.62-3.39. The recommended water classification based
on SA~ .is shown in Table 4. Mendel and Shiftnnt~l suggested that waters having SAR of 0-10 cnn be used for agricultural soils while those having SA R range of 18-26 may produce harmful effects on agricultural soils. Thus, based on this classification, water from the two rivers nrc good for irrigntion, which is one of the major uses of the water hy the n1ral dwellers of the two communities .
3.3. Trilin cn r (Piper) Diagrnm: This can be used to classify water into various types based on the domii1ai1t cntions and anions. It is grnphical representation of wnter types modified a ncr Piper ( 1944). For example, if calcium and bicarbonate are the dominant ions, then the water would be Ca-liCO,~ type. On this dingram, relative concentrations of major ions, in Meq/L are plotted on cations and anions triangles, and then the locations are projected to a point on n qundrilnternl representing both ions, Deutscht' 1• The quadrilateral was further divided to seven hydrochemienl flleies from, a - e by Tijani ll')l using the anions concentrations, Fig 3. Based on this, waters from Oki-Gbode area fall into the 'e' !lnd 'g' types. This is known as predominantly SO,- Cl i.e. 1\lkali/Earth-alkali water.
However, ltasin water differs as it sliows a predominantly Earth-Alkaline type (e), wi th higher alkali components, except in location 9 where n high sulfate, S04, of type 'c' was recorded. Cations concentrations show high Ca and Na contents. Hence, the overall results could be put as Alkali/En11h 1\lknline water [Ca - Na - Cl - SO, - HCO,] Pig 3. This reflects diverse effects of bitumen seepage, atmosphere precipitati on, weathering, cation exchange processes and anthropo~enic input as affected surf!lce water quality of the areas. !3nrth-alkalit1e waters2)Earthalkaline wnters (with higher 1\lkali component) Predominantly HCOJ(d) Predominantly II C03 HCO,~S0.1(e) Predominantly SO, - Cl Predominantly SO, Alkali watersl-6- Oki-Gbode water (f) Predominantly HC01 (g) Predom inantly SO~ -- Cl 7-12 - ltasin water
3.4. Stntistica l Evnluntions: 3.4.1. Co1Tclntion Coefficient: The determination of coefficient of correlation helps to evaluate the existence and extent of relationship between two variables. Association of some elements may lend directly to the interpretation of the likely sources of the clements. Na, K, Ca and Mg are strongly correlated to one another (Fig 4). lt implies that same source could be inferred for these elements which mean that the process that introduced Na into the water is also cu lp1'it for other elements that are strongly correlated with Na. f-or the anions, HCO, correlates wi th N03 and N01 with SO~.
We know that C02, nitrates and ammonia could be introduced from rain water wh ich n1n-off into the stream . This lllllY possibly be responsible for incrensing ncidity of the water. A few positive relntionship exits between sdme cations !lnd some n'nions, for example Fe versus NOJ and HCO,; and between Cu versus SO,: re could be ll·om ferruginous sandstone that consti tutes part of the geology of the area. A better Approach to understand the <listribution of chemical elements made us to determine the ild~ pnth of these elements in the river water as showq. Jf] tile Sc!10cllcr <lingra111s (Fig 5).
2046
" ······· · ll 0

J
J. IIppi. Sc:i. Res .. 6(1:!): 2042-2050, 2010
• Water Sample
I )
2) • l ·o - Oki- Gt·ode mler
e 7-12·- ltusu1\'l•ler
Fig:· 3: Trilinem (Piper) Diagram plot of the Chemical Data Showing Different I lydro-chemical fncies in the study aren.
TAllie 3: Woler Clnssilication based on TDS and llardness (Ancr Todd, 1980) TDS (mp/1.) Cbss llordness (mg/1.) Cia~~
Son <I ,000 Frc.~h 0 - 60
I ,000-3,000 Slightly Saline 61 - 120 Modc•alcly lhud
10,000-35,000 Very Saline 121 - ISO
>35 000 llrinc > 180
Tn hie 4: C l as~i fieution nf water based on ""SA;..;..;..:Il_,("-A"'-fl:.zc:...r ""M;.;;u""'m"'IG:..:.I..:.;ac:.:.nt"-1 "'S""h;.:.in"'n"'n,~l Y...:.9..:.1l,__ __________ -:-:-:--:::------SAR (%) Wutc1 Clnss <10 Excel lent __________ \ ______________________________________________________________________________________________________________ __ , ______________ , _______________________________ _
10- IK Good
19-26
>26
The spatial distribution of the chemicnl clements denotes progressive increase in water mineraliz.1tion for ltnsin as agninst Oki-Gbodc water. In the Inter, most cations, except for Fe, remain constant (fig 5a); whereas, there is general increasing trend of cations
.. · concentration- for ' ltas in 'water (fig 5b). Also, the chloride composition shows an increasing sequence in
l'nir
Poor
both waler but more pronounced in lt<~sin th<111 OldGbodc.
Thus, a uwin trend towards increasing salinity can be observed. Nitrate and sulphate concenlrntions arc quilc constant in both . Samples 51\ and 61\ have the highest f:e concentrations followed by sample 21\. while sample 1213 has the highest chloride
2047
'~'

)
l l.
/_~
L
L
L [
.tf'
r [
L L
J. Appl. Sa Ues., 6(12): 2042-2050, 2010
. ,
II
I 10 I
! I I
1 I I
' I " z • I
I
I : t: l
O i
s 4')
4
IS
~ J
!. 2S r 2 i
1.5 i
0
J i OS i
0 :.
0\
··a. • •
~
KII'ICI\1 ________________ _,
• • •••
l.S
10
C,(m&/l)
-·- - L.
NOll,.ull
f"ig. 4: Correlation Plot of some Chemical Pammeters
concentra tion. Generally, there seems to be gradual increase of the chemical elements in ltasin water.
Higher enrichment of this water (river llasin) above the other one {river Oki-Gbode) could rossibly he explained in the fact that it nows from a far source cutting across different and wider geographical locations incorporating geochemical signatures from various sources along ils rath.
., ' ' 14 •
ll ! - · 10 ' ~ I E. s ' I .:J
' j .~
•
: I 0 .
0
Xlm&IU
---- . ----------------
• n
] ~~ I
/
"' 0 I S i z :
l
OS ' 0 !
0 10 1\ /0 IS JO Jl
HCOltmlfl)
30 .
IS · /-10 . • •• ~ • ! • • 1\ • 0 • • z l: 10.
• /
0 - .
0
JrlmutJ J ---- ---- -·-·--· ·~ ··- .... ~-- -·
Conclusions: Physico-chemical assessment of water samples taken from rivers ltasin and Oki-Gbode in the study areas has been discussed here. Twelve samples were collected in nil six from each river. The snmples were analysed with Inductively Coupled Plasma Optical Emiss ion Spectroscory {ICP- OES) and the ion Chromatography methods for cations and 11nions, while the physical parameters were delermined, some in situ and others in the laboratory.
2048

...
J. IIppi. Sci. Res., 6(12): 2042-2050, 2010
(a)
10 :;
' ~ IS E
Flow Path forOki·Gbode
; 10 ·---·--·-------····- " 0
~ s ----·------------· L ... ~ 0 y c 0 v
14t l• C~l· ~~I · fe Cu!• H(0l 110l· SOil· 0·
Pmmelers
Samplt -+-lA + ZA ;-.!A -~ -s~ +6A Station
_. s < 1 r;; Cl 6 E - s c
flow Path for Uasin
.g 4 • ·---·- -----·"- .. --
(! 3
~ 1
~ I 0 v 0
K• Cll• 1.!&1• Fe Cult 11(0) IIOJ· SOli· Cl·
Parametm Samplt
(b) Station -+- 78 -+SB -.-~a - toe -110 -+-llB
Fig. ·s: Schoeller diagrams showing the hydrochemical composition now paths for the two rivers
. . - ' The results when compared with WHO and SON
quality criteria for drinking water, shows very low degree of compliance. Chemical contents of OkiGbodc water show lc11ser concentrations compnred lo lhnl of ll:~sin . Sl:~li sti c:~ l cvnlu:~lions on the river wntcrs indicates that there is general increasing trend of cations and chloride concentrations for llasin water than for Oki-Gbode water.
TI1Us, ltasin water is more mineralized than its counterpart possibly because of its long flow history and wider geographic coverage. The high Fe· content is highly undesirable and long exposure lo it may give undesirable taste.
On the other hand, physical parameters determined also portend the water unsafe for human consumption. From the pH value, for example, the water samples were found lo be acidic which has serious henllh implications. ll is therefore recommended that the inhabitants of the study area be advised to desist from drinking wnter from tho two rivers.
However, this could be diflicull without alternative source of potable water which government must look into.
REFERENCES
I. Agngu, O.K., 1985. t\ Geological Guide to Bituminous Sediments in Southwestern Nigeria, (Unpubl Monograph). Dept of Geology, University of Jbadan.
2. Billman, H.G., 1992. Offshore Stratigraphy and Paiacontology of the Dahomey Embaymei1t, w ·esl A fricq; Nigerian Association of Petroleum l?.xploratinnists IJulletirr, 72: 121 - 130.
.. 3.- Bowen; H.t.M., 1979. f!nviroumchlal Chctnistry ot the tlcr1]cnls. Acadelni9 l'ress, London. pp: 13-29.
: .
'4. Deutch, W .J., 1997. Groundwater Geochemi stry : rundamcntals and Application to Contnminntion. l.ewis l'ublishers, Washington IJ.C. USA. pp: 221 .
5. Enu, E. I., 1990. Aspect or Rock Evaluation Studies or the Maaslrichlinn-Eoccne Sediments . .lour. Min a11d Gaol., Vol 40( t ): 29-40.
G. lbe Sr, K.M. and A. l-1.0. Sowa, 2002. Hydrogeology of Port of the Oramiriukwa River 13asin, Southeast of Owcrri, lmo Stale, Nigeria. Hydrogeol. Jour. 10(4): 509-521.
7. Kogbe, C.A., 1976. Geology of Niger ia. 2"~ Revised Edition (Ed. C.t\. Kogbe ), Rock Viell' (Nig). pp: 455.
8. Mendell and E.l. Shi !lon, 1991. Groundwater resources investignlion and development. Academic Press, Inc. pp: II 0-115.
9. NCon, M.E., 200 I. Sedimentol ogical and Geochemical Studies of Rock Uni ts in the Eastern Dahomey Basin, Southwester Nigeri fl. Upbli 1'/l.fJ 'l11esis U11ivcrsity of Jbada11, pp: J 15.
10. Oroma, /\ .E., D.t\ . Omologbe nnd r . t\igbcrun, 2005. Physico-Chemical Qunl ily or Groundwater in Parts or Port-Harcourt City, Eastern Niger Delta, Nigeria. Water Resources, I G: 18-24. ,
II. Ogbe, F.G.t\ ., 1972. Stratigraphy of Strain .Exposed in the Ewekoro Quarry, Southwestern Nigeria. In: T.F.J. Uessauvagie a11d Whiteman (EdJ) A.fi-ican Geology, University Press, Nigeria, pp: 305.
12. Olanrcwaju, V.O., M.O. Oloru nfcmi and 0 . Alade, 199(i. Chemicfll Characteristic of Qroundwf)tcr rrqm SOfTIC Parts of the lJasemenl 'Col]lplcx or Central Nigeria. Jour. /If in.' Ceo/. 33(2): I 35- 1 3~.
13. OnFttsoln, M.E. nm! O.S. Aqcgokc, 1 9~ 1. T~,:ctoqic I I ,, II
"!3vol u11~n ~no_ q~t11cco us 1 Strp!igr~pjlY Qr . tj1c buhomcy Pnstn. Joi{mal of Mining rmd Geol . 54(i); ~(i5-l ~i. . . .
.,
... 2049
,,. ' ·
l l_'

I
L.
L
\].
L
L
L
L
L
J. Appl. Sci. Res., 6(12): 2042-2050, 20/0
14. Piper, A.M., 1944. A Grnphic procedure in Geochemical I nterprelalion of Water Analysis. Trans American Geophysics Union 25: 914-918.
15. Reyment, R.A., 1965. Aspect of the Geology of Nigeria, lhadan University, l'ress .
16. Rush, W., 1924. The phosphatic Deposits of Abeokuta Province. JJu/1. Geol. Surv., Nigeria, 7.
17. Standard Organization of Nigeria (SON) · 2007.Standard for Drinking Wnler Quality, NIS pp:
345-30.
. ,, 2050
,.
18. Tebbutt, T.H.Y., 1977. Principles of W<tler Qu<tlity Control. 2"d Edition, l'ergamon l'ress Ltd, l~ngland. pp: 201'
19. Tijani, M.N., 1994. llydro-geochernical Assessment of groundwntcr in Maro <trea, K wnra Stale, Nigeria. linvironmenlol Geology 24(3 ): 194-202.
20. Todd, O.K., 1980. Grounclwnter llydrology 2"d Ed. John Willey and Sons, New Y.ork, pp: 555.
2 1. WORLD llEALTll ORGANISATION (WilO) 2006. Guidelines for drinking Wnler qunlity, Geneva.

QUARTERLY PUBLICATION
· ;j

Int. J. En11ron. Sci . T .. -ch.. 7 CJ. }f>1.3 7t>. Spmg ~010 ISS'I . IH~- 1n~
r IKSI: :-.1 . ('J· I· RS. IAL'
Contamination assessment of surface and groundwater within and around two dumpsites
1 *A . . H. Odukoya; 1A. F. A bimbo/a
1 O..·par/111<'11/ of (i,·oscic:nn•s Uni1·c:rsiry <!/ La~os . Lagos. Nigc:rio
1 Dt'partmt'llt of Gl!t>I<IJ,.'l' Umrt'rsiry o/ /hac/an. Pl'v. Nigl!ria
RcccJ\·cd 16 bnu.ll) ~0 I 0; n:1·iscd S February ~0 I 0; accepted ~8 February 20 I 0
ABSTRACT: Geochemical analyses of ground" ater and streams llo'' ing around abandoned and aclive dumpsites in Lagos. Sourhwcsrcm l\igcria ''ere carn.:d out. Resulls show that "atcr samples have: generally low total dissolved solids with average values of ,)'63 . 7 5 and I 53.-1 for abandoned and ac1i1·e dumpsites, respes;tively. pll ranges from 3.96- • !U.J while lola! hardness 'aries from I 0-::!::!0 mg· L calcium carbonate (soil to slightly hard). Average concentrations of the dominant ions for abandoned and aeti1 e dumpsttcs were 57 .8 and :!5 .86 mg/L (Na) representing 40.7 and 46.3 %of t.' the 1o1al c:11ions respcrtil'cly and Nirrare (a1·. 96.89 and 61.51 mgil) representing 49.1 %and 40 %, respectively of the total anions. The pi!. colifonn count and conccntrarions of nilrate iron. manganese and sodium in most of the water samples were above the national drinking water standards proposed by the United States Environmental Protection Agency. Trace clements like sih-cr. arsenic. berylltum. b~muth . cerium. coball, chromium, lithium selenium, tellurium, titanium, uranium, vanadium. tin and ~11rium were bclo"~ det~tion lcvd for all the water samples while tungsten, thallium, molybdenum and le<~d were only present in surfa~:e and groundwater close to the dumpsites and also display values higher than recommended standards " hile cuppcr. zinc . aluminum. barium and strontium were present in most of the samples. The pollution index among all sites' aricd from 0.009 to I .:!6 and 0.106 to 6.25 for abandoned and active du mpsites, respccti1 ely wh ilc the "a1cr around most of the dumpsitc an: as c.~cccded the acute and chronic effect levels proposed by the United States En1 ironmcntal Protection Agency in :!007.
Keywords: Anrhmpogc•nic: Em·imnmem: Pollution indl!x: Trace elc:ment.l'
INTRODUCTION The disposal of wastes generated by human
activities within a municipality is genera lly an urban problem. The recognition of the connection between human activities and pollution and the need to protect human health. recrea tion and fisheries production led to the early development of water quality regulations and m\onitoring methods (Hem 1985; Jenkins et a/., 1996; USEPA, 2007). The existence of trace metals in aquatic environments has led to serious concerns about their influence on plant and animal life (Samarghandi eta/., 2007; Zvinowanda et al .. 2009). During their transport, the trace metals undergo numerous changes in their speciation due to dissolution, precipitation, sorption and complexation phenomena (Akcay eta! .. 2003; Abdel-Ghani and Elchaghaby, 2007; Abdel-Ghani eta! .. 2009; Mohinddin eta/. . 20 I 0). One of the reasons these toxins are so harmful is that Ihey become more 181 •Corresponding Author Ema1l: [email protected]
Tci.IFax: +080~ (,~ 7 ~:! 19
concentrated in successive trophic levels of a food web. a process called biological magnification (Woodwell, 1972; Grimanis el a/., 1978; Adams eta/., 1992; Campbell, 1996; Manly, 1996; Kaooga eta/., 2010). The need for socio-economic advancement has led to rapid expansion of the industrial sector in developing countries like Nigeria. These waste disposal sites and landfills are neither properly designed nor constructed. After some years a dumpsite undergoes biologically, chemically, geologically and hydro geologically mediated changes resulting in a weathering process consequently, it becomes point source for pollution of the aquiferous units close to them (Arienzo et al., 2001; Manjunatha et a/., 200 I; Altindag and Yigit, 2005; Awofolu eta/., 2005; Wang and Zhuo, 2005; Adeniyi el at.. 2008) . The commonly used disposal methods of the solid wastes in the study area are open dumps, non -engineering sanitary landfill and incineration. When rain falls, the rain leaches pollutants from the
i

waste disp'osal sites. Thus introducing toxins and contaminqnts into the soil, surface and groundwater and eventually plants that grow within the vicinity of the dumpsite (Awofolu eta/., 2007; Daka eta/.. 2007). The overall implication ofthis is that the hydrochemical facies of groundwater changes in response to its now path history, that is, underground water quality is dependent on pollution status of its en,·ironment (Oiabaniyi and Owoyemi, 2006).
Geological and geomorphologic features The geology of the study area fall within constnl
plain sand ofDahomey Basin nnd is chnrncteri zed by coarse, unsorted sands and clay lenses mixed together in varying proportions at varying depth. Depth to water ranges from land surface to about 10m for first a qui fer. Generally, the lithology is composed of medium to coarse grained sandy horizon interbedded with thin band of grey black clay which occur in minor proportion (<20m).
The study areas which are !solo and Ojota dumpsites are both located in lagos. southwestern
3"21'
(•I
- -.·---- r-Ill< I~ M~l
OriSII!IJn
Oregup
A
:0 ..: ,.., -. . oO .::
• . Sampling point ... D Dump site A
- Foothpllh -Road ~River
~ITyl•ndN A
w -<>-· I A
O~udu
d J•~ I '
36R
Nigeria t Fig. I a and b). Ojotn dispos:d site is locJted in the northeastern area of lagos. It is \ery massive with a topogrnphi ca l height of about 45.-15 rn ( 150 fi) from the sen Je,·e J it has been in operntior, since 1992. still ,·ery nctive nnd'it is \ery close to so mnny industries. The I solo wnste disposa l si te is situa h!d nt the northern part of Lngos metrupol is. It is sited \ ery close to a big can al whtch norm:1lly O\·ernows its ':>:Jnks during the rniny senson nnd n dominant percentage of the waste deposited here nre domestic wastes. -\lso, the si te has been abandoned for the past t11·eh·e ye1rs and therefore, it is no more acti1·e. This research has been done between 2007 and 200~ .
1\L\TERIAL\:\D l\fETJIODS \\'ater samples from boreholes, v·ells and strenms
were collected at se,·ernl locations within and around the two dumpsites. Se,·eral sensiti•:e pnrameters of water such as total di ssoh·ed solids (TDS). electrical conducti ,·i ty and pH were determinc:d during the on the spot snmplin g using the appropriate digital meters (e.g. wnter trentment works ( \\r'f\V)-conductivity meter
I· JIFI>•• •. {hi ;_
~ ;.. . > ' F
_,/ .:: ,....
0
0
n 0
-~ ..... 0 • 0 • 0
0 ---
' 0 / 0
lf«ra<<d>J ·. 0
' . ....._.
J' u ·

/111 J F:nnmn. S" T..•,h . 7 (!1 . ](,7.]711. Spr111g !0/0
model U92 and WT\V- pH meter model pH 91 ). Water samples of approximately 1~5 mL were collected for multielement analysis: pressure filtered through 0.2 mm Nuclepore membranes and 3 mL anal)lical grade HNO, was added to bring the water acid solution to a pH- 2. The analysis of trace elements and cations in water were carried out using inductively coupled plasmaoptical emission spectrometry (ICP-OES) while unaciditied water samples were analyzed for anions concentrations using the DIONEX DX-120 ion chromatography techniques. All the analyses were carried out at the Act labs laboratory. Ontario Canada. To check the accuracy. activation laboratories (Ontario. Canada) employed two internal standards (each run twice)' and found that the errors were consistently minimal. Bacteriological analysis of the water samples was also carried out. Results were further compared with recommended standards and pollution index was calculated to determine the impacts of the two dumpsites on water quality.
RESULTS AND DISCUSSIO:'\ The summary of the concentrations of dissoh·ed
elements in streams and groundwater around both active and abandoned dumpsites in Lagos. Southwestern Nigeria were gi,·en together with national drinking water standards proposed by the US Environmental PrOiection Agency(USEPA) in may 2009 (Tables I and 2). pH \'alues range from 3.96-8.34 with most of the samples slightly acidic and out of the US EPA (2009) standards as a result of dilution by leachates. Total dissolved solid is low generally with mean values of I 63.62 and 153 .38 while electrical conductivity(EL) showed mean of301.63 anJ 311.21 for abandoned and active dumpsites. respectively. On this basis, the water can be classified as fresh (Todd, 198().). Major ions such as Fe, Mg. Mn, Na. Brand NO, in the water samples were higher than the limits of the above standards for samples close to the dumpsites, (Fig. 2). Concentrations for Au, Be. Hg. In, lr, Nb. Os, Pd, Pt, Re, Rh, Ru, Sb. Se, Ta and Te were all below the detection limit for ICP-OES and therefore were not listed in Tables I and 2. The metals showed the following trends Zn >AI > Sr > Ba > Cu > Ni and Zn > AI > Ni > Sr > Ba > Cu for abandoned and active dumpsites respecti\'ely. The mean concentrations for samples taken around abandoned and active dumpsites were 55 I .5 and 398.76 for ln. 4. 71 and 72.06 for Ni, 52.35 and 43.76 for Ba. 32.59 and 15.29 for Cu.
182.4 and 2M. 7 tor AI and 0.18 and 13 7.6 and 57.65 for Sr. respecti\'ely (Tables I and 2). W, Mo and Pb were tound only in the two samples and both were above _ US EPA. 2009 standards. N03 ranges between 0.3-250.3 mg/L and 3.2 mg/L- 200 mg/L while coliform ranges between Ocfu/1 00 mL- 600 cfu/1 00 mL and 10 cfu/100 mL (l()() cfull 00 mL for abandoned and active dumpsites, respecti\'ely. The large relative standard deviation values indicate that there is significant variability among the indi\idual sampling sites around the two dumpsites. The wide range of concentrations most likely represents diflerent point-source inputs from different materials in the dumpsites since chemical weathering of sedimentary rocks which is Coastal Plain Sands in the case of the study area are unlikely to provide such large spatiaJ fluctuations in trace elements content. The variability of concentrations of these elements, as well as total coliform within the water suggests local anthropogenic input sources through domestic, municipal and industrial wastes ''ithin the dumpsites. The total concentrations of t he elements were compared at several sampling sites and there was a slight overall trend of increase in the concentration of trace and major elements in the water samples within and very close to the dumpsites (Figs. 3 and 4 ). The large increase at these sites suggests a high elemental input into the water which is probably from the dumpsites. Leachate within the two dumpsites showed the highest values for most of the elements wb ile the control samples taken far away from the sites showed the least (Figs. 3 and 4 ).
Pollution index The pollution index was used in this study to
evaluate the degree of trace metal contamination (Nishida el a/., 1982; Chon, el a/., 1991; Kimel a/., 1998; Emoyan eta/., 2005; Nier 2007). The tolerable level is the elemen t concentrat ion in the water considered safe for human consumption (Kloke 1979; Lee el a/., 1998). The US EPA national drinking water standards (2009) were used as tolerable level for water and the pollution index can be calculated by the formulae below
I ka')' metal concentration in water
Toler:~ble level PI -
Numbc:r of heavy metals
The PI among all sites varied from 0.009 to 1.26 and 0. 106 to 6.:!5 for abandoned and active dumpsites,
369
\ ·~

...,
,,, J f:II\IIHII S" T.>o. II. - 1-' I. .11\-. J -to. Spnng !UIU 't .Ill)
eou
+ Mill ... + WIIIU ...
+ '\t)l)
- loll/ I
~ ~ -'110 • • • • ' " ""'' ~ • lOll • • • • +
~ ~II( I ~
::; ~
~ • • • ~ =•W •• •• • • • , • ••• ~ • • • • ~
~(lll 1111 • ., •• •6• ~~~w•••• • •_% 1.la I a a..a~I-1 .1-IL• 0 i . ill• I)
(I I• t< ~I) 11 ll IS 20
s~mp..: '-hll~)nli. S•mpl.: l.lcotons
+ l.n u ~ · J,. ll.> + AI 11 Cu .A N• ....
')ll
t> so • 70
-E ~·· A -
"' A ~I) A
:: • 1 ' .l • e .II)
~ 4
~ • A "" ~ . Ill • • • ;:; A • • ... % ~I) ~ • • A A • + ~ • • • • • ...... • • • • • •• • + +
0 •••••••• • •••••• • • • •• • •• \
I) --~- --- * 0 ll L' ~~~ I) ll IS 20
· I SJrnf'lc uoiiOn> S•mple l.lco110ns
+ Fe I \In -'. \I~ +C• .. •RH! .A Na ~\
~~I)
~so • ~Ill)
• 3~11
~00 \ I :: ;ou • ·E ...J
~ t<O :_,
~~0 ' • ~
2 ~00 •
2 ill ~ •
l! VlO I ;;
• I ~ L<O • c
!:: 3 • • • )00
so • ~ ~ • •• • • • • ~~~ • I II • • • • • •• •• • II • • •• • • • 0 • • II II . ~
0 ... L< ~I) I) 10 IS 20
Slmp\..:' \.)~Jt)l.)n o. Sompl.: lo c 01ions
+ CI • ,o_; + T Cohfonn ~
l'ly , ~ - Seau~r~ll plel, or h~a1y m~l~la again&l sampl~ locot ioM aruund active dumpsil~
373 ~ ...

¥
~
l ~
A
O.J .
0.~~
" 0.2 u "0 .!: c
.2 0.15 -1! 0 "" 0 .1
OM .
0
\\'-1 1\'.,1 \\'.~ II .; II.~ \1 .:: II · l l II . L<
SJmrk '--'". J1\'""' Fig. s· P!>IIUih>n mJ~\ fN J!>anJ,·n~d dumlliC
6
" u ]
s
.~ ; 0 ""
l
0
W-16 W- U! \\ ·~: II . :~ II . Jfl
Samp\: klt: J '~"'
Fi~ . 6 : P!>ll ul iun i nd~~ fu r acll\c dum~i1c
of these metals will pollute the water which sen ·es as source of drinking water for some people while the possible trophic transfers especially at the dO\m stream putside the urban areas where local inhabitants use the water in vegetable nurseries/ farming ca ll for concerns.
CONCLUSION Quality evaluation of surface and groundwater from
Lagos Southwestern Nigeria, were discussed ns n case study of anthropogenic influence of dumpsites in a typical urban environment of a developing country. From this study, it is clearly evident that lack of well constructed environmental friendly lnndfill s and indiscriminate dumping of wastes to stream channels
37-1
h:n·e considera ble inOuences on r.he hea vy metal con tamina tions of surface and groundwater in the s tud y area. The s tu dy re\'ealed s li ght degree contamination of AI. Zn. Ba. Cu. B. Pb. Mo. Wand Ni in the some water sar:nples ·Hound the two dumpsites compared to the US EPA \2009) standards. Among the major element s. NO, and Fe are the most criti ca l in th e wa ter system. Also. total coliform count s were ,·ery hig h in all the samples. The pollution index among all si tes \'ar ,ed from 0.009 to 1.26 and 0.106 to 6.25 for abandoned and active dumpsites. respccti,·ely while the water around most of the durnpsite areas exceeded the t:cute and chronic effec t le\'els proposed by the US Environmental Protection Agency (US EPA. 2007) .

tJu.Jiu, " ' " '"' 1 •"" II"·' ·"""r•ll,·•
Table I : Summary Clf r~~ul1~ ,,,- \\:ll~r 'ampk< "11h1n and ar,,und aband'''h'd dumps11~
Surface wal~r Gn,unJ\\ ah.·r L,·a,hal,· CllnlrJ I :\0\\"S pH l ~.5-X .3~(~.7~ I _, _'l(,.S CJ~~~-~~ I " 5- 7 .S 6 5-X5 Conducti\'ity 170-~50( 226.25) ~o- - _~flt:!~~ 21 t,(l5 50 1-lOO TDS, I I 6- I X b( I 6~ . 7 5 I :!t>-15 .1111\S 'II ""' >IJ 1000 Hardness I 0-1!1(:!<1 .:!5 I :!fl -2 :!Ill(,() -II -II 67 Totnl colifonn 10-120(161 51 fi -Nlfii'IS S I ~O' 10 0 Ca 9.2-12R(·R91 1~-1~11-IX~I -1 ; ,, XI I :!00 Fe 0.05-0 23(0.1 J) fl 01~1 ~-110 Oll51 ·or 0 1)) 0 J K 7 .4-19~(56.!15) 0 -~-1:! -Il-l 02 ~ 1 t-o 19
Mg 3-63.1 I I !1 .25 I 0 ~-1 .1 2t(, llSi b 50 Mn 0.09.{).16(0.1 ~) ll 02.{) 1-ltfl.0-1 I) f l h IJOI 0 05 Na :!7.7-2-13(97.!1) .j .:!-l<-1t2Q. 71 ~-~ ~ -1.9 200 p O.R:!-3 . 76(:!.3 I 0 22-2 2-ltO X-l I I ~ ~ 00-l Si :!.-l-10.3(5.61 ~ 5-:< ~~ 5.051 ~ 5 - 6
s 5-:!-ltl-1.51 I - 2:!t-1 .0 .~ I 9 5 Cl 2!< .6-106( 12!1. 7 I 12 S-2() Si:!l ~-l I Ill X j -l 2.1 0 Br 0.{).111(0.1 Rl l\'D-0 61(1).1771 IJ 19 IJO-l 0 01
N01 0.03-250.3( 135.96 I 0 0:!-1:!0 .1LW XI I I IJ I 0 01 10 so. 3.07-1 !17(51.-16) I IJ-i6.-lt:!9 691 .'I I 2 S I -100 HC01 0-J!!( 121 0-:!5th .. 1 I -x -15 AI 200-1100(-100) l\'D-1001901 .~()() 100 R7 Ba -10-100(65) -10-IOOt-19! -"!) -lO I Cu 4-16(21.5) K- 2 .1:!t~.1 .61 16 -1 Ni 0-20( 7.5) l'\D-1 ~1351 10 nd 0 02 Zn 525-1 060(791.25) 30-960()!1-1 .61 2~ .'0 JO s Sr 50-670(227.51 :!0-5:!0(1 051 120 250 0 01
• NDWS: National drinking wa1er s1andard$, • NO !'lot c.ktcrttt.!. • r..bj\'r c-k~nts 111 m~ L. • 1 r..~~.·"" cltn'k"nh en J.l ~ I.
Table 2: Summary of results Clf \\Jicr samples" 11hin and arllund act"~ dumpsu~
Surface water Groundwater L,-:~clu t ~ Co1;trol 1'\DWS
pH 4.2!1-6. 75(5 .1) -1 2.1 -X 0-115 6-1 I -1 X9 7.92 6.5-X .S Conductivity 122-603(302 .6) 122-10.'(3-10 91 ~0 .n 1~00
TDS 2-1-185( 12!<.-ll 1(6-1 2 ~1 197 .'I ~ 5 ~~ 1000 Hardness I 0-65(371 :!2 -102(51 21 210 7~
Total colifonn 12-308( Ill) I 0 -~0~190 31 20l< 0
Ca 2.3-23 .1(12 .16) ~ -~-17 9t6.R)I :< 5 l<l I 200 Fe l 0.04-2 .36(052) 0 02 - U~tO. IXI 0 06 0.01 OJ K 1.2-21.7(9. 11 1-20 ()(6.171 5.5 I .'~
I Mg• 0.5-3.9(L'2l 06-~5t1AJI 16 ~ 50 .,. Mn 0.02.{).2 1 (0.1) 0 O.l-0 l~tO .Of,l 0 .01> 0.01 0 05 ' Na 13.2-7 5.6(3!1.62) I J A-56. 7( 26.0l< I .'t .'t 6 n 200 p 0.3~-3.64 ( 1.99) 0.02-2 . .12(0.~61 ~ s 0.0-l Si' 4.4-9.6(6.56) I 7-R 7(~ 71 -1 ~ 7 s s 5-19( IO.RI 2-17(6 ~I II
Cl 12.5-54(4-1.95) 5.0(\-7!<.:!( ~l< . 21 ~- ' J~ 230 Br NO 1'\D \'0 :'\ .) 0.01 N01 3.2-11 7.9(79.13 2A 1-200.01(51 621 21 i 5 0.0 1 10 so, 1.29-7 .09( .j .IJ) 1.19-9 .X6( -1.3 I "09 2.S I ~00
HC01 0-1 03(20.5) 0-21Jt2~ ~51 0 ~ -AI 200-600(300) 200-100(2901 200 100 R7 Ba 40-1 00(72) l'D-l<Ot561 ::5 -10 I Cu 10-24(14AI l<-2(\t 17 II 2l< 4 I Ni nd-19(6) l'd -5~0({•5 . 51 600 1\d 0.02 Zn 240-6~5(~05) 2hU-X95(-102 1100 J U 5 Sr 20-R0(5Rl 20- 100(~~ ~I .10 250 0.01
• NOWS: N1tional drinkinll \\Bier slandards. • ND: :-lol dc1o.1o.J. • M>J''' ckn>o:niS 111 mg L ' l rxc clcm.-ru < oa ~1- L
:no
j
(

i ', '
:-10, - Sr
Or '"
In
Cl
"""' ~ Sa ~ " ~
Mn
~ ~ . ;:;
-;;
"' Cu ~ ::<
~ c. BJ
Fo .~I
M~ ·-' ... -- - - 0 NlOO !1)00 3000 ~000 5000
0 ~ 0 .wo
Cunc c ntuuon lmi! 1.1 Cooccntr~tion l'lVL
•Mm 1!1\1~' .,. [)\\ <; . 1\llll .Mn .t.:achatc .Acute achronic .NOWS
0 )(tOO ~non 300fl ~non ~11110 0 50 klO L50 200 2SO
.Min II Max . NOWS
Fig. 2 : Bar charts of hea,·y m~tab and som~ major ~km~nts concentration with acute , chronic and national drinking water standards proposed by USEP.·\ (2009)
respectively. Concentrations ofAl. Ba, Cu, Zn and Sr in most of the water samples were less than the given tolerable levels while Ni showed higher concentration in I and 2 samples for abandoned and actiYe dumpsites. respectively (Figs. 5 and 6). Pi was below 0.1 at 4 and 6 samples representing (27 .7% and 37.5 ~ ·o) of the total samples, between 0.1 to 0.3 at 6 and 8 samples (37.5% and 50%) and greater than 0.3 at 5 and 2 samples (33.3% and 12.5%) for abandoned and acti1·e dumpsites. respectively (Table 3). The pollution index for shallow well and leachate within the acti1·e dumpsite were as high as 5.42 and 6.05. respectiYely.
Fresh Jmter acute and chronic critaio The water around most of the dumpsite areas
exceeded the acute and chronic effect le\'els proposedby the US Environrnentnl Protection Agency ( USEPAl in 2007 (Fig. I). The tolerable acute and chronic levels
37 1
for fresh water are 4 70 and 52 11g/L for Ni, 750 and 87 ~1g/l for AI, 13 and 9 11gll for Cu, 65 and 2.5 11g/L for Pb and 120 Jlg/L for both, for Zn. Among all the studied areas, 6.25 %, 84.38%, 71.87% and 81.25% of water exceeded the acute and chronic limit ofNi, AI, Cu and Zn, respectively. For chloride only one sample from surface water exceeded the fresh water aquati c life acute and chronic criteria . The standard recommended for the consumption of water and organisms for human health by US EPA (2007) include 300 ug/L, 50 ug/L and I 0,000 ug/L for Fe, Mn and NO> while 31.25 %, 46.88% and 59.4% of total samples exceeded these values, respectively. The source of these metals may be attributed to anthropogenic activities from the various wastes at the dumpsites and dumping of wastes/rubbish on the stream channels. The environmental implication of water contamination lies in the fact that the adsorbed portion

t ~·.J. ~·'t • ..... _, :, . . ·,~ ~ ... . ., .. -----....;·c.· ~'\·' -
hot J F."'"'"' Su T.•clt . -1!1 . . lfl-· .1'11. Sprong .'IIIII
Generally. the water contamination is r..:latt:J to anthropogenic sources mostly from difTert:nt wastes within the dumpsites which are domestic municipal and slightly industrial in origin .
ACKNOWLEDGHIE?\TS The authors wish to acknowlt:dge the finan~ial
support of the Vice Chancellor of Olabisi Onabanjo University. Ago lwoye. Nigeria between ::!00 I and 2006.
REFEREI'\CES Abdd: Ghani. K . T : Ekhayhab~. (i ..\ . 1 ~01)7 1. lntlu~n.:~ of
opcra1ing condi11on~ on lh'c rcmo,at ol Cu. ln. CJ and Pb ions from w~slc\\al.:r by adsorp11on. ln1. J . r:n,·irun . S.:L Tech .. ~ 1-1). ~51 --156 (6 pagrs) .
Alxki-Ghani. K. T.: lkga~ . A 1-: : EI -Chaghab~ . G :\ . t~009J Typha dom1ngcnsis leaf po"d~r lor decon1amina11on of aluminium. iron. zinc and kad: Aiosorp11on ~1ne11cs and equilibrium modeling ln1. J f:0\1ron Sc1 T.:,·h . t\ f~l.
2~3 ·2~K (6 pagrs) . Adams. W . J.; K1mak. R. A : Barn.:~ . J \\' . t199~ I SeJim.:nl
qualny and aqua1ic life ass.:ssmenl. fn\lron. S.:1. T.:.:h .. ~ o
( 10). I R65-1875 (11 pagrs) Adeniyi. A . A . ; Yu suf. 0 0 .: Oked.: ~ i. 0 0. I ~OOXJ:
Ass.:ssm.:n1 of 1h.: e'posur.: of 1\\ u f" h >pe .: ~.:s 10 m.:1a h pollu1ion in lhc OJ;un rl\ .:r .:at.:hm.:nl>. K.:tu . Lagos. 1-:ic.:ria . En' iron . Monn .-hscs>. 1 ~ 7 11 · 3 l. ~ 5 1 · -1 5 X (8 pages).
Akcay. II. ; Oguz. ,\ : f.:arap11.: . C. . I ~OOJ I S1ud) of h.:.1' y mclal pollu110n and spcc1a110n 1n Bu)ak M.:nd.:ro and Gcdiz ri,·cr scd imenl s . \\'a1cr Rc>. 3 7 t-1 1. X I J - ~~ ~ ~
(I 0 pages) . Aliindag. A .; Y1g11 . S .. 1~0051 Asse ss mcnl oi hea'y me~al
conccn1ra1ions in lhc food '''b of lake Ac~ sch1r. Tur~cy. Chcmosph.:rc . 60 C-1 1. 55~· 55 o (S paj:rs)
Aricnzo. M.; Adamo. P .. B1anco. ~I R . \ 'iolant.:. P . f ~00 11 lmpacl of land usc and urban run-oiT on 1hc con1amma1ion of lhe Sarno ri\'Cr basin in soulh\\eslern llal~ \\'a~er Air Soil Polloi.. I J I ( 1-~). J-19-366 ( 18 pages) .
Awofolu. 0 . R.; Du PleSSIS. R.; RampcJ1. I . 1 ~0071. tnllu.:m:c of discharyed effiucnl on 1he quah1~ oi >Urfacc "a1cr u1ih1~d for agricullural purpos~ s. Afr J A1o1~.:h . 6 t19J. ~~ 5 1 ·
225M (8 pagu). Awofolu. 0 . R.; MboJeb,a . Z . ~llshemla . \ '. Fa1ok1. 0 S;
t2005). Levels of 1rac.: mcla ls 1n wa~.:r anJ s.:dimcnl from Tyume river and i1s cffcc1s on an nnga1cd farmland \\'alcr S. Afr .. Jl C I l. IP-9~ (8 pagts)
Campbell. K . A .. t1996J . B1olo~y. ~·Ed The Bcnpn11n cummings publish•ng c ompan~ ln.: , L' n" crs 11~ oi California . US,\ .
Chon, II . T.; Ahn. J. S.; Jung. M C . 1 1991) En11ronmcn1al conlaminalion of lo,ic hea,·~ me~ a Is 1n 1he '1.:1n11~ of some Au Ag mines in Korro . l'ro-: of rhc -1' Biennial SG.-\ Mcel ing. Truku: Finland. X9 1
Daka. E. R.; Molson. ~1. : r:l;ch. C ·\ . f:b~eo1or . I K r: .. (2007). S<d1men1 qual11y s1a1us of 1"0 creek s '" 1he upper bgnfl)' QIIUOfY. l'i~~r ~~ha. 1n tclmuon to urban 1ndu~tml ac1ivi1ics. Aull. En,·iron Con1am To,ocol . 7X tl\1. 5 15-5~ I (7 pages) .
375
fmo~an. 0 . 0 ; Ogban. F. E.; Akaruh, E., (2005). Evaluaiion o f llc.l\) me~al> loadinll of River ljana, Nigeria . J. Appl. So:1. r:n, iron . 1\lana~:. 10 t2 ). 121-7 (7 pages) .
Cir11nani, . A . P.; Zatiropoulos . D. ; Vassilaki, R.; Grimanis, I\ I . 1197!! l. Trace dcmenls in I he tlcsh and liver of two tl,h ,,,-,; i ,~ trom pollu1cJ and unpollu1cd areas in 1hc Ac11can Sea rn11ron . Sci. Tech .. I~ (6). nJ-n6 (-' pagu).
llcm. J I> . t 19!<5 ). Sludy and in1erprc1a1ion of I he chemical .:hara.:lcri>llcs of nalural wa1~r. USGS. 3"' Ed. , Water supply paper. ~~54 .
Jen~in> . P.; Soulhern, T .; Truesdale, V.; Jeary, A., ( 1996). \\'at.:r> \\'a11s S .. llalliwell L., (Eds. ). Essential en\ ironmental >ci.:nce . Me1hods and Techniques London: Rou1lcJgc, 336·350.
Kaonga. C. C. ; Kumwcnda, J . ; Mapoma, II . T., (2010) . A.:.:umula11on of lead, cadmiUm, manganese, copper and zin.: b)· sludge worms; Tubifc., 1ubifcx in sewage sludge. lnl. J. f:nviron . Sci . Tech., 7 (1), 119-1~6 (8 pa&cs) .
Kim . K. \\ ' .. Lcc . II . K. ; Yoo, D. C., ( 1998). The en\ i ronm~n1al impacl of gold mines in the YuguK" ang.:heon Au -Ag mclallo~:cnic province Republic of 1-:orca r:n,iron Tech ., 19, 291.
Klo~~- .\ . 119 79) . Con1cn1 of arsenic, cadmium, chromium, llullfllc . lead . mercury and ni.:kel in planls grown on con1am1na1cd soil Unilcd Ka1ions ECE Symp.
Lee . J. S ; ~ hon. II. T.: Kim. J. S.; Kim. K. W.; Moon, II. S., tl'l'lX1 [nro.:hmcnl of polcnlially 1oxic clements in areas underla in by bla.:k shalcs and slalcs in Korea . Environ (ic.><:hcm . llllh . 20 (30). 135-1~7 (13 pages) .
!\l.1njuna1ha. B. R ; Balakrishna , K.; Shanker, R.; Mahalin3am, T R .. t~OOI) Gcochemislry and assessment of melal polluuon in soil> and rivcr India componen1s of a monsoon
dom1na1cd en\ ironmenl ncar Kor\Ooar. sou1hwcs1 Coast. f:n11ron . Gcol. . 40 (11- 12). 1-162·1~70 (9 pages).
1\lanl)·. R .. (1991\) Biological indicator.;. Fifidd, F. w.: Haines, 1'. J tf:ds . ). [ n,·ironmcnlal analy1ical chemistry. Black .-\.:adem1c and Professional, Oxford, London.
l\l oh•uJd1n . K. 1\1. ; Zakir. II. M.; Olomo, K.; Sharmoh, S.; Sh.~a?Ono. I\ .. ( 20 I 0) . Geochemical distribution of trace m~1al pollu1an1s in wa1er and sedimenls of downstream of an Urban ri,·cr. Int. J. En\'iron . Sci . Tech., 7 (I) 17 -28 ( 12 pogcs) .
1-:IER. 1~007) . ln,·eslillDiion of 1he impac1 of mine discharges on llan-ri' cr wa1crshed . I'' year 's report.
1' 1shida . II .; 1\l i)'ai . M .. Tada. F.; Suzuki, S ., ( 1982). Compu1a 1ion o f lh.: indc:x of pollulion caused by heavy m~lal, in ri,cr >ed imenl. Environ. Poll. Ser. B4 : 241.
Olobaniyi . S. A .. Owoycmi , F. B., (:!006) . Characterizalion b) fa c1or anai)'SIS of 1he chemical fu c ies of ground waler in 1h~ dehai c plain sand> aquifer o f Warri, Wcslern Nigerdella . l\ 1gcr1a . Afr. J. Sc1. Tech. , 7 (I), 73 -K I (9 pages).
Samaryhandi . ~1. R. 1-:oun . J.; Mc:sda~:hinia, A. R.; Mahvi, A. II .; 1\a scri. S.; \'a.:zi. F., (1007) . En-icicncy removal of pheno l. lead and cadmium by means of UV/Ti02/11 20 2 pm.:cH.:> . Int. J. En \' iro n. Sci. Tech., 4 (I), I 0 -25 ( 16 puges) .
TIXIJ. D. K .. ( 19:!0). Groundwa1er hydrogeolo~:y. John Willey and sons Inc .. K~w York .
USF:I':\ . 1~007) . Recent recommended water quality criteria. Unued S1a1c:s En vironmental Pro tec tion Agency, http:// W\1 ·w.e pa . g ov 'w a 1 ersc ie nce/c ri teri a/ wq criteria .htm I
\ !

.. ., I
~ •'
· I
USEPA, (2009) . Nnlional Drinking wn1cr ~landar<h L'ni1cJ SIRles Environmental Pro1cc1ion ,\gem·~. h11p · www.epa.gov/safewater/
Wang. X.: Zhuo, Q .. (2005). Ecoto:oticolo~;icnl ..rr~cl ~ ,,f cadmium on 1hrec ornamenlal plants . Chcnwsph~r~. l•U (I), 16-21 (6 pages) .
Woodwell. G. M., (1972). A watch on 1he ~nnh : ~Jan 's h••m~
AUTIIOR (5) BIOSKETCIIES
'~ "~ ' L' n11~J '\Jiwn' (',,nf~r~n.:~ on 1hc !Iuman
r. nl lrl>nm~nl <;,, .... ~ '"''"'· s" ~J~n. Z\lnlmanda. C \1. U~onb•1.1. J . 0 : Shabalaln. f'. 1\ .: Agy~i. ~ \1 . t~UU'II \ n,nd aJ ,~.~ rt>.:nl for h.:a•·y mc1al r~m~dtalll•nan a-1u~''U S .:n• ar••nm~nls In I J. En•·iron . Sci . Tc.:h. I> 1>1. ~~ 5-~~~ (II P2l!CS)
Odukoya. ,\ , ~1 ... M.Sc .. Ph.L> .. Lec1Urrr. D<r•anmcn1 ~'1 ( i"''''"'h:l'k."'\:' .. VIU\cr .. u~ ,,( 1.'"'}.'~ - I 3~'" '~~~n .. I· n"Lul uw""w.Jun a \llhoo com
Ablmbola, A. F~ Ph I> .. Associ01c Pn>fcss.>r. Dr['Jnn><nt ••I (i.-,•1••~~ l'nt>.:Nt~ .•1 ll>a.hn. II\ ,•. ''~'"'" I mJII ~tmboJ.Jh'l!.l "hoo com
II ow to rltr this antrtr: (lhn •rd sl) lrl Oduko,, ·n .. ~ . AI.; .~himl-ul.,, A F. (~OIOJ ('mll,lmut,,,,.,, ''"• '""• ''' "' ,,,,,,,,, . . m.l 'L.''''"':.i .... :t. • .. :rir; tt ,,,.,/,,,,,,,,., (\'' ' ,fturq•ut,' ltll J. Et~l'imn. Sd. r.·,·lt .. 7 1 .'I . .1~ ' ·.I'll
376
I I
11
L
:Ji