j.w. wilson & assoc. inc
TRANSCRIPT

STATE OF NEW HAMPSHIRE
BEFORE THE PUBLIC UTILITIES COMMISSION
********
EnergyNorth Natural Gas, Inc. d/b/a National Grid NH Docket DG 10-017
Direct Testimony of
Dr. John W. Wilson
October 22, 2010
J.W. Wilson & Associates, Inc. Economic Counsel
1601 North Kent Street · Rosslyn Plaza C · Suite 1104 Arlington, VA 22209

Direct Testimony of John W. Wilson
TABLE OF CONTENTS
I. QUALIFICATIONS ............................................................................................... 1
II. OVERVIEW OF TESTIMONY ............................................................................. 4
III. THE DCF MODEL ................................................................................................. 6
IV. CAPITAL ASSET PRICING MODEL ................................................................ 25
V. CAPITAL STRUCTURE ..................................................................................... 32
VI. COMPARATIVE RISKS ..................................................................................... 34
VII. FLOTATION COSTS ........................................................................................... 36
VIII. ECONOMIC ENVIRONMENT ........................................................................... 37
IX. CONCLUSION ..................................................................................................... 38

Direct Testimony of John Wilson
Page 1 of 40
I. QUALIFICATIONS 1
Q. PLEASE STATE YOUR NAME, OCCUPATION, AND ADDRESS. 2
A. My name is John W. Wilson. I am President of J.W. Wilson & Associates, 3
Inc. Our offices are at 1601 North Kent Street, Suite 1104, Arlington, 4
Virginia, 22209. 5
Q. PLEASE OUTLINE YOUR EDUCATIONAL BACKGROUND. 6
A. I hold a B.S. degree with senior honors and a Masters Degree in Economics 7
from the University of Wisconsin. I have also received a Ph.D. in 8
Economics from Cornell University. My major fields of study were 9
industrial organization and public regulation of business, and my doctoral 10
dissertation was a study of utility pricing and regulation. 11
Q. HOW HAVE YOU BEEN EMPLOYED SINCE THAT TIME? 12
A. After completing my graduate education I was an assistant professor of 13
economics at the United States Military Academy, West Point, New York. 14
In that capacity, I taught courses in both economics and government. 15
While at West Point, I also served as an economic consultant to the 16
Antitrust Division of the United States Department of Justice. 17
After leaving West Point, I was employed by the Federal Power 18
Commission, first as a staff economist and then as Chief of FPC's Division 19
Direct Testimony of John Wilson
Page 2 of 40
of Economic Studies. In that capacity, I was involved in regulatory matters 1
involving most phases of FPC regulation of electric utilities and the natural 2
gas industry. Since 1973 I have been employed as an economic consultant 3
by various clients, including federal, state, provincial and local 4
governments, private enterprise and nonprofit organizations. This work has 5
pertained to a wide range of issues concerning public utility regulation, 6
insurance rate regulation, antitrust matters and economic and financial 7
analysis. In 1975 I formed J.W. Wilson & Associates, Inc., a Washington, 8
D.C. corporation. 9
Q. WOULD YOU PLEASE DESCRIBE SOME OF YOUR 10
ADDITIONAL PROFESSIONAL ACTIVITIES? 11
A. I have authored a variety of articles and monographs, including a number of 12
studies dealing with utility regulation and economic policy. I have 13
consulted on regulatory, financial and competitive market matters with the 14
Federal Communications Commission, the National Academy of Sciences, 15
the Ford Foundation, the National Regulatory Research Institute, the 16
Electric Power Research Institute, the U.S. Department of Justice Antitrust 17
Division, the Federal Trade Commission Bureau of Competition, the 18
Commerce Department, the Department of the Interior, the Department of 19
Energy, the Small Business Administration, the Department of Defense, the 20
Tennessee Valley Authority, the Federal Energy Administration, and 21
Direct Testimony of John Wilson
Page 3 of 40
numerous state and provincial agencies and legislative bodies in the United 1
States and Canada. 2
Previously, I was a member of the Economics Committee of the U.S. Water 3
Resources Council, the FPC Coordinating Representative for the Task 4
Force on Future Financial Requirements for the National Power Survey, the 5
Advisory Committee to the National Association of Insurance 6
Commissioners (NAIC) Task Force on Profitability and Investment 7
Income, and the NAIC's Advisory Committee on Nuclear Risks. 8
In addition, I have testified as an expert witness in court proceedings 9
dealing with competition in the electric power industry and on regulatory 10
matters before more than 50 Federal and State regulatory bodies throughout 11
the United States and Canada. I have also appeared on numerous occasions 12
as an expert witness at the invitation of U.S. Senate and Congressional 13
Committees dealing with antitrust and regulatory legislation. In addition, I 14
have been retained as an expert on regulatory matters by more than 25 State 15
and Federal regulatory agencies. I have also participated as a speaker, 16
panelist, or moderator in many professional conferences and programs 17
dealing with business regulation, financial issues, economic policy and 18
antitrust matters. I am a member of the American Economic Association 19
and an associate member of the American Bar Association and the ABA’s 20
Antitrust, Insurance and Regulatory Law Sections. 21

Direct Testimony of John Wilson
Page 4 of 40
II. OVERVIEW OF TESTIMONY 1
Q. ON WHOSE BEHALF ARE YOU TESTIFYING IN THIS 2
PROCEEDING? 3
A. I am presenting testimony in this proceeding on behalf of the Commission 4
Staff. 5
Q. PLEASE SUMMARIZE YOUR TESTIMONY? 6
A. My testimony in this case deals with EnergyNorth Natural Gas, Inc.’s 7
(“ENNG” or “the Company”) requested rate of return. My analysis 8
concerning ENNG’s rate of return focuses on the Company’s cost of 9
common equity capital. 10
While ENNG is requesting a common equity return of 11.0 percent, the 11
evidence that I present shows that a more reasonable equity allowance, 12
under present financial circumstances, would be in the 9.0 percent range. 13
Especially in view of the decline in interest rates and other money costs that 14
have occurred in recent years, an 11.0 percent equity return allowance 15
would not be just and reasonable in this case. 16
Q. WHAT IS RATE OF RETURN? 17
A. Rate of return is often described as the profit, expressed as a percentage of 18
the utility’s invested capital (measured as rate base), that the utility is 19

Direct Testimony of John Wilson
Page 5 of 40
allowed to include in its rates. From an economist’s perspective it is not 1
precisely right to call this allowed “profit” because it includes both the cost 2
of debt capital (interest expense) as well as the allowed return on 3
stockholders’ equity investment in the company. 4
For example, if a utility has $100 million invested in rate base and this is 5
funded with $50 million of debt, with an average interest of 6%, and $50 6
million of equity, which the Commission has determined requires a return 7
of 10% (cost of equity or “ROE”), the allowed rate of return would be 8% 8
or $8 million annually. This amount, along with all expenses and taxes, 9
would be the capital cost portion of the revenue requirement reflected in the 10
utility’s rates. 11
Q. IS THE DETERMINATION OF A UTILITY’S RATE OF RETURN 12
ALLOWANCE A CONTROVERSIAL ASPECT IN MOST RATE 13
CASES? 14
A. Yes. Rate of return accounts for a substantial portion of a utility’s rates. 15
While the debt component of rate of return is usually a straightforward 16
reflection of the Company’s actual interest costs as stated on its books, the 17
equity return component is largely a matter of judgment and is typically 18
hotly contested. Disputes about required rate of return allowances in rate 19

Direct Testimony of John Wilson
Page 6 of 40
cases often center on the use of particular cost of capital estimation models 1
used by the various parties. 2
Q. IS STRICT ADHERENCE TO THE RESULTS OF MODELS 3
ESSENTIAL TO GETTING THE RATE OF RETURN “RIGHT” IN 4
A REGULATORY PROCEEDING LIKE THIS? 5
A. No. Models can be either helpful or confusing, and their results are highly 6
dependent on implementation. Ultimately, the “right” ROE determination 7
in this (and any) rate case is very largely a matter of informed judgment. 8
While “experts” may be able to offer the Commission facts, analyses and 9
insights that will help to inform a reasonable range within which that 10
essential judgment can be exercised, it is ultimately a determination that 11
must depend on the Commission’s priorities, objectives and exercise of 12
discretion, which no model, set of “expert” calculations, or sworn opinions 13
can replace. 14
III. THE DCF MODEL 15
Q. DO YOU DISAGREE WITH THE DESCRIPTION OF THE 16
DISCOUNTED CASH FLOW (DCF) MODEL THAT ENNG’S 17
EXPERT, MR. HEVERT HAS PRESENTED IN HIS DIRECT 18
TESTIMONY? 19
A. Mr. Hevert’s basic description of what he refers to as “the Constant Growth 20

Direct Testimony of John Wilson
Page 7 of 40
DCF model” conforms with my own. However, I disagree with some of his 1
elaborations such as his “Multi-Stage” DCF model, in particular, his use of 2
projected GDP growth as a proxy for long term growth in DCF analysis and 3
his adjustments for “flotation costs.” 4
Discounted cash flow (or DCF) models are frequently used as a method for 5
measuring the cost or required return on a firm's common equity capital. 6
The DCF model is based upon two fundamental principles. First, it is 7
based on the principle that rational investors evaluate the risks and expected 8
returns of securities in capital markets and establish prices for particular 9
securities which adequately compensate them for the risks they perceive. 10
Second, the model is based on the proposition that the total equity returns 11
received by shareholders consist of dividends and capital gains, and these 12
returns are measured in terms of the current dividend yield plus the 13
expected rate of dividend growth. The DCF model, which combines yield 14
and growth information to produce an estimated total return expected by 15
stock investors, is the following: 16
Total Return Current Expected Dividend 17
to Investor =
Dividend Yield +
Growth Rate 18
The model makes no separate provision for capital gains because they are 19
fully accounted for in the dividend growth component. That is, capital 20
gains are a consequence of price appreciation which, in turn, is a 21

Direct Testimony of John Wilson
Page 8 of 40
consequence of rising dividends and expected dividend growth. 1
Since an individual investor cannot control either the current dividend rate 2
or the dividend growth rate, his decision about the adequacy of returns is 3
reflected by his buy, sell, and hold decisions. If the expected return 4
exceeds the required return, the price of common stock will be greater than 5
the stock’s book value. If the expected return is lower than investor 6
requirements, the market price will fall below book value. If investor 7
expectations and requirements are the same, the stock will trade at a price 8
equal to book value. 9
In other words, the DCF procedure for estimating the cost of equity capital 10
reflects the fact that the maximum price a logical investor will pay for a 11
security is an amount equal to the present value of the dividends that he or 12
she expects to receive over the years during which the security is held plus 13
its resale price, including capital gains, when the security is sold. 14
Algebraically, this principle can be represented by the following equation: 15
D1 D2 Dt Pt 16
P0 = ______ + ______ + … + ______ + ______ 17 1 + R (1+R)2 (1+R)t (1+R)t 18
19 where Po is the price of a company's common stock today; D1, D2 ... Dt are 20
expected dividends in subsequent periods; Pt is the expected resale price of 21

Direct Testimony of John Wilson
Page 9 of 40
the stock at some time in the future; and R is the discount rate or required 1
return (sometimes referred to as the opportunity cost of capital). This 2
algebraic statement becomes an infinite geometric progression (because Pt 3
and all subsequent resale values depend on expected dividends and resale 4
prices at that point in the future, and dividends are assumed to grow at a 5
constant annual rate) which reduces algebraically to the familiar DCF 6
formula: 7
R = D/P + g 8
where g is the expected annual rate of dividend growth. 9
The market price is the present value of all cash flows expected in the 10
future, discounted at a rate equal to the rate of return investors require on 11
the investment. Present value is the current worth of expected future 12
returns – that is, what an investor would be willing to pay today in order to 13
obtain the expected cash flows in the future. Today's price is the present 14
value of these expected cash flows, discounted at a rate that reflects the cost 15
of capital, including the risk perceived by investors that their expectations 16
will not be met. 17
The most controversial aspect of DCF analysis is usually estimating the 18
growth component of the model, rather than the underlying model or 19
theory, itself. Thus, while Mr. Hevert and I disagree substantially on the 20
Direct Testimony of John Wilson
Page 10 of 40
calculated DCF outcome in this case, we have little fundamental 1
disagreement about the basic model itself. 2
Q. WHAT EXPECTATIONS ARE IMPORTANT IN DCF ANALYSIS? 3
A. Investors’ collective expectations regarding dividend growth are central to 4
the discounted cash flow approach and are the key to estimating the cost of 5
common equity capital. While analysts may opine on what they think 6
investors’ dividend growth expectations may be, the only way in which 7
investors reveal their collective expectations is in the market prices that 8
they establish for common stock. Investors establish prices for common 9
stocks on the basis of their collective expectations of future income streams 10
(dividends and capital gains) relative to their return requirements for the 11
level of perceived risk. It is the consensus of investor expectations that 12
establishes the price of common equities, and those expectations are 13
ultimately concerned with investors’ expected future income streams (i.e., 14
dividends). This means that it is the expected growth in dividends which is 15
most important in estimating “g” in the DCF calculation. 16
Although dividend yields are easy to estimate with published data, the 17
expected dividend growth component, “g”, is not as easy. Although 18
analysts often publish their earnings expectations, which, overall, tend to be 19
somewhat bullish, there is no published consensus value for the dividend 20

Direct Testimony of John Wilson
Page 11 of 40
expectations that investors hold. That analysts’ forecasts are somewhat 1
more bullish than investors’ actual expectations is evident from stock 2
market prices, which are typically lower than analysts’ price forecasts. This 3
differential may be consistent with the notion that really valuable analysts 4
are those who know something that the market does not already know. In 5
any event, in estimating an equity cost rate one must determine, on the 6
basis of factual information, what the most reasonable estimate of dividend 7
growth expectations held by investors is at any point in time. If investors 8
accept analysts’ earnings growth forecasts at face value and without any 9
discounting, and if they expect that firms will increase their dividend 10
payouts in lock-step with earnings growth, then analysts’ earnings forecasts 11
may serve as a proxy for the investor dividend growth expectations that are 12
central to the DCF model. 13
In this regard, it is important to emphasize that the task of the rate of return 14
analyst is to determine what dividend growth rate investors are expecting, 15
and not to forecast a growth rate that analysts expect. Nor does it matter 16
whether investors' expectations turn out to be right or wrong. Today's 17
common stock prices, which enter the DCF calculation through the 18
dividend yield term, depend upon today's expectations for future growth. 19
Of course, expectations and requirements may be different at different 20
times, and, therefore, the cost of common equity is likely to change over 21
Direct Testimony of John Wilson
Page 12 of 40
time. 1
For example, when interest rates are very high, it is likely that required 2
equity returns are higher than when interest rates are low. Similarly, when 3
expected long-term inflation rates are high, it is likely that the cost of 4
common equity will be higher than when long-term inflation expectations 5
are low. A cost of common equity established at one point in time may be 6
quite different from that established previously, or different than that found 7
to be true in the future. Also, while tomorrow's hindsight may prove that 8
today's expectations were wrong, that does not and cannot possibly affect 9
today's cost of capital. That is why it is necessary only for the rate of return 10
analyst to estimate, as accurately as possible, what investor expectations 11
actually are, and not whether they are correct. 12
Q. DO YOU AGREE WITH MR. HEVERT’S DCF CALCULATIONS? 13
A. I have some disagreements with his specific calculations. First, the 14
calculations should be updated to reflect current known and measurable 15
financial circumstances. Second, Mr. Hevert’s “flotation cost” adjustment 16
should be removed. Third, projected gross domestic product (“GDP”) 17
growth is not a proper proxy for expected growth in earnings per share of 18
common stock. Fourth, in addition to earnings per share growth, 19
consideration should also be given to growth in book value per share and 20

Direct Testimony of John Wilson
Page 13 of 40
growth in dividends per share. Expected dividend growth is particularly 1
important because dividend yield and dividend growth are the expected 2
payouts relevant to investors. Expected earnings growth and expected book 3
value growth are relevant as determinants of, and therefore proxies for, 4
expected dividend growth. 5
Q. WHAT OTHER SPECIFIC DISAGREEMENTS DO YOU HAVE 6
WITH MR. HEVERT’S COST OF EQUITY ANALYSIS THAT 7
SHOULD BE NOTED? 8
A. As I explain in more detail below, I disagree both with his use of long term 9
debt interest rates as “risk free” and with the excessive risk premium 10
spreads (between the cost of equity and the cost of risk free debt) that he 11
uses in deriving his capital asset pricing model (CAPM) cost of equity 12
estimates. Long term debt is far from risk free, and the risk premiums 13
adopted by Mr. Hevert are well in excess of reasonable estimates. 14
Also, I disagree with Mr. Hevert’s conclusions regarding the Company’s 15
relative risks. First, it is incorrect to claim that ENNG’s small size in 16
relation to Mr. Hevert’s proxy group implies greater financial risk. ENNG 17
is a small part of a very large Company, National Grid, and all of ENNG’s 18
equity capital is obtained in financial markets by National Grid. As the 19
Commission was told repeatedly in the Keyspan merger case, the Company 20
Direct Testimony of John Wilson
Page 14 of 40
claims that National Grid’s large size provides substantial capital market 1
benefits. Those claimed benefits should be recognized in considering the 2
appropriate regulatory capital cost allowance in this proceeding. ENNG, as 3
part of National Grid, is substantially larger than the companies in Mr. 4
Hevert’s proxy group. 5
Further, while I do not advocate revenue decoupling, it cannot be 6
reasonably denied that if the revenue decoupling benefits that ENNG is 7
seeking in this case are granted, that will result in a significant shift of 8
normal utility business risks from the Company’s owner to its ratepayers. 9
Thus, regardless of the merits of Mr. Hevert’s argument that some of his 10
proxy group companies also have some form of revenue decoupling or cost 11
tracker protection, decoupling would significantly reduce ENNG’s business 12
risks compared to what they were previously. 13
Finally, I recommend that the Commission decline to provide the “stay out” 14
equity return premium proposed by Mr. Hevert. Unlike thirty years ago, it 15
is uncommon today for utilities to file general rate cases on a cycle of less 16
than two years, and any decoupling mechanism will likely extend that time 17
frame. Second, if there were an unforeseen catastrophic event in the near 18
future, it is questionable whether it would be possible or even desirable to 19
enforce a stay-out commitment – especially if that would imperil service. 20
Third, especially with decoupling, relatively frequent rate cases, rather than 21

Direct Testimony of John Wilson
Page 15 of 40
long stay-out periods, are a very important aspect of consumer protection. 1
Ultimately, there is no sound basis for concluding that there is any cost 2
basis for an equity return premium for the stay-out commitment proposed 3
here. 4
Q. DO YOU AGREE WITH MR. HEVERT’S SELECTED PROXY 5
GROUP? 6
A. I have elected to use the same group that was chosen by Mr. Hevert. This 7
will eliminate what could be extended subjective arguments about which 8
companies are more or less comparable to ENNG or National Grid (a 9
matter that the Commission can consider in exercising its judgment) and 10
allow the Commission to more productively direct its attention to the more 11
critical issues. One could, for example, argue that South Jersey Industries 12
(“SJI”) should be removed from the proxy group because of its substantial 13
non-utility business.1
Q. PLEASE DESCRIBE YOUR DCF COST OF EQUITY ESTIMATES. 19
But this would trigger arguments about which 14
measure to use, and, as shown in my exhibits, the difference with and 15
without SJI is not great. In this case, essentially the same information and 16
issues for resolution can be placed before the Commission without 17
extended debate about the makeup of the proxy group. 18
1 In 2008 and 2009 SJI’s non-utility income from continuing operations was 49.0% and 33.2% of the Company’s total earnings, and non-utility “economic” earnings were 42.0% and 45.2 % of total earnings, respectively.

Direct Testimony of John Wilson
Page 16 of 40
A. I begin by examining the same group of gas distribution utilities that Mr. 1
Hevert uses in his DCF analysis. While cases like this often begin with a 2
dispute about what group of companies to use for comparison purposes, 3
that is not a necessary argument here. Exhibit ___ (JW-1) is similar to Mr. 4
Hevert’s (RBH-2). The differences are that: (1) I have updated the analysis 5
to reflect more recent information; (2) I present results including and 6
excluding SJI; and (3) my results do not include the flotation cost 7
adjustment shown in Mr. Hevert’s exhibit. 8
Q. WHAT IS SHOWN IN EXHIBIT___(JW-1)? 9
A. In Exhibit___(JW-1) I present constant growth DCF results for the 10
comparable gas distribution utility group using 30 day, 90 day and 180 day 11
pricing periods (as does Mr. Hevert in RBH-2). 12
Q. WHAT ARE THE DCF RESULTS SHOWN IN EXHIBIT___(JW-1)? 13
A. The results are all in the 7.4% to 9.7% percent range, as summarized below. 14
I have used the same “low”, “mean” and “high” categories as in Mr. 15
Hevert’s analysis. My results are somewhat lower than his largely because 16
of updating. 17
Q. HAVE YOU PERFORMED ANY ADDITIONAL DCF 18
CALCULATIONS? 19

Direct Testimony of John Wilson
Page 17 of 40
A. Yes. I performed the same “constant growth” DCF calculations using 1
projected dividends and book value growth, rather than projected earnings, 2
and I have also made a fundamental DCF analysis. 3
Despite the fact that the DCF model is explicitly designed to estimate 4
common equity cost based on stock prices and investors’ dividend 5
expectations (dividend yield plus dividend growth), Mr. Hevert elects to 6
consider only earnings forecasts (as a proxy for dividend growth) rather 7
than considering dividend growth forecasts directly. He argues that his 8
regression analysis (shown in RBH-4) shows that during the period 3/04 – 9
6/08 expected earnings growth is the only statistically significant 10
determinant (out of earnings, dividends and book value) of differences in 11
his natural gas utilities’ price/earnings ratios. But his statistical analysis of 12
pooled cross section and time series data is not compelling, or even very 13
informative. While forecasted earnings are “statistically significant” in his 14
regressions, they explain only 3.3% of the variation in the gas utility P/E 15
ratios over the 52 month period considered2
2 Adding forecasted book value and dividend growth to the regression increases explained variation to 4.4%, but worsens statistical significance.
, leaving 97% of the variation 16
unexplained. In short, Mr. Hevert’s earnings growth regression reveals 17
hardly anything about what causes P/E ratios to vary over time and between 18
companies. It is an extremely unsatisfactory model – certainly not one that 19
should be relied upon to conclude that 100% reliance should be placed on 20

Direct Testimony of John Wilson
Page 18 of 40
earnings growth forecasts and zero reliance on dividend and book value 1
growth. 2
While I do not contend that dividend or book value growth results are 3
superior in this case to the earnings growth indications in Exhibit __ (JW-4
1), I present them here for the Commission’s consideration in Exhibits ___ 5
(JW-2) and (JW-3), again using 30, 90 and 180 day pricing periods. The 6
results for all of these constant growth DCF calculations are summarized 7
below. Dividend growth expectations indicate a current cost of common 8
equity capital of about 7 percent, while book value growth forecasts 9
indicate an equity cost rate of about 8.5 percent. Note that while earnings 10
per share growth estimates have three sources (Value Line, Zacks and First 11
Call), the dividend and book value estimates are made only by Value Line. 12

Direct Testimony of John Wilson
Page 19 of 40
DCF Cost of Equity Estimates
Earnings Growth Dividend Growth Book Value Growth
30 day pricing
Low 7.61% (7.38)
Medium 8.59% (8.36) 7.12% (6.86) 8.40% (8.40)
High 9.61% (9.23)
90 day pricing
Low 7.68% (7.44)
Medium 8.65% (8.42) 7.18% (6.93) 8.46% (8.46)
High 9.68% (9.30)
180 day pricing
Low 7.72% (7.47)
Medium 8.70% (8.45) 7.24% (6.96) 8.51% (8.49)
High 9.72% (9.33)
Average 8.66% (8.38) 7.18% (6.92) 8.46% (8.45)
Values in parenthesis are without SJI.

Direct Testimony of John Wilson
Page 20 of 40
Q. HAVE YOU ALSO PERFORMED A FUNDAMENTAL DCF 1
ANALYSIS? 2
A. Yes, I have. 3
Q. WHAT IS A FUNDAMENTAL DCF CALCULATION? 4
A. A fundamental DCF calculation uses retained earnings as the measure of 5
expected growth. This alternative DCF approach has the advantage of 6
avoiding analysts’ forecasts of growth that often exceed actual investor 7
expectations. Because retained earnings provide for growth in equity and 8
growth in equity provides for business growth, the rate of earnings plow-9
back (i.e., those earnings not paid out in dividends) serves as a basis for 10
estimating future dividend growth. If the funds that are retained and 11
reinvested earn the allowed return and the allowed return is equal to the 12
cost of capital, retained earnings provide a good estimate of future growth. 13
For example, if a company with a stock price and book value of $50 per 14
share earns $5.00 (10%) and pays out a dividend of $2.50, its dividend 15
yield is 5% (i.e., 2.50/50). Expected growth will also be 5% because, if the 16
10% earnings rate is maintained, the $2.50 that is retained will permit 17
earnings to increase by that amount (i.e., $2.50 x 10% = $0.25 which is 5% 18
of $5.00). Likewise, the retention of $2.50 of earnings within the 19
corporation will cause the book value of its stock to increase by 5% (i.e., 20
Direct Testimony of John Wilson
Page 21 of 40
$2.50 is 5% of $50.00). In this case, the dividend yield of 5% plus 1
expected growth of 5% equals 10%, which is the cost of capital. 2
Q. PLEASE SUMMARIZE THE RESULTS OF YOUR 3
FUNDAMENTAL DCF CALCULATION. 4
A. My fundamental DCF results are presented in Exhibit___ (JW-4). Once 5
again, I have used the same group of eight proxy gas utilities, and I have 6
used dividend and retained earnings projections from The Value Line 7
Investment Survey for each company. As shown in Exhibit___ (JW-4), this 8
fundamental DCF approach indicates an average cost of common equity for 9
the gas utility proxy group of 8.7 percent. 10
Q. HAVE YOU PREPARED MULTI-STAGE DCF CALCULATIONS? 11
A. Yes; I have prepared multi-stage DCF analyses in the same format as 12
presented by Mr. Hevert. These are presented in Exhibit___ (JW-5). 13
Q. WHAT ARE THE DIFFERENCES BETWEEN YOUR MULTI-14
STAGE DCF ANALYSIS AND THOSE PRESENTED BY MR. 15
HEVERT? 16
A. There are two significant differences. First, as in the constant growth DCF 17
models discussed above, I have updated the underlying data for known and 18
measurable changes. Second, I strongly disagree with Mr. Hevert’s use of 19

Direct Testimony of John Wilson
Page 22 of 40
projected gross domestic product (GDP) as a measure of expected long 1
term growth in earnings per share for the proxy gas utility group. 2
Therefore, instead of GDP growth, I have used the estimate for sustainable 3
growth as an appropriate measure of expected long term earnings growth. 4
Q. WHY DO YOU DISAGREE WITH MR. HEVERT’S USE OF 5
PROJECTED GDP AS A MEASURE OF THE EXPECTED LONG 6
TERM GROWTH IN EARNINGS PER SHARE FOR THE PROXY 7
GAS UTILITY GROUP? 8
A. The growth rate that is relevant in the DCF cost of capital model is the rate 9
of growth in dividends per share of stock – not total economic growth. The 10
two measures are substantially different because a large part of total 11
economic growth reflects growth in the number of shares, not just growth 12
per share. Thus, if a company’s earnings and dividends double over 10 13
years, and the number of shares outstanding remains the same, the value of 14
each share doubles. However, if growth in the company’s earnings and 15
divdends is financed by selling additional shares, the resulting per share 16
growth value is less than double. Likewise, if GDP or total corporate 17
earnings double over 10 years, and this reflects the development and 18
growth of new businesses as well as the growth in the number of shares 19
issued by existing businesses, then total growth is spread over more shares, 20
and growth per share is less than double. 21

Direct Testimony of John Wilson
Page 23 of 40
Q. PLEASE EXPLAIN WHY THAT IS SO. 1
A. Whether in terms of earnings or GDP, the economy grows over time for 2
two distinct reasons: 3
1) Individual business enterprises grow, 4
and 5
2) The number of business enterprises grows. 6
Furthermore, when individual business enterprises grow: 7
1) New equity capital is raised from new equity issues, and 8
2) Existing equity investments grow over time due to retained earnings 9
and other accumulations to existing shares. 10
Earnings growth per share will be the same as total earnings growth only if 11
all growth is attributable to existing shares -- i.e. if there are no new firms 12
and existing firms issue no new shares of stock. 13
If a company’s earnings and the market value of its equity capital doubles 14
over ten years, and it still has the same number of shares outstanding, the 15
value of each share doubles, reflecting a 7.18% annual rate of growth over 16
the ten years: 17
(1.0718)10 = 2.0 18
If, on the other hand, a company’s earnings and market value double, but 19
Direct Testimony of John Wilson
Page 24 of 40
this growth is financed by selling additional shares, the resulting per share 1
value is less than double and the annual per share growth rate is less than 2
7.18%: 3
Likewise, if GDP or total corporate earnings double over 10 years and this 4
reflects growth in the number of corporations as well as growth in the 5
number of shares issued by some corporations, growth per share is less than 6
double. 7
In short, it is obvious that total growth measures, like growth in GDP, total 8
corporate earnings or total dividends over a long period of time will not 9
provide a good proxy for earnings or dividend growth per share. Over any 10
long period of time there will also be substantial growth in population, 11
households, number of investors, number of corporations, and corporate 12
shares outstanding. 13
Q. ARE THERE ADDITIONAL REASONS FOR REJECTING GDP 14
GROWTH AS A MEASURE OF PER SHARE EARNINGS 15
GROWTH IN MR. HEVERT’S MULTI-STAGE DCF 16
CALCULATION? 17
A. Yes. The GDP growth percentage in Mr. Hevert’s analysis exceeds his 18
own sustainable growth percentage by a significant margin. This alone 19
Direct Testimony of John Wilson
Page 25 of 40
makes the GDP growth percentage an illogical proxy for per share earnings 1
growth. 2
Q. WHAT ARE THE RESULTS OF YOUR MULTI-STAGE DCF 3
ANALYSIS? 4
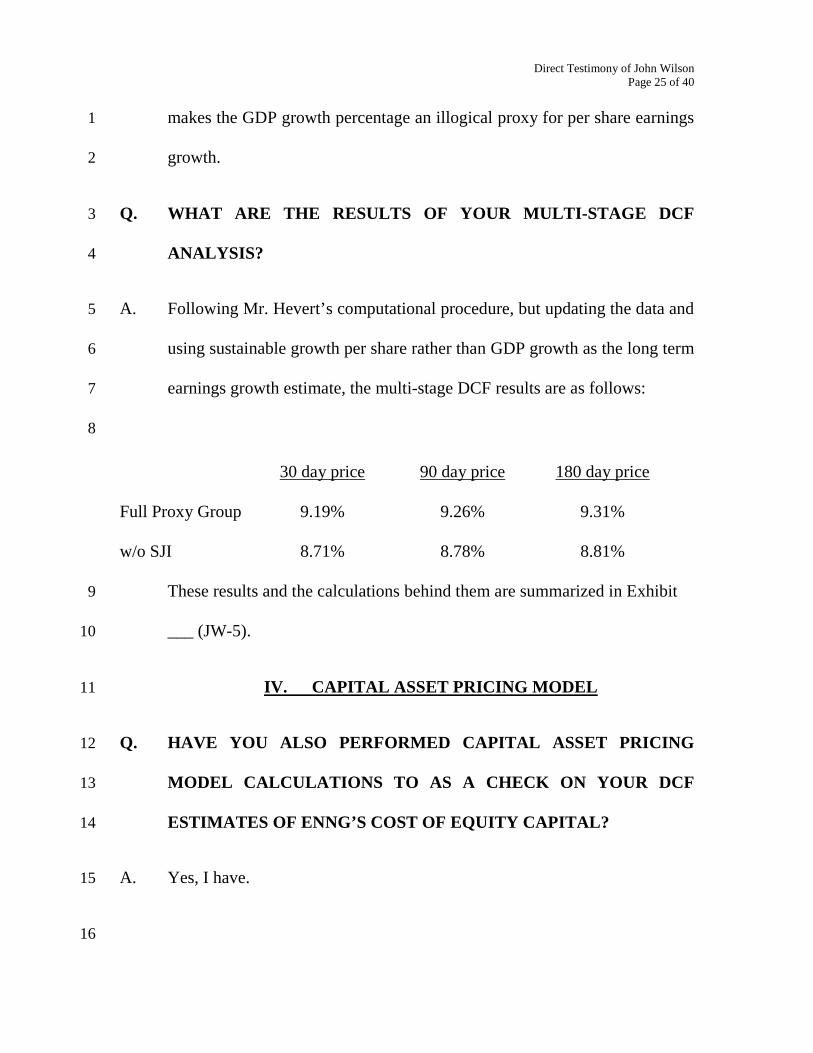
A. Following Mr. Hevert’s computational procedure, but updating the data and 5
using sustainable growth per share rather than GDP growth as the long term 6
earnings growth estimate, the multi-stage DCF results are as follows: 7
8
These results and the calculations behind them are summarized in Exhibit 9
___ (JW-5). 10
IV. CAPITAL ASSET PRICING MODEL 11
Q. HAVE YOU ALSO PERFORMED CAPITAL ASSET PRICING 12
MODEL CALCULATIONS TO AS A CHECK ON YOUR DCF 13
ESTIMATES OF ENNG’S COST OF EQUITY CAPITAL? 14
A. Yes, I have. 15
16
30 day price 90 day price 180 day price
Full Proxy Group 9.19% 9.26% 9.31%
w/o SJI 8.71% 8.78% 8.81%
Direct Testimony of John Wilson
Page 26 of 40
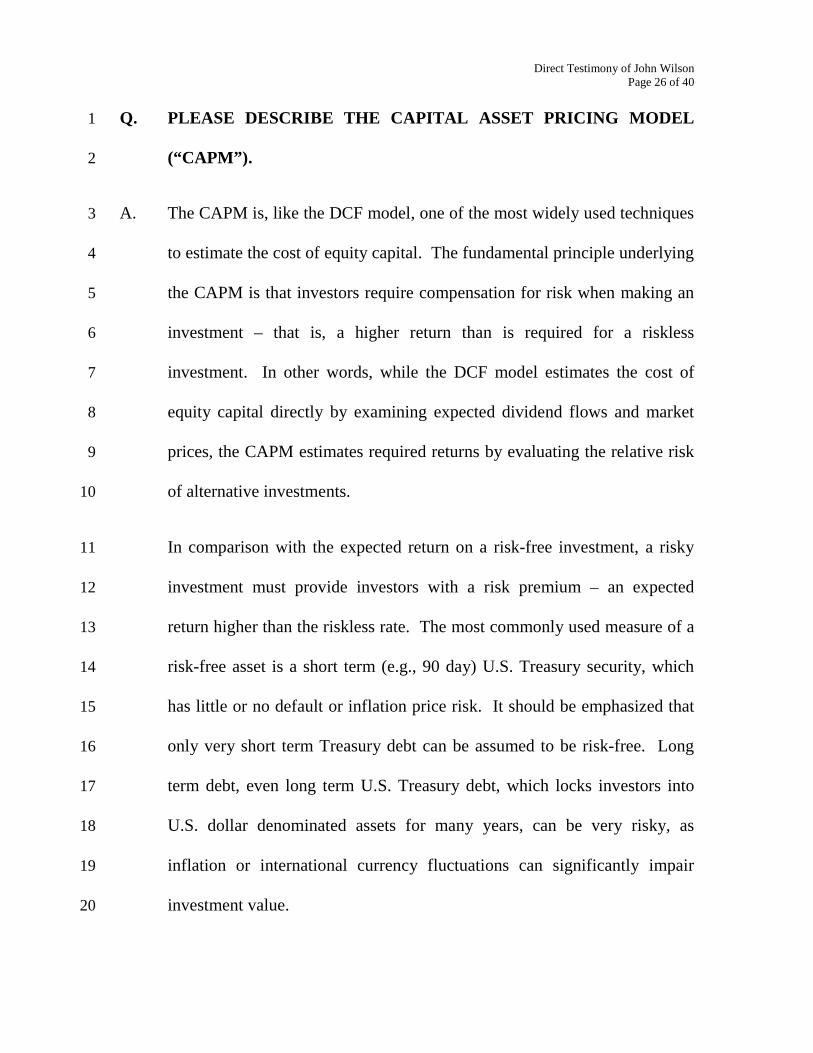
Q. PLEASE DESCRIBE THE CAPITAL ASSET PRICING MODEL 1
(“CAPM”). 2
A. The CAPM is, like the DCF model, one of the most widely used techniques 3
to estimate the cost of equity capital. The fundamental principle underlying 4
the CAPM is that investors require compensation for risk when making an 5
investment – that is, a higher return than is required for a riskless 6
investment. In other words, while the DCF model estimates the cost of 7
equity capital directly by examining expected dividend flows and market 8
prices, the CAPM estimates required returns by evaluating the relative risk 9
of alternative investments. 10
In comparison with the expected return on a risk-free investment, a risky 11
investment must provide investors with a risk premium – an expected 12
return higher than the riskless rate. The most commonly used measure of a 13
risk-free asset is a short term (e.g., 90 day) U.S. Treasury security, which 14
has little or no default or inflation price risk. It should be emphasized that 15
only very short term Treasury debt can be assumed to be risk-free. Long 16
term debt, even long term U.S. Treasury debt, which locks investors into 17
U.S. dollar denominated assets for many years, can be very risky, as 18
inflation or international currency fluctuations can significantly impair 19
investment value. 20
Direct Testimony of John Wilson
Page 27 of 40
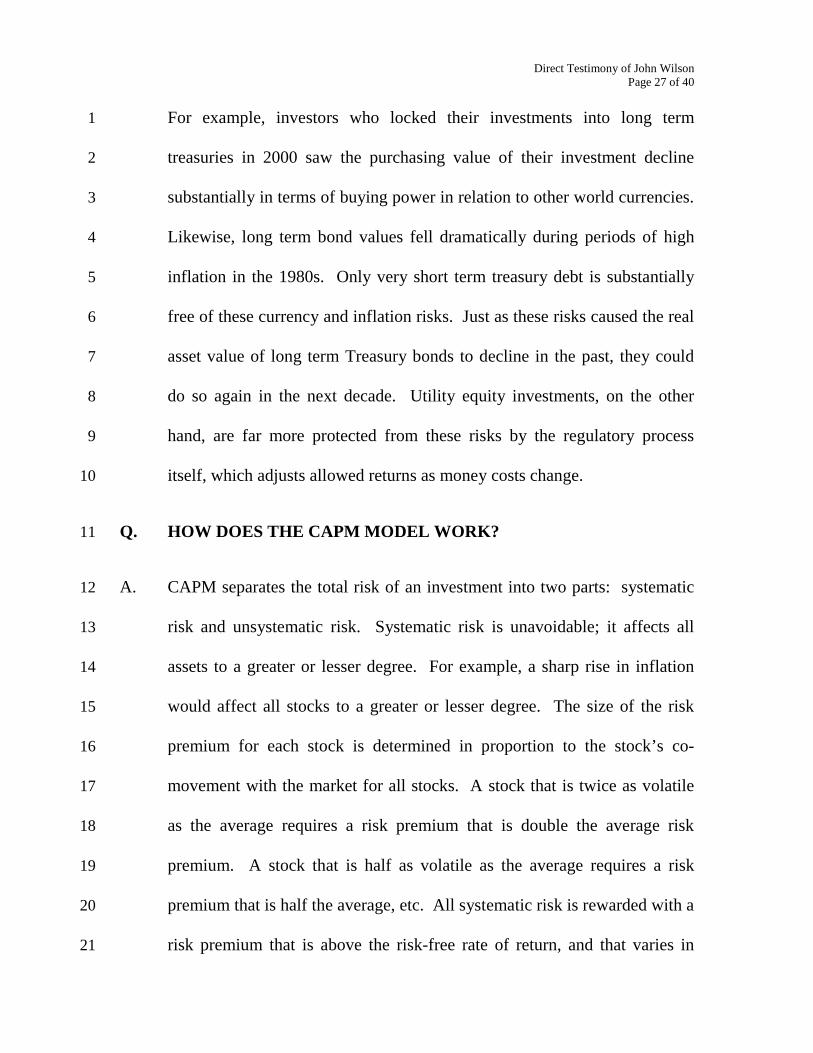
For example, investors who locked their investments into long term 1
treasuries in 2000 saw the purchasing value of their investment decline 2
substantially in terms of buying power in relation to other world currencies. 3
Likewise, long term bond values fell dramatically during periods of high 4
inflation in the 1980s. Only very short term treasury debt is substantially 5
free of these currency and inflation risks. Just as these risks caused the real 6
asset value of long term Treasury bonds to decline in the past, they could 7
do so again in the next decade. Utility equity investments, on the other 8
hand, are far more protected from these risks by the regulatory process 9
itself, which adjusts allowed returns as money costs change. 10
Q. HOW DOES THE CAPM MODEL WORK? 11
A. CAPM separates the total risk of an investment into two parts: systematic 12
risk and unsystematic risk. Systematic risk is unavoidable; it affects all 13
assets to a greater or lesser degree. For example, a sharp rise in inflation 14
would affect all stocks to a greater or lesser degree. The size of the risk 15
premium for each stock is determined in proportion to the stock’s co-16
movement with the market for all stocks. A stock that is twice as volatile 17
as the average requires a risk premium that is double the average risk 18
premium. A stock that is half as volatile as the average requires a risk 19
premium that is half the average, etc. All systematic risk is rewarded with a 20
risk premium that is above the risk-free rate of return, and that varies in 21

Direct Testimony of John Wilson
Page 28 of 40
direct proportion to the stock’s relative volatility. The relative risk of each 1
stock is measured by a value known as beta (“B”), which is a measure of 2
the stock’s relative volatility in comparison with the volatility of the entire 3
market. 4
In contrast, unsystematic risk is that portion of total risk that can be avoided 5
by diversifying. Unsystematic risk is not rewarded with a risk premium. 6
The CAPM defines the cost of equity for each company’s stock as equaling 7
the riskless rate plus an increment equal to the amount of systematic risk 8
that goes with the investment: 9
Kn = Rf + Bn (Rm – Rf) 10
where, 11
Kn = the cost of equity for company n 12
Rf = the riskless rate of return 13
Bn = the beta for the stock of company n 14
Rm – Rf = the expected market risk premium 15
(i.e., the average difference between the expected returns for the 16
diversified market portfolio and the riskless return). 17
18

Direct Testimony of John Wilson
Page 29 of 40
Q. WHAT ARE THE APPROPRIATE VALUES FOR THESE 1
VARIABLES IN THIS CASE? 2
A. At the present time, riskless treasury bills are yielding less than 1%, and the 3
highest value in recent years has been about 5%. Thus, Rf = 1.0 to 5.0%. 4
With regard to risk premium, surveys and academic analyses indicate that 5
the expected market risk premium Rm is in the range of 3% to 6%. For 6
example, according to Dinson, March and Staunton (“Risks and Returns in 7
the 20th and 21st Centuries,” Business Strategy Review, Volume 11, Issue 8
2): 9
“It has become clear that the current level of the equity risk premium 10 is unlikely to be as high as was considered reasonable in the mid-11 1990s. The arithmetic mean of 8½% recommended by Ross, 12 Westerfield and Jaffe (1993), the 8-9% suggested (with caveats) by 13 Bealey and Myers (2000), and the 7½% recommended by Wetson, 14 Chung and Sui (1997), and a similar figure inferred from the 15 Copeland, Koller and Murrin (1995) geometric mean of 5-6%, all 16 look excessive. The market is almost certainly building lower risk 17 premia than this into stock prices….The cost of capital has thus 18 fallen substantially in recent years.” 19
20
Also, according to Eugene F. Fama of the University of Chicago and 21
Kenneth R. French of The Massachusetts Institute of Technology, the risk 22
premium over the past half-century was about 4%. Their calculation is 23
based on going back to the past and analyzing what kinds of returns 24
investors had a reasonable right to expect for the future, given companies’ 25
dividend yields and expected growth rates. Risk premiums exceeding 4% 26
Direct Testimony of John Wilson
Page 30 of 40
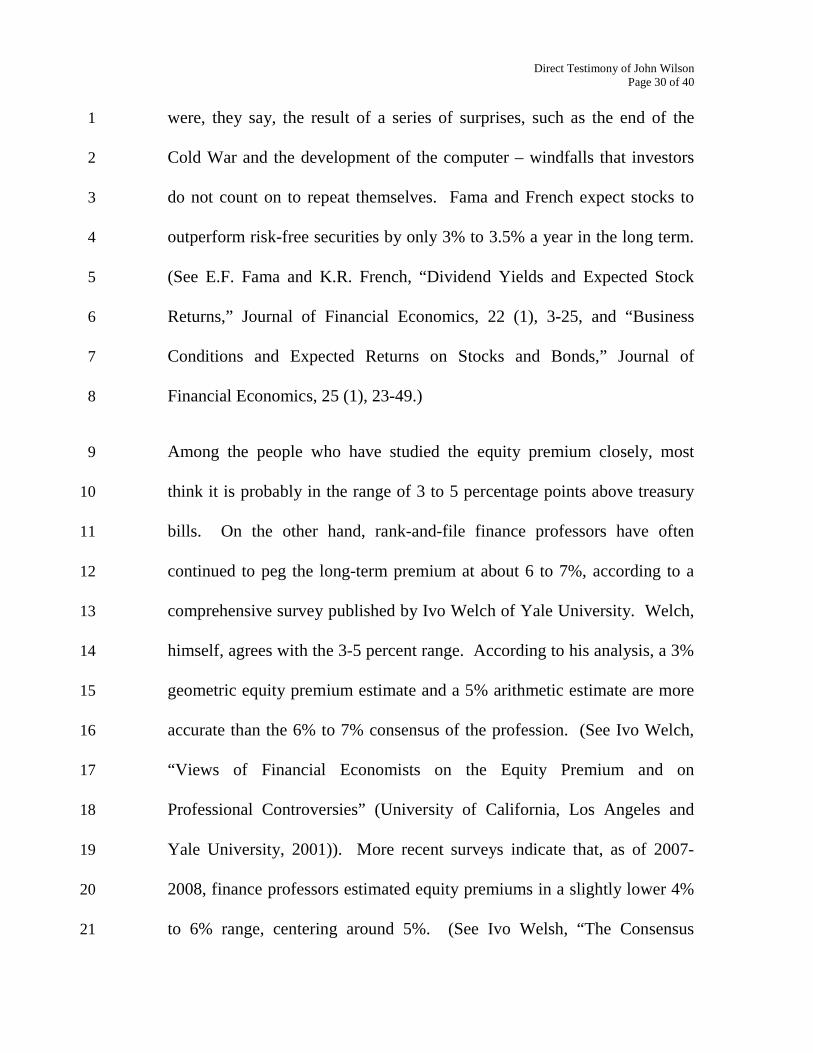
were, they say, the result of a series of surprises, such as the end of the 1
Cold War and the development of the computer – windfalls that investors 2
do not count on to repeat themselves. Fama and French expect stocks to 3
outperform risk-free securities by only 3% to 3.5% a year in the long term. 4
(See E.F. Fama and K.R. French, “Dividend Yields and Expected Stock 5
Returns,” Journal of Financial Economics, 22 (1), 3-25, and “Business 6
Conditions and Expected Returns on Stocks and Bonds,” Journal of 7
Financial Economics, 25 (1), 23-49.) 8
Among the people who have studied the equity premium closely, most 9
think it is probably in the range of 3 to 5 percentage points above treasury 10
bills. On the other hand, rank-and-file finance professors have often 11
continued to peg the long-term premium at about 6 to 7%, according to a 12
comprehensive survey published by Ivo Welch of Yale University. Welch, 13
himself, agrees with the 3-5 percent range. According to his analysis, a 3% 14
geometric equity premium estimate and a 5% arithmetic estimate are more 15
accurate than the 6% to 7% consensus of the profession. (See Ivo Welch, 16
“Views of Financial Economists on the Equity Premium and on 17
Professional Controversies” (University of California, Los Angeles and 18
Yale University, 2001)). More recent surveys indicate that, as of 2007-19
2008, finance professors estimated equity premiums in a slightly lower 4% 20
to 6% range, centering around 5%. (See Ivo Welsh, “The Consensus 21
Direct Testimony of John Wilson
Page 31 of 40
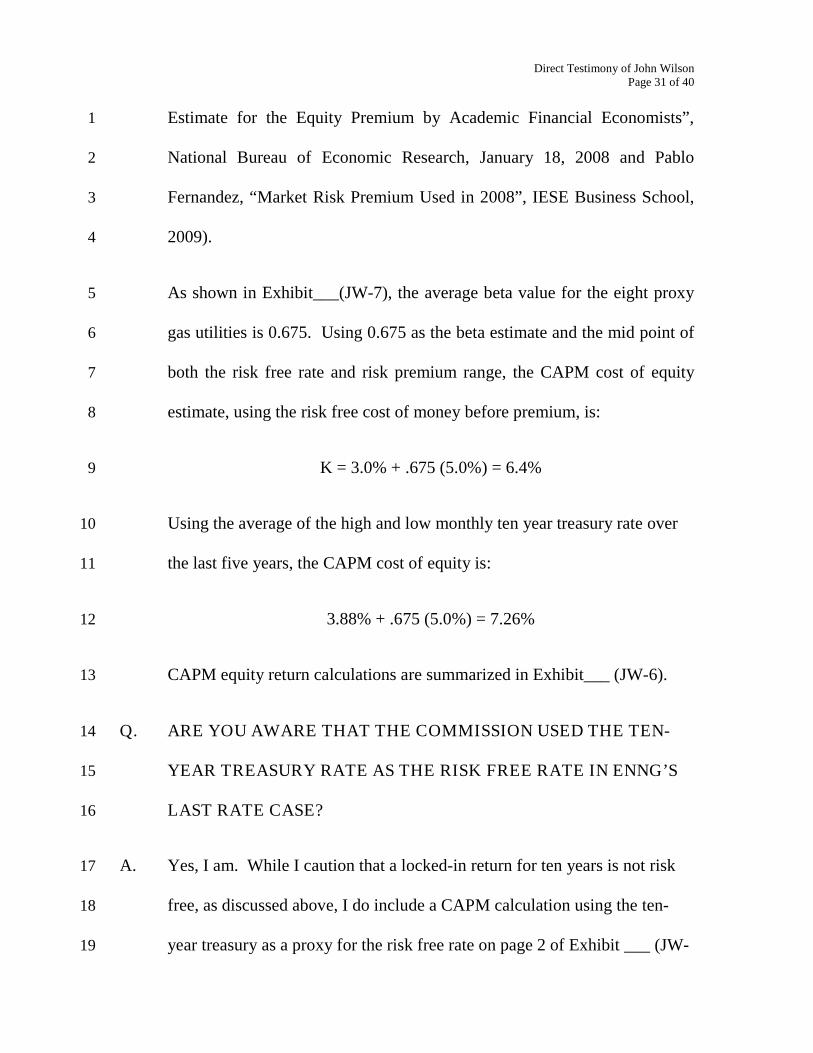
Estimate for the Equity Premium by Academic Financial Economists”, 1
National Bureau of Economic Research, January 18, 2008 and Pablo 2
Fernandez, “Market Risk Premium Used in 2008”, IESE Business School, 3
2009). 4
As shown in Exhibit___(JW-7), the average beta value for the eight proxy 5
gas utilities is 0.675. Using 0.675 as the beta estimate and the mid point of 6
both the risk free rate and risk premium range, the CAPM cost of equity 7
estimate, using the risk free cost of money before premium, is: 8
K = 3.0% + .675 (5.0%) = 6.4% 9
Using the average of the high and low monthly ten year treasury rate over 10
the last five years, the CAPM cost of equity is: 11
3.88% + .675 (5.0%) = 7.26% 12
CAPM equity return calculations are summarized in Exhibit___ (JW-6). 13
Q. ARE YOU AWARE THAT THE COMMISSION USED THE TEN-14
YEAR TREASURY RATE AS THE RISK FREE RATE IN ENNG’S 15
LAST RATE CASE? 16
A. Yes, I am. While I caution that a locked-in return for ten years is not risk 17
free, as discussed above, I do include a CAPM calculation using the ten-18
year treasury as a proxy for the risk free rate on page 2 of Exhibit ___ (JW-19
Direct Testimony of John Wilson
Page 32 of 40
6). At the time of this writing the ten-year treasury rate is 2.4 percent. 1
Over the past five years, the average monthly ten year treasury rate has 2
ranged from 2.65 percent to 5.11 percent. This range is reflected on page 2 3
of Exhibit ___ (JW-6). As shown there, using ten-year U.S. Treasury rates 4
as a proxy for the risk-free rate, the CAPM approach indicates an equity 5
cost range of 4.7% to 9.8%. 6
Q. HOW DO YOUR CAPM RESULTS DIFFER FROM THE CAPM 7
RESULTS PRESENTED BY MR. HEVERT? 8
A. Mr. Hevert’s CAPM results range from 9.98% to 11.17%. These results are 9
substantially overstated because Mr. Hevert incorrectly uses interest on 10
long term (30 year) bonds as the “risk free” rate, and his risk premium 11
spread (7.38%) is excessive, as discussed above. 12
V. CAPITAL STRUCTURE 13
Q. WHAT CAPITAL STRUCTURE DOES ENNG RECOMMEND FOR 14
RATEMAKING PURPOSES IN THIS CASE? 15
A. The Company is proposing a capital structure for ratemaking purposes 16
comprised of 50% common equity and 50% debt. 17
Q. DOES THIS PROPOSAL REFLECT THE COMPANY’S ACTUAL 18
CAPITAL STRUCTURE? 19

Direct Testimony of John Wilson
Page 33 of 40
A. No. It is my understanding that this capital structure reflects the 1
Company’s agreement with Staff and the Commission’s approval in the last 2
rate case as provided in Order No. 24,777. 3
Q DO YOU USE THE SAME 50/50 CAPITAL STRUCTURE IN 4
MAKING YOUR RATE OF RETURN RECOMMENDATION? 5
A. Yes. However, I have adjusted the debt component to include short term 6
debt. The Company’s total year-end debt was comprised of $13.6 million 7
of short term debt and $80 million of long term debt. I used these two 8
amounts to pro-rate debt capitalization for ratemaking purposes between 9
short term and long term debt. The Company has historically incurred 10
short term debt to fund a portion of its assets and is likely to do so in the 11
future. Short term debt is at historically low cost rates and is beneficial in 12
reducing current overall capital costs. While today’s short term commercial 13
debt costs are well under 1.0% (less than 1/20th of the gross-of-tax cost of 14
common equity capital), it is not likely that they will stay at that level for 15
the long term. I have therefore used the Company’s average test year 16
monthly short term debt cost rate of 1.95% for the recommended short term 17
debt component of the Company’s capital structure. 18

Direct Testimony of John Wilson
Page 34 of 40
VI. COMPARATIVE RISKS 1
Q. MR. HEVERT HAS SUGGESTED THAT HIS PROPOSED ROE 2
ALLOWANCE MAY BE WARRANTED BECAUSE ENNG MAY BE 3
PERCEIVED AS BEING EXCEPTIONALLY RISKY. IS THERE 4
MERIT TO THAT CONTENTION? 5
A. No. 6
Q. WHAT SPECIFIC ARGUMENTS HAS MR. HEVERT MADE IN 7
THIS CASE REGARDING ENNG’S COMPARATIVE RISKS? 8
A. Mr. Hevert argues that ENNG is exceptionally risky because it is small, and 9
because it currently has no revenue decoupling or weather normalization 10
clauses in its rates. 11
Q. WHAT IS YOUR RESPONSE TO EACH OF THESE ARGUMENTS? 12
A. As discussed above, the argument that ENNG is more risky than the proxy 13
gas utility group is spurious. ENNG is part of National Grid, a much larger 14
company than any of the proxy group. All of ENNG’s equity capital is 15
obtained in markets by National Grid or through retained earnings. Also, 16
while I do not advocate revenue decoupling, it cannot be denied that 17
decoupling would transfer substantial normal business risk from the 18
Company’s stockholders to its ratepayers. My recommended equity return 19
Direct Testimony of John Wilson
Page 35 of 40
allowance in this case is at the upper end of indicated current common 1
equity costs, and is premised on the assumption that ENNG does not have 2
revenue decoupling. If revenue decoupling is adopted by the Commission, 3
the appropriate common equity return allowance should be at least 100 4
basis points less. 5
Q. IS THERE EMPIRICAL EVIDENCE DEMONSTRATING THAT 6
REGULATED GAS UTILITIES ARE LESS RISKY BUSINESSES THAN 7
COMPETITIVE UNREGULATED ENTERPRISES? 8
A. Yes. Analyses of stock market indices reflect the comparatively stable and 9
low-risk nature of common stock investments in regulated gas utilities. 10
Q. WHAT STOCK MARKET INDICES HAVE YOU REVIEWED? 11
A. In addition to the beta coefficients that I have used above in the CAPM cost of 12
equity analyses, Value Line also publishes indices of safety, price stability and 13
earnings predictability for a wide variety of firms in all sectors of the economy. 14
As shown in Exhibit___(JW-7), the proxy gas utility companies have an average 15
safety index of 2.00 on a scale from 1 to 5, where 1 is the highest safety rating. 16
Also, price stability is ranked at 100 at the upper end of the scale from 5 to 100, 17
where 100 is the highest stability rating. The average earnings predictability 18
index for these companies is 88.13 on a scale from 5 to 100, and average 19
“financial strength” is B++. By all of these measures, the financial risks of these 20

Direct Testimony of John Wilson
Page 36 of 40
proxy gas utilities are indicated to be below average risk for publicly owned firms 1
in the U.S. economy. 2
VII. FLOTATION COSTS 3
Q. SHOULD A FLOTATION COST ADJUSTMENT BE ADDED TO 4
ENNG’S RETURN ON EQUITY ALLOWANCE? 5
A. No. Flotation costs are the costs of issuing securities. In public stock and 6
bond offerings there can be significant underwriter costs and other related 7
securities issuance expenditures. ENNG is, in fact, compensated for all of 8
its debt flotation costs, as the cost of debt is computed in relation to 9
“proceeds” after deducting issuance costs, and not in relation to the 10
“principal amount” of debt issues. In the case of equity, none of ENNG’s 11
common equity capital involves public offerings, as the Company is wholly 12
owned by National Grid. All of the Company’s equity growth is derived 13
from retained earnings and direct equity funding by National Grid. Thus, 14
ENNG incurs no equity flotation costs. 15
Q. HAS THE COMMISSION ADDRESSED THE COMMON EQUITY 16
FLOTATION COST ISSUE IN OTHER RECENT CASES? 17
A. Yes. This issue was addressed in Order No. 24,473 in PSNH case DE 04-18
177 in which the Commission said: “[T]he Commission has historically 19
denied the inclusion of such an adjustment to the return on equity and we 20

Direct Testimony of John Wilson
Page 37 of 40
find no basis in this record to depart from established practice. We reject, 1
therefore, Dr. Morin’s requested adjustment for flotation costs.” More 2
recently, on May 29, 2009, in Order No. 24,972 in ENNG case DG 08-009 3
the Commission said: “More recently, another attempt to persuade the 4
Commission to adopt a flotation cost was made and rejected in Public 5
Service Company of New Hampshire, supra, 90 NH PUC 230, 250 (2005) 6
on the basis of arguments similar to those made here by Staff and OCA. 7
We find no basis in this record to depart from established practice.” See 8
also Pennichuck Water Works, Inc., 70 PUC 850, 862-863 (1985). The 9
same resolution is appropriate here. 10
11
VIII. ECONOMIC ENVIRONMENT 12
Q. HOW DO YOU RESPOND TO MR. HEVERT’S ARGUMENTS 13
ABOUT THE CURRENT ECONOMIC ENVIRONMENT? 14
A. While today’s economic environment is uncertain, and, arguably, even 15
more uncertain than it has been at some other times, I do not know of any 16
time when the economic environment was certain or settled. Moreover, 17
and more importantly, in times of relative uncertainty, investments in 18
companies like ENNG and National Grid, that sell essential services in 19
monopoly franchised markets and that enjoy legal protections permitting 20

Direct Testimony of John Wilson
Page 38 of 40
price increases in relation to costs even in depressed economic times, are 1
typically viewed as less risky than companies that are more exposed to the 2
vagaries of competitive markets. 3
IX. CONCLUSION 4
Q. PLEASE SUMMARIZE YOUR RECOMMENDATION 5
CONCERNING THE RATE OF RETURN ON COMMON EQUITY 6
CAPITAL AND THE OVERALL RATE OF RETURN 7
APPROPRIATE FOR ENNG’S GAS UTILITY RATES IN THIS 8
CASE. 9
A. As summarized in Exhibit___ (JW-8), there is a substantial range of 10
common equity cost estimates. The average for the constant growth DCF 11
models (including SJI) is 8.1 percent. The multi-stage DCF estimate is 12
9.25 percent; the fundamental DCF estimate is 8.7 percent; and the CAPM 13
indications center around 8 to 9 percent. Overall, these indications suggest 14
a current 8 to 9 percent common equity cost range for ENNG. 15
Q. WHAT IS YOUR SPECIFIC EQUITY RETURN 16
RECOMMENDATION IN THIS CASE? 17
A. As I said at the outset of my testimony, the determination of an appropriate 18
ROE allowance within a zone of reasonableness is a matter of the 19
Commission exercising its discretion in balancing the public interest 20

Direct Testimony of John Wilson
Page 39 of 40
objectives of consumer protection and incentives for adequate service and 1
capital attraction. The empirical evidence and calculations that I have 2
provided define an ROE zone of reasonableness within a range from about 3
8 percent to 9.5 percent for comparable gas utilities. Within this zone of 4
reasonableness, and assuming that revenue decoupling is not adopted, I use 5
9.0 percent for ENNG, together with the previously established capital 6
structure of 50% equity and 50% debt (adjusted to include short term debt 7
at an interest cost of 1.95%), to calculate a recommended return on rate 8
base. 9
Q. WHAT IS THE RETURN ON RATE BASE THAT RESULTS FROM 10
THIS ROE ALLOWANCE AND CAPITAL STRUCTURE? 11
A. Based on my recommended 9.0% ROE allowance, together with a proposed 12
capital structure comprised of 50% equity and 50% debt (including short 13
term debt at an interest cost of 1.95%), the Company’s overall allowed 14
return on its gas utility rate base would be 7.586 percent. 15
Ratio Cost Allowed Return 16
Long Term Debt 42.73% 6.89 2.944% 17
Short Term Debt 7.27% 1.95% 0.142 18
Common Equity 50.00% 9.0% 4.500% 19
Overall Return 7.586% 20
Q. DOES THIS CONCLUDE YOUR DIRECT TESTIMONY? 21

Direct Testimony of John Wilson
Page 40 of 40
A. Yes, it does. 1