k-12 it leadership survey report - cosn.org it leadership 2018.pdf · cosn 2018 k-12 it leadership...
TRANSCRIPT

2018 K-12 IT Leadership
Survey Report
®

CoSN 2018 K-12 IT Leadership Survey Report | 2
Table of Contents Overview...................................................................................................3Introduction ......................................................................................... 3 Top 10 Findings .................................................................................... 4 AbouttheSchoolSystems.........................................................................5Demographics ...................................................................................... 5 ITLeaderProfiles.......................................................................................6Education ............................................................................................ 6 Professional Background ........................................................................ 7 Experience ........................................................................................... 8 Diversity .............................................................................................. 9 TechnologyLeadershipinSchoolSystems...............................................10Titles ................................................................................................. 10 Responsibilities ................................................................................... 11 Purchasing Involvement ....................................................................... 12 Salaries ............................................................................................. 14 DistrictInitiatives....................................................................................14Top Priorities ...................................................................................... 14 Privacy & Security ............................................................................... 15 Digital Instructional Materials ............................................................... 16 1:1 Goals ........................................................................................... 17 Closing the Homework Gap .................................................................. 20 Online Assessment Readiness ............................................................... 21 Open Educational Resources (OER) ........................................................ 22 Interoperability ................................................................................... 24 AboutTechnology...................................................................................25Peer-to-Peer Reviews .......................................................................... 25 Outsourcing ....................................................................................... 26 AboutBudgets.........................................................................................27AboutStaffing.........................................................................................30AboutProfessionalDevelopment............................................................33InClosing.................................................................................................35Summary ........................................................................................... 35 About CoSN ....................................................................................... 35 CoSN Resources ................................................................................. 36 About Our Sponsor .............................................................................. 37 About Our Partners ............................................................................. 37

CoSN 2018 K-12 IT Leadership Survey Report | 3
Overview
Introduction
CoSN has been supporting K-12 IT Leaders since the organization was established 26 years ago.
Since then, technology and its uses have changed dramatically. So, too, have the roles and
responsibilities of the K-12 IT Leader. No longer focused solely on infrastructure issues—the
boxes and switches—IT Leaders now play an integral role in shaping the learning environments
for students as well. To gain a better understanding of the changing responsibilities of IT
Leaders and their educational technology challenges, CoSN launched its first IT Leadership
survey in 2013. That survey had just 35 questions. This year’s survey has over 50. Questions
have been added about new educational technology initiatives, such as Project Unicorn, and
CoSN’s national aspirational leadership certification—Certified Education Technology Leader
(CETL®). Survey respondents are also asked about relevant topics such as Open Education
Resources (OER) and Single Sign-On (SSO). To better understand and address diversity issues,
the survey started to collect data about sex, race, and ethnicity in 2015, establishing a baseline
from which progress can be measured.
The report was undertaken with the support of Dude Solutions. With the help of our partner
MDR, the survey was deployed to 12,781 districts. 41,384 data points from over 478 completed
surveys1 were collected and sorted by our partner Forcast5 Analytics.
Each year, the survey results help to inform CoSN’s programming and initiatives. Year-over-
year and trend results provide unique insights into how the world of the IT Leader is, or is not,
changing. This survey report provides valuable information for CoSN, IT Leaders, school
districts and the organizations that serve and support those districts.
1 The margin of error (4.4) was calculated based on completed surveys. americanresearchgroup.com/moe.html However, responses from incomplete surveys have also been included meaning the margin of error is smaller for some questions.

CoSN 2018 K-12 IT Leadership Survey Report | 4
Top 10 Findings
1. Cyber Security and Broadband/Network Capacity tie as the top priorities for IT Leaders.
2. Budget constraints are ranked the top challenge for the fourth straight year.
3. Integrating technology into the classroom continues to be the most understaffed IT function.
4. Transition from print-to-digital is taking longer than projected.
5. Twice as many districts that are seeking to create a 1:1 (device to student) environment
are providing the device versus using Bring-Your-Own-Device strategies.
6. IT Leaders are increasingly involved in digital content purchasing decisions. For 28% of
districts, digital content cannot be purchased without their approval.
7. IT Leaders are outsourcing less than they used to.
8. Men and Women tend to take different paths to IT Leadership. More than half of women
come to their role with an academic background in education and instruction, as compared
to just a third of men. Whereas men primarily come from a technical background.
9. Significant progress has been made in the transition to digital assessments, with 80%
ready or almost ready to conduct Common Core or statewide high-stakes online
assessments.
10. IT Leaders are predominately White (90%). This is the same percentage as prior years and
shows no progress towards diversifying the field to include more district IT Leaders of color.

CoSN 2018 K-12 IT Leadership Survey Report | 5
About the School Systems
Demographics
As in all prior years, an overwhelming majority of survey respondents work in public schools.
This year they comprised 95%. When segmenting respondents by district size, the breakdowns
are consistent with prior years. A third of all respondents (34%) work in districts with
enrollments of 2,500—9,999. The next largest group (22%) have enrollments of 1,000-2,999,
and 20% support districts with less than 1,000 students. Eleven percent (11%) of respondents
work in the largest districts—more than 50,000 students.
For consistency with the segmentation categories used by the National Center for Education
Statistics (NCES), the new category of “Town” has been added to the breakdown of
respondents by metropolitan status.2 More than a third (36%) of survey respondents work in
Suburban districts, 27% in Rural districts, 18% in Towns, and the smallest percentage of
respondents (outside of 6%“unreported”) work in Urban districts (13%). Since Urban districts
comprise only 5% of all districts by type—they are overrepresented in the survey results.
Conversely, the majority of districts (57%) is Rural so those districts are underrepresented in
the survey.3 However, in terms of enrollments, Rural districts account for only 18% of all
students while Urban districts account for 30%.4
2 https://nces.ed.gov/Programs/EDGE/docs/LOCALE_CLASSIFICATIONS.pdf 3 https://nces.ed.gov/programs/coe/indicator_tla.asp 4 https://nces.ed.gov/programs/digest/d17/tables/dt17_214.40.asp?current=yes
Under 1,000 20%
1,000-2,499 22%
2,500-9,999 34%
10,000-14,999 5%
15,000-49,999 8%
Over 50,000 11%
Responses by Enrollments
CoSN 2018 K-12 IT Leadership Survey Report | 6
IT Leader Profiles
Education
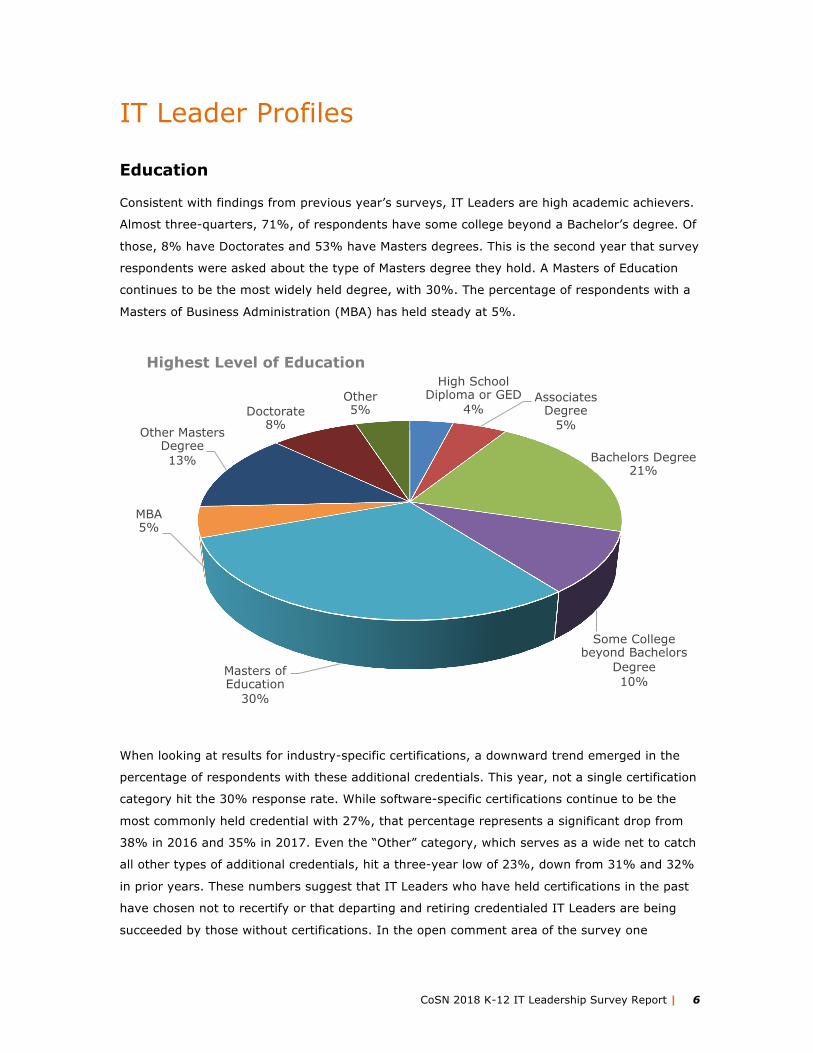
Consistent with findings from previous year’s surveys, IT Leaders are high academic achievers.
Almost three-quarters, 71%, of respondents have some college beyond a Bachelor’s degree. Of
those, 8% have Doctorates and 53% have Masters degrees. This is the second year that survey
respondents were asked about the type of Masters degree they hold. A Masters of Education
continues to be the most widely held degree, with 30%. The percentage of respondents with a
Masters of Business Administration (MBA) has held steady at 5%.
When looking at results for industry-specific certifications, a downward trend emerged in the
percentage of respondents with these additional credentials. This year, not a single certification
category hit the 30% response rate. While software-specific certifications continue to be the
most commonly held credential with 27%, that percentage represents a significant drop from
38% in 2016 and 35% in 2017. Even the “Other” category, which serves as a wide net to catch
all other types of additional credentials, hit a three-year low of 23%, down from 31% and 32%
in prior years. These numbers suggest that IT Leaders who have held certifications in the past
have chosen not to recertify or that departing and retiring credentialed IT Leaders are being
succeeded by those without certifications. In the open comment area of the survey one
High School Diploma or GED
4% Associates
Degree 5%
Bachelors Degree 21%
Some College beyond Bachelors
Degree 10%
Masters of Education
30%
MBA 5%
Other Masters Degree 13%
Doctorate 8%
Other 5%
Highest Level of Education

CoSN 2018 K-12 IT Leadership Survey Report | 7
respondent wrote that they “need help for advocacy on the importance of staff certifications.”
This comment suggests getting financial support for the credential is the problem. The district
leaders responsible for approving expenditures, rather than IT Leaders, may be the cause for
the declining certification rates.
Professional Background
There are two main paths to becoming an IT Leader—a professional background in
“Technology/Technical” (47%) and “Education/Instruction” (42%). However, these percentages
represent shifts from prior year, when a majority of respondents reported they came from an
education background (52%) and only 38% reported having a technical background. This
increase in respondents with technical backgrounds appears to be linked to the increase of
male respondents this year. The majority of men come to their IT Leadership roles with a
background in technology. There were no significant differences from prior year in the
percentages for “Business/Management” (7%)—which roughly correlates with the 5% of
respondents with a MBA—or “Other” with 3%.
0% 5% 10% 15% 20% 25% 30%
A Software Specific Certification (Apple, Microsoft, etc.)
Other
CompTIA
CETL (Certified Education Technology Leader)
CCNA (Cisco Certified Network Administrator)
ITIL (Information Technology Infrastructure Library)
PMP
CISSP (Certified Information Systems Security Professional)
NBPTS National Board Certification (from National Board for Professional Teaching
Standards)
Industry-Specific Certifications

CoSN 2018 K-12 IT Leadership Survey Report | 8
When looking at educational background segmented by sex, separate paths to leadership
become apparent. The majority of women (53%) come to their role with an academic
background in education and instruction, as compared to just a third (34%) men. The majority
of men (56%) but only a minority of women (30%) have technology/technical educational
backgrounds.
Experience
Business/Management
7%
Education/Instruction
42%
Technology/Technical
47%
Other 3%
Primary Professional Background
Business/Management
7%
Technology/Technical
56%
Other 3%
Education/Instruction
34%
Male Respondents
Business/Management
10%
Technology/Technical
30% Other 5%
Education/Instruction
53%
Female Respondents

CoSN 2018 K-12 IT Leadership Survey Report | 9
Experience
As in the prior year, about half of the respondents (49%) have been in their current position for
less than six years. However, the percentage of those with less than one year was 7% in 2017
compared with only 1% this year—the lowest percentage in this category since 2013, when the
rate was 2%. Although a multi-year analysis cannot be done for each category due to different
breakdowns that were used, we can directly compare breakdowns for 10 years and less. The
percentage of respondents in the 1-5 year category has steadily increased from (32%) five
years ago to 48% today. This suggests that new IT Leaders are staying in their positions. .
Years in Current Position
2017
2018
Less than 1 year 7% 1%
1-5 years 43% 48%
6-10 years 21% 23%
11-20 years 23% 21%
More than 20 years 6% 7%
Diversity
Achieving racial and ethnic diversity in IT Leadership continues to be a challenge for school
districts. There are large discrepancies between the make-up of their IT Leadership and the
student population they serve. As in prior years, 90% of survey respondents of IT Leaders are
White, compared to a student body which is 49% White. Only 2% of respondents identified as
Black or African American, while 15% of all students are Black. The ratio is even worse when
looking at ethnicity— 2% of respondents are of Hispanic origin, while Hispanic students account
for more than a quarter (26%) of all students.5
This is the second straight year in which approximately two-thirds of all respondents are male—
70% this year and 64% in the prior year. In 2015, the first year the survey collected
demographic data by sex, 54% of respondents were male. So while the majority of
respondents has consistently been male, the size of that majority has increased. While further
analysis is necessary, this data seems to suggest that IT Leadership is becoming more male
dominated. However, even this smaller percentage of women compares favorability to the
percentage of women in IT Leadership roles in the business sector, where according to a recent
industry study, only “9% of senior IT leadership are women.”6
5 https://eddataexpress.ed.gov/state-report.cfm?state=US&submit.x=34&submit.y=12&submit=View 6 https://www.harveynash.com/usa/news-and-insights/HarveyNashKPMGCIOSurvey2017_US.pdf

CoSN 2018 K-12 IT Leadership Survey Report | 10
When looking at breakdowns by district size, the female/male ratios tend to match the general
survey respondent rate of 30% female and 70% male. Proportionally speaking, women and
men are fairly equally represented in districts of all sizes. The only exception is in the largest
districts—over 50,000 students—where men are disproportionately clustered. These positions
tend to be the most highly paid in the sector with more status and responsibility for a large
staff.
Under 1,000
1,000 to 2,499
2,500 to 9,999
10,000 to
14,999
15,000 to
49,000
Over 50,000
Female 28% 25% 29% 31% 30% 4%
Male 72% 75% 71% 69% 70% 96%
Technology Leadership in School Systems
Titles
A clear majority (57%) indicated the CIO/CTO represents both IT and Ed Tech on the Executive
Team—a CoSN best practice. The next most common scenario, a distant second with 19%, was
the CIO/CTO that represents both functional areas but reports to a member of the Executive
Team. The third most common scenario where IT and Ed Tech report to different members of
the Executive Team (13%). Much less common are scenarios where IT and Ed Tech have
different levels of representation on the Executive Leadership Team. Only 2% indicate that IT
reports to the CIO/CTO and sits on the executive team (while their Ed Tech counterpart reports
to another Executive Team member). Still fewer, only 1%, report the reverse—Ed Tech reports
to the CIO/CTO and sits on the executive team (while their IT counterpart reports to another
Executive Team member). The category for “other” reporting scenarios accounts for the
remaining 8%.

CoSN 2018 K-12 IT Leadership Survey Report | 11
Responsibilities
Over the six years CoSN has conducted this survey, respondents have been asked about their
primary job responsibility. Each year the answer receiving the highest response rate is “Both
Instructional and Administrative Tech.” It has consistently been the majority response, with
almost three-quarters (74%) this year. However, as one respondent commented:
“Replacing Technology Directors who have both an educational background and IT
skillset is difficult in rural districts.”
1% 13%
2%
57%
19%
8%
IT and Ed Tech on the Executive Leadership Team
Ed Tech reports to the CIO and is on Executive Team, but IT reports to a different member of the Executive Team
IT and Ed Tech are split and report to different members of the Executive Team
IT reports to CIO and is on Executive Team, but Ed Tech reports to a different member of the Executive Team
The CIO/CTO represents both and is on the Executive Team
The CIO/CTO represents both IT and Ed Tech, but reports to a member of the Executive Team
Other

CoSN 2018 K-12 IT Leadership Survey Report | 12
Another survey respondent shared this perspective:
“In larger school districts, the complexities of networks, virtualization, compliance with
FERRA/HIPAA/SOX/PCI and other laws; and the amount of devices running on these
networks provide a good argument to separate the instructional tech from the
Operational Tech. While they must work together, the function is separate.”
* 2017 and 2018 totals more than 100% due to rounding of the nearest whole percent.
Purchasing Involvement
The IT Leader’s role in digital content purchasing decisions is increasing. Eighty-six percent
(86%) of respondents report having at least moderate involvement in their district’s decisions
to purchase digital content, as compared to 75% in the prior year. Correspondingly, the
categories of “not involved” decreased from 5% to 1% and “low input” decreased from 20% to
13%. The “Decision-Maker/content cannot be purchased without my approval” response had
the most significant year-over-year change, increasing from 16% in 2017 to 28% this year. In
2016, only 8% of respondents indicated they made the final decision. This double-digit increase
over three years suggests a growing realization that the purchase of digital content needs to
take into account considerations beyond the quality of its pedagogy and its price. Technical
aspects need to be evaluated to ensure that digital content can deliver on its promise.
Responsibilities
2013
2014
2015
2016
2017*
2018*
Instructional Tech 2% 6% 6% 8% 11% 4%
Administrative Tech 8% 10% 10% 10% 10% 11%
Both Instructional & Administrative Tech 83% 77% 55% 65% 61% 74%
Specific Department, Division, or School 2% 2% 13% 8% 7% 4%
Other 5% 6% 16% 9% 12% 8%

CoSN 2018 K-12 IT Leadership Survey Report | 13
While the overwhelming majority of IT Leaders have some responsibility for purchasing digital
content, their involvement varies considerably according to the type of content being purchased.
More than three-quarters of respondents (79%) are involved in the purchase of productivity
tools—the category with the highest involvement. However less than a third (32%) are involved
in purchasing decisions for Teaching Aids. The overall ranking of most-involved to least-
involved has been consistent year-over-year. Productivity Tools and Content Creation Tools,
this year with 79% and 69% respectively, have always ranked first and second. Supplemental
digital content, this year with 48%, continues to rank a distant third. It is important to note
that Core Curriculum and Formative Assessments show the most significant increases over the
three-years. Districts purchasing digital content for Core Curriculum and Formative
Assessments have recognized that IT Leaders need to play a larger role in assessing the
products in those areas.
Digital Content
2016
2017
2018
Core Curriculum 28% 38% 42%
Supplemental 38% 48% 48%
Formative Assessments 28% 38% 44%
Literacy Aids 24% 35% 35%
Library & Reference Tools 39% 47% 43%
Teaching Aids 28% 33% 32%
Productivity Tools 67% 68% 79%
Content Creation Tools 57% 59% 69%
Decision-Maker / content cannot be purchased without my approval
28%
Heavy / a key influencer
33%
Low / provide input when asked
13%
Moderate / part of a team that
evaluates 25%
None / not involved
1%
Involvement in Purchase of Digital Content

CoSN 2018 K-12 IT Leadership Survey Report | 14
Salaries
Almost a quarter of all respondents (23%) selected “prefer not to provide” when asked about
their salary. Therefore, a clear conclusion that can be made with salary data is that a significant
minority of IT Leaders don’t like to talk about how much money they make. The reason for the
steep increase—from 2% or 3% in all prior years to 23% this year —is likely the result of the
change in question constuction and survey deployment. This year, respondents were asked to
enter an exact salary amount instead of selecting a range. Also, surveys were sent to specific
IT Leaders in each district and responses were limited to one per district. This modification
enhanced data quality but eliminted anomininity. (NOTE—CoSN does not see any personally
identifiable information or have access to it for preparing this report. Data is only provided in
the aggregate.) While data was collected for each salary range, the picture it paints is blurred
because of the almost one quarter of respondents who opted-out.
Salary 2013 2014 2015* 2016 2017 2018
Under $70K 30% 24% 30% 24% 29% 15%
$70K-99,999 36% 35% 39% 35% 32% 29%
$100K-129,999 26% 27% 23% 26% 25% 22%
$130K-159,999 5% 10% 6% 8% 8% 9%
$160K-200K 1% 1% 1% 4% 3% 2%
More than $200K Less than 1% Less than 1% Less than 1% Less than 1% Less than 1% Less than 1%
Did not provide 2% 3% 2% 3% 2% 23% * 2015 totals more than 100% due to rounding of the nearest whole percent.
District Initiatives
Top Priorities
Mobile learning, the number one priority in 2017 and ranked second or third since 2014, failed
to make the top three in 2018. This year there is a tie for number one— Broadband & Network
Capacity and Cyber Security. This reflects a jump of one place for Broadband, which ranked
second in the prior year. Cyber Security jumped two places from its third place rank. Breaking
into the top three for the first time is Data Driven Instruction & Decision Making. All three of
these priorities are connected and make it clear that data is a district priority—accessing,
managing, leveraging, and keeping it secure.

CoSN 2018 K-12 IT Leadership Survey Report | 15
2013 2014 2015 2016 2017 2018 1 BYOD Assessment
Readiness Assessment Readiness
Broadband & Network Capacity
Mobile Learning
Broadband & Network Capacity
Cyber Security *
2 Assessment Readiness
Mobile Learning
Wireless Access
Wireless Access
Broadband & Network Capacity
3 Broadband Access
Wireless Access
Mobile Learning
Mobile Learning
Cyber Security
Data Driven Instruction & Decision Making
*Tie for number one
Privacy & Security
Cyber Security’s leap to a number one priority does not come as a surprise. A recent study on
network security across business sectors found that “education is the most vulnerable
vertical.”7 In Higher Education, Information Security has been ranked as the number one issue
for IT Leaders for the past three years.8 At the time of this writing, there have been over 300
K-12 cyber security incidents reported since 2016, “resulting in the disclosure of personal
information, the loss of taxpayer dollars, and the loss of instructional time.” 9 The threats are
real and the consequences are severe when it comes to data breaches or the misuse of
students’ personally identifiable information (PII). When asking IT Leaders to rate the
importance of privacy and security of student data, 68% rated it as more important than the
prior year, including 30% who rated this issue as “much more important.” What is most
revealing is the response rate for “less important”—zero.
7 Global Application & Network Security Report 2016-2017, radware https://www.radware.com/assets/0/314/6442478110/01f31b9e-6dfb-49de-86fe-5dd0954bdeac.pdf 8 https://www.educause.edu/research-and-publications/research/top-10-it-issues-technologies-and-trends/2018 9 https://www.edtechstrategies.com/k-12-cyber-incident-map/

CoSN 2018 K-12 IT Leadership Survey Report | 16
Digital Instructional Materials
In 2015, survey respondents were asked to project the degree to which print instructional
materials would be replaced by digital materials over the next three years. This year, we asked
to what degree that transition from print to digital had actually taken place. Looking at the
extreme ends the spectrum—print-only and digital-only—the projections were on target. Very
few districts expected to be, or actually are, print-only (less than 1%) .While no districts
reported being digital-only, less than 3% of districts expected to be at this point. Projections for
a 50/50 ratio of print/digital were roughly in line as well. Three years ago, 34% of survey
respondents projected that their districts would be 50% digital in 2018, compared to 29% who
reported they are 50% digital in 2018. The greatest discrepancy between expectations and
attainment was the degree to which the use of print materials persists. Three times as many
districts (54%) are primarily print-based than were projected (16%). Three years ago, 84% of
respondents expected instructional material to be at least 50% digital. Three years later, only
43% of respondents reported that is the case. While districts are transitioning to digital
materials, it is not at the pace predicted. A possible explanation could be the lack of
interoperability between digital content and district content platforms. As noted earlier, IT
Leaders are playing a larger role in digital content purchasing decisions, with the most growth
in core curriculum. Perhaps their greater involvement is a result of issues that arose when
digital materials were adopted without technical vetting.
Much more important than it
was last year, 30%
No change. Same level of
importance as it was last year,
32% Somewhat less
important than it was last year, 0%
Somewhat more important than it was last year ,
38%
Privacy And Security Of Student Data

CoSN 2018 K-12 IT Leadership Survey Report | 17
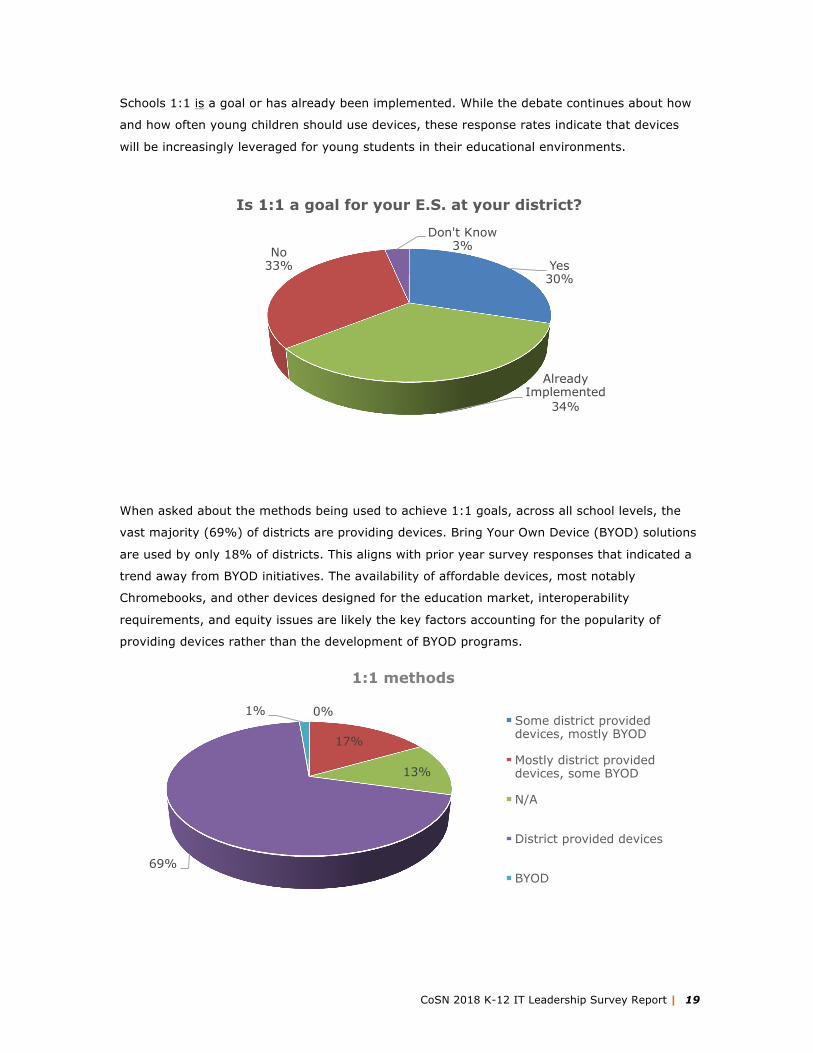
1:1 Goals
Technology can enable a personalized learning environment for individual students. 1:1
initiatives support personalized learning goals. In this survey, 1:1 was defined as “the approach
that every child has an assigned device whether this is provided by a district program or BYOD.”
Respondents were asked about their districts’ 1:1 goals for each school level. A majority of
respondents indicated that for every level, 1:1 is a current goal or is a goal already achieved.
29%
0%
1%
2% 54%
14%
Print Instruction Materials Replaced By Digital
About 50% of our resources are digital All of our resources are digital All of our resources are still print Don’t know
Some of our resources are now digital The majority of our resources are digital
0% 10% 20% 30% 40% 50% 60% 70% 80% 90%
Yes/Already Implemented
No
Don't Know
1:1 Goals by School Level
ES MS HS

CoSN 2018 K-12 IT Leadership Survey Report | 18
Middle Schools have the highest rate of 1:1 implementation with 53%. Combined with the 30%
of those who indicated 1:1 is a goal for their district, Middle School implementation of 1:1 can
be expected to grow to 83% in the near future.
High School 1:1 responses closely mirror those of Middle School, with 47% implementation
rates and 32% citing 1:1 as a goal. These numbers combine for a 79% response rate for 1:1 as
a goal for High Schools.
Elementary Schools had the least interest in 1:1. A third of respondents (33%) reported that
1:1 was not a goal for their Elementary schools, compared to response rates of 15% and 13%
respectively for their Middle and High Schools. However, for the majority (64%) of Elementary
Yes 30%
Already Implemented
53%
No 15%
Don't Know 2%
Is 1:1 a goal for your M.S. at your district?
Yes 34%
Already Implemented
51%
No 14%
Don't Know 1%
Is 1:1 a goal for your H.S. at your district?
CoSN 2018 K-12 IT Leadership Survey Report | 19
Schools 1:1 is a goal or has already been implemented. While the debate continues about how
and how often young children should use devices, these response rates indicate that devices
will be increasingly leveraged for young students in their educational environments.
When asked about the methods being used to achieve 1:1 goals, across all school levels, the
vast majority (69%) of districts are providing devices. Bring Your Own Device (BYOD) solutions
are used by only 18% of districts. This aligns with prior year survey responses that indicated a
trend away from BYOD initiatives. The availability of affordable devices, most notably
Chromebooks, and other devices designed for the education market, interoperability
requirements, and equity issues are likely the key factors accounting for the popularity of
providing devices rather than the development of BYOD programs.
Yes 30%
Already Implemented
34%
No 33%
Don't Know 3%
Is 1:1 a goal for your E.S. at your district?
0%
17%
13%
69%
1%
1:1 methods
Some district provided devices, mostly BYOD
Mostly district provided devices, some BYOD
N/A
District provided devices
BYOD

CoSN 2018 K-12 IT Leadership Survey Report | 20
With the same response rate (39%) as the prior year, the most common district policy
regarding students’ use of personal devices in school is allowing teachers to decide about their
use at the classroom level. The next most common policy, with 28%, is allowing “students to
use their devices before, between, and after classes,” an increase from 20% from the prior
year. Only a tenth of districts have policies completely banning devices, slightly outpacing
districts (7%) who actively encourage their students to bring their own devices. When results
were segmented by metro status, Urban districts were the least likely to encourage BYOD
(15%) compared with Suburban districts (41%). However, Urban districts were also least likely
to ban devices (7%) as compared to Suburban districts with 43%.
Closing the Homework Gap
Digital Equity/lack of broadband access outside of school for learning, often referred to as the
homework gap, is a concern for 70% of all respondents, with a third (32%) rating the issue as
“very” or “extremely” important. However, roughly the same percentage of respondents (30%)
indicates the issue is “not at all” important. The relatively large size of that percentage made a
bit more sense when segmenting the responses by metro status. Two-thirds (66%) of those
that are not concerned with homework gap issues are in Towns (22%) and Suburban districts
(44%) as compared to just 7% of Urban districts.
39%
28%
16%
10%
7%
Policies regardingng students' use of personal devices in school
Teachers to determine if BYOD/BYOT is allowed in their class
Primarily allow students to use their devices before, between, or after classes
The principal of the school determines the overall BYOD/BYOT policy
Student devices are banned
Students are encouraged to bring their own devices

CoSN 2018 K-12 IT Leadership Survey Report | 21
Online Assessment Readiness
The vast majority (80%) of respondents report their districts are ready or almost ready to
conduct online assessments. This is a complete reversal from 2013 when the Assessment
Readiness Survey conducted by the Partnership for Assessment of Readiness for College and
Careers (PARCC) found that 80% of schools would not meet the requirements for online
assessments.10 Unlike the print-to-digital transition, which has been slower than expected, the
transition to digital assessments has been swift. It is important to point-out that “assessment
readiness” was a top-ranked priority for several years and the number one priority for two
years running—a strong indicator that once key goals are identified, districts know how to
achieve them. However, resolve alone is not enough. As one respondent put it—
“…the current financial climate does not allow the full support needed to implement all that we want to implement.”
10 www.parcconline.org
Extremely 13%
Very 19%
Moderately 6% Slightly
32%
Not at All 30%
Importance of Digital Equity Outside of School

CoSN 2018 K-12 IT Leadership Survey Report | 22
Digital Open Educational Resources (OER)
The importance of digital OER has consistently been recognized by a large majority of districts
since this question was first asked in 2015. This year 73% of respondents reported that OER is
important to their district’s digital content strategy. However, this rate indicates a slight dip in
the degree of importance, compared to 2017 and 2016, which had rates of 79% and 78%
respectively. While the “somewhat important” category has been fairly consistent—45% this
year, 44% in 2017, and 41% in 2016—the response rates have been creeping up and taking
percentage points from the “very important” category and the “extremely important” categories.
The 5% rate for “extremely important” is less than half of the rate (11%) of the two previous
years. These rates suggest that digital OER may be becoming less important, an unexpected
finding, especially in light of the recent federal push and the number of organizations
promoting OER use. One factor that might be skewing results is 17% of respondents who “don’t
know” how important OER is to their district’s digital content strategy, almost twice the 9% of
the prior year. This result in itself might suggest that districts are in the process of reevaluating
the importance of digital OER.
13%
67%
9% 8% 3%
Ready to implement Common Core or statewide high-stakes online assessments
Almost ready for online assessments
Fully prepared for online assessments
Half-way to online assessments
Just began to prepare for online assessments
Not conducting assessments online

CoSN 2018 K-12 IT Leadership Survey Report | 23
When looking at the current use of digital OER, the majority (59%) of respondents indicate that
proprietary materials are still the primary source of digital content. However, only 7% report
that propriety materials are the only digital content indicating that 93% of districts are using
digital OER to some extent. More than a quarter (29%) report that digital OER comprise about
50% of all digital content. This 29% appears to directly correlate with the 29% of respondents
who rated digital OER either “very” or “extremely” important to their district’s digital content
strategy.
Extremely important
5%
Very important 23%
Somewhat important
45%
Not important 10%
Don't know 17%
OER Importance to digital content strategy
59% 29%
7% 5%
0%
OER replaced proprietary digital content
Proprietary materials are the primary digital content
OER and proprietary digital materials are about 50/50
Proprietary materials are the only digital content
OER are the primary digital content
OER are the only digital content

CoSN 2018 K-12 IT Leadership Survey Report | 24
Interoperability
A fifth of respondents (20%) indicate that their districts have fully implemented Single Sign-On
(SSO), with 53% reporting SSO as partially implemented. With a combined rating of 73% in
both categories, SSO ranks as the most implemented of the four interoperability initiatives in
the survey. Data Interoperability is the second most popular initiative with a 70%
implementation rate. Content Interoperability is third with 61% and just one percentage point
behind Data Dashboards is a very close fourth with 60%. We also asked about districts’
awareness of Project Unicorn, a new initiative that advocates for schools to sign an
interoperability pledge. Over a quarter (26%) of respondents noted an awareness of this early
effort.
InteroperabilityInitiative
FullyImplemented
PartiallyImplemented Planning Don'tKnow Notat
AllSingleSign-On 20% 53% 12% 2% 13%
ContentInteroperability 9% 53% 13% 11% 13%
DataInteroperability 10% 60% 12% 9% 9%DataDashboards 13% 47% 19% 7% 13%
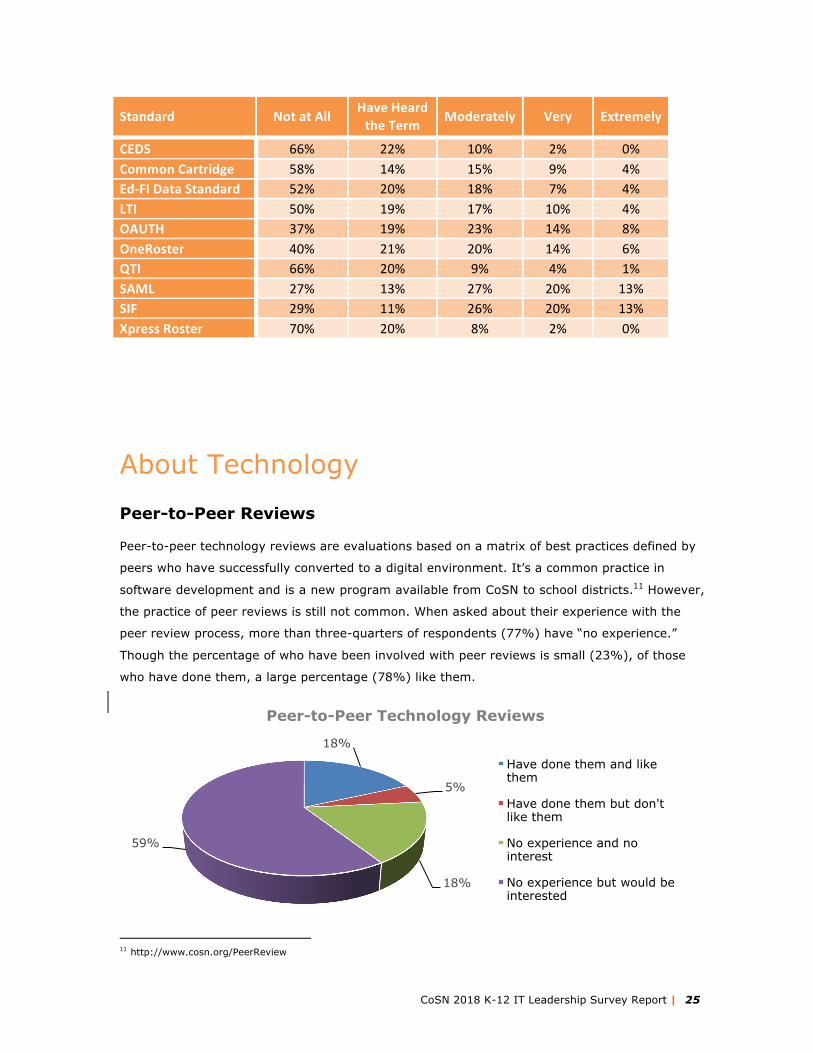
When asked to “rate the degree to which you are familiar with the following technical
standards,” respondents indicated they were most aware of SAML and SIF, with a majority
reporting they are moderately to extremely familiar with them, 60% and 59% respectively.
When adding those who have at least “heard the term,” SAML’s rates increase to 73% and
SIF’s to 71%. As both standards are at least a decade-old, it is not unexpected that SAML and
SIF would be well-recognized. OAUTH, another standard that is more than a decade old, is the
third most recognized standard with 63% of respondents having at least heard the term.
OneRoster, a newcomer released just three years ago, is the fourth most recognized standard
with 60%. The degree to which IT Leaders are familiar with this standard, despite its relatively
short life, is likely the result of the degree to which rostering is an issue for districts. Xpress
Roster, another new standard also designed to address rostering, is less well known with 30%.
Results indicate that, to a significant degree, respondents are unfamiliar with the various
technical standards. A majority of respondents did not recognize half of the standards on the
survey—not even by name. Only the top five most recognized standards (SAML, SIF, OAUTH,
OneRoster, and LTI), avoided that result. While IT Leaders are not expected to have a
developer’s understanding of standards, some degree of familiarity will be required as districts
move away from single-vendor solutions.
CoSN 2018 K-12 IT Leadership Survey Report | 25
18%
5%
18%
59%
Peer-to-Peer Technology Reviews
Have done them and like them
Have done them but don't like them
No experience and no interest
No experience but would be interested
Standard NotatAll HaveHeardtheTerm Moderately Very Extremely
CEDS 66% 22% 10% 2% 0%CommonCartridge 58% 14% 15% 9% 4%Ed-FIDataStandard 52% 20% 18% 7% 4%LTI 50% 19% 17% 10% 4%OAUTH 37% 19% 23% 14% 8%OneRoster 40% 21% 20% 14% 6%QTI 66% 20% 9% 4% 1%SAML 27% 13% 27% 20% 13%SIF 29% 11% 26% 20% 13%XpressRoster 70% 20% 8% 2% 0%
About Technology
Peer-to-Peer Reviews
Peer-to-peer technology reviews are evaluations based on a matrix of best practices defined by
peers who have successfully converted to a digital environment. It’s a common practice in
software development and is a new program available from CoSN to school districts.11 However,
the practice of peer reviews is still not common. When asked about their experience with the
peer review process, more than three-quarters of respondents (77%) have “no experience.”
Though the percentage of who have been involved with peer reviews is small (23%), of those
who have done them, a large percentage (78%) like them.
11 http://www.cosn.org/PeerReview
CoSN 2018 K-12 IT Leadership Survey Report | 26
Outsourcing
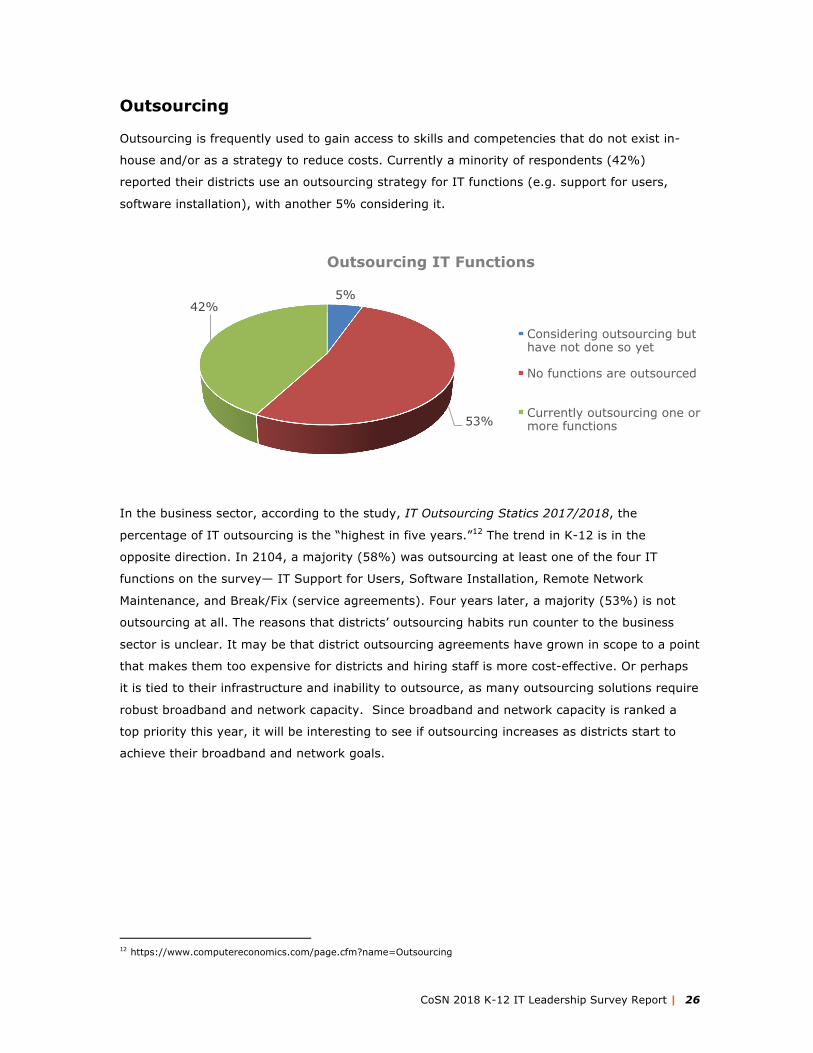
Outsourcing is frequently used to gain access to skills and competencies that do not exist in-
house and/or as a strategy to reduce costs. Currently a minority of respondents (42%)
reported their districts use an outsourcing strategy for IT functions (e.g. support for users,
software installation), with another 5% considering it.
In the business sector, according to the study, IT Outsourcing Statics 2017/2018, the
percentage of IT outsourcing is the “highest in five years.”12 The trend in K-12 is in the
opposite direction. In 2104, a majority (58%) was outsourcing at least one of the four IT
functions on the survey— IT Support for Users, Software Installation, Remote Network
Maintenance, and Break/Fix (service agreements). Four years later, a majority (53%) is not
outsourcing at all. The reasons that districts’ outsourcing habits run counter to the business
sector is unclear. It may be that district outsourcing agreements have grown in scope to a point
that makes them too expensive for districts and hiring staff is more cost-effective. Or perhaps
it is tied to their infrastructure and inability to outsource, as many outsourcing solutions require
robust broadband and network capacity. Since broadband and network capacity is ranked a
top priority this year, it will be interesting to see if outsourcing increases as districts start to
achieve their broadband and network goals.
12 https://www.computereconomics.com/page.cfm?name=Outsourcing
5%
53%
42%
Outsourcing IT Functions
Considering outsourcing but have not done so yet
No functions are outsourced
Currently outsourcing one or more functions

CoSN 2018 K-12 IT Leadership Survey Report | 27
2014 2015 2016 2017 2018 No functions Outsourced
32%
44%
47%
49%
53%
Considering Outsourcing
9%
8%
7%
6%
5%
Currently Outsourcing one or more
functions
59%
48%
46%
45%
42%
When districts do outsource, “Remote Network Maintenance” with 52% and “Break/fix (service
agreements)” with 46% are by far the most popular. “Other” rounded out the top three with
34%. The functions least likely to be outsourced were “IT support for Users” (23%) and
“Software Installation” with 16%%.
About Budgets
For the first time on the survey, respondents were asked to provide their current year district-
level technology budget. Not surprisingly, the smallest percentage of respondents report the
largest budgets—3% work in districts with budgets over the $10 million mark. The next
smallest percentage (16%) represents those working with the smallest budgets—$100,000 or
less. About a fifth of respondents (19%) report budgets between $500,000 and $1,000,000.
The remaining districts are split evenly with 31% with budgets in the $100,001 —$500,000
range and 31% with budgets between $1 million and $10 million.
16%23%
34%46%
52%
0% 10% 20% 30% 40% 50% 60%
Outsourced IT Functions
Remote network maintenance Break/fix (service agreements)
Other IT support for users
Software installation

CoSN 2018 K-12 IT Leadership Survey Report | 28
For a large majority of respondents (70%), their district’s IT budget enables them to “meet the
overall expectation of the school board/district leaders.” However, about half (53%) indicated
that their budget does not “allocate enough financial resources to hire the personnel needed to
support the tech assets that have already been purchased.” Respondents have a number of
strategies to overcome their budget issues. The most common strategy, cited by 79% of
respondents, is to apply for funds available through the 20-year-old E-Rate program. The
second most common strategy and the only other strategy employed by a majority of districts
(60%) is “delaying replacement or deferring maintenance/upgrade contracts.” Half of
respondents (50%) intend to use grants, making it the third most popular plan, followed closely
by “reduction in technology purchases” with 47%.
16%
31%
19%
31% 3%
Technology Budget
0-$100,000
$100,001 -$500,000
$500,001 -$1,000,000
$1,000,0001-$10,000,000
$10,000,001 -$500,000,00
0% 10% 20% 30% 40% 50% 60% 70% 80% 90%
Reduction in staff
Other
Outsourcing
Reduced energy use
Bonds
Network or server consolidation
Vendor contract negotiations
Reduction in technology purchases
Grants
Delaying replacement or deferring
E-Rate funds
Plan to Overcome Budget Issues

CoSN 2018 K-12 IT Leadership Survey Report | 29
When asked to identify their “top 3 challenges to planning and implementing technology
enabled environments,” respondents cited the usual suspects. “Budgets constraints and lack of
resources” continue to be ranked as the number one challenge for districts. It has been the top
challenge four years running. It has ranked as the number one challenge for five of the six
years of the survey’s existence, missing a full sweep only by dropping to the number two slot in
2014. This year’s number two challenge—“Relevant training and professional development
unavailable”— is the same as the prior year as was the number three challenge—“Existence of
silos in the district, which make it difficult to work together on technology planning.” These two
challenges are not strangers in the top three challenges list.
Top 3 Challenges
2013
2014
2015
2016
2017
2018
#1
Budget constraints and lack of resources
Changing the culture of teaching to student-centered*
Budget constraints and lack of resources
Budget constraints and lack of resources
Budget constraints and lack of resources
Budget constraints and lack of resources
#2
Changing the culture of teaching to student-centered
Budget constraints and lack of resources
Relevant training and professional development unavailable
Existence of silos in the district, which make it difficult to work together on technology planning
Relevant training and professional development unavailable
Relevant training and professional development unavailable
#3
Breaking down silos within the district
Breaking down silos within the district
Existence of silos in the district, which make it difficult to work together on technology planning
Lack of vision/ support from senior district leadership
Existence of silos in the district, which make it difficult to work together on technology planning
Existence of silos in the district, which make it difficult to work together on technology planning
* This answer option was re-worded from 2013/2014, “Changing the culture of teaching & learning to a student-centered environment with ubiquitous computing (1:1 student to device or better),” into two options in 2015—“Lack of support for creating personalized learning environments” and “A technology-adverse culture.”

CoSN 2018 K-12 IT Leadership Survey Report | 30
About Staffing
For more than two-thirds of respondents (69%), staffing levels are unchanged from the prior
year. This mirrors the results of 2017 and 2016 with “stayed the same” rates of 66% and 62%
respectively, indicating staffing is fairly stagnant. A fifth of respondents (20%) had staffing
increases and 11% experienced a decrease.
Two-thirds (67%) of respondents indicated they have eight or fewer technicians in their
district—34% with 4-8 technicians and 33% with three or less. A tenth (10%) have between
and 9-15 technicians, 11% between 16-20, and respondents with more than 20 technicians in
their district comprise the remaining 8%. As expected, it is apparent that districts with lower
enrollments tend to have fewer technicians and districts with larger enrollments tend to have
more. However, it does not break down that way for every district. While the 84% of
respondents with more than 20 technicians are in districts with enrollments greater than
10,000, 16% are in districts with fewer students (2,500-9,999). Conversely, while an
overwhelming majority (89%) of respondents with 4-8 technicians are in districts with less than
10,000 students, 11% of districts with more than 10,000 need to make do with the same
number of technicians. It is possible that those districts have less tech to support, using
computer labs versus 1:1 scenarios, for example. Or perhaps those districts with low
technician-to-student ratios tap their students for help with a student-run tech team. As one
respondent suggested, “Do you use students as help?” is a question worth asking in next year’s
survey.
Decreased, 11%
Stayed the same, 69%
Increased, 20%
Size of IT Staff

CoSN 2018 K-12 IT Leadership Survey Report | 31
Under 1,000
1,000 to 2,499
2,500 to 9,999
10,000 to
14,999
15,000 to
49,999
Over 50,000
0-3* 40% 41% 20% 0% 0% 0%
4-8 7% 15% 67% 6% 4% 1%
9-15 2% 0% 44% 19% 35% 0%
16-20 0% 0% 55% 0% 45% 0%
More than 20 0% 0% 16% 16% 56% 12%
* Row does not equal 100% due to rounding of the nearest whole percent.
Two-thirds (65%) of respondents work in districts that support 7,500 devices or less. That
group breaks down fairly evenly across the three subcategories with 22% supporting 1,000 or
fewer devices, 23% supporting 1,001-3,000, and 20% supporting 3,001-7,500. However, a
fifth (20%) of all respondents are supporting more than 15,000 devices. It is important to note
these figures only tell part of the story, as districts need support beyond that of their devices.
As one respondent stated:
“Technicians support all technology including document cameras, interactive whiteboards/pads, projectors, unified communications, etc.”
As on prior surveys, respondents were asked how they felt about their staffing levels for
various functions. This year an answer option was added for “over-staffed.” It was only selected
twice, by 1% of respondents—for supporting needs of the district and integrating technology in
0-1,000 22%
1,001-3,000
23%
3,001-7,500 20%
7,501-10000
8%
10001-15000
7%
More than 15000 20%
Devices Supported by Districts

CoSN 2018 K-12 IT Leadership Survey Report | 32
the classroom—and both times 1% was the result of rounding-up to the nearest whole percent.
While the majority of respondents indicate their districts have insufficient staffing across every
IT activity on the survey, the rates in every category improved over the prior year. When
adding response rates for “adequate but we are very busy” to the “matched to needs”
assessment, a brighter picture of staffing emerges with every activity reaching a majority. The
largest percentages are in “Install IT applications” and “Maintain IT applications” each with
88%. “Effectively support the needs of the district,” “Meet your department’s yearly objectives,”
and “Maintain systems adequately” all with 80%, have the next largest percentage. “Plan for
new technology” has 73% and “implement new technology” has 71%. The activity with the
lowest combined rate is “Integrate technology into the classroom” with 57%. Correspondingly,
it has the highest percentage of respondents (43%) indicating they are “stretched too thin and
can’t get to critical areas.” For three years running, “integrate technology into the classroom”
continues to be, by a significant margin, the most understaffed IT activity. Implementing new
technology (29%) and plan for new technology (27%) round out the bottom three activities
where IT Leaders can’t get to critical areas. This chart provides insight into tech staffing levels
issues, as a wide variety of skill sets is needed to properly support districts. One respondent
highlighted this issue in a comment:
“ …we have enough FTE but their job duties don’t align to the district needs. For example, I have more technicians than I need to maintain adequate support to address service requests but I do not have specialization in the areas of server support or network systems support.”
Activity/Responsibility
Wearestretched
toothinandcan'tgettocriticalareas
Staffingisadequatebutweareverybusy
Staffingismatchedto
needsOver-staffed
Effectivelysupporttheneedsofthedistrict/school* 20% 58% 22% 1%
Implementnewtechnology 29% 54% 17% 0%InstallITapplications* 11% 53% 35% 0%Integratetechnologyintotheclassroom 43% 39% 18% 1%MaintainITapplications 12% 57% 31% 0%Maintainnetworksystemsadequately* 19% 48% 32% 0%Meetyourdepartment'syearlyobjectives* 19% 55% 25% 0%
Planfornewtechnology 27% 50% 23% 0%
Respondents report that the majority (60%) of IT departments are spending the bulk of their
time reacting to technical problems (as opposed to working in a proactive mode). Over a
* Row total does not equal 100% due to rounding to the nearest whole percent.

CoSN 2018 K-12 IT Leadership Survey Report | 33
quarter of respondents (27%) indicated that more than 75% of their department’s workload is
reacting to technical problems. This is an increase from prior year rate of only 14%—almost
double the rate.
About Professional Development
In light of Professional Development’s ranking as a top challenge for IT Leaders, it is not
surprising that a majority (58%) consider the Certified Education Technology Leadership (CETL)
credential to be important. Less than a tenth (9%) of respondents consider it unimportant.
However, when asked to “rate the value” of CETL, a third of respondents (33%) don’t know
how to value the credential. A respondent who had attained the CETL credential might provide
some insight into why so many respondents don’t know how to rate the value of the
certification:
“The reason I answered “unsure” about the value of the CETL certification is that I am not sure how many outside our specific association know about it or acknowledge its value.”
This response suggests the need to increase awareness of what the CETL credential signifies
about the IT Leaders who earn it.
4% 8%
28%
33%
27%
Reacting to Technical Problems
0-10%
11-25%
26-50%
51-75%
76-100%

CoSN 2018 K-12 IT Leadership Survey Report | 34
For the third year, survey respondents were asked “Does your PD budget provide additional
support for emerging leaders with 5 years or less experience in K-12 educational technology?”
The majority of respondents (55%) indicated some type of additional support is provided.
Funding to attend professional conferences was the most common type of support with 39%,
followed closely by access to online PD with 37%. The least-funded type of additional support is
certification and credentials with 26%.
13%
19%
33%
26%
9%
Certified Education Technology Leadership (CETL)
Extremely important
Very important
Don't know
Somewhat important
Not important
0% 5% 10% 15% 20% 25% 30% 35% 40% 45% 50%
No additional support provided
Funding for online courses or other online professional development
Funding for membership in a professional association
Funding for consultant/training
Funding for Certification/Credentials
Funding to support face-to-face professional learning at conferences
Additional Support for Emerging Leaders

CoSN 2018 K-12 IT Leadership Survey Report | 35
In Closing
Summary
Over the past six years, the CoSN K-12 IT Leadership Survey has provided important
information about the environment in which IT Leaders work and the challenges they face. The
role of IT Leaders is changing and expanding. Increasingly IT leaders are involved in decisions
regarding the purchase of curriculum materials and recognized as a valued member of the
district leadership team. At the same time, IT Leaders face new challenges, especially in areas
relating to student data privacy and security, while they continue to address the persistent
problems of insufficient budgets and lack of resources. To help IT Leaders address the various
issues of their districts, CoSN has created resources such as the Privacy Toolkit and TLE seal
and, as well as professional development programs and the CETL certification. Now more than
ever, CoSN is committed to working with IT Leaders— helping them address the challenges
posed by today’s educational environments
About CoSN
CoSN (the Consortium for School Networking) is the premier professional association for
district technology leaders. For more than a quarter of a century, CoSN has provided leaders
with the management, community building, and advocacy tools they need to succeed. Today,
CoSN represents over 13 million students in school districts nationwide and continues to grow
as a powerful and influential voice in K-12 education.
CoSN Core Beliefs:
• The primary challenge we face in using technology effectively is human.
• Technology is a critical tool to personalize learning and overcome barriers of time and
space for each learner.
• Equitable and ubiquitous access to technology is a necessity.
• The effective use of technology for the systemic transformation of learning cannot occur
without strong organization, leadership, and vision.
• Technological fluency allows our children to be prepared for the world of today and
tomorrow.

CoSN 2018 K-12 IT Leadership Survey Report | 36
CoSN Resources
CoSN’s Certified Education Technology Leader (CETL) Certification program –
www.cosn.org/certification
The Trusted Learning Environment (TLE) Seal program – www.trustedlearning.org
Leadership & Vision
• Leadership for Mobile Learning – www.cosn.org/MobileLead
• The Empowered Superintendent - http://www.cosn.org/superintendents
• Digital Equity Toolkit - http://www.cosn.org/digital-equity-action-toolkit-february-2016
• Participatory Learning in Schools: Leadership and Policy –
www.cosn.org/participatoryLearning
• Collaboration for Innovation: Advancing Excellence and Equity
www.cosn.org/OnlineCoP
• Digital Leap Success Matrix - http://cosn.org/focus-areas/digital-leap-success-matrix
Understanding the Educational Environment
• Teaming for Transformation – www.cosn.org/OnlineCoP
• CoSN’s Annual E-rate and Broadband Survey – www.cosn.org/ErateSurvey
Managing Technology & Support Resources
• Smart Education Networks by Design (SEND) – www.cosn.org/SmartEdNetworks
• Protecting Privacy in Connected Learning - http://www.cosn.org/focus-
areas/leadership-vision/protecting-privacy
• Interoperability Standards - http://www.cosn.org/interoperability-standards
• Raising the BAR: Becoming Assessment Ready – http://www.cosn.org/assessment
• Data-Driven Decision Making – www.cosn.org/3dm

CoSN 2018 K-12 IT Leadership Survey Report | 37
About Our Sponsor
Dude Solutions is a leading software-as-a-service (SaaS)
provider of operations management solutions to education,
government, healthcare, senior living, manufacturing and membership-based organizations. For
nearly two decades, Dude Solutions has inspired clients to create better work and better lives.
We combine innovative, user-friendly technology with the world’s smartest operations engine,
empowering education operations leaders to transform the most important places in our lives.
Today, more than 7,000 educational institutions use our award-winning software to manage
maintenance, assets, energy, safety, IT, events and more. For more information,
visit dudesolutions.com.
About Our Partners
MDR is a different kind of integrated marketing services agency with unique digital,
creative, and branding capabilities. MDR leads the industry in helping clients
achieve their business goals by connecting with targeted audiences through
research and market intelligence, a world class database and multi-channel digital communities
including WeAreTeachers, WeAreParents, School Leaders Now, Schooldata.com and EdNET.
Forecast5 Analytics provides decision support systems and
applications for school district leaders. Forecast5's suite of state-
of-the-art analytics technology helps you identify strategic, financial, and student growth
opportunities with highly visual output in the areas of financial performance, compensation,
staffing, enrollment/demographics and student performance. More than 1,200 school districts
across the country use Forecast5 tools to maximize their data insights.
ABOUT THE AUTHOR:
This report was prepared by Paula Maylahn, an education industry consultant with over 30 years’ experience
across the K-20 spectrum. Paula is a contributing author on two books, The Experts’ Guide to the K-12 Market and
The Experts’ Guide to the Postsecondary Market, and recently authored “CoSN’s 2017 Annual Infrastructure
Survey Report.” Paula is a member of CoSN’s Standards and Technical Committee, a former board member of the
Education Division of the Software & Information Industry Association, and past Executive Council member of the
PreK-12 Learning Group of the Association of American Publishers. Paula is currently on the Board of Directors for
the United Design Guild where she chairs the Education Council.