k adsorption on ag(110): evect on surface structure and ...rocca/files pdf...
TRANSCRIPT
Surface Science 424 (1999) 62–73
K adsorption on Ag(110): effect on surface structure andsurface electronic excitations
F. Moresco a, M. Rocca a,*, T. Hildebrandt b, V. Zielasek b, M. Henzler ba Centro di Fisica delle Superfici e delle Basse Temperature del C.N.R. and Istituto Nazionale per la Fisica della Materia,
Dipartimento di Fisica, via Dodecaneso 33, 16146 Genova, Italyb Institut fur Festkorperphysik, Universitat Hannover, Appelstrasse 2, 30167Hannover, Germany
Received 30 April 1998; accepted for publication 17 December 1998
Abstract
The growth of K adlayers on Ag(110) was studied by energy loss spectroscopy–low energy electron diffraction(ELS–LEED) which allows the analysis of both elastically and inelastically scattered electrons. Ordered (1×n) missingrow reconstructions and disordered adsorption were investigated. We find that extended surface reconstruction takesplace already at 3% K coverage generating a (1×3) missing row structure. Elastic spot profile analysis shows that along range correlation between K adatoms is present along the 11:0� direction on the reconstructed surface, implyingthe stabilization of the reconstruction also at long distances from the K adatoms. With increasing coverage [(1×2)and (1×3) structures] the distance between the K adatoms along 11:0� decreases and the adsorption sites becomecorrelated also along 001� in contrast with the behaviour of K on Ni, Cu and Pd. For disordered K adsorption weobserve that a weak correlation between the adatoms along both directions is already present in the background. Theinelastic intensity shows only one marked loss at the surface plasmon frequency, indicating that in the investigatedcoverage range both K-induced s and p levels are empty. Ag surface plasmon dispersion and damping are affected bythe presence of K in accord with the electronic mechanism generating the reconstruction. For the ordered (1×n)reconstructions the structural anisotropy is enhanced, while the anisotropy of Ag surface plasmon dispersion isreduced. K adsorption strongly affects in particular the quadratic term of the dispersion along 001�, which dropsby 60% already at 3% K coverage while the linear term remains initially unaffected independently of surfacereconstruction. Above 30% K coverage also the linear term decreases and the anisotropy present for the surfaceplasmon dispersion of the bare Ag(110) is removed. © 1999 Published by Elsevier Science B.V. All rights reserved.
Keywords: Ag(110); ELS–LEED; HREELS; K adsorption; SPA–LEED; Surface plasmon dispersion
1. Introduction differences are present among the materials, as thealkali coverage necessary to induce the reconstruc-tion depends on the substrate and so not all theMissing row reconstruction induced by alkali(1×n) structures are reported for all metals. Formetal adsorption is known to occur on the (110)Ag(110) and Cu(110) the series of (1×n) orderedsurfaces of Ag, Pd, Ni and Cu [1–8], and ismissing row structures starts with n=3 and corres-therefore a general phenomenon for which aponds to the removal of every third 11:0� row.common origin was postulated [9]. However someWith increasing alkali deposition, a (1×2) recon-struction appears, implying the removal of every* Corresponding author. Fax: +39 10 314218;
e-mail: [email protected]. second substrate row. A second (1×3) structure
0039-6028/99/$ – see front matter © 1999 Published by Elsevier Science B.V. All rights reserved.PII: S0039-6028 ( 99 ) 00011-4

63F. Moresco et al. / Surface Science 424 (1999) 62–73
is present at still higher coverage, and corresponds need a critical coverage. At low coverage the Cuto two out of three top layer 11:0�rows missing. surface is observed to be only locally reconstructed,For Pd(110) and Ni(110) only the (1×2) recon- with (1×2) areas concentrated in islands. At astruction forms. The alkali coverage, HK, necessary coverage of about 0.2 ML an extended (1×2)to induce such reconstructions depends on the reconstruction forms, whereby the K sit in thesubstrate. For K/Ag(110) the (1×3) structure is missing rows at an average distance of 2.5 Cureported for a K coverage, HK, of 0.01<HK< atoms. Such a study concludes therefore that the0.05 monolayer (ML), while for HK#0.1 ML the reconstruction mechanism is strictly local and(1×2) is observed [1]. For K/Cu(110), on the claims that such a mechanism is also active for theother hand, the (1×3) structure appears only at other metals. However, such a local reconstructionHK=0.13 ML and HK=0.2 ML is necessary to model cannot explain the reconstruction on Ag,induce the (1×3) and the (1×2) reconstructions Pd and Ni, which takes place at too small anrespectively [5–8]. The reconstruction process is amount of K, implying a long range mechanism,known to be thermally activated [5], with all where single K atoms affect the configuration ofsystems showing a critical temperature in the range the substrate beyond their nearest neighbors.between 150 and 250 K, depending also on the Recent X-ray diffraction experiments on thealkali atom coverage. (1×n) structures induced by Cs adsorption on
The driving force and the mechanism of alkali Cu(110) [13] and theoretical calculations [14] haveinduced missing row reconstruction have been shown that the experimentally observed relaxationstudied theoretically. Different models exist, all of pattern cannot be explained by just consideringwhich claim to describe all fcc (110) transition the properties of the clean surface atoms, demon-metal surfaces [10–12]. According to Jacobsen and strating that the role of the adsorbed alkali atomsNorskov [10] the effect is local and the driving is more important than suspected so far.force results from an increase in adsorption energy We report here an energy loss spectroscopy–which overcompensates the energy required for the
low energy electron diffraction (ELS–LEED)reconstruction. A minimum coverage of ca 0.1 ML
investigation of the surface geometric structureis required to reconstruct the whole surface. Onand of the collective electronic excitations on thethe contrary, according to Fu and Ho [12], the(1×n) missing row K/Ag(110) reconstructedreconstruction mechanism operates through ansurface.electron donation effect, which produces an
In the first part of this paper we present a spotincreased surface electron concentration. They findprofile analysis of the diffraction pattern of thethat the surface undergoes a missing row recon-(1×n) phases. It confirms that the Ag surfacestruction as soon as a small amount (#0.05reconstructs completely already at a lower K cover-electrons per surface atoms) of excess charge isage than it is the case for K/Cu. The averagetransferred to the surface.distance between the K adatoms is smaller thanIn a recent scanning tunnelling microscopyexpected for a random distribution, implying that(STM) investigation of the K/Cu(110) systemthey form islands leaving vast reconstructed Ag[6–8] the nucleation of the reconstruction wasareas with no K. Increasing the coverage theobserved, showing that each single K atomdistance between the K adatoms decreases monot-removes locally two or three substrate atoms outonously. For the (1×2) phases we find that theof a 11:0� row. The K adatom could not beposition of the K atoms is correlated also betweenimaged, but it was supposed to be accommodatedneighbouring rows. In the second part of the paperin the resulting hole, thus forming a nucleus forwe present a full analysis of the energy loss datathe missing row structure. The long range recon-which were partially reported elsewhere [15]. Thestruction proceeds then by the coalescence of suchpresence of K strongly influences the Ag surfacenuclei, which interact attractively in the 11:0�plasmon dispersion and damping independentlydirection and repulsively along 001�. Nucleation
starts at a small K concentration and does not on surface reconstruction thus supporting a long
64 F. Moresco et al. / Surface Science 424 (1999) 62–73
range reconstruction mechanism electronic inorigin.
2. Experimental
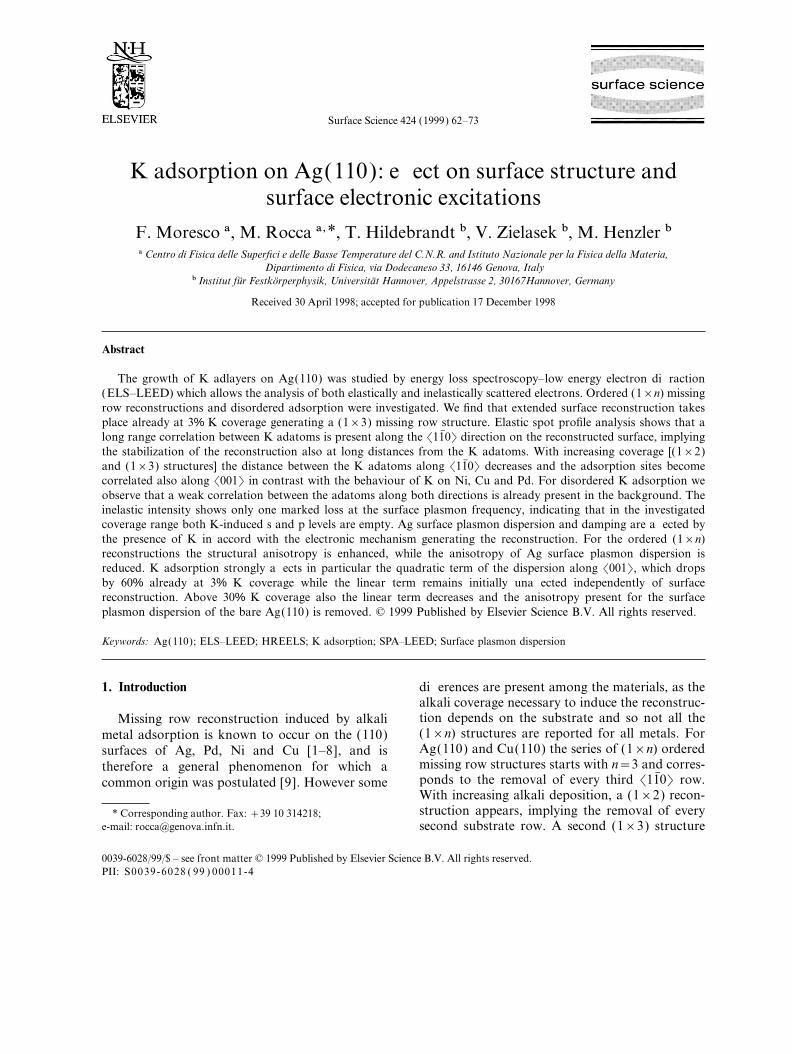
The experiment was performed in an ultra highvacuum (3×10⁻¹⁰ mbar) on an Ag(110) singlecrystal prepared in the usual way [17] by ionsputtering and annealing until no traces of impuri-ties could be detected by Auger electron spectro-scopy (AES) and by ELS–LEED. Potassium was Fig. 1. Ratio of the intensities of the K transition at 252 eV andevaporated from a well outgassed commercial of the Ag transition at 352 eV versus exposure time, as obtainedgetter source (SAES getters) at room temperature by AES.to study the reconstructed phases and at T=100 Kto inhibit reconstruction.
The surface structure and the energy loss spectra the metallic radius of K is 2.32 A [24],HK=1 ML corresponds to a coverage of 0.64 Kwere investigated by ELS–LEED, a spectrometer
which combines the electrostatic deflection unit of atoms per Ag(110) unit cell, that is, to 5.4×10¹⁴atoms cm−2.a spot profile analysis of the low energy electron
diffraction (SPA–LEED) system with beam mono-chromatization and analysis of high resolutionelectron energy loss spectroscopy (HREELS). It 3. Surface structuremay be considered either as a HREELS with highmomentum resolution, or as a SPA–LEED system 3.1. Data presentationwith high energy resolution [18]. The transferwidth of the instrument is 1500 A, corresponding A series of (1×n) missing row structures have
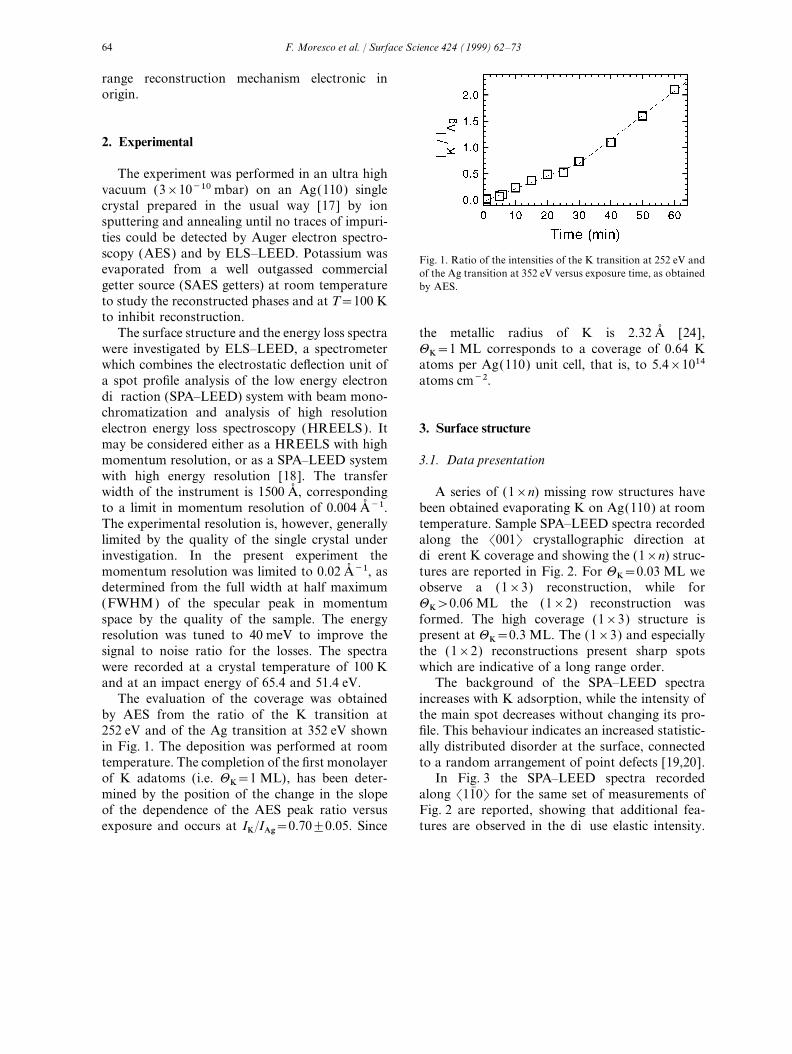
been obtained evaporating K on Ag(110) at roomto a limit in momentum resolution of 0.004 A−1.The experimental resolution is, however, generally temperature. Sample SPA–LEED spectra recorded
along the 001� crystallographic direction atlimited by the quality of the single crystal underinvestigation. In the present experiment the different K coverage and showing the (1×n) struc-
tures are reported in Fig. 2. For HK=0.03 ML wemomentum resolution was limited to 0.02 A−1, asdetermined from the full width at half maximum observe a (1×3) reconstruction, while for
HK>0.06 ML the (1×2) reconstruction was(FWHM) of the specular peak in momentumspace by the quality of the sample. The energy formed. The high coverage (1×3) structure is
present at HK=0.3 ML. The (1×3) and especiallyresolution was tuned to 40 meV to improve thesignal to noise ratio for the losses. The spectra the (1×2) reconstructions present sharp spots
which are indicative of a long range order.were recorded at a crystal temperature of 100 Kand at an impact energy of 65.4 and 51.4 eV. The background of the SPA–LEED spectra
increases with K adsorption, while the intensity ofThe evaluation of the coverage was obtainedby AES from the ratio of the K transition at the main spot decreases without changing its pro-
file. This behaviour indicates an increased statistic-252 eV and of the Ag transition at 352 eV shownin Fig. 1. The deposition was performed at room ally distributed disorder at the surface, connected
to a random arrangement of point defects [19,20].temperature. The completion of the first monolayerof K adatoms (i.e. HK=1 ML), has been deter- In Fig. 3 the SPA–LEED spectra recorded
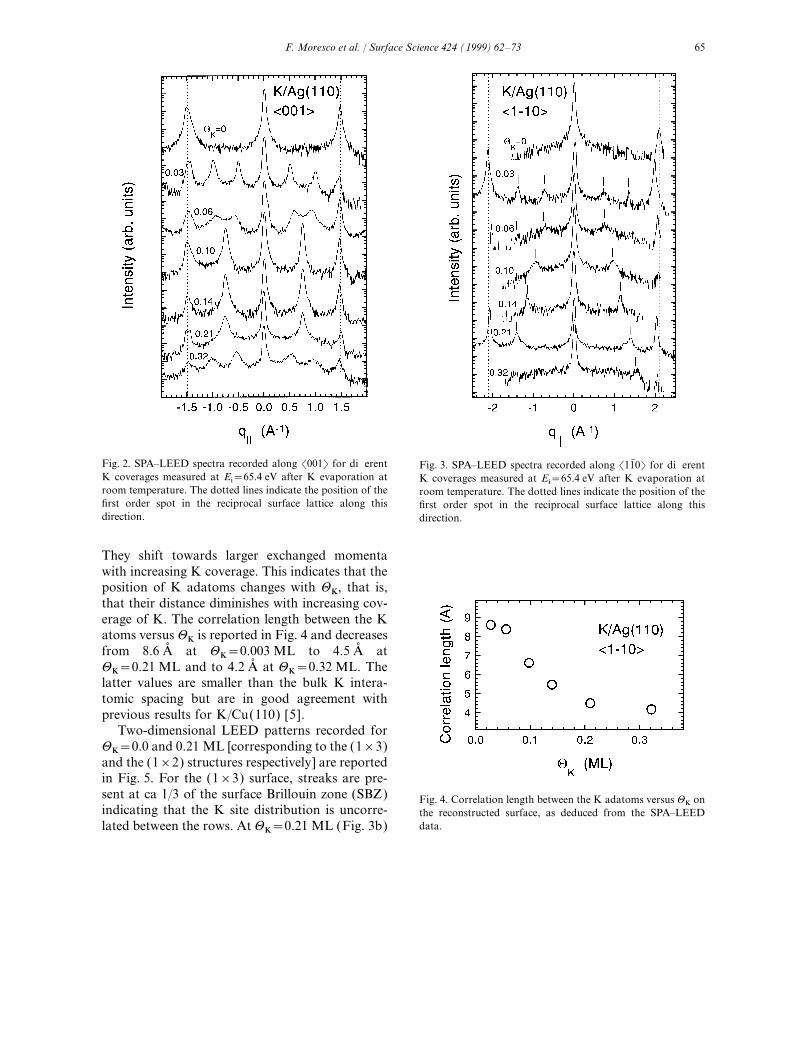
along 11:0� for the same set of measurements ofmined by the position of the change in the slopeof the dependence of the AES peak ratio versus Fig. 2 are reported, showing that additional fea-
tures are observed in the diffuse elastic intensity.exposure and occurs at IK/IAg=0.70±0.05. Since
65F. Moresco et al. / Surface Science 424 (1999) 62–73
Fig. 2. SPA–LEED spectra recorded along 001� for different Fig. 3. SPA–LEED spectra recorded along 11:0� for differentK coverages measured at Ei=65.4 eV after K evaporation at K coverages measured at Ei=65.4 eV after K evaporation atroom temperature. The dotted lines indicate the position of the room temperature. The dotted lines indicate the position of thefirst order spot in the reciprocal surface lattice along this first order spot in the reciprocal surface lattice along thisdirection. direction.
They shift towards larger exchanged momentawith increasing K coverage. This indicates that theposition of K adatoms changes with HK, that is,that their distance diminishes with increasing cov-erage of K. The correlation length between the Katoms versus HK is reported in Fig. 4 and decreasesfrom 8.6 A at HK=0.003 ML to 4.5 A atHK=0.21 ML and to 4.2 A at HK=0.32 ML. Thelatter values are smaller than the bulk K intera-tomic spacing but are in good agreement withprevious results for K/Cu(110) [5].
Two-dimensional LEED patterns recorded forHK=0.0 and 0.21 ML [corresponding to the (1×3)and the (1×2) structures respectively] are reportedin Fig. 5. For the (1×3) surface, streaks are pre-sent at ca 1/3 of the surface Brillouin zone (SBZ) Fig. 4. Correlation length between the K adatoms versus HK onindicating that the K site distribution is uncorre- the reconstructed surface, as deduced from the SPA–LEED
data.lated between the rows. At HK=0.21 ML (Fig. 3b)

66 F. Moresco et al. / Surface Science 424 (1999) 62–73
SPA–LEED spectra corresponding to the (1×2)reconstruction at HK=0.10 ML are compared inFig. 6 to the spectra obtained at nearly the sameK coverage (HK=0.11 ML) after deposition at T=100 K. As one can see in Fig. 6b, K deposition atlow temperature inhibits surface reconstruction. Infact, while in the room temperature case the (1×2)superstructures are clearly visible, only weak fea-tures are present in the low temperature depositioncase, indicating that only a local rearrangement ofthe substrate takes place around the K adatoms.Along 11:0� the additional features due to Kadsorption are still present, even if their intensityis strongly reduced, indicating a more disorderedsurface and a worse correlation between the Kadatoms.
Fig. 5. Two-dimensional LEED pattern corresponding to a Kcoverage of: (a) HK=0.03 ML and (b) HK=0.21 ML. Thearrows show the position of the K-induced additional features.
the streaks break up into spots, showing that theK adatom positions become correlated alsobetween the Ag rows. K-induced peaks are placednot only in the (10) SBZ along C9Y9 (shown inFig. 3), but also in the (0, 1/2) SBZ at 1/6 in thesame direction.
We note therefore that in the case of K/Ag(110)a strong correlation between K atoms is present Fig. 6. SPA–LEED spectra for the reconstructed (1×2) surfacein both azimuthal directions, at variance with the at HK=0.10 ML and for the unreconstructed surface at
HK=0.11 ML along (a) 11:0� and (b) 001�.case of K/Cu [5].
67F. Moresco et al. / Surface Science 424 (1999) 62–73
3.2. Discussion of Fig. 5 it is, however, not possible to derive anunique structural model.
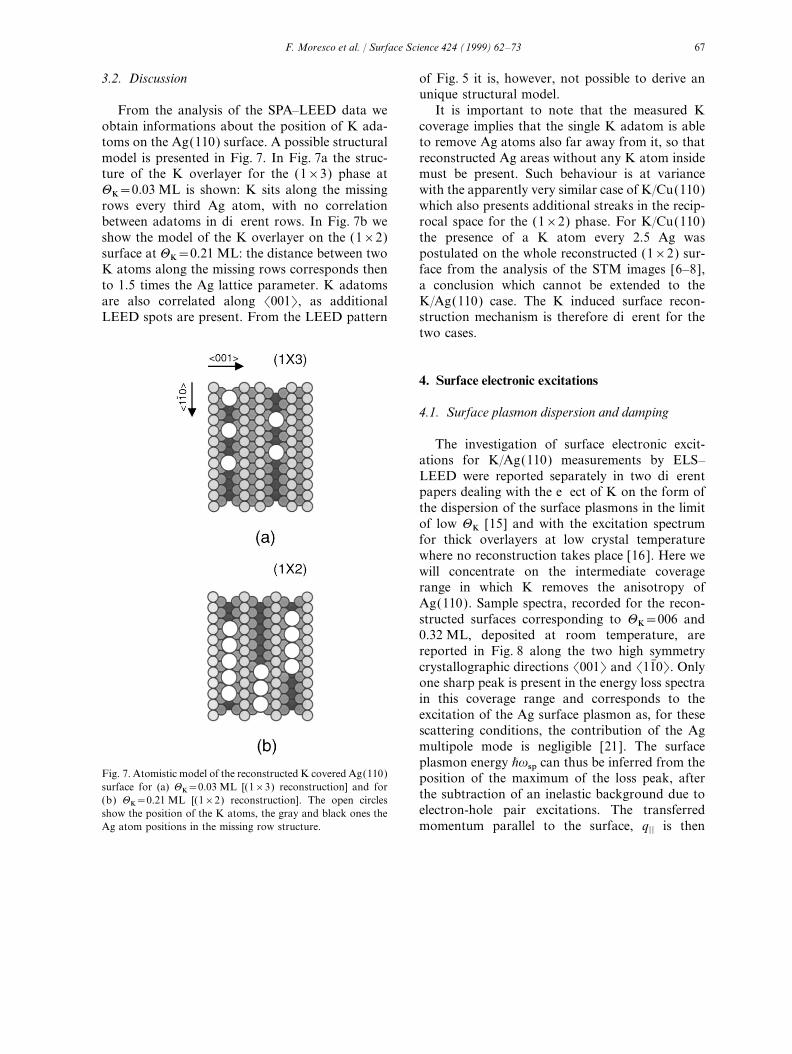
It is important to note that the measured KFrom the analysis of the SPA–LEED data weobtain informations about the position of K ada- coverage implies that the single K adatom is able
to remove Ag atoms also far away from it, so thattoms on the Ag(110) surface. A possible structuralmodel is presented in Fig. 7. In Fig. 7a the struc- reconstructed Ag areas without any K atom inside
must be present. Such behaviour is at varianceture of the K overlayer for the (1×3) phase atHK=0.03 ML is shown: K sits along the missing with the apparently very similar case of K/Cu(110)
which also presents additional streaks in the recip-rows every third Ag atom, with no correlationbetween adatoms in different rows. In Fig. 7b we rocal space for the (1×2) phase. For K/Cu(110)
the presence of a K atom every 2.5 Ag wasshow the model of the K overlayer on the (1×2)surface at HK=0.21 ML: the distance between two postulated on the whole reconstructed (1×2) sur-
face from the analysis of the STM images [6–8],K atoms along the missing rows corresponds thento 1.5 times the Ag lattice parameter. K adatoms a conclusion which cannot be extended to the
K/Ag(110) case. The K induced surface recon-are also correlated along 001�, as additionalLEED spots are present. From the LEED pattern struction mechanism is therefore different for the
two cases.
4. Surface electronic excitations
4.1. Surface plasmon dispersion and damping
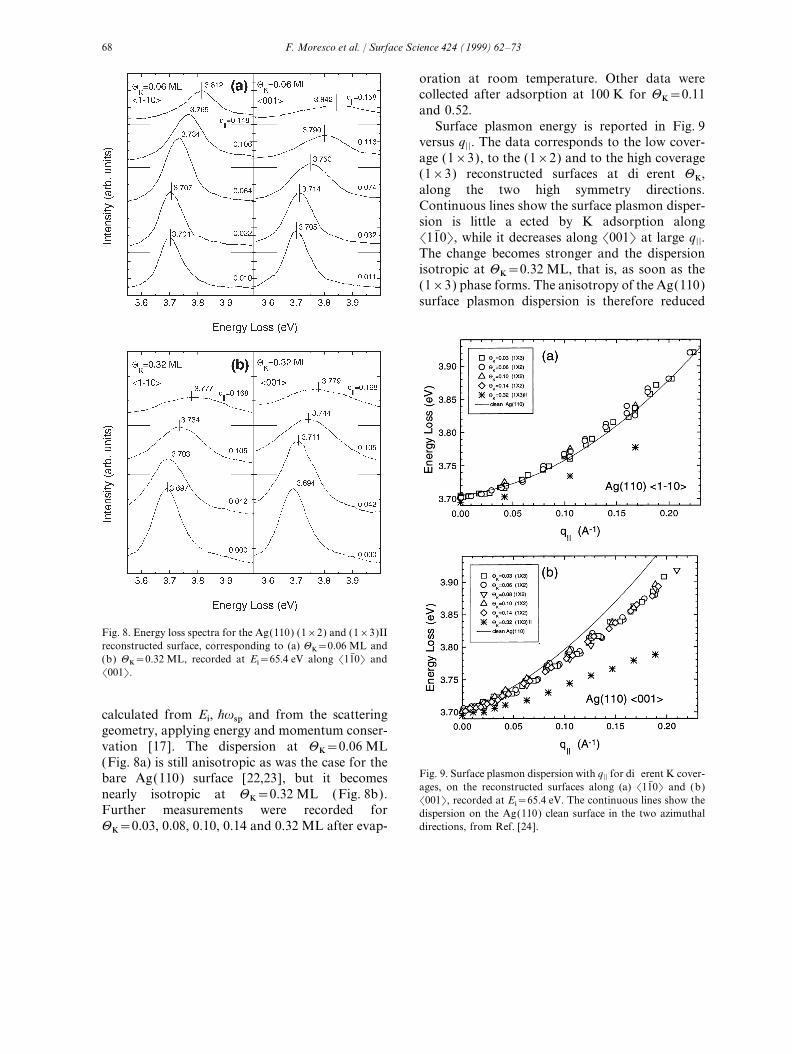
The investigation of surface electronic excit-ations for K/Ag(110) measurements by ELS–LEED were reported separately in two differentpapers dealing with the effect of K on the form ofthe dispersion of the surface plasmons in the limitof low HK [15] and with the excitation spectrumfor thick overlayers at low crystal temperaturewhere no reconstruction takes place [16 ]. Here wewill concentrate on the intermediate coveragerange in which K removes the anisotropy ofAg(110). Sample spectra, recorded for the recon-structed surfaces corresponding to HK=006 and0.32 ML, deposited at room temperature, arereported in Fig. 8 along the two high symmetrycrystallographic directions 001� and 11:0�. Onlyone sharp peak is present in the energy loss spectrain this coverage range and corresponds to theexcitation of the Ag surface plasmon as, for thesescattering conditions, the contribution of the Agmultipole mode is negligible [21]. The surfaceplasmon energy Bvsp can thus be inferred from the
Fig. 7. Atomistic model of the reconstructed K covered Ag(110) position of the maximum of the loss peak, aftersurface for (a) HK=0.03 ML [(1×3) reconstruction] and for
the subtraction of an inelastic background due to(b) HK=0.21 ML [(1×2) reconstruction]. The open circleselectron-hole pair excitations. The transferredshow the position of the K atoms, the gray and black ones the
Ag atom positions in the missing row structure. momentum parallel to the surface, q|| is then
68 F. Moresco et al. / Surface Science 424 (1999) 62–73
oration at room temperature. Other data werecollected after adsorption at 100 K for HK=0.11and 0.52.
Surface plasmon energy is reported in Fig. 9versus q||. The data corresponds to the low cover-age (1×3), to the (1×2) and to the high coverage(1×3) reconstructed surfaces at different HK,along the two high symmetry directions.Continuous lines show the surface plasmon disper-sion is little affected by K adsorption along 11:0�, while it decreases along 001� at large q||.The change becomes stronger and the dispersionisotropic at HK=0.32 ML, that is, as soon as the(1×3) phase forms. The anisotropy of the Ag(110)surface plasmon dispersion is therefore reduced
Fig. 8. Energy loss spectra for the Ag(110) (1×2) and (1×3)IIreconstructed surface, corresponding to (a) HK=0.06 ML and(b) HK=0.32 ML, recorded at Ei=65.4 eV along 11:0� and 001�.
calculated from Ei, Bvsp and from the scatteringgeometry, applying energy and momentum conser-vation [17]. The dispersion at HK=0.06 ML(Fig. 8a) is still anisotropic as was the case for the
Fig. 9. Surface plasmon dispersion with q|| for different K cover-bare Ag(110) surface [22,23], but it becomesages, on the reconstructed surfaces along (a) 11:0� and (b)
nearly isotropic at HK=0.32 ML (Fig. 8b). 001�, recorded at Ei=65.4 eV. The continuous lines show theFurther measurements were recorded for dispersion on the Ag(110) clean surface in the two azimuthal
directions, from Ref. [24].HK=0.03, 0.08, 0.10, 0.14 and 0.32 ML after evap-
69F. Moresco et al. / Surface Science 424 (1999) 62–73
with respect to the bare surface case, for the (1×3)and (1×2) reconstructions and it disappears forthe high coverage (1×3) structure.
The experimental data were fitted with theparabolic form:
Bvsp(qd)=Bvsp(0)+Aqd+Bq2d (1)
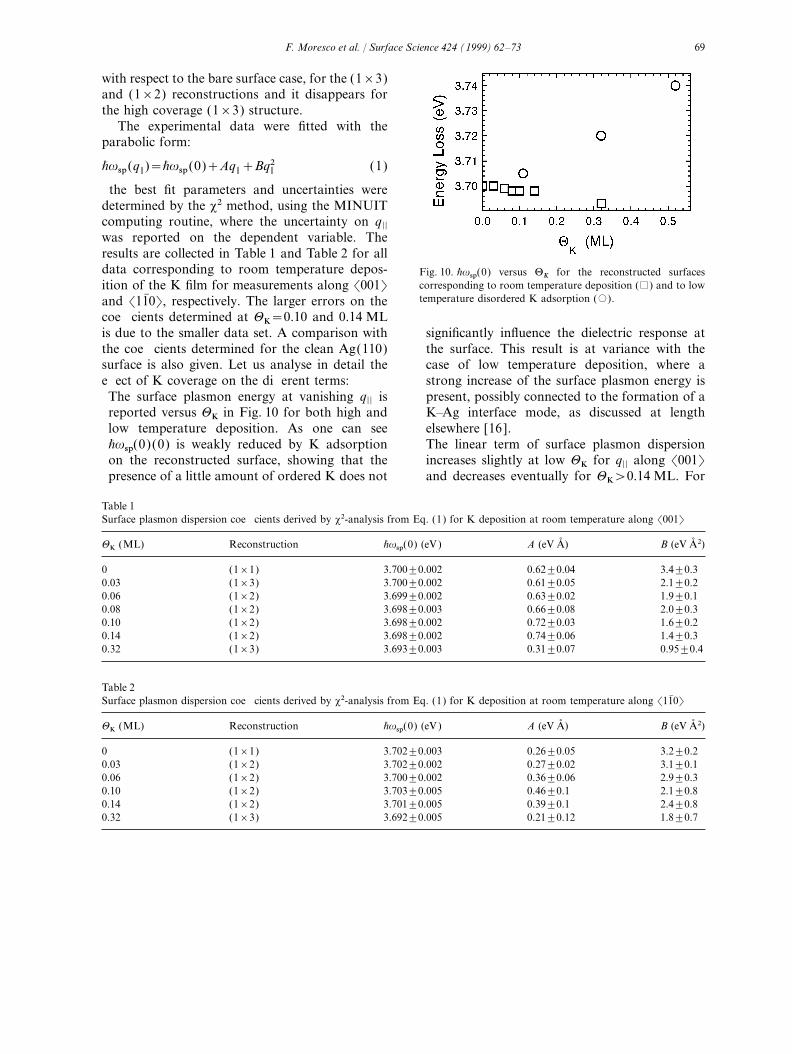
the best fit parameters and uncertainties weredetermined by the x2 method, using the MINUITcomputing routine, where the uncertainty on q||was reported on the dependent variable. Theresults are collected in Table 1 and Table 2 for alldata corresponding to room temperature depos- Fig. 10. Bvsp(0) versus H
Kfor the reconstructed surfaces
corresponding to room temperature deposition (%) and to lowition of the K film for measurements along 001�temperature disordered K adsorption (#).and 11:0�, respectively. The larger errors on the
coefficients determined at HK=0.10 and 0.14 MLis due to the smaller data set. A comparison with significantly influence the dielectric response at
the surface. This result is at variance with thethe coefficients determined for the clean Ag(110)surface is also given. Let us analyse in detail the case of low temperature deposition, where a
strong increase of the surface plasmon energy iseffect of K coverage on the different terms:The surface plasmon energy at vanishing q|| is present, possibly connected to the formation of a
K–Ag interface mode, as discussed at lengthreported versus HK in Fig. 10 for both high andlow temperature deposition. As one can see elsewhere [16 ].
The linear term of surface plasmon dispersionBvsp(0)(0) is weakly reduced by K adsorptionon the reconstructed surface, showing that the increases slightly at low HK for q|| along 001�
and decreases eventually for HK>0.14 ML. Forpresence of a little amount of ordered K does not
Table 1Surface plasmon dispersion coefficients derived by x2-analysis from Eq. (1) for K deposition at room temperature along 001�
HK (ML) Reconstruction Bvsp(0) (eV) A (eV A) B (eV A2)
0 (1×1) 3.700±0.002 0.62±0.04 3.4±0.30.03 (1×3) 3.700±0.002 0.61±0.05 2.1±0.20.06 (1×2) 3.699±0.002 0.63±0.02 1.9±0.10.08 (1×2) 3.698±0.003 0.66±0.08 2.0±0.30.10 (1×2) 3.698±0.002 0.72±0.03 1.6±0.20.14 (1×2) 3.698±0.002 0.74±0.06 1.4±0.30.32 (1×3) 3.693±0.003 0.31±0.07 0.95±0.4
Table 2Surface plasmon dispersion coefficients derived by x2-analysis from Eq. (1) for K deposition at room temperature along 11:0�
HK (ML) Reconstruction Bvsp(0) (eV) A (eV A) B (eV A2)
0 (1×1) 3.702±0.003 0.26±0.05 3.2±0.20.03 (1×2) 3.702±0.002 0.27±0.02 3.1±0.10.06 (1×2) 3.700±0.002 0.36±0.06 2.9±0.30.10 (1×2) 3.703±0.005 0.46±0.1 2.1±0.80.14 (1×2) 3.701±0.005 0.39±0.1 2.4±0.80.32 (1×3) 3.692±0.005 0.21±0.12 1.8±0.7

70 F. Moresco et al. / Surface Science 424 (1999) 62–73
HK>0.32 ML it becomes identical to the value At even larger values of HK (see the case ofobserved along 11:0�. 0.52 ML in Table 3, measured, however, for a filmThe quadratic term along 001� is reduced by deposited at 100 K), we observe that the quadraticnearly a factor of 2 with respect to the clean term of the dispersion recovers the same value assurface value already at HK=0.03 ML and reported for the bare surface case, while the lineardecreases then more slowly to 1 eV A2. Along term is three times smaller and coincides, within 11:0� it decreases on the contrary almost linearly experimental error, with the value observed on thewith increasing K coverage. At HK=0.32 ML this reconstructed surface at HK=0.32 ML. At largeterm also becomes nearly isotropic. HK the linear dispersion term is thus strongly
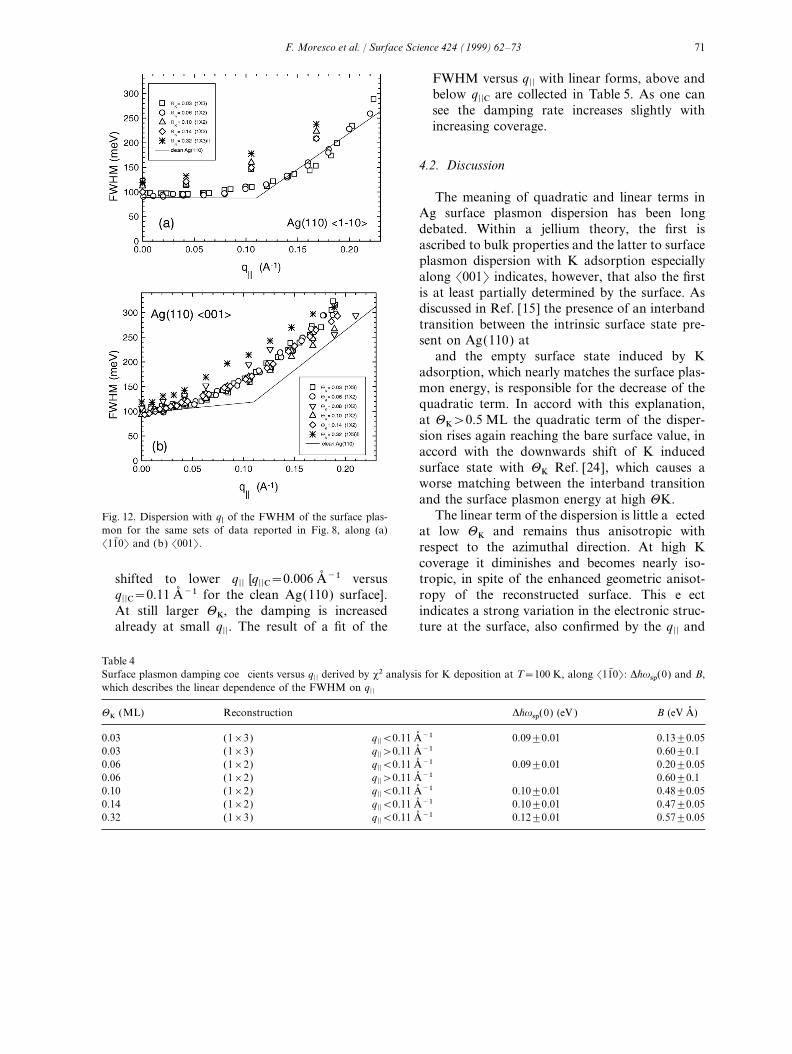
A comparison between surface plasmon disper- decreased. A similar effect was reported by Kimsion on the unreconstructed (1×1) and on the et al. [25] for Cl/Ag(111) and ascribed to thereconstructed (1×2) surfaces is reported in reduced sp–d polarization for an adsorbate cov-Fig. 11, while the dispersion coefficients are shown ered surface.in Table 3. As one can see the reconstruction only The FWHM of the surface plasmon versus q||has a minor effect on the dispersion coefficients, is reported in Fig. 12. The data, deconvoluted withthe differences being within experimental error. We respect to energy and angular resolution asdemonstrate therefore that the geometrical struc- described in Ref. [17], indicate that:ture does not affect the surface plasmon dispersion The presence of K has little effect on surfacesignificantly as the most corrugated case is also plasmon damping for q||=0.the least anisotropic. Along 11:0� the FWHM increases initially
weakly with q||, while it grows eventually morerapidly above a critical q|| (q||C=0.11 A−1), aswas the case for the clean surface. The additionaldamping mechanism above q||C was ascribed tothe opening of a decay channel connected to theexcitation of interband transitions involving sur-face states [17]. On increasing HK the dampingrate increases both below and above q||C.Notably the value of q||C does not change withK adsorption. A linear fit of the data, forq||<q||C and for q||<q||, is reported in Table 4.For HK=0.10, 0.14 and 0.32 ML only the dataabove q||C the set of data was too small to allowfor such a fine analysis.
Fig. 11. Surface plasmon dispersion for q|| for the reconstructed Along 001� the damping is generally stronger(1×2) and the unreconstructed surface, at HK=0.10 and than for the clean surface case. For HK=0.030.11 ML, respectively, along 001� and 11:0�. The continuous and 0.06 ML the presence of the additionaland dashed lines show the dispersion on the Ag(110) bare sur-
damping mechanisms can still be recognized.face in the two azimuthal directions, as obtained from Refs.[22,23]. The critical q|| value appear however to be
Table 3Surface plasmon dispersion coefficients derived by x2-analysis from Eq. (1) for K deposition at T=100 K
HK (ML) Azimuth Bvsp(0) (eV ) A (eV A) B (eV A2)
0.11 001� 3.701±0.002 0.74±0.06 1.6±0.30.52 001� 3.733±0.004 0.24±0.1 3.6±0.80.11 110� 3.709±0.005 0.37±0.1 2.08±0.8
71F. Moresco et al. / Surface Science 424 (1999) 62–73
FWHM versus q|| with linear forms, above andbelow q||C are collected in Table 5. As one cansee the damping rate increases slightly withincreasing coverage.
4.2. Discussion
The meaning of quadratic and linear terms inAg surface plasmon dispersion has been longdebated. Within a jellium theory, the first isascribed to bulk properties and the latter to surfaceplasmon dispersion with K adsorption especiallyalong 001� indicates, however, that also the firstis at least partially determined by the surface. Asdiscussed in Ref. [15] the presence of an interbandtransition between the intrinsic surface state pre-sent on Ag(110) at
and the empty surface state induced by Kadsorption, which nearly matches the surface plas-mon energy, is responsible for the decrease of thequadratic term. In accord with this explanation,at HK>0.5 ML the quadratic term of the disper-sion rises again reaching the bare surface value, inaccord with the downwards shift of K inducedsurface state with HK Ref. [24], which causes aworse matching between the interband transitionand the surface plasmon energy at high HK.
The linear term of the dispersion is little affectedFig. 12. Dispersion with q|| of the FWHM of the surface plas-mon for the same sets of data reported in Fig. 8, along (a) at low HK and remains thus anisotropic with 11:0� and (b) 001�. respect to the azimuthal direction. At high K
coverage it diminishes and becomes nearly iso-tropic, in spite of the enhanced geometric anisot-shifted to lower q|| [q||C=0.006 A−1 versus
q||C=0.11 A−1 for the clean Ag(110) surface]. ropy of the reconstructed surface. This effectindicates a strong variation in the electronic struc-At still larger HK, the damping is increased
already at small q||. The result of a fit of the ture at the surface, also confirmed by the q|| and
Table 4Surface plasmon damping coefficients versus q|| derived by x2 analysis for K deposition at T=100 K, along 11:0�: DBvsp(0) and B,which describes the linear dependence of the FWHM on q||HK (ML) Reconstruction DBvsp(0) (eV ) B (eV A)
0.03 (1×3) q||<0.11 A−1 0.09±0.01 0.13±0.050.03 (1×3) q||>0.11 A−1 0.60±0.10.06 (1×2) q||<0.11 A−1 0.09±0.01 0.20±0.050.06 (1×2) q||>0.11 A−1 0.60±0.10.10 (1×2) q||<0.11 A−1 0.10±0.01 0.48±0.050.14 (1×2) q||<0.11 A−1 0.10±0.01 0.47±0.050.32 (1×3) q||<0.11 A−1 0.12±0.01 0.57±0.05

72 F. Moresco et al. / Surface Science 424 (1999) 62–73
Table 5Surface plasmon damping coefficients versus q|| derived by x2 analysis for K deposition at T=100 K, along 001�: DBvsp(0) and B,which describes the linear dependence of the FWHM on q||HK (ML) Reconstruction DBvsp(0) (eV ) B (eV A)
0.03 (1×3) q||<0.05 A−1 0.10±0.01 0.41±0.050.03 (1×3) q||>0.05 A−1 1.53±0.10.06 (1×2) q||<0.05 A−1 0.10±0.01 0.36±0.050.06 (1×2) q||>0.05 A−1 1.48±0.10.08 (1×2) q||<0.05 A−1 0.10±0.01 0.67±0.050.08 (1×2) q||>0.05 A−1 1.01±0.10.10 (1×2) q||<0.05 A−1 0.09±0.01 0.62±0.050.10 (1×2) q||>0.05 A−1 1.07±0.10.14 (1×2) q||<0.05 A−1 0.09±0.01 0.66±0.050.14 (1×2) q||>0.05 A−1 1.30±0.10.32 (1×3) q||<0.05 A−1 0.12±0.01 0.59±0.050.32 (1×3) q||>0.05 A−1 1.16±0.1
HK dependence of surface plasmon damping and Acknowledgementsis possibly connected to the formation of asurface alloy. This work was partially financed by the Italian
Ministry of University and Research under con-tract 97021178261-003.
5. Conclusions
In this work we have presented a combined ReferencesSPA–LEED and HREELS study of the influenceof K adsorption on Ag(110) surface structure and [1] B.E. Hayden, K.H. Prince, P.J. Davie, G. Paolucci, A.M.
Bradshaw, Solid State Commun. 48 (1983) 325.surface electronic excitations, for K coverage in[2] J.W.M. Frenken, R.L. Krans, J.F. van der Veen, E. Holub-the range between 0.03 and 0.5 ML. We have
Frappe, K. Horn, Phys. Rev. Lett. 59 (1987) 2307.shown that surface reconstruction takes place at a[3] C.J. Barnes, M.Q. Ding, M. Litroos, R.D. Diehl, D. King,
very low K coverage along 001�, while along the Surf. Sci. 162 (1985) 59.unreconstructed 11:0� direction K-induced fea- [4] R.J. Behm, D.K. Flynn, K.D. Jamison, G. Ertl, P.A. Thiel,
Phys. Rev. B 36 (1987) 9267.tures are present, indicating a correlation between[5] W.C. Fan, A. Ignatiev, Phys. Rev. B 38 (1988) 366.K adatoms. At larger HK this correlation is[6 ] R. Schuster, J.V. Barth, G. Ertl, R.J. Behm, Surf. Sci. 247stronger and is present along both azimuthal direc-
(1991) L229.tions, underlying the very active role played by K [7] R. Schuster, J.V. Barth, G. Ertl, R.J. Behm, Phys. Rev. Badatoms in surface reconstruction. 44 (1991) 13689.
[8] R. Schuster, J.V. Barth, R.J. Behm, G. Ertl, Phys. Rev.The electronic surface structure is heavilyLett. 69 (1992) 2547.affected by K adsorption, as evidenced by the
[9] R.J. Behm, in: H.P. Bonzel, A.M. Bradshaw, G. Ertlsurface electronic excitation spectrum which shows(Eds.), Physics and Chemistry of Alkali Metal Adsorption,
an increased damping of the surface plasmon Elsevier, Amsterdam, 1989, p. 111.associated to the new interband transitions con- [10] K.W. Jacobsen, J.K. Norskov, Phys. Rev. Lett. 60
(1988) 2496.nected to the K-induced states and the removal of[11] S.M. Foiles, Surf. Sci. 191 (1987) L779.the anisotropy of surface plasmon dispersion. The[12] C.L. Fu, K.M. Ho, Phys. Rev. Lett. 63 (1989) 1617.long range mechanism driving the reconstruction[13] R. Schuster, I.K. Robinson, Phys. Rev. Lett. 76 (1996)
must therefore by of electronic origin for 1671.K/Ag(110) in contrast to the local driving force [14] A.C. Egsgaard Madsen, P. Stoltze, K.W. Jacobsen, L.K.
Norskov, Phys. Rev. Lett. 78 (1997) 158C.which is apparently active for K/Cu(110).

73F. Moresco et al. / Surface Science 424 (1999) 62–73
[15] F. Moresco, M. Rocca, T. Hildebrandt, V. Zielasek, M. [21] F. Moresco, M. Rocca, V. Zielasek, T. Hildebrandt, M.Henzler, Phys. Rev. B 54 (1997) R14333.Henzler, Europhys. Lett. 43 (1998) 433.
[16 ] F. Moresco, M. Rocca, T. Hildebrandt, M. Henzler, Surf. [22] F. Moresco, M. Rocca, V. Zielasek, T. Hildebrandt, M.Henzler, Surf. Sci. 338 (1997) 1.Sci. 424 (1999) 55.
[17] M. Rocca, Surf. Sci. Rep. 22 (1995) 1. [23] F. Moresco, M. Rocca, V. Zielasek, T. Hildebrandt, M.Henzler, Surf. Sci. 338 (1997) 24.[18] H. Claus, A. Bussenschutt, M. Henzler, Rev. Sci. Instrum.
63 (1992) 2195. [24] W. Jacob, E. Bertel, V. Dose, Phys. Rev. B 35 (1987) 5910.[25] J.S. Kim, L.M. Chen, L.L. Kesmodel, P. Garcia-Gonzales,[19] M. Henzler, Appl. Surf. Sci. 11/12 (1982) 450.
[20] M. Henzler, Appl. Phys. A 43 (1984) 205. A. Liebsch, Phys. Rev. B 56 (1997) R4402.