k j ramesh ministry of earth sciences [email protected]
TRANSCRIPT

PERSPECTIVES OF BUILDING RESILIENT
INDIA THROUGH EFFECTIVE CLIMATE AND
DISASTER RISK REDUCTION
K J Ramesh Ministry of Earth Sciences

MoES Agencies dealing with various Hazards
HYDRO-METEOROLOGICAL HAZARDS – IMD, INCOIS Floods, Tropical Cyclones Local Severe Storms, Drought Snow Avalanches, Winter Systems GEOLOGICAL
HAZARDS Earthquakes & Tsunamis (IMD and INCOIS) Rain Induced Landslides/Mudslides (IMD) ENVIRONMENTAL IMPACTS
-Air pollution & Haze, FOG, Smog (IMD) -Coastal Zone Management (ICMAM) -Coastal Erosion (ICMAM) -Eco-system monitoring/ modeling (IITM and IMD) -Climate change impacts on severe weather events (IITM)


Disaster and Climate Risk


Tsunami Early Warning System
Tide gauge Network
Seismic Network
BPR Network
Bathymetry
Tsunami Modelling
Topography
Costal Vulnerability
TSUNAMI WARNINGS!!!
Capacity Building
R & D
Observation Networks Communications Simulations Last mile connectivity
INMARSAT
VSAT
INSAT
GPRS
Detection Warnings Dissemination

Tsunami Public Bulletins
Publ
ic
Tsunami Exchange Bulletins
Bulletin-1 EQ info, Tsunamigenic poten.
Bulletin-2, 3,4…. T1, T2, T3, T4,
Max_beach, Depth, Obs
Bulletin-1 EQ info, Tsunamigenic
potential
Bulletin-2, 3,4…. T2,Max_beach, Obs
Final Bulletin Threat Passed
(i) Tsunami Exchange and (ii) Tsunami Public
MoES MHA
NDMA
Final Bulletin Threat Passed
WARNING
ALERT
WATCH
Threat
Passed
INCOIS
Bulletin Types and Content
WARNING
ALERT
Threat Passed
Bulletin type Information
Time of issue (Earthquake Origin time as T0) mins
Type-1 Preliminary EQ Parameters T0 + 10
Type-2
No Threat Information from Model Scenarios
T0 + 20 Threat (WARNING / ALERT / WATCH) Information from Model Scenarios
Type-2 Revised EQ Parameters and model results
as and when revised earthquake parameters are available
Type-3 Real-time water level observations indicating Tsunami Generation
as and when the first real-time water level observation is available
Type-3
Real-time water level observations indicating Tsunami Generation + THREAT PASSED information for individual Zones
Hourly update / as and when the subsequent real-time water level observations are available
Type-4 (Final )
No significant tsunami
Threat Passed
120 mins after the last exceedance of 0.5 M threat threshold at last Indian Ocean member state
All Bulletins are sequentially numbered regardless of the bulletin type

Cyclone Monitoring -HUDHUD
Lead
Time
(h)
Landfall Point
Error
(km)
Landfall
Time Error (hour
s)
12 10 0 24 20 0 36 17 -4 h 48 04 -4 h 60 08 -3 h 72 02 -1 h 84 24 -3 h 96 40 - 3 h
Observed and Forecast Track of Cyclone, HUDHUD based on 1200 UTC of 09 October 2014 (67 hours before landfall) Landfall took place around 0700 UTC of 12 October 2014
• Two Cyclones, Hud Hud and Nilopher were predicted well in advance and sufficient time was available to respond
• All aspects of genesis, intensity, track, landfall, associated rainfall, gale wind and storm surge were predicted
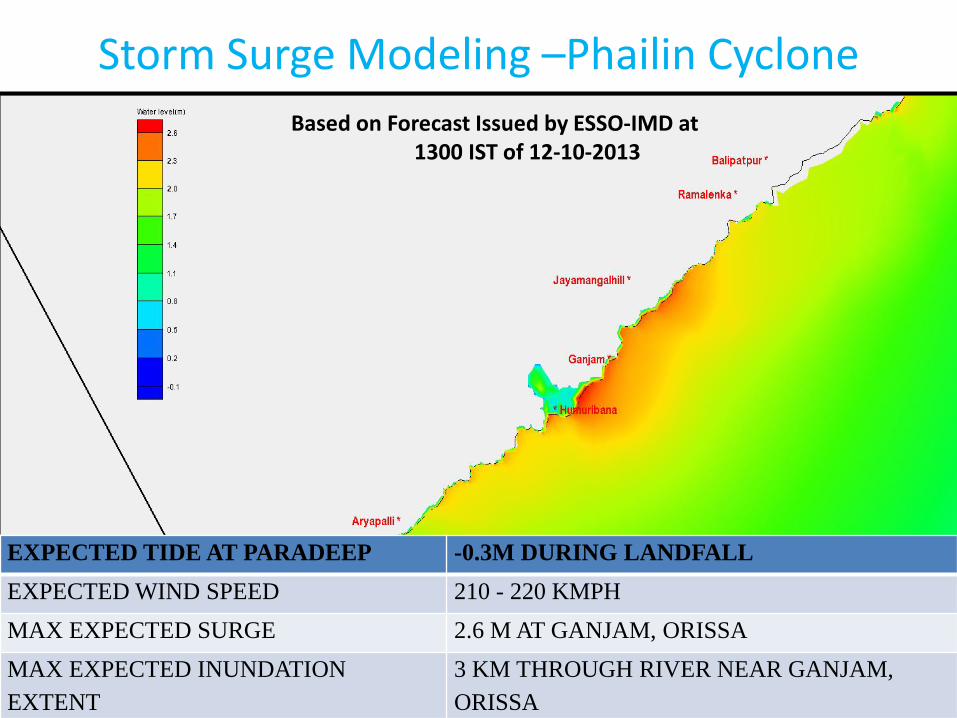
Storm Surge Modeling –Phailin Cyclone
Based on Forecast Issued by ESSO-IMD at 1300 IST of 12-10-2013
EXPECTED TIDE AT PARADEEP -0.3M DURING LANDFALL
EXPECTED WIND SPEED 210 - 220 KMPH
MAX EXPECTED SURGE 2.6 M AT GANJAM, ORISSA
MAX EXPECTED INUNDATION EXTENT
3 KM THROUGH RIVER NEAR GANJAM, ORISSA

11
Website Web GIS Facility
Bulletins of Hudhud Graphical products of Hudhud advisory
Development of a website for storm surge warning system is completed
Bulletins are published in real time and are tested during Phailin and made operational during Hudhud cyclone
Website is functioning as expected and is user-friendly to access both information and graphical products.
WebGIS facility is enabled where user can overlay satellite pictures, track and can asses the threat of the storm surge and inundation by panning and zooming facility.
Storm Surge Website


District Level Forecast & Agro-Met Advisories
• Based on Multi-Model Ensemble (MME), forecast issued for 596 districts (Rainfall, Max and Min temp., Total cloud cover, Surface Relative humidity & Wind). Accuracy: 70-75 %.
• Bi-weekly Agromet Advisory Bulletins (608 districts). State and national level composite advisories also issued. Advisories at block level to be initiated.
• Dissemination: Print, Radio, TV, Web, Mobile. 7 Million farmers use mobiles. About 50 % farmers are using the advisories.
• Estimated Contributions to National GDP Rs. 50,000 crores.
(mm)
Live Advisory

City Weather Forecast Covers 324 major cities and
tourist locations Updated 2 times a day and
contains Daily weather observations Forecasts for Temperature
(Min. & Max.), Weather outlook (rainfall, fog, clear sky etc.) for next 7 days
Last 7 days temperature trend General monthly climatology Climatology of extreme
weather events Available on SMS as well
Live Forecast

SAFAR-Delhi @MoES
PM2.5: Number of Days (% ) per year in Different Categories
S.N. PM2.5 (µg/m³) Range Attributes 2011 (%) 2012 (%) 2013
(%) Average (%) 2011-2013
1. 0-60 GOOD 30 32 21 27.7 2, 61-90 MODERATE 24 24 23 23.7 3. 91-210 POOR 27 34 50 37.0 4. 211-252 VERY POOR 8 4 4 5.3 5. 253 & Above CRITICAL 11 7 3 7.0
PM10: Number of Days (%) per year in different categories
S.N. PM10 (µg/m³) Range Attributes 2011 (%) 2012 (%) 2013
(%) Average (%) 2011-2013
1. 0-100 GOOD 12 19 18 16.3 2. 101-150 MODERATE 19 13 24 18.7 3. 151-350 POOR 54 54 53 53.7 4. 351-420 VERY POOR 9 4 5 6.0 5. 421 & Above CRITICAL 6 7 3 5.3
DELHI AIR QUALITY STATUS (α Severity) (2011-2013)
DOMINANCE OF MIDDLE LEVEL-3 (POOR) POLLUTION EVENTS

Pathway to Climate Risk Management
pasess through Disaster Risk Management
[as climate change brings additional degree of Vulnerability]
• Population to be affected
• Densely populated villages
•Areas under threat
• Threat to Crops
• Damage to Structures
• Rail and Road network in the affected areas
• Vulnerable points
• Cyclone shelters
Information From DSS include …


THATCHEDHOUES

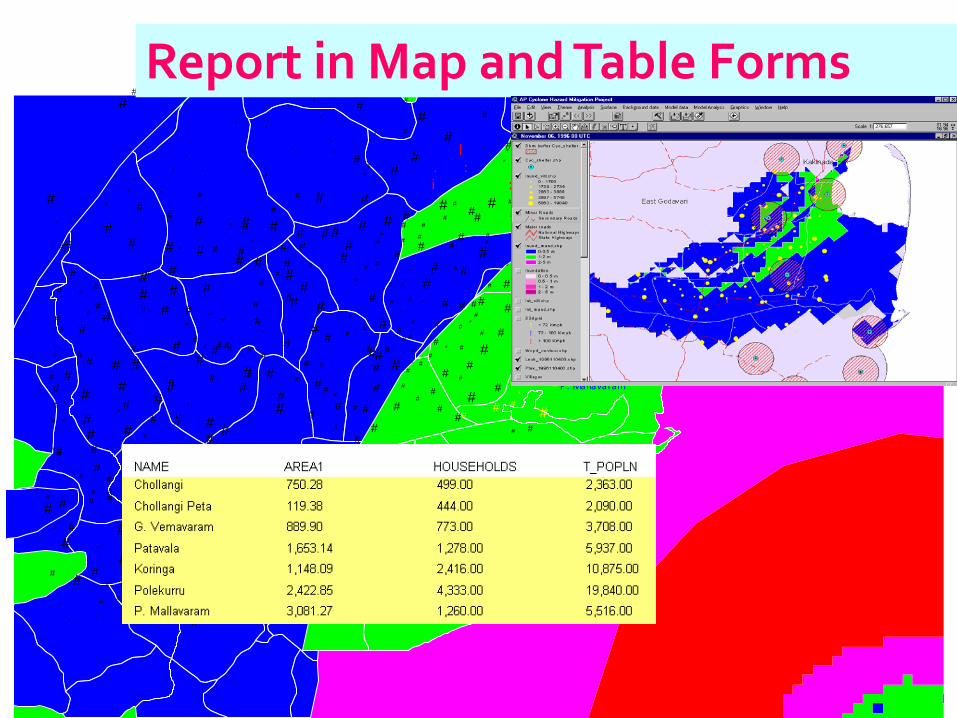
DSS Generating Sample Maps
# # # #
# # #
#
# # # # #
#
# # # #
# #
# #
# # #
# #
#
# # #
#
# #
#
# #
#
#
# # # # #
# #
#
# #
# #
# #
#
#
#
#
#
#
#
# #
#
# #
# # #
# # # #
# # #
# #
# # # # # #
# #
#
# # # #
# # #
#
# # #
#
# # #
# # # #
# # #
# # # # # #
# #
#
# #
#
#
# # # #
# # #
# #
# #
# #
# # # #
# # # # #
# #
# #
#
#
# # #
#
# # #
#
# # #
#
# # #
# #
# #
# # #
#
# #
#
# #
#
# #
# #
# #
# #
# # #
# # # # # #
#
# #
# #
#
# #
#
# #
# #
#
# # #
# # #
# # # # #
# #
#
# # # #
# #
# # #
# # # # #
# #
# #
#
# # #
#
# #
# #
#
# #
# # # #
# # #
#
# #
# # # #
# #
# # #
# #
# # # # #
# # #
# #
#
# # #
# # # # #
# #
# #
# #
# # # # #
# # #
# #
#
# #
# #
# # # #
#
# #
#
#
#
# #
# # #
# # # #
#
#
# #
#
# # # #
# # #
# # #
# #
# #
# # # #
#
# #
# #
# #
# #
#
# #
# #
#
# #
#
#
# # # #
# # #
# #
#
# # #
#
#
# # # # #
# #
# #
# #
# #
#
# #
#
# #
#
# #
#
# #
#
# # # #
#
# # #
# #
# # # #
# # #
# # #
# # #
#
# # # #
# #
# # #
#
#
# #
# # #
# # # #
# # #
# #
# # # # # #
#
# #
#
#
#
#
#
#
# #
#
#
# #
#
#
#
#
#
# #
# #
#
#
#
#
#
#
#
#
#
#
# #
#
#
#
#
C h o l l a n g i
C h o l l a n g i P e t a G . V e m a v a r a m
P a t a v a l a
K o r i n g a
P o l e k u r r u P . M a l l a v a r a m
l . :
i :
KAKINADA BAY
Report in Map and Table Forms

DSS identifying Cyclone Shelters

CYCLONE HAZARD MAPS

DSS identifying Cyclone Shelters

Inundation map of Nellore District (Units:Cm)
Inundation map of Nellore District (Units:Cm)
Flood Inundation Maps

Composite Multi-hazard line and future shoreline overlaid on DEM
Case Study
Building polygons are in hazard area (pink) and non-hazard area (green) are overlaid

Risk Mapping and Disaster Management

3D GIS
Main window shows 3D model of the Earth surface. The cities having 3D building models are marked by colored flags.

Allows to select any area of the Earth surface and zoom in on this area up to the highest resolution 60 cm (if a certain satellite imagery of the highest resolution is available)

Manipulation with realistic 3D models and textures of real buildings. Inclusion of real object images (peoples, items, signs ) in a 3D model.
The building brief (address, telephone, owner) appears in the pop-up information box.

The example of design a photographically exact 3D model. These real buildings are the buildings for public worship in Nagapattinam (India).

Districts wise status
Long-term shoreline changes

Design of Coastal Protection Structures Addressing the issue of
continuous erosion along Puducherry coast
Puducherry government implemented the Beach Nourishment prescribed by ESSO-NIOT which resulted in formation of 60m wide beach near New Pier.
Now Puducherry government has requested for restoration of beach
Preliminary Desk Studies are carried out for Hybrid Solution.
An Offshore Submerged Reef in 4-5m depth along with Beach Nourishment is being considered for the Puducherry Beach Restoration
Light House
Northern Breakwater
Northern Breakwater
Light House September -
2013 February -
2014
Lay out of proposed Hybrid Solution Numerical Modeling of Offshore

Ministry of Earth Sciences – Earth System Science Organization Activities Critical for Coastal Areas
• Observing Systems for Atmospheric and Oceanic Science & Services – multi-scale networks over Land (Doppler Weather Radars; Automatic Weather Stations/Rain Gauges; High Wind Speed Recorders etc.), Sea (moored and drifting buoys, Argo Floats, ADCP and Current Moorings etc.), in-situ airborne & ship borne platforms and Satellite Based systems (INSAT, Kalpana, OCEANSAT, Megha Tropique, NOAA, EUMETSAT etc.) for real time data transmission and reception
• 24X7 system of severe weather survellance and forecasting (continuously scaling up) - Cyclones; Tsunami and Storm Surges; other severe weather systems; River basin scale meteorological support for CWCs river flood warning system
• Continuously monitoring the pattern of sea level changes all along the Indian coastline with established 26 tide gauges.
• Vulnerability of the Coastal Zones – [3-Dimensional Geographical Information System (3D GIS) maps for the entire coastal stretch; mosaic with other available topographic and thematic high resolution maps at 1:100000; 1:25000; 1:5000 scale; shoreline change maps at 1:25000 scale] for effective emergency response, risk reduction, sustainable shoreline management and natural resource management
• Climate services information products viz. spatial monthly scale anomalies of rainfall and temperature; minimum/maximum temperature; standardized Precipitation Index (SPI) etc. along with severe weather events.
