k. k. podlesskii l. l. perchuk w. v. maresch semi...
TRANSCRIPT

ORIGINAL PAPER
T. V. Gerya � K. K. Podlesskii
L. L. Perchuk � W. V. Maresch
Semi-empirical Gibbs free energy formulations for minerals and fluidsfor use in thermodynamic databases of petrological interest
Received: 13 October 2003/Accepted: 24 May 2004
Abstract The P–T partition function in statisticalthermodynamics can be used to derive semi-empiricalformulations of the Gibbs free energy G for mineralsand fluids. Parameterization of these equations in-cludes simultaneous regression of experimental heatcapacity and molar volume data, allowing fitting, ap-praisal and optimization of various data sources, asrequired in the construction of internally consistentpetrological data bases. This approach can also beextended to minerals with k-transitions and to fluids byconsidering the Gibbs free energy as a function ofpressure P, temperature T and an ordering parameterXa, so that accurate modelled representation andextrapolation of the thermodynamic properties of largenumbers of petrologically significant minerals andcoexisting fluids can be attained. The orderingparameter is chosen to denote the equilibrium molefraction (thermodynamic probability) of ordered clus-ters (structural units) in a substance when G(T,P,Xa) ¼ min. The procedure is tested on existing experi-mental data for the system MgO–SiO2–H2O. Theproposed Gibbs free energy formulation permits ther-modynamic properties of minerals, fluids and phaseequilibria to be described and extrapolated over awide range of pressure (0–800 kbar) and temperature
(20–3000 K), thus allowing effective use in thermody-namic data bases of petrological interest.
Keywords Equations of state � Thermodynamic databases � Partition function � Ordering–disorderingprocesses � Molecular clusters in fluids
Introduction
Internally consistent thermodynamic databases (e.g.Karpov et al. 1976; Helgeson et al. 1978; Dorogokupetsand Karpov 1984; Berman 1988; Grevel 1995; Hollandand Powell 1990, 1998; Chatterjee et al. 1994, 1998;Berman and Aranovich 1996; Gottschalk 1997; Saxenaet al. 1993) are widely used for the construction ofpetrologically relevant phase diagrams, as well as for themodelling of the compositional and physical properties ofrocks and minerals at the high pressures and tempera-tures. In petrological systems, where reactions at depth inthe Earth are of foremost interest, pressure, temperatureand composition generally are the independent variablesof choice, making the Gibbs free energy the most usefulstability criterion. In thermodynamic data bases theGibbs free energy is usually cast in the form
GP ;T ¼ DHo � T � So þZT
To
½CpoðT Þ�dT
� T �ZT
To
½CpoðT Þ=T �dT þZP
Po
½VðP ;T Þ�dP ; ð1Þ
where P is pressure, T is temperature, GP,T is the molarGibbs free energy at given P and T; DHo and So are theenthalpy of formation and third-law entropy, respec-tively, of a substance at standard pressure Po and tem-perature To; Cpo(T) is the heat capacity as a function oftemperature at standard pressure Po; V(P,T) is the molarvolume of a substance as a function of pressure andtemperature.
Phys Chem Minerals (2004) 31: 429–455 � Springer-Verlag 2004DOI 10.1007/s00269-004-0409-8
T. V. Gerya � W. V. MareschInstitut fur Geologie, Mineralogie und Geophysik,Fakultat fur Geowissenschaften, Ruhr-Universitat Bochum,44780 Bochum, Germany
T. V. Gerya � K. K. Podlesskii � L. L. PerchukInstitute of Experimental Mineralogy,Russian Academy of Sciences Chernogolovka,Moscow district, 142432, Russia
Present address: T. V. Gerya (&)Geologisches Institut - ETH - Zurich,CH-8092 Zurich, Switzerlande-mail: [email protected].: +41-1-6322336Fax: +41-1-6321030
L. L. PerchukDepartment of Petrology, Geological Faculty, Moscow StateUniversity, Vorobievy Gory, Moscow, 119899 Russia

Equation (1) can lead to a direct representation ofthe Gibbs potential as a function of P and T whenCpo(T) and V(P,T) data are available for integration.Such data are still a major problem, however, andvarious empirical and semi-empirical power expansionseries for Cpo(T) and V(P,T) have been suggested (see,for example, the reviews of Richet et al. 1992 andSaxena et al. 1993) that attempt to systematize theavailable, usually limited experimental data. Of par-ticular importance is the fact that the form of the fittedpolynomial should ideally have a physical significance(e.g. Dubrovinskaya et al. 1997), in order to allowrealistic extrapolation beyond the range of the availabledata base. As discussed in detail by Richet et al. (1992),Saxena et al. (1993) and Dubrovinskaya et al. (1997),this limitation is particularly critical with respect toCpo(T). While experimental calorimetric measurementleads to isobaric heat capacity Cpo(T), existing modelsfor calculating calorimetric properties of mineralsbased on lattice dynamics lead instead to the isochoricheat capacity Cv. In addition, the vibration spectra ofmany of the minerals necessary for a useful petrologicaldata base are still extremely complex and poorlyunderstood. Thus, these models are limited in theireffectiveness for providing a physical description ofthe temperature dependence of Cpo. All availablepolynomial fits for Cpo(T) of either experimental dataor analogy-based estimates (cf. Richet et al. 1992),although widely used in petrological circles (Berman1988; Holland and Powell 1990, 1998), are at presententirely empirical.
Theoretical approaches for modelling CV turn tospectroscopic data and statistical thermodynamics. Mo-lar volume and temperature are taken as independentvariables and the Helmholtz free energy FV,T is chosen asthe equilibrium potential for minerals (e.g. Kieffer 1985;Polyakov and Kuskov 1994; Dubrovinskaya et al. 1997)and fluids (e.g. Stewart and Jacobson 1989; Saul andWagner 1989; Hill 1990). Theoretically derived equationsfor the Helmholtz free energy of solids (e.g. Kieffer 1985;Polyakov and Kuskov 1994; Dubrovinskaya et al. 1997)are primarily based on a statistical mechanical approachemploying the canonical partition function in terms ofmolar volume and temperature that treats minerals assystems of quantum oscillators (e.g. Kubo 1965; Todaet al. 1992; Landau and Lifshitz 1959). Parameterizationof these equations is based on either vibration spectra (e.g.Polyakov and Kuskov 1994) or data on isochoric heatcapacity and volume (e.g. Dubrovinskaya et al. 1997) atdifferent pressure and temperature. Analytical expres-sions for any other thermodynamic parameters (e.g. iso-baric heat capacity, Gibbs free energy, entropy etc.) canthen be derived using standard thermodynamic relations.Thus theGibbs free energy of a substance at givenVandTcan be calculated asGV,T ¼ FV,T )VƶFV,T/¶V. However,this approach does not lead to a direct formulation of theGibbs free energy as a function ofP andT, as is preferablefor a system of petrological interest, nor does it provide abasis for directly fitting experimental Cpo(T) data.
It has recently been shown that an analogous statis-tical approach (Kut’in and Pyadushkin 1998; Geryaet al. 1998) can be based on a partition function inpressure and temperature (e.g. Kubo 1965; Toda et al.1992) to obtain expressions for the Gibbs free energy ofsolids as a function of P and T rather than V and T.Parameterization includes simultaneous regression ofCpo(T) and V(P,T) data, allowing fitting and optimi-zation of various data sources, as required in the con-struction of an internally consistent petrological database. This semi-empirical approach can also be extendedto minerals with k-transitions (e.g. Gerya et al. 1998)and to fluids (Gerya and Perchuk 1997), by consideringthe Gibbs free energy G as a function of pressure, tem-perature and an ordering parameter, so that accuratemodelled representation and extrapolation of the ther-modynamic properties of large numbers of petrologi-cally significant minerals and coexisting fluids can beattained. The present paper is intended to summarizethis new approach and to test it against well-establisheddata on both the thermodynamic properties of somecritical phases of petrological interest and on phaseequilibria at high pressures and temperatures.
Summary of the basic method
Derivation of basic equations
For a substance in a crystalline state considered as asystem of independent quantum oscillators (e.g. Landauand Lifshitz 1959), the Gibbs free energy can beexpressed using the P–T partition function of statisticalthermodynamics (Toda et al. 1992). Using a set ofapproximations for the calculation of the statistical sumover states, the following expression of the molar Gibbsfree energy can be obtained (Appendix 1)
Gs ¼ Hs � TS os þRT
Xn
i
ci lnf1� exp½DHsi=RT �g; ð2Þ
where R is the gas constant, Hs and Sso are, respectively,
molar enthalpy and entropy for a state of zero-pointvibrations, n is the number of groups of oscillatorsconsidered, ci is a statistical weight of the i-th groupequal to the number of oscillators in the i-th groupdivided by NA (Avogadro’s number), and DHsi is thesystem enthalpy change related to transition betweenneighbouring energy levels in the i-th group (taken forNA oscillators). The effects of pressure on Hs and DHsi
are given by
Hs ¼ H os þ
ZP
Po
VsdP ; ð3Þ
DHsi ¼ DH osi þ
ZP
Po
DVsidP ; ð4Þ
430

where Po is standard pressure, Hso is molar enthalpy at 0
K and Po, DHsio is the DHsi value at Po, Vs is molar
volume at 0 K as a function of pressure, DVsi is thesystem volume change due to transition between neigh-bouring energy levels for the i-th group of oscillators asa function of pressure (taken for NA oscillators).Theoretical forms of the pressure dependence of Vs andDVsi are unknown, and thus some well-establishedsemi-empirical functions must be employed. One of thepossible choices is the Murnaghan equation, whichdemonstrates good extrapolation properties in a wideregion of pressure at a given temperature (e.g. Zharkovand Kalinin 1971; Saxena et al. 1993):
Vs ¼ V os ðPo þ /Þ1=5=ðP þ /Þ1=5; ð5Þ
DVsi ¼ DV osi ðPo þ /Þ1=5=ðP þ /Þ1=5; ð6Þ
where V os is molar volume at 0 K and Po, DVo
si is the DVsi
value at Po, and / is an empirical parameter approxi-mating the mean effect of attractive interaction betweenthe atoms in the whole pressure range. From Eq (3)–(4),the effect of pressure on Hs and DHsi is given by
Hs ¼ Hos þ V o
s W; ð7Þ
DHsi ¼ DHosi þ DV o
si W; ð8Þwhere W ¼ 5=4ðP0 þ /Þ1=5½ðP þ /Þ4=5 � ðP0 þ /Þ4=5�:
Standardizing Eq. (2) relative to To and Po with areduced number of empirical terms (n £ 5, Gerya et al.1998), and taking into account Eq. (7)–(8), yields
Gs ¼ HToPo � TSToPo þ V os Wþ
Xn�5i¼1
ci½RT1nð1� eiÞ
� DHosið1� T=ToÞeoi=ð1� eoiÞ �RT1nð1� eoiÞ�;
ð9Þ
SToPo¼�ð@Gs=@T ÞToPo
¼ Sos þXn
i
ci½DHosi=Toeoi=ð1� eoiÞ�R1nð1� eoiÞ�;
ð9aÞ
HToPo ¼ Hos þ
Xn
i
ciDHosieoi=ð1� eoiÞ; ð9bÞ
ei ¼ expð�DHsi=RT Þ (9c)
and
eoi ¼ expð�DHosi=RToÞ; (9d)
where GToPo, HToPo, and SToPo are, respectively, themolar Gibbs free energy, enthalpy and entropy of thesubstance at standard To and Po. If To is taken to be 0K, the terms in Eq. (9) containing To are equal to zero.Equation (9) directly expresses the Gibbs potential of acondensed substance as a function of P and T.
An empirical parameterization of Eq. (9) can nowbe done using experimental data on isobaric heat
capacities and volume measurements. Analytical expres-sions forCp andV can be obtained fromEq. (9) as follows
Cp ¼ �T ð@2Gs=@T 2Þ ¼Xn�5i¼1
ciDH2si=RT 2½ei=ð1� eiÞ2�;
ð10Þ
V ¼@Gs=@P ¼ ½Xn�5i¼1
ciDV osi ei=ð1� eiÞ
þ V os �ðPo þ /Þ1=5=ðP þ /Þ1=5: ð11Þ
Calculated examples
As an example of the applicability of Eqs. (9)–(11) forthe description of the thermodynamic properties ofcrystalline substances, data for periclase, brucite, coesiteand stishovite (Table 1) are considered. With n=3,So
s =0 (according to Nernst’s law), Po=1 bar andTo=298.15 K, an equation of molar Gibbs free energyfor these minerals takes the form (Gerya et al. 1998):
Gs ¼ H298;1 þ V os Wþ
X3i¼1
ci½RT 1nð1� eiÞ
� DHosieoi=ð1� eoiÞ�; ð12Þ
where ei ¼ exp½�ðDHosi þ DV o
si WÞRT �; eoi ¼ expð�DHosi=
R298:15Þ; W ¼ 5=4ðPo þ /Þ1=5½ðP þ /Þ4=5 � ð1þ /Þ4=5�:Entropy SToPo is absent from Eq. (12) since So
s=0 andall other terms in Eq. (9a) are cancelled by corre-sponding terms in Eq. (9). Third-law entropy can becalculated according to Eq. (9a) assuming that low-temperature heat capacity (20–298 K) is accuratelyrepresented by Eq. (10).
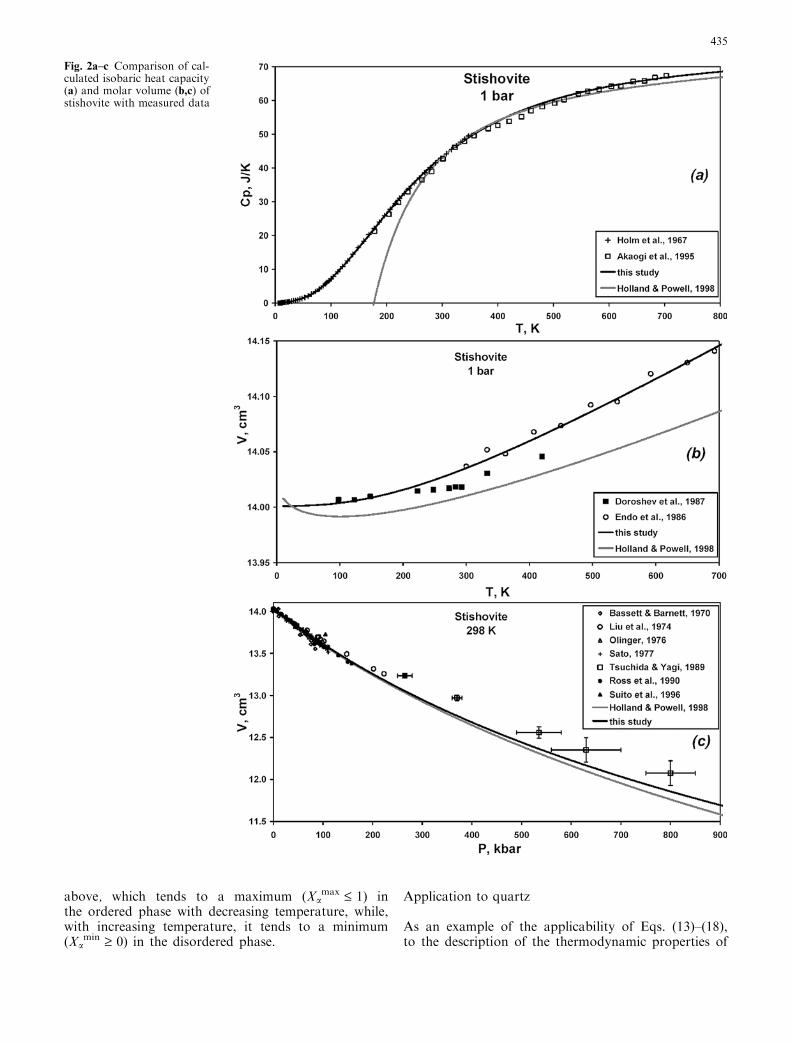
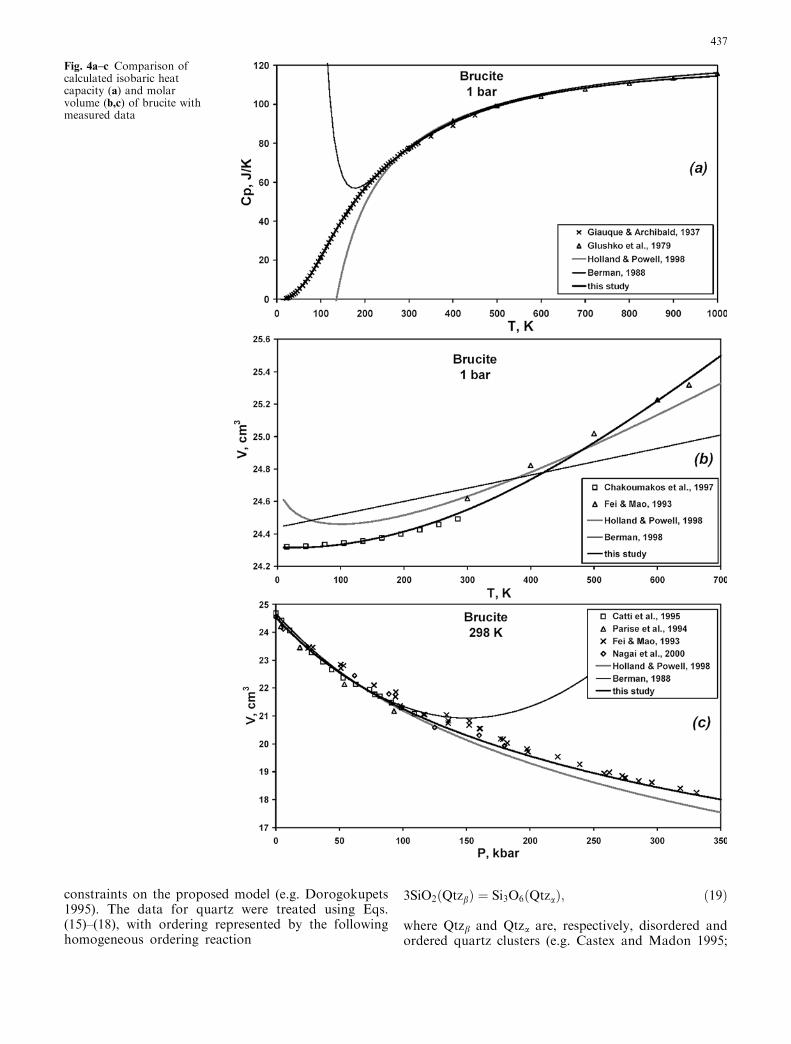
The results for the parameters of Eq. (12) are listedin Table 2. The derivation of these internally consistentthermodynamic data was performed by a non-linearleast-squares method. Processing of the experimentaldata was done in cyclic fashion with quality control ofthe refined parameters. The measured parameters arereproducible within experimental error. To illustratethis, the calculated results for isobaric heat capacityand volume are plotted against the original experi-mental data in Figs. 1–4. It is seen that by comparisonto the power expansion formulations used in petro-logical data bases (e.g. Berman 1988; Holland andPowell 1998), Eq. (12) allows a better fit of isobaricheat capacities and volumes over a very wide region ofpressure (0–800 kbar) and temperature (20–3000 K).Equation (2) requires that ci in Eq. (12) should sum to3v, where m is the number of atoms in the formula unit.This is fulfilled for coesite and stishovite (the sum is 9),but not quite for brucite (the sum is 14.6 instead of 15)and periclase (the sum is 6.6 instead of 6). These dis-crepancies are due to the relatively low value of n (= 3)chosen in Eq. (12), which may not be sufficient to
431

reflect the actual number of different groups of oscil-lators.
Modification to include minerals with k-transitions
Derivation of basic equations
Some petrologically important phases such as quartzdemonstrate specific changes in thermodynamic prop-erties that are related to a k-transition not accounted forin Eq. (9). Most approaches attempt to describe thiseffect in terms of the formalism of Landau theory (e.g.Carpenter et al. 1998; Dove 1997; Holland and Powell1998). Landau theory (e.g. Landau and Lifshitz 1959)suggests that the Gibbs potential of a crystalline phase inthe region of the k-transition can be considered as afunction of P, T and an order parameter g. The equi-librium order parameter corresponds to a minimum ofthe Gibbs free energy G(T,P,g) ¼ min. This general
formalism is consistent with thermodynamic concepts ofhomogeneous equilibria in crystals (Thompson 1969)widely developed for phases of petrological interest (e.g.Holland and Powell 1996). A similar approach hasrecently been applied to the k-transition in quartz(Gerya et al. 1998).
A thermodynamic process related to a k-transition ina one-component mineral can be viewed as an internalordering reaction (transition)
aA ¼ a; ð13Þwhere A is a disordered cluster (structural unit) , a ¼ Aa
is an ordered cluster (structural unit), a is the stoichi-ometric coefficient. The thermodynamic equilibrium forReaction (transition) 13 is given by
DGord ¼ RT lnðKordÞ þ DGoord þ DGe
ord ¼ 0; ð14Þwhere Kord ¼ Xa/(XA
a) and XA+Xa ¼ 1. XA and Xa arethe mole fractions (thermodynamic probabilities) of thedisordered and ordered clusters (structural units),
Table 1 Source of experimental data used in this study
Starting data References
Isobaric heat capacity of quartz Gurevitch and Khlyustov (1979); Watanabe (1982); Hemingway (1987); Grønvold et al.(1989); Hemingway et al. (1991); Akaogi et al. (1995)
Molar volume of quartz Jay (1933); Ackermann and Sorell (1974); Danielsson et al. (1976); Lager et al. (1982);Olinger and Halleck (1976); Jorgensen (1978); d’Amour et al. (1979); Levien et al.(1980); Hazen et al. (1989); Kihara (1990); Vaidya et al. (1973); Glinnemann et al.(1992)
Adiabatic modulus of quartz, (¶T/¶P)S Boehler et al. (1979); Boehler (1982)Relative molar enthalpy of quartz Richet et al. (1982)Isobaric heat capacity of coesite Holm et al. (1967); Akaogi et al. (1995)Molar volume of coesite Bassett and Barnett (1970); Levien and Prewitt (1981) Galkin et al. (1987); Smyth et al.
(1987)Relative molar enthalpy of coesite Holm et al. (1967); Akaogi and Navrotsky 1984; Akaogi et al. (1995)Isobaric heat capacity of stishovite Holm et al. (1967); Akaogi et al. (1995)Molar volume of stishovite Bassett and Barnett (1970); Liu et al. (1974); Olinger (1976); Sato (1977); Endo et al.
(1986); Doroshev et al. (1987); Tsuchida and Yagi (1989); Ross et al. (1990) Suito et al.(1996)
Enthalpy of phase transition quartz-coesite Holm et al. (1967); Akaogi and Navrotsky (1984); Kuskov et al. (1991); Akaogi et al.(1995)
Phase transition a-quartz - b-quartz Gibson (1928); Yoder (1950); Cohen and Klement (1967); Koster van Groos and TenHeege (1973); Mirwald and Massone (1980b); Shen et al. (1993)
Phase transition quartz—coesite Boyd and England (1960); Kitahara and Kennedy (1964); Mirwald and Massone(1980a,b); Akella (1979); Bohlen and Boettcher (1982); Ishbulatov and Kosyakov(1990); Bose and Ganguly (1995)
Phase transition coesite–stishovite Akimoto and Syono (1969); Yagi and Akimoto (1976); Suito (1977); Zhang et al.(1993), (1996); Serghiou et al. (1995)
Water: tabulated data on molar Gibbsfree energy, molar entropy and molarvolume of water at T = 0–1000 �C andP = 1–10 000 bar; tabulated P–V–T dataon liquid-gas transition
Saul and Wagner (1989)
Isobaric heat capacity of periclase Giauque and Archibald (1937); Barron et al. (1959); Glushko et al. (1979); Krupka et al.(1979); Watanabe (1982)
Molar volume of periclase Reeber et al. (1995); Fiquet et al. (1999); Fei (1999) Dewaele et al., (2000); Zhang (2000)
Adiabatic modulus of periclase (¶T/¶P)S Boehler (1982)Relative molar enthalpy of periclase Richet and Fiquet (1991)Isobaric heat capacity of brucite Giauque and Archibald (1937); Glushko et al. (1979)Molar volume of brucite Chakoumakos et al. (1997); Catti et al. (1995); Parise et al. (1994); Fei and Mao (1993);
Nagai et al. (2000); Xia et al. (1998)Phase transition brucite = periclase + water Franz (1982); Schramke et al. (1982); Johnson and Walker (1993); Aranovich and
Newton (1996)
432

respectively. DGoord and DGe
ord are changes of thestandard and excess Gibbs free energy, respectively, dueto Reaction (13). According to our formalism, ordered/disordered clusters need not always be static (long-lived)structural features, but may reflect dynamic (short-lived)variations due to the thermal vibration of atoms (e.g.Kihara 1990). This does not preclude a uniform ther-modynamic treatment, but instead changes the inter-pretation of the ordering parameter Xa. For staticfeatures this parameter represents the mole fraction ofordered clusters, while for dynamic variations it standsfor the thermodynamic probability of finding the givenstructural units in the ordered state. The additionalmolar Gibbs free energy relative to the ordered state(Xa ¼ 1) is defined as (Gerya et al. 1998):
Ga ¼fRT ½ð1� XaÞ lnð1� XaÞ þ Xa lnðXaÞ�� DGo
ordð1� XaÞ=aþ DGeordg=½1þ Xaða� 1Þ�;
ð15Þwhere DGo
ord ¼ DHoord + DVo
ordY, Geord ¼WG(1 )Xa)
(Xa) , WG ¼WH + WVY.
Geord is the integral excess Gibbs free energy of
mixing of ordered and disordered clusters expressedusing the Margules formalism (e.g. Thompson 1969),with the expressions for DGo
ord and WG formulated byanalogy to Eq. (7).
If the k-transition leads to significant changes in thethermal vibrations of atoms, this must be taken intoaccount in the vibrational part of the Gibbs potential.The corresponding formulation derived from the P–Tpartition function by analogy to Eq. (9) takes the form(see Appendix 2)
Gs¼HToPo�TSToPoþV os
þXn�5i¼1
cifRT lnfð1� eaiÞð1�ebiÞ=½ð1� ebiÞ
þ ekiðebi� eaiÞ�g�DH osia ð1�T =ToÞeoai=ð1� eoaiÞ
�RT lnð1� eoaiÞg; ð16Þ
where SToPo ¼ �ð@Gs=@T ÞToPo
¼ S os þ
Xn
i
ci½DH osi =To eoai=ð1� eoaiÞ �R lnð1� eoaiÞ�;
HToPo ¼ Hos þ
Xn
i
ciDH osi eoai=ð1� eoaiÞ;
eai ¼ expð�DHsia=RT Þ; ebi ¼ expð�DHsib=RT Þ;
eki ¼ expð�DHsik=RT Þ; eoai ¼ expð�DH osia =RToÞ;
DHsia ¼ DH osia þ DV o
sia W; DHsib ¼ DH osib þ DV o
sib W;
and DHsik ¼X2k¼0ðDH o
sikk þ DV osikk WÞ ðXaÞk:
DHsia and DHsib are values of DHsi for ordered anddisordered substances, respectively; DHsik is the apparententhalpy parameter dependent on Xa and related to theorder–disorder transition for the i-th group of oscilla-tors.
Under isothermal-isobaric conditions, an equilibriumin a non-reacting phase is given by
Table 2 Calculated parameters of Eqs. (12), (20) and (30) for the molar Gibbs free energy of minerals and water
Parameter Coesite Stishovite Brucite Periclase Quartz Water
H298,1, J )907051.35 )870123.92 )925267.08 )601500.00a )910712.59a )286831.56a
S298,1, J K)1 – – – – – 65.188Vs
o, J bar)1 2.05333 1.40010 2.43162 1.12228 2.25888 1.71382/, bar 217664 612340 98040 301795 71662 6209c1 1.44913 0.28816 1.87663 1.96612 1.42569 7.23576c2 3.71385 2.73177 8.55012 4.12756 3.50283 0.31482c3 3.83702 5.98007 4.16639 0.53690 4.07148 –DHs1
o, J 1435.64 1179.01 1637.57 2966.88 1278.08 4586.46DHs2
o, J 4099.77 3845.99 4403.89 5621.69 3911.05 –DHs3
o, J 10479.16 8042.74 11614.44 27787.19 10469.21 –DVs1
o, J bar)1 0.00158600 0.00233400 0.00541752 0.00352971 0.00312581 0.04310884DVs2
o, J bar)1 =DVs1o =DVs1
o =DVs1o =DVs1
o =DVs1o –
DVs3o, J bar)1 =DVs1
o =DVs1o 0.07026587 0.19849568 =DVs1
o –DHo
ord, J – – – – –2636.90 )44838.80DSo
ord, J K)1 – – – – – )122.397DCpoord, J K)1 – – – – – 21.486DVo
ord, J bar)1 – – – – )0.127829WH
1, J)1 – – – – 14255.08 )28793.19
WS1, J K)1 – – – – – )11.704
WCp1, J K)1 – – – – – 5.086
WV1, J bar)1 – – – – 0.633504 –
DHsko, J – – – – 12947.71 –
DVsko, J bar)1 – – – – 0.242077 –
aThe H298,1 value has been adjusted to obtain the enthalpies of formation at 298.15 K and 1 bar, as recommended by CODATA (1978)
433

Gsþa ¼ Gs þ caGa ¼ min; ð17Þ
@Gsþa=@Xa ¼ 0; ð18Þwhere Gs+a is the molar Gibbs free energy of a sub-stance with a k-transition, Gs is given either by Eq. (7)
when changes in thermal vibrations are insignificant, orby Eq. (16), when these changes must be taken intoaccount, and ca is the number of degrees of freedomcorresponding to the ordering Reaction (13). Xa can beconsidered to be equivalent to the ordering parameter g
Fig. 1a–c Comparison ofcalculated isobaric heatcapacity (a) and molarvolume (b,c) of coesite withmeasured data
434
above, which tends to a maximum (Xamax £ 1) in
the ordered phase with decreasing temperature, while,with increasing temperature, it tends to a minimum(Xa
min ‡ 0) in the disordered phase.
Application to quartz
As an example of the applicability of Eqs. (13)–(18),to the description of the thermodynamic properties of
Fig. 2a–c Comparison of cal-culated isobaric heat capacity(a) and molar volume (b,c) ofstishovite with measured data
435

minerals with a k-transition, the results of theirparameterization can be considered for quartz.Ordering–disordering phenomena in quartz are well
studied over a wide range of P–T conditions andmanifest themselves in anomalous behaviour of heatcapacity and thermal expansion, thus providing tight
Fig. 3a–c Comparison ofcalculated isobaric heatcapacity (a) and molar vol-ume (b,c) of periclase withmeasured data
436
constraints on the proposed model (e.g. Dorogokupets1995). The data for quartz were treated using Eqs.(15)–(18), with ordering represented by the followinghomogeneous ordering reaction
3SiO2ðQtzbÞ ¼ Si3O6ðQtzaÞ; ð19Þ
where Qtzb and Qtza are, respectively, disordered andordered quartz clusters (e.g. Castex and Madon 1995;
Fig. 4a–c Comparison ofcalculated isobaric heatcapacity (a) and molarvolume (b,c) of brucite withmeasured data
437

Spearing et al. 1992). Using ca ¼ 1 in Eq. (17) and n ¼ 3,Vsia
o ¼ Vsio, Vsib
o ¼ 0, Sso ¼ 0 (according to Nernst’s
law), Po ¼ 1 bar and To ¼ 298.15 K in Eq. (16), theGibbs free energy equation for quartz takes the follow-ing semi-empirical form (Gerya et al. 1998)
Gsþa ¼ H298;1 þ V os W
þX3i¼1
ci�RT lnfð1� eaiÞð1� ebiÞ=½ð1� ebiÞ
þ ekðebi � eaiÞ�g � DH osi eoi=ð1� eoiÞ
�þ fRT ½Xa lnðXaÞ þ ð1� XaÞ lnð1� XaÞ�� ðDHo
ord þ DV oordWÞð1� XaÞ=3
þ ðW H1 þ W V
1WÞð1� XaÞXag=ð1þ 2XaÞ; ð20Þwhere eai ¼ exp[)(DHsi
o + DVsoY)/RT], ebi ¼ exp()D
Hsio/RT), eoi ¼ exp()DHsi
o/R298.15), ek ¼ exp[)(DHsko
Xa2 + DVsk
oY)/RT], Y ¼ 5/4(Po+/)1/5[(P+/)4/5)(1+/)4/5]. Xa is the mole fraction of ordered Si3O6
clusters. The empirical parameters obtained for Eq. 20are presented in Table 2.
Equation (20) allows an accurate description of bothexperimental heat capacity and volume of a- and b-quartz over a wide region of P and T that includes the k-transition (Fig. 5). By comparison with the formulationsof Berman (1988), Dorogokupets (1995) and Hollandand Powell (1998), Eq. 20 demonstrates a superior fit ofthe available experimental data (Fig. 5).
Gibbs potential of fluids
Derivation of basic equations
Fundamental, precise descriptions of the thermody-namic properties of fluid over a wide P–T interval,including the two-phase region, are traditionally basedon the Helmholtz potential and related P ¼ f(V,T)equations of state (e.g. Stewart and Jacobson 1989; Sauland Wagner 1989; Hill 1990). However, it was recentlyshown (Gerya and Perchuk 1997) that a similardescription can be based on the Gibbs potential. Thephenomenological approach suggested by Gerya andPerchuk (1997) uses the concept of an internal reactionof association of molecules to form dynamic (short-lived) clusters in fluids. Such an approach is well devel-oped theoretically for describing the hydrogen bondingin supercritical fluids (e.g. Luck 1980; Gupta et al. 1992)and its potential applicability to any fluid has beendemonstrated (Barelko et al. 1994; Gerya and Perchuk1997).
According to Barelko et al. (1994), the dynamicprocess of association of molecules in any supercriticalfluid can be considered as a chain clusterization reaction
A1 þAn ¼ Anþ1; ð21Þwhere A1 stands for a monomer, and An and An+1
denote clusters of dimensions n and n+1. The thermo-dynamic equilibrium of Reaction (21) is given by
DGcls ¼ RT ln½KclsðnÞ� þ DGoclsðnÞ þ DGe
clsðnÞ ¼ 0; ð22Þ
where Kcls(n) ¼ Xn+1/(X1 Xn) andP1n¼1
Xn ¼ 1; X1, Xn, and
Xn+1 are the mole fractions (thermodynamic probabili-ties) of clusters of dimension 1 (i.e. monomers), n andn + 1, respectively; DGo
cls(n) and DGecls(n) are changes of
the standard and excess Gibbs free energy, respectively,due to Reaction (21). The additional molar Gibbs freeenergy relative to the associated (X1 ¼ 0, X¥ ¼ 1) state isgiven by
Ga ¼X1n¼1
Xn½RT lnðXnÞ þ nðGo1 þ Ge
1Þ
þXn�1m¼1ðDGo
clsðmÞ þ DGeclsðmÞÞ�=
X1n¼1
nXn � ½Go1
þX1�1m¼1
DGoclsðmÞ=1�; ð23Þ
where Go1 and Ge
1 are standard and excess Gibbs freeenergy of monomers, respectively. When the equilibriumconstant of Reaction (22) is assumed to be independentof n, summation in Eq. (23), using Eq. (22), yields
Ga ¼ fRT ½ð1� X1Þ lnð1� X1Þ þ X1 lnðX1Þ�� DGo
clsX1 þ Geg; ð24Þwhere DGo
cls is the change of standard Gibbs free energyin Reaction (21) (independent of n), Ge is the excessmolar energy of mixing, related to the presence of dif-ferent clusters in the fluid. A similar equation was ob-tained by Gerya and Perchuk (1997) by treating thedynamic association process as a simple, short-term‘‘ordering’’ transition
Gas ¼ Liq; ð25Þwhere Gas stands for a molecule in the ‘‘gas-like’’ (free,‘‘disordered’’) mode, and Liq denotes a molecule in the‘‘liquid-like’’ (associated, ‘‘ordered’’) mode. Accordingto Reaction (25) the additional molar Gibbs free energyrelative to the associated (XGas ¼ 0, XLiq ¼ 1) state isgiven by
Ga¼RT ½XLiq lnðXLiqÞþXGas lnðXGasÞ��DGoordXGasþGe;
ð26Þwhere DGo
ord is a change of standard Gibbs free energyin ‘‘ordering’’ Reaction (25). Thus, from the viewpointof thermodynamics, both considerations are equivalentand yield similar results.
A semi-empirical formulation of the last two terms inEq. (26) yields (see Appendix 3)
Ga ¼ RT ½XLiq lnðXLiqÞ þ ð1� XLiqÞ lnð1� XLiqÞ�þ ð1� XLiqÞRT ln½ðP þ /X 2
Liq Þ=Po�� ð1� XLiqÞfDHo
ord � TDSoord
þ DC oP ord½T � To � T lnðT=ToÞ�g
þ fW H1 � TW s
1 þ W Cp1 ½T
� To � T lnðT=ToÞ�gXLiqð1� XLiqÞ; ð27Þ
438

where DHoord, DSo
ord , DCPoord are standard enthalpy,
entropy and heat capacity effects of Reaction (25), WH1,
WS1, W
Cp1 are enthalpy, entropy and heat capacity Mar-
gules parameters.
By analogy with minerals, a standard Gibbs freeenergy, Gs, of fluid in fully associated ‘‘liquid-like’’ state(XGas ¼ 0, XLiq ¼ 1), considered as a system of quantumoscillators, can be approached by Eq. (9). Under
Fig. 5a–c Comparison ofcalculated isobaric heatcapacity (a) and molar vol-ume (b,c) of quartz withmeasured data
439

isothermal-isobaric conditions, equilibrium in a one-phase fluid is given by
Gsþa ¼ Gs þ Ga ¼ min ð28Þ
@Ga=@XLiq ¼ 0: ð29Þwhere Gs+a is the molar Gibbs free energy of a fluid, andGs is given by Eq. 9.
Fig. 6a–c Comparison ofcalculated volume (a), en-tropy (b) and Gibbs energy(c) of water with tabulateddata (Saul and Wagner1989)
440

Thermodynamic properties of aqueous fluid
As an example of the applicability of Eqs. (26)–(29) fordescribing the thermodynamic properties of compressedgases, the results of parameterizing an aqueous fluid canbe considered. The tabulated data for water (Saul andWagner 1989) in the experimentally well-studied regionT ¼ 0–1000 �C and P ¼ 1–10 000 were treated usingEqs. (9) as well as (27)–(29) on the basis of a non-linearleast-squares method.
Using n ¼ 2 in Eq. (9), Po ¼ 1 bar and To ¼ 298.15 Kin Eqs. (9) and (27), the Gibbs free energy equation foraqueous fluid takes the following semi-empirical form,which is also applicable to other gases (e.g. Ar, CO2,CH4; Gerya and Perchuk 1997)
Gsþa¼H298;1�TS298;1þV os WþRT ½c1 lnð1�e1Þ
þc2 lnð1�e2Þ��ðc1þc2Þ½DH os1ð1�T =ToÞeo=ð1�eoÞ
þRT lnð1�eoÞ�þRT ½ð1�XLiqÞlnð1�XLiqÞ
þXLiq lnXLiq�þð1�XLiqÞRT ln½/X 2LiqþP �
�ð1�XLiqÞfDHoord�TDSo
ordþDC oP ord½T �298:15
�T lnðT=298:15Þ�gþfW H1 �TW S
1
þW Cp1 ½T �298:15�T lnðT=298:15Þ�gXLiqð1�XLiqÞ;
ð30Þwhere e1 ¼ exp[)(DHs1
o+DVs1oY)/RT)], e2 ¼ exp[)DHs1
o
/RT)], eo ¼ exp[)DHs1o/R298.15)], Y ¼ 5/4(Po+/)1/5
[(P+/)4/5)(1+/)4/5]. Table 2 lists the calculatedparameters of Eq. (30). This equation allows an accu-rate, continuous description of the thermodynamicproperties of water in both the two-phase and super-critical P–V–T region (Fig. 6), i.e. without the need to
separate the P–V–T field into sub-regions (e.g. Hollandand Powell 1998). The most significant errors weredetected for the molar volume of the aqueous gas in thevicinity of the critical point (Fig. 6a). Problems indescribing the molar volumes of fluids near the criticalregion have long been known, and empirical switchfunctions are commonly used to improve the descriptionin this region without disturbing the continuity of thefar-field P–V–T equations (e.g. Hill 1990). Taking intoaccount that the related errors in the Gibbs free energyare not large (Fig. 6c), we decided not to introduce thisadditional complexity to our model. Figure 7 shows acomparison of the molar volumes of water, calculatedaccording to Eq. (30), with those recommended byIAPWS-95 for scientific use (Wagner and Pruß 1997).The comparison shows that our equation demonstratesmore consistency with internationally approvedtabulated properties of water than other calibrations(Duan et al. 1996; Holland and Powell 1998), especiallyat high P and T.
Figure 8 shows the results of extrapolating the molarvolumes of water to high P–T. It is seen that Eq. (30)shows good extrapolation properties in terms of bothpressure and temperature, and better coincides with theresults of independent shock-wave and volumetricexperiments than calibrations suggested by Duan et al.(1996) and Holland and Powell (1998).
Combined applications: phase equilibria in the systemMgO–SiO2–H2O
Phase equilibria in the MgO–SiO2–H2O system havebeen experimentally studied to very high P and T,thus providing the opportunity to test the equations of
Fig. 7 Comparison of calcu-lated molar volume of waterat high pressure and temper-ature with thermodynamicdata (Wagner and Pruss1997) recommended forscientific use (IAPWS-95)
441

Gibbs free energy described here over a wide rangeof pressures and temperatures. The extrapolationproperties of the above equations can be simulta-neously tested for both minerals and the coexistingaqueous fluid. All calculations are inherently based on
internally consistent data on the basis of non-linearleast-squares analysis.
We considered several experimentally studied equi-libria involving aqueous fluid, quartz, coesite, stisho-vite, periclase, and brucite. Figure 9 show the results
Fig. 8a–c Comparison ofthe extrapolated molar vol-umes of water with results ofthe independent volumetric(Bridgeman 1942; Brodholtand Wood 1994) and shock-wave (Rice and Walsh 1957)experiments. Differentdiagrams show the volumescalculated using Eq. (30) (a),and PVT formulations sug-gested by Holland andPowell (1998) (b) and Duanet al. (1996) (c)
442

obtained for the a–b transition in quartz (Fig. 9a) andthe liquid–gas transition in water (Fig. 9b), calculatedwith the use of Eqs. (20) and (30), respectively. Alongthe phase boundaries, mole fractions of the ordered/associated clusters (Xa / XLiq) in the coexisting phasescorrespond to the conditions of equilibrium for boththe internal ‘‘ordering’’ transition in each phase andthe heterogeneous reaction between them. This isexemplified by Fig. 10, showing the Gibbs potentialof quartz (Fig. 10a) and water (Fig. 10b) in the regionof the phase transitions. Along these curves, two
analogous minima occur in both cases, correspondingto the two stable phases differing in the degree ofordering/association. Figure 9 shows that the derivedGibbs energy equations allow an accurate descriptionof experimental data. However, the critical point ofwater calculated using Eq. (30) appears to be 25 Khigher than the experimentally determined datum(Fig 9b). This discrepancy is related to the difficultiesdiscussed above in describing the continuous thermo-dynamic properties of fluid in the region of the criticalpoint.
Fig. 9a, b Comparison ofphase boundaries calculatedfor quartz (a) and water (b)with experimental data
443

Figure 11 shows some mineral equilibria calculatedusing the data of Table 2. Comparison of the calculatedphase boundaries with experimental data shows that theequations of Gibbs free energy derived here lead toaccurate descriptions of the various phase boundaries,including the dehydration reaction brucite ¼ peri-clase + water to very high pressures and temperatures(1250 �C, 150 kbar).
Discussion and conclusions
The equations for Gibbs free energy described hereare sufficiently accurate to describe and extrapolate
thermodynamic properties and phase equilibria on thebasis of experimental data on isobaric heat capacity andmolar volume. This implies that they can be effectivelyused in thermodynamic data bases of petrologicalinterest. Moreover, they are relatively simple and lead toa uniformity of representation of the Gibbs potential asa direct function of P and T for very different phases (thesoftware implementing the equations discussed in thispaper for thermodynamic calculations is available byrequest from the corresponding author). It should benoted that the proposed model employs not more than16 adjustable parameters. By comparison, the Helm-holtz free energy equations that allow reasonable
Fig. 10a, b Diagram illus-trating the method fordetermining the equilibriumordering parameter corre-sponding to the Gibbs en-ergy minimum. Thediagrams are calculated forquartz under pressure of 10kbar (a) and water under apressure of 86 bar (b).Arrows relate minima of theGibbs energy at a giventemperature
444

descriptions of a one-component fluids over a wide P–Trange, including the two-phase region, normally contain30–80 empirical parameters (e.g. Altunin 1975; Sychev
et al. 1979; Saul and Wagner 1989;Stewart and Jacobson1989; Hill 1990). The Gibbs free energy equationfor quartz proposed by Dorogokupets (1995) for a
Fig. 11a–c Comparison ofselected calculated phasetransitions in the systemMgO–SiO2–H2O with theexperimental data
445

description of the k-transition contains 26 parameters.In the case of simple phases, Equation (12) with 10–12adjustable parameters allows an accurate descriptionof the heat capacity and volume over a wide range ofP–T conditions (20–3000 K, 0–800 kbar), including theimportant low-temperature (20–200 K) region relevantfor correct representation of the third-law entropyaccording to Eq. (9a).
On the other hand, the approach presented here alsoleads to novel insights into the structure of crystallinephases with k-transitions and fluids. The derived Gibbsfree energy equations for such phases require the calcu-lation of an equilibriumordering parameter to satisfyEqs.
(19) and (21), as illustrated by Fig. 10. Figure 12 showsthe calculated P and T dependence of the orderingparameter for quartz (Fig.12a) and for water (Fig.12b).For quartz, the calculated miscibility gap widens withincreasing pressure (the calculated critical point corre-sponds to T ¼ 553 �C, P ¼ )880 bar). A hypotheticalhomogeneous silica phase, with the ordering parameterXa changing continuously with temperature, would existbelow this point (Fig. 12a). These relationships are verysimilar to those in the aqueous fluid above the criticalpoint (Fig. 12b). Accordingly, the heat capacity andcoefficient of thermal expansion show maxima at themaximum value of the derivative ¶X/¶T (Figs. 13, 14).
Fig. 12a, b Isobars of thethemperature dependence ofordering parameters forquartz (a) and water (b)
446

Comparison of the thermodynamic functions and order-ing parameters of quartz and those of aqueous fluid(Figs. 13, 14) thus reveal a clear analogy, demonstratingthe thermodynamic similarity of ordering phenomena influid and crystalline states (Landau and Lifshitz 1959). Itshould alsobenoted that the possible existence of a criticalpoint for a crystalline substance with a k-transition waspredicted theoretically by Landau (e.g. Landau andLifshitz 1959). Our test calculations have also shown thata similar thermodynamic approach can be applied to treatorder/disorder transitions in binary alloys withpronounced k-anomaly.
An important question concerns the physicalmeaning of the ordering parameters Xa and XLiq usedfor the description of the Gibbs free energy of quartzand aqueous fluid, respectively. For both water andquartz, this parameter cannot be directly obtained fromphysical measurement, and therefore appears entirelyabstract. However, a correspondence between XLiq andthe number of clusters follows from the similarity ofEqs. (22) and (24). Therefore, XGas ¼ 1)XLiq may beinterpreted as an apparent mole fraction (thermody-namic probability) of the monomers, X1, in the fluid,and XLiq is the bulk mole fraction (thermodynamic
Fig. 13a, b Isobars of thetemperature dependence ofisobaric heat capacities forquartz (a) and water (b)
447

probability) of the clusters with n ‡ 2. The concept ofthe existence of two distinct states of molecules in afluid appears consistent with investigations of the waterstructure by Gorbaty and Demianets (1983), whodemonstrated that the near-critical fluctuations arepreserved at elevated P–T conditions above the criticalpoint to a pressure of 1 kbar and temperatures of500 �C. In the supercritical region, there are short-termspace fluctuations that correspond to the liquid-likeand gas-like states. Presence of clusters of water in thesupercritical region is found in molecular dynamicsexperiments, even at densities of less than 0.2 gcm)3
(Churakov and Kalinichev 1999), thus validating ourthermodynamic formalism.
Further examples of the correspondence between thecalculated ordering parameters and physical measure-ments are demonstrated in Fig. 15. Figure 15a presentsthe negative linear correlation of the estimated orderingparameter Xa with the sum of mean-squares displace-ments (MSD) of the oxygen atoms in the quartz struc-ture, as determined for the k-transition by Kihara(1990). The high correlation coefficient (r ¼ )0.987)shows that the calculated decrease of Xa with increasingtemperature reflects the real mechanism of disordering.
Fig. 14a, b Isobars of thetemperature dependence ofthe coefficient of thermalexpansion for quartz (a) andwater (b)
448

In Fig. 15b, the mole fraction of molecules in the liquid-like state XLiq is compared to the mole fraction ofhydrogen bonds XH, calculated by Gorbaty and Kalin-ichev (1995) from experimental data (the association of
molecules in an aqueous fluid is mainly determined byhydrogen bonds). Figure 14c presents a comparison ofthe mole fraction of molecules in the liquid-like stateXLiq with the mole percent of monomers NM (Luck
Fig. 15a–c Comparison ofthe ordering parameters withexperimentally determinedstructural parameters forquartz (a) and water (b),(c)a A negative correlation (r= )0.987) between Xa andsum of mean-squares dis-placements (MSD) of oxy-gen atoms along axes 1–3(Kihara 1990) at P ¼ 1 barand T ¼ 600–1100 K.b A positive correlation (r =0.942) between XLiq andmole fraction of hydrogenbonds XH (Gorbaty andKalinichev 1995) at a P ¼ 1kbar and T ¼ 0–550 �C.(c) A negative correlation(r = )0.997) between XLiq
and content of monomersNM (mol%) (Luck 1980)in the liquid phase along theboiling curve
449

1980). High coefficients of linear correlation between XH
and XLiq (r ¼ 0.942) and between NM and XLiq
(r ¼ )0.997) suggest that XLiq quantitatively character-izes the degree of association of molecules in an aqueousfluid. Thus, it can be concluded that our relatively ab-stract ordering parameter reflects physical processes inminerals and fluids.
Figure 16 shows the results of modelling the mixingproperties of an H2O–CO2 fluid with Eq. (27) andparameters linearly dependent on fluid composition, i.e.BH2O-CO2
¼ BCO2XCO2
+ BH2OXH2O
, where XCO2¼ CO2
/(CO2 + H2O), XH2O¼ H2O/(CO2 + H2O); BH2O-CO2
are parameters of Eq. (27) for the binary fluid of givencomposition; BH2O
and BCO2are, respectively, empirical
parameters of Eq. (27) for pure H2O (Table 2) and pureCO2 (DHo
ord ¼ )20608.153 J, DSoord ¼ )138.42315 J/K,
DCPoord ¼ 10.0415201 J/K, WH ¼ )20859.049 J,
WS ¼ 36.8658607 J/K, WCp ¼ 0, and / ¼ 6551.312 bar,Gerya and Perchuk 1997). Our results coincide well withthe empirical mixing models of Aranovich and Newton(1999) and Holland and Powell (2003) based on exper-imental data. This suggests that simple linear mixingrules can be used to extend our model on fluid mixtureswithout introducing any additional parameters. Thisalso implies that non-ideality of mixing in multicompo-nent fluids is primarily related to changes in the degreeof association of fluid molecules (XLiq) with changingfluid composition, as directly accounted for by Eq. 27.
Acknowledgements The authors are grateful to V.B. Polyakov andO.L. Kuskov, Y.V. Petrov and A.G.Kalinichev for discussions onthe details of the formulation and for fruitful consultations. Weappreciate the detailed comments on an earlier version of this
manuscript by M.S. Ghiorso, Z. Duan, N. Dubrovinskaya andS.K. Saxena, who stimulated its substantial revision. The study wassupported by the Russian Foundation for Basic Research (grants02-05-64025, 03-05-64633, 1645-2003-5) and an Alexander vonHumboldt Foundation Research Fellowship to Gerya. Helpfulreviews by two anonymous reviewers are appreciated.
References
Ackermann RJ, Sorell CA (1974) Thermal expansion and the high–low transformation in quartz, I. High-temperature X-raystudies. J Appl Crystallogr 1: 461–467
Akaogi M, Navrotsky A (1984) The quartz–coesite–stishovitetransformations: new calorimetric measurements and calcula-tion of phase diagrams. Phys Earth Planet Interiors 36: 124–134
Akaogi M, Yusa H, Shiraishi K, Suzuki T (1995) Thermodynamicproperties of a-quartz, coesite, and stishovite and equilibriumphase relations at high pressures and high temperatures.J Geophys Res (B)100: 22337–22347
Akella J (1979) Quartz–coesite transition and the comparativefriction measurement in piston-cylinder apparatus using talc–alsimag–glass (TAG) and NaCl-high pressure cells. N Jb Min-eral Monatsh 217–224
Akimoto S, Syono Y (1969) Coesite–stishovite transition. J Geo-phys Res 74: 1653–1659
Altunin VV (1975) Thermophysical properties of carbon dioxide(in Russia). Standards, Moscow, 551 pp
Aranovich LY, Newton RC (1996) H2O activity in concentratedNaCl solutions at high pressures and temperatures measured bythe brucite–periclase equilibrium. Contrib Mineral Petrol 125:200–212
Aranovich LY, Newton RC (1999) Experimental determination ofCO2–H2O activity–composition relations at 600–1000 �C and6–14 kbar by reversal decarbonation and dehydration reactions.Am Mineral 84: 1319–1332
Barelko VV, Zakirov IV, Pechatnikov EL (1994) On the depen-dence of the molecular clusterization in a one-component gasmedium on parameters of its equation of state (in Russian).Khimicheskaya Fizika 13: 42—50
Barron THK, Berg WT, Morrison JA (1959) On the heat capacityof crystalline magnesium oxide. Proceedings Roy Soci London250(A): 70–83
Bassett WA, Barnett JD (1970) Isothermal compression of stisho-vite and coesite up to 85 kilobars at room temperature by X-raydiffraction. Phys Earth Planet Interiors 3: 54–60
Berman RG (1988) Internally consistent thermodynamic data forminerals in the system Na2O–K2O–CaO–MgO–FeOFe2O3–Al2O3–SiO2–TiO2–H2O–CO2. J Petrol 29: 445–522
Berman RG, Aranovich LY (1996) Optimized standard state andsolution properties of minerals,1. Model calibration for olivine,orthpyroxene, cordierite, garnet, ilmenite in the system FEO–MGO–CaO–Al2O3–TiO3–SiO2. Contrib Mineral Petrol 126:1–24
Boehler R (1982) Adiabats of quartz, coesite, olivine, and magne-sium oxide to 50 kbar and 1000 K, and the adiabatic gradient inthe Earth’s mantle. J Geophys Res 87: 5501–5506
Boehler R, Skoropanov A, O’Mara D, Kennedy GC (1979)Gruneisen parameter of quartz, quartzite, and forsterite.J Geophys Res 84: 3527–3531
Bohlen SR, Boettcher AL (1982) The quartz–coesite transforma-tion: a precise determination and the effects of other compo-nents. J Geophys Res 87: 7073–7078
Bose K, Ganguly J (1995) Quartz-coesite transition revisited:reversed experimental determination at 500–1200 �C andretrieved thermochemical properties. Am Mineral 80: 231–238
Boyd FR, England JL (1960) The quartz–coesite transition.J Geophys Res 65: 749–756
Bridgeman PW (1942) Freezing parameters and compressions of 21substances to 50 000 kgcm)2. Proc Am Acad Arts Sci 74:399–424
Fig. 16a–c Activity–composition plot for H2O–CO2 at 800 �C and 6–14 kbar calculated from eq. (27) with parameters linearly dependenton fluid composition (see text for discussion). Binary models ofAranovich and Newton (1999) and Holland and Powell (2003) areshown for comparison
450

Brodholt JP, Wood BJ (1994) Measurements of the PVT propertiesof water to 25 kbar and 1600 �C from synthetic fluid inclusionsin corundum. Geochim Cosmochim Acta 58: 2143–2148
Carpenter MA, Salje EKH, Graeme-Barber A, Wruck B, DoveMT, Knight KS (1998) Calibration of excess thermodynamicproperties and elastic constant variations associated with the a‹fi b phase transition in quartz. Am Mineral 83: 2–22
Castex J, Madon M (1995) Test of the vibrational modelling for thelambda-type transitions–application to the a-ß quartz transi-tion. Phys Chem Miner 22: 1–10
Catti M, Farraris G, Hull S, Pavese A (1995) Static compressionand H disorder in brucite, Mg(OH)2, to 11 GPa: a powderneutron diffraction study. Phys Chem Miner 22: 200–206
Chakoumakos BC, Loong C-K, Schultz AJ (1997) Low-tempera-ture structure and dynamics of brucite. J Phys Chem B101:9458–9462
Chatterjee ND, Miller K, Olbricht W (1994) Bayes estimation—anovel approach to derivation of internally consistent thermo-dynamic data for minerals, their uncertainties, and correlations,2. Application. Phys Chem Miner 21: 50–62 1994
Chatterjee ND, Kruger R, Haller G, Olbricht W (1998) TheBayesian approach to an internally consistent thermodynamicdatabase: theory, database, and generation of phase diagrams.Contrib Mineral Petrol 133: 149–168
Churakov SV,Kalinichev AG (1999) Size and structure ofmolecularclusters in supercritical water. J Structural Chem 40: 548–553
CODATA task group on key values for thermodynamics. (1978)CODATA recommended key values for thermodynamics 1977.CODATA Bull 28: 1–17
Cohen LH, Klement WK Jr (1967) High-low quartz inversion:determination to 35 kilobars. J Geophys Res 72: 4245–4251
d’Amour H, Denner W, Schulz H (1979) Structure determinationof a-quartz up to 68Æ108 Pa. Acta Crystallogr 35: 550–555
Danielsson S, Grenthe I, Oskarsson A (1976) A low-temperatureapparatus for single-crystal diffractometry: the unit-celldimensions of a–quartz in the temperature range 86–298 K.J Appl Crystallogr 9: 14–17
Dewaele A, Fiquet G, Andrault D, Hausermann D (2000) P–V–Tequation of state of periclase from synchrotron radiationmeasurements. J Geophys Res 105: 2869–2878
Dorogokupets PI (1995) Equation of state for lambda transition inquartz. J Geophys Res (B)100: 8489–8499
Dorogokupets PI, Karpov IK (1984) Thermodynamics of mineralsand mineral equilibria (in Russian). Nauka, Novosibirsk, 185 pp
Doroshev AM, Galkin VM, Kuznetzov GN (1987) Thermalexpansion of stishovite in temperature interval 98-420 K(in Russian). Geokhimiya 10: 1463–1467
Dove MT (1997) Theory of displacive phase transitions in minerals.Am Mineral 82: 213–244
Duan Z, Møller N, Weare J (1996) A general equation of state forsupercritical fluid mixtures and molecular dynamics simulationof mixture PVTX properties. Geochim Cosmochim Acta 60:1209–1216
Dubrovinskaya NA, Dubrovinsky LS, Saxena SK (1997) System-atics of thermodynamic data on solids: thermochemical andpressure–volume–temperature properties of some minerals.Geochim Cosmochim Acta 61: 4151–4158
Endo S,Akai T,AkahamaY,WakatsukiM,NakamuraT, TomaiY,Koto K, Ito Y, Tokonami M (1986) High-temperature X-raystudy of single-crystal stishovite synthesizedwith Li2WO4 as flux.Phys Chem Miner 13: 146–151
Fei Y (1999) Effects of temperature and composition on the bulkmodulus of (Mg,Fe)O. Am Mineral 84: 272–276
Fei Y, Mao HK (1993) Static compression of Mg(OH)2 to 78 GPaat high temperature and constraints on the equation of state offluid H2O. J Geophys Res 98: 11875–11884
Fiquet G, Richet P, Montagnac G (1999) High-temperature ther-mal expansion of lime, periclase, corundum and spinel. PhysChem Miner 27: 103–111
Franz G (1982) The brucite-periclase equilibrium at reduced H2Oactivities: some information about the system H2O–NaCl. Am JSci 282: 1325–1339
Galkin VM, Doroshev AM, Babich YV (1987) Thermal expansionof coesite (in Russian). Geokhimiya 11: 1645–1647
Gerya TV, Perchuk LL (1997) Equations of state of compressedgases for thermodynamic databases used in petrology. Petrol-ogy 5: 366–380
Gerya TV, Podlesskii KK, Perchuk LL, Swamy V, Kosyakova NA(1998) Equations of state of minerals for thermodynamicdatabases used in petrology. Petrology 6: 511–526
Giauque WF, Archibald RC (1937) The entropy of water from thethird law of thermodynamics. The dissociation pressure andcalorimetric heat of the reaction Mg(OH)2 ¼MgO+H2O. Theheat capacities of Mg(OH)2 and MgO from 20 to 300 K. J AmChem Soc 59: 561–569
Gibson RE (1928) The influence of pressure on the high–lowinversion of quartz. J Phys Chem 32: 1197–1210
Glinnemann J, King HE Jr, Schulz H, Hahn T, LaPlaca SJ, Dacol F(1992) Crystal structures of the low-temperature quartz-typephases of SiO2 and GeO2 at elevated pressure. Z Kristallogr 198:177–212
Glushko VP, Gurvich LV, Bergman GA, Weiz IV, Medvedev VA,Khachkuruzov GA, Yungman VS (eds) (1979) Themodynamicproperties of individual substances, vol 2, (in Russian).Moscow: Nauka, 784 pp
Gorbaty YE, Demianets YN (1983) The pair correlation functionsof water at a pressure of 1000 bar in temperature range25–500 �C. Chem Phys Lett 100: 450–453
Gorbaty YE, Kalinichev AG (1995) Hydrogen bonding in super-critical water, 1. Experimental results. J Phys Chem 99: 5336
Gottschalk M (1997) Internally consistent thermodynamic data forrock-forming minerals in the system SiO2–TiO2–Al2O3–Fe2O3–CaO–MgO–FeO–K2O–Na2O–H2O–CO2. Eur J Mineral 9:175–223
Grevel K-D (1995) Internally consistent thermodynamic data forhigh-pressure phases in the system CaO–MgO–Al2O3–SiO2–H2O. Bochumer Geol Geotech Arb 44: 64–69
Grønvold F, Stølen S, Svendsen SR (1989) Heat capacity ofa-quartz from 298.15 to 847.3 K, and of b-quartz from 847.3 to1000 K—transition behavior and reevaluation of the thermo-dynamic properties. Thermochim Acta 139: 225–243
Gupta RB, Panayiotou CG, Sanchez IC, Johnston KP (1992)Theory of hydrogen bonding in supercritical fluids. AmericanInstitute of Chemical Engineers Journal J 38: 1243–1253
Gurevich VM, Khlyustov VG (1979) A calorimeter for measure-ments of low-temperature heat capacity of quartz at 9-300 K (inRussian). Geokhimiya 6: 829–839
Hazen RM, Finger LW, Hemley RJ, Mao HK (1989) High-pres-sure crystal chemistry and amorphization of a-quartz. SolidState Commun 72: 507–511
Helgeson HC, Delany JM, Nesbitt HW, Bird DK (1978) Summaryand critique of the thermodynamic properties of rock-formingminerals. Am J Sci 278A: 229 pp
Hemingway BS (1987) Quartz: heat capacities from 340 to 1000 Kand revised values for the thermodynamic properties. AmMineral 72: 273–279
Hemingway BS, Robie RA, Evans HT Jr, Kerrick DM (1991) Heatcapacities and entropies of sillimanite, fibrolite, andalusite,kyanite, and quartz and the Al2SiO5 phase diagram. Am Min-eral 76: 1597–1613
Hill TL (1956) Statistical mechanics. Principles and selectedapplications, McGraw-Hill New York, 432 pp
Hill PG (1990) An unified fundamental equation for the thermody-namic properties of H2O. J Phys Chem Ref Data 19: 1233–1274
Holland TJB, Powell R (1990) An enlarged and updated internallyconsistent thermodynamic data set with uncertainties and cor-relations: the system K2O–Na2O–CaO–MgO–FeO–Fe2O3–Al2O3–TiO2–SiO2–C–H2–O2. J Metamorph Geol 8: 309–343
Holland TJB, Powell R (1996) Thermodynamics of order–disorderin minerals, I. Symmetric formalism applied to minerals of fixedcomposition. Am Mineral 81: 1413–1424
Holland TJB, Powell R (1998) Internally consistent thermody-namic data set for phases of petrological interest. J MetamorphGeol 16: 309–344
451

Holland TJB, Powell R. (2003) Activity composition relations forphases of petrological calculations: an asymmetric multicomp-onet formulation. Contrib Mineral. Petrol. 145: 492–501
Holm JL, Kleppa OJ, Westrum EF (1967) Thermodynamics ofpolymorphic transformations in silica. Thermal properties from5 to 1070 K and pressure-temperature stability fields for coesiteand stishovite. Geochim Cosmochim Acta 31: 2289–2307
Ishbulatov RA, Kosyakov AV (1990) Problems of pressure esti-mation in high-temperature experiments using solid mediaapparatus; pressure calibration with reference to breakdown ofalbite and quartz–coesite transformation (part II). Proc IndianAcad Sci 99: 133–140
Jay AH (1933) The thermal expansion of quartz by X-ray mea-surements. Proc Roy Soc London 142A(846): 237–247
Johnson MC, Walker D (1993) Brucite [Mg(OH)2] dehydrationand the molar volume of H2O to 15 GPa. Am Mineral 78:271–284
Jorgensen JD (1978) Compression mechanisms in a-quartz struc-tures—SiO2 and GeO2. J Appl Phys 49: 5473–5478
Karpov IK, Kiselev AI, Letnikov FA (1976) Computer modeling ofnatural mineral formation (in Russian). Nedra, Moscow, 256 pp
Kieffer SW (1985) Heat capacity and entropy: systematic relationsto lattice vibrations. Mineralogical Society of America, Wash-ington DC, Rev Mineralogy, vol 14: pp 65–126
Kihara K (1990) An X-ray study of the temperature dependence ofthe quartz structure. Eur J Mineral 2: 63–77
Kitahara S, Kennedy GC (1964) The quartz–coesite transition.J Geophys Res 69: 5395–5400
Koster van Groos, AF, Ter Heege JP (1973) The high–low quartztransition up to 10 kilobars pressure. J Geol 81: 717–724
Krupka KM, Robie RA, Hemingway BS (1979) High-temperatureheat capacities of corundum, periclase, anorthite, CaAl2Si2O8
glass, muscovite, pyrophyllite, KAlSi3O8 glass, grossular, andNaAlSi3O8 glass. Am Mineral 64: 86–101
Kubo R (1965) Statistical mechanics. North-Holland, Amsterdam,425 pp
Kuskov OL, Zidikova AP, Semenov YV, Babich YV, FabrichnayaOV (1991) Thermodynamics of polymorph modyfications ofsilica (in Russian). Geokhimiya 8: 1175–1185
Kut’in AM, Pyadushkin DV (1998) Analytical approximation ofthermodynamic functions of solids at the basis of phenome-nological statistics of interaction nodes (in Russian). Z Fizi-cheskoy Khimii 72: 1735–1740
Lager GA, Jorgensen JD, Rotella FJ (1982) Crystal structure andthermal expansion of a-quartz at low temperatures. J Appl Phys53: 6751–6756
Landau LD, Lifshitz EM (1959) Statistical physics. Pergamon,London, 484 pp
Levien L, Prewitt CT (1981) High-pressure crystal structure andcompressibility of coesite. Am Mineral 66: 324–333
Levien L, Prewitt CT, Weidner DJ (1980) Structure and elasticproperties of quartz at pressure. Am Mineral 65: 920–930
Liu LG, Basset WA, Takahashi T (1974) Effect of pressure on thelattice parameters of stishovite. J Geophys Res 79: 1160–1164
Luck WAP (1980) A model of hydrogen-bonded liquid. AngewChem Int Ed Eng 19: 28
Mirwald PW, Massone H-J (1980a) Quartz–coesite transition andthe comparative friction measurement in piston-cylinder appa-ratus using talc-alsimag-glass (TAG) and NaCl high-pressurecells: a discussion. N Jb Mineral Monatsh 10: 469–477
Mirwald PW, Massone H-J (1980b) The low–high quartz andquartz–coesite transition to 40 kbar between 600 and 1600 �Cand some reconnaissance data on the effect of NaAlO2 com-ponent on the low quartz–coesite transition. J Geophys Res 85:6983–6990
Nagai T, Hattori T, Yamanaka T (2000) Compression mechanismof brucite: an investigation by structural refinement underpressure. Am Mineral 85: 760–764
Olinger B (1976) The compression of stishovite. J Geophys Res 81:5341–5343
Olinger B, Halleck PM (1976) The compression of a-quartz.J Geophys Res 81: 5711–5714
Parise JB, Leinenweber K, Weidner DJ, Tan K, Von Dreele RB(1994) Pressure-induced H bonding: neutron diffractionstudy of brucite, Mg(OH)2, to 9.3 GPa. Am Mineral 79:193–196
Polyakov VB, Kuskov OL (1994) Self-consistent model for calcu-lation of thermoelastic and caloric properties of minerals (inRussian). Geokhimiya 7: 1096–1122
Prigogine I, and Defay R (1954) Chemical thermodynamics.Longmans Green, London
Reeber RR, Goessel K, Wang K (1995) Thermal expansion andmolar volume of MgO, periclase, from 5 to 2900 K. EurJ Mineral 7: 1039–1047
Rice MH, Walsh JM (1957) Equation of state of water to 250Kbars. J Chem Phys 26: 824–830
Richet P, Fiquet G (1991) High-temperature heat capacity andpremelting of minerals in the system MgO–CaO–Al2O3–SiO2.J Geophys Res 96: 445–456
Richet P, Bottinga Y, Denielou L, Petitet JP, Tequi C. (1982)Thermodynamic properties of quartz, cristoballite and amor-phous SiO2: drop calorimetry measurements between 1000 and1800 K and a review from 0 to 2000 K. Geochim CosmochimActa 46: 2639–2658
Richet P, Gillet P, Fiquet G (1992) Thermodynamic properties ofminerals: macroscopic and microscopic approaches. Adv PhysGeohem 10: 98–131
Ross NL, Shu J-F, Hazen RM, Gasparik T (1990) High-pressurecrystal chemistry of stishovite. Am Mineral 75: 739–747
Sato Y (1977) Pressure–volume relationship of stishovite underhydrostatic compression. Earth Planet Sci Lett 34: 307–312
Saul A, Wagner W (1989) A fundamental equation for watercovering the range from melting line to 1273 K at pressure up to25 000 Mpa. J Phys Chem Ref Data 18: 1537–1563
Saxena SK, Chatterjee N, Fei Y, Shen G (1993) Thermodynamicdata on oxides and silicates: an assessed data set based onthermochemistry and high-pressure phase equilibrium. Spring-er, Berlin, Heidelberg, New York, 428 pp
Serghiou G, Zerr A, Chudinovskih LT, Boehler R (1995) Thecoesite–stishovite transition in a laser-heated diamond cell.Geophys Res Lett 22: 441–444
Schramke JA, Kerrick DM, Blencoe JG (1982) The experimen-tal determination of the brucite–periclase + water equilib-rium with a new volumetric technique. Am Mineral 67:269–276
Shen AH, Basset WA, Chou I-M (1993) The a–b quartz transitionat high temperatures and pressures in a diamond-anvil cell bylaser interferometry. Am Mineral 78: 694–698
Smyth JR, Smith JV, Artioli G, Kvick A (1987) Crystal structure ofcoesite, a high-pressure form of SiO2, at 15 and 298 K fromsingle-crystal neutron and X-ray diffraction data: test ofbonding models. J Phys Chem 91: 988–992
Spearing DR, Farnan I, Stebbins JF (1992) Dynamics of the a-ßphase transitions in quartz and cristobalite as observed by in-situ high-temperature 29Si and 17O NMR. Phys ChemMiner 19:307–321
Stewart RB, Jacobson RT (1989) Thermodynamic properties ofargon from the triple point to 1200 K with pressures to 1000MPa. J Phys Chem Ref Data 18: 639–798
Suito K (1977) Phase relations of pure Mg2SiO4 up to 200 kilobars.In: Manghnani MH, Akimoto S (eds) High-pressure research:application to geophysics. Academic Press, San Diego, pp365–371
Suito K,MiyoshiM, Onodera A, Shimomura O, Kikegawa T (1996)Thermal expansion studies of stishovite at 10.5 GPa usingsynchrotron radiation. Phys Earth Planet Interiors 93: 215–222
Sychev VV, Wasserman AA, Zagoruchenko VA, Kozlov AD,Spiridonov GA, Tsimarny VA (1979) Thermodynamic proper-ties of methane (in Russian). Standards, Moscow; 348 pp
Thompson JB Jr (1969) Chemical reactions in crystals. AmMineral54: 341–375
Toda M, Kubo R, Saito N (1992) Statistical physics, I. Equilibriumstatistical mechanics (2nd ed). Springer, Berlin Heidelberg, NewYork, 252 pp
452

Tsuchida Y, Yagi T (1989) A new, post-stishovite high-pressurepolymorph of silica. Nature 340: 217–220
Vaidya SN, Bailey S, Pasternack T, Kennedy GC (1973)Compressibility of 15 minerals to 45 kilobars. J Geophys Res78: 6893–6898
Wagner W, Pruss A (1997) Die neue internationale Standard-Zu-standsgleihung fur Wasser fur den allgemeinen und wissens-chaftlichen Gebrauch, Jahrbuch 97. VDI-GesllstVerfahrenstechnik und Chemieingenieurwesen, VDI-Verlag,Dusseldorf, pp 134–156
Watanabe H (1982) Thermochemical properties of synthetic highpressure compounds relevant to the Earth’s mantle. In: Akim-oto S, Manghnani M (eds) High-pressure research in geophys-ics. Center for Academic Publications, Tokyo, pp 441–464
Xia X, Weidner DJ, Zhao H (1998) Equation of state of brucite:single-crystal Brillouin spectroscopy study and polycrystallinepressure–volume–temperature measurement. Am Mineral 83:68–74
Yagi T, Akimoto S (1976) Direct determination of coesite–stisho-vite transition by in situ X-ray measurements. Tectonophysics35: 259–270
Yoder HS (1950) High–low quartz inversion up to 10 000 bars.Transactions American Geophysical Union, Washington DC,31: 827–835
Zhang J (2000) Effect of pressure on the thermal expansion of MgOup to 8.2 Gpa. Phys Chem Miner 27: 145–148
Zhang J, Liebermann RC, Gasparik T, Herzberg CT, Fei Y (1993)Melting and subsolidus relations of SiO2 at 9–14 GPa. J Geo-phys Res (B)98: 19785–19793
Zhang J, Li B, Utsumi W, Liebermann RC (1996) In situ X-rayobservations of the coesite-stishovite transition: reversed phaseboundary and kinetics. Phys Chem Miner 23: 1–10
Zharkov VN, Kalinin VA (1971) Equations of state of solids athigh pressures and temperatures. Consultant Bureau, NewYork, 257 pp
Appendix 1. Derivation of Eq. (2)
The derivation of Eq. (2) follows standard logic of sta-tistical mechanics (e.g. Hill 1956; Kubo 1965; Toda et al.1992; Landau and Lifshitz 1959), but is based on anensemble not treated in standard textbooks on statisticalmechanics.
Let us first consider a substance in a condensed state,solid or liquid, at a relatively low temperature, when itsatoms are close to each other and vibrate mainly aroundequilibrium positions. A system with N atoms will have3N vibrational degrees of freedom, and, from the view-point of mechanics, can be referred to as a system of 3Nindependent quantum oscillators (e.g. Landau and Lif-shitz 1959). The Gibbs free energy of a system ofquantum oscillators in equilibrium at constant P and Tcan also be expressed with the P–T partition function(Toda et al. 1992)
G ¼ �kBT lnðY Þ; ðA1Þ
Y ¼X
i
Z1
0
expf�½EiðV Þ þ PV �=kBT g dV ðA2Þ
where Y is the statistical sum over states, kB is Boltz-mann’s constant, V is the system volume and Ei(V) is thesystem energy for the i-th quantum state as a function ofthe volume. Theoretical expressions for Ei(V) are
unavailable and empirical approximations are used in-stead. For integration of Eq. (A2) we take into accountthat at given P and T the fluctuation of volume ofcondensed substance is insignificant. If for an i-th stateat a given P only one system volume Vi(P) refers to anon-zero probability, then
Z1
0
expf�½EiðV Þ þ PV �=kBTgdV ¼ exp½�HiðP Þ=kBT �;
ðA3Þwhere Hi(P) ¼ Ei(P)+PVi(P) and Ei(P) ¼ Ei[Vi(P)].
Hi(P), Ei(P) and Vi(P) are enthalpy (or, more spe-cifically, its microscopic analogue), energy and volumeof the system, respectively, in an i-th state as functions ofP. If the apparent volume Vi(P) and correspondingHi(P) and Ei(P) in Eq. (A3) are valid for a case of thei-th quantum state at given P with insignificant fluctu-ations of the system volume V relative to Vi(P), then Eq.(A2) can be simplified to
Y ¼X
i
exp½�HiðP Þ=kBT �: ðA4Þ
Equation (A4) differs from equations normally given instatistical mechanics (e.g. Hill 1956) in that the volumeintegral is taken before summation of the quantumstates of the oscillators.
Normalizing the partition function relative to zero-point vibrations gives
G ¼ G0ðP Þ � kBT lnðY0Þ; ðA5Þwhere Y0 =
Pi
exp[-DHi(P)/ kBT], G0 ¼ H0(P) - TS0,DHi(P) ¼ Hi(P) ) H0(P) ¼ DEi(P) + PDVi(P),H0(P) =E0(P) + PV0(P), DEi(P) ¼ Ei(P) ) E0(P),DVi(P) ¼ Vi(P) ) V0(P).Y0 is the statistical sum nor-malized relative to the state of zero-point vibrations.G0(P), H0(P), E0(P) and V0(P) are, respectively, thepressure-dependent Gibbs free energy, enthalpy, energyand volume of the system for the state of zero-pointvibrations. S0 is entropy of the system for the state ofzero-point vibrations (in case of ordered crystallinephases, it is equal to zero according to Nernst’s law).DHi(P), DEi(P) and DVi(P) are, respectively, the pres-sure-dependent changes of enthalpy, energy and volumedue to transition from the state of zero-point vibrationsto the i-th quantum state. Taking into account 3Nindependent oscillators:
Y0 ¼Y3N
i
Y0i ; ðA6Þ
where Y0i ¼PM
jexp½�DHijðP Þ=kBT �;
DHijðP Þ ¼ DEijðP Þ þ PDVijðP Þ:
Y0i is the statistical sum for the i-th oscillator normalizedrelative to the state of zero-point vibrations, M is thenumber of energy levels for the i-th oscillator, DHij(P)DEij(P) and DVij(P) are, respectively, pressure-dependent
453

changes in enthalpy, energy and volume due to transi-tion of the i-th oscillator from the state of zero-pointvibrations to the j-th energy level. To calculate Y0i, it isassumed that every oscillator has an infinite number ofenergy levels and that DHij(P), DEij(P) and DVij(P) areproportional to j (e.g. Landau and Lifshitz 1959). Then
DHijðP Þ ¼ jDHi0ðP Þ; ðA7Þ
Y0i ¼ 1=f1� exp½�DHi0ðP Þ=kBT �g; ðA8Þ
DHi0ðPÞ ¼ DEi0ðP Þ þ DVi0ðPÞ: ðA9Þ
G¼H0ðP Þ�TS0þkBTX3N
i
lnf1� exp½�DHi0ðP Þ=kBT �g;
ðA10Þwhere DHi0(P), DEi0(P), and DVi0(P) are, respectively,pressure-dependent changes in enthalpy, energy andvolume due to transition of the i-th oscillator betweenneighbouring energy levels. The form of Eq. (A10) issimilar to a standard equation for the Helmholtz freeenergy of the system of independent quantum oscillators(e.g. Landau and Lifshitz 1959; Kubo 1965; Toda et al.1992), and the only difference is that the statistical sumover states is expressed in terms of enthalpy changes (notenergy changes) related to the transitions of the oscil-lators.
If N ¼ mNA (NA is Avogadro’s number, m is thenumber of atoms in a substance molecule) and functionsDHi0(P) have similar values for n big groups of oscilla-tors, then Eq. (A9) can be rewritten in the form of Eq. (2)
Appendix 2. Derivation of Eq. (16)
The derivation of Eq. (16) is also based on the P–Tpartition function (Toda et al. 1992) and follows thesame logic as the derivation of Eq. 2 (see Appendix 1).
If the k-transition leads to notable changes in thethermal vibrations of atoms, this must be taken into ac-count in a description of the energy transitions of oscil-lators; i.e. Gs in Eq. (2) depends on Xa. Suppose that for acertain oscillator energy levelm, whose energy depends onXa, the enthalpy effect of the transition DHsi changes.Then, the statistical sums Y0i in Eq. (A6) take the form
Y0i¼f½1�expð�DHib=kBT Þ�þexpð�DHik=kBT Þ�½expð�DHib=kBT Þ�expð�DHia=kBT Þ�g=f½1�expð�DHia=kBT Þ��½1�expð�DHib=kBT Þ�g;
ðA11Þ
where DHia is the enthalpy change of the energy transi-tions (DHi0) beginning with the zero level to the level(m-1) in the ordered phase, DHib is the enthalpy changeof the energy transitions beginning with the level m inthe disordered phase, DHik is the enthalpy change of thetransition from the zero level to the level m as a functionof Xa and can be expressed by a power series expansion:
DHik ¼Xu
k¼0DHikkðXaÞk; ðA12Þ
where DHikk denotes the expansion coefficients. ThenEq. (A10) can be transformed to:
Gs¼Hs�TSos þXn
i¼1ciRT1nfð1� eaiÞð1� ebiÞ=½ð1� ebiÞ
þ ekiðebi� eaiÞ�g; ðA13Þwhere eai ¼ expð�DHsia =RT Þ; ebi ¼ expð�DHsib =RT Þ;eki ¼ expð�DHsik =RT Þ; eoi¼ exp ð�DH�sia =R ToÞ;DHsia ¼DH�sia þDV �sia W;DHsib ¼ DH�sib þDV �sib W; and DHsik ¼Puk¼0ðDH�sikk þDV �sikk WÞðXaÞk:
DHsia, DHsib, and DHsik are values of DHia, DHib andDHik taken for NA oscillators. Equation (16) is derivedfrom Eq. (A13) by using u ¼ 2, n £ 5 and Eqs. (5)–(6).
Appendix 3. Derivation of Eq. (27)
The last two terms in Eq. (26) can be expressed as
�XGasDGoord þ Ge ¼ GP þ GT ; ðA14Þ
where GP ¼RPPoð�DV o
ordXGas � V eÞdP ; and GT ¼ �XGas
ðDHoord � TDSo
ordÞ þ He � TSe þRTTo
½�DCoP ðT Þord XGasþ
CeP ðT Þ�dT� T
RTTo
½ð�DCoP ðT ÞordXGasþ Ce
P ðT ÞÞ=T �dT :
DV oord and Ve are the standard volume change of
short-term ‘‘ordering’’ transition 25 (Gas = Liq) andthe excess volume of the fluid, respectively, both beingfunctions of P and T, DHo
ord and DSoord are the standard
enthalpy and entropy changes of Reaction (25) at Po andTo, H
e and Se are, respectively, contributions to excessenthalpy and entropy not related to Ve at Po and To,DCo
P (T)ord and CeP (T) are, respectively, the standard
heat capacity change of ‘‘ordering’’ transition (25) andthe excess heat capacity of the fluid, both dependent ontemperature at Po.
To quantify GP from Eq. (A14) it can be assumedthat the volume of a phase that contains only moleculesin the gas-like (free) state can be expressed as two terms,namely, the conventional volume of the molecules Vs
and the free volume Vf (Prigogine and Defay 1954).Then
V oGas ¼ Vs þ Vf ¼ Vs þRT=P : ðA15Þ
The volume of one mole of a substance that containsonly molecules in the liquid-like (associated) state issolely determined by the conventional volume of themolecules
V oLiq ¼ Vs: ðA16Þ
Hence, the standard volume change of Reaction (25) isDV o
ord ¼ V oLiq � V o
Gas ¼ �RT=P :
454

Considering Eqs. (A15) and (A16), the total volumeV of a mixture consisting of molecules in both the liquid-like and the gas-like states
V ¼ XGasV oGas þ XLiqV o
Liq � V e ¼ Vs � XGasDV oord � V e
¼ Vs þ XGasRT=P � V e: ðA17ÞThe negative sign of Ve corresponds to a decrease in thefree volumeVf caused by attraction between molecules ofany type. Then, in line with the van der Waals equation
P ¼ RT=ðV � bÞ � /a;
where b is the correction for molecular volume, i.e. b =Vs, and /a = const/V2 is the correction for the attractiveinteraction between the molecules. Equation (A17) canbe rewritten as
V ¼ Vs þ XGasRT=P � V e ¼ Vs þ XGasRT=ðP þ /aÞ:ðA18Þ
Apparently, /a depends on the average distance betweenmolecules in a fluid. Taking into account the volumechange of Reaction (25), this distance is a function ofXLiq. As the external pressure decreases, the volume ofthe system approaches that of the ideal gas, RT/P, andboth XLiq and /a tend to zero. As the pressure increases,XLiq and /a also increase. Hence, /a can be expressed asa function of XLiq in the form
/a ¼ /a1XLiq þ /a2X 2Liq þ � � � þ /aqX q
Liq; ðA19Þ
where/a1,/a2, . . ., and/aq are coefficients independent ofXLiq. Evidently, with XLiq approaching 1, /a approaches/ (Eq. 5), because both corrections characterize the same
attractive interaction between molecules. Then, in accor-dance with Eq. (A19)
/ ¼ /a1 þ /a2 þ � � � þ /aq: ðA20Þ
For a transition from the liquid-like state to the gas-likeone, when distances between the molecules increasesignificantly, Eqs. (A18)–(A19) provide an additionalcorrection for the attractive interaction. Taking for thestandard state /a ¼ 0, integration of Eq. (A17) inaccordance with Eq. (A14) yields the following equationfor GP
GP ¼ XGasRT ln½ðP þ /aÞ=Po; ðA21Þwhere /a ¼ /a1XLiq þ /a2X 2
Liq þ � � � þ /aqX qLiq:
Using the Margules expansion to express the integralexcess Gibbs free energy of mixing of liquid-like and gas-like molecules in a fluid and assuming DCo
PordðT Þ andCePðT Þ constant, GT in Eq. (A14) can be defined as
GT ¼�XGasfDHoord�TDSo
ordþDCoPord½T �To
�T 1nðT=ToÞ�gþXm
j¼1W G
j XGasXjLiq; ðA22Þ
where W Gj ¼ W H
j � TW Sj þ W Cp
j ½T � To � T 1nðT=ToÞ�:Co
Pord is the standard heat capacity effect of Reaction(25) at Po and To, and the Ws are the Margulesparameters.
Equation (27) is derived from Eqs. (A14), (A21) and(A22) using q ¼ 2, m ¼ 1 and XGas+XLiq ¼ 1.
455