k traffic e collision n facts - transportation.ky.gov · dedication this 2000 collision facts...
TRANSCRIPT
TRAFFIC
COLLISION
FACTS
2000
REPORT
K
E
N
T
U
C
K
Y


DEDICATION
This 2000 Collision Facts Report
is appropriately
dedicated
to
THE EIGHT HUNDRED TWENTY-THREE CITIZENS
Who were victims of Fatal Traffic Collisions
During 2000
and to
Their Families
All citizens of the Commonwealth of Kentuckyshare the sorrow brought about by senseless
tragedies on our streets and highways.
KENTUCKYTRAFFIC COLLISION FACTS
2000
Prepared by:
Kentucky Transportation CenterCollege of EngineeringUniversity of Kentucky
Lexington, Kentucky 40506-0281
In Cooperation with:
Kentucky State PoliceCommonwealth of Kentucky
Please Direct Inquires to:
Statistics SectionRecords Branch
Kentucky State Police1250 Louisville Road
Frankfort, Kentucky 40601
(502) 226-2169

i
TABLE OF CONTENTS
Message from the Governor, Commonwealth of Kentucky
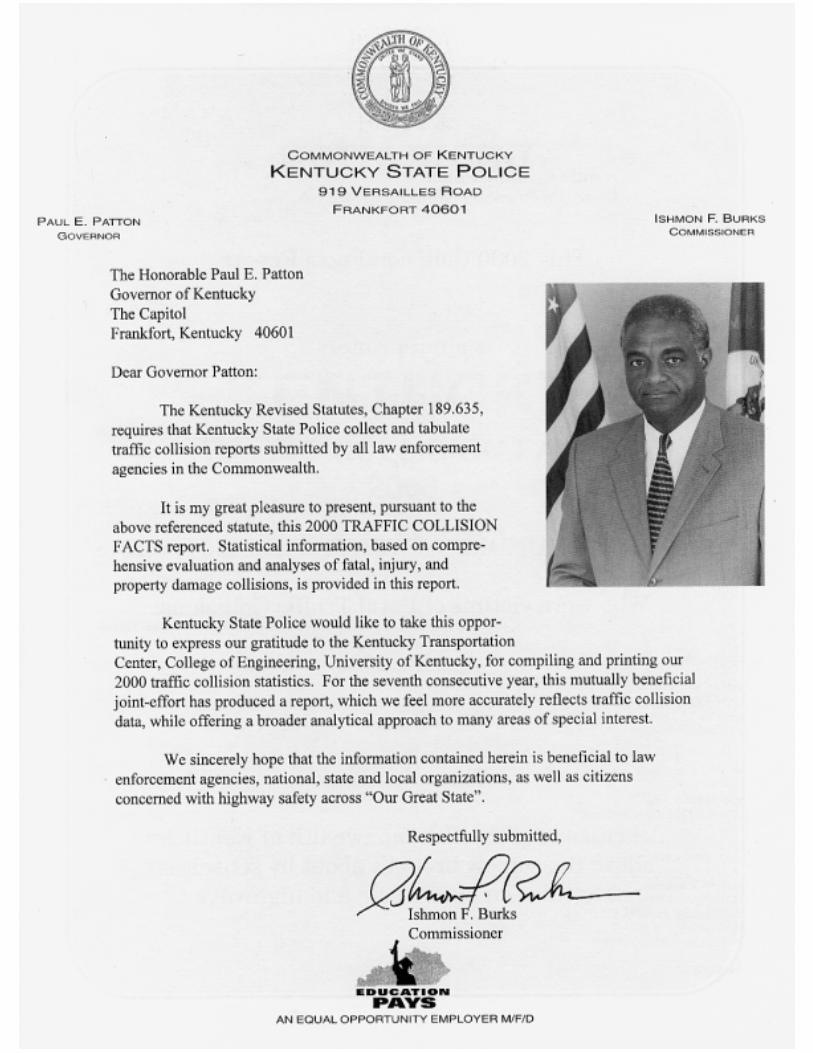
Transmittal Letter, Commissioner, Kentucky State Police
Dedication
Introduction . . . . . . . . . . . . . . . . . . . . . . . . . . . . . . . . . . . . . . . . . . . . . . . . . . . . . . . . . . . . . . . . . . . iii
2000 Collision Summary . . . . . . . . . . . . . . . . . . . . . . . . . . . . . . . . . . . . . . . . . . . . . . . . . . . . . . . . . 1
Death and Injury Summary . . . . . . . . . . . . . . . . . . . . . . . . . . . . . . . . . . . . . . . . . . . . . . . . . . . . . . . . 2
Fatalities by Age and Sex . . . . . . . . . . . . . . . . . . . . . . . . . . . . . . . . . . . . . . . . . . . . . . . . . . . . . . . . 3
Severity of Injury by Type of Collision . . . . . . . . . . . . . . . . . . . . . . . . . . . . . . . . . . . . . . . . . . . . . . 4
Occurrence of Collisions by Type . . . . . . . . . . . . . . . . . . . . . . . . . . . . . . . . . . . . . . . . . . . . . . . . . . 5
Types of Collisions . . . . . . . . . . . . . . . . . . . . . . . . . . . . . . . . . . . . . . . . . . . . . . . . . . . . . . . . . . . . . . 6
Pedestrian Collisions . . . . . . . . . . . . . . . . . . . . . . . . . . . . . . . . . . . . . . . . . . . . . . . . . . . . . . . . . . . . 7
Hit-and-Run Collisions . . . . . . . . . . . . . . . . . . . . . . . . . . . . . . . . . . . . . . . . . . . . . . . . . . . . . . . . . . . 8
Land Use . . . . . . . . . . . . . . . . . . . . . . . . . . . . . . . . . . . . . . . . . . . . . . . . . . . . . . . . . . . . . . . . . . . . . . 9
Collision Locations (Rural vs. Urban) . . . . . . . . . . . . . . . . . . . . . . . . . . . . . . . . . . . . . . . . . . . . . . . 9
Location of Collisions (Type of Roadway) . . . . . . . . . . . . . . . . . . . . . . . . . . . . . . . . . . . . . . . . . . 10
Collisions on Interstates and Parkways . . . . . . . . . . . . . . . . . . . . . . . . . . . . . . . . . . . . . . . . . . . . 10
Collisions by Roadway Conditions and Roadway Character . . . . . . . . . . . . . . . . . . . . . . . . . . . 11
Collisions by Light Condition . . . . . . . . . . . . . . . . . . . . . . . . . . . . . . . . . . . . . . . . . . . . . . . . . . . . 12
Two-Vehicle Collisions . . . . . . . . . . . . . . . . . . . . . . . . . . . . . . . . . . . . . . . . . . . . . . . . . . . . . . . . . 13
Collisions by Day and Month . . . . . . . . . . . . . . . . . . . . . . . . . . . . . . . . . . . . . . . . . . . . . . . . . . . . . 14
Holiday Collisions . . . . . . . . . . . . . . . . . . . . . . . . . . . . . . . . . . . . . . . . . . . . . . . . . . . . . . . . . . . . . 15
Type of Vehicles Involved in Collisions . . . . . . . . . . . . . . . . . . . . . . . . . . . . . . . . . . . . . . . . . . . . 16
Truck Collisions . . . . . . . . . . . . . . . . . . . . . . . . . . . . . . . . . . . . . . . . . . . . . . . . . . . . . . . . . . . . . . . 17

ii
Driver Involvement by Residence and Sex . . . . . . . . . . . . . . . . . . . . . . . . . . . . . . . . . . . . . . . . . . 18
Age of Driver (All Collisions) . . . . . . . . . . . . . . . . . . . . . . . . . . . . . . . . . . . . . . . . . . . . . . . . . . . . . 19
Age of Driver (Fatal Collisions) . . . . . . . . . . . . . . . . . . . . . . . . . . . . . . . . . . . . . . . . . . . . . . . . . . . 20
Collisions Involving Teenage Drivers . . . . . . . . . . . . . . . . . . . . . . . . . . . . . . . . . . . . . . . . . . . . . . 21
Alcohol-Related Collisions . . . . . . . . . . . . . . . . . . . . . . . . . . . . . . . . . . . . . . . . . . . . . . . . . . . . . . 22
Safety Restraints . . . . . . . . . . . . . . . . . . . . . . . . . . . . . . . . . . . . . . . . . . . . . . . . . . . . . . . . . . . . . . 23
Contributing Factors - All Collisions . . . . . . . . . . . . . . . . . . . . . . . . . . . . . . . . . . . . . . . . . . . . . . 27
Contributing Factors - Specific Type of Collision . . . . . . . . . . . . . . . . . . . . . . . . . . . . . . . . . . . . 29
Collisions by County . . . . . . . . . . . . . . . . . . . . . . . . . . . . . . . . . . . . . . . . . . . . . . . . . . . . . . . . . . . 37
Collisions Involving Drinking Drivers by County . . . . . . . . . . . . . . . . . . . . . . . . . . . . . . . . . . . . . 40
Drivers Under Influence of Drugs by County . . . . . . . . . . . . . . . . . . . . . . . . . . . . . . . . . . . . . . . . 43
Collisions by Area Development District . . . . . . . . . . . . . . . . . . . . . . . . . . . . . . . . . . . . . . . . . . . 44
Alcohol and Drug Collisions by Area Development District . . . . . . . . . . . . . . . . . . . . . . . . . . . . 45
Collisions by County (Parking Lot/Private Property) . . . . . . . . . . . . . . . . . . . . . . . . . . . . . . . . . 49
Types of Collisions (Parking Lot/Private Property) . . . . . . . . . . . . . . . . . . . . . . . . . . . . . . . . . . . 52
Age of Driver (Parking Lot/Private Property) . . . . . . . . . . . . . . . . . . . . . . . . . . . . . . . . . . . . . . . . 53
Contributing Factors (Parking Lot/Private Property) . . . . . . . . . . . . . . . . . . . . . . . . . . . . . . . . . 54
Fatality Analysis Reporting System . . . . . . . . . . . . . . . . . . . . . . . . . . . . . . . . . . . . . . . . . . . . . . . 59
Drivers Involved in Fatal Collisions - Age and Alcohol Involvement . . . . . . . . . . . . . . . . . . . . . 59
Alcohol Involvement by Age and Test Results for Drivers Involved in Fatal Collisions . . . . . 60
Fatally Injured Pedestrians . . . . . . . . . . . . . . . . . . . . . . . . . . . . . . . . . . . . . . . . . . . . . . . . . . . . . . 60
Safety Restraints and Ejection in Fatal Collisions . . . . . . . . . . . . . . . . . . . . . . . . . . . . . . . . . . . 61
Child Restraints in Fatal Collisions . . . . . . . . . . . . . . . . . . . . . . . . . . . . . . . . . . . . . . . . . . . . . . . 62
Selecting the Appropriate Car Seat for Your Child’s Weight and Age . . . . . . . . . . . . . . . . . . . . 63
Cost of Kentucky Traffic Collisions . . . . . . . . . . . . . . . . . . . . . . . . . . . . . . . . . . . . . . . . . . . . . . . 64
iii
INTRODUCTIONKENTUCKY’S TRAFFIC COLLISION FACTS report for 2000 is based on collision reports submitted to the Kentucky State PoliceRecords Branch. As required by Kentucky Revised statutes 189.635, “every law enforcement agency whose officers investigatea vehicle accident of which a report must be made...shall file a report of the accident...within ten days after investigation of theaccident upon forms supplied by the bureau.” The stated purpose of this requirement is to utilize data on traffic collisions for suchpurposes as will improve the traffic safety program in the Commonwealth.” Data contained in this report are based solely on theobservations and judgements of the state and local police officers who investigated each collision. The collision data is containedin an automatic system (Collision Report Analysis for Safer Highways) (CRASH). This system has edit checks for accuracy.Computer tabulations and summaries are again checked for accuracy before information is released or disseminated. It is hopedthat the detailed information presented in the 2000 Kentucky Traffic Collision Facts report will, in fact, “improve the traffic safetyprogram within the Commonwealth.”
Definitions and Terms: the National MANUAL ON CLASSIFICATION OF MOTOR VEHICLE TRAFFIC CRASHES is used toensure uniformity and compliance with federal requirements. Standard definitions and terms used in this booklet include thefollowing:
Motor Vehicle Traffic Collision: any motor vehicle collision that occurs on a trafficway or that occurs after the motor vehicle runsoff roadway but before events are stabilized.
Collision: an unintended event that produces death, injury or damage. The word “injury” includes “fatal injury.”
Trafficway: the entire width between property lines or other boundary lines, of every way or place, of which any part is opento the public for purposes of vehicular travel as matter of right or custom.
Fatal Collision: is any motor vehicle collision that results in fatal injuries to one or more persons.
Fatality: a person or persons killed in a fatal collision (also referred to as “persons killed”).
Nonfatal Injury Collision: any motor vehicle collision that results in injury, other than fatal, to one or more persons (also referredto as Personal Injury Collision).
Injured: a person or person injured in a collision (also referred to as “persons injured”).
Property Damage Collision: any motor vehicle collision in which there is no injury to any person, but only damage to a motorvehicle or other property, including injury to domestic animals.
Alcohol-Related Collision: any collision in which an operator was observed to have been drinking by the officer investigatingthe collision.
NOTE: KRS 189.635 requires “any person operating a vehicle...who is involved in an accident resulting in any property damageexceeding $500 in which an investigation is not conducted by a law enforcement officer shall file a written report of the accidentwith the state police within ten(10) days of occurrence of the accident...” Such reports are not included in the overall datapresented in this report.
NOTE: Summary data on fatal collisions are included throughout this report. Additional data on fatal collisions can be foundin the section titled “Kentucky’s Fatality Analysis Reporting System (FARS)”, pages 57-62.
NOTE: Prior to 1985, Kentucky utilized a ninety day cut-off for deaths resulting from fatal collisions. As of 1986, persons whodied as a result of injuries sustained in a motor vehicle collision are counted as fatalities only if death occurred within thirty daysfrom the date of the collision. This change from ninety to thirty days was made to be consistent with guidelines of the NationalHighway Traffic Safety Administration.
NOTE: Beginning with the 2000 Kentucky Traffic Collision Facts report, these statistics were tabulated under modified formats.Data from parking lots and private property are reported but summarized separately from collisions on public roads. Civilian reportdata are not included. UNLESS OTHERWISE NOTED, THE DATA ARE FOR PUBLIC ROADS ONLY.Therefore, some data are not directly comparable to previous years.

CO
MM
ON
WEALTH OF KENTU
CK
Y
UNITED WE STAND
DIVIDED WE FALL
��������������
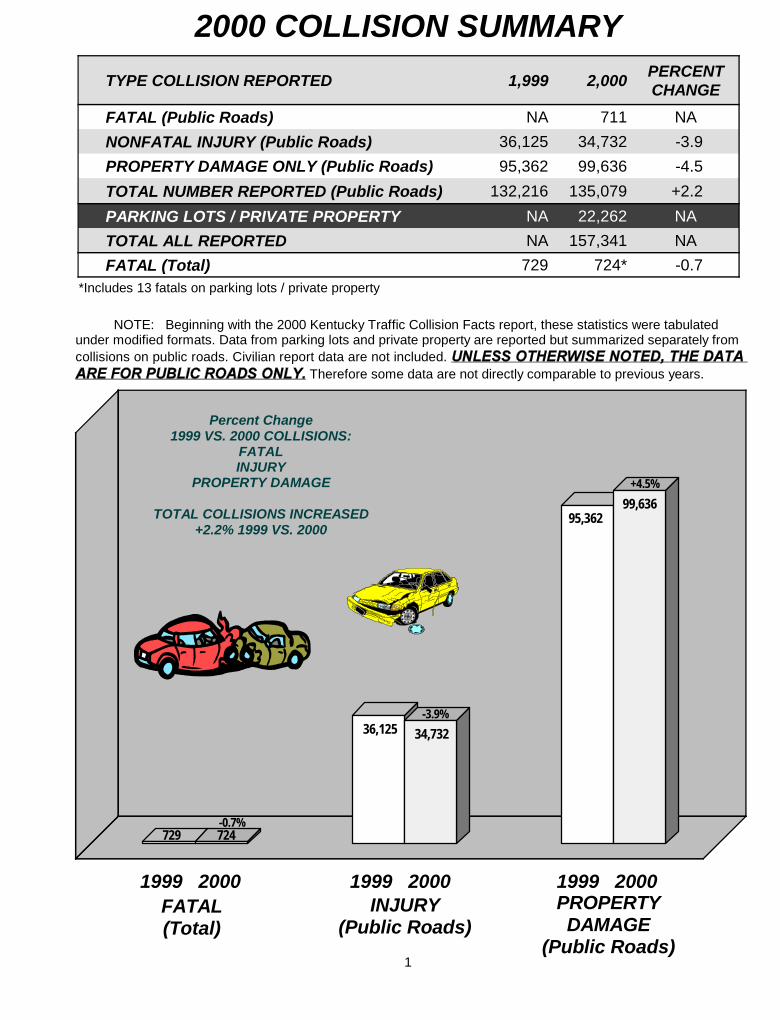
TYPE COLLISION REPORTED 1,999 2,000 PERCENTCHANGE
FATAL (Public Roads) NA 711 NA
NONFATAL INJURY (Public Roads) 36,125 34,732 -3.9
PROPERTY DAMAGE ONLY (Public Roads) 95,362 99,636 -4.5
TOTAL NUMBER REPORTED (Public Roads) 132,216 135,079 +2.2
PARKING LOTS / PRIVATE PROPERTY NA 22,262 NA
TOTAL ALL REPORTED NA 157,341 NA
FATAL (Total) 729 724* -0.7
2000 COLLISION SUMMARY
1
1999 2000 1999 2000 1999 2000FATAL(Total)
INJURY(Public Roads)
PROPERTYDAMAGE
(Public Roads)
Percent Change1999 VS. 2000 COLLISIONS:
FATALINJURY
PROPERTY DAMAGE
TOTAL COLLISIONS INCREASED+2.2% 1999 VS. 2000
-0.7%
-3.9%
+4.5%
729 724
36,125 34,732
95,36299,636
NOTE: Beginning with the 2000 Kentucky Traffic Collision Facts report, these statistics were tabulated under modified formats. Data from parking lots and private property are reported but summarized separately from collisions on public roads. Civilian report data are not included.
Therefore some data are not directly comparable to previous years.
*Includes 13 fatals on parking lots / private property

1999 2000 %CHANGE
PERSONS KILLED - Public Roads NA 810 NA
PERSONS KILLED - Parking Lots / Private Property NA 13 NA
PERSONS KILLED (Total) 819 823 +0.5
PERSONS INJURED - Public Roads 54,951 53,129 -3.3
PERSONS INJURED - Parking Lots / Private Property NA 1,353 NA
PERSONS INJURED (Total) NA 54,482 NA
DEATH AND INJURY SUMMARY
* Based on 4,041,769 population estimate for 2000.** Based on 2,754,348 licensed drivers In Kentucky in 2000 (including learner permits).
YEAR KILLED KY U.S.1985 730 2.6 2.81986 808 2.8 2.61987 849 2.8 2.61988 840 2.7 2.51989 776 2.4 2.31990 851 2.5 2.21991 828 2.4 2.01992 819 2.2 1.81993 875 2.2 1.81994 791 2.0 1.81995 856 2.1 1.81996 846 2.0 1.81997 865 1.9 1.71998 869 1.9 1.61999 819 1.7 1.52000 823 1.8 1.5
RATE
*Miles traveled in Kentucky in 2000 = 46.7 billion**Includes both Public Roads and Private Property
A total of 823 persons were killed during 2000. The total number of traffic fatalities increased 0.5%, with 4 more fatalities than during 1999.
53,129 persons were injured on public roads during 2000, a decrease of 3.3% from 1999, or 1,822 fewer persons injured.
The chart at the right compares death rates for Kentucky vs. U.S. death rates computed by the National Safety Council.
The bottom chart plots persons injured by severity of injury. An incapacitating injury includes those injuries that required transport to a hospital.
FACTS: APPROXIMATELY ONE OF EVERY 5,500 KENTUCKY RESIDENTS DIED AS A RESULT OF A FATAL TRAFFIC COLLISION DURING 2000 IN KENTUCKY. ABOUT ONE IN 82 KENTUCKY RESIDENTS WAS INJURED IN A TRAFFIC COLLISION IN KENTUCKY. *
APPROXIMATELY ONE OF EVERY 12 DRIVERS LICENSED IN KENTUCKY WAS INVOLVED IN A TRAFFIC COLLISION IN KENTUCKY. ABOUT ONE OF 3,000 KENTUCKY DRIVERS WAS INVOLVED IN A FATAL COLLISION.**
2
TOTAL DEATH RATES(deaths per 100 million miles traveled*)
TYPE INJURY NUMBER %
INCAPACITATING INJURYPublic Roads 8,354 16
Parking Lots / Private Property 180 13
NON-INCAPACITATING INJURY
Public Roads 20,849 39
Parking Lots / Private Property 453 33
POSSIBLE INJURY
Public Roads 23,926 45
Parking Lots / Private Property 720 53
TOTAL
Public Roads 53,129
Parking Lots / Private Property 1,353

35
165
97
85
67
38
28
4518
65
34 43
28
21
17
24
0-14 15-24 25-34 35-44 45-54 55-64 65-74 75and
above
AGE
0
25
50
75
100
125
150
175
200
225
250
NU
MB
ER
PERSONS KILLEDMALE (560)
FEMALE (250)
6%
7%
26%
14% 17%
11%
8%
7%
10%
8%
5%
7%
12%
15%
17%
30%
FATALITIESBY AGE AND SEX
The number of persons killed in fatal collisions in 2000 is shown by age and sex in the chart below. There were 560 males versus 250 females killed. Twenty-eight (28) percent of all persons killed in traffic collisions were in the 15- to 24-year old age group. Fifty-two (52) of the persons killed were pedestrians, four were pedalcyclists. The percentages represent the percent of males or females killed in the given age group (as a percentage of the total males or females killed).
3
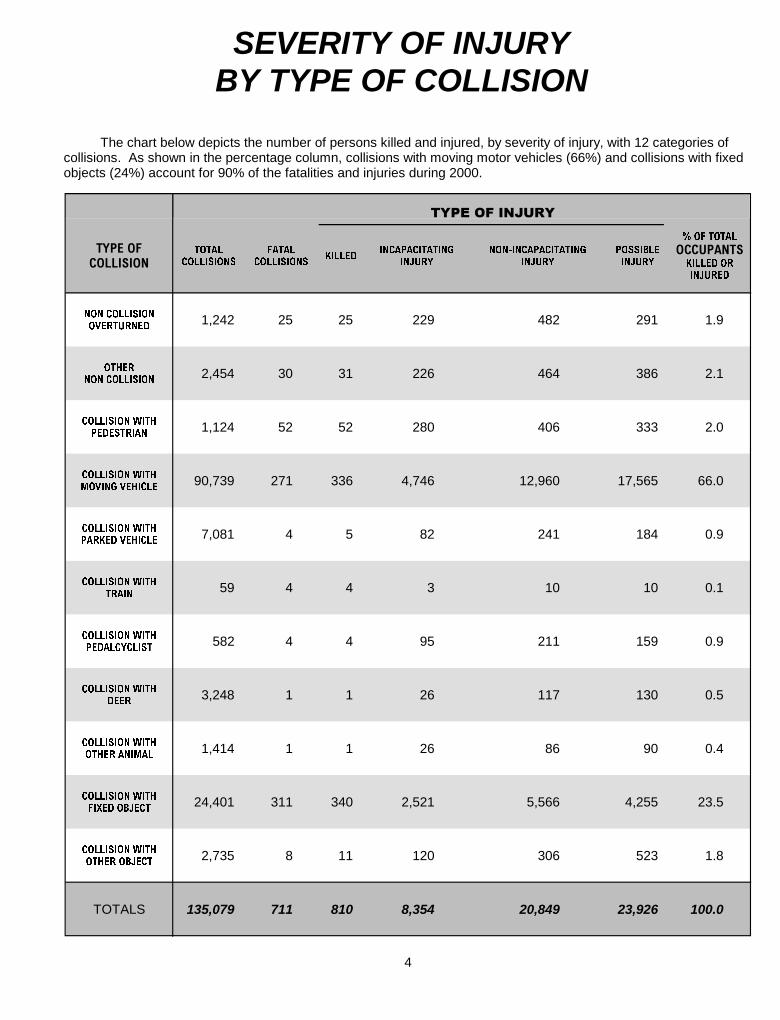
SEVERITY OF INJURYBY TYPE OF COLLISION
The chart below depicts the number of persons killed and injured, by severity of injury, with 12 categories of collisions. As shown in the percentage column, collisions with moving motor vehicles (66%) and collisions with fixed objects (24%) account for 90% of the fatalities and injuries during 2000.
4
�������������
������
���������
����
��������������
�������������
�����
���������������
�����
���������
�����
���������
��� ���������� ���
�����
����������
�������� 1,242 25 25 229 482 291 1.9
�����
����������2,454 30 31 226 464 386 2.1
�������������
�� ������1,124 52 52 280 406 333 2.0
�������������
�������������90,739 271 336 4,746 12,960 17,565 66.0
�������������
����� ��������7,081 4 5 82 241 184 0.9
�������������
����59 4 4 3 10 10 0.1
�������������
�� ���������582 4 4 95 211 159 0.9
�������������
���3,248 1 1 26 117 130 0.5
�������������
�����������1,414 1 1 26 86 90 0.4
�������������
��� �������24,401 311 340 2,521 5,566 4,255 23.5
�������������
������������2,735 8 11 120 306 523 1.8
TOTALS 135,079 711 810 8,354 20,849 23,926 100.0
������������
COLLISIONWITH FIXED
OBJECT:18%
ALLOTHER:
15%
COLLISION WITH MOVING VEHICLES:
67%
ALL COLLISIONS
FATAL COLLISIONS
COLLISION WITH MOVING VEHICLE:
38%
COLLISION WITHFIXED OBJECT:
44%
ALL OTHER:11%
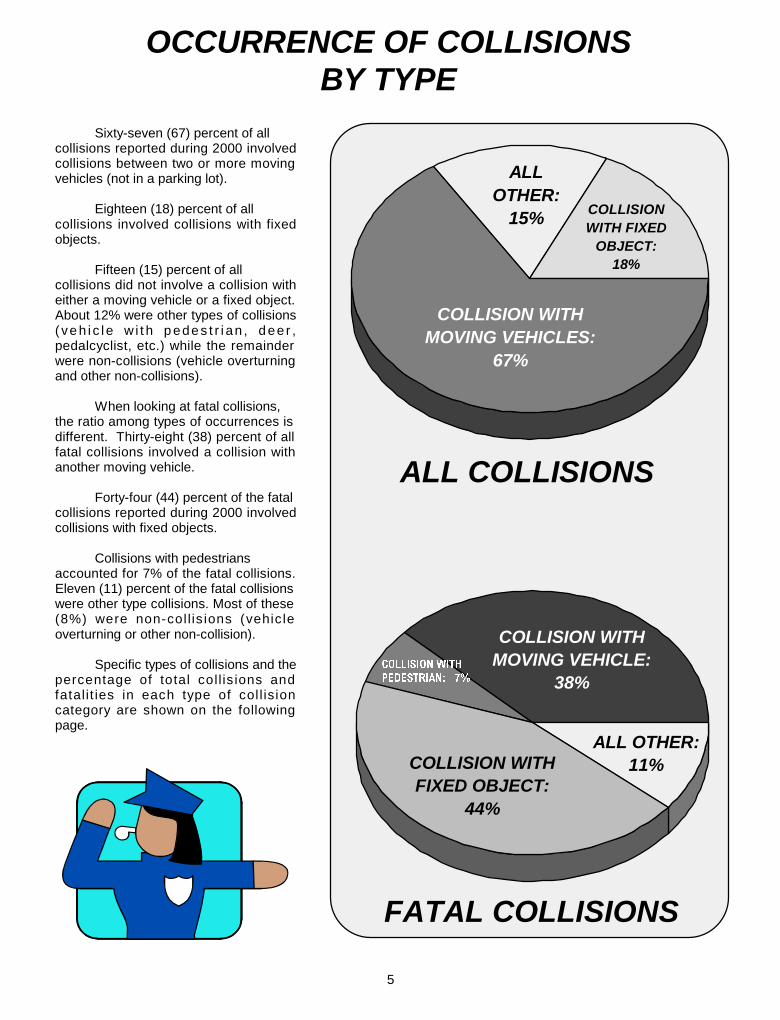
OCCURRENCE OF COLLISIONSBY TYPE
Sixty-seven (67) percent of all collisions reported during 2000 involved collisions between two or more moving vehicles (not in a parking lot).
Eighteen (18) percent of all collisions involved collisions with fixed objects.
Fifteen (15) percent of all collisions did not involve a collision with either a moving vehicle or a fixed object. About 12% were other types of collisions ( ve h i c l e w i t h p ede s t r i an , d ee r , pedalcyclist, etc.) while the remainder were non-collisions (vehicle overturning and other non-collisions).
When looking at fatal collisions, the ratio among types of occurrences is different. Thirty-eight (38) percent of all fatal collisions involved a collision with another moving vehicle.
Forty-four (44) percent of the fatal collisions reported during 2000 involved collisions with fixed objects.
Collisions with pedestrians accounted for 7% of the fatal collisions. Eleven (11) percent of the fatal collisions were other type collisions. Most of these (8%) were non-col l is ions (vehic le overturning or other non-collision).
Specific types of collisions and the percentage of total coll is ions and fatalit ies in each type of col l is ion category are shown on the following page.
������������
�� ������������
5

TYPES OF COLLISIONS
Collisions with other moving motor vehicles were responsible for 67% of all collisions reported during 2000, and accounted for 41% of all fatalities (persons killed). Collisions with fixed objects accounted for 18% of all collisions, but 42% of fatalities. Types of collisions are depicted below.
6
COLLISION WITH ANIMALS(excluding deer):
Total Collisions: 1,414% of Total Collisions: 1.05%
Persons Killed: 1% of Total Fatalities: 0.12%
No. of Fatal Collisions: 1% of All Fatal Collisions: 0.14%
COLLISION WITHDEER:
Total Collisions: 3,248% of Total Collisions: 2.40%
Persons Killed: 1% of Total Fatalities: 0.12%
No. of Fatal Collisions: 1% of All Fatal Collisions: 0.14%
COLLISION WITHRAILWAY TRAIN:
Total Collisions: 59% of Total Collisions: 0.04%
Persons Killed: 4% of Total Fatalities: 0.49%
No. of Fatal Collisions: 4% of All Fatal Collisions: 0.56%
COLLISION WITHPEDALCYCLIST:
Total Collisions: 582% of Total Collisions: 0.43%
Persons Killed: 4% of Total Fatalities: 0.49%
No. of Fatal Collisions: 4% of All Fatal Collisions: 0.56%
COLLISION WITHPEDESTRIAN:
Total Collisions: 1,124% of Total Collisions: 0.83%
Persons Killed: 52% of Total Fatalities: 6.42%
No. of Fatal Collisions: 52% of All Fatal Collisions: 7.31%
COLLISION WITH FIXEDOBJECT:
Total Collisions: 24,401% of Total Collisions: 18.06%
Persons Killed: 340% of Total Fatalities: 41.98%
No. of Fatal Collisions: 311% of All Fatal Collisions: 43.74%
COLLISION WITH MOVINGMOTOR VEHICLE:
Total Collisions: 90,739% of Total Collisions: 67.17%
Persons Killed: 336% of Total Fatalities: 41.48%
No. of Fatal Collisions: 271% of All Fatal Collisions: 38.12%
NON-COLLISIONOVERTURNED:
Total Collisions: 1,242% of Total Collisions: 0.92%
Persons Killed: 25% of Total Fatalities: 3.09%
No. of Fatal Collisions: 25% of All Fatal Collisions: 3.52%
OTHERNON-COLLISION:
Total Collisions: 2,454% of Total Collisions: 1.82%
Persons Killed: 31% of Total Fatalities: 3.83%
No. of Fatal Collisions: 30% of All Fatal Collisions: 4.22%
COLLISION WITH OTHEROBJECT:
Total Collisions: 2,735% of Total Collisions: 2.02%
Persons Killed: 11% of Total Fatalities: 1.36%
No. of Fatal Collisions: 8% of All Fatal Collisions: 1.13%
PARKED VEHICLECOLLISIONS:
Total Collisions: 7,081% of Total Collisions: 5.24%
Persons Killed: 5% of Total Fatalities: 0.62%
No. of Fatal Collisions: 4% of All Fatal Collisions: 0.56%

FatalActions
InjuryActions 0-4 5-9 10-14 15-19 20-24 25-44 45-64 65-UP
NotStated
Approaching or Leaving Vehicle 5 58 3 3 9 12 3 18 8 6 0At Intersection 5 107 1 4 12 13 13 32 30 8 0Crossing Against Signal 1 47 0 3 3 10 10 8 8 5 1Crossing With Signal 1 62 1 2 4 2 5 14 25 9 1Dark Clothing / Not Visible 20 50 1 1 4 12 7 27 13 5 0Darting into Roadway 11 225 24 71 62 25 11 21 14 6 2Drinking 5 64 0 0 3 2 8 36 15 3 2Drug Related 0 7 0 0 0 0 1 5 1 0 0Getting On or Off Vehicle 0 14 0 1 1 4 3 3 1 1 0In Crosswalk 1 110 2 5 6 15 12 32 28 10 1Jogging 1 7 0 0 0 2 1 4 1 0 0Lying in Roadway 1 12 0 1 1 0 3 6 1 1 0Not at Intersection 9 109 4 12 23 8 7 36 14 13 1Not in Roadway 4 55 2 3 5 9 8 13 7 10 2Physical Impairment 2 5 0 1 0 0 0 2 2 2 0Playing in Roadway 0 29 2 8 12 2 1 1 2 0 1Pushing Vehicle 0 3 0 0 0 0 1 1 1 0 0Skating/Skateboarding 0 14 1 5 3 3 2 0 0 0 0Walking in Roadway 22 154 5 3 26 16 13 63 30 20 0Working in Roadway 1 26 0 0 0 0 5 16 6 0 0Working on Vehicle 0 16 2 0 0 0 4 7 0 3 0TOTAL* 89 1,174 48 123 174 135 118 345 207 102 11
PEDESTRIAN COLLISIONS
����� �������������������� ������������������������������PEDESTRIAN
FACTOR
Fifty-two (52) pedestrians were killed and 1,019 were injured in traffic collisions in 2000. The charts below depict ages of victims of pedestrian collisions and the factors related to the pedestrian vs. the vehicle at the time of the collision. Up to three pedestrian factors can be coded for one collision. Nineteen (19) percent of the pedestrians killed or injured were 14 years of age or younger, while 15% were age 65 or older.
7
* These totals are higher than the actual number of pedestrians involved because they reflect multiple pedestrian actions.
Straight RightTurn
LeftTurn Parking Starting
in Traffic Slowing Backing Other TOTAL
Approaching or Leaving Vehicle 38 0 0 22 1 0 12 8 81At Intersection 46 20 23 22 2 2 1 13 129Crossing Against Signal 38 4 3 1 2 1 0 4 53Crossing With Signal 11 23 27 1 1 1 0 2 66Dark Clothing / Not Visible 48 2 3 0 0 2 1 9 65Darting into Roadway 214 3 2 1 1 10 1 21 253Drinking 48 0 3 1 2 0 3 5 62Drug Related 5 0 0 0 0 0 0 2 7Getting On or Off Vehicle 6 0 0 6 0 0 0 4 16In Crosswalk 47 17 27 1 0 4 3 8 107Jogging 6 1 0 0 4 0 0 2 13Lying in Roadway 4 2 0 0 0 0 0 0 6Not at Intersection 79 2 6 4 0 4 3 15 113Not in Roadway 17 2 3 11 2 0 6 11 52Physical Impairment 4 1 0 0 0 1 1 0 7Playing in Roadway 21 0 1 1 0 2 4 2 31Pushing Vehicle 4 0 0 0 0 0 0 0 4Skating/Skateboarding 11 2 1 1 0 1 1 0 17Walking in Roadway 128 4 11 4 4 2 9 20 182Working in Roadway 20 0 2 4 1 1 1 7 36Working on Vehicle 5 0 0 1 0 0 1 5 12TOTAL* 800 83 112 81 20 31 47 138 1,312
VEHICLE ACTIONPEDESTRIANFACTOR

TOTAL FATALCOLLISIONS
INJURYCOLLISIONS
PROPERTYDAMAGE
COLLISIONS
PERSONSKILLED
PERSONSINJURED
10,422 13 1,341 9,068 14 1,796
Hit-and-run collisions are those collisions in which the driver leaves the collision scene with the intent of evading responsibility. Hit-and-run is a serious violation of the law. During 2000, there were 10,422 hit-and-run collisions, of which 13 were fatal collisions and 1,341 were injury collisions. As depicted in the chart below, most of Kentucky's hit-and-run collisions were property damage collisions (87%). Fourteen (14) persons were killed and 1,796 were injured.
TYPE OF VICTIM PERSONSKILLED
PERSONSINJURED
Pedestrian 5 127
Pedalcyclist 0 36
Other 9 1,633
TOTAL 14 1,796
HIT-AND-RUN VICTIMSAs shown in the chart below, 5 of the 14 persons killed in hit-and-run collisions were pedestrians and none
were pedalcyclists. One hundred twenty-seven (127) pedestrians and 36 pedalcyclists were injured.
TYPE OFROADWAY
ALL HIT-AND-RUNCOLLISIONS
FATALCOLLISIONS
INJURYCOLLISIONS
PROPERTYDAMAGE
INTERSTATE 663 0 97 566U.S. ROUTE 1,629 3 267 1,359STATE ROUTE 2,405 8 445 1,952PARKWAY 35 1 6 28COUNTY ROADS 592 0 101 491LOCAL STREETS 4,621 1 401 4,219
OTHER 477 0 24 453
TOTAL 10,422 13 1,341 9,068
LOCATION OF HIT-AND-RUN COLLISIONSThe location of hit-and-run collisions are shown in the chart below. The largest percentage of hit-and-run
collisions (44%) occurred on local streets, followed by 23% on state routes.
HIT-AND-RUN COLLISIONS
8
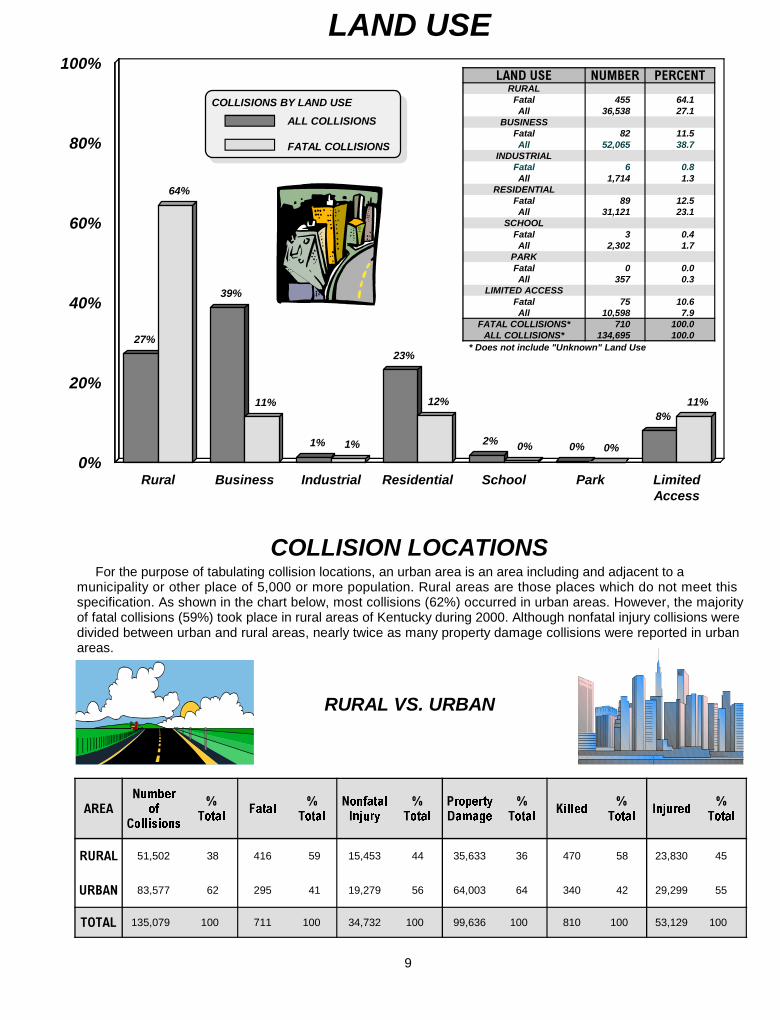
LAND USE
�����
�
��
��
��
��
��
��
��
�
��
� �� 51,502 38 416 59 15,453 44 35,633 36 470 58 23,830 45
���� 83,577 62 295 41 19,279 56 64,003 64 340 42 29,299 55
����� 135,079 100 711 100 34,732 100 99,636 100 810 100 53,129 100
COLLISION LOCATIONSFor the purpose of tabulating collision locations, an urban area is an area including and adjacent to a
municipality or other place of 5,000 or more population. Rural areas are those places which do not meet this specification. As shown in the chart below, most collisions (62%) occurred in urban areas. However, the majority of fatal collisions (59%) took place in rural areas of Kentucky during 2000. Although nonfatal injury collisions were divided between urban and rural areas, nearly twice as many property damage collisions were reported in urban areas.
9
27%
39%
1%
23%
2% 0%
8%
64%
11%
1%
12%
0% 0%
11%
Rural Business Industrial Residential School Park LimitedAccess
0%
20%
40%
60%
80%
100%���� �� � ���� �������
RURAL Fatal 455 64.1All 36,538 27.1
BUSINESSFatal 82 11.5All 52,065 38.7
INDUSTRIALFatal 6 0.8All 1,714 1.3
RESIDENTIALFatal 89 12.5All 31,121 23.1
SCHOOLFatal 3 0.4All 2,302 1.7
PARKFatal 0 0.0All 357 0.3
LIMITED ACCESSFatal 75 10.6All 10,598 7.9
FATAL COLLISIONS* 710 100.0ALL COLLISIONS* 134,695 100.0
COLLISIONS BY LAND USE
ALL COLLISIONS
FATAL COLLISIONS
* Does not include "Unknown" Land Use
RURAL VS. URBAN

TYPE OFROADWAY
FatalCollisions
NonfatalInjury
PropertyDamage
%Total
INTERSTATE 65 2,284 7,291 7
U.S. ROUTE 162 9,062 24,098 25
STATE ROUTE 375 14,108 31,112 34
PARKWAY 19 399 1,138 1
COUNTY ROAD 51 2,624 6,519 7
CITY STREET 29 5,342 25,342 23
Other 10 913 4,136 4
TOTAL 711 34,732 99,636 100
LOCATION OF COLLISIONS
The chart at right shows the number of collisions during 2000 by type of roadway, with percentages of all collisions.
As shown, relatively few collisions were reported on interstate highways (7%).
Thirty-four (34) percent of all collisions occurred on Kentucky's "State Numbered" roads, with 53% of all fatal collisions reported during 2000 occurring on this type of roadway.
Although 23% of all collisions occurred on city streets, only 4% of the fatal collisions occurred on city streets.
INTERSTATE CollisionsFatal
CollisionsNonfatal
InjuryPropertyDamage
NumberKilled
NumberInjured
I-24 391 6 97 288 7 149I-64 1,771 18 439 1,314 21 632I-65 2,001 19 446 1,536 26 708I-71 641 6 170 465 8 249I-75 2,585 7 622 1,956 7 919I-264 1,187 4 289 894 4 404I-265 324 3 70 251 3 108I-275 582 2 122 458 2 173I-471 158 0 29 129 0 32
TOTAL 9,640 65 2,284 7,291 78 3,374
INTERSTATES AND PARKWAYSThe chart below depicts the incidence of collisions on Kentucky's interstates and parkways. Interstate
collisions represent 7% of all collisions. Parkway collisions represent 1% of all collisions.
PARKWAY CollisionsFatal
CollisionsNonfatal
InjuryPropertyDamage
NumberKilled
NumberInjured
Audubon 47 0 6 41 0 11Blue Grass 188 2 39 147 3 60Edward Breathitt 331 2 77 252 2 112Daniel Boone 118 3 42 73 3 83Louie Nunn 133 4 28 101 4 40Bert Combs
Mountain 150 4 49 97 9 70
William Natcher 127 1 33 93 1 44Purchase 115 0 29 86 0 36Wendell Ford 328 1 96 231 1 148Not Stated 19 2 0 17 2 0TOTAL 1,556 19 399 1,138 25 604
10

COLLISIONSBY ROADWAY CONDITIONS
AND ROADWAY CHARACTERThe charts below depict percentages and numbers of all collisions and fatal collisions according to the
conditions and character of the roadway on which the collision occurred.The road conditions chart compares fatal collisions with all collisions for different road conditions identified by
the police officer who completed the collision investigation report.As depicted in the bottom chart, 79% of all collisions occurred on straight roads and 21% on curved roads.
Thirty-eight (38) percent of the fatal collisions during 2000 occurred on curved roads.
11
74.4%
20.3%
4.7%0.2% 0.4%
79.6%
17.2%
2.7% 0.3% 0.3%
DRY WET SNOW/ICE/SLUSH MUD Not Stated0.0%
10.0%
20.0%
30.0%
40.0%
50.0%
60.0%
70.0%
80.0%
90.0%
100.0%Surface Number Percent
DRYFatal 566 79.6All 100,490 74.4
WETFatal 122 17.2All 27,404 20.3
SNOW/ICE/SLUSHFatal 19 2.7All 6,388 4.7
MUDFatal 2 0.3All 299 0.2
Not StatedFatal 2 0.3All 498 0.4
FATAL COLLISIONS 711
ALL COLLISIONS 135,079
���������������� ��������
ALL COLLISIONS
FATAL COLLISIONS
56.8%
18.1%
4.2%9.2% 9.6%
2.1% 0.1%
37.8%
19.8%
4.5%
16.6% 18.6%
2.7%0.0%
Straight& Level
Straight& Grade
Straight& Hillcrest
Curve& Level
Curve& Grade
Curve& Hillcrest
Unknown0.0%
10.0%
20.0%
30.0%
40.0%
50.0%
60.0%
70.0%
80.0%
90.0%
100.0%
���������������� ���������
ALL COLLISIONS
FATAL COLLISIONS
Terrain Number PercentStraight & Level
Fatal 269 37.8All 76,666 56.8
Straight & GradeFatal 141 19.8
All 24,465 18.1Straight & Hillcrest
Fatal 32 4.5All 5,618 4.2
Curve & LevelFatal 118 16.6
All 12,401 9.2Curve & Grade
Fatal 132 18.6All 12,911 9.6
Curve & HillcrestFatal 19 2.7
All 2,899 2.1Unknown
Fatal 0 0.0All 119 0.1
FATAL COLLISIONS 711ALL COLLISIONS 135,079
DAYLIGHTCOLLISIONS
97,505(72.4%)
COLLISIONSAT DUSK
3,824(2.8%)
COLLISIONSDURINGDARK30,386(22.6%)
DAYLIGHTCOLLISIONS
382(53.7%)
COLLISIONSAT DAWN
17(2.4%)
COLLISIONSDURINGDARK
287(40.4%)
FATAL COLLISIONS ONLY
ALL COLLISIONS(excludes unknown light condition)
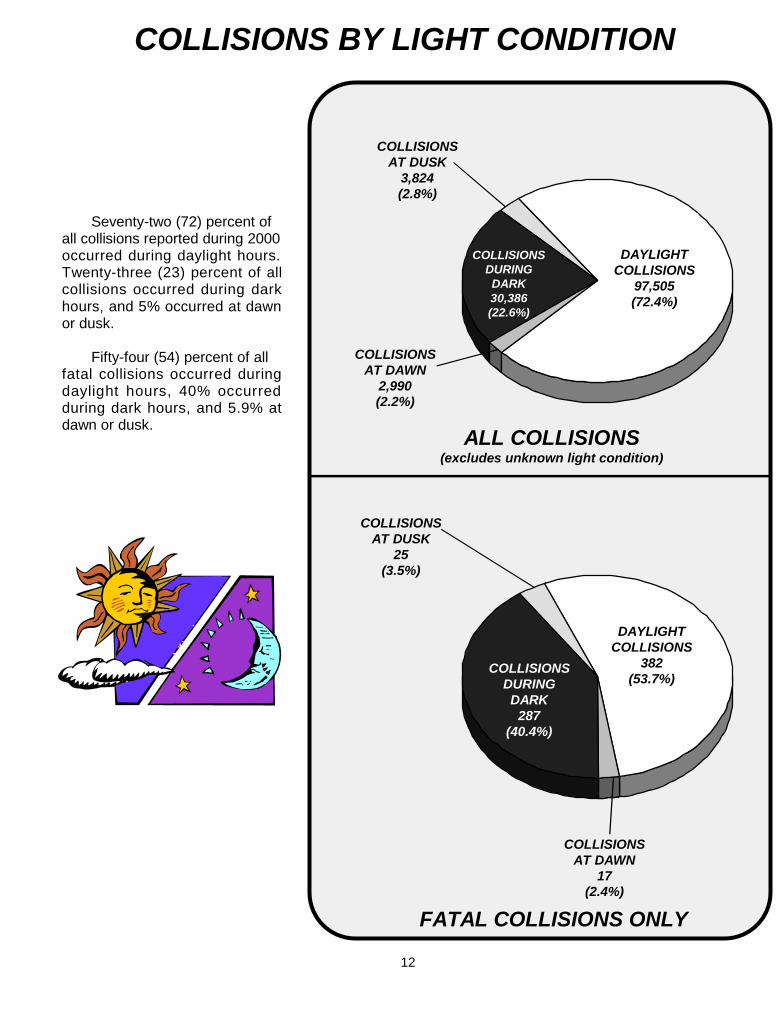
COLLISIONS BY LIGHT CONDITION
Seventy-two (72) percent of all collisions reported during 2000 occurred during daylight hours. Twenty-three (23) percent of all collisions occurred during dark hours, and 5% occurred at dawn or dusk.
Fifty-four (54) percent of all fatal collisions occurred during daylight hours, 40% occurred during dark hours, and 5.9% at dawn or dusk.
12
COLLISIONSAT DAWN
2,990(2.2%)
COLLISIONSAT DUSK
25(3.5%)

13
TWO-VEHICLE COLLISIONS
83,948 traffic collisions (including 213 fatal collisions) reported during 2000 involved "two-vehicle" collisions. These collisions represent 62% of collisions and 30% of fatal collisions reported.
This chart depicts the manner of collision for these collisions, where known. The numbers and percents of each type of collision are shown.
Head-on collisions accounted for only 3% of the total collisions involving two vehicles, but 29% of the fatal collisions.
Rear-end collisions reflect 34% of all two-vehicle collisions, but only 7% of the fatal collisions.
Sideswipe collisions (both meeting and passing) reflect 17% of all collisions and 8% of the fatal collisions.
Angle collisions represent the highest percentage of fatal collisions.
����
�����
�����
�����
����
�����
�����
�� �
����
�����
� �
�����
HEAD-ON
REAR-END
SIDE-SWIPE
ANGLE
BACKED INTO
OTHER
0.0% 10.0% 20.0% 30.0% 40.0% 50.0%
(62)
(28,169)
(16)
(26,154)
(91)
(3,634)
(0)
(9,281)
(29)
(2,132)
(15)
(14,578)
Vehicular Action

118 81 96 109
76 109 122
SUN MON TUE WED THU FRI SAT 0
50
100
150
FA
TA
LC
OL
LIS
ION
S
13,63120,714 19,521 19,354 19,096 23,159 19,598
SUN MON TUE WED THU FRI SAT0
10,000
20,000
30,000
AL
LC
OL
LIS
ION
S
COLLISIONS BY DAY AND MONTHThe graph below shows all collisions and fatal collisions by day of occurrence (excluding unknown). Forty-two
(42) percent of all collisions and 49% of fatal collisions occurred on weekends (Friday, Saturday, Sunday combined).
10,8
27
9,52
0
10,6
18
11,2
62
12,0
20
11,5
06
10,5
18
11,3
39
11,9
68
11,6
53
11,6
71
12,1
77
JAN FEB MAR APR MAY JUN JUL AUG SEP OCT NOV DEC0
5,000
10,000
15,000
AL
LC
OL
LIS
ION
S
40 50 52 62 65 63 75 49
73 56 69 57
JAN FEB MAR APR MAY JUN JUL AUG SEP OCT NOV DEC 0
20
40
60
80
100
FA
TA
LC
OL
LIS
ION
S
July reported the highest number of fatal collisions; January showed the lowest. December ranked highest for total number of collisions and February showed the lowest number of total collisions.
14
�����������������
�������������� ���������

HOLIDAY COLLISIONS
HOLIDAY DEATH TOLL
The chart below depicts the number of deaths in fatal collisions and the number of alcohol involved deaths (as indicated by blood-alcohol tests) over holiday periods for five years. These holiday periods are established by the National Safety Council. The total number of persons killed in holiday periods in 2000 was 67 as compared to 48 in 1999.
COMPARISON OF HOLIDAY FATALITIES/COLLISIONSThe Fourth of July holiday period registered the highest number of fatalities during 2000. The lowest number of holiday
fatalities occurred over the New Year's Day holiday. The chart below shows relevant collision data for each of the holidays.
HOLIDAY PERIODNEW
YEAR'SDAY
MEMORIALDAY
FOURTHOF JULY
LABORDAY
THANKS-GIVING
CHRIST-MAS
NO. PERSONS KILLED 5 13 20 7 16 6
NO. PERSONS INJURED 373 473 372 496 705 356
FATAL COLLISIONS 5 10 15 7 16 4
INJURY COLLISIONS 254 270 235 316 423 213
PROPERTY DAMAGE 623 749 672 674 1,123 560
TOTAL COLLISIONS 882 1,029 922 997 1,562 777
TOTAL DEATHS
The times and dates below have been designated by the National Safety Council for holidays in 2000.
HOLIDAY START END
New Year's Day 6:00 pm Thursday, December 30, 1999 11:59 pm Sunday, January 2, 2000
Memorial Day 6:00 pm Friday, May 26 11:59 pm Monday, May 29
Fourth of July 6:00 pm Friday, June 30 11:59 pm Tuesday, July 4
Labor Day 6:00 pm Friday, September 1 11:59 pm Monday, September 4
Thanksgiving 6:00 pm Wednesday, November 22 11:59 pm Sunday, November 26
Christmas 6:00 pm Friday, December 22 11:59 pm Monday, December 25
HOLIDAY TIMES AND DATES
Number AlcoholInvolved Number Alcohol
Involved Number AlcoholInvolved Number Alcohol
Involved Number AlcoholInvolved
NEW YEAR'S DAY 6 4 2 1 11 3 2 1 5 2
MEMORIAL DAY 11 2 7 1 11 5 11 5 13 7
FOURTH OF JULY 17 4 5 2 6 3 5 3 20 5
LABOR DAY 5 3 13 6 8 5 12 7 7 3
THANKSGIVING 10 4 7 2 10 4 11 2 16 5
CHRISTMAS 2 0 8 4 5 1 7 3 6 2
TOTAL 51 17 42 16 51 21 48 21 67 24
15

VEHICLE TYPE
VEHICLESINVOLVED IN
ALLCOLLISIONS
PERCENTOF TOTAL
VEHICLES INVOLVED IN
FATAL COLLISIONS
PERCENTOF TOTAL
Passenger Cars* 222,324 90.60 916 78.69
Taxicabs 323 0.13 0 0.00
Trucks 11,042 4.50 103 8.85
Motorcycles 1,140 0.46 38 3.26
Motor Scooters/Motor Bikes 90 0.04 2 0.17
School Buses 943 0.38 1 0.09
Other Buses 543 0.22 2 0.17
Farm Tractors/Equipment 200 0.08 2 0.17
Emergency 985 0.40 4 0.34
Other Public Owned 583 0.24 3 0.26
Other 5,709 2.33 93 7.99
Not Stated 1,513 0.62 0 0.00
TOTAL 245,395 100.00 1,164 100.00
TYPE VEHICLES INVOLVED IN COLLISIONS
* Passenger cars include automobiles and trucks registered for 6,000 pounds or less.
There were 245,395 vehicles involved in collisions during 2000. Of this total, 182,060 were involved in property damage only collisions, 62,171 were involved in injury collisions, and 1,164 were involved in fatal collisions. The majority (91%) of the vehicles involved in all collisions were passenger cars (79% in fatal collisions). Trucks accounted for 4.5% of vehicles in all collisions, but accounted for 9% of vehicles in fatal collisions. Motorcycles represented 3% of the vehicles in fatal collisions, but only 0.5% of vehicles in all collisions.
16
������������������ ��� ���������
PASSENGER CARS 2,041,987
COMMERCIAL TRUCKS 871,904
MOTORCYCLES 44,490
Other 327,565
TOTAL (ALL TYPES) 3,285,946
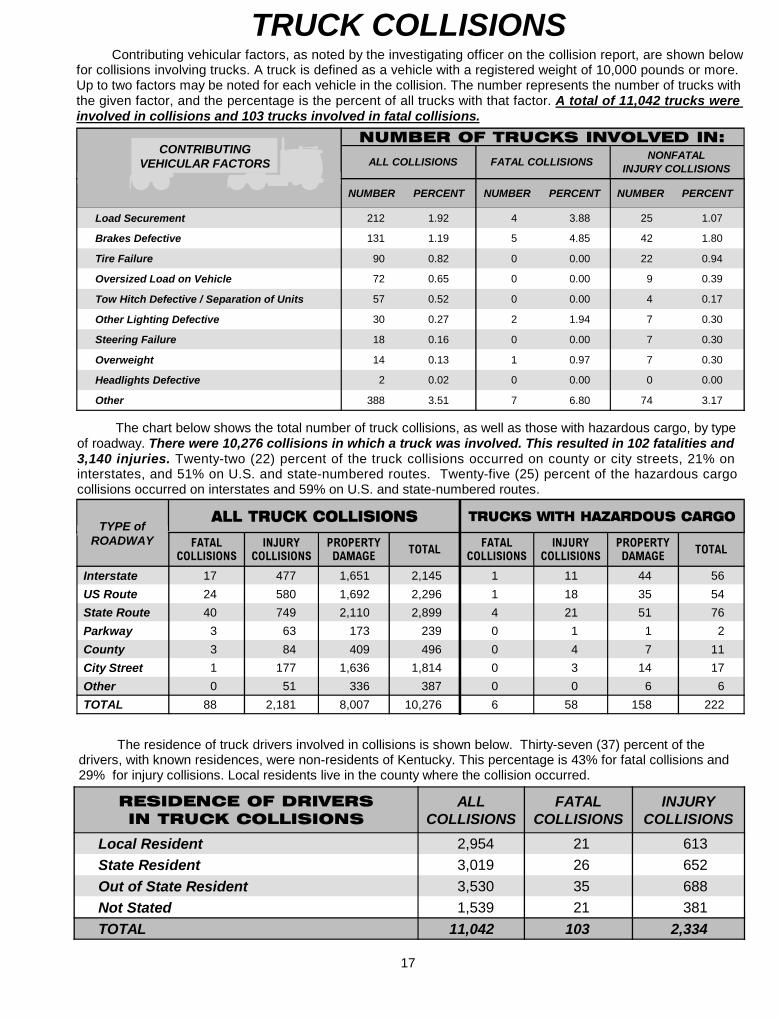
TRUCK COLLISIONSContributing vehicular factors, as noted by the investigating officer on the collision report, are shown below
for collisions involving trucks. A truck is defined as a vehicle with a registered weight of 10,000 pounds or more. Up to two factors may be noted for each vehicle in the collision. The number represents the number of trucks with the given factor, and the percentage is the percent of all trucks with that factor. A total of 11,042 trucks were involved in collisions and 103 trucks involved in fatal collisions.
The chart below shows the total number of truck collisions, as well as those with hazardous cargo, by type of roadway. There were 10,276 collisions in which a truck was involved. This resulted in 102 fatalities and 3,140 injuries. Twenty-two (22) percent of the truck collisions occurred on county or city streets, 21% on interstates, and 51% on U.S. and state-numbered routes. Twenty-five (25) percent of the hazardous cargo collisions occurred on interstates and 59% on U.S. and state-numbered routes.
������������� �
� ����������� �
�����������
����������
�������� �� ���
�������� ������������
�����
Interstate 17 477 1,651 2,145 1 11 44 56
US Route 24 580 1,692 2,296 1 18 35 54
State Route 40 749 2,110 2,899 4 21 51 76
Parkway 3 63 173 239 0 1 1 2
County 3 84 409 496 0 4 7 11
City Street 1 177 1,636 1,814 0 3 14 17
Other 0 51 336 387 0 0 6 6
TOTAL 88 2,181 8,007 10,276 6 58 158 222
����������������������� �����������
ALLCOLLISIONS
FATALCOLLISIONS
INJURYCOLLISIONS
Local Resident 2,954 21 613
State Resident 3,019 26 652
Out of State Resident 3,530 35 688
Not Stated 1,539 21 381
TOTAL 11,042 103 2,334
The residence of truck drivers involved in collisions is shown below. Thirty-seven (37) percent of the drivers, with known residences, were non-residents of Kentucky. This percentage is 43% for fatal collisions and 29% for injury collisions. Local residents live in the county where the collision occurred.
17
NUMBER PERCENT NUMBER PERCENT NUMBER PERCENT
Load Securement 212 1.92 4 3.88 25 1.07
Brakes Defective 131 1.19 5 4.85 42 1.80
Tire Failure 90 0.82 0 0.00 22 0.94
Oversized Load on Vehicle 72 0.65 0 0.00 9 0.39
Tow Hitch Defective / Separation of Units 57 0.52 0 0.00 4 0.17
Other Lighting Defective 30 0.27 2 1.94 7 0.30
Steering Failure 18 0.16 0 0.00 7 0.30
Overweight 14 0.13 1 0.97 7 0.30
Headlights Defective 2 0.02 0 0.00 0 0.00
Other 388 3.51 7 6.80 74 3.17
ALL COLLISIONS FATAL COLLISIONSNONFATAL
INJURY COLLISIONS
� �������� ���������������CONTRIBUTING
VEHICULAR FACTORS
TYPE ofROADWAY

RESIDENCE OF DRIVER
NUMBER INVOLVED IN
ALLCOLLISIONS
PERCENTOF
TOTAL
PERCENTOF TOTAL
EXCLUDINGNOT STATED
LOCAL RESIDENT 152,615 67 68
STATE RESIDENT 46,699 21 21
OUT OF STATE 24,535 11 11
NOT STATED 3,743 2
TOTAL 227,592 100 100
RESIDENCE OF DRIVER
NUMBER INVOLVED IN
FATAL COLLISIONS
PERCENTOF
TOTAL
PERCENTOF TOTAL
EXCLUDINGNOT STATED
LOCAL RESIDENT 626 59 59
STATE RESIDENT 282 27 27
OUT OF STATE 148 14 14
NOT STATED 5 0
TOTAL 1,061 100 100
SEXNUMBER IN
FATALCOLLISIONS
PERCENT INFATAL
COLLISIONS
MALE 776 73
FEMALE 285 27
TOTAL 1,061 100
SEXNUMBER IN
ALLCOLLISIONS
PERCENT INALL
COLLISIONS
MALE 133,425 59
FEMALE 94,167 41
TOTAL 227,592 100
DRIVER INVOLVEMENT
There were 227,592 drivers involved in collisions during 2000. Of these, 1,061 drivers were involved in fatal collisions. The chart below tabulates driver involvement by residence and shows that most drivers (68% of those in which residence is known) were local residents (reside in the county where the collision occurred). Many drivers in the unknown category are the result of hit-and-run collisions where the drivers' identities remain unknown. There are fewer drivers than vehicles because of collisions with unoccupied vehicles (generally a parked vehicle).
INVOLVEMENT BY RESIDENCE
RESIDENCEOF
DRIVER
As shown in the chart below, 59% of the drivers who were involved in collisions during 2000 (where sex was listed) were male; 41% were female. In fatal collisions, 73% of the drivers were male and 27% were female.
��������������� ��������������
SEXOF
DRIVER
18

0%
14%14%
22%
20%
14%
8%
5%
3%
0%
6%
9%
19%
22%
19%
12%
8%
5%
under16
16to19
20to24
25to34
35to44
45to54
55to64
65to74
75andover
AGE
0%
5%
10%
15%
20%
25%DRIVERS INVOLVED INALL COLLISIONS
LICENSED DRIVERS
AGE OF DRIVER(ALL COLLISIONS)
The chart below groups the ages of 225,553 drivers involved in traffic collisions in 2000 in Kentucky (for which age information was available). For each age category, the following information is shown: the percentage of drivers involved in all collisions, the number of drivers involved in these collisions is shown in parentheses, the percentage of all licensed drivers, and the number of licensed drivers is shown in parentheses (includes learner permits). This allows a comparison to be made between the percentage of a given age category is of the driving population and the corresponding percentage this age category is involved in collisions. The percentage of drivers involved in all collisions was higher than the percentage of licensed drivers for the age categories under age 35, especially for the 16 to 19 years of age category. This data does not differentiate drivers "at-fault" versus drivers "not-at-fault." There were 2,039 driver's ages which could not be determined. These drivers represent 0.9% of all drivers involved in all collisions. The percentages given below do not consider the "Unknown" category.
(31,684)(32,657)
(49,073)
(44,949)
(31,705)
(17,237)
(10,667)
(6,951)
(630)(0)
(173,727)
(247,566)
(516,191)
(592,045)
(520,710)
(336,545)
(226,913)
(140,652)
19
NOTE: PERCENTAGE OF LICENSED DRIVERS IN EACH AGE CATEGORY ARE BASED ON 2,754,348 DRIVERS LICENSED IN KENTUCKY AS OF 12/31/2000(Includes learner permits.)

1%
12%
16%
21%
19%
13%
8%
5% 5%
0%
6%
9%
19%
22%
19%
12%
8%
5%
under16
16to19
20to24
25to34
35to44
45to54
55to64
65to74
75andover
AGE
0%
6%
11%
17%
22%
28% DRIVERS INVOLVED INFATAL COLLISIONS
LICENSED DRIVERS
AGE OF DRIVER(FATAL COLLISIONS)
The chart below groups the ages of 1,060 drivers involved in fatal collisions in 2000 (for which age information was available). It should be noted that the drivers were not necessarily killed in the fatal collision. The number of drivers involved in fatal collisions exceeded the total number of fatal collisions. Percentages are based on drivers involved in fatal collisions during 2000 and do not include one driver whose age was not stated on the collision report. The numbers of drivers involved in fatal collisions and licensed drivers are in parentheses. The percentage of the driving population within a given age category can be compared to the corresponding percentage of involvement in fatal collisions within this same age category. The largest difference is the over-representation of teenage drivers in fatal collisions (12%) compared to their percent of the driving population (6.3% including learner permits).
(206)
(167)
(123)
(140)
(86)
(54) (52)
(7)
20
(225)
(0)
(173,727)
(247,566)
(516,191)
(592,045)
(520,710)
(336,545)
(226,913)
(140,652)
NOTE: PERCENTAGE OF LICENSED DRIVERS IN EACH AGE CATEGORY ARE BASED ON 2,754,348 DRIVERS LICENSED IN KENTUCKY AS OF 12/31/2000(Includes learner permits.)
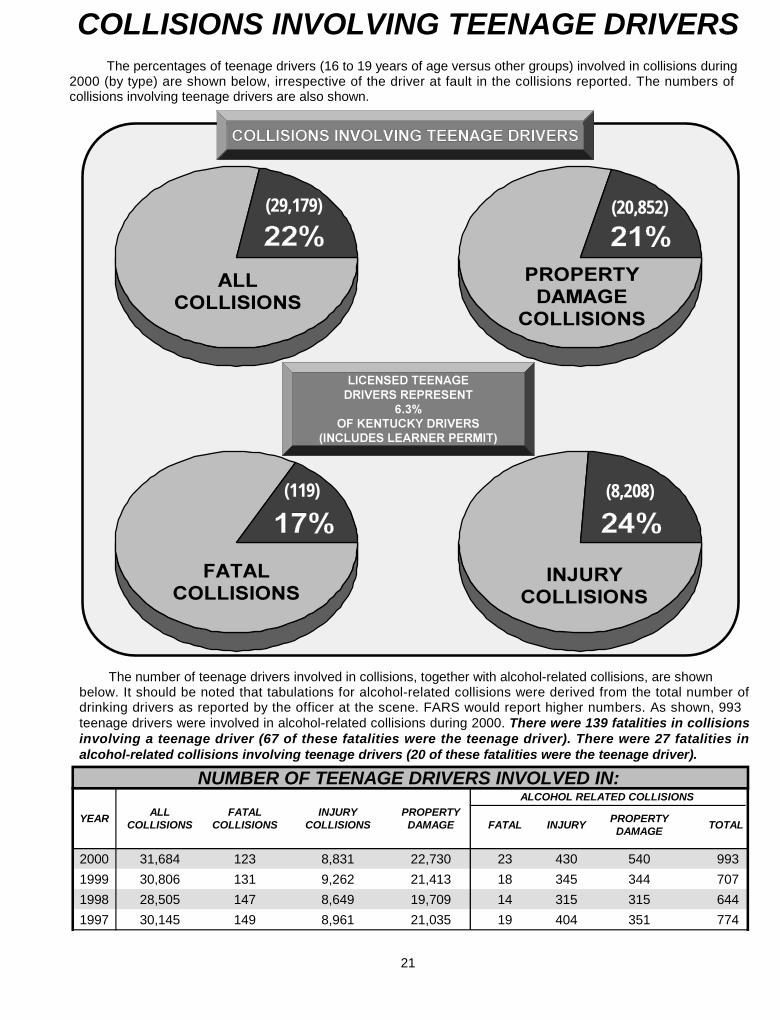
COLLISIONS INVOLVING TEENAGE DRIVERSThe percentages of teenage drivers (16 to 19 years of age versus other groups) involved in collisions during
2000 (by type) are shown below, irrespective of the driver at fault in the collisions reported. The numbers of collisions involving teenage drivers are also shown.
The number of teenage drivers involved in collisions, together with alcohol-related collisions, are shown below. It should be noted that tabulations for alcohol-related collisions were derived from the total number of drinking drivers as reported by the officer at the scene. FARS would report higher numbers. As shown, 993 teenage drivers were involved in alcohol-related collisions during 2000. There were 139 fatalities in collisions involving a teenage driver (67 of these fatalities were the teenage driver). There were 27 fatalities in alcohol-related collisions involving teenage drivers (20 of these fatalities were the teenage driver).
21
YEARALL
COLLISIONSFATAL
COLLISIONSINJURY
COLLISIONSPROPERTY
DAMAGE FATAL INJURYPROPERTYDAMAGE
TOTAL
2000 31,684 123 8,831 22,730 23 430 540 993
1999 30,806 131 9,262 21,413 18 345 344 707
1998 28,505 147 8,649 19,709 14 315 315 644
1997 30,145 149 8,961 21,035 19 404 351 774
NUMBER OF TEENAGE DRIVERS INVOLVED IN:ALCOHOL RELATED COLLISIONS
(29,179) (20,852)
(8,208)(119)

ALCOHOL-RELATED COLLISIONSAn alcohol-related collision is any collision where a driver was determined to have been drinking. For injury and
property damage collisions, the following information gives the determination made at the scene by the investigating officer and given on the collision report. However, more detailed information regarding drinking drivers in fatal collisions is obtained from FARS, which follows up on blood alcohol content (BAC) results.
Alcohol-related collisions are listed by county beginning on page 40. The following information has been adjusted to agree with FARS statistics involving fatal collisions; therefore, these numbers may not agree with previously listed state totals.
The total number of alcohol involved collisions is depicted in the upper left chart. The number of persons killed and injured in alcohol involved collisions is depicted in the right-hand chart.
6,126 alcohol-related collisions were reported during 2000. 2.9% of the alcohol-related collisions were fatal, 47% were injury collisions, and 50% were property damage only.
Comparison with previous yearsDuring 2000, alcohol-related collisions increased by 13% from 1999. The 196 persons killed in 2000 reflect an
decrease of 12% when compared with 222 persons killed in 1999. During 2000, there were 4,447 persons injured in alcohol-related collisions, an increase of 12% from 1999 when 3,981 persons were injured.
Fatal collision data in the chart below have been adjusted to reflect follow-up studies of alcohol test results.
YEARTOTAL COLLISIONS
(Alcohol Related)% CHANGE FROMPREVIOUS YEAR
TOTALKILLED
%+/-
TOTALINJURED
%+/-
2000 6,127 +13 196 -12 4,447 +12
1999 5,441 +4 222 +8 3,981 +3
1998 5,222 -14 205 -12 3,882 -17
1997 6,070 -1 234 -9 4,653 +0
1996 6,150 -0 256 -8 4,637 -2
1995 6,163 +3 278 -3 4,741 +5
22
AL
LC
OL
LIS
ION
S FATAL COLLISIONS 181
INJURY COLLISIONS 2,903
PROPERTY DAMAGECOLLISIONS
3,043
TOTAL 6,127
NUMBER KILLED 196
NUMBER INJURED 4,447
INCAPACITATINGINJURIES
1,163
NON-INCAPACITATINGINJURIES
1,949
POSSIBLE INJURIES 1,335PE
RS
ON
SK
ILL
ED
/I NJU
RE
D

SAFETY RESTRAINTSThe chart below com pares safety belt usage for the years of 1996 through 2000. The data were obtained as part
of an annual observational survey conducted at 200 sites across Kentucky. Data for children under four years of age
were collected in both the front and rear seats.
The chart below shows vehicle occupants by their injury status, and separates the occupants into categories of restraint used and restraint not used. Overall, 15% of all vehicle occupants were killed or injured. A breakdown into restraint usage shows only 13% of those restrained were killed or injured, com pared to 40% of those not restrained. Com paring the percentages killed or injured in the "Restraint Used" and "Restraint Not Used" categories shows the benefit of wearing a safety belt. The "NOT APPLICABLE" category includes occupants in vehicles that norm ally do not contain safety restraints, occupants where safety restraints usage was not indicated, occupants not in an appropriate position, or pedestrians and pedalcyclist.
23
NUMBER% OF
TOTALNUMBER
% OF
TOTALNUMBER
% OF
TOTALNUMBER
% OF
TOTAL
KILLED 810 0.2 247 0.1 418 1.5 145 0.4
INCAPACITATING
INJURY8,354 2.3 4,760 1.6 2,630 9.5 964 2.8
NON-INCAPACITATING
INJURY20,849 5.8 14,379 4.8 4,850 17.5 1,620 4.7
POSSIBLE INJURY 23,926 6.7 19,402 6.5 3,227 11.6 1,297 3.8
NOT INJURED 304,877 85.0 258,095 86.9 16,576 59.8 30,206 88.2
TOTAL 358,816 100.0 296,883 100.0 27,701 100.0 34,232 100.0
NOTAPPLICABLE
RESTRAINTNOT USED
RESTRAINTUSED
ALLOCCUPANTSINJURY
STATUS
ALL FRONT SEATDRIVERS & PASSENGERS
CHILDREN UNDER FOUR YEARS OF AGE
2000 60 87
1999 59 89
1998 54 80
1997 54 82
1996 55 79
YEAR
Note: There were 16,117 deploym ents of front air bags and 409 of side air bags.

CO
MM
ON
WEALTH OF KENTU
CK
Y
UNITED WE STAND
DIVIDED WE FALL
����� ����������

HUMAN FACTORS ALL COLLISIONS
PERCENTOF TOTAL
FATALCOLLISIONS
PERCENTOF TOTAL
Inattention 48,548 35.94 124 17.44
Failed to Yield Right of Way 18,455 13.66 91 12.80
Following Too Close 7,755 5.74 2 0.28
Too Fast for Conditions 7,512 5.56 64 9.00
Not Under Proper Control 6,979 5.17 86 12.10
Alcohol Involvement 6,117 4.53 171 24.05
Disregard Traffic Control 4,401 3.26 30 4.22
Misjudge Clearance 3,885 2.88 4 0.56
Distraction 3,782 2.80 11 1.55
Overcorrecting/Oversteering 2,972 2.20 68 9.56
Turning Improperly 2,450 1.81 8 1.13
Exceeded Stated Speed Limit 2,121 1.57 90 12.66
Fell Asleep 1,539 1.14 26 3.66
Improper Passing 1,532 1.13 7 0.98
Improper Backing 1,200 0.89 0 0.00
Drug Involvement 868 0.64 10 1.41
Lost Consciousness/Fainted 572 0.42 16 2.25
Weaving in Traffic 368 0.27 2 0.28
Cell Phone 362 0.27 2 0.28
Fatigue 359 0.27 5 0.70
Sick 306 0.23 6 0.84
Emotional 297 0.22 1 0.14
Physical Disability 239 0.18 8 1.13
Medication 227 0.17 2 0.28
CONTRIBUTING FACTORSA variety of factors and conditions can contribute to a collision. Police officers may indicate up to three
driver factors for each driver, two vehicular factors for each vehicle, and up to two environmental factors for each collision. This table gives the number of collisions in which a given factor was listed at least once. Accumulations were made only once for each factor indicated in a collision, even if the factor was listed for more than one driver or vehicle. Therefore, the percentages give the percent of collisions in which a given factor is listed.
27

VEHICULAR FACTORS ALL COLLISIONS
PERCENTOF TOTAL
FATALCOLLISIONS
PERCENTOF TOTAL
Brakes Defective 1,544 1.14 10 1.41
Tire Failure 750 0.56 3 0.42
Load Securement 397 0.29 6 0.84
Steering Failure 340 0.25 2 0.28
Other Lighting Defective 194 0.14 2 0.28
Oversized Load on Vehicle 160 0.12 2 0.28
Tow Hitch Defective / Separation of Units
142 0.11 1 0.14
Headlights Defective 51 0.04 1 0.14
Overweight 30 0.02 1 0.14
CONTRIBUTING FACTORS(cont'd)
A variety of factors and conditions can contribute to a collision. Police officers may indicate up to three driver factors for each driver, two vehicular factors for each vehicle, and up to two environmental factors for each collision. This table gives the number of collisions in which a given factor was listed at least once. Accumulations were made only once for each factor indicated in a collision, even if the factor was listed for more than one driver or vehicle. Therefore, the percentages give the percent of collisions in which a given factor is listed.
28
ENVIRONMENTAL FACTORS ALL COLLISIONS
PERCENTOF TOTAL
FATALCOLLISIONS
PERCENTOF TOTAL
Slippery Surface 15,489 11.47 64 9.00
Animals Action 4,844 3.59 3 0.42
View Obstructed / Limited 3,925 2.91 24 3.38
Water Pooling 1,367 1.01 10 1.41
Glare 995 0.74 7 0.98
Construction Work Zone 718 0.53 6 0.84
Debris In Roadway 678 0.50 3 0.42
Improperly Parked Vehicle(s) 406 0.30 3 0.42
Shoulders Defective / Drop-off 396 0.29 4 0.56
Hole/Deep Ruts/Bumps 158 0.12 4 0.56
Improper / Non-Working Traffic Controls
156 0.12 1 0.14
Maintenance / Utility Work Zone 139 0.10 0 0.00
Fixed Object(s) 66 0.05 1 0.14

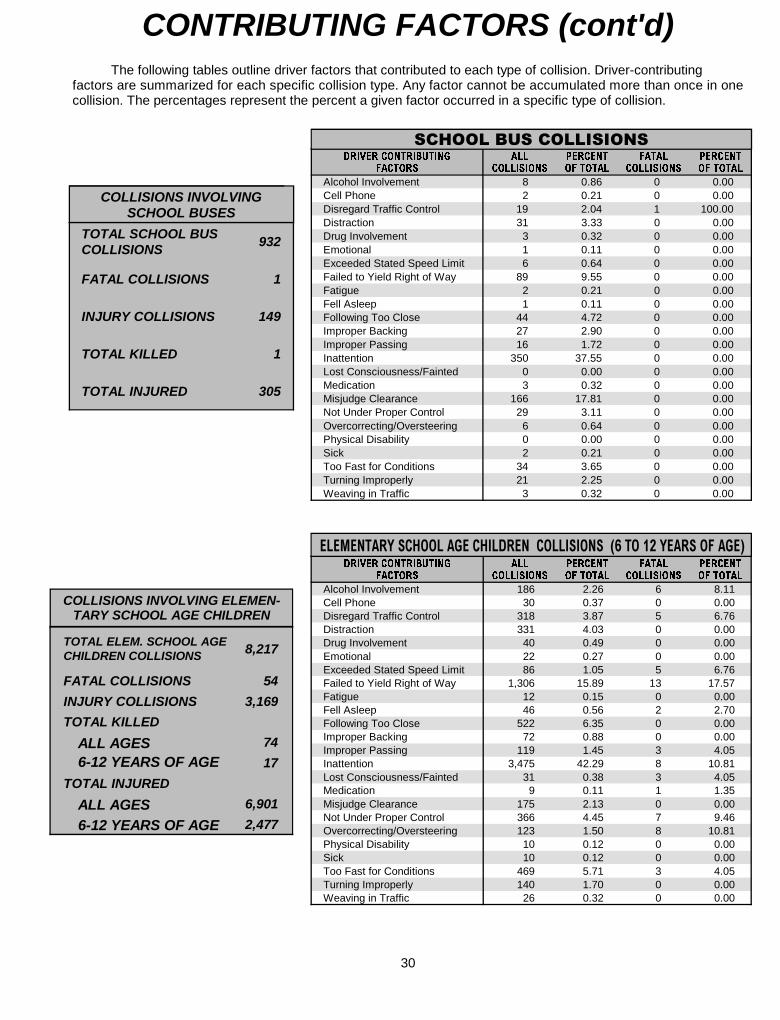
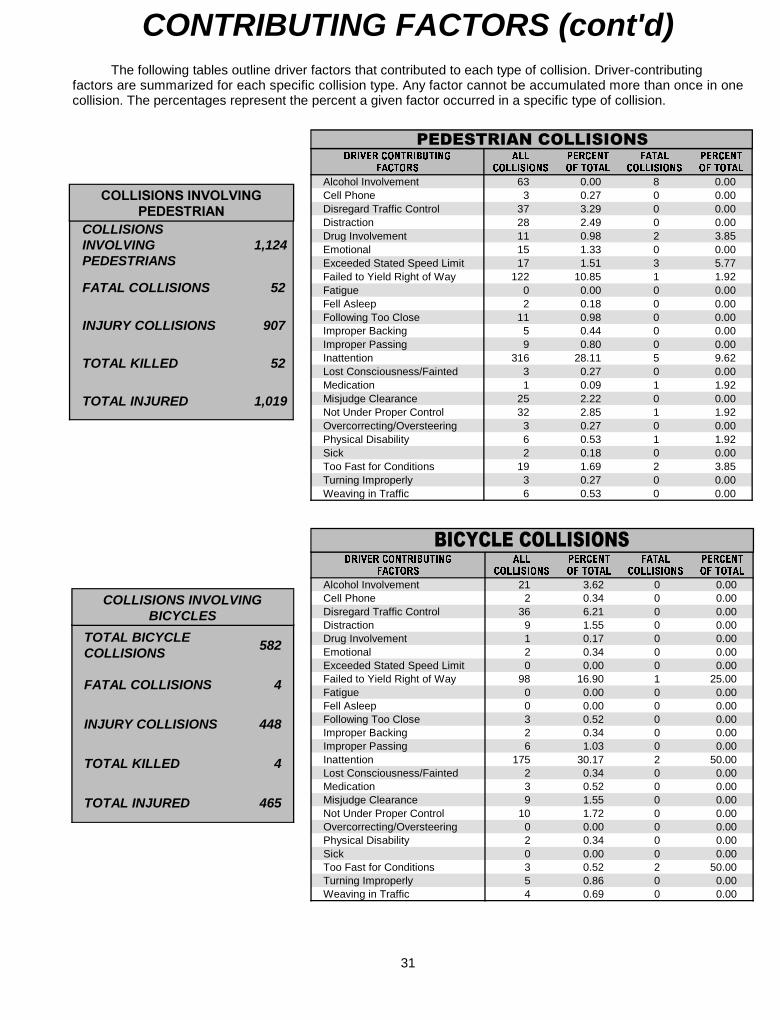
CONTRIBUTING FACTORSThe following tables outline driver factors that contributed to each type of collision. Driver-contributing
factors are summarized for each specific collision type. Any factor cannot be accumulated more than once in one collision. The percentages represent the percent a given factor occurred in a specific type of collision.
29
TOTAL EMERGENCY VEHICLE COLLISIONS
963
FATAL COLLISIONS 4
INJURY COLLISIONS 208
TOTAL KILLED 4
TOTAL INJURED 334
COLLISIONS INVOLVINGEMERGENCY VEHICLES
�������������� �
������
���
���������
�����
������
����
���������
�����
������
Alcohol Involvement 2 1.00 0 0.00Cell Phone 0 0.00 0 0.00Disregard Traffic Control 9 4.50 0 0.00Distraction 6 3.00 0 0.00Drug Involvement 0 0.00 0 0.00Emotional 0 0.00 0 0.00Exceeded Stated Speed Limit 6 3.00 0 0.00Failed to Yield Right of Way 37 18.50 1 50.00Fatigue 0 0.00 0 0.00Fell Asleep 1 0.50 0 0.00Following Too Close 1 0.50 0 0.00Improper Backing 0 0.00 0 0.00Improper Passing 25 12.50 0 0.00Inattention 71 35.50 1 50.00Lost Consciousness/Fainted 2 1.00 0 0.00Medication 0 0.00 0 0.00Misjudge Clearance 8 4.00 0 0.00Not Under Proper Control 5 2.50 0 0.00Overcorrecting/Oversteering 3 1.50 0 0.00Physical Disability 0 0.00 0 0.00Sick 1 0.50 0 0.00Too Fast for Conditions 6 3.00 0 0.00Turning Improperly 3 1.50 0 0.00Weaving in Traffic 0 0.00 0 0.00
������������� �������
������� ����� ��� ��������������������� �
������
���
���������
�����
������
����
���������
�����
������
Alcohol Involvement 53 5.50 1 25.00Cell Phone 5 0.52 0 0.00Disregard Traffic Control 32 3.32 0 0.00Distraction 41 4.26 0 0.00Drug Involvement 18 1.87 0 0.00Emotional 5 0.52 0 0.00Exceeded Stated Speed Limit 19 1.97 2 50.00Failed to Yield Right of Way 144 14.95 1 25.00Fatigue 4 0.42 0 0.00Fell Asleep 8 0.83 0 0.00Following Too Close 25 2.60 0 0.00Improper Backing 19 1.97 0 0.00Improper Passing 12 1.25 0 0.00Inattention 263 27.31 0 0.00Lost Consciousness/Fainted 5 0.52 0 0.00Medication 1 0.10 0 0.00Misjudge Clearance 69 7.17 0 0.00Not Under Proper Control 41 4.26 0 0.00Overcorrecting/Oversteering 22 2.28 1 25.00Physical Disability 0 0.00 0 0.00Sick 3 0.31 0 0.00Too Fast for Conditions 45 4.67 0 0.00Turning Improperly 19 1.97 0 0.00Weaving in Traffic 3 0.31 0 0.00
TOTAL FARM EQUIPMENT COLLISIONS
200
FATAL COLLISIONS 2
INJURY COLLISIONS 58
TOTAL KILLED 2
TOTAL INJURED 81
COLLISIONS INVOLVINGFARM EQUIPMENT
The following tables outline driver factors that contributed to each type of collision. Driver-contributing factors are summarized for each specific collision type. Any factor cannot be accumulated more than once in one collision. The percentages represent the percent a given factor occurred in a specific type of collision.
CONTRIBUTING FACTORS (cont'd)
TOTAL SCHOOL BUS COLLISIONS
932
FATAL COLLISIONS 1
INJURY COLLISIONS 149
TOTAL KILLED 1
TOTAL INJURED 305
COLLISIONS INVOLVINGSCHOOL BUSES
�������������� �
������
���
���������
�����
������
����
���������
�����
������
Alcohol Involvement 186 2.26 6 8.11Cell Phone 30 0.37 0 0.00Disregard Traffic Control 318 3.87 5 6.76Distraction 331 4.03 0 0.00Drug Involvement 40 0.49 0 0.00Emotional 22 0.27 0 0.00Exceeded Stated Speed Limit 86 1.05 5 6.76Failed to Yield Right of Way 1,306 15.89 13 17.57Fatigue 12 0.15 0 0.00Fell Asleep 46 0.56 2 2.70Following Too Close 522 6.35 0 0.00Improper Backing 72 0.88 0 0.00Improper Passing 119 1.45 3 4.05Inattention 3,475 42.29 8 10.81Lost Consciousness/Fainted 31 0.38 3 4.05Medication 9 0.11 1 1.35Misjudge Clearance 175 2.13 0 0.00Not Under Proper Control 366 4.45 7 9.46Overcorrecting/Oversteering 123 1.50 8 10.81Physical Disability 10 0.12 0 0.00Sick 10 0.12 0 0.00Too Fast for Conditions 469 5.71 3 4.05Turning Improperly 140 1.70 0 0.00Weaving in Traffic 26 0.32 0 0.00
TOTAL ELEM. SCHOOL AGECHILDREN COLLISIONS 8,217
FATAL COLLISIONS 54
INJURY COLLISIONS 3,169
TOTAL KILLED
74
17
TOTAL INJURED
6,901
2,477
COLLISIONS INVOLVING ELEMEN-TARY SCHOOL AGE CHILDREN
6-12 YEARS OF AGE
6-12 YEARS OF AGE
ALL AGES
ALL AGES
�������������� �
������
���
���������
�����
������
����
���������
�����
������
Alcohol Involvement 8 0.86 0 0.00Cell Phone 2 0.21 0 0.00Disregard Traffic Control 19 2.04 1 100.00Distraction 31 3.33 0 0.00Drug Involvement 3 0.32 0 0.00Emotional 1 0.11 0 0.00Exceeded Stated Speed Limit 6 0.64 0 0.00Failed to Yield Right of Way 89 9.55 0 0.00Fatigue 2 0.21 0 0.00Fell Asleep 1 0.11 0 0.00Following Too Close 44 4.72 0 0.00Improper Backing 27 2.90 0 0.00Improper Passing 16 1.72 0 0.00Inattention 350 37.55 0 0.00Lost Consciousness/Fainted 0 0.00 0 0.00Medication 3 0.32 0 0.00Misjudge Clearance 166 17.81 0 0.00Not Under Proper Control 29 3.11 0 0.00Overcorrecting/Oversteering 6 0.64 0 0.00Physical Disability 0 0.00 0 0.00Sick 2 0.21 0 0.00Too Fast for Conditions 34 3.65 0 0.00Turning Improperly 21 2.25 0 0.00Weaving in Traffic 3 0.32 0 0.00
� ��������� �������
30
The following tables outline driver factors that contributed to each type of collision. Driver-contributing factors are summarized for each specific collision type. Any factor cannot be accumulated more than once in one collision. The percentages represent the percent a given factor occurred in a specific type of collision.
CONTRIBUTING FACTORS (cont'd)
31
�������������� �
������
���
���������
�����
������
����
���������
�����
������
Alcohol Involvement 63 0.00 8 0.00Cell Phone 3 0.27 0 0.00Disregard Traffic Control 37 3.29 0 0.00Distraction 28 2.49 0 0.00Drug Involvement 11 0.98 2 3.85Emotional 15 1.33 0 0.00Exceeded Stated Speed Limit 17 1.51 3 5.77Failed to Yield Right of Way 122 10.85 1 1.92Fatigue 0 0.00 0 0.00Fell Asleep 2 0.18 0 0.00Following Too Close 11 0.98 0 0.00Improper Backing 5 0.44 0 0.00Improper Passing 9 0.80 0 0.00Inattention 316 28.11 5 9.62Lost Consciousness/Fainted 3 0.27 0 0.00Medication 1 0.09 1 1.92Misjudge Clearance 25 2.22 0 0.00Not Under Proper Control 32 2.85 1 1.92Overcorrecting/Oversteering 3 0.27 0 0.00Physical Disability 6 0.53 1 1.92Sick 2 0.18 0 0.00Too Fast for Conditions 19 1.69 2 3.85Turning Improperly 3 0.27 0 0.00Weaving in Traffic 6 0.53 0 0.00
��������� �������
COLLISIONS INVOLVING PEDESTRIANS
1,124
FATAL COLLISIONS 52
INJURY COLLISIONS 907
TOTAL KILLED 52
TOTAL INJURED 1,019
TOTAL BICYCLECOLLISIONS 582
FATAL COLLISIONS 4
INJURY COLLISIONS 448
TOTAL KILLED 4
TOTAL INJURED 465
COLLISIONS INVOLVINGBICYCLES
�������������� �
������
���
���������
�����
������
����
���������
�����
������
Alcohol Involvement 21 3.62 0 0.00Cell Phone 2 0.34 0 0.00Disregard Traffic Control 36 6.21 0 0.00Distraction 9 1.55 0 0.00Drug Involvement 1 0.17 0 0.00Emotional 2 0.34 0 0.00Exceeded Stated Speed Limit 0 0.00 0 0.00Failed to Yield Right of Way 98 16.90 1 25.00Fatigue 0 0.00 0 0.00Fell Asleep 0 0.00 0 0.00Following Too Close 3 0.52 0 0.00Improper Backing 2 0.34 0 0.00Improper Passing 6 1.03 0 0.00Inattention 175 30.17 2 50.00Lost Consciousness/Fainted 2 0.34 0 0.00Medication 3 0.52 0 0.00Misjudge Clearance 9 1.55 0 0.00Not Under Proper Control 10 1.72 0 0.00Overcorrecting/Oversteering 0 0.00 0 0.00Physical Disability 2 0.34 0 0.00Sick 0 0.00 0 0.00Too Fast for Conditions 3 0.52 2 50.00Turning Improperly 5 0.86 0 0.00Weaving in Traffic 4 0.69 0 0.00

The following tables outline driver factors that contributed to each type of collision. Driver-contributing factors are summarized for each specific collision type. Any factor cannot be accumulated more than once in one collision. The percentages represent the percent a given factor occurred in a specific type of collision.
32
CONTRIBUTING FACTORS (cont'd)
TOTAL ALL TERRAINVEHICLE COLLISIONS
127
FATAL COLLISIONS 10
INJURY COLLISIONS 103
TOTAL KILLED 11
TOTAL INJURED 156
������������������������ �����������
�������������� �
������
���
���������
�����
������
����
���������
�����
������
Alcohol Involvement 21 16.54 3 30.00Cell Phone 0 0.00 0 0.00Disregard Traffic Control 0 0.00 0 0.00Distraction 1 0.79 0 0.00Drug Involvement 1 0.79 0 0.00Emotional 0 0.00 0 0.00Exceeded Stated Speed Limit 4 3.15 0 0.00Failed to Yield Right of Way 18 14.17 0 0.00Fatigue 0 0.00 0 0.00Fell Asleep 0 0.00 0 0.00Following Too Close 1 0.79 0 0.00Improper Backing 0 0.00 0 0.00Improper Passing 0 0.00 0 0.00Inattention 36 28.35 2 20.00Lost Consciousness/Fainted 0 0.00 0 0.00Medication 0 0.00 0 0.00Misjudge Clearance 1 0.79 0 0.00Not Under Proper Control 32 25.20 4 40.00Overcorrecting/Oversteering 6 4.72 2 20.00Physical Disability 0 0.00 0 0.00Sick 0 0.00 0 0.00Too Fast for Conditions 15 11.81 0 0.00Turning Improperly 2 1.57 0 0.00Weaving in Traffic 0 0.00 0 0.00
�������������� �
������
���
���������
�����
������
����
���������
�����
������
Alcohol Involvement 104 10.80 9 25.00Cell Phone 1 0.10 0 0.00Disregard Traffic Control 17 1.77 2 5.56Distraction 14 1.45 0 0.00Drug Involvement 15 1.56 1 2.78Emotional 1 0.10 0 0.00Exceeded Stated Speed Limit 64 6.65 9 25.00Failed to Yield Right of Way 164 17.03 6 16.67Fatigue 2 0.21 0 0.00Fell Asleep 2 0.21 0 0.00Following Too Close 29 3.01 0 0.00Improper Backing 4 0.42 0 0.00Improper Passing 29 3.01 1 2.78Inattention 304 31.57 3 8.33Lost Consciousness/Fainted 0 0.00 0 0.00Medication 1 0.10 0 0.00Misjudge Clearance 11 1.14 0 0.00Not Under Proper Control 161 16.72 9 25.00Overcorrecting/Oversteering 19 1.97 2 5.56Physical Disability 1 0.10 0 0.00Sick 3 0.31 1 2.78Too Fast for Conditions 62 6.44 4 11.11Turning Improperly 20 2.08 0 0.00Weaving in Traffic 6 0.62 0 0.00
����� � ��� �������
TOTAL MOTORCYCLES COLLISIONS
1,110
FATAL COLLISIONS 36
INJURY COLLISIONS 797
TOTAL KILLED 37
TOTAL INJURED 951
Motorcyclists 36Wearing Helmet 19
Wearing Helmet 1

TOTAL TRUCK COLLISIONS
10,276
FATAL COLLISIONS 88
INJURY COLLISIONS 2,181
TOTAL KILLED 102
TOTAL INJURED 3,140
COLLISIONS INVOLVINGTRUCKS*
�������������� �
������
���
���������
�����
������
����
���������
�����
������
Alcohol Involvement 180 1.75 6 6.82Cell Phone 17 0.17 0 0.00Disregard Traffic Control 270 2.63 10 11.36Distraction 201 1.96 1 1.14Drug Involvement 29 0.28 2 2.27Emotional 21 0.20 0 0.00Exceeded Stated Speed Limit 111 1.08 6 6.82Failed to Yield Right of Way 1,133 11.03 18 20.45Fatigue 33 0.32 1 1.14Fell Asleep 129 1.26 2 2.27Following Too Close 513 4.99 0 0.00Improper Backing 197 1.92 0 0.00Improper Passing 174 1.69 0 0.00Inattention 3,621 35.24 26 29.55Lost Consciousness/Fainted 40 0.39 0 0.00Medication 14 0.14 0 0.00Misjudge Clearance 988 9.61 0 0.00Not Under Proper Control 574 5.59 16 18.18Overcorrecting/Oversteering 171 1.66 4 4.55Physical Disability 13 0.13 2 2.27Sick 27 0.26 0 0.00Too Fast for Conditions 425 4.14 5 5.68Turning Improperly 288 2.80 5 5.68Weaving in Traffic 46 0.45 1 1.14
33
The following tables outline driver factors that contributed to each type of collision. Driver-contributing factors are summarized for each specific collision type. Any factor cannot be accumulated more than once in one collision. The percentages represent the percent a given factor occurred in a specific type of collision.
�������������� �
������
���
���������
�����
������
����
���������
�����
������
Alcohol Involvement 4 6.78 0 0.00Cell Phone 0 0.00 0 0.00Disregard Traffic Control 8 13.56 0 0.00Distraction 3 5.08 0 0.00Drug Involvement 0 0.00 0 0.00Emotional 1 1.69 0 0.00Exceeded Stated Speed Limit 0 0.00 0 0.00Failed to Yield Right of Way 8 13.56 0 0.00Fatigue 1 1.69 0 0.00Fell Asleep 0 0.00 0 0.00Following Too Close 0 0.00 0 0.00Improper Backing 0 0.00 0 0.00Improper Passing 0 0.00 0 0.00Inattention 22 37.29 4 100.00Lost Consciousness/Fainted 0 0.00 0 0.00Medication 0 0.00 0 0.00Misjudge Clearance 6 10.17 0 0.00Not Under Proper Control 1 1.69 0 0.00Overcorrecting/Oversteering 0 0.00 0 0.00Physical Disability 0 0.00 0 0.00Sick 0 0.00 0 0.00Too Fast for Conditions 0 0.00 0 0.00Turning Improperly 0 0.00 0 0.00Weaving in Traffic 0 0.00 0 0.00
����� �������
CONTRIBUTING FACTORS (cont'd)
TOTAL TRAIN COLLISIONS 59
FATAL COLLISIONS 4
INJURY COLLISIONS 18
TOTAL KILLED 4
TOTAL INJURED 23
*A truck is defined as a vehicle with a registered weight of 10,000 pounds or more.
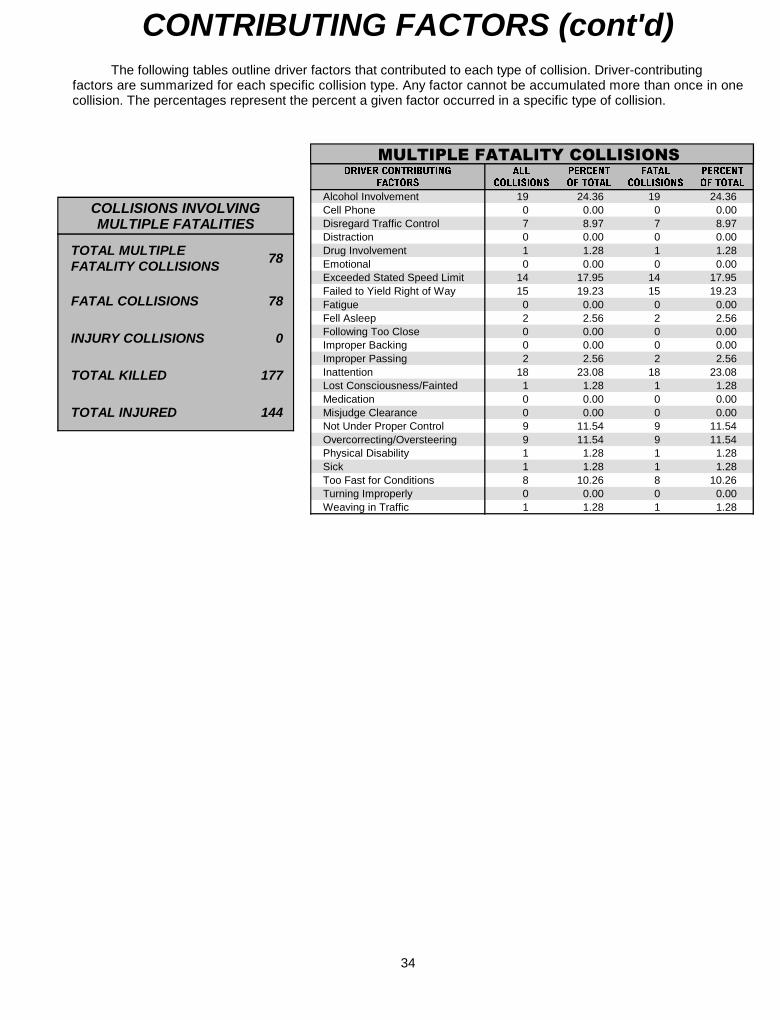
TOTAL MULTIPLE FATALITY COLLISIONS
78
FATAL COLLISIONS 78
INJURY COLLISIONS 0
TOTAL KILLED 177
TOTAL INJURED 144
COLLISIONS INVOLVINGMULTIPLE FATALITIES
�������������� �
������
���
���������
�����
������
����
���������
�����
������
Alcohol Involvement 19 24.36 19 24.36Cell Phone 0 0.00 0 0.00Disregard Traffic Control 7 8.97 7 8.97Distraction 0 0.00 0 0.00Drug Involvement 1 1.28 1 1.28Emotional 0 0.00 0 0.00Exceeded Stated Speed Limit 14 17.95 14 17.95Failed to Yield Right of Way 15 19.23 15 19.23Fatigue 0 0.00 0 0.00Fell Asleep 2 2.56 2 2.56Following Too Close 0 0.00 0 0.00Improper Backing 0 0.00 0 0.00Improper Passing 2 2.56 2 2.56Inattention 18 23.08 18 23.08Lost Consciousness/Fainted 1 1.28 1 1.28Medication 0 0.00 0 0.00Misjudge Clearance 0 0.00 0 0.00Not Under Proper Control 9 11.54 9 11.54Overcorrecting/Oversteering 9 11.54 9 11.54Physical Disability 1 1.28 1 1.28Sick 1 1.28 1 1.28Too Fast for Conditions 8 10.26 8 10.26Turning Improperly 0 0.00 0 0.00Weaving in Traffic 1 1.28 1 1.28
��������������� �������
The following tables outline driver factors that contributed to each type of collision. Driver-contributing factors are summarized for each specific collision type. Any factor cannot be accumulated more than once in one collision. The percentages represent the percent a given factor occurred in a specific type of collision.
CONTRIBUTING FACTORS (cont'd)
34

CO
MM
ON
WEALTH OF KENTU
CK
Y
UNITED WE STAND
DIVIDED WE FALL
���������� �
������

CO LLISIO NS BY CO UNTY
1999 VS 2000
C O L L I S I O N S P E R S O N S
NON-FATAL PROPERTYCO UNTY TOTAL FATAL INJURY DAM AGE KILLED INJURED
1999 2000 1999 2000 1999 2000 1999 2000 1999 2000 1999 2000
Adair 466 556 7 3 120 136 339 417 7 3 177 206
Allen 509 377 5 1 141 141 363 235 7 1 232 193
Anderson 515 484 2 3 146 110 367 371 2 3 202 176
Ballard 188 256 3 3 68 84 117 169 3 4 96 137
Barren 1,297 1,275 4 6 381 363 912 906 5 6 589 574
Bath 289 324 2 4 85 91 202 229 2 4 156 119
Bell 612 697 4 3 202 236 406 458 4 3 305 387
Boone 3,507 3,691 5 7 851 799 2,651 2,885 5 8 1,259 1,120
Bourbon 684 625 4 2 208 187 472 436 4 2 339 258
Boyd 2,073 1,915 4 6 562 478 1,507 1,431 4 7 811 749
Boyle 941 949 8 5 242 251 691 693 10 6 396 391
Bracken 279 271 2 2 79 74 198 195 2 2 117 115
Breathitt 450 442 7 8 201 214 242 220 8 10 388 374
Breckinridge 281 300 7 3 109 115 165 182 7 3 183 198
Bullitt 1,325 1,324 9 5 386 343 930 976 10 5 607 512
Butler 220 231 4 3 68 74 148 154 7 3 104 118
Caldwell 323 355 3 3 95 105 225 247 3 5 150 181
Calloway 970 1,024 3 7 260 258 707 759 3 7 376 396
Cam pbell 3,027 2,746 13 2 638 525 2,376 2,219 13 2 917 738
Carlisle 35 69 3 0 14 22 18 47 3 0 20 30
Carroll 474 441 1 5 148 101 325 335 1 5 204 177
Carter 721 659 12 7 214 214 495 438 14 9 361 310
Casey 257 264 3 1 88 63 166 200 3 1 137 100
Christian 1,973 1,913 10 14 577 504 1,386 1,395 12 15 914 777
Clark 1,260 1,195 6 5 331 254 923 936 8 10 484 368
Clay 455 503 11 9 194 211 250 283 12 11 347 367
Clinton 175 162 2 3 49 44 124 115 2 3 96 72
Crittenden 222 220 4 0 83 86 135 134 4 0 124 126
Cum berland 84 100 4 2 24 27 56 71 6 2 40 49
Daviess 3,229 3,576 10 10 730 821 2,489 2,745 10 11 1,095 1,258
Edm onson 247 230 2 5 93 78 152 147 2 9 135 123
Elliott 60 159 1 2 33 45 26 112 1 3 53 66
Estill 399 306 4 4 142 93 253 209 4 4 235 143
Fayette 12,324 13,040 17 20 2,845 2,831 9,462 10,189 19 24 4,177 4,121
Flem ing 293 246 1 4 95 89 197 153 1 5 153 141
Floyd 1,048 1,004 14 11 456 468 578 525 15 12 724 809
Franklin 1,567 1,731 10 9 385 335 1,172 1,387 12 10 559 503
Fulton 158 237 2 1 54 75 102 161 6 3 73 113
Gallatin 226 202 1 0 76 69 149 133 1 0 124 102
Garrard 420 398 6 3 143 122 271 273 7 4 216 183
37

CO LLISIO NS BY CO UNTY
1999 VS 2000
C O L L I S I O N S P E R S O N S
NON-FATAL PROPERTY
CO UNTY TOTAL FATAL INJURY DAM AGE KILLED INJURED
1999 2000 1999 2000 1999 2000 1999 2000 1999 2000 1999 2000
Grant 902 915 8 5 224 232 670 678 8 5 368 327
Graves 988 895 11 7 256 239 721 649 14 7 398 365
Grayson 290 747 7 3 187 206 96 538 7 3 263 302
Green 245 231 1 1 66 75 178 155 1 1 102 122
Greenup 738 791 4 6 243 244 491 541 5 6 373 376
Hancock 179 137 2 2 56 37 121 98 2 2 74 61
Hardin 2,611 2,773 20 15 676 647 1,915 2,111 21 17 1,073 1,053
Harlan 709 735 8 7 244 273 457 455 8 12 382 425
Harrison 520 584 4 4 152 138 364 442 4 4 213 185
Hart 524 417 9 9 158 129 357 279 10 12 256 202
Henderson 1,865 2,028 7 5 461 500 1,397 1,523 7 5 697 774
Henry 373 439 5 2 109 134 259 303 5 2 162 177
Hickm an 119 100 2 1 44 38 73 61 2 1 61 51
Hopkins 1,611 1,565 10 8 364 389 1,237 1,168 10 9 517 577
Jackson 327 261 4 2 145 101 178 158 5 2 247 156
Jefferson 28,013 29,214 63 86 6,632 6,576 21,318 22,552 68 95 9,817 9,746
Jessam ine 1,188 1,344 4 6 298 333 886 1,005 5 8 440 497
Johnson 552 600 0 3 207 216 345 381 0 4 350 344
Kenton 6,011 5,666 11 9 1,362 1,121 4,638 4,536 12 9 1,935 1,543
Knott 373 347 5 6 151 156 217 185 6 6 250 237
Knox 787 849 8 6 303 313 476 530 8 6 508 499
Larue 335 355 3 0 100 101 232 254 3 0 139 150
Laurel 1,648 1,703 11 13 509 442 1,128 1,248 13 14 778 731
Lawrence 329 293 4 1 119 119 206 173 4 1 181 192
Lee 138 104 2 2 52 38 84 64 2 3 86 76
Leslie 308 248 3 8 164 127 141 113 3 9 255 228
Letcher 649 557 5 9 265 225 379 323 5 9 423 365
Lewis 335 269 7 12 94 74 234 183 8 15 158 145
Lincoln 389 506 3 3 169 171 217 332 3 3 267 256
Livingston 222 240 1 2 69 76 152 162 1 2 109 108
Logan 714 646 7 5 222 194 485 447 7 7 341 297
Lyon 245 239 3 3 84 63 158 173 3 4 126 87
M cCracken 2,904 2,562 13 17 840 682 2,051 1,863 13 20 1,323 1,107
M cCreary 319 330 5 8 109 115 205 207 5 10 184 185
M cLean 226 228 2 2 76 85 148 141 2 2 110 143
M adison 2,541 2,615 17 15 625 595 1,899 2,005 22 15 905 925
M agoffin 225 245 1 2 122 111 102 132 1 2 187 198
M arion 499 524 6 6 146 147 347 371 6 6 225 235
M arshall 710 795 6 4 211 236 493 555 6 5 319 359
M artin 253 285 2 1 121 128 130 156 2 1 205 210
38

CO LLISIO NS BY CO UNTY
1999 VS 2000
C O L L I S I O N S P E R S O N SNON-FATAL PROPERTY
CO UNTY TOTAL FATAL INJURY DAM AGE KILLED INJURED
1999 2000 1999 2000 1999 2000 1999 2000 1999 2000 1999 2000
M ason 824 730 7 11 193 151 624 568 9 14 282 243
M eade 544 520 9 10 195 167 340 343 10 11 316 282
M enifee 134 91 1 2 59 32 74 57 1 2 98 54
M ercer 531 599 4 1 171 154 356 444 5 2 252 232
M etcalfe 163 248 3 3 49 73 111 172 3 3 81 114
M onroe 250 195 3 2 91 46 156 147 3 2 152 67
M ontgom ery 720 826 8 4 190 214 522 608 8 6 274 343
M organ 305 309 5 2 123 127 177 180 8 4 177 198
M uhlenberg 901 956 10 7 262 286 629 663 13 7 413 459
Nelson 1,220 1,206 12 5 314 281 894 920 14 5 477 426
Nicholas 185 168 1 1 52 48 132 119 1 1 79 76
Ohio 474 608 3 8 182 222 289 378 3 8 265 357
Oldham 986 867 6 3 248 229 732 635 9 3 362 332
Owen 223 269 3 1 66 96 154 172 3 1 105 135
Owsley 129 87 1 0 29 30 99 57 1 0 41 44
Pendleton 378 381 1 6 117 101 260 274 2 6 172 160
Perry 993 1,048 6 7 389 390 598 651 7 7 639 648
Pike 2,007 2,056 19 23 854 861 1,134 1,172 23 23 1,362 1,363
Powell 370 323 3 6 124 109 243 208 3 6 194 172
Pulaski 1,737 1,677 14 13 480 460 1,243 1,204 16 15 743 719
Robertson 15 46 0 0 6 19 9 27 0 0 10 33
Rockcastle 505 443 4 4 168 131 333 308 4 4 269 215
Rowan 912 905 4 4 260 235 648 666 7 4 400 363
Russell 339 366 4 5 109 98 226 263 5 5 170 156
Scott 1,283 1,345 6 8 354 328 923 1,009 7 8 544 503
Shelby 1,060 1,229 12 8 266 274 782 947 15 9 397 451
Sim pson 564 520 7 5 176 126 381 389 7 5 256 191
Spencer 197 235 4 3 63 79 130 153 4 3 100 140
Taylor 748 688 3 5 210 155 535 528 3 8 313 222
Todd 235 225 3 2 73 67 159 156 3 3 117 108
Trigg 322 264 2 2 107 74 213 188 2 3 165 115
Trim ble 206 208 3 2 63 55 140 151 3 2 99 85
Union 457 469 4 3 136 168 317 298 4 3 211 251
W arren 3,893 4,003 13 17 1,001 1,034 2,879 2,952 14 21 1,522 1,611
W ashington 269 268 2 5 95 62 172 201 2 6 160 96
W ayne 491 492 3 5 147 130 341 357 3 9 245 214
W ebster 346 400 2 3 117 130 227 267 2 3 160 203
W hitley 959 1,013 9 7 291 293 659 713 10 8 483 492
W olfe 205 205 5 3 83 71 117 131 6 3 134 108
W oodford 639 712 6 8 161 164 472 540 10 8 230 252
TOTALS 132,216 135,079 729 711 36,125 34,732 95,362 99,636 819 810 54,951 53,129
39

COLLISIONS INVOLVING DRINKING DRIVERSBY COUNTY
1999 VS 2000
C O L L I S I O N S P E R S O N S
NON-FATAL PROPERTY
CO UNTY TOTAL FATAL * INJURY DAM AGE KILLED * INJURED
1999 2000 1999 2000 1999 2000 1999 2000 1999 2000 1999 2000
Adair 17 23 1 1 11 12 5 10 1 1 14 15
Allen 18 21 1 0 10 11 7 10 1 0 21 17
Anderson 31 19 0 0 14 6 17 13 0 0 17 6
Ballard 18 16 2 1 12 9 4 6 2 1 21 10
Barren 41 49 3 2 20 26 18 21 4 2 27 35
Bath 13 20 1 3 7 12 5 5 1 3 17 19
Bell 29 29 1 1 12 13 16 15 1 1 23 26
Boone 105 138 1 0 57 59 47 79 1 0 86 76
Bourbon 28 39 2 1 15 16 11 22 2 1 18 26
Boyd 61 71 2 0 26 33 33 38 2 0 36 50
Boyle 39 36 3 0 13 16 23 20 4 0 28 32
Bracken 13 13 1 1 8 8 4 4 1 1 13 16
Breathitt 30 39 3 1 19 30 8 8 3 1 27 52
Breckinridge 17 19 2 0 11 8 4 11 2 0 17 10
Bullitt 57 79 6 3 29 37 22 39 6 3 53 56
Butler 13 14 0 1 9 8 4 5 0 1 14 13
Caldwell 13 20 1 1 7 10 5 9 1 2 11 18
Calloway 41 50 0 2 24 19 17 29 0 2 31 31
Cam pbell 104 122 5 0 35 44 64 78 5 0 46 70
Carlisle 4 2 1 0 3 2 0 0 1 0 3 2
Carroll 32 33 0 1 13 16 19 16 0 1 17 32
Carter 40 40 3 3 16 26 21 11 4 5 31 43
Casey 19 15 3 0 12 7 4 8 3 0 19 8
Christian 85 85 1 3 37 40 47 42 1 3 58 67
Clark 59 44 1 1 24 19 34 24 1 1 32 29
Clay 28 22 4 1 15 18 9 3 5 1 35 31
Clinton 10 5 1 1 5 3 4 1 1 1 13 6
Crittenden 14 7 0 0 10 5 4 2 0 0 17 5
Cum berland 4 3 3 0 1 1 0 2 4 0 4 1
Daviess 122 138 3 3 55 47 64 88 3 3 73 78
Edm onson 16 18 1 0 11 14 4 4 1 0 16 23
Elliott 5 16 0 0 3 10 2 6 0 1 5 17
Estill 20 22 1 1 13 11 6 10 1 1 25 21
Fayette 459 600 3 9 162 221 294 370 3 11 238 342
Flem ing 15 11 0 1 11 7 4 3 0 1 14 9
Floyd 75 71 5 1 48 48 22 22 6 1 73 71
Franklin 67 70 2 1 31 36 34 33 2 1 44 48
Fulton 9 14 2 1 3 5 4 8 6 3 3 9
Gallatin 8 16 1 0 4 7 3 9 1 0 6 11
Garrard 18 18 0 1 9 10 9 7 0 2 16 13
* Fatal collision data has been adjusted to reflect follow -up studies of drivers w ith blood alcohol content (BAC) of .01 or higher (from FARS).
This also affects the total of all collisions.
40

COLLISIONS INVOLVING DRINKING DRIVERSBY COUNTY
1999 VS 2000
C O L L I S I O N S P E R S O N S
NON-FATAL PROPERTY
CO UNTY TOTAL FATAL * INJURY DAM AGE KILLED * INJURED
1999 2000 1999 2000 1999 2000 1999 2000 1999 2000 1999 2000
Grant 30 32 1 1 13 20 16 11 1 0 19 35
Graves 35 46 2 1 21 34 12 11 2 1 28 49
Grayson 23 36 1 2 18 22 4 12 1 2 25 35
Green 6 15 1 0 3 11 2 4 1 0 9 22
Greenup 38 45 1 2 21 20 16 23 2 2 27 28
Hancock 11 5 0 0 7 1 4 4 0 0 10 1
Hardin 94 102 3 2 41 44 50 56 3 2 57 60
Harlan 39 35 4 1 17 23 18 11 4 1 26 30
Harrison 27 32 0 1 11 16 16 15 0 1 21 19
Hart 23 18 2 2 8 11 13 5 2 2 17 13
Henderson 81 59 3 1 29 34 49 24 3 1 46 52
Henry 24 24 2 0 13 12 9 12 2 0 17 13
Hickm an 6 6 1 1 3 3 2 2 1 1 3 4
Hopkins 51 43 3 2 18 25 30 16 3 2 28 39
Jackson 17 20 1 1 8 13 8 6 1 1 12 21
Jefferson 894 1112 16 26 393 476 485 610 19 28 632 696
Jessam ine 57 81 2 2 24 38 31 41 2 3 35 71
Johnson 26 32 0 1 18 20 8 11 0 1 25 25
Kenton 237 267 2 4 94 108 141 155 3 4 138 153
Knott 21 17 2 1 14 10 5 6 2 1 19 17
Knox 44 40 0 0 26 23 18 17 0 0 39 34
Larue 11 16 1 0 5 7 5 9 1 0 5 7
Laurel 48 63 3 3 21 36 24 24 4 4 36 67
Lawrence 11 21 0 0 5 15 6 6 0 0 6 21
Lee 11 12 1 0 7 9 3 3 1 0 10 22
Leslie 18 20 0 1 12 14 6 5 0 1 15 23
Letcher 34 40 3 3 19 26 12 11 3 3 28 47
Lewis 25 24 2 3 14 13 9 8 2 3 28 27
Lincoln 22 25 0 2 13 11 9 12 0 2 16 18
Livingston 11 10 0 0 8 3 3 7 0 0 9 3
Logan 28 30 1 1 9 15 18 14 1 1 10 22
Lyon 9 8 1 1 5 2 3 5 1 1 7 4
M cCracken 95 125 5 5 50 62 40 58 5 5 76 95
M cCreary 29 19 2 4 16 10 11 5 2 4 27 26
M cLean 11 10 0 0 7 3 4 7 0 0 8 4
M adison 136 147 2 6 60 60 74 81 2 6 96 95
M agoffin 29 18 1 0 23 14 5 4 1 0 36 21
M arion 54 66 3 2 26 37 25 27 3 2 42 55
M arshall 27 29 0 0 13 17 14 12 0 0 17 28
M artin 13 21 0 0 10 14 3 7 0 0 12 25
* Fatal collision data has been adjusted to reflect follow -up studies of drivers w ith blood alcohol content (BAC) of .01 or higher (from FARS).
This also affects the total of all collisions.
41

COLLISIONS INVOLVING DRINKING DRIVERSBY COUNTY
1999 VS 2000
C O L L I S I O N S P E R S O N S
NON-FATAL PROPERTY
CO UNTY TOTAL FATAL * INJURY DAM AGE KILLED * INJURED
1999 2000 1999 2000 1999 2000 1999 2000 1999 2000 1999 2000
M ason 35 50 3 4 16 23 16 23 5 4 24 35
M eade 29 38 1 4 15 15 13 19 1 5 21 32
M enifee 16 10 0 0 10 5 6 5 0 0 18 7
M ercer 22 27 2 0 12 11 8 16 2 0 20 15
M etcalfe 13 12 2 1 6 4 5 7 2 1 12 7
M onroe 16 9 1 0 12 4 3 5 1 0 26 4
M ontgom ery 38 44 3 1 18 22 17 21 3 1 27 36
M organ 15 15 2 1 7 8 6 6 2 1 10 12
M uhlenberg 49 36 1 1 23 21 25 14 1 1 34 24
Nelson 66 60 3 0 35 32 28 28 4 0 55 49
Nicholas 19 16 1 0 11 8 7 8 1 0 16 11
Ohio 28 23 1 2 19 11 8 10 1 2 33 19
Oldham 24 24 0 1 13 16 11 7 0 1 17 22
Owen 13 24 1 0 8 13 4 11 1 0 10 15
Owsley 8 7 0 0 6 5 2 2 0 0 12 6
Pendleton 25 27 0 3 15 10 10 14 0 3 18 12
Perry 48 46 3 3 28 31 17 12 4 3 38 50
Pike 90 103 4 5 44 66 42 32 4 5 60 99
Powell 16 16 2 0 8 9 6 7 2 0 22 13
Pulaski 62 56 2 1 35 29 25 26 2 1 59 48
Robertson 1 7 0 0 0 5 1 2 0 0 0 9
Rockcastle 23 13 2 1 14 6 7 6 2 1 22 11
Rowan 29 48 1 1 17 26 11 21 1 1 21 38
Russell 16 20 0 1 6 11 10 8 0 1 8 17
Scott 50 43 1 1 20 14 29 28 2 1 29 17
Shelby 51 70 3 4 23 28 25 38 3 4 32 47
Sim pson 24 21 0 1 14 8 10 12 0 1 20 11
Spencer 15 21 2 1 7 13 6 7 2 1 17 17
Taylor 41 28 0 1 21 15 20 12 0 1 30 25
Todd 6 7 0 0 3 4 3 3 0 0 3 5
Trigg 9 9 0 1 8 1 1 7 0 2 15 1
Trim ble 7 11 1 1 5 6 1 4 1 1 11 10
Union 25 29 0 2 12 15 13 12 0 2 16 20
W arren 150 166 1 3 68 76 81 87 1 3 108 115
W ashington 27 21 1 2 16 8 10 11 1 2 26 12
W ayne 20 18 0 1 13 10 7 7 0 2 22 22
W ebster 15 22 1 1 6 11 8 10 1 1 11 20
W hitley 42 37 5 1 22 17 15 19 6 1 43 29
W olfe 19 11 2 0 13 5 4 6 3 0 19 5
W oodford 36 44 2 3 15 19 19 22 5 3 17 29
TOTALS 5,441 6,127 196 181 2,592 2,903 2,653 3,043 222 196 3,981 4,447
* Fatal collision data has been adjusted to reflect follow -up studies of drivers w ith blood alcohol content (BAC) of .01 or higher (from FARS). This also affects the total of all collisions.
42
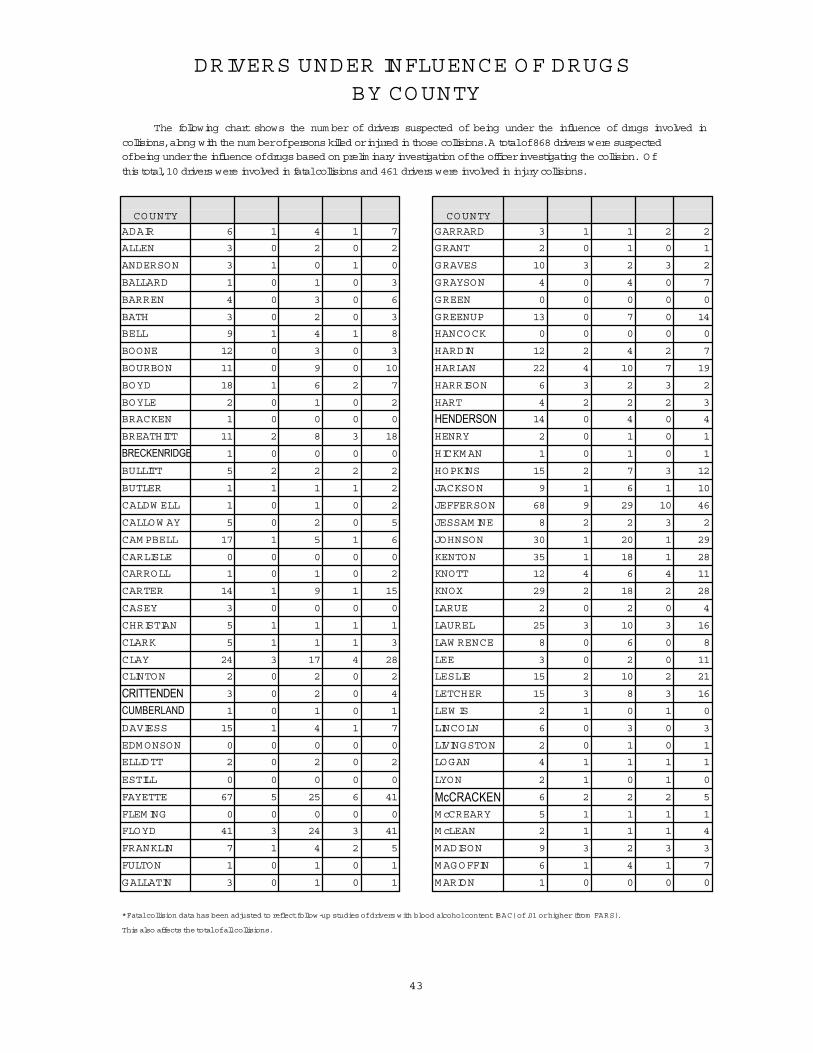
DRIVERS UNDER INFLUENCE OF DRUGS BY COUNTY
The following chart shows the num ber of drivers suspected of being under the influence of drugs involved in
collisions, along with the num ber of persons killed or injured in those collisions. A total of 868 drivers were suspectedof being under the influence of drugs based on prelim inary investigation of the officer investigating the collision. Of
this total, 10 drivers were involved in fatal collisions and 461 drivers were involved in injury collisions.
ALL FATAL* INJURY PERSONS* PERSONS ALL FATAL* INJURY PERSONS* PERSONS
COUNTY COLLISIONSCOLLISIONSCOLLISIONS KILLED INJURED COUNTY COLLISIONS OLLISIONS OLLISIONS KILLED INJURED
ADAIR 6 1 4 1 7 GARRARD 3 1 1 2 2
ALLEN 3 0 2 0 2 GRANT 2 0 1 0 1
ANDERSON 3 1 0 1 0 GRAVES 10 3 2 3 2
BALLARD 1 0 1 0 3 GRAYSON 4 0 4 0 7
BARREN 4 0 3 0 6 GREEN 0 0 0 0 0
BATH 3 0 2 0 3 GREENUP 13 0 7 0 14
BELL 9 1 4 1 8 HANCOCK 0 0 0 0 0
BOONE 12 0 3 0 3 HARDIN 12 2 4 2 7
BOURBON 11 0 9 0 10 HARLAN 22 4 10 7 19
BOYD 18 1 6 2 7 HARRISON 6 3 2 3 2
BOYLE 2 0 1 0 2 HART 4 2 2 2 3
BRACKEN 1 0 0 0 0 HENDERSON 14 0 4 0 4
BREATHITT 11 2 8 3 18 HENRY 2 0 1 0 1
BRECKENRIDGE 1 0 0 0 0 HICKM AN 1 0 1 0 1
BULLITT 5 2 2 2 2 HOPKINS 15 2 7 3 12
BUTLER 1 1 1 1 2 JACKSON 9 1 6 1 10
CALDW ELL 1 0 1 0 2 JEFFERSON 68 9 29 10 46
CALLOW AY 5 0 2 0 5 JESSAM INE 8 2 2 3 2
CAM PBELL 17 1 5 1 6 JOHNSON 30 1 20 1 29
CARLISLE 0 0 0 0 0 KENTON 35 1 18 1 28
CARROLL 1 0 1 0 2 KNOTT 12 4 6 4 11
CARTER 14 1 9 1 15 KNOX 29 2 18 2 28
CASEY 3 0 0 0 0 LARUE 2 0 2 0 4
CHRISTIAN 5 1 1 1 1 LAUREL 25 3 10 3 16
CLARK 5 1 1 1 3 LAW RENCE 8 0 6 0 8
CLAY 24 3 17 4 28 LEE 3 0 2 0 11
CLINTON 2 0 2 0 2 LESLIE 15 2 10 2 21
CRITTENDEN 3 0 2 0 4 LETCHER 15 3 8 3 16
CUMBERLAND 1 0 1 0 1 LEW IS 2 1 0 1 0
DAVIESS 15 1 4 1 7 LINCOLN 6 0 3 0 3
EDM ONSON 0 0 0 0 0 LIVINGSTON 2 0 1 0 1
ELLIOTT 2 0 2 0 2 LOGAN 4 1 1 1 1
ESTILL 0 0 0 0 0 LYON 2 1 0 1 0
FAYETTE 67 5 25 6 41 McCRACKEN 6 2 2 2 5
FLEM ING 0 0 0 0 0 M cCREARY 5 1 1 1 1
FLOYD 41 3 24 3 41 M cLEAN 2 1 1 1 4
FRANKLIN 7 1 4 2 5 M ADISON 9 3 2 3 3
FULTON 1 0 1 0 1 M AGOFFIN 6 1 4 1 7
GALLATIN 3 0 1 0 1 M ARION 1 0 0 0 0
* Fatal collision data has been adjusted to reflect follow-up studies of drivers with blood alcohol content (BAC) of .01 or higher (from FARS).
This also affects the total of all collisions.
43

DRIVERS UNDER INFLUENCE OF DRUGS BY COUNTY
FATAL* INJURY PERSONS* PERSONS ALL FATAL* INJURY PERSONS* PERSONS
COUNTY COLLISIONSCOLLISIONSCOLLISIONS KILLED INJURED COUNTY COLLISIONS OLLISIONS OLLISIONS KILLED INJURED
M ARSHALL 10 2 5 3 8 ROBERTSON 0 0 0 0 0
M ARTIN 18 0 6 0 9 ROCKCASTLE 7 2 3 2 4
M ASON 3 1 1 1 1 ROW AN 4 2 1 2 1
M EADE 4 1 0 1 0 RUSSELL 8 1 5 1 6
M ENIFEE 0 0 0 0 0 SCOTT 4 1 2 1 2
M ERCER 1 0 1 0 2 SHELBY 6 1 2 1 3
M ETCALFE 0 0 0 0 0 SIM PSON 2 1 0 1 0
MONROE 3 1 1 1 1 SPENCER 1 1 0 1 0
MONTGOMERY 5 2 2 2 4 TAYLOR 4 1 0 2 0
MORGAN 1 1 0 1 0 TODD 1 0 0 0 0
MUHLENBERG 6 2 3 2 7 TRIGG 1 0 0 0 0
NELSON 3 1 0 1 0 TRIM BLE 0 0 0 0 0
NICHOLAS 5 0 3 0 6 UNION 3 1 2 1 3
OHIO 6 1 3 1 6 W ARREN 24 5 11 5 17
OLDHAM 2 0 1 0 5 WASHINGTON 0 0 0 0 0
OW EN 2 1 1 1 1 W AYNE 4 0 0 0 0
OW SLEY 1 0 1 0 1 W EBSTER 2 1 1 1 1
PENDLETON 6 1 2 1 2 W HITLEY 18 3 8 3 11
PERRY 23 2 11 2 18 W OLFE 2 0 0 0 0
PIKE 57 10 30 10 48 WOODFORD 1 0 1 0 2
POW ELL 3 3 0 3 0
PULASKI 19 2 7 2 10 TOTALS 990 133 461 147 749
* Fatal collision data has been adjusted to reflect follow-up studies of drivers under the influence of drugs (from FARS).This also affects the total of all collisions.
ALL COLLISIONS BY AREA DEVELOPM ENT DISTRICT
AREA TO TAL TO TAL CO LLISIO NS REPO RTED NUM BER PERSONSDEVELO PM ENT NUM BER
DISTRICT REPO RTED FATAL INJURY KILLED INJUREDPurchase 5,938 40 1,634 47 2,558
Pennyrile 5,977 41 1,650 48 2,538
Green River 7,446 33 1,963 34 3,047
Barren River 8,142 56 2,258 69 3,490
Lincoln Trail 6,693 47 1,726 51 2,742
KIPDA 33,516 109 7,690 119 11,443
Northern Kentucky 14,311 35 3,044 36 4,302
Buffalo Trace 1,562 29 407 36 677
Gateway 2,455 16 699 20 1,077
FIVCO 3,817 22 1,100 26 1,693
Big Sandy 4,190 40 1,784 42 2,924
Kentucky River 3,038 43 1,251 47 2,080
Cum berland Valley 6,204 51 2,000 60 3,272
Lake Cum berland 4,866 46 1,303 57 2,045
Bluegrass 26,924 103 6,223 118 9,241
TOTALS 135,079 711 34,732 810 53,129
44

ALCOHOL RELATED COLLISIONS BY AREA DEVELOPM ENT DISTRICT
AREA TOTAL TOTAL COLLISIONS REPORTED NUM BER PERSONSDEVELOPM ENT NUM BER
DISTRICT REPORTED FATAL* INJURY KILLED* INJUREDPurchase 288 11 151 13 228Pennyrile 225 9 111 11 166G reen River 286 9 122 9 194Barren River 358 11 177 11 260Lincoln Trail 358 12 173 13 260KIPDA 1,341 36 588 38 861Northern Kentucky 659 9 277 8 404Buffalo Trace 105 9 56 9 96Gateway 137 6 73 6 112FIVCO 193 5 104 8 159Big Sandy 245 7 162 7 241Kentucky River 192 9 130 9 222Cum berland Valley 259 9 149 10 249Lake Cum berland 202 10 109 11 190Bluegrass 1,279 29 521 33 805TOTALS 6,127 181 2,903 196 4,447
* Fatal collision data has been adjusted to reflect follow-up studies of drivers (FARS).
This also affects the total of all collisions.
DRUG RELATED COLLISIONS BY AREA DEVELOPM ENT DISTRICT
AREA TOTAL TOTAL COLLISIONS REPORTED NUM BER PERSONSDEVELOPM ENT NUM BER
DISTRICT REPORTED FATAL* INJURY KILLED* INJUREDPurchase 34 7 14 8 25Pennyrile 36 6 15 7 27G reen River 42 5 15 5 25Barren River 45 11 21 11 32Lincoln Trail 27 4 10 4 18KIPDA 84 13 35 14 57Northern Kentucky 78 4 32 4 44Buffalo Trace 6 2 1 2 1Gateway 13 5 5 5 8FIVCO 55 2 30 3 46Big Sandy 152 15 84 15 134Kentucky River 82 13 46 14 96Cum berland Valley 143 19 76 23 124Lake Cum berland 52 6 20 7 27Bluegrass 141 21 57 25 85TOTALS 990 133 461 147 749
* Fatal collision data has been adjusted to reflect follow-up studies of drivers (FARS).
This also affects the total of all collisions.
AREADEVELOPM ENT COUNTIES IN DISTRICT
DISTRICT
Purchase Ballard, Calloway, Carlisle, Fulton, Graves, Hickm an, M cCracken, M arshall
Pennyrile Caldwell, Christian, Crittenden, Hopkins, Livingston, Lyon, M uhlenberg, Todd, Trigg
G reen River Daviess, Hancock, Henderson, M cLean, O hio, Union, W ebster
Barren River Allen, Barren, Butler, Edm onson, Hart, Logan, M etcalfe, M onroe, Sim pson, W arren
Lincoln Trail Breckinridge, G rayson, Hardin, Larue, M arion, M eade, Nelson, W ashington
KIPDA Bullitt, Henry, Jefferson, O ldham , Shelby, Spencer, Trim ble
Northern Kentucky Boone, Cam pbell, Carroll, G allatin, G rant, Kenton, O wen, Pendleton
Buffalo Trace Bracken, Flem ing, Lewis, M ason, Robertson
Gateway Bath, M enifee, M ontgom ery, M organ, Rowan
FIVCO Boyd, Carter, Elliott, G reenup, Lawrence
Big Sandy Floyd, Johnson, M agoffin, M artin, Pike
Kentucky River Breathitt, Knott, Lee, Leslie, Letcher, O wsley, Perry, W olfe
Cum berland Valley Bell, Clay, Harlan, Jackson, Knox, Laurel, Rockcastle, W hitley
Lake Cum berland Adair, Casey, Clinton, Cum berland, G reen, M cCreary, Pulaski, Russell, Taylor, W ayne
Bluegrass Anderson, Bourbon, Boyle, Clark, Estill, Fayette, Franklin, G arrard, Harrison, Jessam ine,
Lincoln, M adison, M ercer, Nicholas, Powell, Scott, W oodford
45
CO
MM
ON
WEALTH OF KEN
TUC
KY
UNITED WE STAND
DIVIDED WE FALL
���������� ��������
�������

CO LLISIO NS BY CO UNTYPARKING LOTS / PRIVATE PROPERTY*
2000
C O L L I S I O N S P E R S O N S
CO UNTY NON-FATAL PROPERTY
TOTAL FATAL INJURY DAM AGE KILLED INJURED
Adair 121 0 4 117 0 4
Allen 63 0 4 59 0 5
Anderson 111 0 5 106 0 9
Ballard 32 0 3 29 0 3
Barren 67 0 5 62 0 5
Bath 46 0 1 45 0 1
Bell 188 0 10 178 0 13
Boone 801 0 42 759 0 50
Bourbon 113 0 7 106 0 7
Boyd 471 0 19 452 0 26
Boyle 197 0 6 191 0 9
Bracken 19 0 0 19 0 0
Breathitt 97 0 7 90 0 9
Breckinridge 59 0 2 57 0 2
Bullitt 179 0 13 166 0 14
Butler 32 0 2 30 0 2
Caldwell 32 0 1 31 0 1
Calloway 171 0 4 167 0 4
Cam pbell 588 0 16 572 0 18
Carlisle 4 0 1 3 0 1
Carroll 74 0 2 72 0 3
Carter 130 0 3 127 0 3
Casey 69 0 2 67 0 6
Christian 160 0 13 147 0 14
Clark 298 0 10 288 0 10
Clay 107 0 9 98 0 13
Clinton 49 0 0 49 0 0
Crittenden 49 0 4 45 0 7
Cum berland 5 0 0 5 0 0
Daviess 883 0 44 839 0 55
Edm onson 36 0 0 36 0 0
Elliott 15 0 2 13 0 2
Estill 56 0 2 54 0 3
Fayette 2,968 1 109 2,858 1 121
Flem ing 55 0 1 54 0 1
Floyd 141 1 22 118 1 29
Franklin 489 0 13 476 0 16
Fulton 66 0 2 64 0 2
Gallatin 29 0 1 28 0 1
Garrard 61 0 4 57 0 4
*Only 2000 data available
49
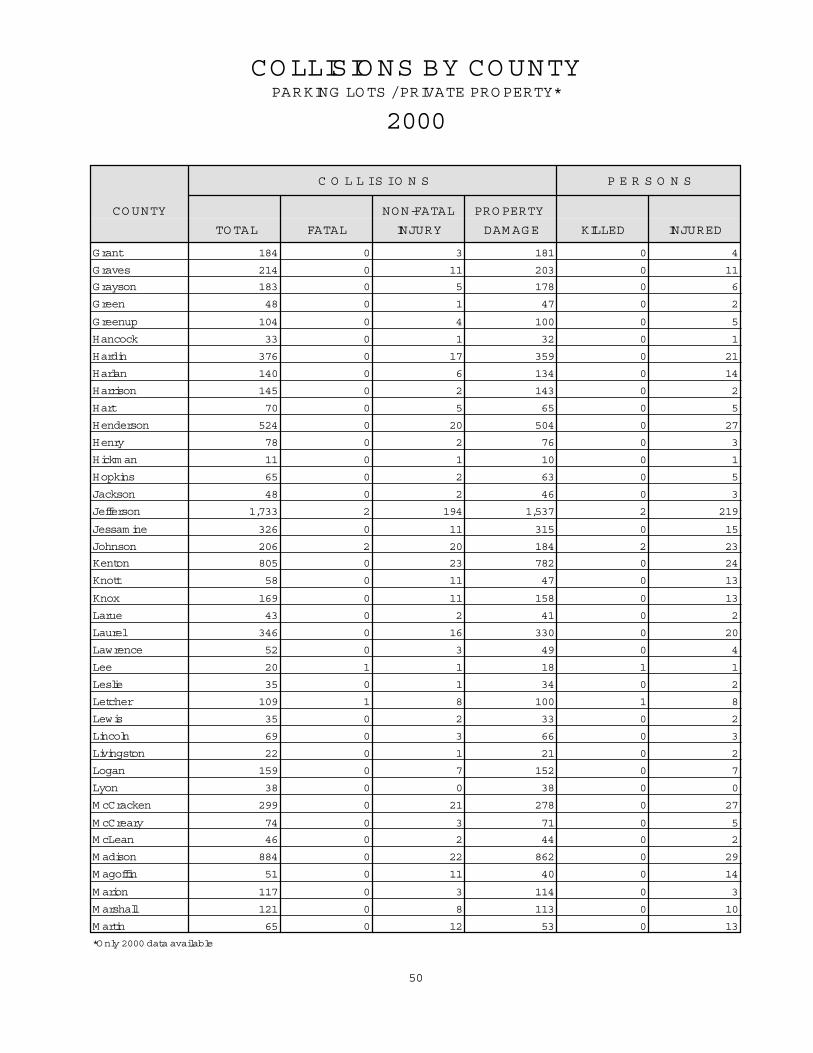
CO LLISIO NS BY CO UNTYPARKING LOTS / PRIVATE PROPERTY*
2000
C O L L I S I O N S P E R S O N S
CO UNTY NON-FATAL PROPERTY
TOTAL FATAL INJURY DAM AGE KILLED INJURED
Grant 184 0 3 181 0 4
Graves 214 0 11 203 0 11
Grayson 183 0 5 178 0 6
Green 48 0 1 47 0 2
Greenup 104 0 4 100 0 5
Hancock 33 0 1 32 0 1
Hardin 376 0 17 359 0 21
Harlan 140 0 6 134 0 14
Harrison 145 0 2 143 0 2
Hart 70 0 5 65 0 5
Henderson 524 0 20 504 0 27
Henry 78 0 2 76 0 3
Hickm an 11 0 1 10 0 1
Hopkins 65 0 2 63 0 5
Jackson 48 0 2 46 0 3
Jefferson 1,733 2 194 1,537 2 219
Jessam ine 326 0 11 315 0 15
Johnson 206 2 20 184 2 23
Kenton 805 0 23 782 0 24
Knott 58 0 11 47 0 13
Knox 169 0 11 158 0 13
Larue 43 0 2 41 0 2
Laurel 346 0 16 330 0 20
Lawrence 52 0 3 49 0 4
Lee 20 1 1 18 1 1
Leslie 35 0 1 34 0 2
Letcher 109 1 8 100 1 8
Lewis 35 0 2 33 0 2
Lincoln 69 0 3 66 0 3
Livingston 22 0 1 21 0 2
Logan 159 0 7 152 0 7
Lyon 38 0 0 38 0 0
M cCracken 299 0 21 278 0 27
M cCreary 74 0 3 71 0 5
M cLean 46 0 2 44 0 2
M adison 884 0 22 862 0 29
M agoffin 51 0 11 40 0 14
M arion 117 0 3 114 0 3
M arshall 121 0 8 113 0 10
M artin 65 0 12 53 0 13
*Only 2000 data available
50

CO LLISIO NS BY CO UNTYPARKING LOTS / PRIVATE PROPERTY*
2000
C O L L I S I O N S P E R S O N S
CO UNTY NON-FATAL PROPERTY
TOTAL FATAL INJURY DAM AGE KILLED INJURED
M ason 208 0 4 204 0 4
M eade 58 0 4 54 0 4
M enifee 14 0 0 14 0 0
M ercer 104 1 4 99 1 5
M etcalfe 29 0 0 29 0 0
M onroe 40 0 2 38 0 3
M ontgom ery 231 0 7 224 0 11
M organ 70 0 6 64 0 6
M uhlenberg 192 0 5 187 0 5
Nelson 108 1 8 99 1 15
Nicholas 31 0 3 28 0 3
Ohio 123 0 3 120 0 3
Oldham 71 0 5 66 0 6
Owen 30 0 3 27 0 3
Owsley 12 0 1 11 0 1
Pendleton 58 0 3 55 0 4
Perry 260 0 17 243 0 22
Pike 397 0 36 361 0 44
Powell 26 0 2 24 0 2
Pulaski 460 0 10 450 0 12
Robertson 3 0 0 3 0 0
Rockcastle 37 0 2 35 0 3
Rowan 231 0 7 224 0 9
Russell 58 0 4 54 0 5
Scott 143 0 8 135 0 8
Shelby 228 0 10 218 0 12
Sim pson 195 0 6 189 0 8
Spencer 36 0 1 35 0 1
Taylor 201 0 3 198 0 3
Todd 39 0 1 38 0 2
Trigg 50 0 3 47 0 3
Trim ble 17 2 0 15 2 0
Union 79 0 6 73 0 7
W arren 569 0 44 525 0 61
W ashington 29 0 0 29 0 0
W ayne 129 0 7 122 0 9
W ebster 49 1 2 46 1 2
W hitley 227 0 9 218 0 11
W olfe 39 0 5 34 0 6
W oodford 145 0 5 140 0 6
TOTALS 22,262 13 1,119 21,130 13 1,353
*Only 2000 data available
51
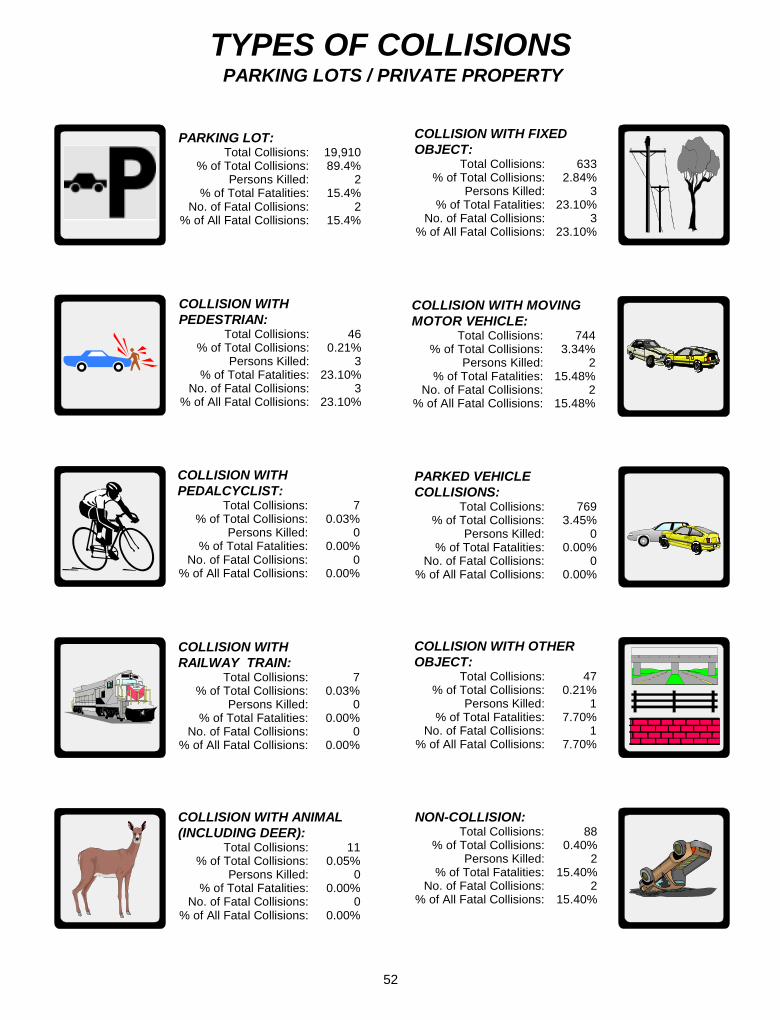
TYPES OF COLLISIONS
52
PARKING LOTS / PRIVATE PROPERTY
COLLISION WITH ANIMAL(INCLUDING DEER):
Total Collisions: 11% of Total Collisions: 0.05%
Persons Killed: 0% of Total Fatalities: 0.00%
No. of Fatal Collisions: 0% of All Fatal Collisions: 0.00%
NON-COLLISION:Total Collisions: 88
% of Total Collisions: 0.40%Persons Killed: 2
% of Total Fatalities: 15.40%No. of Fatal Collisions: 2
% of All Fatal Collisions: 15.40%
COLLISION WITHRAILWAY TRAIN:
Total Collisions: 7% of Total Collisions: 0.03%
Persons Killed: 0% of Total Fatalities: 0.00%
No. of Fatal Collisions: 0% of All Fatal Collisions: 0.00%
COLLISION WITH OTHEROBJECT:
Total Collisions: 47% of Total Collisions: 0.21%
Persons Killed: 1% of Total Fatalities: 7.70%
No. of Fatal Collisions: 1% of All Fatal Collisions: 7.70%
COLLISION WITHPEDALCYCLIST:
Total Collisions: 7% of Total Collisions: 0.03%
Persons Killed: 0% of Total Fatalities: 0.00%
No. of Fatal Collisions: 0% of All Fatal Collisions: 0.00%
PARKED VEHICLECOLLISIONS:
Total Collisions: 769% of Total Collisions: 3.45%
Persons Killed: 0% of Total Fatalities: 0.00%
No. of Fatal Collisions: 0% of All Fatal Collisions: 0.00%
COLLISION WITH MOVINGMOTOR VEHICLE:
Total Collisions: 744% of Total Collisions: 3.34%
Persons Killed: 2% of Total Fatalities: 15.48%
No. of Fatal Collisions: 2% of All Fatal Collisions: 15.48%
COLLISION WITHPEDESTRIAN:
Total Collisions: 46% of Total Collisions: 0.21%
Persons Killed: 3% of Total Fatalities: 23.10%
No. of Fatal Collisions: 3% of All Fatal Collisions: 23.10%
COLLISION WITH FIXEDOBJECT:
Total Collisions: 633% of Total Collisions: 2.84%
Persons Killed: 3% of Total Fatalities: 23.10%
No. of Fatal Collisions: 3% of All Fatal Collisions: 23.10%
PARKING LOT:Total Collisions: 19,910
% of Total Collisions: 89.4%Persons Killed: 2
% of Total Fatalities: 15.4%No. of Fatal Collisions: 2
% of All Fatal Collisions: 15.4%

0%
13%12%
19%18%
14%
9%
6%
5%
0%
6%
9%
19%
22%
19%
12%
8%
5%
under16
16to19
20to24
25to34
35to44
45to54
55to64
65to74
75andover
AGE
0%
5%
10%
15%
20%
25%DRIVERS INVOLVED INALL COLLISIONS
LICENSED DRIVERS
AGE OF DRIVER(ALL COLLISIONS)
The chart below groups the ages of 27,601 drivers involved in traffic collisions during 2000 in Kentucky (for which age information was available). For each age category, the following information is shown: the percentage of drivers involved in all collisions, the number of drivers involved in these collisions is shown in parentheses, the percentage of all licensed drivers, and the number of licensed drivers is shown in parentheses (includes learner permits). This allows a comparison to be made between the percentage of a given age category is of the driving population and the corresponding percentage this age category is involved in collisions. The percentage of drivers involved in all collisions was higher than the percentage of licensed drivers for the age categories under age 35, especially for the 16 to 19 years of age category. This data does not differentiate drivers "at-fault" versus drivers "not-at-fault." There were 722 driver's ages which could not be determined. These drivers represent 2.6% of all drivers involved in collisions. The percentages given below do not consider the "Unknown" category.
(3,582)(3,433)
(5,199)(5,035)
(3,926)
(2,562)
(1,783)
(1,251)
(108)(0)
(173,727)
(247,566)
(516,191)
(592,045)
(520,710)
(336,545)
(226,913)
(140,652)
53
NOTE: PERCENTAGE OF LICENSED DRIVERS IN EACH AGE CATEGORY ARE BASED ON 2,754,348 DRIVERS LICENSED IN KENTUCKY AS OF 12/31/2000(Includes learner permits.)
PARKING LOTS / PRIVATE PROPERTY
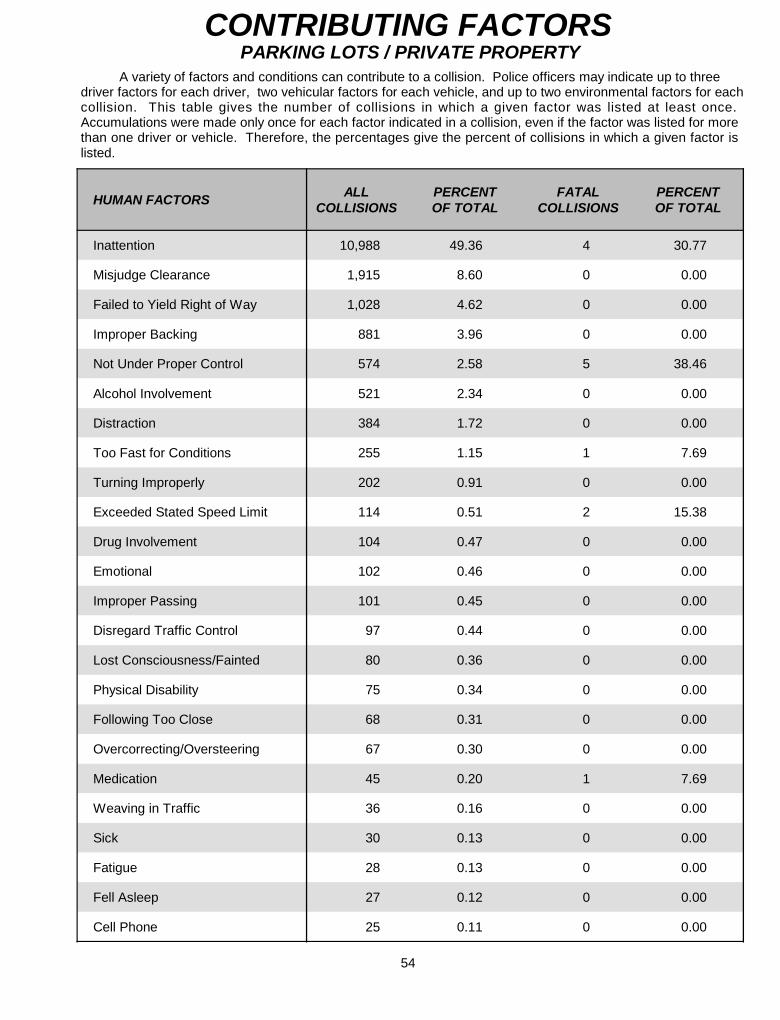
HUMAN FACTORS ALL COLLISIONS
PERCENTOF TOTAL
FATALCOLLISIONS
PERCENTOF TOTAL
Inattention 10,988 49.36 4 30.77
Misjudge Clearance 1,915 8.60 0 0.00
Failed to Yield Right of Way 1,028 4.62 0 0.00
Improper Backing 881 3.96 0 0.00
Not Under Proper Control 574 2.58 5 38.46
Alcohol Involvement 521 2.34 0 0.00
Distraction 384 1.72 0 0.00
Too Fast for Conditions 255 1.15 1 7.69
Turning Improperly 202 0.91 0 0.00
Exceeded Stated Speed Limit 114 0.51 2 15.38
Drug Involvement 104 0.47 0 0.00
Emotional 102 0.46 0 0.00
Improper Passing 101 0.45 0 0.00
Disregard Traffic Control 97 0.44 0 0.00
Lost Consciousness/Fainted 80 0.36 0 0.00
Physical Disability 75 0.34 0 0.00
Following Too Close 68 0.31 0 0.00
Overcorrecting/Oversteering 67 0.30 0 0.00
Medication 45 0.20 1 7.69
Weaving in Traffic 36 0.16 0 0.00
Sick 30 0.13 0 0.00
Fatigue 28 0.13 0 0.00
Fell Asleep 27 0.12 0 0.00
Cell Phone 25 0.11 0 0.00
CONTRIBUTING FACTORSA variety of factors and conditions can contribute to a collision. Police officers may indicate up to three
driver factors for each driver, two vehicular factors for each vehicle, and up to two environmental factors for each collision. This table gives the number of collisions in which a given factor was listed at least once. Accumulations were made only once for each factor indicated in a collision, even if the factor was listed for more than one driver or vehicle. Therefore, the percentages give the percent of collisions in which a given factor is listed.
54
PARKING LOTS / PRIVATE PROPERTY
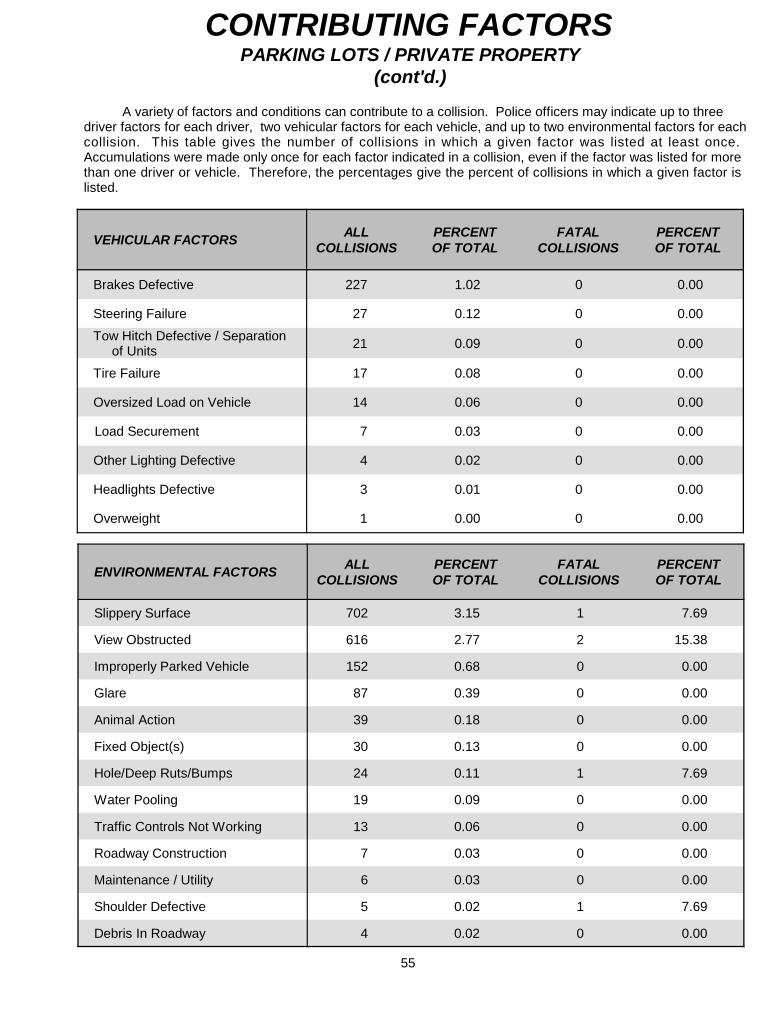
VEHICULAR FACTORS ALL COLLISIONS
PERCENTOF TOTAL
FATALCOLLISIONS
PERCENTOF TOTAL
Brakes Defective 227 1.02 0 0.00
Steering Failure 27 0.12 0 0.00
Tow Hitch Defective / Separation of Units 21 0.09 0 0.00
Tire Failure 17 0.08 0 0.00
Oversized Load on Vehicle 14 0.06 0 0.00
Load Securement 7 0.03 0 0.00
Other Lighting Defective 4 0.02 0 0.00
Headlights Defective 3 0.01 0 0.00
Overweight 1 0.00 0 0.00
CONTRIBUTING FACTORS
A variety of factors and conditions can contribute to a collision. Police officers may indicate up to three driver factors for each driver, two vehicular factors for each vehicle, and up to two environmental factors for each collision. This table gives the number of collisions in which a given factor was listed at least once. Accumulations were made only once for each factor indicated in a collision, even if the factor was listed for more than one driver or vehicle. Therefore, the percentages give the percent of collisions in which a given factor is listed.
55
ENVIRONMENTAL FACTORS ALL COLLISIONS
PERCENTOF TOTAL
FATALCOLLISIONS
PERCENTOF TOTAL
Slippery Surface 702 3.15 1 7.69
View Obstructed 616 2.77 2 15.38
Improperly Parked Vehicle 152 0.68 0 0.00
Glare 87 0.39 0 0.00
Animal Action 39 0.18 0 0.00
Fixed Object(s) 30 0.13 0 0.00
Hole/Deep Ruts/Bumps 24 0.11 1 7.69
Water Pooling 19 0.09 0 0.00
Traffic Controls Not Working 13 0.06 0 0.00
Roadway Construction 7 0.03 0 0.00
Maintenance / Utility 6 0.03 0 0.00
Shoulder Defective 5 0.02 1 7.69
Debris In Roadway 4 0.02 0 0.00
PARKING LOTS / PRIVATE PROPERTY(cont'd.)

CO
MM
ON
WEALTH OF KENTU
CK
Y
UNITED WE STAND
DIVIDED WE FALL
������������
�������������
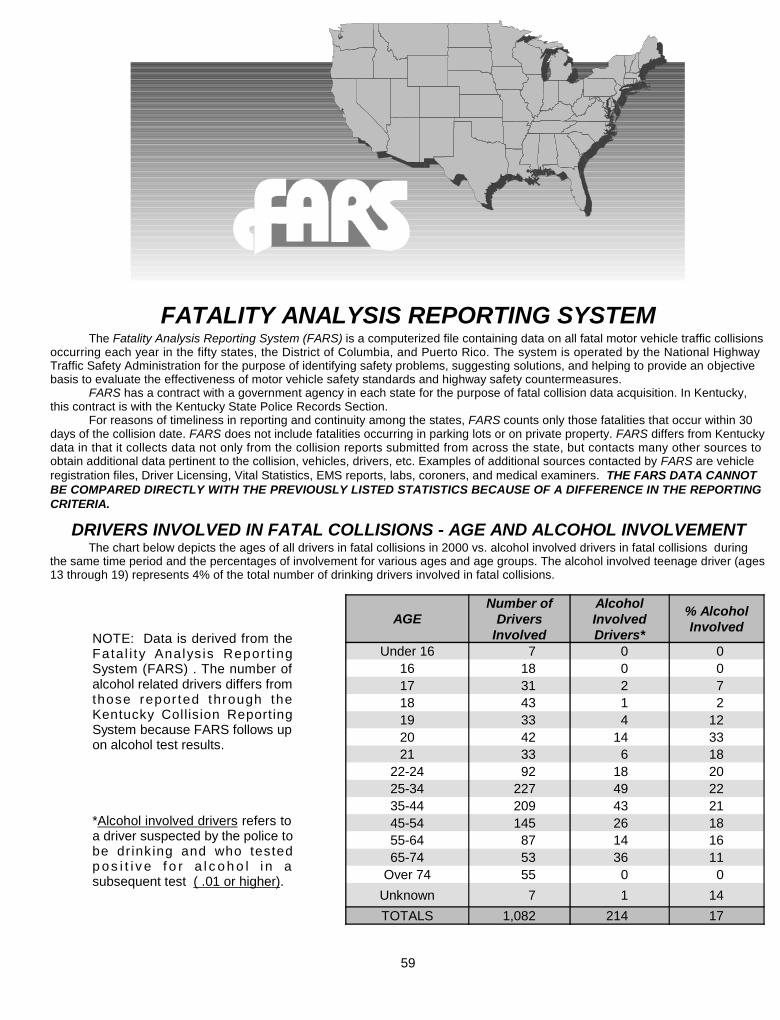
FATALITY ANALYSIS REPORTING SYSTEM
� � �� ��
The Fatality Analysis Reporting System (FARS) is a computerized file containing data on all fatal motor vehicle traffic collisions occurring each year in the fifty states, the District of Columbia, and Puerto Rico. The system is operated by the National Highway Traffic Safety Administration for the purpose of identifying safety problems, suggesting solutions, and helping to provide an objective basis to evaluate the effectiveness of motor vehicle safety standards and highway safety countermeasures.
FARS has a contract with a government agency in each state for the purpose of fatal collision data acquisition. In Kentucky, this contract is with the Kentucky State Police Records Section.
For reasons of timeliness in reporting and continuity among the states, FARS counts only those fatalities that occur within 30 days of the collision date. FARS does not include fatalities occurring in parking lots or on private property. FARS differs from Kentucky data in that it collects data not only from the collision reports submitted from across the state, but contacts many other sources to obtain additional data pertinent to the collision, vehicles, drivers, etc. Examples of additional sources contacted by FARS are vehicle registration files, Driver Licensing, Vital Statistics, EMS reports, labs, coroners, and medical examiners. THE FARS DATA CANNOT BE COMPARED DIRECTLY WITH THE PREVIOUSLY LISTED STATISTICS BECAUSE OF A DIFFERENCE IN THE REPORTING CRITERIA.
The chart below depicts the ages of all drivers in fatal collisions in 2000 vs. alcohol involved drivers in fatal collisions duringthe same time period and the percentages of involvement for various ages and age groups. The alcohol involved teenage driver (ages13 through 19) represents 4% of the total number of drinking drivers involved in fatal collisions.
DRIVERS INVOLVED IN FATAL COLLISIONS - AGE AND ALCOHOL INVOLVEMENT
59
NOTE: Data is derived from the Fata l i ty Analys is Repor t ing System (FARS) . The number of alcohol related drivers differs from those repor ted through the Kentucky Collision Reporting System because FARS follows up on alcohol test results.
*Alcohol involved drivers refers to a driver suspected by the police to be dr ink ing and who tested p o s i t i v e f o r a l c o h o l i n a subsequent test ( .01 or higher).
AGENumber of
DriversInvolved
AlcoholInvolvedDrivers*
% AlcoholInvolved
Under 16 7 0 016 18 0 017 31 2 718 43 1 219 33 4 1220 42 14 3321 33 6 18
22-24 92 18 2025-34 227 49 2235-44 209 43 2145-54 145 26 1855-64 87 14 1665-74 53 36 11
Over 74 55 0 0
Unknown 7 1 14
TOTALS 1,082 214 17

ALCOHOL INVOLVEMENTBY AGE AND TEST RESULTS FOR
DRIVERS INVOLVED IN FATAL COLLISIONS
The chart below shows drinking drivers by age and alcohol test result. Eighty (80) percent of the drinking drivers tested were found to have a blood alcohol content (BAC) of 0.10% or above at the time of the collision.
AGENUMBER OF
DRINKINGDRIVERS* .01-.05 .06-.09 .10-.19 .20+
Under 16 0 0 0 0 016 0 0 0 0 017 2 0 1 0 118 1 0 0 1 019 4 1 0 3 020 14 4 0 7 321 6 0 0 4 2
22-24 19 2 4 8 525-34 49 5 4 27 1335-44 43 0 4 18 2145-54 26 2 3 11 1055-64 14 5 0 7 265-74 6 2 0 3 175+ 0 0 0 0 0
Unknown 1 0 0 0 1
TOTAL 185 21 16 89 59
* Drinking driver refers to a driver suspected by the police to be drinking, and who tested positive for alcohol in a subsequent test.
��� ����������� �� ��
�����������
�������
0-5 5 0 06-10 2 0 0
11-15 4 0 016-20 2 0 021-25 2 0 026-30 7 2 .2131-40 6 1 .4741-50 5 2 .2951-60 7 2 .1861-70 5 2 .1471-80 4 1 .3381+ 4 0 0
UNKNOWN 0 0 0TOTAL 53 10 .27
60
BAC TEST RESULTS
FATALLY INJURED PEDESTRIANS
Another traffic hazard is the drinking pedestrian. The chart on the right shows the number of fatally injured pedestrians by age and alcohol involvement.
FARS total number of pedestrians differs from the number reported through the Kentucky Collision Reporting System because FARS does not include pedestrians killed in parking lots.
DURING 2000, THERE WERE 196 PERSONS KILLED IN FATAL COLLISIONS INVOLVING A DRINKING DRIVER. THIS REPRESENTS 24% OF ALL PERSONS KILLED IN TRAFFIC COLLISIONS IN KENTUCKY DURING 2000.
����������� ��������������� �� �������� �������������� ��� � ���������� ���� � �� � ��� ��� � � � �������� � �� ����� ��� ���������� ������� �!"

ResultUsed
NotUsed Unknown Used
NotUsed Unknown
TOTAL
Fatal Injury 20 15 1 235 487 18 776
Incapacitating Injury 1 1 0 172 180 10 364
Non-Incapacitating Injury 1 1 0 145 90 1 238
Possible Injury 0 0 0 69 31 0 100
No Injury 0 0 0 220 57 6 283
Unknown If Injured 0 0 0 0 0 8 8
Injured, Severity Unknown 0 0 0 0 0 0 0
TOTAL 22 17 1 841 845 43 1,769
SAFETY RESTRAINTS AND EJECTIONIN FATAL COLLISIONS
The chart below plots overall results in fatal collisions when motorcycle helmets and other restraints (safety belts, harnesses, child restraints, etc.) are used. A comparison of "used" versus "not used" for 2000 FARS data strongly confirms both the lifesaving advantage as well as the reduction of serious injury when restraints are in place. SIXTY-THREE (63) PERCENT OF THE VEHICLE OCCUPANTS KILLED DURING 2000 WERE NOT RESTRAINED. FIFTY (50) PERCENT OF THE VEHICLE OCCUPANTS SUFFERING INCAPACITATING INJURY WERE NOT RESTRAINED. FORTY (40) PERCENT OF THE OCCUPANTS SUFFERING NON-INCAPACITATING INJURY WERE NOT RESTRAINED. NON-MOTORISTS ARE NOT INCLUDED IN THE CHARTS BELOW.
Of the 1,769 vehicle occupants involved in fatal collisions in 2000, only 863 were using safety restraints - an overall usage rate of 49% in fatal collisions.
Result TotalEjection
PartialEjection
NoEjection
Unknown TOTAL
Fatal Injury 160 43 581 0 784
Incapacitating Injury 25 4 333 0 362
Non-Incapacitating Injury 5 0 240 0 245
Possible Injury 0 0 102 0 102
No Injury 0 0 284 0 284
Unknown If Injured 0 0 5 3 8
Injured, Severity Unknown 0 0 0 0 0
TOTAL 190 47 1,545 3 1,785
EJECTION
The above chart shows overall injuries in fatal collisions according to whether the vehicle occupant was ejected from the vehicle, partially ejected, or not ejected. EIGHTY-SIX (86) PERCENT OF VEHICLE OCCUPANTS WHO WERE EITHER TOTALLY OR PARTIALLY EJECTED WERE KILLED. This data also reaffirms the lifesaving advantage of using an active restraint, since the possibility of being ejected upon impact is significantly reduced.
*Motorcycles are excluded for ejections (not applicable under FARS guidelines).
61
MOTORCYCLE HELMET RESTRAINT

62
������� ������
� ���
� � ���� ��
��
�
Killed 19 7 1 11 0
Injured (Incapacitating) 11 4 2 4 1
Injured (Non-Incapacitating) 10 7 1 2 0
Injured (Possible) 4 4 0 0 0
Not Injured 9 5 2 2 0
TOTAL 53 27 6 19 1
CHILD RESTRAINTS IN FATAL COLLISIONSKentucky's "child restraint law" (KRS 189.125) became effective July 15, 1982, and Subsection
(3) requires that "Any driver of a motor vehicle, when transporting a child of forty (40) inches in height or less in a motor vehicle operated on the roadways, streets, and highways of this state, shall have the child properly secured in a child restraint system of a type meeting federal motor vehicle safety standards."
In order to qualify, the child restraint system must be certified as having been federally approved. (Federal approval of a child restraint system is based on its having withstood dynamic crash tests -- 30 mph collision into a fixed barrier.)
The data on child restraints depicted in the chart below reflects age (four years and under) rather than the height of the child. Other states with child restraint laws have adopted the "four years and under" standard in their statutes.
Of the fifty-three (53) child occupants (four years and under) involved in fatal collisions in 2000, only thirty-three (33) children were secured in a child restraint. Of the nineteen (19) children killed, eleven (11) had no restraint and only seven (7) were using child safety seats. This information confirms what other studies have suggested regarding the effectiveness of child restraints. An infant or small child's survival can depend on whether the child was properly secured.

���������������
COSTofKENTUCKYTRAFFICCOLLISIONS
2000
The calculable costs (economic costs) of motor vehicle collisions on public roads include wage loss, medical expense, administration costs, property damage, and employer costs. Comprehensive costs include not only the economic cost components but also a measure of the value of lost quality of life associated with deaths and injuries. Estimated costs provided by the National Safety Council, considering both economic and comprehensive costs, were used to arrive at a cost range for traffic collisions in Kentucky during 2000 (occurring on public roads).
The economic cost ($1.9 billion) was derived from the following formula:
Cost per X Number = Estimated Cost Reported
Fatalities@ $1,000,000 X 810 = $810,000,000
IncapacitatingInjuries@ $47,900 X 8,354 = $400,156,600
Non-IncapacitatingInjuries@ $16,000 X 20,849 = $333,584,000
PossibleInjuries@ $9,150 X 23,926 = $217,726,600
Property Damage Only@ $1,861 X 99,636 = $185,422,596
TOTAL ECONOMICCOST ESTIMATE: $1,946,889,796
The comprehensive cost ($5.4 billion) was derived from the following formula:
Cost per X Number = Estimated Cost Reported
Fatalities@ $3,214,290 X 810 = $2,603,574,900
IncapacitatingInjuries@ $159,449 X 8,354 = $1,332,036,946
Non-IncapacitatingInjuries@ $41,027 X 20,849 = $855,371,923
PossibleInjuries@ $19,528 X 23,926 = $467,226,928
Property Damage Only@ $1,861 X 99,636 = $185,422,596
TOTAL COMPREHENSIVECOST ESTIMATE: $5,443,633,293
64
KENTUCKY STATE POLICERECORDS BRANCH1250 Louisville Road
Frankfort, Kentucky 40601
TO:
BULK RATEU.S. POSTAGE
PAIDFrankfort, KY
Permit No. 674
Here is your copy of the 2000 TRAFFIC COLLISION FACTS report you requested. If you want to receive the 2001 report, please print or type your name and address below and return this form.
This card must be returned to ensure receipt of the 2001 publication. Existing mailing lists are being revised to include only those individuals who respond to this notice.
IMPORTANT NOTICEK
ENTUCKY
P O L I C E
STATE
K
ENTUCKY
P O L I C E
STATE
name
company
address
city, state, zip
Kentucky State PoliceRecords Branch / Statistics Section1250 Louisville RoadFrankfort, Kentucky 40601
���